1. Introduction
The world economy is developing rapidly in recent decades, and cardiovascular disease has become the main cause of death in the world [
1]. According to the survey, at present, 30% of the world’s deaths are caused by 52 cardiovascular diseases [
2]; hypertension is a disease associated with cardiovascular disease, accounting for 13% of cardiovascular diseases, that is, the high prevalence of hypertension worldwide is one of the reasons for the high prevalence of cardiovascular diseases. It is a chronic disease and has a serious impact on human health. Over time, its prevalence worldwide has increased year by year, but its awareness rate and control rate are still very low. Hypertension can damage the vascular system, causing major diseases such as myocardial infarction, coronary heart disease and stroke secondary diseases. Studies by L Gray and IM Lee [
3] have shown that if blood pressure is high in early adulthood, the mortality rate of cardiovascular disease and coronary heart disease will increase in a few decades. Around 54% of the world’s strokes, 47% of ischemic heart disease, 75% of hypertension, and 25% of other cardiovascular diseases are caused by high blood pressure [
4].
In China, the number of people suffering from hypertension is on the rise due to poor awareness, treatment and control of hypertension, which is much lower than that in the West, especially among young people and people in remote areas. The incidence of hypertension has increased greatly. In 1991, the number of people over 15 years of age suffering from hypertension increased by 60% compared with 1980. In 2002, the prevalence rate of hypertension in those over 18 years old reached 18.8%. Two out of 10 people suffered from hypertension, and the number with high blood pressure reached 153 million, accounting for 20% of the world’s total hypertension. Mild to moderate hypertension accounts for 90% of cases and normal blood pressure does not exceed 50% [
5]. According to a recent survey, about one-third of adults suffer from hypertension. Half of them will receive treatment for hypertension, but only 5% of them will eventually have their blood pressure properly controlled [
6]. In China 750,000 people die of hypertension every year. Obesity is a major contributor to hypertension. In China, the proportion of obese and overweight people aged 7–18 increased 28-fold between 1985 and 2000. In 1992–2002, 260 million people were overweight or obese, so hypertension will continue to deteriorate in the future [
7]. Research on hypertension has become a key issue. Hypertension itself is not terrible, but it can cause enormous damage to the target organs. The target organs of hypertension are mainly the heart, kidney, brain, blood vessels and so on. Tatasciore et al. [
8], O’Sullivan et al. [
9], and Gao et al. [
10] studied the damage of target organs caused by hypertension, and it turned out that high blood pressure causes great damage to the target organs.
Hypertension has become a very common disease worldwide, so in view of its great harm to the human body, how to detect hypertension and treat it is urgent. The classification of hypertension in Chinese hospitals is only based on severity grades, such as hypertension grade 1 and hypertension grade 2. According to the severity of the patients, appropriate drugs are used to treat hypertension. Although this classification method can be applied, it is not rigorous. As mentioned above, half of hypertensive patients will suffer from target organ damage; in some it caused kidney damage, in some it caused heart damage, some people suffer damage to one target organ and others to two target organs, which means that although these patients are judged to have hypertension, there are differences between them. Patients with the same target organ injury may have some similarities, which requires analysis of their detection indicators data, which cannot be generalized, so the current hospital classification according to the severity of the disease is not rigorous. For most Chinese families, the cost of medical care is a large burden. If a patient can be detected with hypertension, at the same time according to various indicators it can be determined which type of hypertension he has and which target organs may be damaged due to hypertension in the future. This can avoid the blindness of treatment, and doctors can target preventive treatment to patients. As time goes by, more patients with hypertension will be free from the trouble of hypertension target organ damage.
Most of the current studies are based on the analysis of the effects of a certain physical index or a certain feature of target organ damage in hypertensive patients, according to Viazzi F et al. [
11], Giuseppe Mule et al. [
12], but there is almost no prediction of hypertension-related symptoms. With the continuous development of technology, the era of big data has arrived. Applying big data analysis methods to medical, education, and smart cities has become a global concern [
13,
14]. The hospital generates a large amount of body index information at all times, so it is necessary to apply the big data analysis method to the medical field. Through effective analysis and processing, the efficiency and accuracy of diagnosis can be improved, and then scientific and accurate treatment methods can be used to treat patients.
The innovation of this paper is that, according to the patient’s detection index, the blood pressure category of a patient can be obtained by the clustering algorithm, and then combined with the XGBoost method, the probability that the patient has different hypertension-related symptoms can be obtained. For a new patient, after identifying the category by the clustering algorithm, the doctor can predict the possible symptoms based on the results obtained in this paper. This paper combines the hospital’s big data and algorithms to solve medical problems, which is of great practical significance.
The content of this article is arranged as follows: the first chapter is about the current situation of hypertension in China, the introduction of hypertension research and the innovation of this article. The second chapter introduces the main algorithms used in this paper, including clustering algorithm, XGBoost method and the overall method architecture used in this paper. The third chapter is the analysis of the experimental process and the analysis of the results. The fourth chapter summarizes this article.
2. Materials and Methods
2.1. Clustering Methodology
Cluster analysis is based on the similarity of each class. The similarity between one point and other points in a class is greater than the similarity with other classes. The clustering method can maximize the similarity of objects in the class, and the similarity between classes is the smallest [
15]. K-means is a kind of clustering technology applied to Web, which randomly selects clustering centers in all data and classifies them according to the distance between data points and centers [
16]. The main idea is to find the
class centers of the data set and classify the data into
classes so that the distance between the data points in the data set and the class centers of the classes to which they belong is minimal. This method often requires manual determination of the number of clustering centers, which is subjective. When the number of classes selected manually does not match the data, there will be significant errors [
17,
18,
19]. Hierarchical clustering [
20], density-based [
21] are also commonly used clustering methods.
The k-means method mentioned above is the most basic method among clustering methods [
22], because it relies too much on the initial selection of k aggregation centers, resulting in a series of grid-based clustering methods and so on. This article uses a new clustering method proposed by Alex Rodriguez and Alessandro Laio [
23].
The method has two distinct characteristics as follows:
The density of the cluster center is large, and its density around it is smaller.
The distance between the cluster center and other dense data points is relatively far.
represents data sets with clustering. is the corresponding index set. The distance between and represented by . For every point in , and representing the two characteristics mentioned above where represents local density, represents the distance (Formula (3) is explained in detail). Here are two calculation methods for calculating local density.
Among them, represents the truncation distance. This is an amount given by experience and requires artificial settings. When choosing , it should be emphasized that there should be a number of 1%–2% of the total number of data points around each data point. For each data point in , it has a distance value from the point of other than itself, so there are distances in . But the distance between any two points is computed twice, so the number of effective distances is . We sort the distance from large to small, and the sequence is , Take as . In general, the distance satisfying the condition of less than takes up about , that is, about , and the average distance to each data point is about . The ratio is equivalent to in the algorithm. So when the ratio is given, can be approximately taken as . In this paper, the range of is locked at 1~2%, which is based on the empirical values of many data sets.
represents the data points between
and
(except
itself) with a distance less than
. Gaussian kernel:
Compared with the Formula (1), the cut-off kernel is a discrete value, but the Gaussian kernel is a continuous value, so the probability that different data points have the same local density is smaller under the latter condition, and the latter also satisfies the property that the closer to the data point, the greater the density.
Distance :
Assuming that
represents a descending order of
, it means that it satisfies:
According to the Formula (3), when the local density of
is the largest.
represents the distance of the point in
S where the distance from
is the largest, otherwise
represents the distance from the point where the distance from
is the smallest among the points where the local density is larger than
. So far, for each data point
in
S, we can calculate
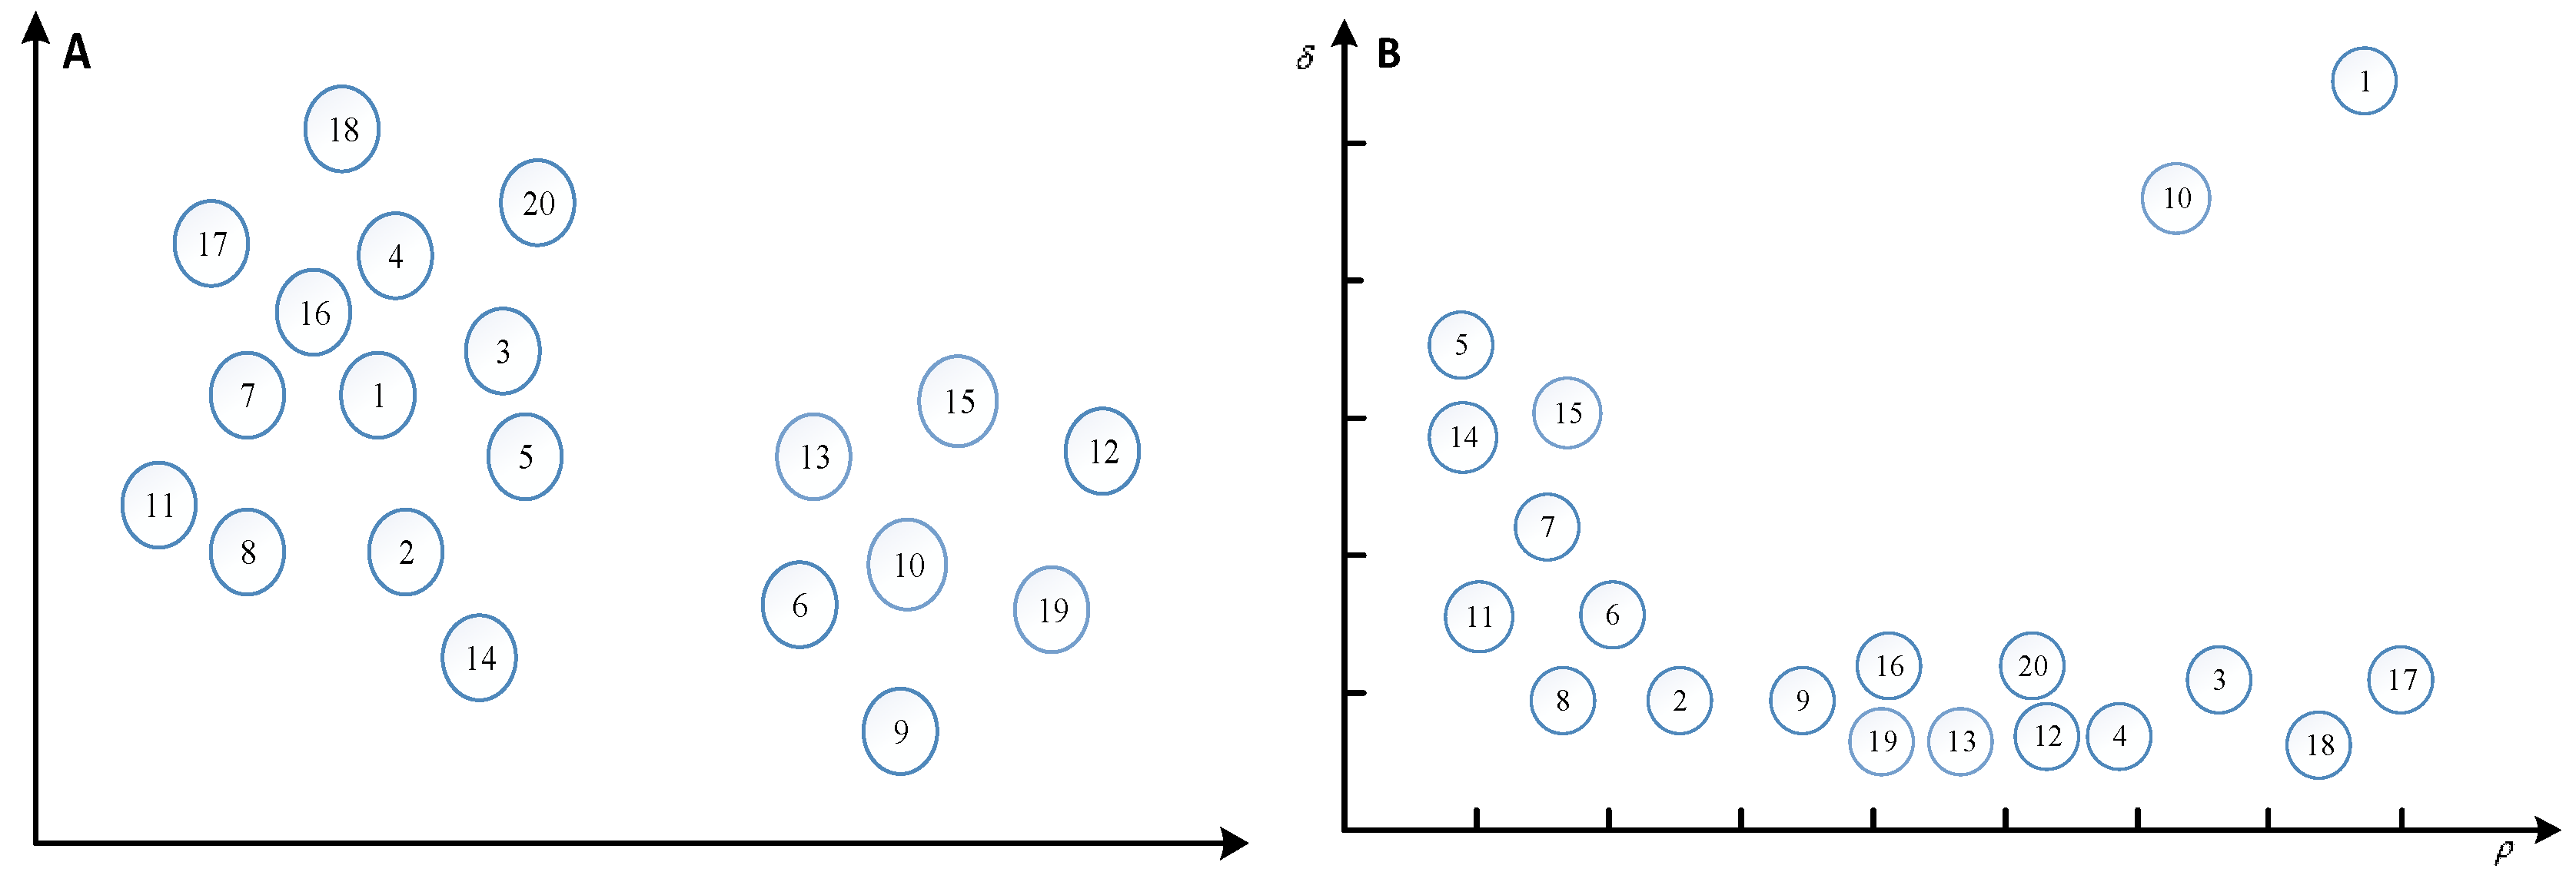
. For example, in a two-dimensional space, 20 points are distributed, and the numbers in the circles represent the number of points, and the distribution of points is shown in
Figure 1A. The
and
of each point are calculated and represented in a two-dimensional space, as shown in
Figure 1B.
is the horizontal axis and
is the longitudinal axis.
Figure 1B plays a decisive role in the selection of clustering centers, because subjective selection plays a great role in the selection of clustering centers, it is necessary to create a new metric
, the product of
and
, the greater the product, the higher the probability of being selected as a clustering center.
The algorithm flow chart of this method is as follows.
Step 1: Initialization and Preprocessing
Given a parameter which is the same as determining the cut-off distance
Calculate the distance , and make
Determining cut-off distance
Compute and generate its descending order subscript
Calculate and
Step 2: Select the cluster center
and initialize the data point classification attribute tag
, as follows:
Step 3: Categorization of non-clustered central data points
Step 4: If , the data points in each cluster are further divided into cluster core and cluster halo
Initialization mark
Generate an average local density upper bound for each cluster.
Identification cluster halo
2.2. XGBoost Method
The full name of XGBoost is eXtreme Gradient Boosting, which is a c++ implementation of Gradient Boosting Machine algorithm. The greatest advantage of this algorithm is that it can automatically use the CPU to run multi-threaded, improve efficiency, and the algorithm has been changed to improve the accuracy. Shi et al. [
24], Lei et al. [
25], Zhang et al. [
26] used the XGboost method to obtain very accurate predictions. This article uses the XGBoost method proposed by Chen T Q and Guestrin C [
27].
The algorithm steps can be expressed as follows:
Training objective function:
Target function Taylor second-order expansion approximation:
Remove the constant term:
Find the optimal solution of the objective function:
XGBoost has the following advantages:
It supports linear classifier.
In order to control the complexity of the model, the XGboost method deliberately sets a regularization term in the objective function.
XGBoost uses the second-order Taylor expansion of the objective function, and uses the first and second derivatives.
When tree nodes split, we need to calculate the corresponding gain of each segmentation point of each feature, that is, to enumerate all possible segmentation points with a greedy method.
XGBoost borrows from the random forest approach and supports column sampling, which not only reduces over-fitting, but also reduces computational complexity.
The XGBoost method considers the problem of efficient use of disks, especially when the amount of data is large and there is not enough memory. It combines data compression and fragmentation, and a multi-threaded approach that greatly improves efficiency.
Shrinkage is equivalent to learning rate. After an iteration, XGBoost multiplies the weight of the leaf nodes by this coefficient, mainly to weaken the impact of each tree, so that there is more learning space. In practical applications, eta is generally set up a little bit, and then the number of iterations is set a little larger.
2.3. Probability Analysis Process
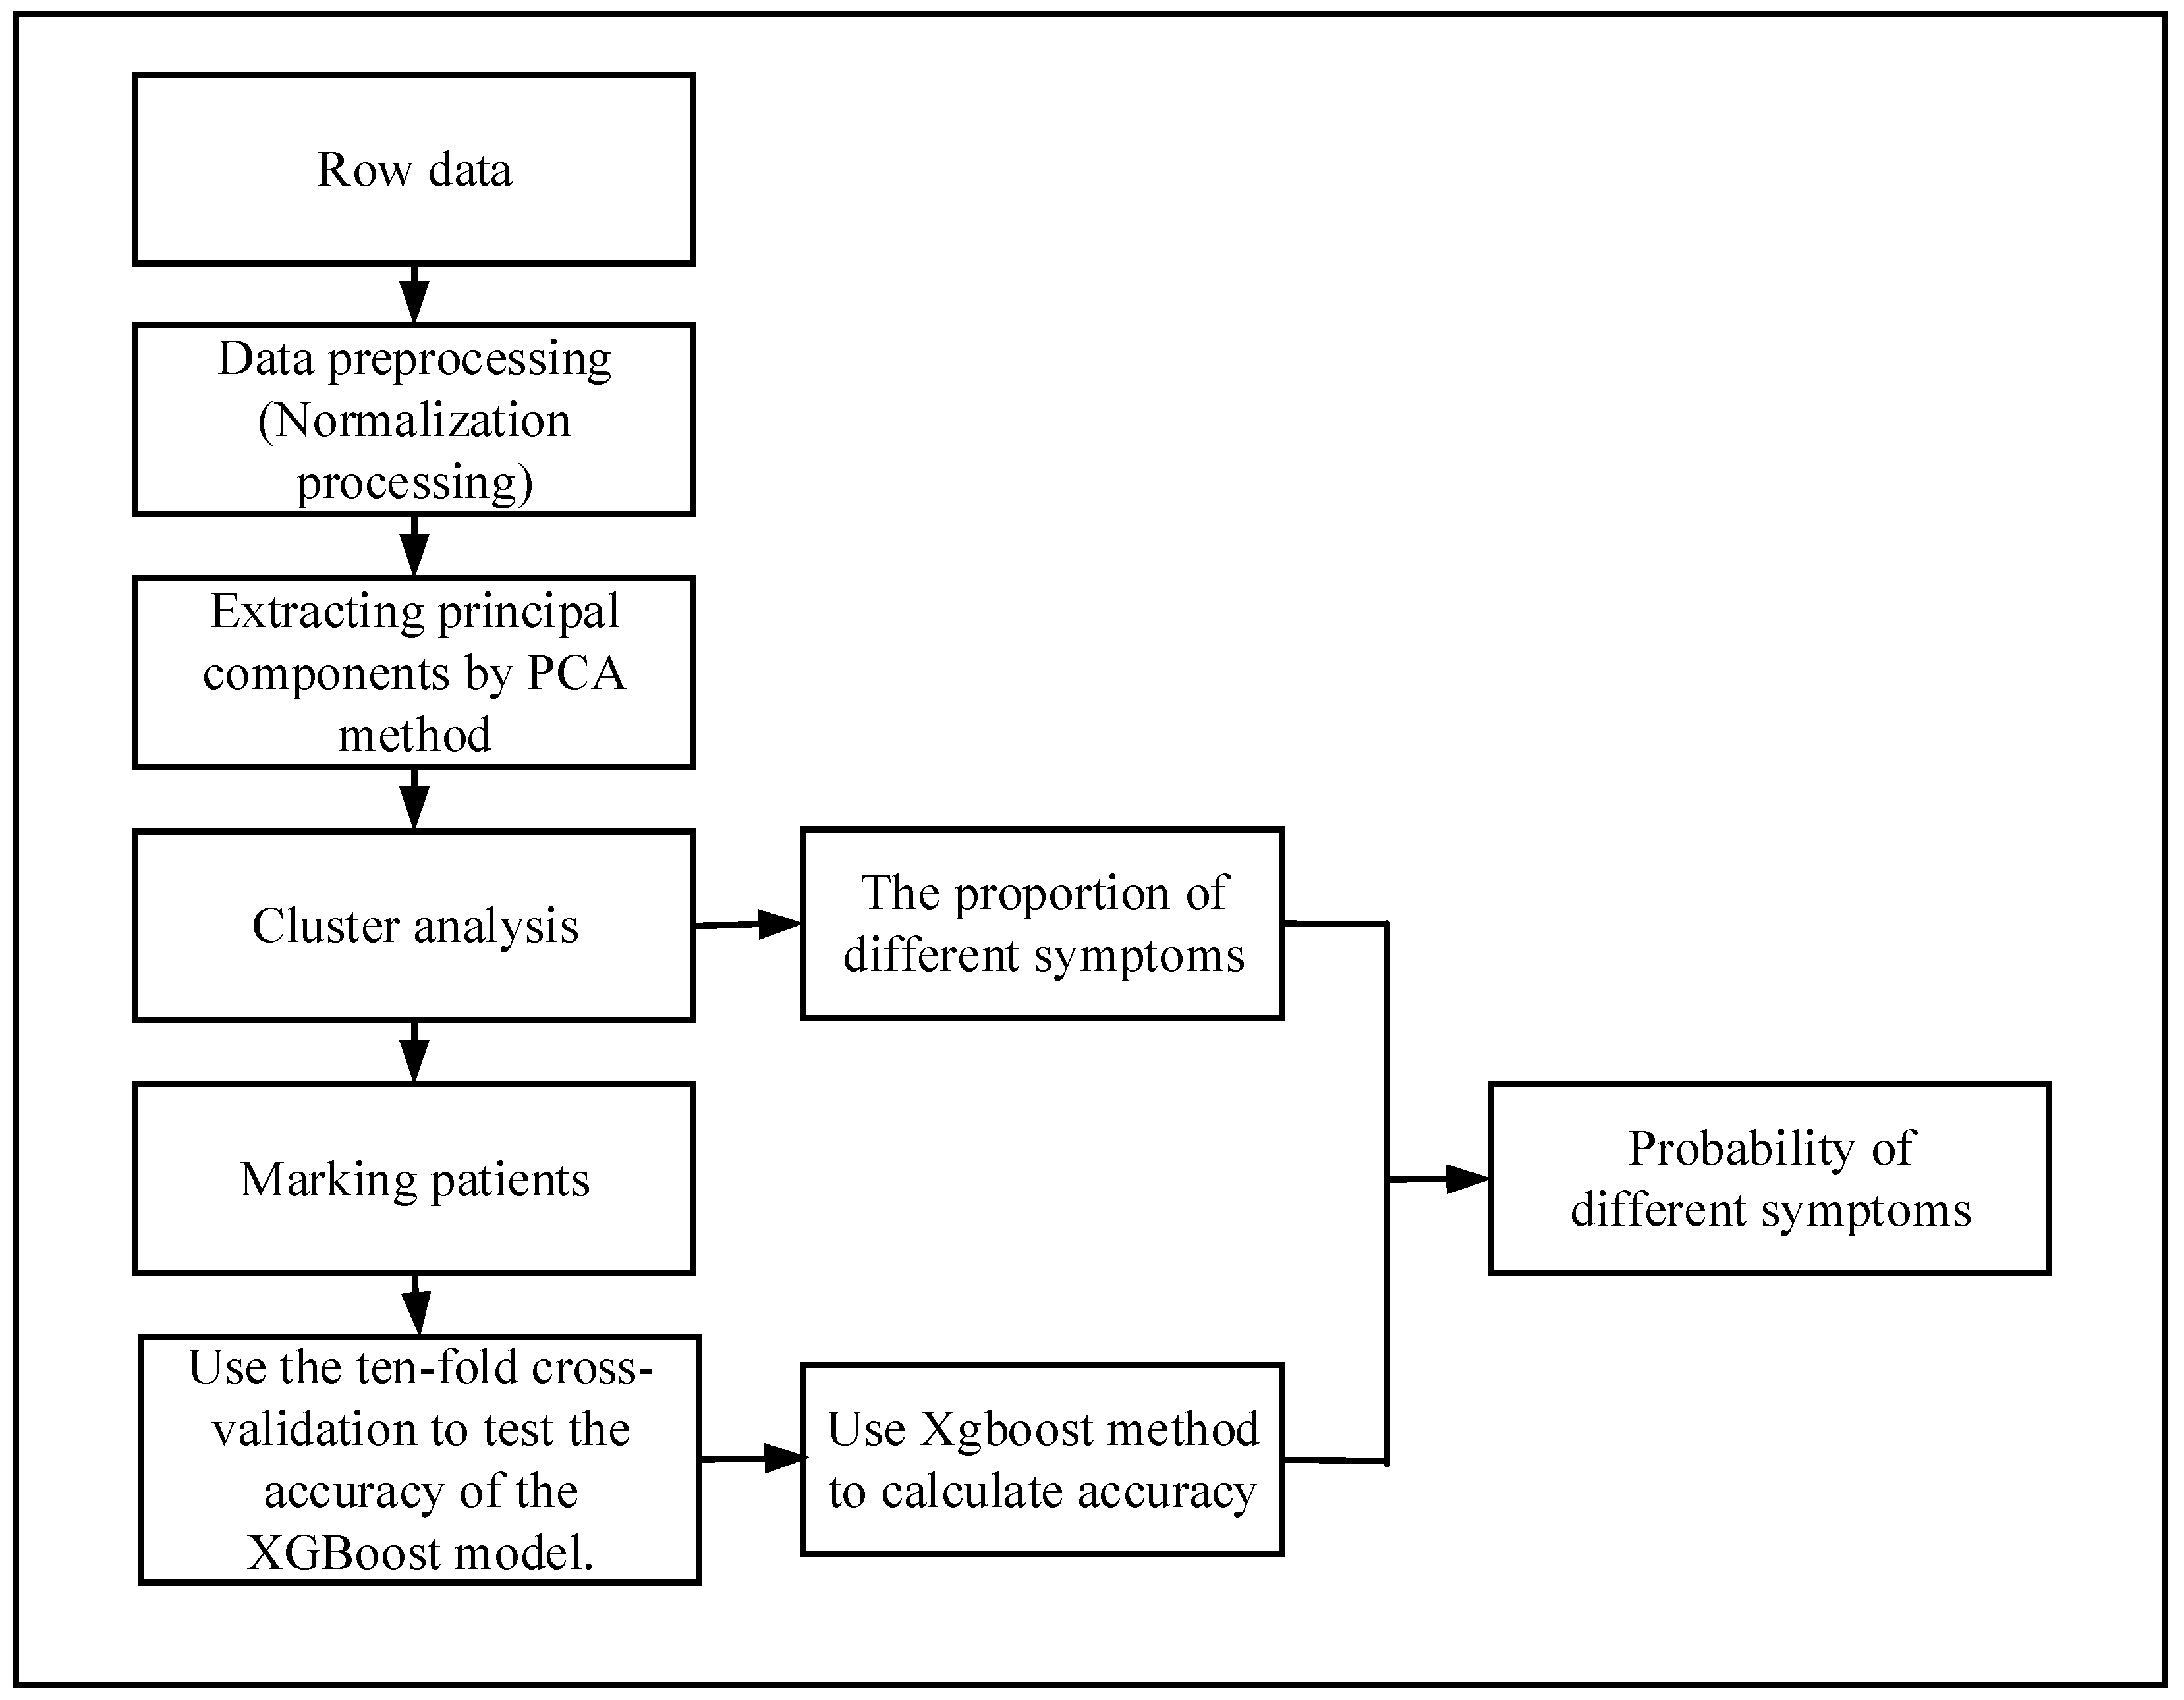
The flow chart of the probability analysis is shown in
Figure 2. First of all, we get the original data of hypertensive patients for physical examination, because not all indicators are related to hypertensive diseases, so we need to pick out the data related to hypertension from the original data. Not all patients have done all the necessary indicators related to hypertension, so there will be many missing values in the original data. In order to make the calculation more accurate, it is necessary to delete the missing samples. There are many indicators related to hypertension, and the differences among them are quite large. Some of them are very small, in the range of 0–10, and some are very large, and may reach more than 100. Therefore, data need to be standardized, and the target value will be locked within 0–1.
There are many indicators related to hypertension. If all these indicators are used, it will not only increase the huge computational burden, but also make the calculation very difficult. In addition, in most cases, there is a certain correlation between variables, which leads to the overlap of these variables in the information of the problem. In order to minimize the number of variables in this paper, principal component analysis (PCA) is used. The main idea of this method is to maximize the possibility of deleting some extra or highly relevant variables, and then create as few new irrelevant variables as possible. By PCA, several principal components will be selected according to the cumulative contribution rate, and then the scores of several principal components will be obtained. The scores () of principal components will be taken as the coordinates of this point. According to the coordinates, the distance between every two points will be calculated. The feature information of the original sample is processed by the PCA to obtain the coordinates of the point, so each point uniquely represents a sample.
Through the distance between points, the patients are clustered by clustering algorithm to get the categories of each patient, and then each patient is labeled according to the clustering results. According to the categories of patients and their real symptoms, the hypertension-related symptoms of different types of hypertensive patients were counted separately, and the true proportion of each symptom was obtained.
In order to calculate the accuracy of the clustering effect, the XGBoost algorithm is used. Firstly, a part of the samples is selected as the training set, and then the rest is used as the test set to calculate the accuracy. A very important point here requires special attention, in order to determine that the XGBoost method can accurately calculate the accuracy of cluster analysis, the prediction performance of the XGBoost model should be verified. Therefore, the performance of XGBoost is estimated using a 10-fold cross-validation method. If XGBoost works well, it can be used to calculate the accuracy of the clustering method. After clustering, the proportion of patients with different symptoms in each group has been calculated, multiplying the proportion by the accuracy of the XGBoost method yields the probability that a patient will have a certain symptom. The above are the steps of the diagnostic model.
3. Experiment and Result Discussion
The data used in this study was obtained from 531 hypertensive patients in a hospital in Beijing. A total of 22 related indicators of blood pressure were used. Hypertension-related indicators are shown in
Table 1.
RARMSBP is right upper limb systolic pressure; RARMDBP is right upper limb diastolic pressure; LARMSBP is left upper limb systolic pressure; LARMDBP is left upper limb diastolic pressure; RLEGSBP is right lower limb systolic pressure; RLEGDBP is right lower limb diastolic pressure; LLEGSBP is left lower limb diastolic pressure; BAPWVR, ABIR, ABIL are all one of limb blood pressure. MEANSBP is the 24-h mean systolic blood pressure; MEANDBP is the 24-h mean diastolic blood pressure; HIGHSBP is the highest systolic blood pressure; HIGHDBP is the highest diastolic blood pressure; LOWSBP is the lowest systolic blood pressure; LOWDBP is the lowest diastolic blood pressure. DAYMSBP is the average systolic blood pressure during the day; DAYMDBP is the average diastolic blood pressure during the day; NIHTMSBP is the average systolic blood pressure at night; and NIHTMDBP is the average diastolic blood pressure at night.
Because of the relevant indicators obtained by physical examination, the parameter gap of different people is relatively large, which is not conducive to the later research. Therefore, the index parameters should be normalized firstly, and the values of each index should be locked in the range of 0 to 1.
In this analysis, there are 22 variables related to hypertension. Too many variables will increase the complexity of the problem. In reality, many variables are related, which means the relevant variables have redundant information. In view of this, the principal component analysis method is adopted. Under the premise of retaining the original information to the greatest extent, the variables with large correlations in the original variables are deleted, and several unrelated new variables are constructed.
The contribution of 22 variables to the variance is shown in
Table 2. The table shows the contribution rate of each variable to the original information and the cumulative contribution rate of all variables. Two new variables are selected to describe the original problem by principal component analysis (PCA), because the two new variables can keep 75% of the original information.
The scores of two new variables
,
,
and
were obtained on the basis of the original 22 variables. The number of elements contained in
and
was 531, that is, the number of patients.
as the coordinates of point
, Results are shown in
Table 3. The distance between each point can be calculated according to the Euclidean distance formula. The result of the final calculation is a 531 × 531 matrix. Here the distance of oneself to oneself is set to 0.
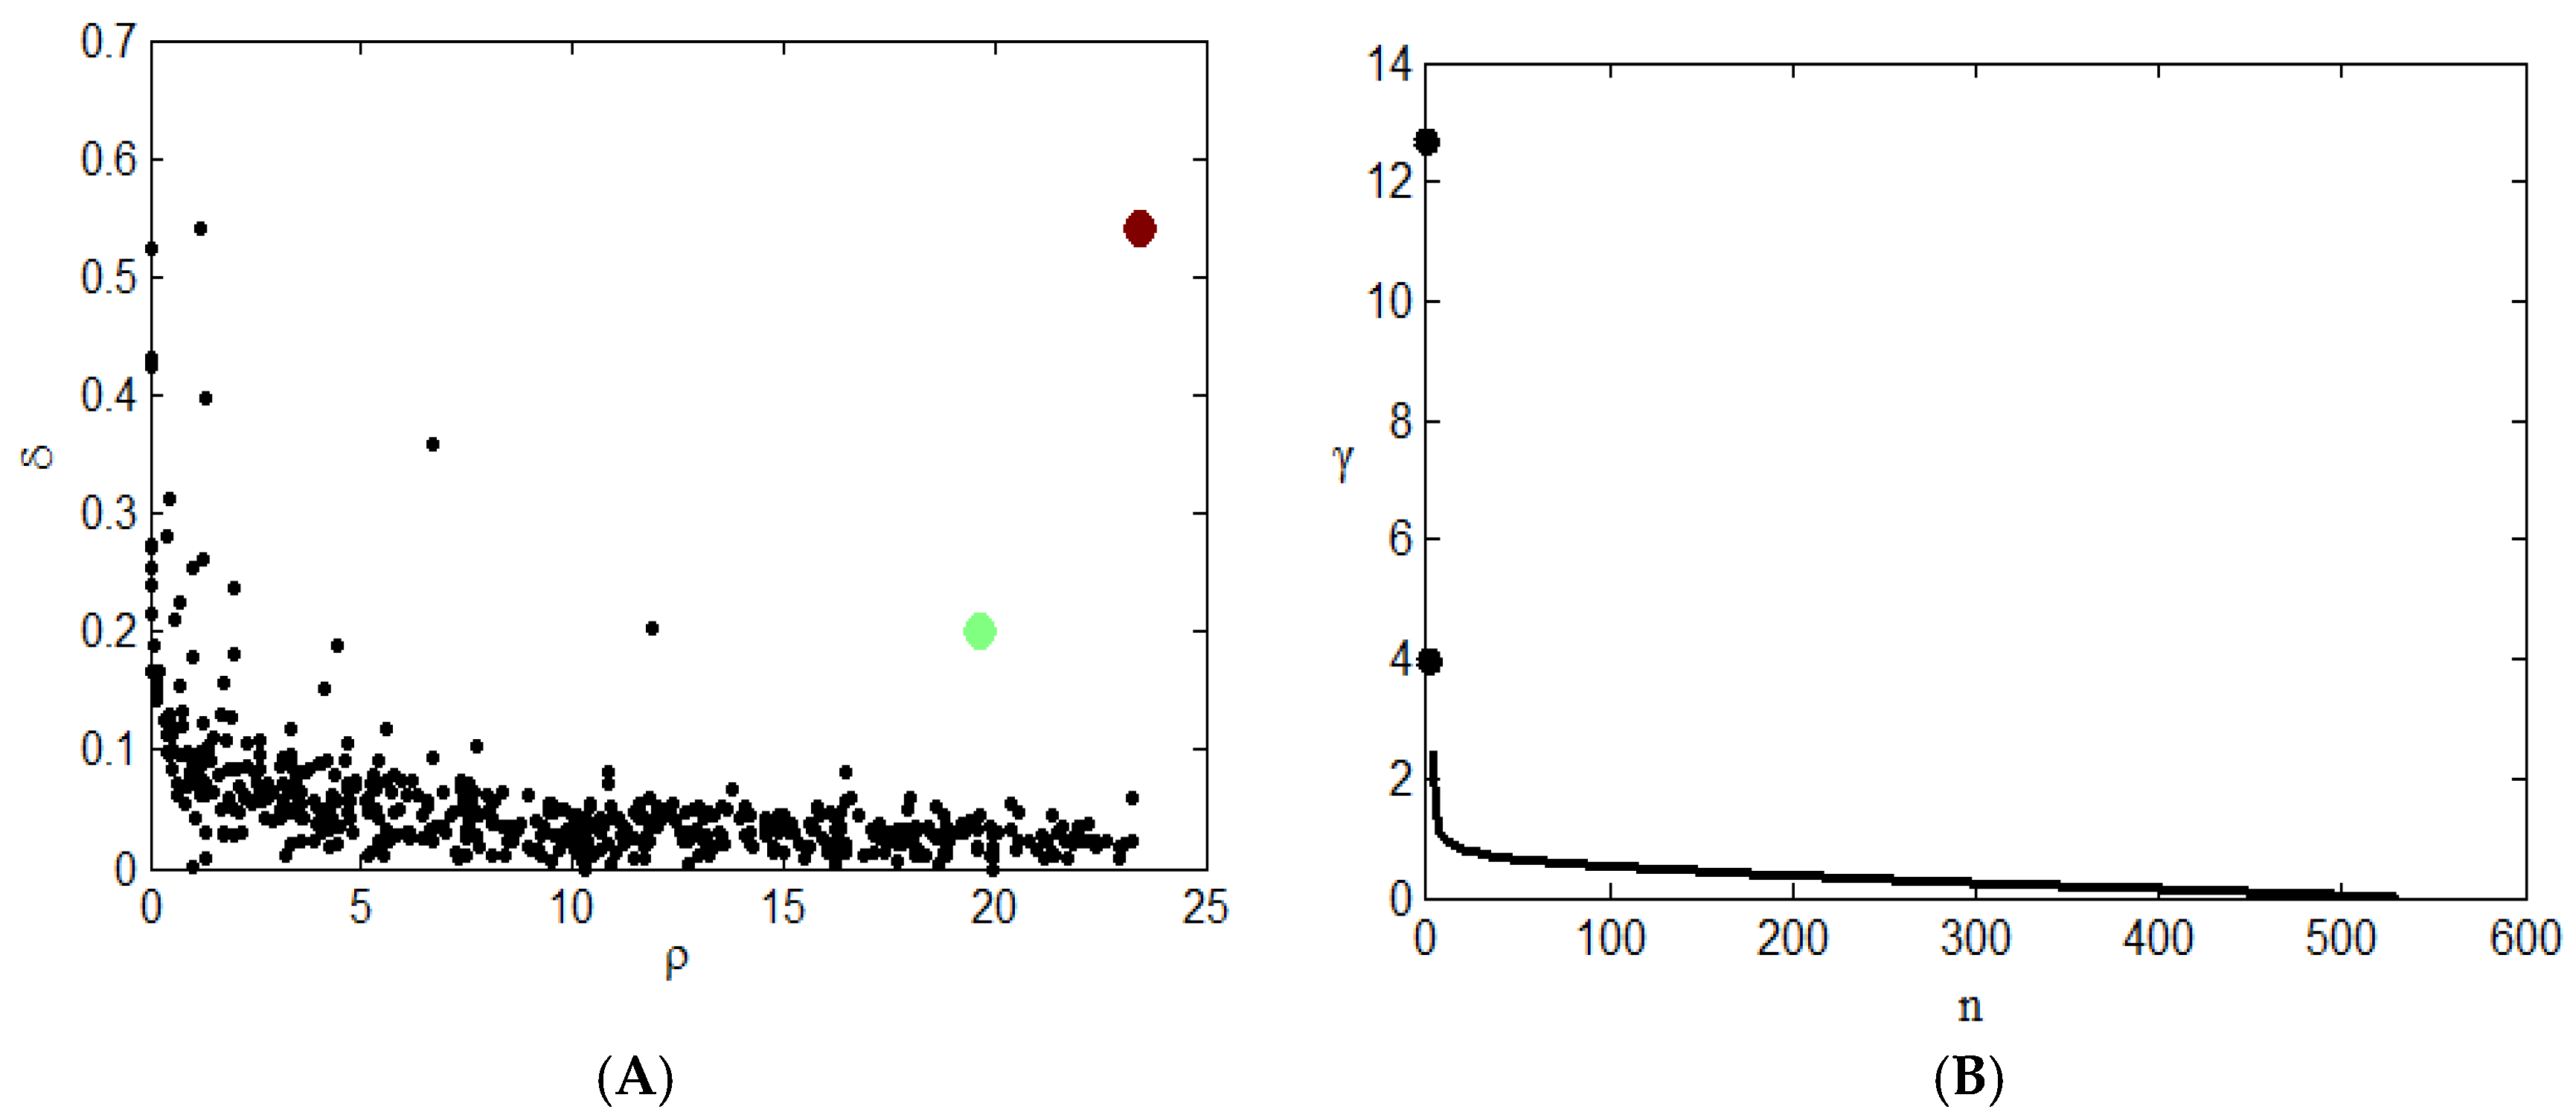
Figure 3A shows the clustering results. The red and green points in the graph represent the clustering centers of two types. This graph shows the relationship between the density and distance of each point. The clustering centers usually fall on the right side of the graph. Two black-colored points in
Figure 3B. represent two clustering centers, and it is obvious that the γ values of these two points are large, so they will be given priority when considering clustering centers. After the center point is determined, points other than the two center points must select a class based on the conditions of the cluster.
The final clustering results are shown in
Table 4. The total sample size is 531. The number of patients in the first category is 138, and the center point is the patient numbered 217. In a class, the average density is calculated, the point where the density exceeds the average density is at the core position, and the point where the density is lower than the average density is due to the position of the halo. According to the density of the sample points, 13 people are in the core position of the first category, and 125 people are in the halo position. The number of patients in the second category is 393, and the center point is the number 355. Similarly, according to the density of the sample points, 64 people are in the core position of the second category, and 329 people are in the halo position.
A represents ventricular hypertrophy, B represents vascular sclerosis, C represents lower limb ischemia, D represents renal insufficiency, E represents microalbuminuria, F represents fundus disease, G represents stroke.
Table 5 describes an analysis of the related symptoms of different types of hypertension after classification. There are two types of hypertension, the number of one group of patients was 138, and the number of two groups of patients was 393. The table shows the number of patients with different types of hypertension corresponding to different symptoms, and the corresponding proportion of each type of symptoms, the appearance of different symptoms means that there is damage to the corresponding target organ, such as ventricular hypertrophy, and shows that hypertension caused damage to the heart of patients and that renal insufficiency means that hypertension caused damage to the kidneys of patients. For heart target organs, only about 10% of the patients in the first group developed ventricular hypertrophy, while 34.9% of the patients in the second group developed ventricular hypertrophy. For vascular sclerosis, both the first group and the second group had a very high proportion of the symptoms; the first group was close to 90% of the patients, the second group of patients is as high as 96.4% of the proportion, which means patients with hypertension will generally appear in the symptoms of vascular sclerosis. For lower limb ischemia, the proportion of patients in both groups is not high, 2.2% and 0.8% respectively, which proves that patients with hypertension rarely have symptoms of lower limb ischemia. Similarly, for renal insufficiency, the proportion of minor symptoms in both groups was small, but the proportion of patients in the second group was six times higher than that in the first group. For microalbuminuria, 41.2% of patients in the second group had this symptom, compared with 7.2% in the first group. Fundus lesions and stroke were not significantly different between the two groups, and the incidence is very low. The results suggest that there is indeed a significant difference in some symptoms between different types of hypertension.
After cluster analysis of 531 patients, the patients were divided into two groups and the symptoms with higher prevalence were selected. The proportion of patients with vascular sclerosis in the first group was 89.1%, that of patients with vascular sclerosis in the second group was 96.4%, that of patients with ventricular hypertrophy was 34.9%, and that of microalbuminuria was 41.2%.
In order to determine the accuracy of clustering, 334 of 531 patients were trained and 197 patients were tested by XGBoost method, the ratio of the test set is 37%. In the XGBoost algorithm, the depth of the tree is 6 and the total number of iterations, i.e., the number of decision trees is 100; the gbtree tree model is used as the base classifier; all CPU parallel computing is used; and each tree is trained, using the full training set, with the other parameters the default values. In order to estimate the XGBoost prediction performance, the 10-fold cross-validation method is used here. The accuracy of each cross-validation is shown in
Table 6, n is the nth verification of the ten-fold cross-validation. The average of the 10 accuracy rates is used as the index of XGBoost’s prediction performance. The final result is 0.973, indicating that the XGBoost method has good prediction performance and it can be used to calculate the accuracy of the clustering effect.
After determining that the XGBoost method can be used to calculate the accuracy of the clustering effect, the result of the XGBoost method is 98.48%. This means that there is a probability of 98.48% that the result of the clustering algorithm is correct, showing that the result of clustering analysis is very high, and there is no obvious error in general.
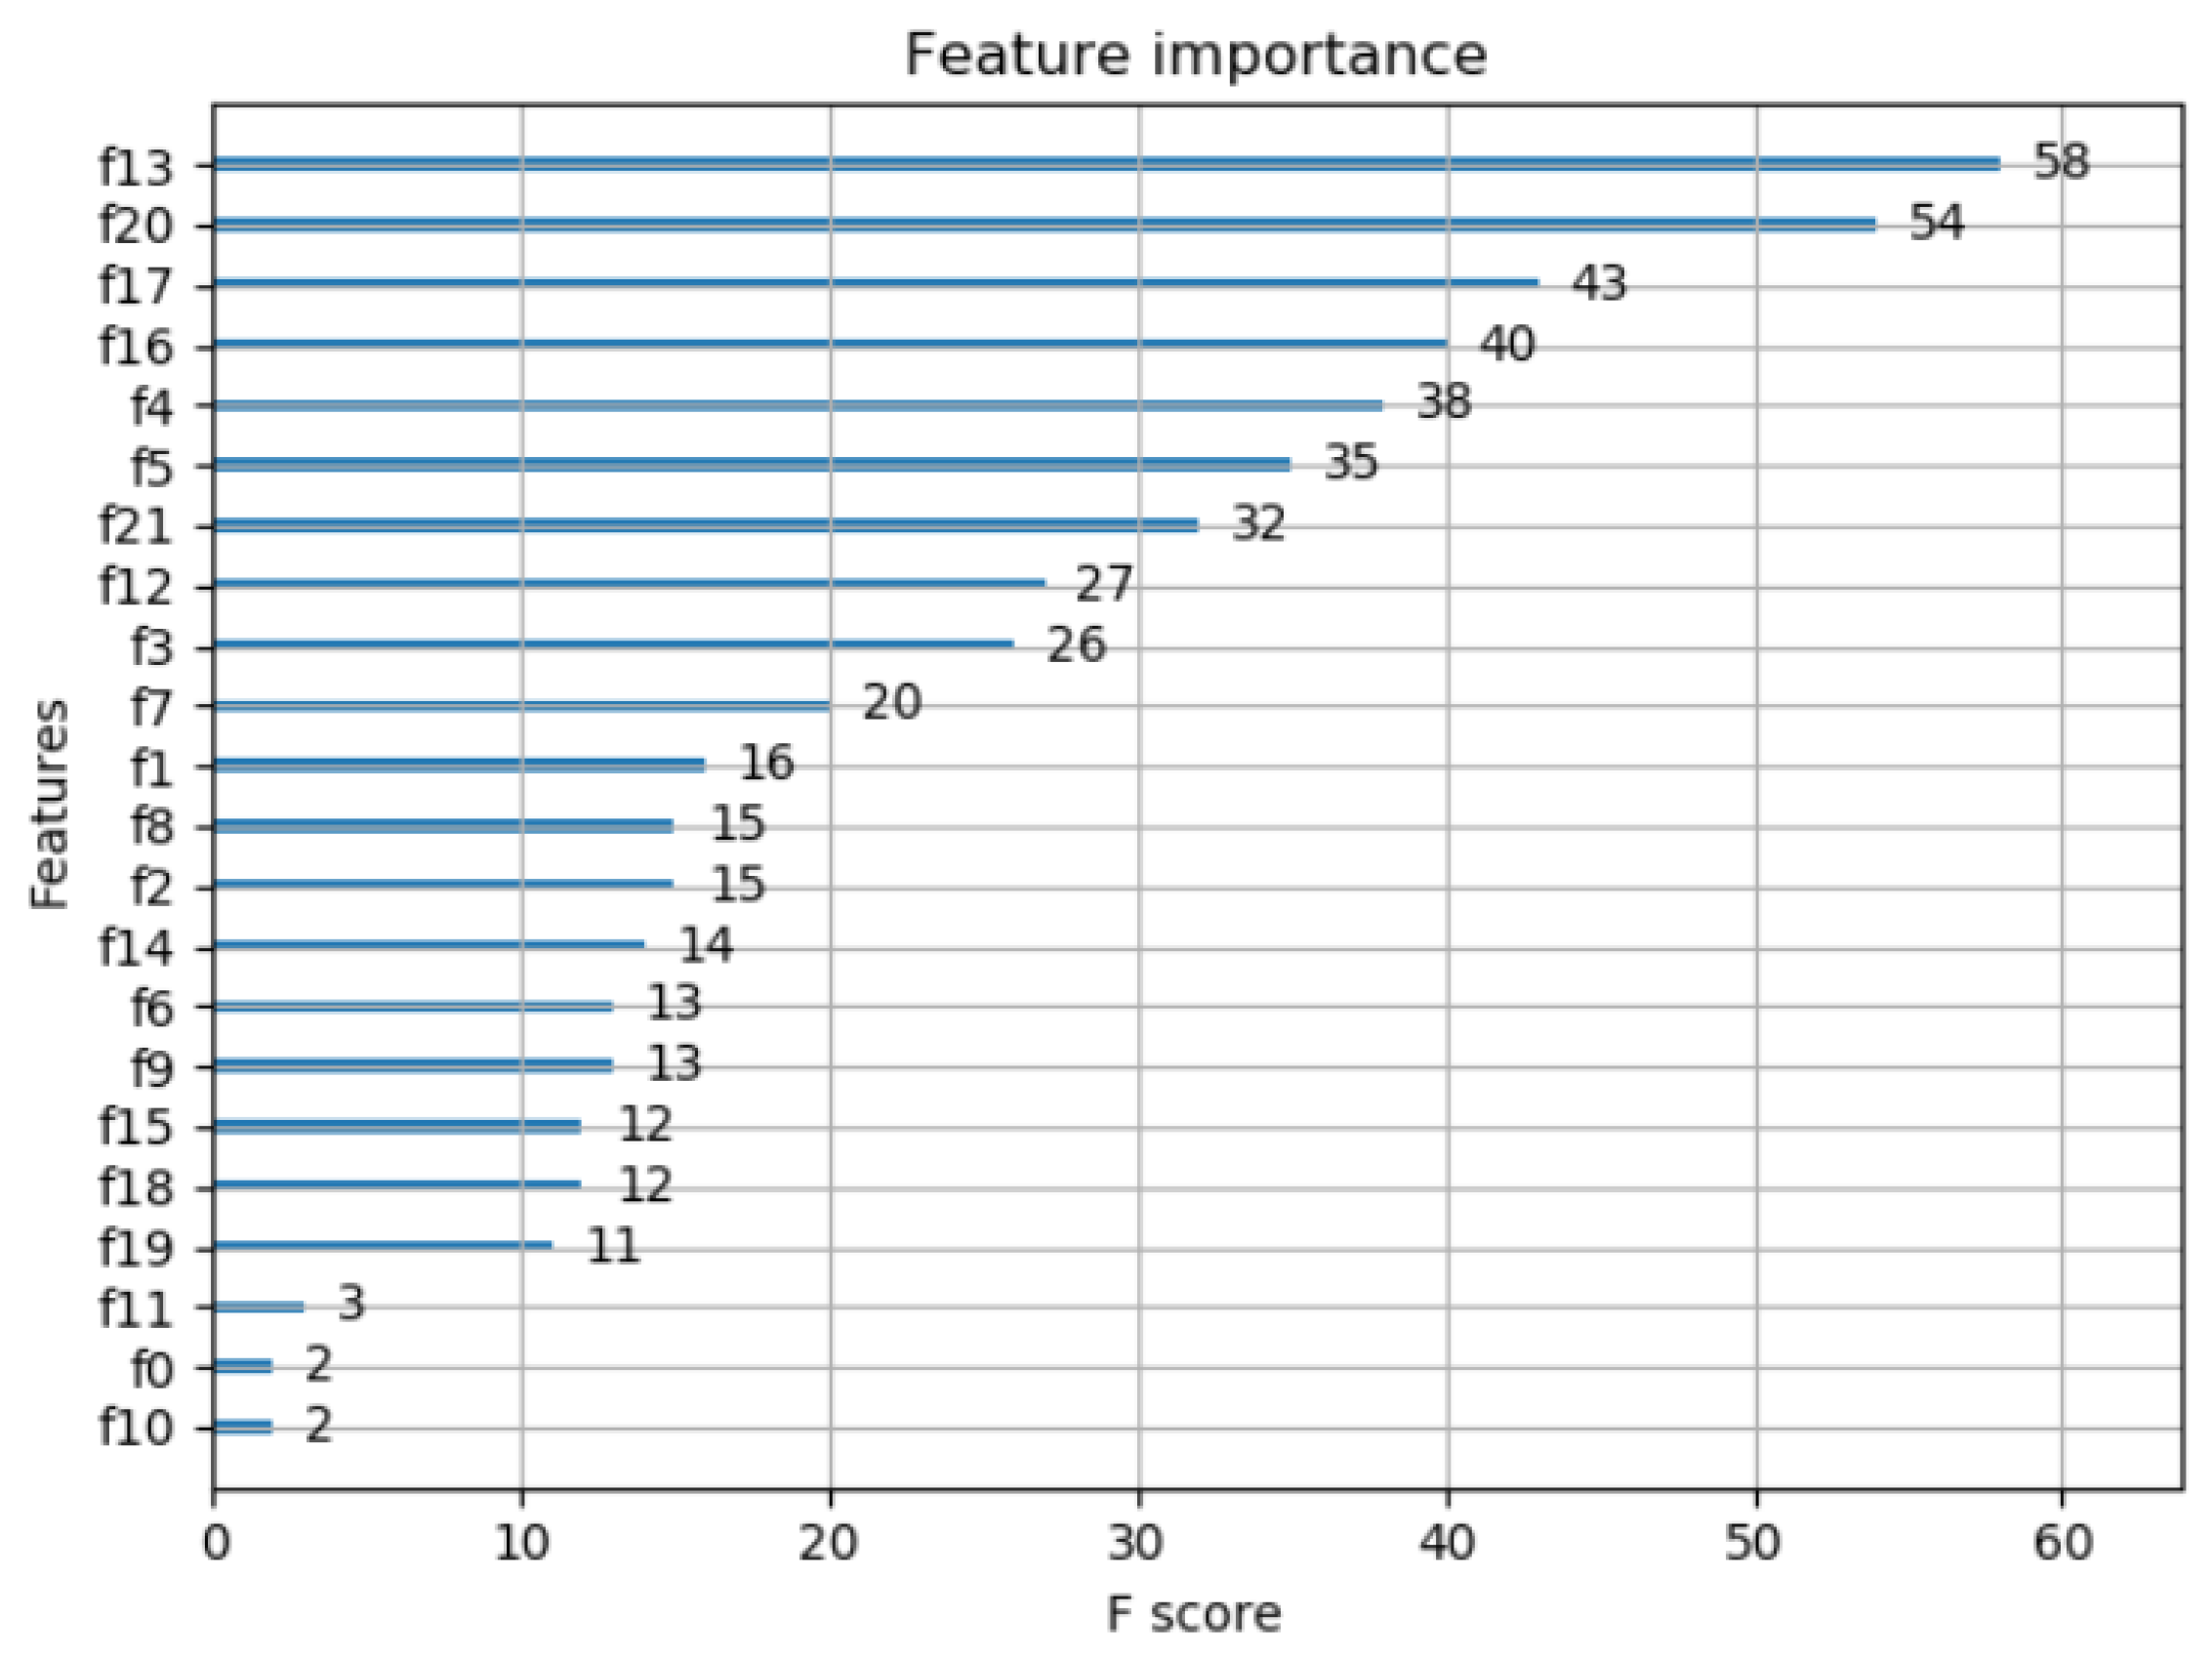
Figure 4 shows the importance degree of the features obtained by the XGBoost method. It can be seen from the figure that the 13th and 20th features have a great influence on the results. According to
Table 1, the two variables are the 24-h average systolic blood pressure and systolic blood pressure during the day.
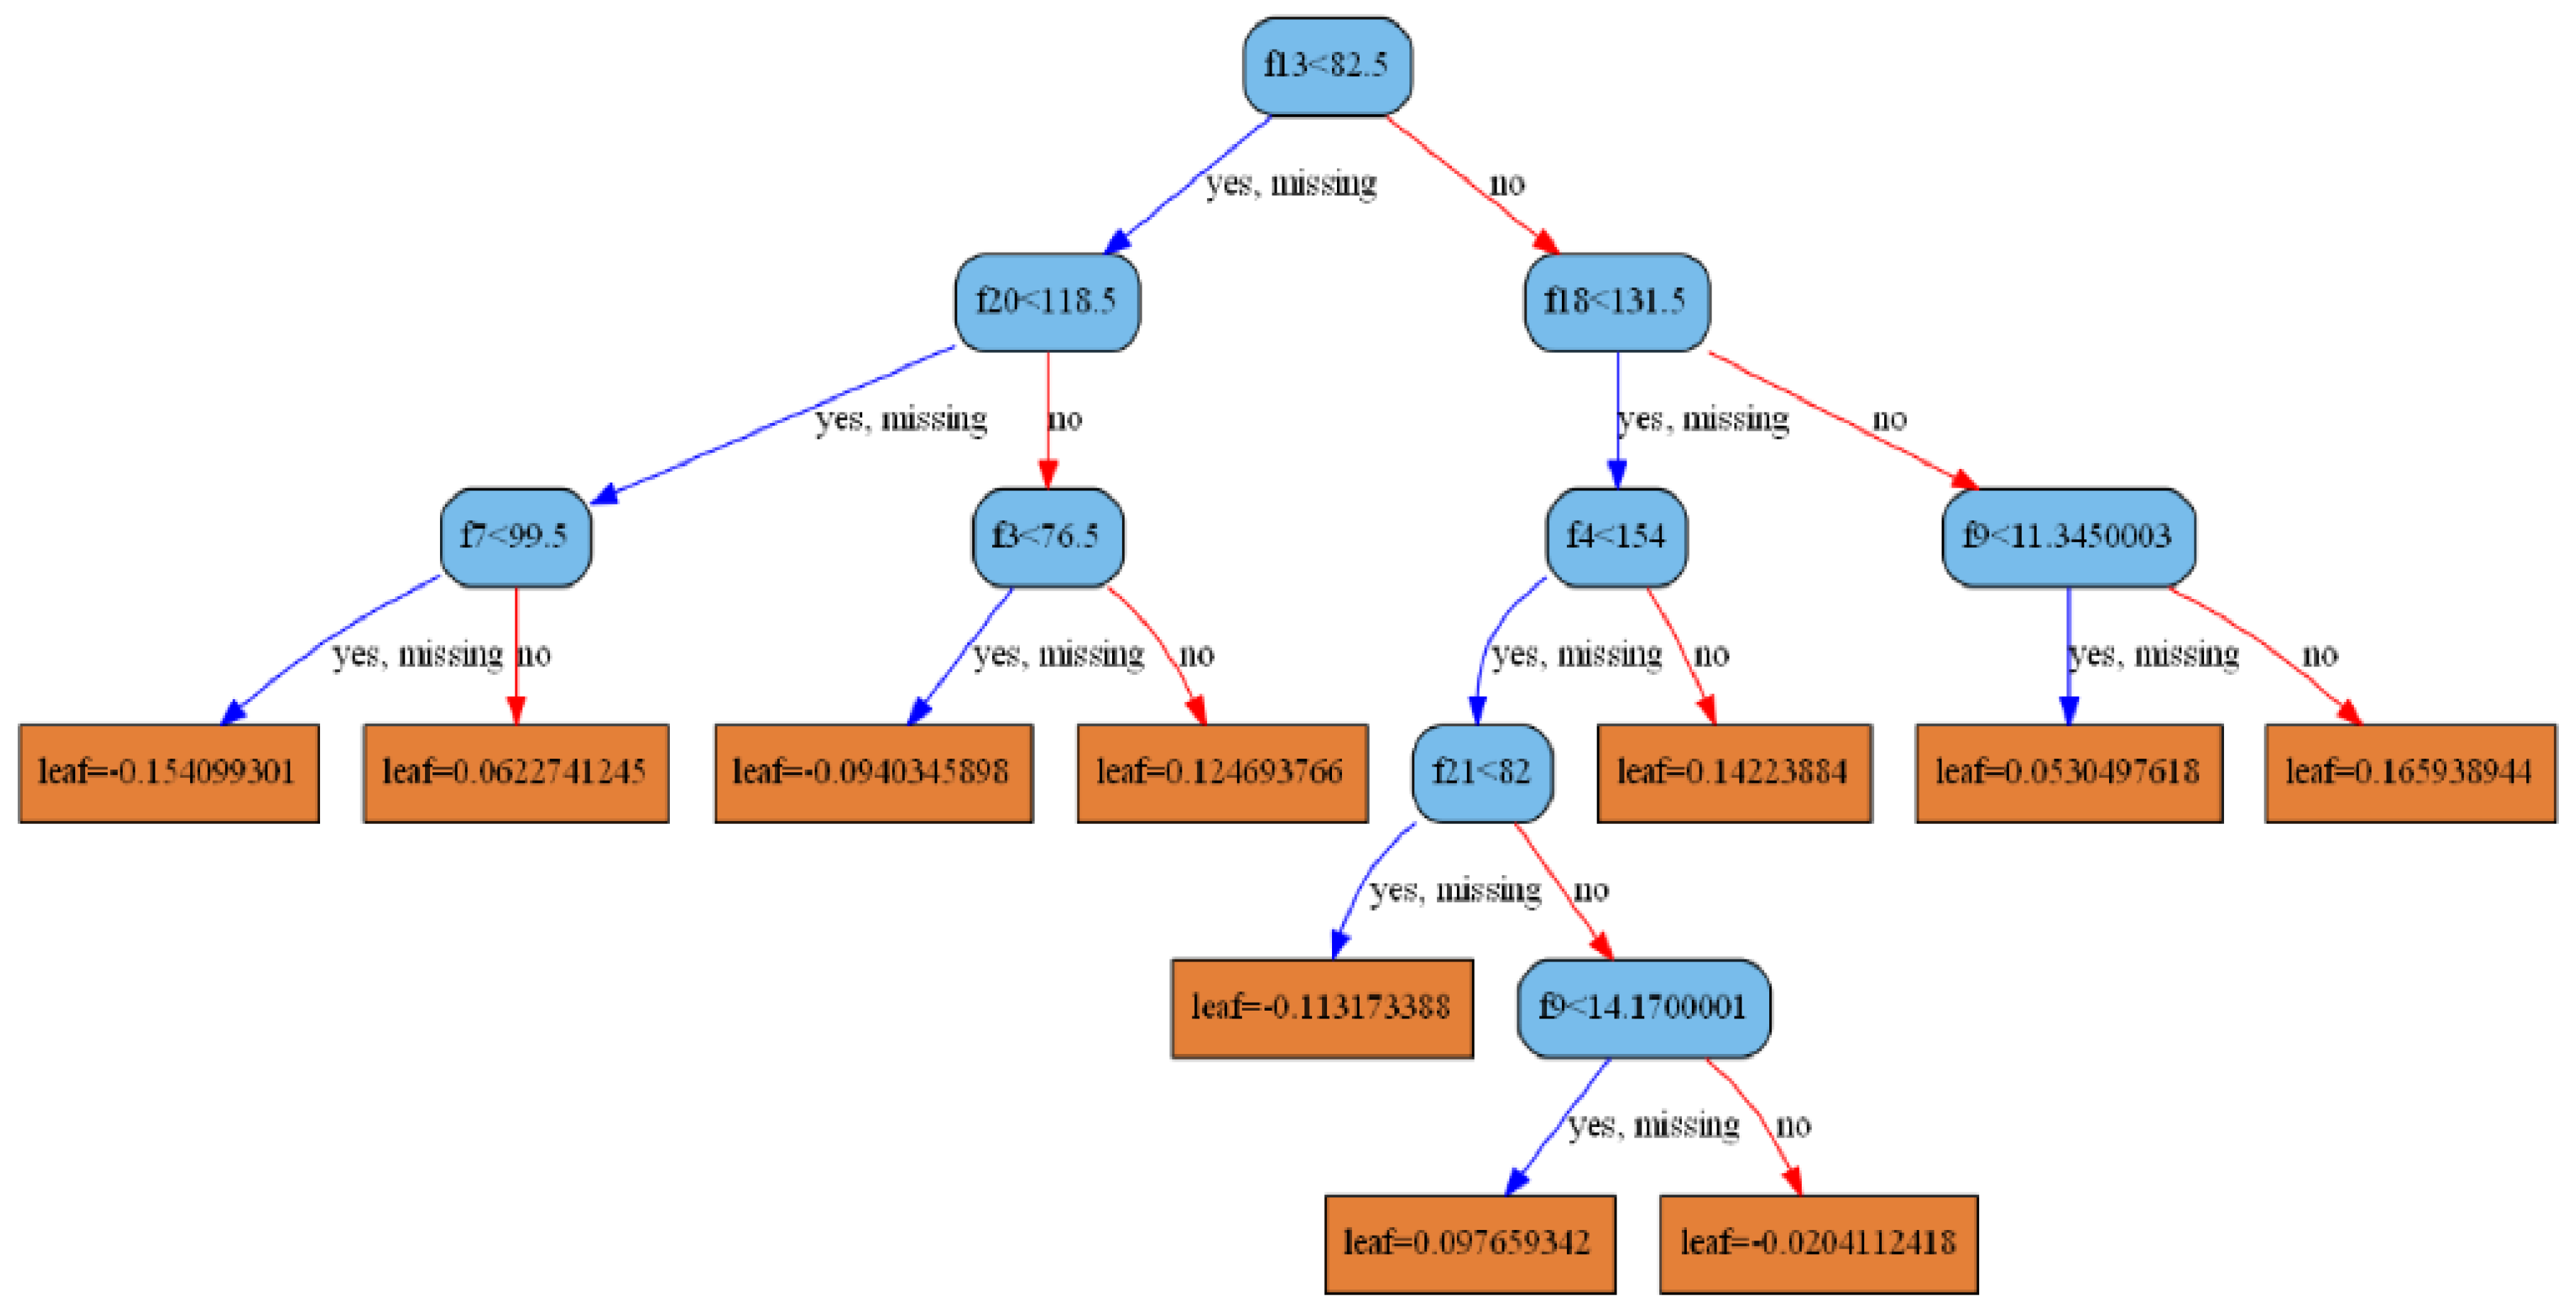
XGBoost is a boosting tree method in which each decision tree can be drawn.
Figure 5 is the decision tree obtained by this model. It can be seen that the root node is the 13th feature, and the left subtree of the second layer is the 20th feature, which is consistent with the feature importance obtained in
Figure 4.
After clustering patients, the proportion of various symptoms in different categories can be counted, this ratio is multiplied by the accuracy obtained by the XGBoost method, and the probability of occurrence of various symptoms is obtained, which is shown in
Table 7. This method of calculation is similar to the method of calculating the expectation in terms of probability.
According to
Table 7, if a new patient is identified as the first type of hypertension, then the probability that he has arteriosclerosis is 87.75%. If he is identified as the second type of hypertension, his probability of arteriosclerosis is 94.93%. These two values are very high, indicating that if the patient is diagnosed with hypertension, then the patient is likely to suffer from vascular sclerosis, patients can receive hardening therapy immediately. According to the data from the table, the difference between ventricular hypertrophy and microalbuminuria is obvious. That is to say, if hypertensive patients are classified into the second group, they will have a greater chance of developing symptoms of ventricular hypertrophy and microalbuminuria, and they can be treated preventively.
4. Conclusions
In this paper, we first pretreated hypertensive data and extracted principal components. After labeling patients with clustering algorithm, combined with XGBoost, the probability of different symptoms of patients was calculated. The final results show that hypertension patients have a high probability of vascular sclerosis symptoms. In other symptoms, there are significant differences between the two groups. The second group has a greater probability of ventricular hypertrophy and microalbuminuria symptoms than the first group. Therefore, if a hypertensive patient is divided into the second type of hypertensive patients, we can focus on the prevention and treatment of microalbuminuria and ventricular hypertrophy. Hypertension can damage organs, which is painful for patients. Microalbumin is the most sensitive and reliable diagnostic indicator for early detection of nephropathy, and ventricular hypertrophy is a precursor of heart disease. Therefore, preventive treatment of type II hypertension patients can reduce the damage of hypertension to the kidney and heart.
For a new patient, classification can be determined by the clustering method in this paper. If many patient categories have been determined by this clustering method, these patients can be added as sample points to the original sample and the probability of different symptoms recalculated. As time goes by, the sample will continue to increase and the final probability will be more accurate.
At present, young people with hypertension in China are increasing year by year, and obesity is becoming more common among young people, meaning that within a short time the condition of hypertension in China will further deteriorate. Hypertension itself is not a major threat, but it will cause damage to target organs. For patients, if the target organ damage occurs, it will not only have a great financial burden, but also have a great impact on the body and spirit. In conclusion, the analysis of hypertension-related symptoms and target organ damage is urgent.
The method proposed in this paper can obtain the probability of certain symptoms in different types of hypertensive patients, and it can guide different types of hypertensive patients for targeted treatment, greatly reducing the risk of suffering from more serious diseases, with strong practical significance.
With the continuous advancement of the era of big data and the continuous development of the medical field, more and more medical data will be preserved. Utilizing big data analysis methods to scientifically use these saved data to increase the accuracy of medical diagnosis will be an important research direction in the future.
This paper combines big data analysis methods with a hospital’s data, and successfully applies big data analysis methods to the medical field. This method can predict the probability of some related symptoms in hypertensive patients. In the medical field, big data analysis can play a huge role, but the extensive application of data analysis in the medical field requires a lot of research. With the continuous development of big data analysis, more accurate research results will make outstanding contributions in the medical field.

 ,
, 


