Article

Quantitative Reconstruction of Absorption Coefficients for Photoacoustic Tomography

1
Department of Control Science and Engineering, Harbin Institute of Technology, Harbin 150000, China
2
Department of Control Science and Engineering, Dalian Maritime University, Dalian 116026, China
3
Department of Control Science and Engineering, Harbin Institute of Technology, Weihai 264209, China
*
Author to whom correspondence should be addressed.
Appl. Sci. 2019, 9(6), 1187; https://doi.org/10.3390/app9061187
Submission received: 19 January 2019 / Revised: 8 March 2019 / Accepted: 11 March 2019 / Published: 20 March 2019

Abstract

:
Photoacoustic (PA) tomography (PAT) is a cutting-edge imaging modality for visualizing the internal structure and light-absorption distribution in tissue. However, reconstruction of the absorption distribution has been limited by nonuniform light fluence. This paper introduces a novel method for quantitative reconstruction of the distribution of optical absorption coefficients in tissue. In this method, we implement an iterative algorithm for recovering absorption coefficients from optical absorbed energy maps based on a 3D Monte Carlo simulation of light transport and integrated with fluence compensation to obtain the initialization parameters. In the iteration algorithm, we calculate the deviation between the detected and the computed absorbed energy distribution at each iteration. By minimizing the deviation in the absorbed energy, the recovered values converge to the true absorption distribution. The results of numerical simulation and phantom experiment theoretically and experimentally demonstrate that the proposed method performs an accurately quantitative estimate of the distribution of optical absorption coefficients. This work expects to provide accurate quantitative information for absorbers within tissues or organs, and thereby broaden the clinical applications of PAT.

1. Introduction

Photoacoustic tomography imaging is an emerging imaging modality that provides both structural and functional information of biological tissues with high contrast and excellent sensitivity [1,2,3,4,5,6,7,8,9]. It is a reliable avenue for detecting melanoma, subcutaneous blood vessels, prostate cancer and breast cancer [10,11,12,13]. The high image contrast is provided by light-absorbing chromophores within the tissue, which may be natural endogenous molecules such as oxyhemoglobin, deoxyhemoglobin, melanin, or exogenous contrast agents such as dyes and nanoparticles [14]. Photoacoustic tomography imaging is based on the photoacoustic effect, which means the generation of acoustic waves by delivering short laser pulses into biological tissues. Some of the delivered energy will be absorbed and converted into heat, leading to transient thermoelastic expansion and thus wideband ultrasonic emission. The generated ultrasonic waves can be detected by acoustic sensors surrounding tissue surface, and then analyzed to reconstruct photoacoustic images [10].
In PA imaging [15,16], the photoacoustic initial pressure distribution is proportional to the absorbed optical energy density, which is a product of both the optical absorption coefficient and the local light fluence. The photoacoustic image is a combination of optical absorption and light fluence and therefore it indirectly represents the structure and physiological information of biological tissues. However, the absorption coefficient distribution can reflect the spatial distribution of the absorbers in a direct way and explicitly without being affected by the change of light fluence. Quantitative PA imaging aims to accurately and quantitatively estimate the distribution of chromophores in tissue. In order to achieve quantitative reconstruction of tissue absorption coefficients, the influence of the depth-dependent attenuation of light fluence should be eliminated [16,17,18].
Although various algorithms have been developed for quantitative estimation of the absorption coefficient [15,16,17,18,19,20,21,22,23,24,25,26,27,28,29,30,31,32,33,34,35,36,37,38,39], they all have limitations on account of being researched primarily for simple simulation. Cox et al. have previously developed a simple iterative method for quantitative reconstruction based on light fluence, that is, the absorption coefficient was iteratively fit by using the measured initial pressure map. While the algorithm converges to an accurate estimate values of absorption coefficients, it only realizes the numerical simulation of the 2-dimensional model. In addition, Cox et al. extended their previous work by using multiwavelength excitation and gradient-based optimization to estimate the chromophores distribution. Finally, Cox et al. were able to demonstrate the model-based recovery of absorption coefficient and reduced scattering coefficient or spectrally derived chromophores from a 4 × 8 mm rectangular region in a Quantitative Photoacoustic Tomography (qPAT) image [15,16,17,18,19]. Thesis work of Roman Hochuli on Monte Carlo for qPAT, which were demonstrated that that linear inversion is only applicable to certain illumination wavelength bands and limited depth, and the alternative approach used a novel Monte Carlo model of light transport to simplify the computation of functional gradients [20]. Rosenthal et al. proposed a quantitative reconstruction sparse representation method based on different spatial distribution characteristics of light fluence and absorption. Although this method does not need the parameter-based fluence distribution, it will generate errors under non-uniform boundary illumination [21,22,23]. Zemp et al. proposed a method for quantitative reconstruction with multiple optical sources under the circumstances of a spatial variation of the Grüneisen coefficient and ideal transducer bandwidth. Their latest research also liberalizes the bandwidth of the ideal sensor [24]. The quantitative reconstruction algorithm developed by Mastanduno et al. for the photoacoustic image is to model optical sources according to acoustic data in order to generate a quantitative image of the absorption coefficient of the deep tissue [25]. Jetzfellner et al. [26]. demonstrated the performance of the iterative photoacoustic inversion scheme, based on the finite element method, experimentally. Brochu et al. proposed an iterative optimization algorithm for fluence correction based on the finite element method [27]. Banerjee et al. achieved recovery of maps of absorption coefficients with initial pressure distribution and boundary pressure measurement [28]. Bauer et al. demonstrated improvements in the reconstruction of large phantoms using hybrid diffuse optical tomography and PAT techniques [29]. Bu et al. introduced a fluence-compensation and reconstruction method for 3-D planar PAT to update the absorption distribution, with fluence compensation being integrated into model-based reconstruction [30]. Yuan and Jiang et al. proposed a quantitative reconstruction method of diffusion equation based on a regularization Newton method. However, PAT images need to be segmented to obtain prior structural information [31,32,33,34].
The quantitative reconstruction is highly underdetermined due to the uncertainty parameter values of the light fluence, absorption, scattering coefficient distribution, and even the Grüneisen coefficient [15,35,36,37,38,39], which leads to considerable difficulty for reconstructing an accurate absorption distribution. In this study, the research focuses on developing an accurately quantitative estimate of the distribution of optical absorption coefficients under the assumption that the Grüneisen coefficient is constant in the tissue and the absorption and scattering distributions of the background are approximately known. In order to recover the absorption distribution, a novel method for quantitative reconstruction of the distribution of optical absorption coefficients in tissue is proposed. This method has the advantage of weakening the dependence on prior knowledge of the tissue model (including various optical properties and geometric information), while also providing a way to update the absorption coefficient based on the deviation of optical energy deposition that can accelerate the iteration. This method has potential to greatly facilitate clinical diagnosis.
The rest of this paper is organized as follows. Section 2 describes the principle of the proposed method. The numerical simulation is presented in Section 3 and Section 4 shows the phantom experiment. Finally, we discuss and conclude our study overall findings in Section 5.

2. Methods

According to the photoacoustic effect, when laser pulses are delivered into biological tissues, optical absorbers in tissue absorb photons and generate ultrasound pressure waves which can be detected by ultrasound transducers around the tissue and then analyzed to reconstruct images [1,2,6].
The measured initial pressure distribution [15,16,17], P 0 is proportional to the absorption energy distribution, A , and the measured initial PA signal may be written as
P 0 = Γ ^ A ,
where Γ ^ is the PA efficiency, which usually can be regarded as a constant value. In addition, the absorption energy distribution can be written as
A = μ a Φ ,
where μ a is the optical absorption coefficient and Φ is the light fluence. Therefore, the initial acoustic pressure distribution may be written as the product of three quantities:
P 0 = Γ ^ μ a Φ ,
Since it is obvious that the measured photoacoustic signal is derived from the interaction between the light fluence and absorption coefficient, the quantitative PA measurements of the optical absorption coefficient requires an accurate estimation of optical fluence [7,15,16,17]. In this paper, we address this issue for fluence estimation using the 3D Monte Carlo simulation, which is often regarded as the “gold standard” for simulating light transport in turbid media and provides a reliable and accurate method for calculating light transport. For this method, we use the mcxyz.c program, a computer simulation of light transport in a heterogenous tissues with varying absorption and scattering properties developed by Steven et al. [7], and the Monte Carlo toolkit can be downloaded freely from https://omlc.org/software/mc/mcxyz/index.html.
This paper introduces a novel method for quantitative reconstruction of the distribution of optical absorption coefficients in tissue. In this method, we implemented an iterative algorithm for recovering absorption coefficients from optical absorbed energy maps based on a 3D Monte Carlo simulation of light transport and integrated with fluence compensation to obtain the initialization parameters. At each iteration, we calculate the deviation between the detected and the computed absorbed energy distribution. By minimizing the deviation in the absorbed energy, the recovered values converge to the true absorption distribution, the flow-chart of the proposed method is shown in Figure 1. After obtaining the absorbed energy deposition, initialize the Monte Carlo simulation model. At this point, parameters such as the illumination geometry, the scattering distribution and the anisotropy factor are used as prior knowledge. It is necessary to combine the pure background for fluence compensation, and to obtain more structural priors to make the quantitative results more accurate. Then based on μ a = A / Φ , obtain the initial absorption coefficient μ a ( 0 ) and start iterating the loop. Calculate the deviation between the detected absorbed energy distribution A ( 0 ) and the computed absorbed energy distribution A ( k ) at each iteration. If the deviation exceeds the stop criterion ε , calculate the increment of the new absorption estimate Δ μ a , and update the new absorption estimate value. The iterative calculation through the loop until the error in the absorbed energy is sufficiently small or exceeds the set maximum number of times. By minimizing the deviation in the absorbed energy, output the recovered values of absorption distribution.
In addition, we used three evaluation indicators to quantitatively evaluate the performance of the algorithm: structural similarity (SSIM), root mean square error (RMSE), and peak signal-to-noise ratio (PSNR) [40,41,42]. The SSIM index is given by
S S I M ( x , y ) = ( 2 μ x μ y + C 1 ) ( 2 σ x y + C 2 ) ( μ x 2 + μ y 2 + C 1 ) ( σ x 2 + σ y 2 + C 2 ) ,
where x and y represent the input image and the real image, respectively, and C 1 , C 2 are small constants, μ x , μ y represents the mean of the image, σ x , σ y represents the variance of the image, σ x y represents the covariance of the image.
RMSE is given as,
R M S E = ( x r e c o n x t r u e ) 2 N N ,
here x r e c o n is the reconstructed data, x t r u e is the ground truth and N is the size of data. Based on RMSE, the PSNR is defined as,
P S N R = 20 × log ( max ( x t r u e ) R M S E ) ,

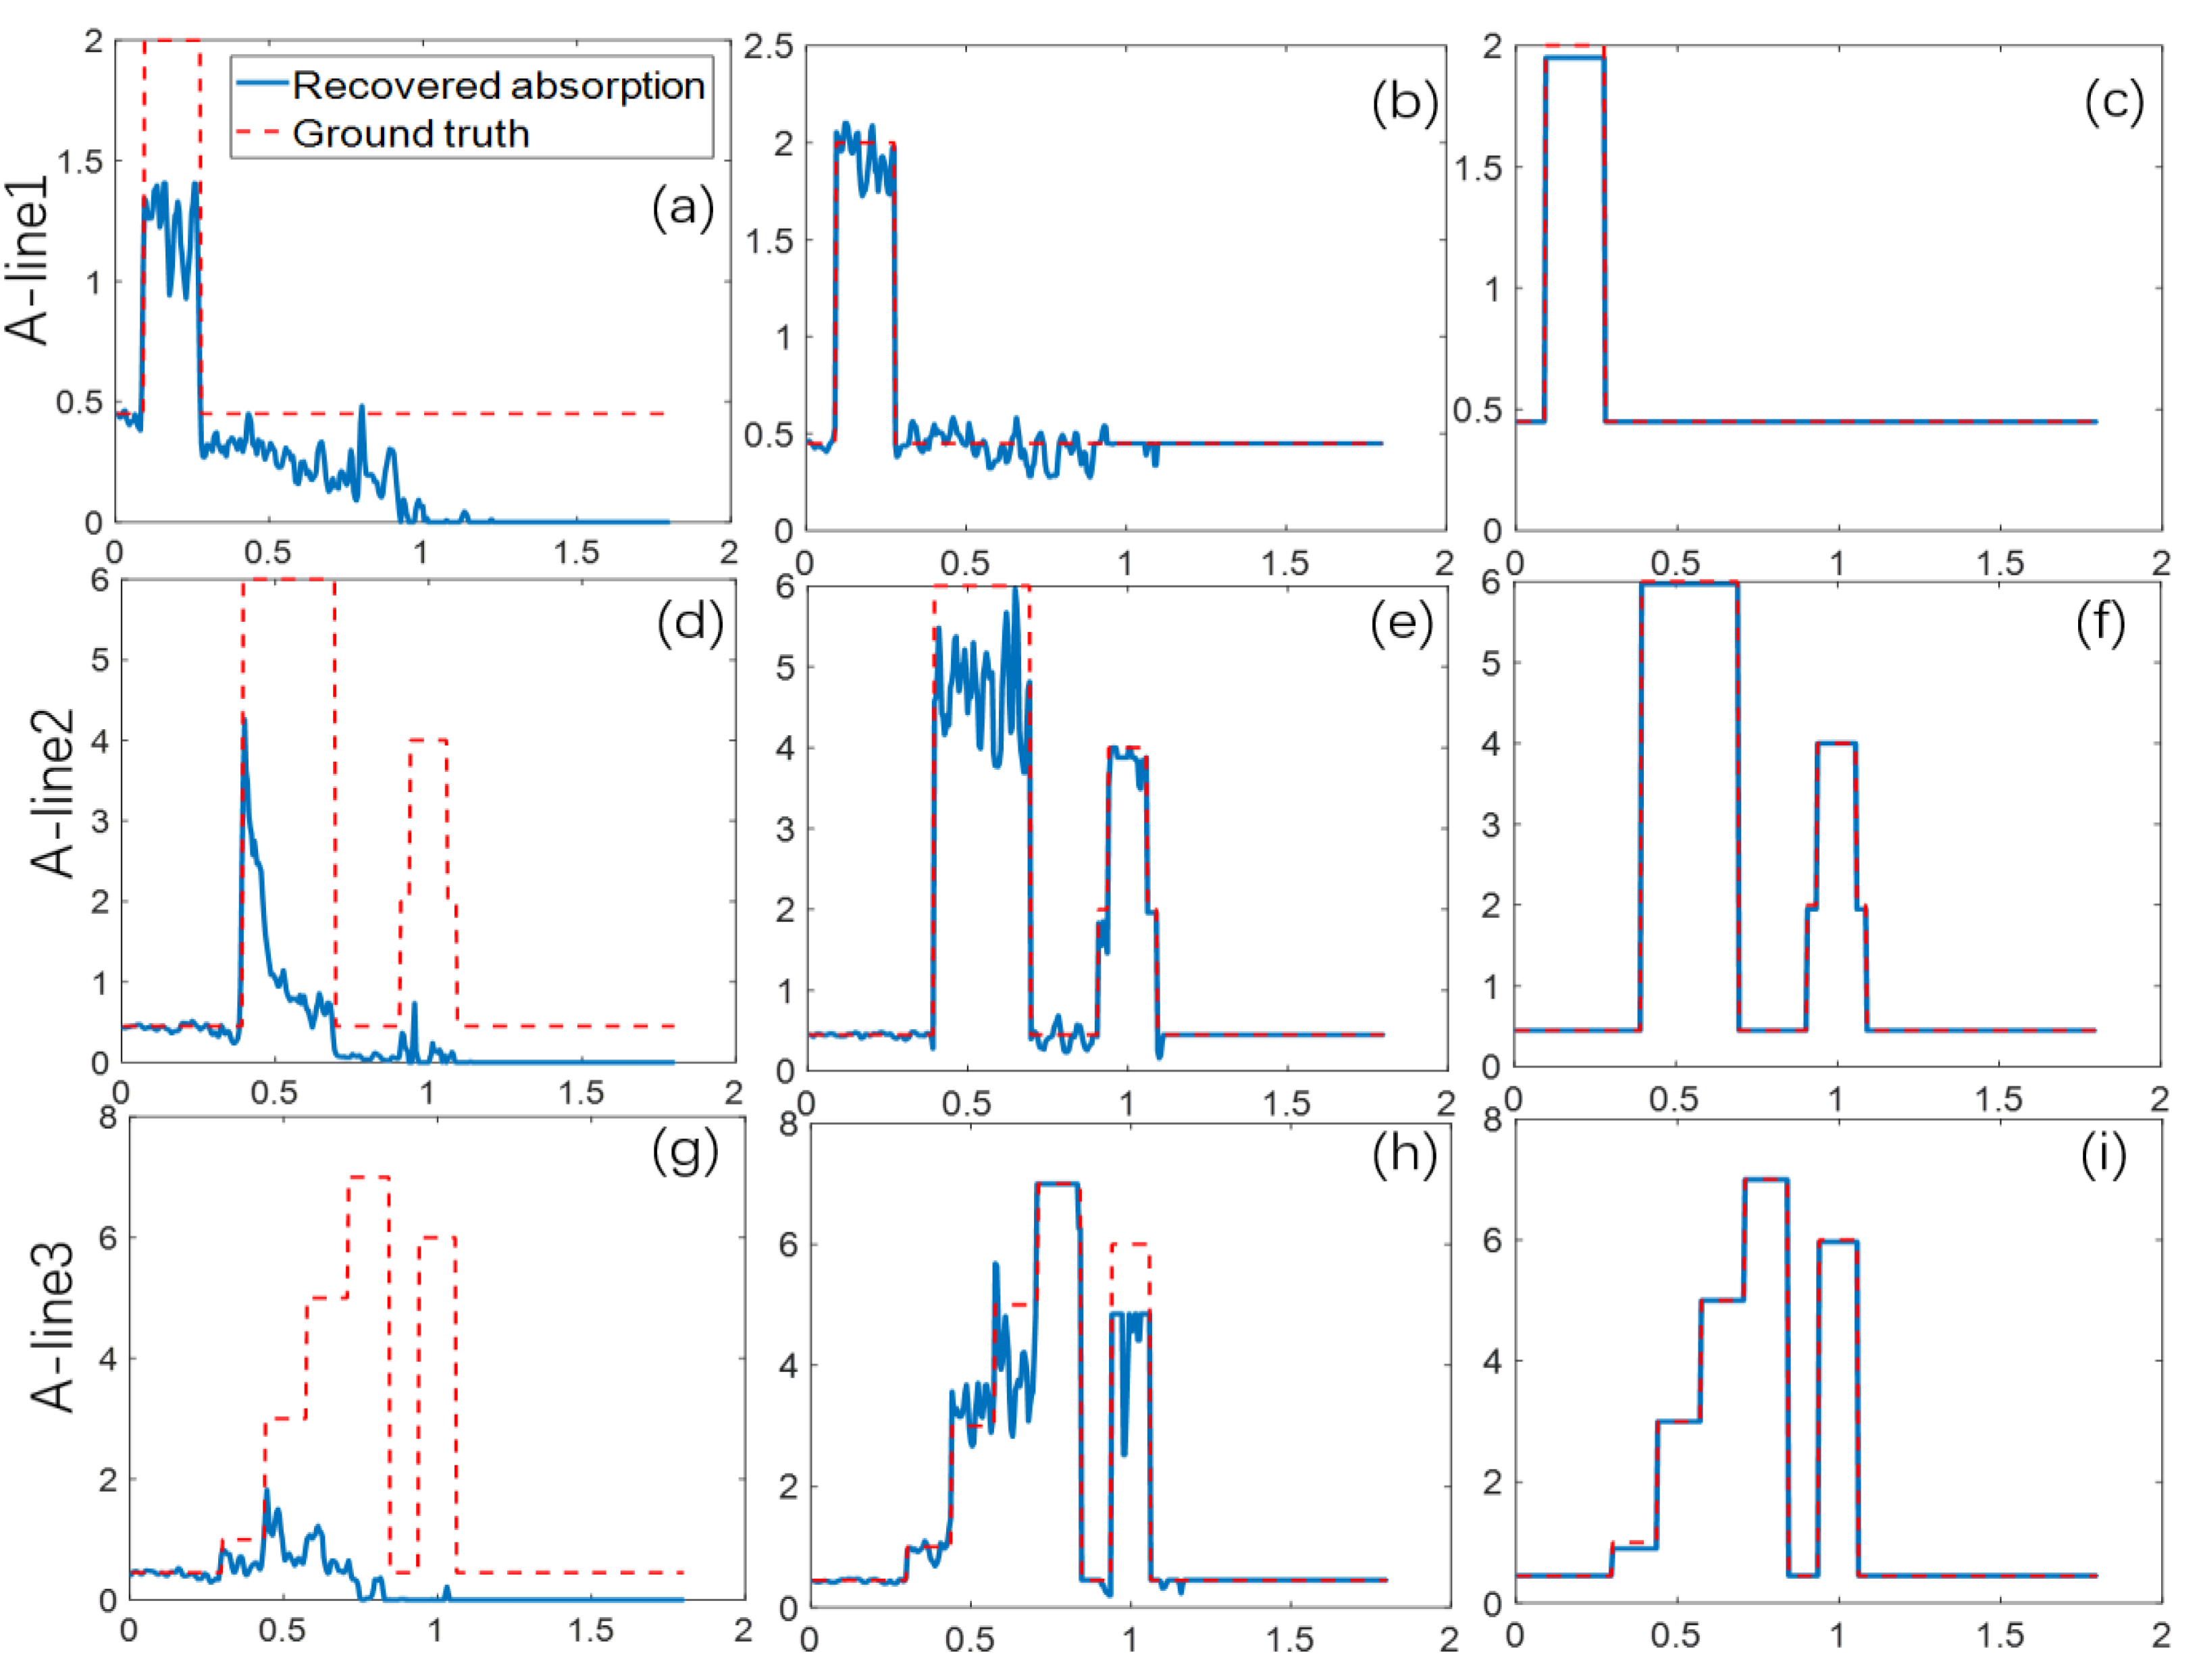
3. Numerical Simulation

We design a complex numerical simulation experiment to evaluate the proposed method, a 3D MC model of light transport was employed to simulate the measured absorbed energy density [7]. In this numerical simulation, we designed a 3D simulation of the hypothetical complex tissue model, as illustrated in Figure 2a.
The 3D tissue model contains 5 targets with different absorption coefficients with a range of 0.45 cm−1 to 7 cm−1 embedded in a block tissue (1.8 × 1.8 × 1.8 cm3). Target 1 is a cube with a side length of 0.18 cm, the absorption coefficient is 2.0 cm−1. Target 2 is a sphere (dia. 0.30 cm) with absorption coefficient μ a of 6 cm−1. Target 3 is a multi-layer nested structure, which is a large cube nested into four layers, and the absorption distribution of each layer is 1, 3, 5, 7 (cm−1). Target 4 is a little cube with a little ball inside, the μ a of the inner-sphere is 4 cm−1. Target 5 is a sphere (dia. 0.12 cm), the absorption coefficient is the same as for target 2. The simulation parameters are summarized in Table 1. The background’s absorption coefficient was μ a = 0.45 cm−1, and its scattering coefficient was μ s = 356.5 cm−1.
Figure 2b shows the measured absorption energy distribution on the cross section of z-x plane at y = 0. Obviously, the distribution of absorbed energy is affected by the depth-dependent attenuation of light fluence, which cannot provide sufficient tissue information, especially in the deep tissue.
A uniformly distributed illumination was selected, irradiated from top to bottom, and the illumination diameter was 0.63 cm. The corresponding laser wavelength is 532 nm and the running time of simulation was 10 min. We set the stop criterion to 0.2 and the maximum number of iterations to 30.
The z-x plane configuration for the simulation model is shown in Figure 3a, and Figure 3b is the fluence distribution of pure background tissue corresponding to the z-x section, which is calculated based on the Monte Carlo method according to the background tissue parameters. Then execute light fluence compensation to obtain initial absorption coefficient and implement the quantitative estimate of absorption coefficient iteratively.
Iterative recovery of the absorption coefficient results of three iterations (No. 1, 5 and 10) are shown in Figure 4 respectively. Here, we select 3 A-lines to visualize the iteration recovery of the absorption coefficient results. After 10 iterations, the value of the absorption coefficient was recovered quantitatively, and the accuracy reached 92.00% to 99.50%. Figure 4 excellently shows that the iterative method proposed in this paper quantitatively recovered the true absorption distribution for the complex tissue model. The results show that the proposed algorithm can effectively reduce or even eliminate the influence of light fluence on the measured absorption distribution.
Figure 5 corresponds to the three A-lines (white dotted line) selected in Figure 4a, three profiles visualize the performance of the proposed quantitative recovery absorption coefficient method, which were the results of three iterations of 1, 5 and 10, respectively corresponding to the absorption distribution in Figure 4. Figure 5 shows that with the increase of iteration times, the absorption coefficient more obviously converges to the ground truth, which demonstrates the feasibility of the iterative algorithm proposed in this paper.
Absorption energy distribution before iteration recovery and absorption coefficient distribution after iterative recovery are shown on a 3-D mesh in Figure 6a,b, respectively. As can be seen from the figure, before the quantitative recovery, it was hard to obtain the absorption distribution in deep tissue according to the graph of energy absorption deposition before the quantitative recovery. In contrast, the obtained absorption coefficient distribution was greatly improved after applying the quantitative iterative algorithm. The quantitative recovery algorithm has noticeable effect and iterative convergence, as shown in Figure 6. In addition, the results are listed in Table 2, including the raw data before and after the algorithm. By comparing the difference of the simulation results between the restored value and the real value, the proposed algorithm can obtain remarkably accurate quantitative absorption coefficients. Furthermore, we employ SSIM, RMSE, and PSNR as evaluation indicators to verify the reliability of the algorithm by comparing changes in various indicators before and after recovery [40,41,42].
In Table 2, we use SSIM as the local information evaluation index. SSIM1 represents the local corresponding area calculation result between the original data and the actual value before reconstruction, and SSIM2 represents the local corresponding area calculation result between the restored data and the actual value after reconstruction. The comparison proves that the proposed method makes the SSIM value totally enhanced. In particular, the degree of improvement in target2, target3- layer2-4, and target4, target5 in the deeper position is obviously advanced.
Table 3 shows the changes of the overall photoacoustic image before and after recovery, in which the values of the algorithm quality evaluation indicators SSIM and PSNR are significantly improved, while the value of RMSE is significantly reduced. The correct trend of the three indicators verifies the reliability of the proposed method.

4. Phantom Experiment

Performances were also evaluated by a tissue-mimicking phantom with an embedded absorber, as illustrated in Figure 7a. The background of the tissue-mimicking phantom with a size of 0.6 (X) × 0.6 (Y) × 0.6(Z) cm3 included (1%–2%) Intralipid and Arga powder. The absorption and scattering coefficients of the base phantom were 0.04 and 200 cm−1 at a wavelength of 532 nm [26,34,43,44]. A 2 mm-diameter tube filled with 5% Indian ink as the absorber was inserted into a phantom-base. The µa value of the Indian ink absorber was 112.5 cm−1, and scattering coefficients was 100 cm−1, we utilized a spectrophotometer to measure the optical properties of the phantom sample, and the absorption coefficient value was normalized to 100 for computational convenience [26,27,34].
In the phantom experiment, the light illumination was provided by a pulsed Nd:YAG laser source (Vigour-A-100S, Anshan Ziyu, China) with the wavelength of 532 nm, pulse repetition rate of 20 Hz and pulse duration 5 ns. A photoacoustic imaging system (Prodigy, S-Sharp, China) was exploited with a linear array transducer to acquire the PA signal. Figure 7b is a B-scan of the phantom reconstructed from PA signals obtained by the S-Sharp system, while Figure 7c demonstrates the corresponding fluence distribution of the phantom.
The absorption coefficient of the phantom absorber was estimated by the proposed iteration method. Firstly, the initial absorption coefficient was obtained based on the 3D Monte Carlo model to execute light fluence compensation. In the iteration algorithm, the deviation was calculated between the detected and the computed distribution of absorbed energy at each iteration, which was used to update the estimated optical parameter. By minimizing the deviation in the absorbed energy, the final estimate was obtained as the value of the optimal absorption distribution.
A-line profiles are selected to visualize the iteration recovery results, and the recovery results of absorption coefficients of the 3rd, 6th and 13th iterations are shown in Figure 8a–c, respectively. After 13 iterations, the condition of iteration stopping was reached and the optimal quantitative estimate value could be outputted. The results show that the proposed algorithm can effectively reduce or even eliminate the influence of light fluence on the measured absorption distribution.

5. Discussion and Conclusions

In this paper, we have successfully demonstrated the applicability of the novel method for quantitative reconstruction of the distribution of optical absorption coefficients, which has higher practicability compared with the traditional iterative recovery method. The 3D Monte Carlo simulation is carried out by utilizing this approach, and the parameters to initialize the Monte Carlo are obtained by pure background fluence compensation. The research weakens the dependence on the prior knowledge of the tissue model (including various optical properties and geometric information). However, studies have shown that the automatic segmentation process can be integrated with an iterative inversion algorithm to provide a reliable way to obtain a more accurate reconstruction of the actual distribution of absorption coefficients. In the research work of Matthews et al. [45], a joint reconstruction method is proposed in which the sound velocity and initial pressure distribution are simultaneously estimated accurately from the photoacoustic measurement results. Mandal S et al. [46]. investigated the applicability of active contour models for boundary segmentation in optoacoustic tomographic reconstructions and further used a reconstruction mask for quantitative mapping the optical absorption coefficient via light fluence normalization. Their research shows the prior knowledge obtained by the segmentation method.
In the algorithm, we limit our current investigation to the optical inverses without considering the effects of acoustic inverse problems. In fact, photoacoustic images are constituted by integrating optical information and ultrasonic propagation. In the hybrid imaging process, the solution of the acoustic inverse problem (i.e., the absorbed energy distribution) is input into the optical inverse problem to quantify the absorption coefficient distribution or the chromophore concentration in the tissue. Obviously, the noise in the former results will directly affect the latter quantified results. The noise of optical data is modeled as Gaussian distributed in the study by Tarvainen T et al. [47], Bayesian approximation error modeling is further applied to compensate for modeling errors in the optical data caused by the acoustic solver, thereby improving optical reconstruction. Prakash J. et al. [48] proposed an algorithm for photoacoustic tomography based on an entropy maximization algorithm, which uses logarithmic regularization for attaining nonnegative reconstructions and showed excellent reconstruction performance.
In addition, this method updates the iterative absorption coefficient by making use of the difference of the absorption energy distribution between measurements and calculated values, while at the same time ensuring the convergence of the algorithm and effectively improving the efficiency. By minimizing the deviation in the absorbed energy, the recovery values converge to the true absorption distribution. The results of numerical simulation and phantom experiment theoretically and experimentally demonstrate that the proposed method can estimate the distribution of optical absorption coefficients accurately and quantitatively. This paper is promising for the application of vascular system and breast cancer detection photoacoustic imaging quantitative analysis, etc., which need to accurately estimate the absorption distribution.
In the future work, we will continue to research a better optimization method for addressing the quantitative photoacoustic imaging problem. In addition, we will try to explore more complex phantom experiments, ex-vivo experiments or in-vivo experiments. This work expects to provide accurate quantitative information for absorbers within tissues or organs, thereby broadening the clinical applications of PAT.

Author Contributions

Conceptualization and methodology, Y.L. and M.S.; Data processing, Y.L., T.L., Y.M. and C.L.; Software and Formal Analysis, D.H., N.F. and Y.M.; Writing, Y.L. and S.M.; Supervision S.M. and N.F.

Funding

This research was funded by the National Key R&D Program of China (Grant No.2017YFE0121000 and No.2018YFC0114800), National Natural Science Foundation of China (Grant No.11574064 and No.11874133), Shandong Provincial Natural Science Foundation, China (Grant No. ZR2017MF041 and ZR2018MF026), the Science and Technology Development Plan Project of Shandong Province (Grant No.2018GGX103047 and 2016GGX103032), Development Plan of Chinese Academy of Sciences and Wego Group (Grant No.2017011).

Acknowledgments

The authors would like to thank the reviewers for their valuable comments to improve this paper. The authors would also like to thank the team members from the Institute of biomedical and health engineering at Shen Zhen Institute of Advanced Technology, Chinese Academy of Sciences (SIAT) for helping to evaluate the optical properties of the phantom.

Conflicts of Interest

The authors declare no conflict of interest.

References

  1. Wang, L.V.; Hu, S. Photoacoustic Tomography: In Vivo Imaging from Organelles to Organs. Science 2012, 335, 1458–1462. [Google Scholar] [CrossRef] [PubMed] [Green Version]
  2. Xu, M.; Wang, L.V. Photoacoustic imaging in biomedicine. Rev. Sci. Instrum. 2006, 77, 305–598. [Google Scholar] [CrossRef]
  3. Beard, P. Biomedical photoacoustic imaging. Interface Focus 2011, 1, 602–631. [Google Scholar] [CrossRef] [PubMed] [Green Version]
  4. Wang, X.; Pang, Y.; Ku, G.; Xie, X.; Stoica, G.; Wang, L.V. Noninvasive laser-induced photoacoustic tomography for structural and functional in vivo imaging of the brain. Nat. Biotechnol. 2003, 21, 803. [Google Scholar] [CrossRef]
  5. Zerda, A.D.L.; Zavaleta, C.; Keren, S.; Vaithilingam, S.; Bodapati, S.; Liu, Z.; Levi, J.; Smith, B.R.; Ma, T.-J.; Oralkan, O.; et al. Carbon nanotubes as photoacoustic molecular imaging agents in living mice. Nat. Nanotechnol. 2008, 3, 557. [Google Scholar] [CrossRef] [PubMed]
  6. Wang, L.V.; Wu, H. Biomedical optics: Principles and imaging. J. Biomed. Opt. 2008, 13, 049902. [Google Scholar] [CrossRef]
  7. Jacques, S.L. Coupling 3D Monte Carlo light transport in optically heterogeneous tissues to photoacoustic signal generation. Photoacoustics 2014, 2, 137–142. [Google Scholar] [CrossRef] [Green Version]
  8. Liu, T.; Sun, M.; Feng, N.; Wu, Z.; Shen, Y. Multiscale Hessian filter-based segmentation and quantification method for photoacoustic microangiography. Chin. Opt. Lett. 2015, 13, 091701. [Google Scholar]
  9. Lin, X.; Sun, M.; Feng, N.; Hu, D.; Shen, Y. Monte Carlo light transport-based blood vessel quantification using linear array photoacoustic tomography. Chin. Opt. Lett. 2017, 15, 111701. [Google Scholar]
  10. Wang, X.; Roberts, W.W.; Carson, P.L.; Wood, D.P.; Fowlkes, J.B. Photoacoustic tomography: A potential new tool for prostate cancer. Biomed. Opt. Express 2010, 1, 1117–1126. [Google Scholar] [CrossRef]
  11. Zhou, Y.; Xing, W.; Maslov, K.I.; Cornelius, L.A.; Wang, L.V. Handheld photoacoustic microscopy to detect melanoma depth in vivo. Opt. Lett. 2014, 39, 4731–4734. [Google Scholar] [CrossRef] [PubMed] [Green Version]
  12. Heijblom, M.; Piras, D.; Xia, W.; van Hespen, J.C.; Klaase, J.M.; Van den Engh, F.M.; van Leeuwen, T.G.; Steenbergen, W.; Manohar, S. Visualizing breast cancer using the Twente photoacoustic mammoscope: What do we learn from twelve new patient measurements? Opt. Express 2012, 20, 11582. [Google Scholar] [CrossRef]
  13. Li, R.; Wang, P.; Lan, L.; Lloyd, F.P.; Goergen, C.J.; Chen, S.; Cheng, J.X. Assessing breast tumor margin by multispectral photoacoustic tomography. Biomed. Opt. Express 2015, 6, 1273. [Google Scholar] [CrossRef] [PubMed]
  14. Tzoumas, S.; Nunes, A.; Olefir, I.; Stangl, S.; Symvoulidis, P.; Glasl, S.; Bayer, C.; Multhoff, G.; Ntziachristos, V. Eigenspectra optoacoustic tomography achieves quantitative blood oxygenation imaging deep in tissues. Nat. Commun. 2016, 7, 12121. [Google Scholar] [CrossRef] [Green Version]
  15. Cox, B.; Laufer, J.G.; Beard, P.C.; Arridge, S.R. Quantitative spectroscopic photoacoustic imaging: A review. J. Biomed. Opt. 2012, 17, 061202. [Google Scholar] [CrossRef]
  16. Cox, B.T.; Arridge, S.R.; Kostli, K.P.; Beard, P.C. Quantitative photoacoustic imaging: Fitting a model of light transport to the initial pressure distribution. Photons Plus Ultrasound Imaging Sens. Sixth Conf. Biomed. Thermoacoust. 2005, 5697, 49–56. [Google Scholar]
  17. Cox, B.T.; Arridge, S.R.; Köstli, K.P.; Beard, P.C. Two-dimensional quantitative photoacoustic image reconstruction of absorption distributions in scattering media by use of a simple iterative method. Appl. Opt. 2006, 45, 1866–1875. [Google Scholar] [CrossRef] [PubMed]
  18. Cox, B.T.; Arridge, S.R.; Beard, P.C. Estimating chromophore distributions from multiwavelength photoacoustic images. J. Opt. Soc. Am. A Opt. Image Sci. Vis. 2009, 26, 443–455. [Google Scholar] [CrossRef]
  19. Cox, B.; Shao, P.; Zemp, R.J. Estimating optical absorption, scattering, and Grueneisen distributions with multiple-illumination photoacoustic tomography. Appl. Opt. 2011, 50, 3145–3154. [Google Scholar]
  20. Hochuli, R. Monte Carlo Methods in Quantitative Photoacoustic Tomography. Ph.D. Thesis, University College London, London, UK, 2016. [Google Scholar]
  21. Rosenthal, A.; Razansky, D.; Ntziachristos, V. Quantitative Optoacoustic Signal Extraction Using Sparse Signal Representation. IEEE Trans. Med. Imaging 2009, 28, 1997–2006. [Google Scholar] [CrossRef]
  22. Rosenthal, A.; Razansky, D.; Ntziachristos, V. Sparse signal representation at the service of quantitative optoacoustic tomography. Photons Plus Ultrasound Imaging Sens. Int. Soc. Opt. Photonics 2010, 7564, 75640S. [Google Scholar]
  23. Rosenthal, A.; Razansky, D.; Ntziachristos, V. Fast semi-analytical model-based acoustic inversion for quantitative optoacoustic tomography. IEEE Trans. Med. Imaging 2010, 29, 1275–1285. [Google Scholar] [CrossRef] [PubMed]
  24. Zemp, R.J. Quantitative photoacoustic tomography with multiple optical sources. Appl. Opt. 2010, 49, 3566–3572. [Google Scholar] [CrossRef] [PubMed]
  25. Mastanduno, M.A.; Gambhir, S.S. Quantitative photoacoustic image reconstruction improves accuracy in deep tissue structures. Biomed. Opt. Express 2016, 7, 3811. [Google Scholar] [CrossRef]
  26. Jetzfellner, T.; Razansky, D.; Rosenthal, A.; Schulz, R.; Englmeier, K.H.; Ntziachristos, V. Performance of iterative optoacoustic tomography with experimental data. Appl. Phys. Lett. 2009, 95, 013703. [Google Scholar] [CrossRef]
  27. Brochu, F.M.; Brunker, J.; Joseph, J.; Tomaszewski, M.R.; Morscher, S.; Bohndiek, S.E. Towards Quantitative Evaluation of Tissue Absorption Coefficients Using Light Fluence Correction in Optoacoustic Tomography. IEEE Trans. Med. Imaging 2017, 36, 322–331. [Google Scholar] [CrossRef] [Green Version]
  28. Banerjee, B.; Bagchi, S.; Vasu, R.M.; Roy, D. Quantitative photoacoustic tomography from boundary pressure measurements: Noniterative recovery of optical absorption coefficient from the reconstructed absorbed energy map. JOSA A 2008, 25, 2347–2356. [Google Scholar] [CrossRef]
  29. Bauer, A.Q.; Nothdurft, R.E.; Culver, J.P.; Erpelding, T.N.; Wang, L.V. Quantitative photoacoustic imaging: Correcting for heterogeneous light fluence distributions using diffuse optical tomography. J. Biomed. Opt. 2011, 16, 096016. [Google Scholar] [CrossRef]
  30. Bu, S.; Liu, Z.; Shiina, T.; Kondo, K.; Yamakawa, M.; Fukutani, K.; Someda, Y.; Asao, Y. Model-Based Reconstruction Integrated with Fluence Compensation for Photoacoustic Tomography. IEEE Trans. Biomed. Eng. 2012, 59, 1354–1363. [Google Scholar]
  31. Yuan, Z.; Wang, Q.; Jiang, H. Reconstruction of optical absorption coefficient maps of heterogeneous media by photoacoustic tomography coupled with diffusion equation based regularized Newton Method. Opt. Express 2007, 15, 18076–18081. [Google Scholar] [CrossRef]
  32. Yuan, Z.; Jiang, H. Three-dimensional finite-element-based photoacoustic tomography: Reconstruction algorithm and simulations. Med. Phys. 2007, 34, 538–546. [Google Scholar] [CrossRef]
  33. Yao, L.; Jiang, H. Finite-element-based photoacoustic tomography in time domain. J. Opt. A Pure Appl. Opt. 2009, 11, 085301. [Google Scholar] [CrossRef]
  34. Liu, Y.; Jiang, H.; Yuan, Z. Two schemes for quantitative photoacoustic tomography based on Monte Carlo simulation. Med. Phys. 2016, 43, 3987–3997. [Google Scholar] [CrossRef] [PubMed]
  35. Rabanser, S.; Neumann, L.; Haltmeier, M. Stochastic Proximal Gradient Algorithms for Multi-Source Quantitative Photoacoustic Tomography. Entropy 2018, 20, 121. [Google Scholar] [CrossRef]
  36. Xia, J.; Danielli, A.; Liu, Y. Calibration-free quantification of absolute oxygen saturation based on the dynamics of photoacoustic signals. Opt. Lett. 2013, 38, 2800–2803. [Google Scholar] [CrossRef] [PubMed] [Green Version]
  37. Jin, Z.; Anastasio, M.A.; Riviere, P.J.; Wang, L.V. Effects of different imaging models on least-squares image reconstruction accuracy in photoacoustic tomography. IEEE Trans. Med. Imaging 2009, 28, 1781–1790. [Google Scholar]
  38. Bu, S.; Kondo, K.; Yamakawa, M.; Shiina, T.; Fukutani, K.; Someda, Y.; Asao, Y. Adaptive and Quantitative Reconstruction Algorithm for Photoacoustic Tomography. Proc. SPIE Int. Soc. Opt. Eng. 2011, 7899, 78992G. [Google Scholar]
  39. Razansky, D.; Buehler, A.; Ntziachristos, V. Volumetric real-time multispectral optoacoustic tomography of biomarkers. Nat. Protoc. 2011, 6, 1121–1129. [Google Scholar] [CrossRef]
  40. Wang, Z.; Simoncelli, E.P.; Bovik, A.C. Multiscale structural similarity for image quality assessment. In Proceedings of the Thrity-Seventh Asilomar Conference on Signals, Systems & Computers, Pacific Grove, CA, USA, 9–12 November 2003; pp. 1398–1402. [Google Scholar]
  41. Mandal, S.; Viswanath, P.S.; Yeshaswini, N.; Dean-Ben, X.L.; Razansky, D. Multiscale edge detection and parametric shape modeling for boundary delineation in optoacoustic images. In Proceedings of the 2015 37th Annual International Conference of the IEEE Engineering in Medicine and Biology Society (EMBC), Milan, Italy, 25–29 August 2015; pp. 707–710. [Google Scholar]
  42. Kazakeviciute, A.; Ho CJ, H.; Olivo, M. Multispectral photoacoustic imaging artifact removal and denoising using time series model-based spectral noise estimation. IEEE Trans. Med. Imaging 2016, 35, 2151–2163. [Google Scholar] [CrossRef]
  43. Van Staveren, H.J.; Moes, C.J.; van Marie, J.; Prahl, S.A.; Van Gemert, M.J. Light scattering in lntralipid-10% in the wavelength range of 400–1100 nm. Appl. Opt. 1991, 30, 4507–4514. [Google Scholar] [CrossRef]
  44. Kirillin, M.; Perekatova, V.; Turchin, I.; Subochev, P. Fluence compensation in raster-scan optoacoustic angiography. Photoacoustics 2017, 8, 59–67. [Google Scholar] [CrossRef] [PubMed]
  45. Matthews, T.P. Image Reconstruction of the Speed of Sound and Initial Pressure Distributions in Ultrasound Computed Tomography and Photoacoustic Computed Tomography. Available online: https://openscholarship.wustl.edu/eng_etds/286 (accessed on 14 March 2019).
  46. Mandal, S.; Deán-Ben, X.L.; Razansky, D. Visual quality enhancement in optoacoustic tomography using active contour segmentation priors. IEEE Trans. Med. Imaging 2016, 35, 2209–2217. [Google Scholar] [CrossRef] [PubMed]
  47. Tarvainen, T.; Pulkkinen, A.; Cox, B.T.; Kaipio, J.P.; Arridge, S.R. Bayesian image reconstruction in quantitative photoacoustic tomography. IEEE Trans. Med. Imaging 2013, 32, 2287–2298. [Google Scholar] [CrossRef] [PubMed]
  48. Prakash, J.; Mandal, S.; Razansky, D.; Ntziachristos, V. Maximum entropy based non-negative optoacoustic tomographic image reconstruction. IEEE Trans. Biomed. Eng. 2019. [Google Scholar] [CrossRef] [PubMed]
Figure 1. Flow chart for quantitative reconstruction the distribution of optical absorption coefficients.
Applsci 09 01187 g001
Figure 2. (a) Complex numerical simulation 3D model, different objects are distinguished by different colors and shapes. (b) Measured absorption energy distribution, for the selected z-x section (y = 0 cm). The axes z and x (left and bottom) illustrate the spatial scale, the unit is cm, whereas the color scale (right) represents the absorbed energy density.
Applsci 09 01187 g002
Figure 3. (a) The z-x section diagram of the tissue model, different objects are distinguished by different colors and shapes; (b) Pure background tissue fluence distribution. The axes z and x (left and bottom) illustrate the spatial scale, the unit is cm, whereas the color scale (right) unit is mJ/cm2.
Applsci 09 01187 g003
Figure 4. Three iterations were selected to visualize the results of the recovered absorption coefficient distribution, which were the results of iterations 1, 5 and 10, respectively: (a) the No.1 iteration recovered result; (b) the No.5 iteration recovered result; (c) the normalized No.10 iteration recovered result. The axes z and x (left and bottom) illustrate the spatial scale, the unit is cm, whereas the color scale (right) represents the absorption coefficient value, the unit is cm−1, the white dotted line represents the three A-lines selected.
Applsci 09 01187 g004
Figure 5. Three A-line profiles were selected to visualize the performance of the proposed quantitative recovery absorption coefficient method, which were the results of three iterations of 1, 5 and 10, respectively corresponding to the absorption distribution in Figure 4. Each row represents the same A-line, each column represents the result of the same iteration. The dotted red line represents the ground truth of absorption coefficient, the solid blue line represents the recovery of the absorption coefficient: (a,d,g) are No.1 iteration results; (b,e,h) are No.5 iteration results; (c,f,i) are No.10 iteration results with normalized. The x-coordinate axis (bottom) illustrate the spatial scale, the unit is cm, the ordinate (left) represents the value of the absorption coefficient, the unit is cm−1.
Applsci 09 01187 g005
Figure 6. (a) Absorption energy distribution before iteration recovery; (b) Absorption coefficient distribution after iterative recovery; (c) The iteration error.
Applsci 09 01187 g006
Figure 7. (a) the configuration of phantom; (b) a B-scan of phantom PA signal, the color scale (right) represents the absorbed energy density; (c). A caption on a single line should be centered, the color scale (right) unit is J/cm2. The scale bar (short solid white line) is 1 mm.
Applsci 09 01187 g007
Figure 8. (ac) show the absorption distribution recovery of the 3rd, 6th and 13th iteration respectively, all the scale bars (short solid white line) are 1 m; The white dotted line in (a) represents the selected A-line (d) (e,f) show the A-line profiles of iteration results respectively corresponding to the absorption distribution (ac). The black dotted line represents the raw B-scan PA signal, the dotted blue line represents the recovery of the absorption coefficient. The x-coordinate axis (bottom) in (df) illustrate the spatial scale, the unit is cm, the ordinate (left) represents the value of the absorption coefficient, the unit is cm−1.
Applsci 09 01187 g008
Table 1. Simulation parameters.
Target Name Target StructureTarget Size (x × y × z) (cm3)μa (cm−1)μs (cm−1)g
target1cube(0.18 × 0.18 × 0.18)2.00100.000.90
target2spheredia. 0.306.00100.000.90
target3- layer1Cube -layer1(0.27 × 0.54 × 0.135)1.00100.000.90
target3- layer2Cube -layer2(0.27 × 0.54 × 0.135)3.00100.000.90
target3- layer3Cube -layer3(0.27 × 0.54 × 0.135)5.00100.000.90
target3- layer4Cube -layer4(0.27 × 0.54 × 0.135)7.00100.000.90
target4cube + sphere(0.18 × 0.18 × 0.18), dia. 0.122.00, 4.00150.000.90
target5small spheredia. 0.126.00100.000.90
backgroundcube(1.80 × 1.80 × 1.80)0.45356.000.90
Table 2. Results for quantitative recovery of absorption coefficient.
TargetRaw DataRecoveredGround TruthSSIM1SSIM2Accuracy
target11.301.952.000.9320360.99986897.50%
target20.965.976.000.6277730.99999599.50%
target3- layer10.390.921.000.9078820.99889292.00%
target3- layer20.203.023.000.5394830.99991799.33%
target3- layer30.155.035.000.3184270.99992199.40%
target3- layer40.107.017.000.2207750.99992598.57%
target40.131.95, 3.972.00, 4.000.6700440.99993397.50%, 99.25%
target50.165.976.000.4418110.99999299.50%
Table 3. Algorithm performance evaluation.
IndexSSIMRMSE PSNR
Before recovery
(Ground truth & Raw data)
0.9134981.4510531.4724 dB
After recovery
(Ground truth & Recovered)
0.9999270.0253681112.403 dB

