Article

A Nonlinear Method for Characterizing Discrete Defects in Thick Multilayer Composites

1
The State Key Lab of Fluid Power and Mechatronic Systems, Zhejiang University, Hangzhou 310027, China
2
CRRC Zhuzhou Institute Co., Ltd., Zhuzhou 412001, China
*
Author to whom correspondence should be addressed.
Appl. Sci. 2019, 9(6), 1183; https://doi.org/10.3390/app9061183
Submission received: 1 February 2019 / Revised: 14 March 2019 / Accepted: 15 March 2019 / Published: 20 March 2019
(This article belongs to the Special Issue Nondestructive Testing in Composite Materials)

Abstract

:
Discrete defects in thick composites are difficult to detect for the small size and the structure noise that appears in multilayer composites. In this paper, a nonlinear method, called recurrence analysis, has been used for characterizing discrete defects in thick section Carbon Fiber Reinforced Polymer (CFRP) with complex lay-up. A 10 mm thick CFRP specimen with nearly zero porosity was selected, and blind holes with different diameters were artificially constructed in the specimen. The second half of the backscattered signal was analyzed by recurrence analysis for areas with or without a defect. The recurrence plot (RP) visualized the chaotic behavior of the ultrasonic pulse, and the statistical results of recurrence quantification analysis (RQA) characterized the instability of the signal and the effect of defects. The results show that the RQA variable differences are related to the size of blind holes, which give a probable detection of discrete geometric changes in thick multilayer composites.

1. Introduction

Carbon Fiber Reinforced Polymer (CFRP) is one of the most widely used multilayer composites in aerospace due to its specific features, such as high ratio of strength to weight, high modulus, and high fatigue resistance. Discrete defects, like larger voids, delaminations, and cracks can occur during manufacturing or service process, and they may result in a significant loss of mechanical properties [1]. Thus, early defect detection is essential to avoid serious problems that are caused by defects. Nondestructive testing (NDT) has been employed to characterize discrete defects in composite structures for many years [2,3]. As an important NDT method, ultrasonic testing has been widely used in the evaluation of defects in CFRP. Li et al. [4] used the ultrasonic arrays technique to improve the characterization of side drilled holes in a 19 mm thick CFRP block, in which the holes were 1.5 mm in diameter and 16 mm in length and down to a depth of 16 mm. Ibrahim et al. [5] performed single-sided technique of contact pulse-echo inspection on CFRP specimen with thickness of 10 mm, to study the effect of crack in the middle of the specimen, while the length of the crack is approximately 25 mm. Smith et al. [6] have successfully applied a two-dimensional fast Fourier transform (2D-FFT) method to B-scan images for detecting out of plane fiber waviness in structures that are as thick as 18 mm. Most researches of inspecting thick CFRP were focused on defects with large sizes, however defects, such as larger voids or micro-cracks, may be smaller than 1 mm. It is not yet able to specify limitations for discrete defects in thick section CFRP. More reliable and quantitative studies are required [3].
Unlike the signals of metallic materials, there are no clearly identifiable defect echoes in the signal of multilayer composites, since the fiber layer with a different direction may also cause a reflected ultrasonic echo [7]. Although ultrasonic inspection can be performed in a variety of physical configurations, for example, the ultrasonic array, pulse-echo inspection is most straightforward and practical among all of the ultrasonic techniques. The detection of discrete defects is mainly based on signal processing of the backscattered signal, which is between the front surface echo and the back wall echo in a typical ultrasonic signal, as shown in Figure 1. Due to the layered structure with a layer thickness that is close to the wavelength of the ultrasonic pulse, the backscattered signal will exhibit resonance noise that is continuously attenuated. Dominguez [8] believes that the frequency continuity and amplitude degradation of backscattered signals will be destroyed for local defects, which can be detected by time-frequency analysis and time-energy analysis. This method is effective for thin CFRP. However, as the thickness of the material increases, defects may occur in the portion where the resonance noise has been attenuated, and the defect echoes are mixed with echoes that are caused by the material structure. The amplitude and energy of the backscattered signal are low, while the signal-to-noise ratio (SNR) of the defect is also low. Thus, the defect echo in the second half of the backscattered signal of the thick section CFRP cannot be well distinguished by traditional time-frequency analysis or time-energy analysis.
In order to solve the problem of characterizing defects in composites, model driven methods, such as ultrasonic pulse-echo modeling and structural modelling of composites, have been researched. A generalized parametric ultrasonic echo model and algorithms for accurately estimating the parameters have been presented in literature [9]. In Part II of the study, the advantage of the model-based estimation method in ultrasonic applications has been explored [10]. Using model-based methods, the ultrasonic signal waveform consisting of multiple overlapping echoes from within thin multilayer structures has been successfully reconstructed [11]. However, thick multilayer composites have large number of layers and diverse layering methods, and they are difficult to be described by a generic model. A data processing method that is capable of dealing with nonlinearity in ultrasound signals would be more useful and suitable for thick multilayer composites for now.
Recurrence analysis has been applied in a wide range of fields, including weather analysis, biological medicine, economic analysis, signal processing, and so on [12,13]. Recently, recurrence analysis has proven to be useful in the ultrasonic testing of porous materials. Using recurrence quantification analysis (RQA), Carrión A. et al. [14] propose the ultrasonic signal modality as a new approach for damage evaluation in concrete, and the results show that one of the RQA variables is more sensitive to damage in spoiled series than other NDT techniques. They also adopt recurrence analysis for the characterization of scattering material with different porosity and propose the measurement of predictability as an indicator of percentages of porosity [15]. Besides, Brandt has used RQA in ultrasonic testing of CFRP [16,17] for the assessment of porosity. The works focus on structures, where the evaluation of the back wall echo from the opposite side of the ultrasonic probe is not able to made, and try to find the relationship between RQA variables and porosity to get an equivalent back wall echo.
For porosity that is distributed throughout the volume, recurrence analysis of the entire time series yields good results, while discrete defects are locally distributed in the composite. The nonlinearity of ultrasonic pulses has been proven to be sensitive to distributed voids, while the recurrence analysis method may also be useful in characterizing the nonlinearity of discrete defects and needs to be experimentally studied. Therefore, in this paper, a 10 mm thick CFRP specimen with 80 layers and zero porosity was tested while using the ultrasonic pulse echo method. Blind holes with different diameters that are smaller than or equal to 1 mm at depth of 6 mm were artificially conducted in the specimen and the signals were analyzed by the recurrence analysis method. The statistics of RQA variables were used to characterize the stability of backscattered signals for inspection of discrete defects with small sizes.

2. Methodology

If the data is aperiodic and does not recognize simple rules of their time dependence, then an approximate repetition of certain events, called a recurrence, can help us build more complex rules [18]. The recurrence analysis of the dynamics of a system is conducted in a phase space that was constructed with delayed vectors. A sequence of scalar measurements x ( t n ) ,   n = 1 , 2 , , N can be extended to a vector by the Takens delay method [19]:
x n = ( x n ( m 1 ) τ , x n ( m 2 ) τ , , x n τ , x n )
where τ is the time lag and m is the embedding dimension. The values of m and τ determine the fact of whether the required information can be obtained from the original time series, while improper parameters will seriously distort the analysis seriously. The common selection method of embedded dimension m is based on false nearest neighborhood, and the selection method of delay time τ is the average mutual information method, according to reference [20].
A method for visualizing recurrences is called a recurrence plot (RP) and Eckmann et al. have introduced it [21]. Compute the matrix
R i , j = Θ ( ε x i x j ) , i , j = 1 , 2 , , n ( m 1 ) τ
where Θ is the Heaviside step function (i.e., Θ ( x ) = 0 if x < 0 , and Θ ( x ) = 1 otherwise), is the Euclidean distance between the two vectors, ε is a tolerance parameter to be chosen, and x i is the delayed vectors of some embedding dimension. Darken all of the nonzero values in the recurrence matrix R i , j and the RP is attained, as shown in Figure 2, in which many special structures exist. According to the macroscopic structures of the RP, the characteristics of plots refer to the different dynamics of system. Figure 2a is a homogeneous RP, which is shown as a uniform distribution of single recurrence dots, and it represents a typical stationary system, such as a random time series. Figure 2b is a period RP, which is shown as a long diagonal structure, and it represents a periodic oscillation system. Figure 2c is the RP of a chaotic system, shorter diagonal lines, small blocks, and single dots can be found as the suggest of chaos [22].
There are also microscopic features, such as single dots, diagonal lines, and vertical and horizontal lines in the RP. The appearance of single dots indicates that the corresponding state does not last or greatly fluctuates. Diagonal lines consist of a series of adjacent recurrence dots, and most of them are parallel to the main diagonal line. A diagonal line represent that the system track is similar in the same direction within a certain time period, and its length represents the degree of determination or predictability. Vertical or horizontal lines represent time segments that remain unchanged or change very slowly, and they are typical behaviors of the state of the laminate, which can reveal the discontinuity of the signal.
Usually, the macrostructure of RP can help us to directly observe the differences in the general structure of the system, while the results are significantly affected by the individual subjective judgment. Therefore, it is necessary to conduct a quantitative analysis that is based on microstructure. The statistical method RQA is more persuasive. In general, RP analysis provides a visual inspection of the matrix in Equation (2), and RQA analysis provides statistical variables that are based on diagonal, vertical, or horizontal lines formed by recurrence dots in the matrix.
Based on the diagonal lines in the RP, Zbilut and Webber put forward some quantities to measure the complexity of the system [23]:
1. Recurrence rate (RR)
R R ( ε ) = 1 N 2 N i j = 1 N R i , j ( ε )
counts the black dots in the RP excluding the main diagonal line. RR is a measure of the relative density of recurrence points in the recurrence matrix.
2. RQA variables that are based on diagonal lines
D E T = l = l min N l H D ( l ) i , j = 1 N R i , j
Percent determinism (DET), the ratio of recurrence points that form diagonal lines to all recurrence points, while the length of diagonal lines should be larger than l min . Usually, l min = 2 . H D ( l ) is the histogram of the lengths of the diagonal structures in the RP.
There are not only diagonal lines in RP, but also vertical and horizontal line segments. From these structures, Marwan et al. [20] proposed extended recurrence quantization variables:
3. RQA variables that are based on vertical and horizontal lines
L A M = l = v min N l H V ( l ) i , j = 1 N R i , j
The definition of the laminarity (LAM) is similar to the definition of DET and it represents the percentage of recurrence points in vertical structures. Analogously, H V ( l ) is the histogram of lengths of vertical lines with v min as the minimal length of vertical lines in RP. Usually v min = 2 .
Figure 3 shows the overall framework of recurrence analysis.

3. Experiment

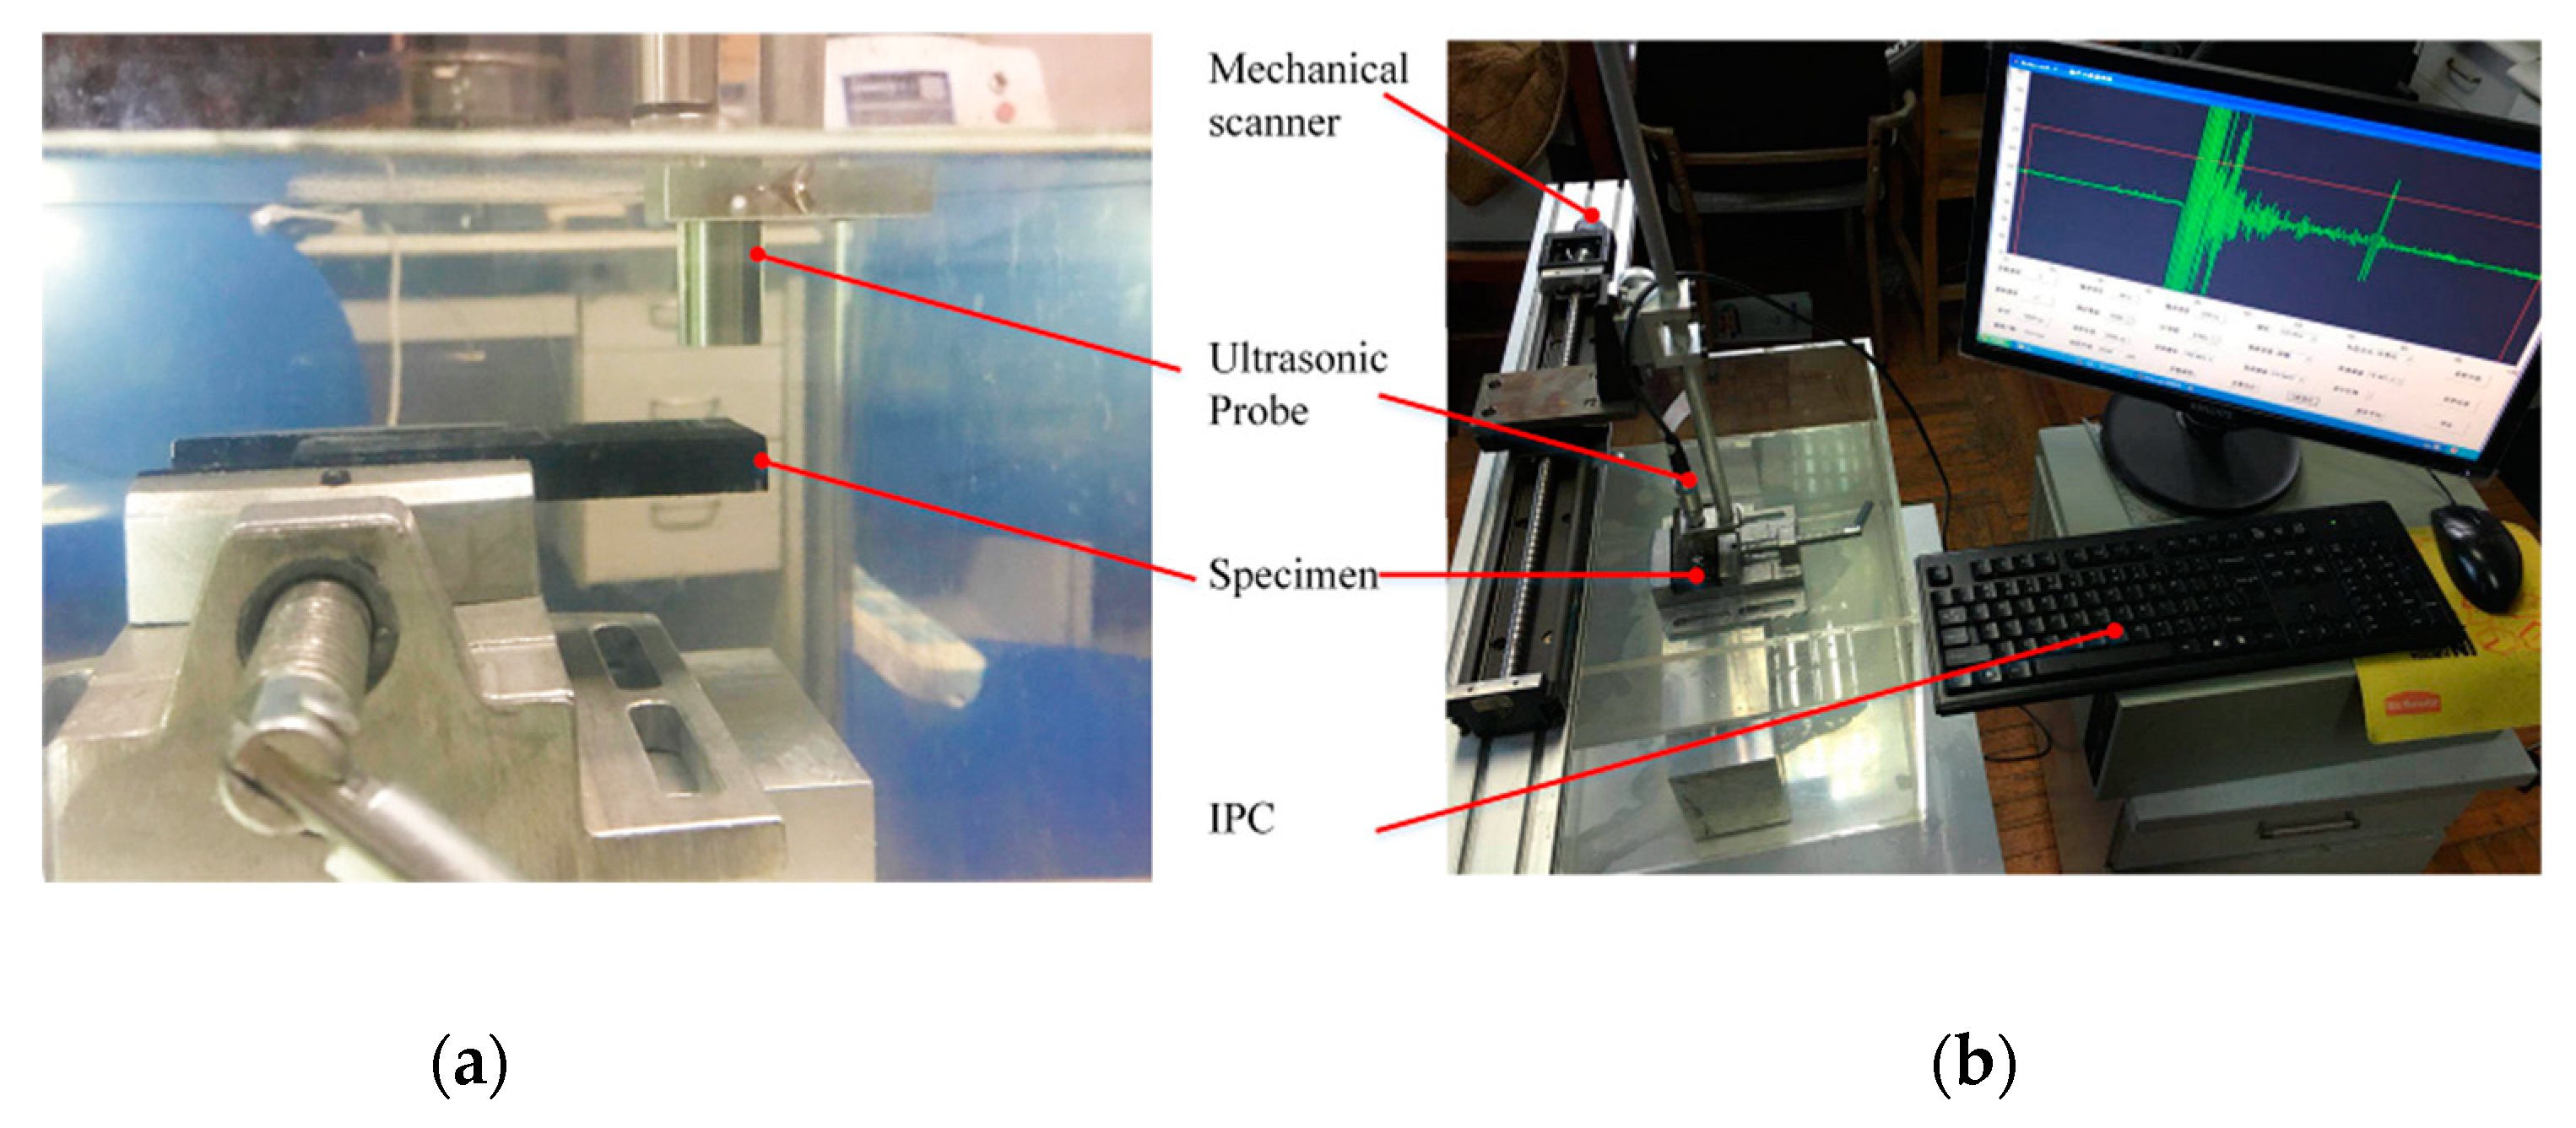
3.1. Material and Test Set-Up

The ultrasonic measurement device is mainly composed of an industrial personal computer, an ultrasonic acquisition card, an ultrasonic probe, and a set of position adjustment mechanism. Figure 4 shows the system. The ultrasonic probe is the OLYMPUS immersion plane probe (I3-0708-R, Resolution Series) with a center frequency of 7.5 MHz. The ultrasonic acquisition card model is PCIUT3100 and the card can achieve the function of ultrasonic pulse transmission/reception at a sampling rate of 100 MHz. The IPC is ADVANTECH IPC-6608. Once the specimen is flattened to the fixture, the adjustment mechanism is used to adjust the vertical position of the probe to make the ultrasonic waveform clear. Subsequently, the vertical position of the probe should remain the same, while the horizontal position of the probe adjusted while using the adjustment mechanism to detect different areas of the specimen.
The experimental material is a thick section CFRP specimen that is provided by an aircraft manufacturing company. The reinforcement is carbon fiber and the matrix is epoxy. The number of plies of the specimen is 80 and the average thickness of each ply is 0.125 mm. The material is assembled in different periodic stacking sequences of fiber directions (45°/0°) to form multilayer structures, as shown in Figure 5. According to the NDT report that was provided by the manufacturer, the porosity of the thick section of the CFRP specimen is nearly zero, which is tested by using an industrial ultrasonic immersion scanner. The purpose of choosing such a zero porosity specimen is to eliminate the effect of the original manufacturing defects in CFRP, so that the test results of the simulated defects can be more reliable.

3.2. Test Method

The flat bottom holes of different diameters have been drilled to simulate discrete defects in CFRP, as shown in Figure 5. The depth is 4mm from the opposite surface of the ultrasonic probe for all artificial defects. Defect-free areas and areas with defects of different sizes have been detected multiple times by the ultrasonic pulse echo method, as shown in Table 1.

4. Results and Discussion

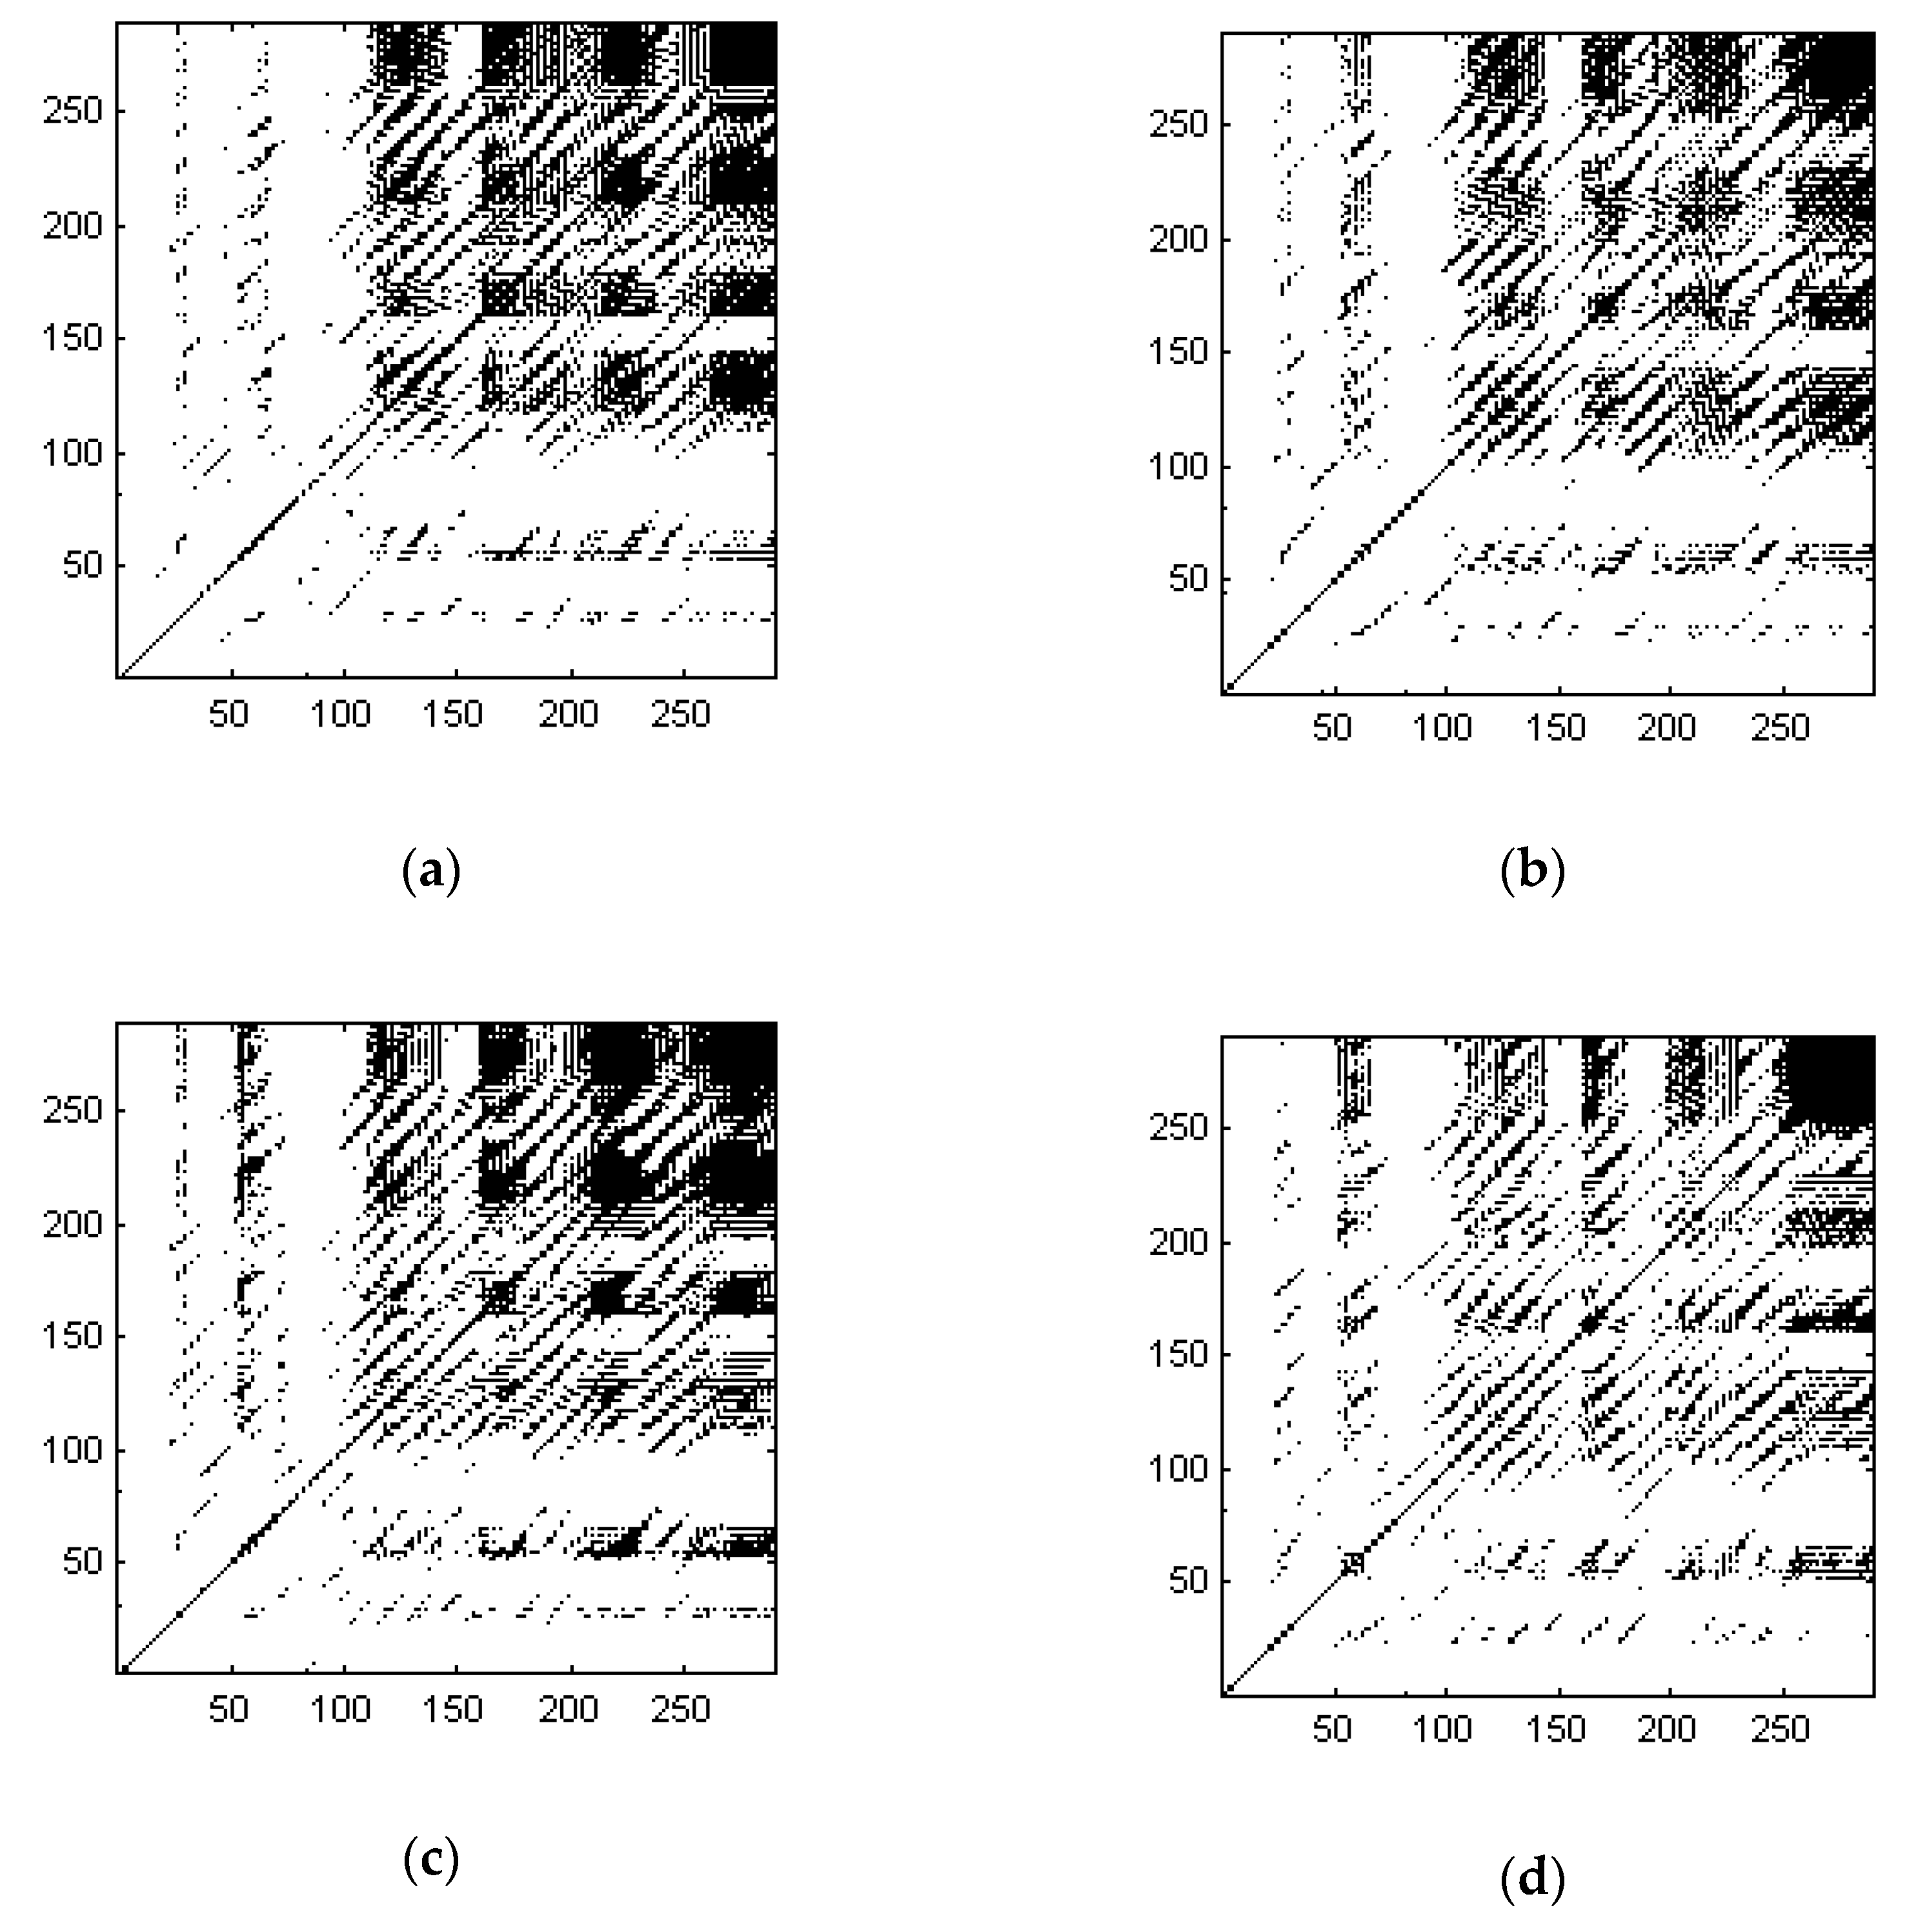
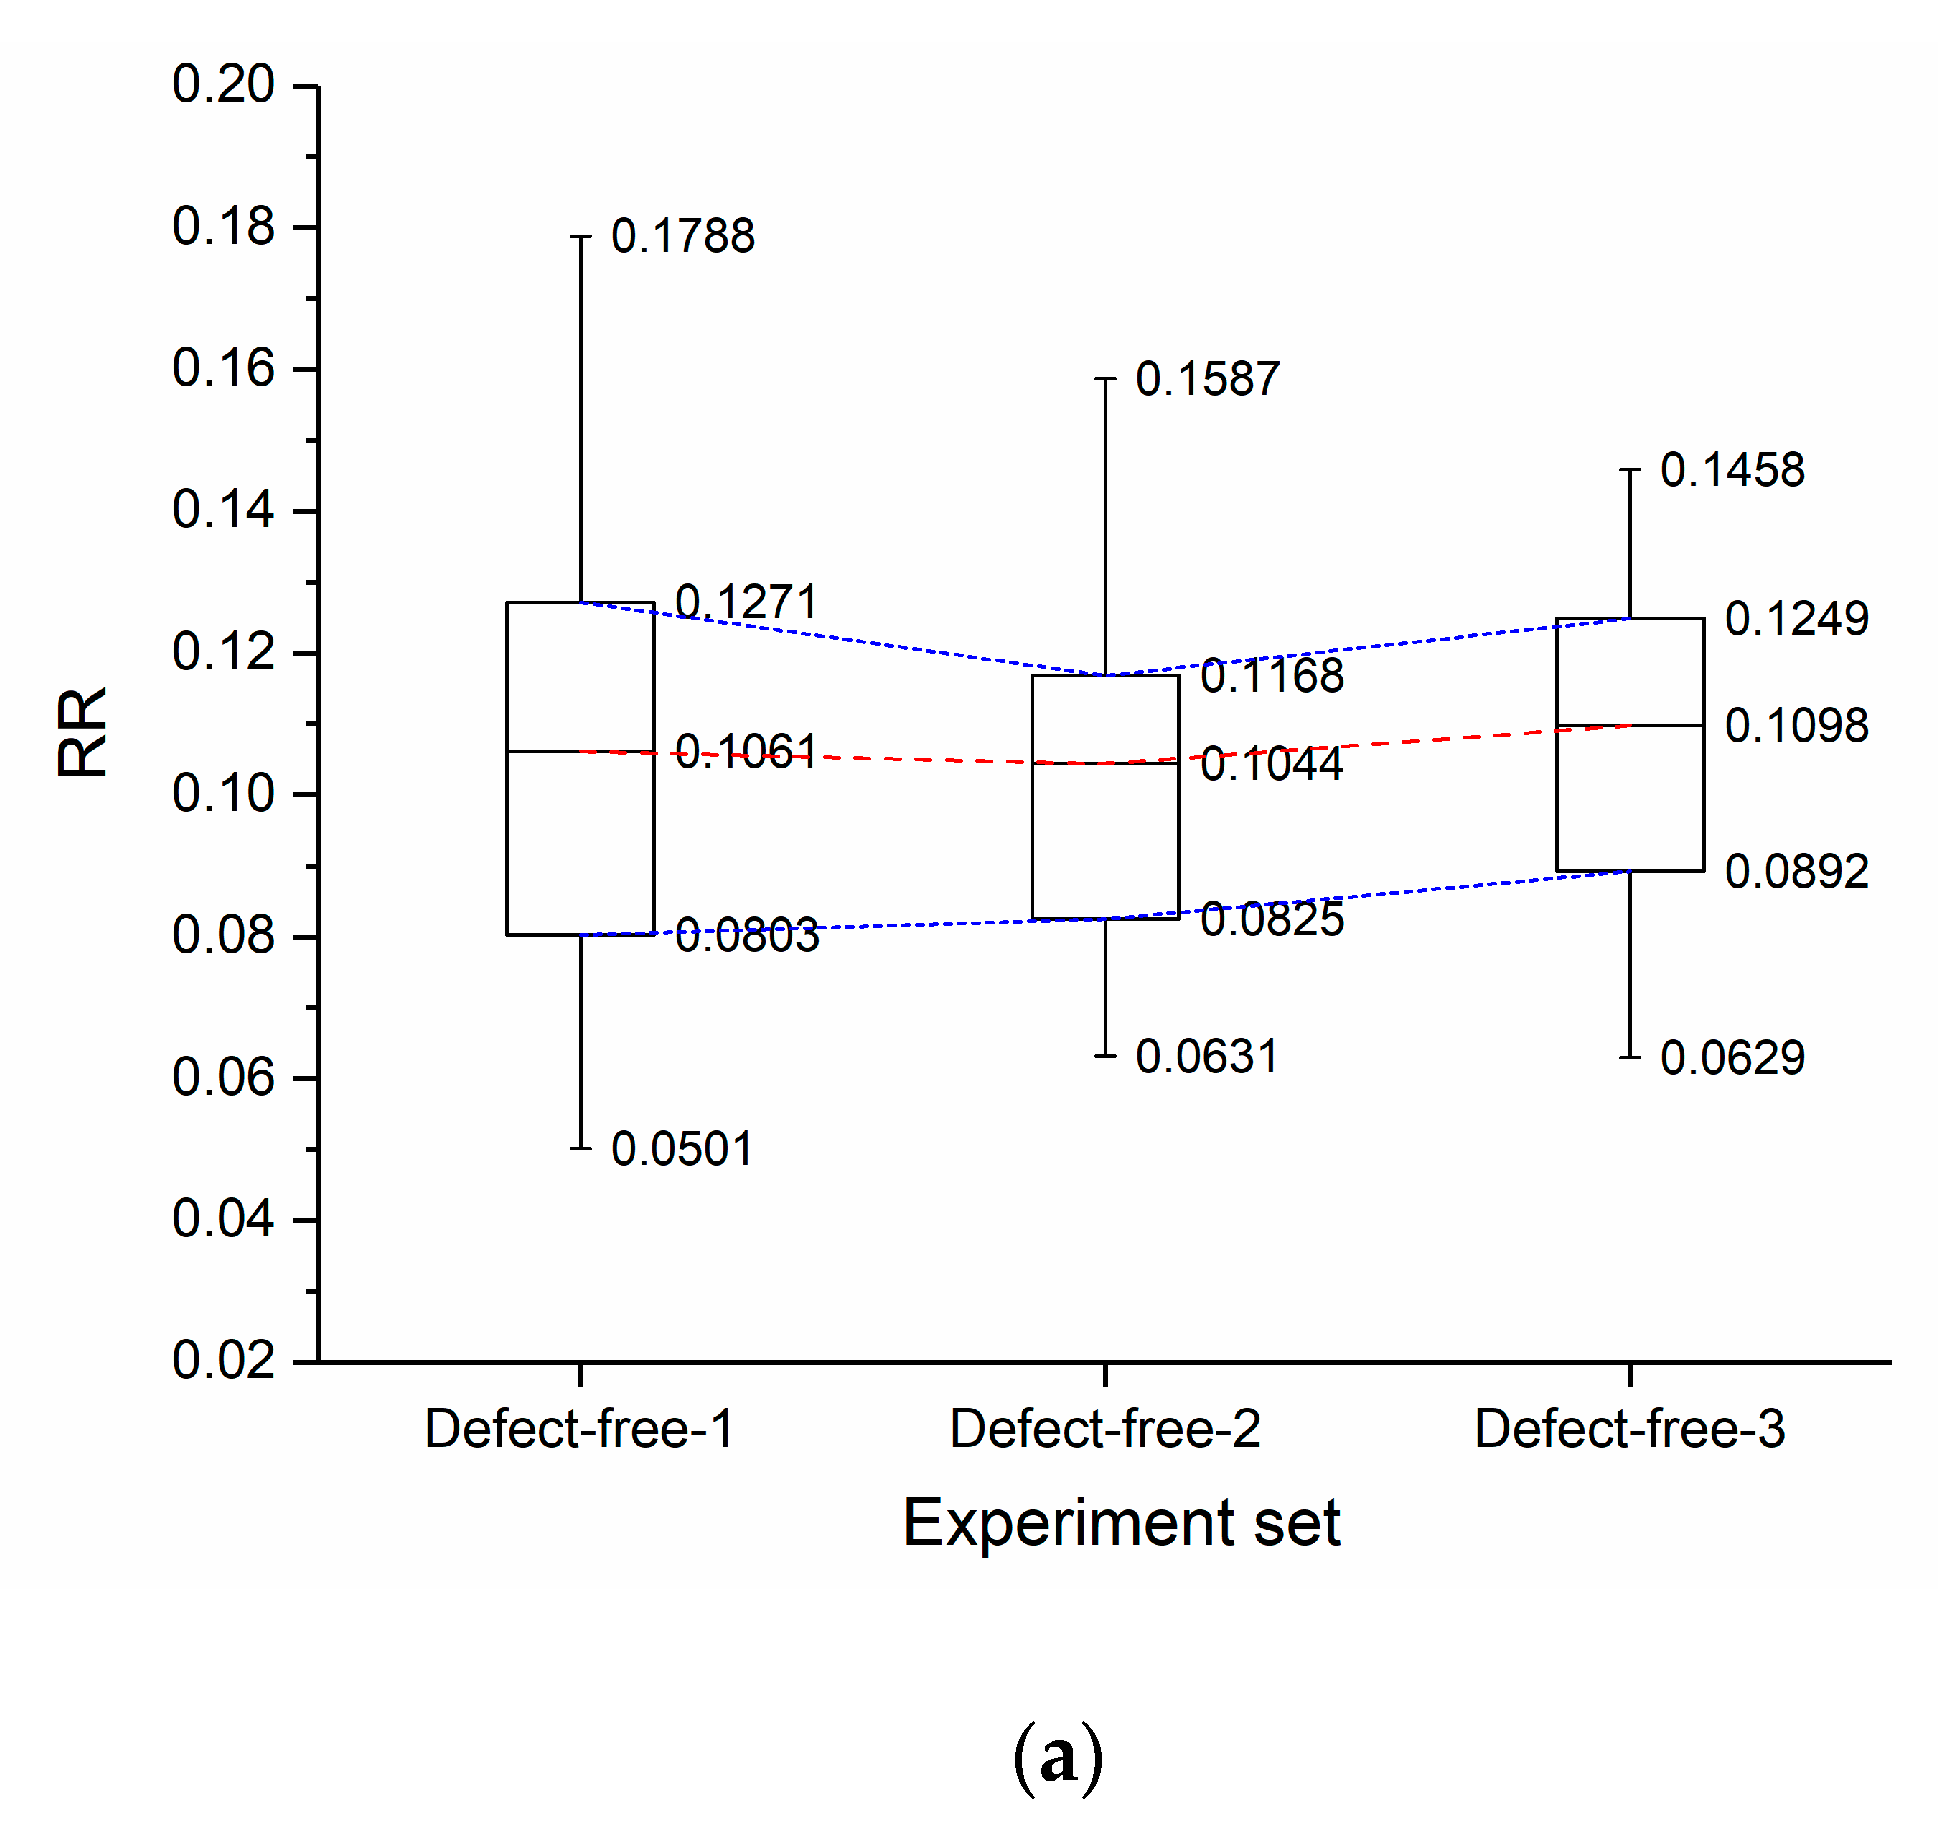
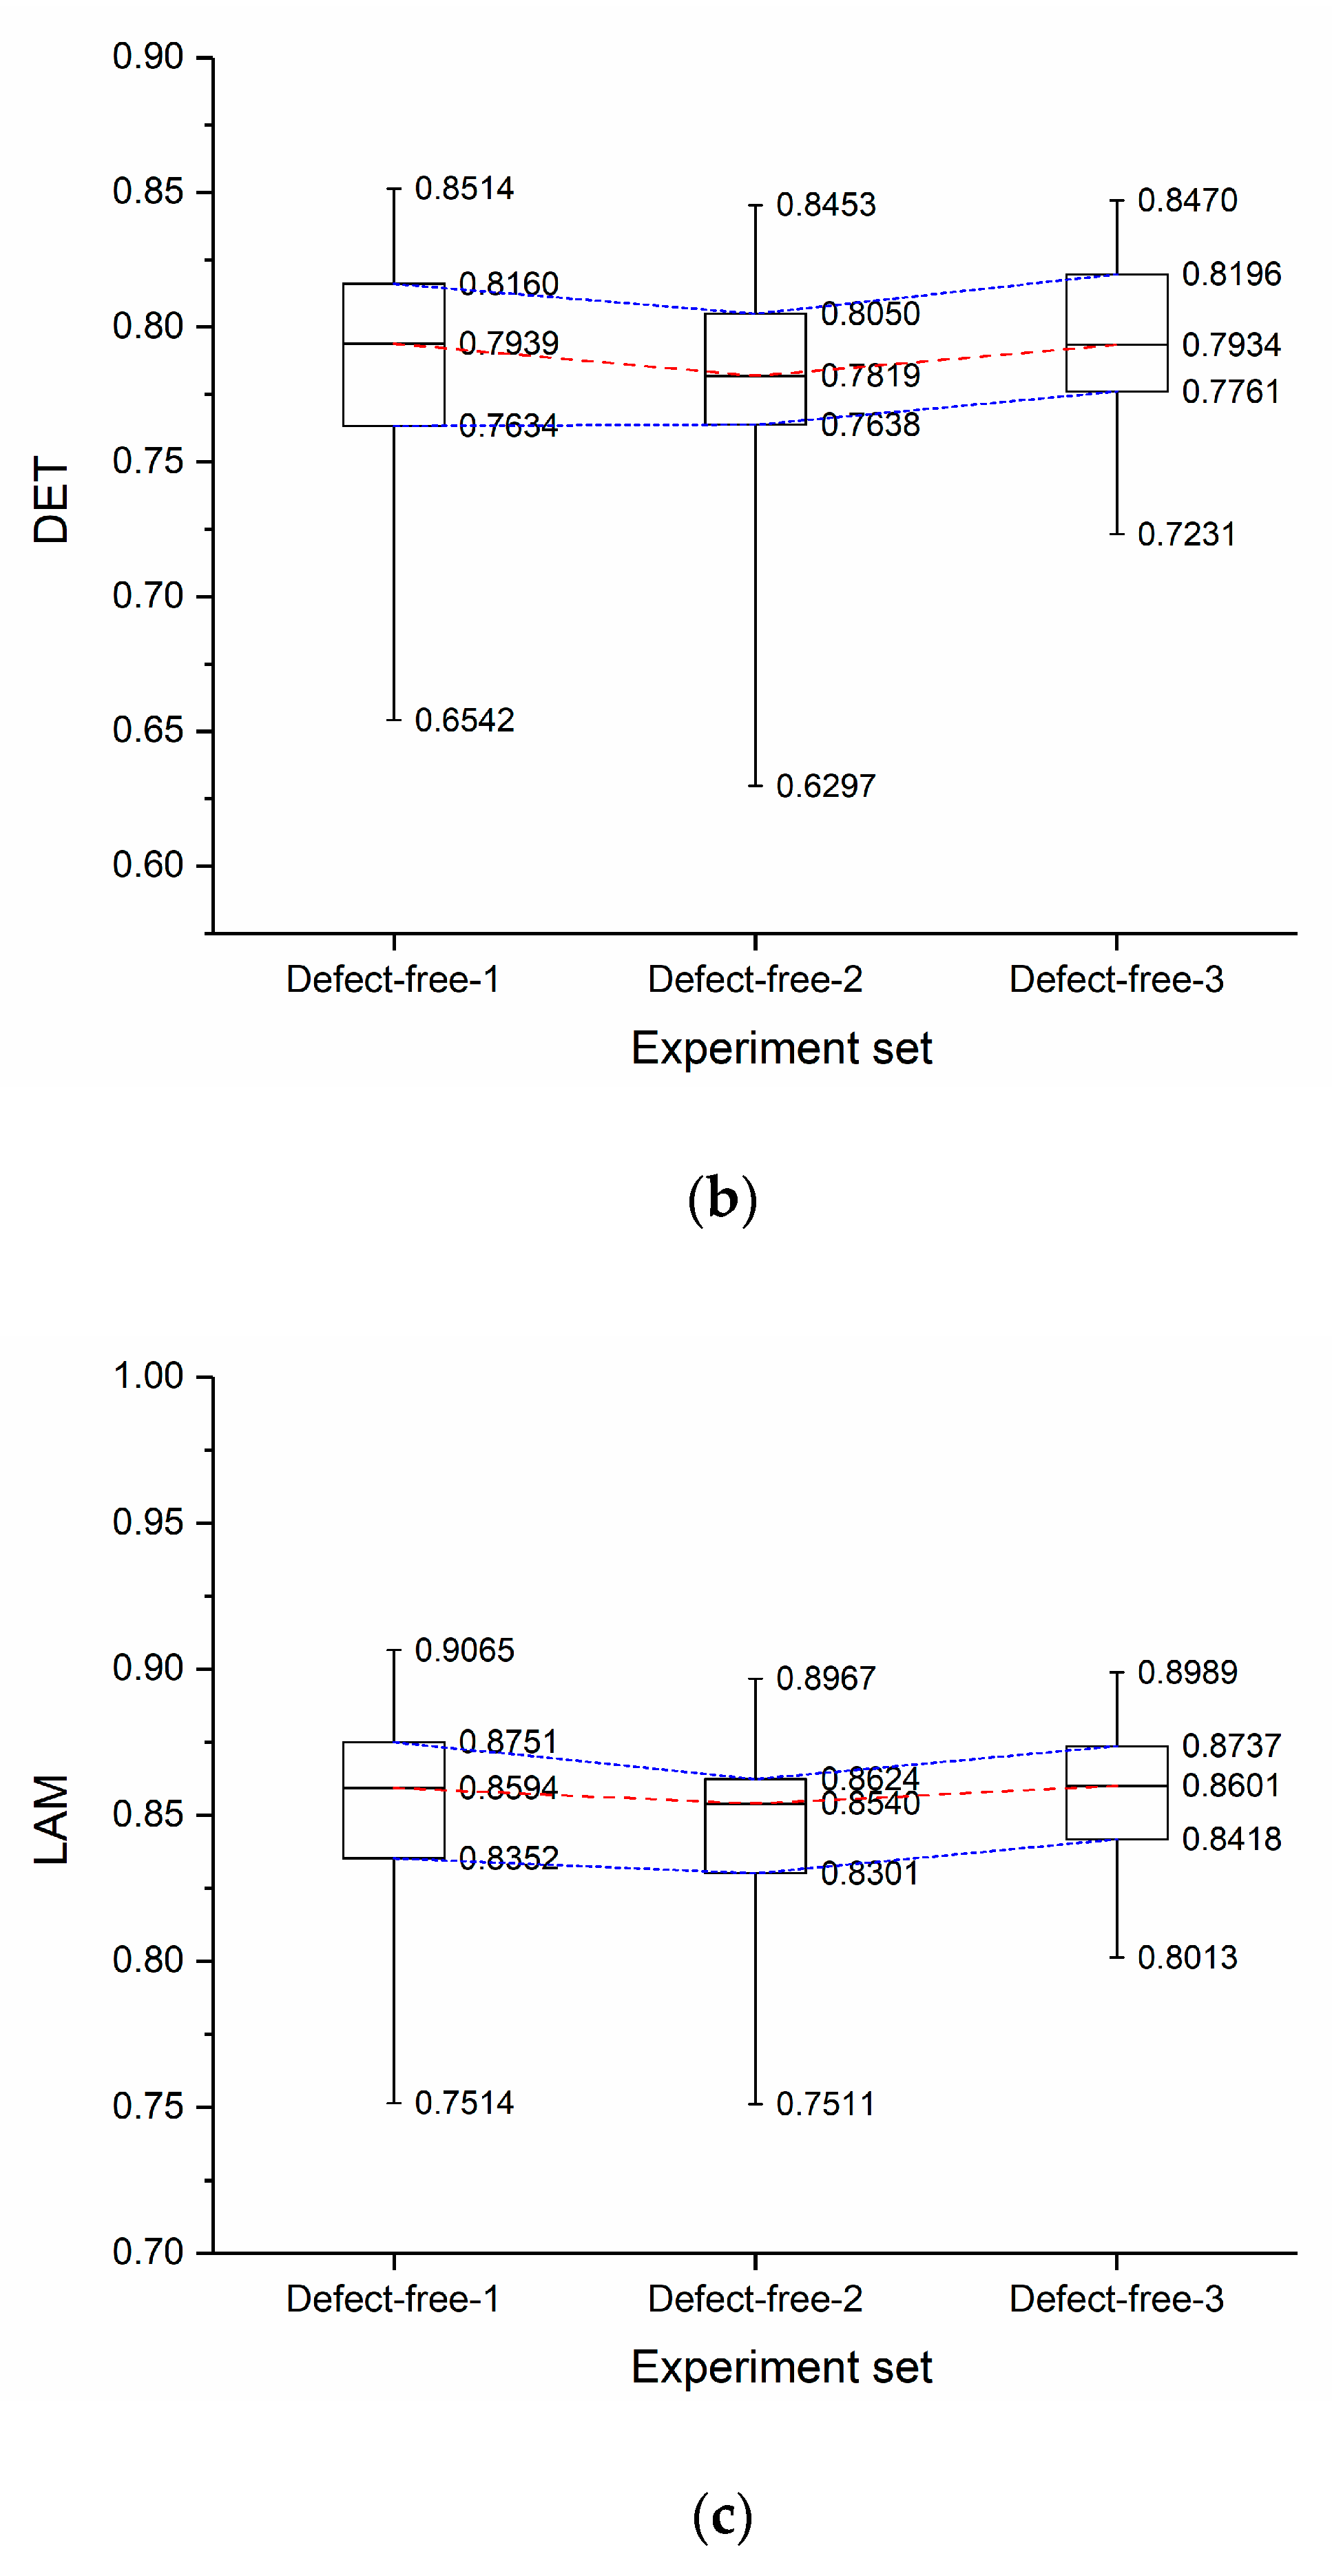
4.1. Recurrence Analysis of Defect-Free Areas

The purpose of this paper is to evaluate the discrete defects in thick multilayer CFRP by recurrence analysis of the second half of backscattered signals. The signal modality is affected by not only defects, but also material structures. Therefore, an area without artificial defects in the specimen has been analyzed first. Four signals have been randomly selected, and the second half of backscattered signals was magnified, as shown in Figure 6. The first half of each signal has the same resonance noise structure and large amplitude, while the second half has smaller amplitude and seem to be different from each other.
For further recurrence analysis of the signal, the mutual information method has been used for determination of the delay time (Lag). The relationship between the mutual information value and Lag has been obtained, as shown in the Figure 7a. The first local minimum of the mutual information value was the optimal time delay value. As a result, the optimal delay time τ = 3 .
Next, the false nearest neighbor algorithm has been used to obtain the embedding dimension. Figure 7b shows the relationship between the ratio of false nearest neighbors and the value of the embedded dimension. The embedding dimension is considered to be the best when the ratio of false nearest neighbors is close to zero. Thus, the optimal embedding dimension m = 5 .
It has been verified by calculation that the embedding dimension and the delay time of all signals are the same. Nonoptimal embedding parameters may cause many small blocks or even diagonal lines perpendicular to the main diagonal line [24], which should be carefully checked in the RP.
A lot of methods could be used to select the threshold, which need to be determined according to specific problems. The most commonly used threshold is that with a fixed value. In order to find the statistical behavior of the RQA parameters, while both the DET and LAM are variables that are based on the total amount of recurrence points according to Equations (4) and (5), the recurrence point rate RR needs to be determined first. Usually, RR takes 0.1; the threshold should be adjusted so that the statistical mean of RRs of all signals is 0.1. The results show that the requirement can be met when the threshold is 0.28 for defect-free signals.
The RPs of the second half of the four signals were calculated using the parameters above, as shown in Figure 8. It can be seen that the structures of the figures are similar and mainly composed of some special structures: short diagonal lines, small black blocks, and vertical and horizontal lines. According to the meaning of structures in RP, short diagonal lines and small blocks can be regarded as the suggestion of chaos. Short diagonal lines indicate that the periodic behavior of the ultrasonic pulse only lasts for a short time, and small black blocks represent different states of the ultrasonic pulse. Ultrasonic pulses travel the material thickness from the front surface echo to the back wall echo twice and may reflect multiple times in the material. Thus, it is reasonable to the existence of chaotic components in the ultrasonic signal, especially those with large number of plies and complex lay-up. Besides, vertical or horizontal lines represent time segments that remain unchanged or change very slowly, and they are typical behaviors of the state of the laminate. This is consistent with the multilayer structure of the composite, but the vertical lines do not exactly correspond to the lay-up of the material. One possible reason is related to the wavelength of the ultrasonic pulse. For the frequency 7.5 MHz, the wavelength of the ultrasonic pulse is approximately 0.4 mm, which is larger than the thickness of the fiber layer 0.1 mm. Thus, some detailed vertical structures may be missing. Although not able to get all of the details of the material structure, recurrence analysis can reveal the modality of the signal and it is sufficient for the detection of discrete defects.
The density of recurrence points indicates the structure of recurrence matrix and it may be a representation of instability of the signal. Analyze the first and the second half of all 100 Defect-free-1 signals separately. The RRs were calculated while using the same embedding dimension and delay used in RPs. The threshold was chosen so that the mean value of RRs of all 100 results equal 0.1, and the statistical results are shown in Figure 9. The median (50%) is a reflection of the concentration trend. Medians of both parts of the backscattered signal are approximately equal to 0.1, the mean of all RRs. The interquartile range (IQR, 75–25%) indicates the dispersion of variables in the statistics, and it can be a good representation of the robustness of the signal. The IQR of the first half is 0.0093, which is far less than the value of the second half 0.0468. A large IQR indicates that the instability of the second half of the backscattered signal might be due to multiple reflections of the ultrasonic pulse in the multilayered structure.
Apply the method onto signals that were acquired in experiment sets Defect-free-1, Defect-free-2, and Defect-free-3. The RQA variables of the second half of backscattered signals were calculated using the same embedding dimension and delay above, while the threshold was chosen so that the mean value of RRs of all results equal to 0.1. The statistics of RR, DET, and LAM were shown in Figure 10. The median and IQR of RQA variables of different defect-free areas remain basically unchanged, while the max and min values vary greatly. When considering that the selected defect-free parts of the specimen have the same structure, the median and IQR of RQA variables are proper for characterizing the behavior of ultrasonic pulses in composite.

4.2. Recurrence Analysis of Defect Areas

According to the RPs of defect-free areas in Figure 8, chaotic behavior has been found in the ultrasonic signal. Despite the low porosity of the specimen, scattering and data noise may exist and form the feeble differences of cases in Figure 8, together with chaos. The statistical results of the RQA variables in Figure 10 reveal that the difference in RPs of different defect-free areas are in a relatively constant range, and the range can be described with the median and IQR of RQA variables. In other words, each value in the range of RQA variables represents a state of the system and the defect-free ultrasonic pulse echo system can be described by a set of RQA statistics: RRmedian = 0.1, RRIQR ≈ 0.4; DETmedian = 0.79, DETIQR ≈ 0.45; LAMmedian = 0.85, and LAMIQR ≈ 0.4.
In order to discover the effect of defects on the states of the ultrasonic pulse echo system, the areas where the defects of 0.5 mm, 0.7 mm, and 1 mm were located were tested and the time series are shown in Figure 11. The signals of 0mm were from experiment set Defect-free-1, while those of 0.5 mm from Defective-1, 0.7 mm from Defective-2, and 1 mm from Defective-3. No recognizable defect echo could be found in the waveform either. The RPs of the second half of each signal were calculated and the results are shown in Figure 12. The plots have similar structures and they are mainly composed of diagonal lines and white bands. It can be inferred that the reflections of ultrasonic pulse caused by discrete defects in the thick CFRP do not appear to be local echo with a high amplitude in the time domain waveform. The effect of the defect is not the form of changing the structure of the signal.
Calculate the RQA variables of the second half of the defect areas with the same embedding dimension and delay in 4.1, and the threshold was chosen so that the mean value of RRs of all results equal to 0.1. The statistics of RR, DET, and LAM are shown in Figure 13. In Figure 13a, the RRmedian of different defect diameter are approximately equal, while the RRIQR decreases as the defect size increases and tend to be constant to 0.01, which is much smaller than the defect-free RRIQR of 0.04. In Figure 13b, DETIQR of different defect diameter are approximately equal while the DETmedian decreases as the defect size increases. The decrease is rather small and the DETmedian tend to be constant around 0.75 which is sufficiently different from the value of defect-free areas. The defect size here is 0.7 mm, which is about twice the wavelength of the ultrasonic pulse. The same trend can be seen in the statistics of LAM in Figure 13c.
When comparing with results of defect-free areas in Figure 10, the statistical values of the RQA variables of defective areas are different and related to the size of the defect. For defect-free areas, the second half of backscattered signals is rather instable and shows chaotic characteristics. As the defect size increases, no significant change in chaotic characteristics is found, while the instability of the signal due to scattering and data noise is weakening. That is, the effect of defects on the signal modality is like a stabilizer, which makes the chaotic structure of the signal clearer. The larger the defect size, the more obvious the stabilization effect until the defect size is about twice the wavelength of the ultrasonic pulse, and in this paper, defects of 0.7 mm and 1 mm can be distinguished in the results of RQA, while 0.5 mm cannot.
In summary, using statistics of RQA variables, it is able to characterize the instability of the signal and reveal the effect of discrete geometry variation in the form of blind holes. The chaotic structure of the signal is more stable due to the presence of simulated defects and it is related to the size of the defect.

5. Conclusions

In this paper, a nonlinear method has been proposed for charactering discrete defects in thick multilayer composites. The second half of the backscattered signal is rather irregular, while the RP is able to reveal the unstable chaotic behavior of ultrasonic pulse and the median and IQR of RQA variables can be used for the description of system states. The method shows the possibility to detect blind holes of small diameter from ultrasonic pulsed-echo inspections. The maximum identifiable defect size may be related to the center frequency of the probe, which needs to be proved by future experiments of different probes and sizes of defects. The results of the nonlinear method and RQA variables can be used as a reference to detect the finite holes of minimum diameter 1 mm at depth of 5–10 mm in thick composites
It is necessary to detect the defect-free areas in the specimen under the uniform test conditions each time the method is used and the previously obtained defect-free data cannot be used as a standard, since the existence of the defect is discriminated with RQA statistics in comparison to those of the defect-free region. Besides, there is a gap between the blind holds and the real discrete defects. The proposed method is not currently capable of detecting real internal defects that are typical of composites with a considerable level of confidence. An artificial specimen with defects made with embedded thin defects or small thin entrapped voids can be produced in further work for the detection of larger voids or small delamination using recurrence analysis.

Author Contributions

Conceptualization, G.T., X.Z. (Xiaojun Zhou) and C.Y.; Formal analysis, G.T.; Funding acquisition, C.Y.; Investigation, G.T. and C.Y.; Methodology, G.T. and X.Z. (Xiang Zeng); Resources, X.Z. (Xiaojun Zhou) and C.Y.; Supervision, X.Z. (Xiaojun Zhou); Writing—original draft, G.T.; Writing—review & editing, G.T., X.Z. (Xiaojun Zhou), C.Y. and X.Z (Xiang Zeng).

Funding

This research was funded by 1: The Fundamental Research Funds for the Central Universities, No.2018QNA4001; 2: Zhejiang Provincial Natural Science Foundation of China under Grant No.LY18E050002.

Acknowledgments

The programs used in this paper are based on the CRP Toolbox for matlab.

Conflicts of Interest

The authors declare no conflict of interest.

References

  1. Cawley, P.; Adams, R.D. Defect types and non-destructive testing techniques for composites and bonded joints. Mater. Sci. Technol. 1989, 5, 413–425. [Google Scholar] [CrossRef]
  2. Scott, I.G.; Scala, C.M. A review of non-destructive testing of composite materials. NDT Int. 1982, 15, 75–86. [Google Scholar] [CrossRef]
  3. Ibrahim, M.E. Nondestructive evaluation of thick-section composites and sandwich structures: A review. Compos. Part A 2014, 64, 36–48. [Google Scholar] [CrossRef]
  4. Li, C.; Pain, D.; Wilcox, P.D. Imaging composite material using ultrasonic arrays. NDT E Int. 2013, 53, 8–17. [Google Scholar] [CrossRef]
  5. Ibrahim, M.E.; Smith, R.A.; Wang, C.H. Ultrasonic detection and sizing of compressed cracks in glass-and carbon-fibre reinforced plastic composites. NDT E Int. 2017, 92, 111–121. [Google Scholar] [CrossRef]
  6. Smith, R.A.; Nelson, L.J.; Mienczakowski, M.J. Automated analysis and advanced defect characterisation from ultrasonic scans of composites. Insight Non-Destruct. Test. Cond. Monit. 2009, 51, 82–87. [Google Scholar] [CrossRef]
  7. Wang, L.; Rokhlin, S.I. Ultrasonic wave interaction with multidirectional composites: Modeling and experiment. J. Acoust. Soc. Am. 2003, 114, 2582. [Google Scholar] [CrossRef] [PubMed]
  8. Dominguez, N.; Mascarot, B. Ultrasonic Non-destructive inspection of localized porosity in composite materials. In Proceedings of the Ninth European Conference on Non-Destructive Testing (ECNDT), Berlin, Germany, 25–29 September 2006. [Google Scholar]
  9. Demirli, R.; Saniie, J. Model-based estimation of ultrasonic echoes. Part I: Analysis and algorithms. IEEE Trans. Ultrason. Ferroelectr. Freq. Control 2001, 48, 787–802. [Google Scholar] [CrossRef] [PubMed]
  10. Demirli, R.; Saniie, J. Model-based estimation of ultrasonic echoes. Part II: Nondestructive evaluation applications. IEEE Trans. Ultrason. Ferroelectr. Freq. Control 2001, 48, 803–811. [Google Scholar] [CrossRef] [PubMed]
  11. Hagglund, F.; Martinsson, J.; Carlson, J.E. Model-based estimation of thin multi-layered media using ultrasonic measurements. IEEE Trans. Ultrason. Ferroelectr. Freq. Control 2009, 56, 1689–1702. [Google Scholar] [CrossRef] [PubMed]
  12. Marwan, N.; Riley, M.; Giuliani, A. Translational Recurrences: From Mathematical Theory to Real-World Applications; Springer Publishing Company Incorporated: New York, NY, USA, 2014. [Google Scholar]
  13. Webber, C.; Marwan, N. Recurrence Quantification Analysis-Theory and Best Practices; Springer: Berlin, Germany, 2015. [Google Scholar] [CrossRef]
  14. Carrión, A.; Genovés, V.; Gosálbez, J.; Miralles, R.; Payá, J. Ultrasonic signal modality: A novel approach for concrete damage evaluation. Cem. Concr. Res. 2017, 101, 25–32. [Google Scholar] [CrossRef]
  15. Carrión, A.; Miralles, R.; Lara, G. Measuring predictability in ultrasonic signals: An application to scattering material characterization. Ultrasonics 2014, 54, 1904–1911. [Google Scholar] [CrossRef] [PubMed] [Green Version]
  16. Brandt, C.; Maaß, P. Recurrence Quantification Analysis for Non-Destructive Evaluation with an Application in Aeronautic Industry. In Proceedings of the 19th World Conference on Non-Destructive Testing, Munich, Germany, 13–17 June 2016. [Google Scholar]
  17. Brandt, C. Recurrence quantification analysis as an approach for ultrasonic testing of porous carbon fibre reinforced polymers. In Recurrence Plots and Their Quantifications: Expanding Horizons; Springer International Publishing: Cham, Switzerland, 2016. [Google Scholar] [CrossRef]
  18. Kantz, H.; Schreiber, T. Nonlinear Time Series Analysis; Cambridge University Press: Cambridge, UK, 2003. [Google Scholar] [CrossRef]
  19. Takens, F. Detecting strange attractors in turbulence. Lect. Notes Math. 1981, 898, 366–381. [Google Scholar] [CrossRef]
  20. Marwan, N.; Romano, M.C.; Thiel, M. Recurrence plots for the analysis of complex systems. Phys. Rep. 2007, 438, 237–329. [Google Scholar] [CrossRef]
  21. Eckmann, J.P.; Kamphorst, S.O.; Ruelle, D. Recurrence plots of dynamical systems. Europhys. Lett. 2007, 4, 973–977. [Google Scholar] [CrossRef]
  22. Hobbs, B.; Ord, A. Nonlinear dynamical analysis of GNSS data: Quantification, precursors and synchronisation. Prog. Earth Planet. Sci. 2018, 5, 36. [Google Scholar] [CrossRef]
  23. Zbilut, J.P.; Thomasson, N.; Webber, C.L. Recurrence quantification analysis as a tool for nonlinear exploration of nonstationary cardiac signals. Med. Eng. Phys. 2002, 24, 53–60. [Google Scholar] [CrossRef]
  24. Marwan, N. How to avoid potential pitfalls in recurrence plot based data analysis. Int. J. Bifurc. Chaos 2011, 21, 1003–1017. [Google Scholar] [CrossRef]
Figure 1. Schematic diagram of the pulse-echo method and an A-scan signal of Carbon Fiber Reinforced Polymer (CFRP) with interior defects and layers with different direction.
Applsci 09 01183 g001
Figure 2. Different types of signals and their RPs. (a) white noise; (b) a periodic signal (cosine wave); and, (c) a chaotic system (the Lorenz system).
Applsci 09 01183 g002
Figure 3. The framework of recurrence analysis.
Applsci 09 01183 g003
Figure 4. Ultrasonic testing system(a) zoom of the probe onto scanned specimen (b) the whole testing system.
Applsci 09 01183 g004
Figure 5. Lay-up of multidirectional [454/0/452/0/45]4s CFRP, total thickness 10 mm.
Applsci 09 01183 g005
Figure 6. Ultrasonic signals randomly selected in results of experiment set Defect-free-1. (a) signal 1 (b) signal 2 (c) signal 3 (d) signal 4.
Applsci 09 01183 g006
Figure 7. (a) The relationship between the mutual information value and the delay time (Lag). (b) The relationship between the ratio of false nearest neighbors and the value of embedded dimension.
Applsci 09 01183 g007
Figure 8. Recurrence plots (RPs) of the second half of backscattered signals of Defect-free-1. (a) signal 1 (b) signal 2 (c) signal 3 (d) signal 4.
Applsci 09 01183 g008
Figure 9. Box charts of recurrence rate (RR) of 100 Defect-free-1 signals: (a) the first half and (b) the second half.
Applsci 09 01183 g009
Figure 10. Statistical results of recurrence quantification analysis (RQA) variables of defect-free areas; (a) RR; (b) percent determinism (DET); and, (c) laminarity (LAM).
Applsci 09 01183 g010aApplsci 09 01183 g010b
Figure 11. Ultrasonic signals of defect areas with different diameter: (a) 0 mm; (b) 0.5 mm; (c) 0.7 mm; and, (d) 1 mm.
Applsci 09 01183 g011
Figure 12. RPs of the second half of backscattered signals of defect areas with different diameter: (a) 0 mm; (b) 0.5 mm; (c) 0.7 mm; and, (d) 1 mm.
Applsci 09 01183 g012aApplsci 09 01183 g012b
Figure 13. Statistical results of RQA variables of defect and defect-free areas: (a) RR; (b) DET; and, (c) LAM.
Applsci 09 01183 g013aApplsci 09 01183 g013b
Table 1. Arrangement of experiments.
Experiment SetDefect Diameter (mm)Test Times
Defect-free-10100
Defect-free-20100
Defect-free-30100
Defective-10.5100
Defective-20.7100
Defective-31100

