Electroadsorptive Removal of Gaseous Pollutants


Abstract
Featured Application
Abstract
1. Introduction
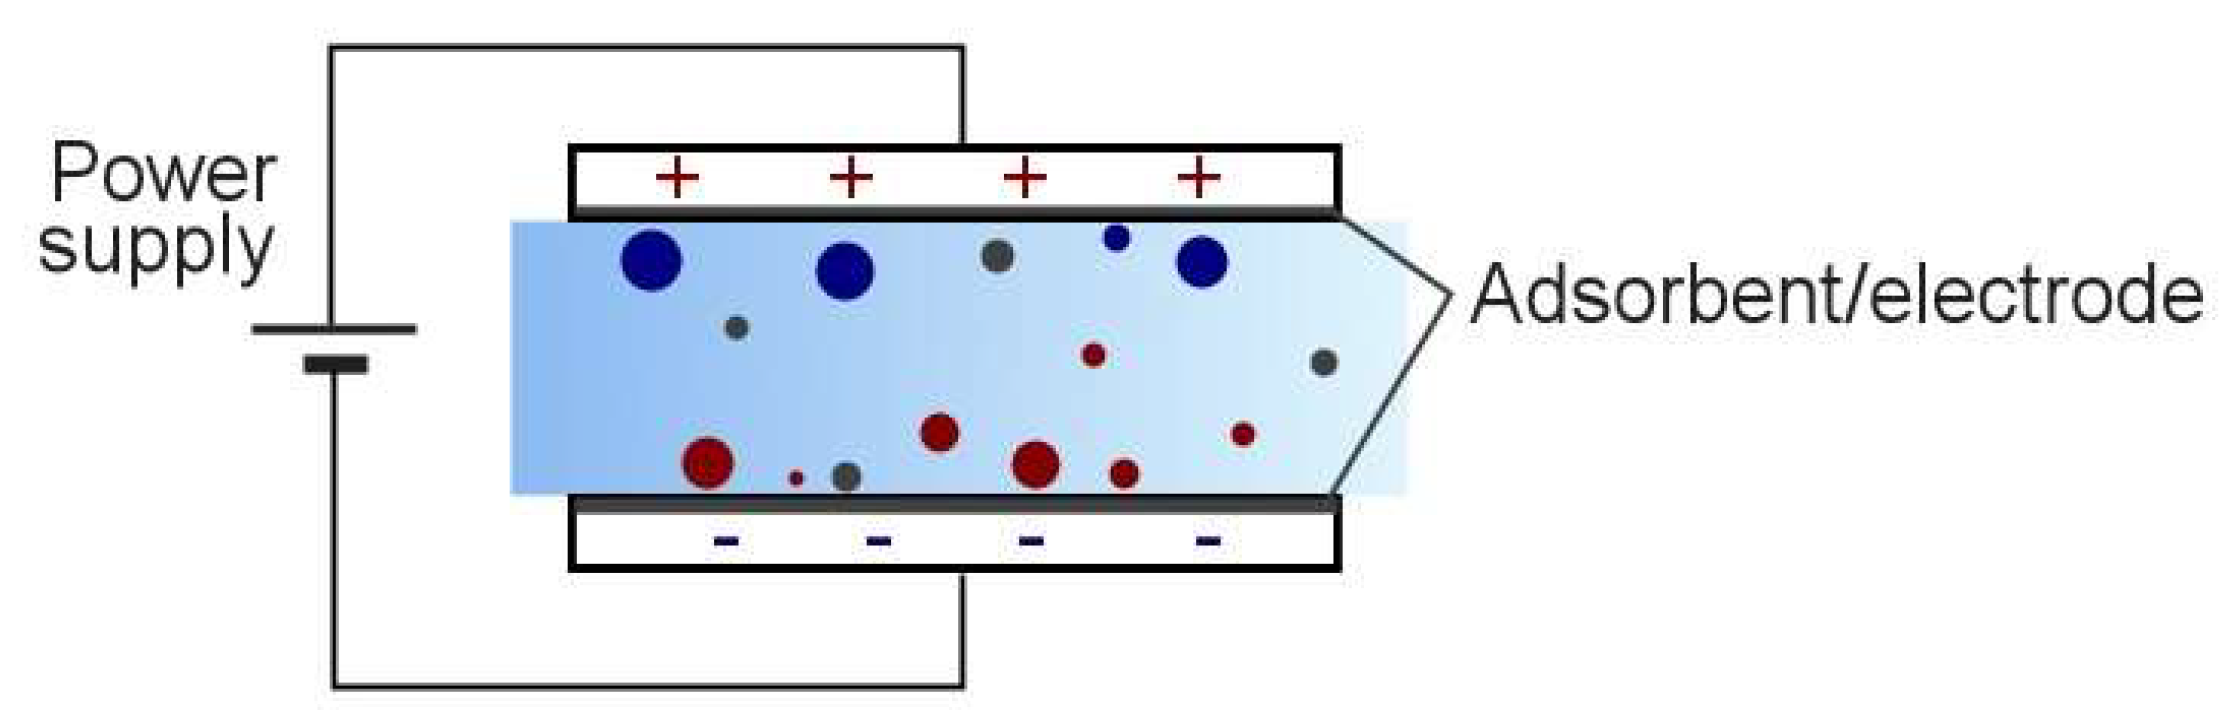
1.1. Electrosorption
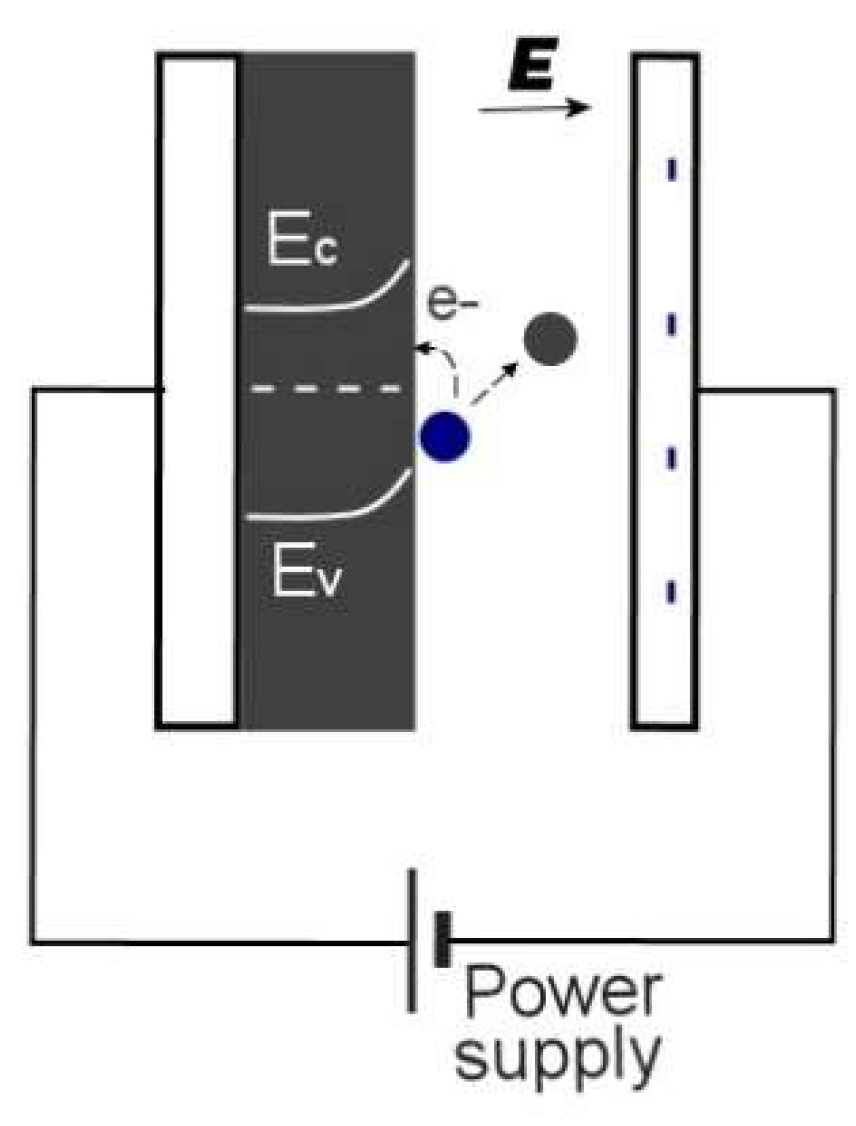
1.2. Electroadsorptive Effect
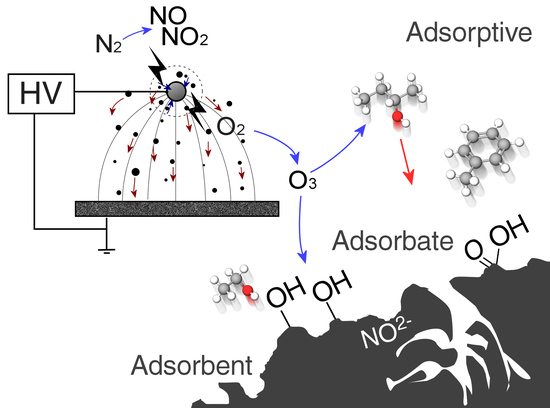
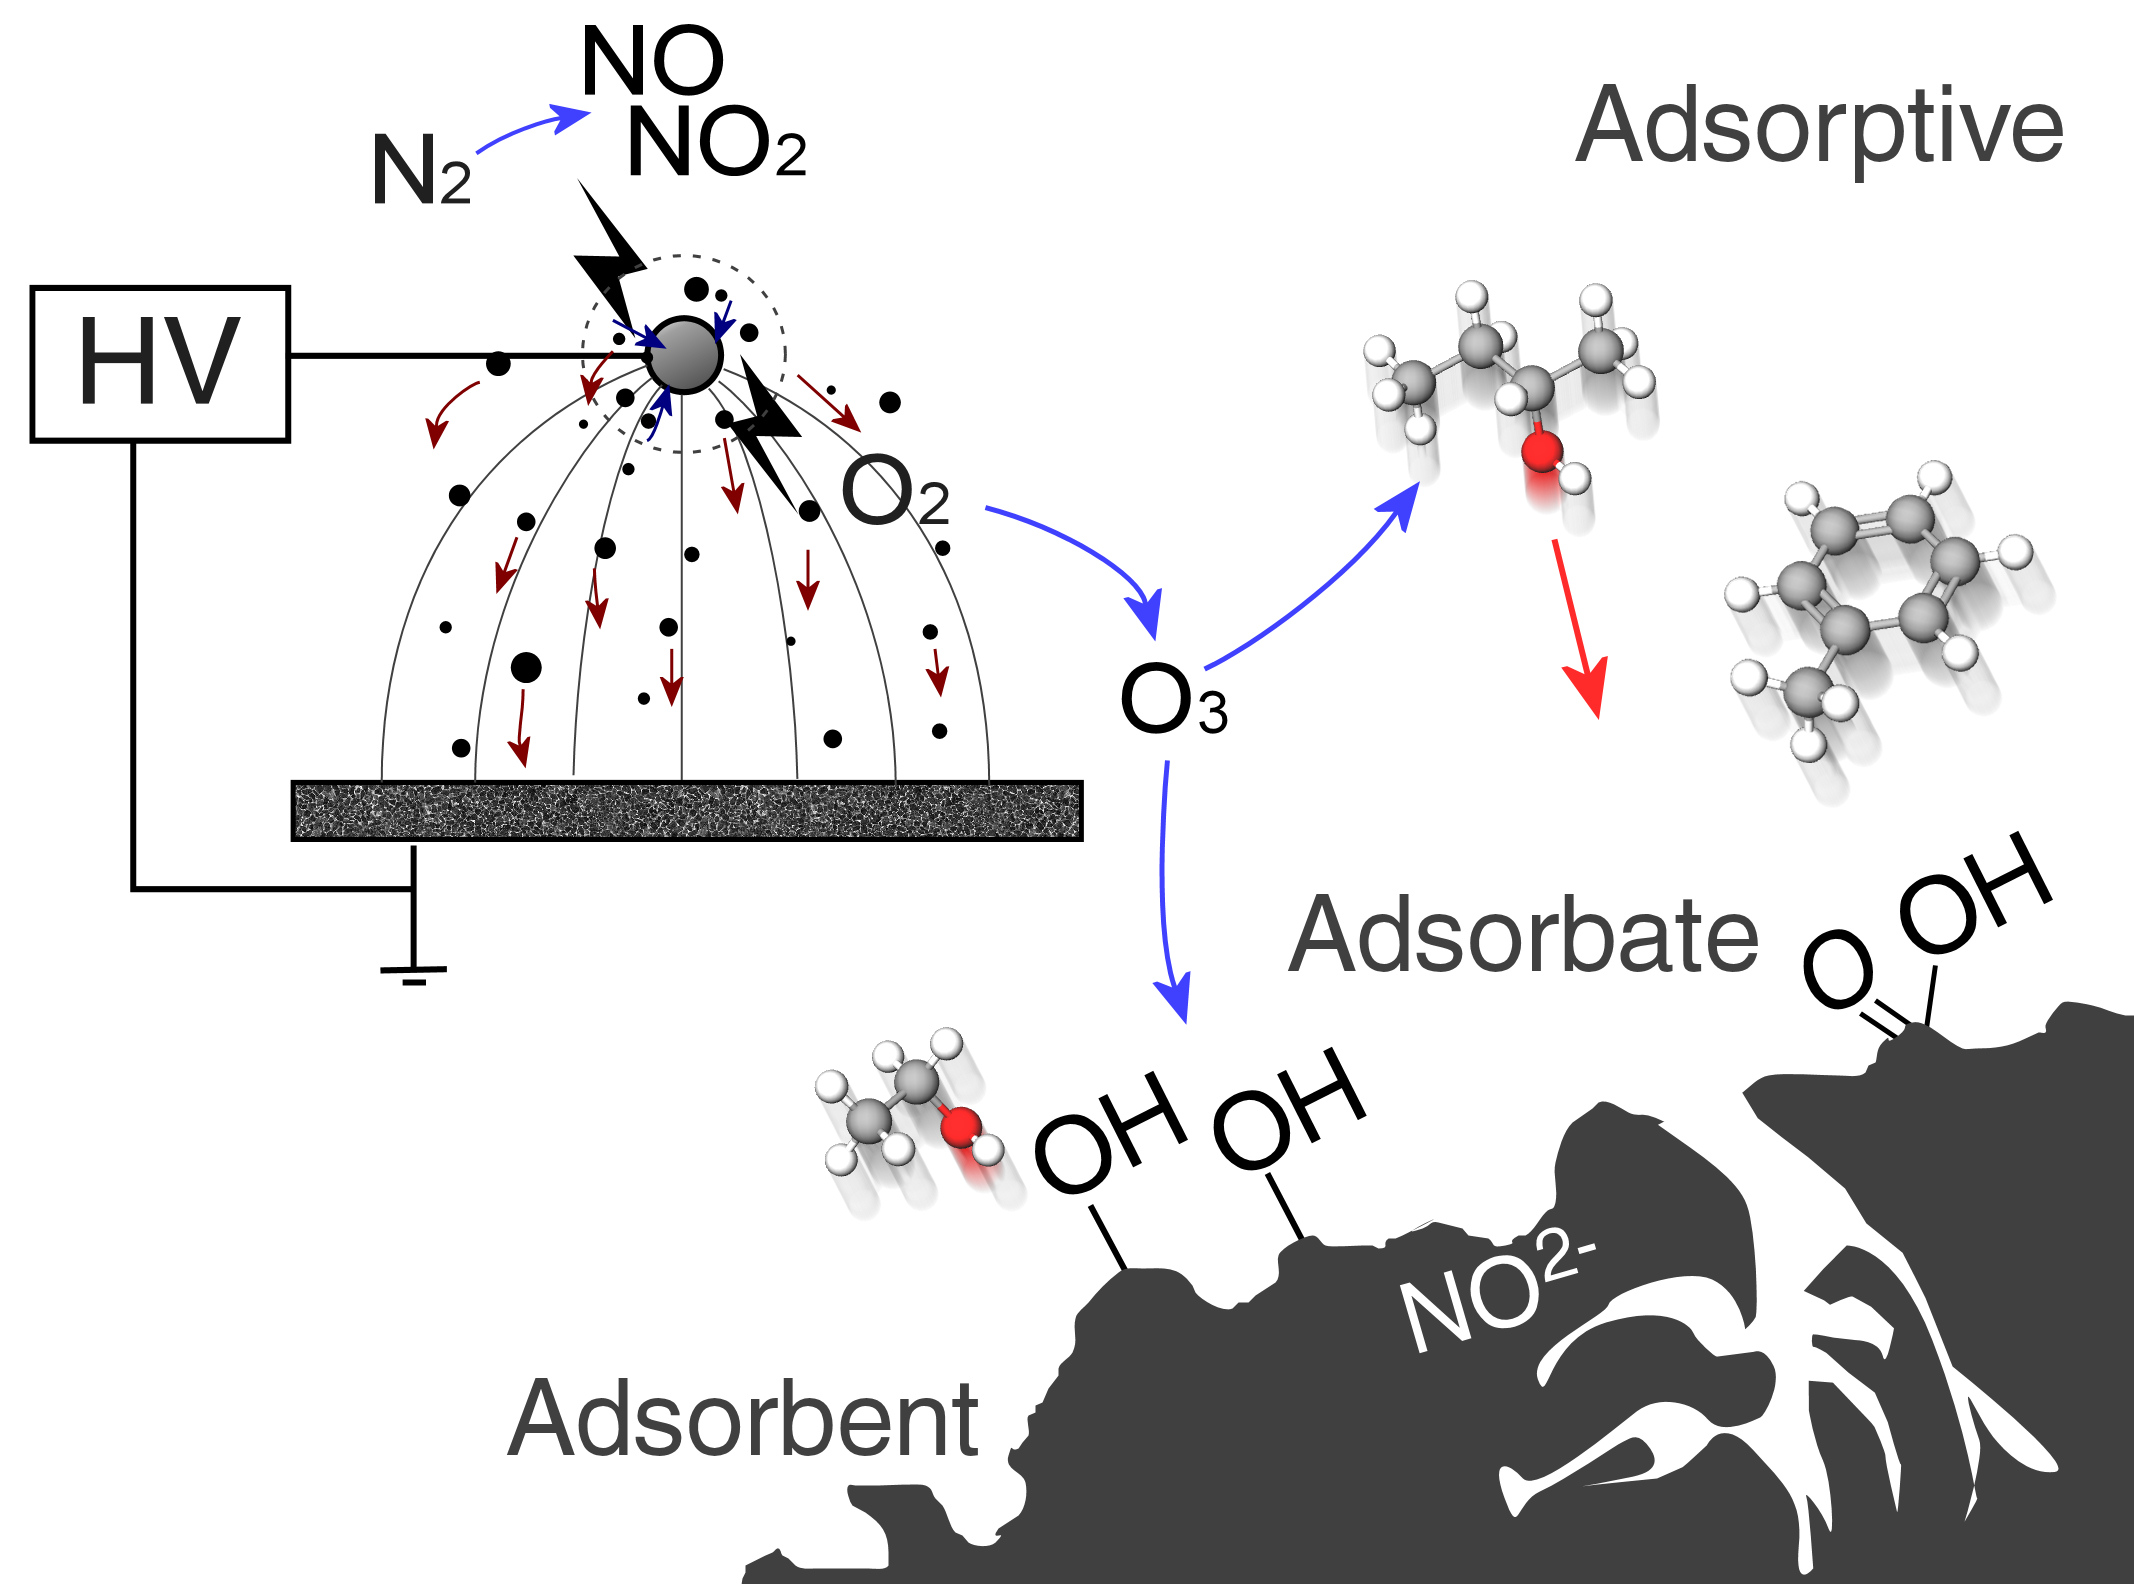
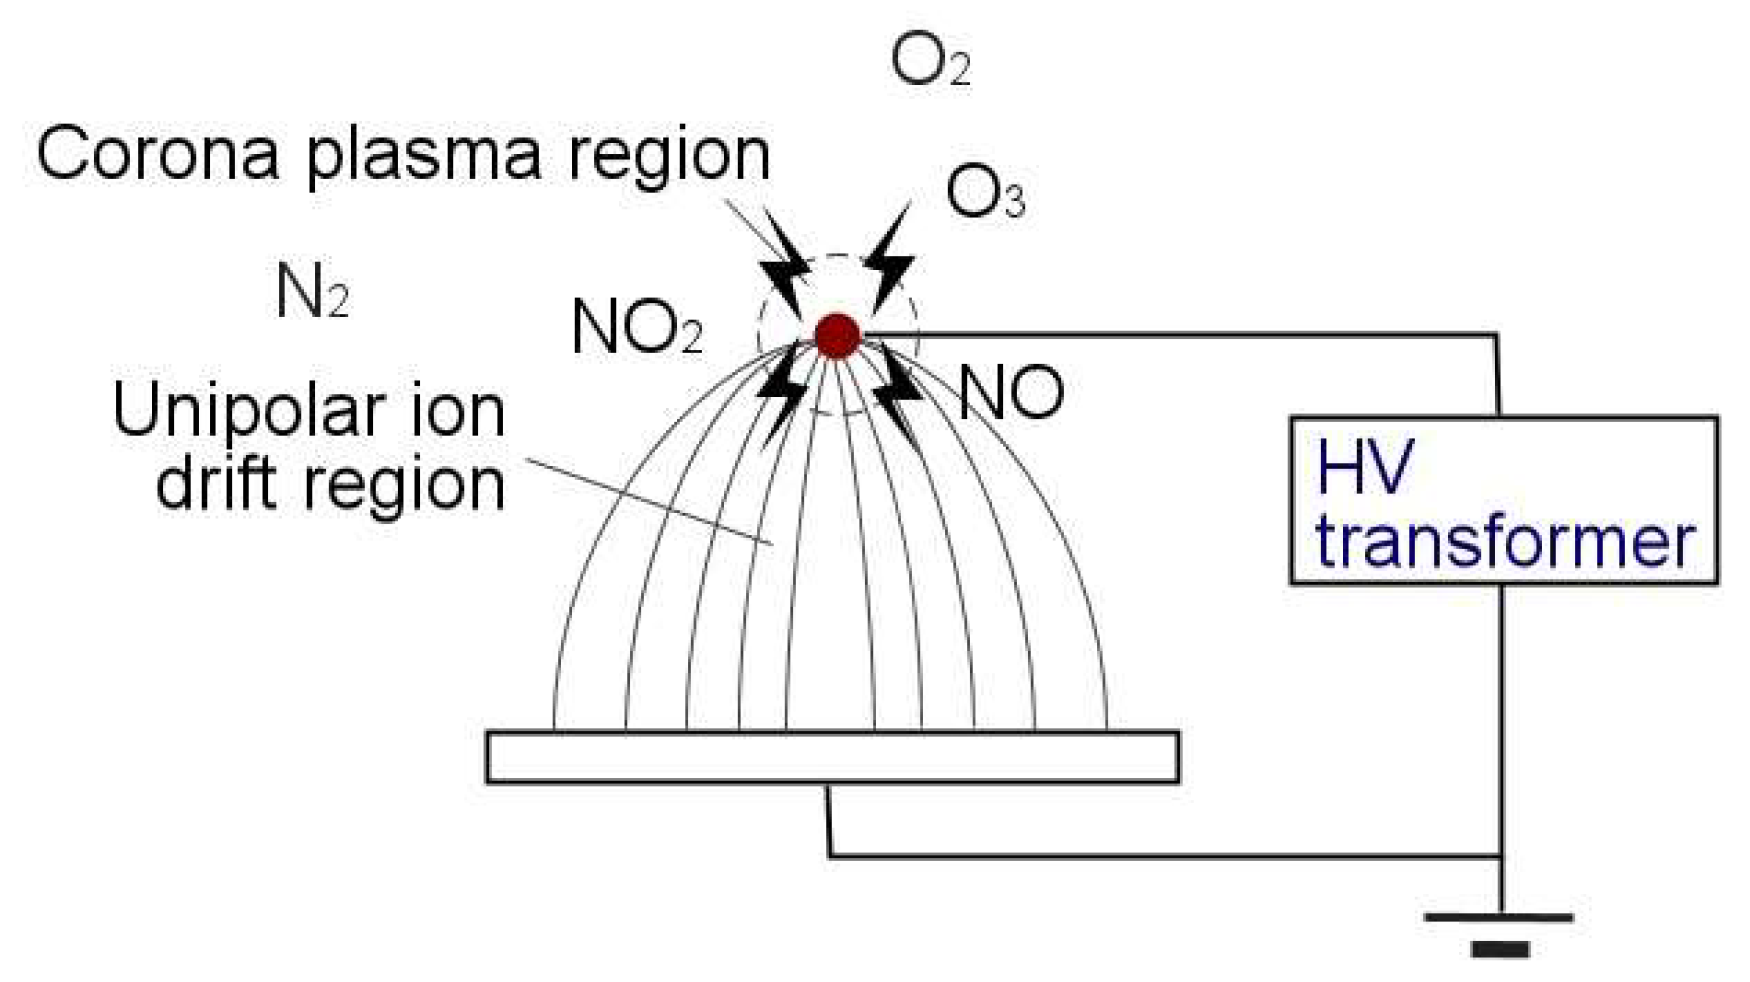
1.3. Gas-Phase Corona Reactions
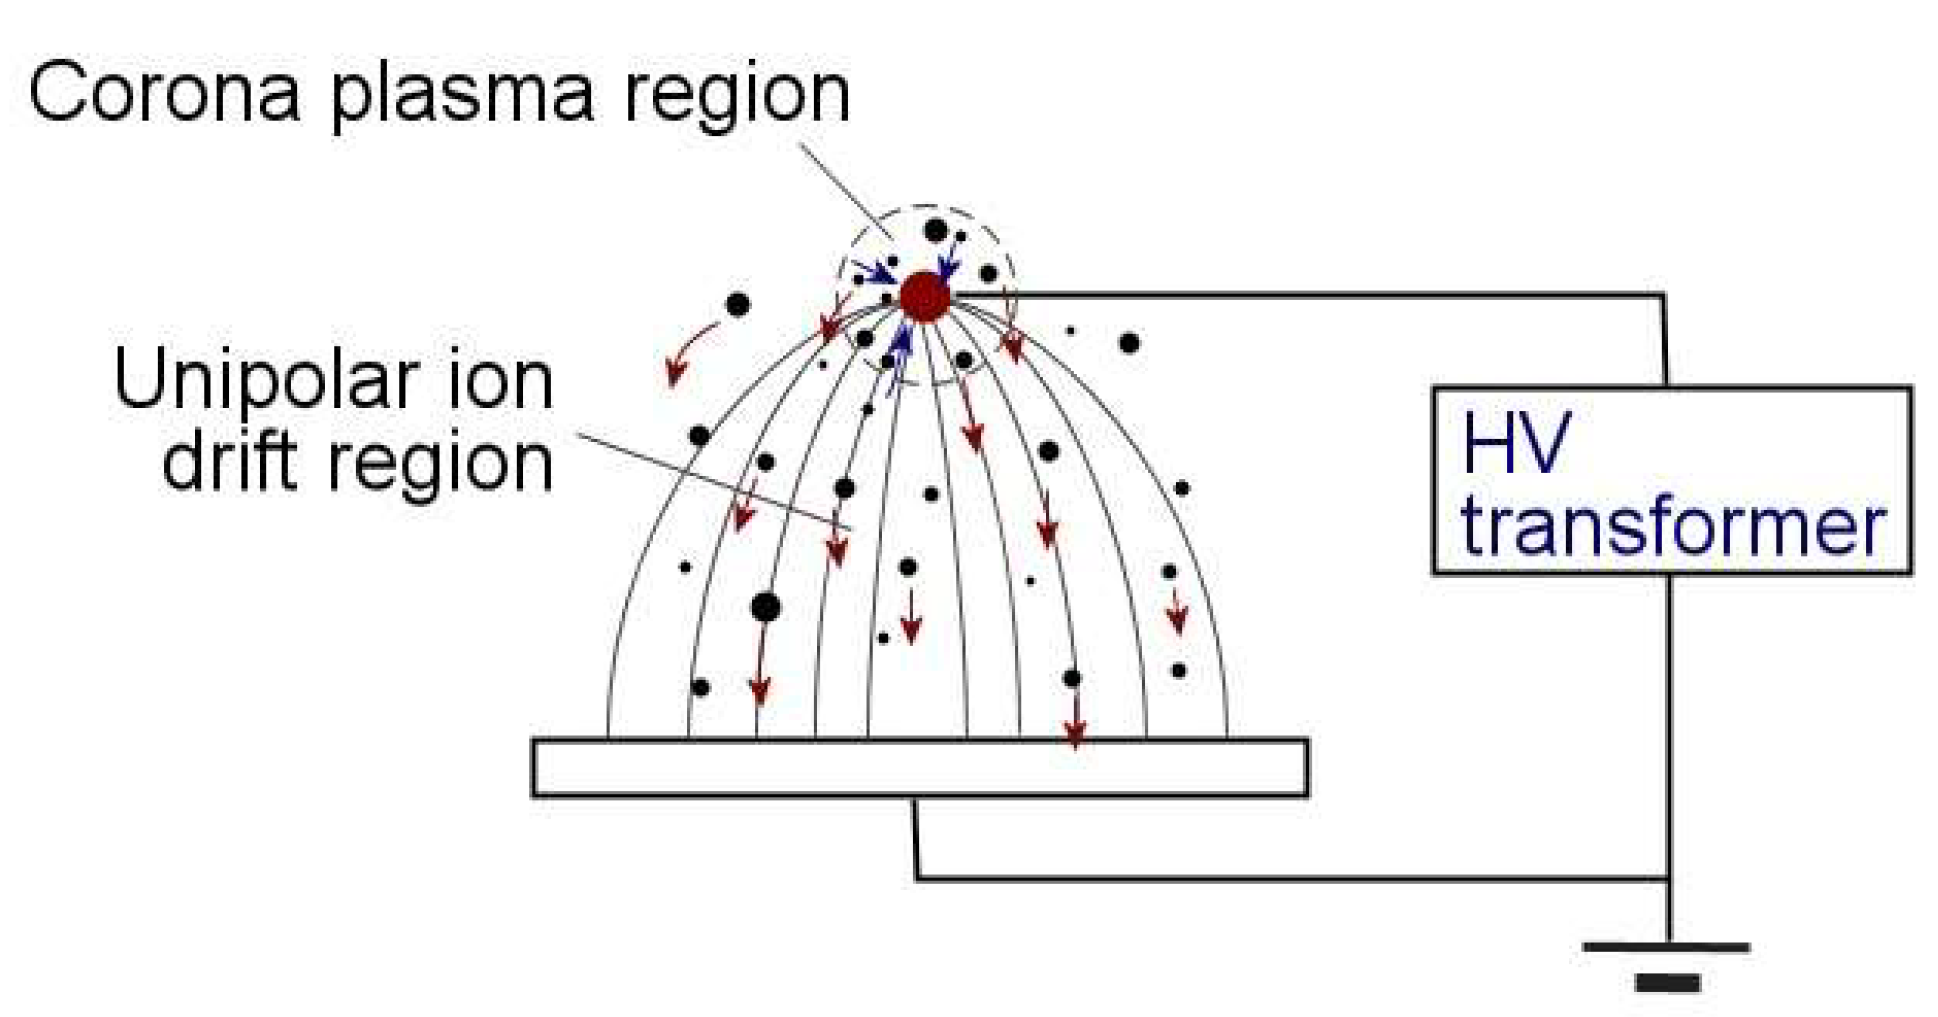
1.4. Electrohydrodynamic Effect
1.5. Adsorbent Modification
2. Materials and Methods
2.1. Materials
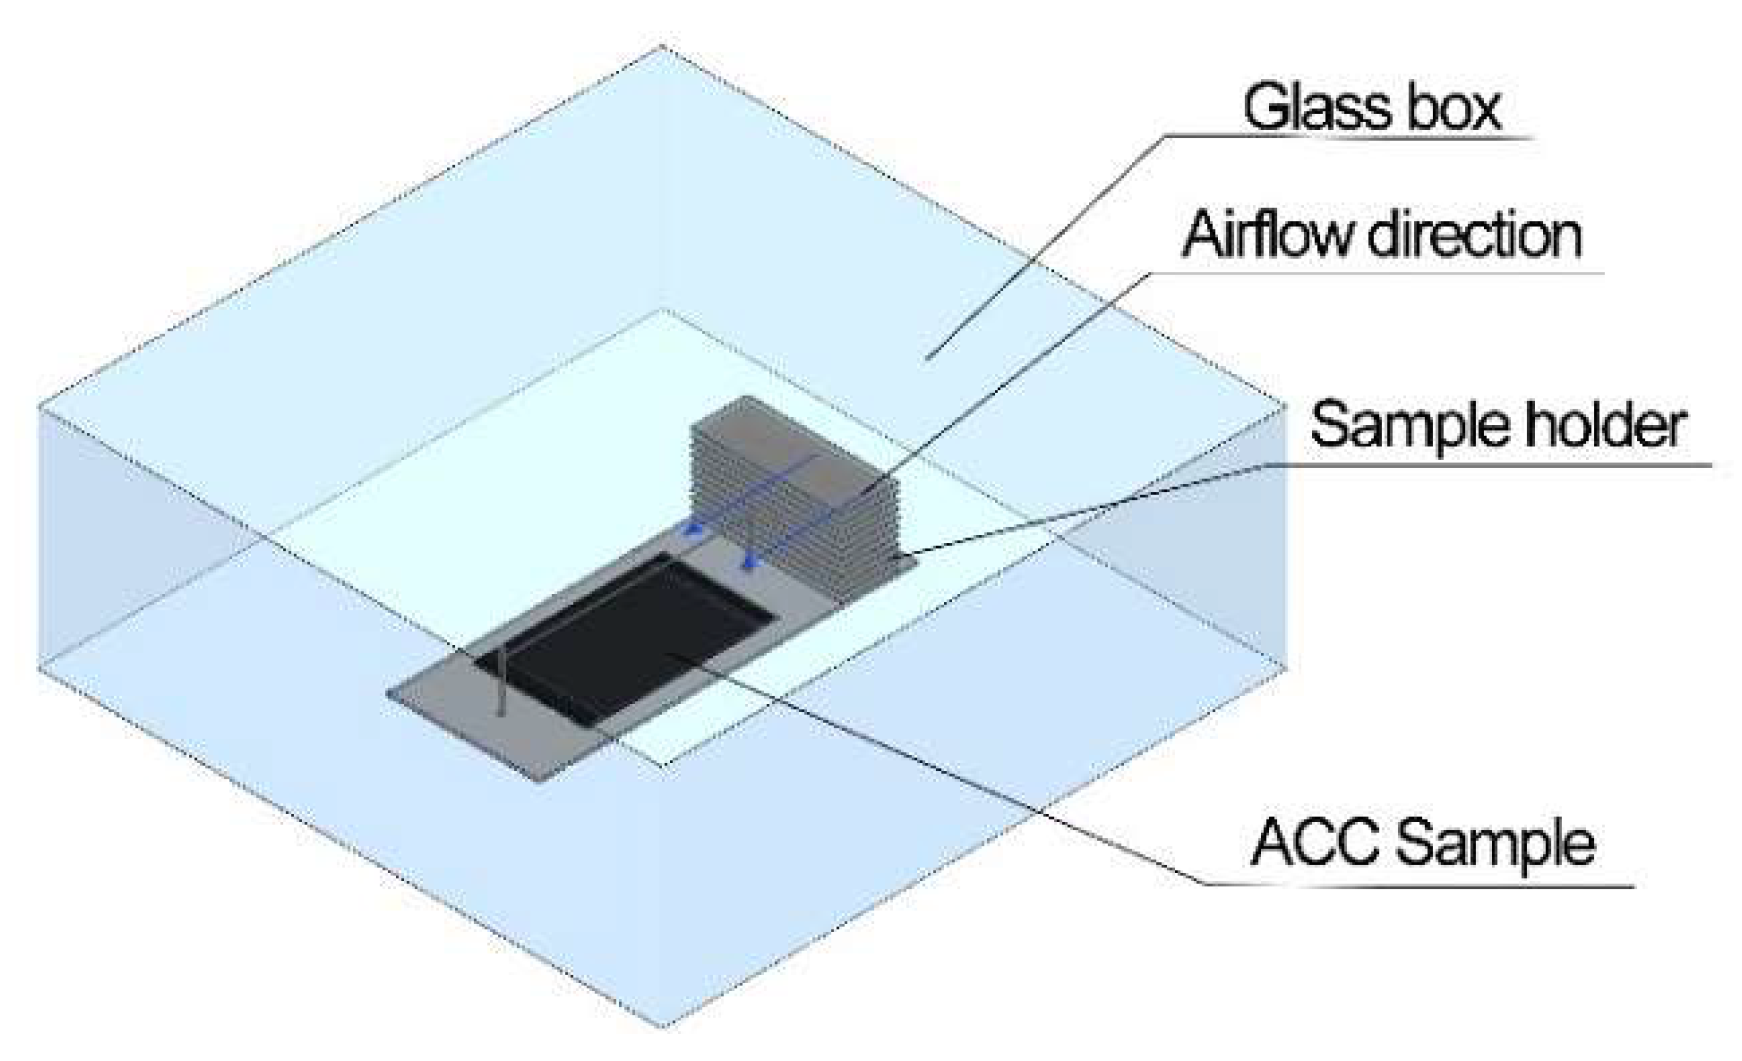
2.2. Test Apparatus
2.3. O3, VOC, CO2, CO Concentration Measurements
2.4. Electrical Impedance Measurement
2.5. SEM and EDX Analysis
2.6. Boehm Titration
2.7. Raman Spectroscopy
2.8. FTIR Analysis
3. Results
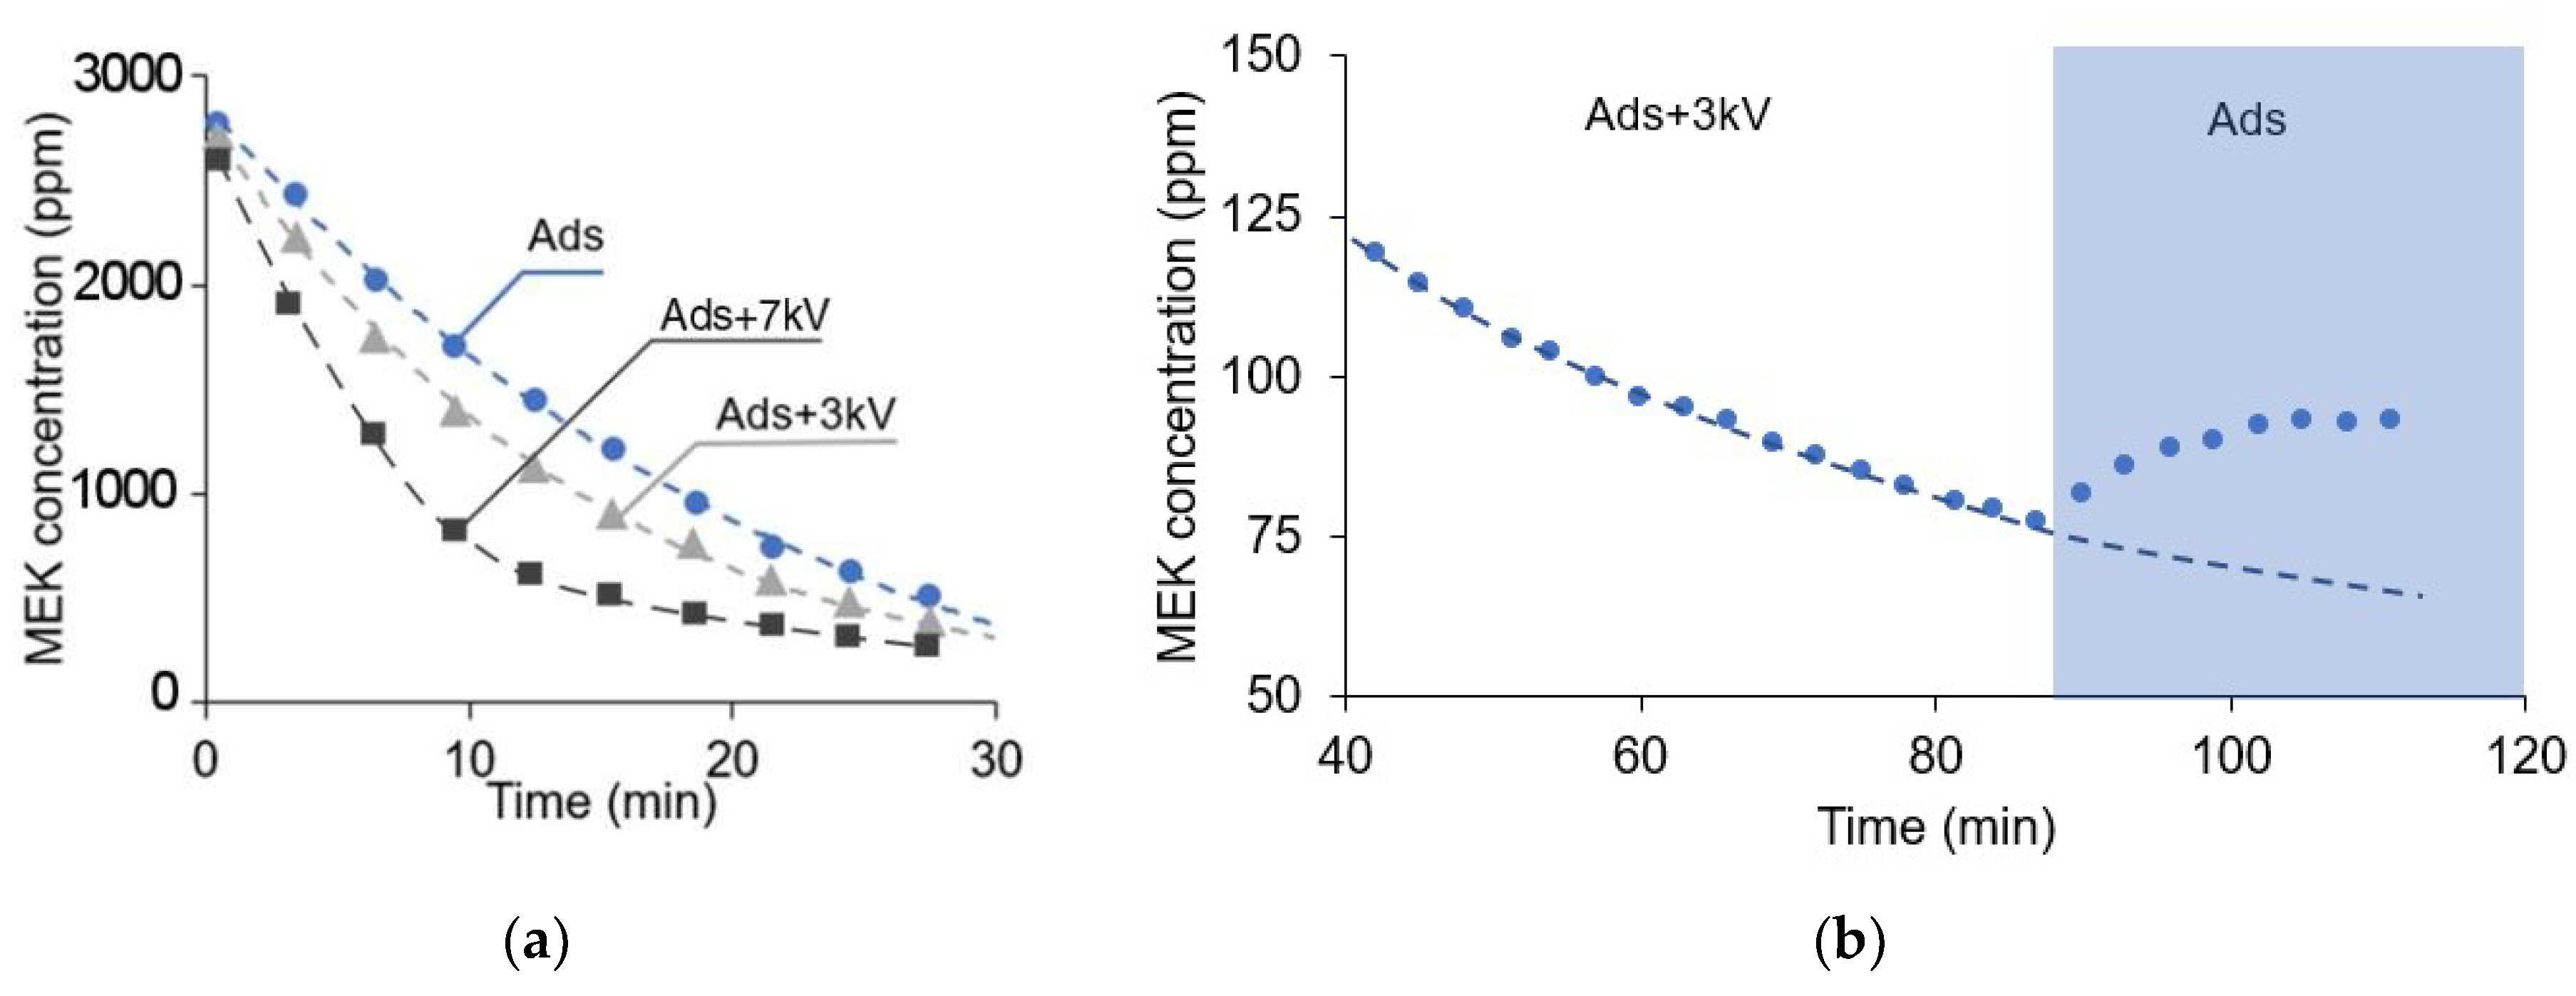
3.1. Enhanced Removal of VOC
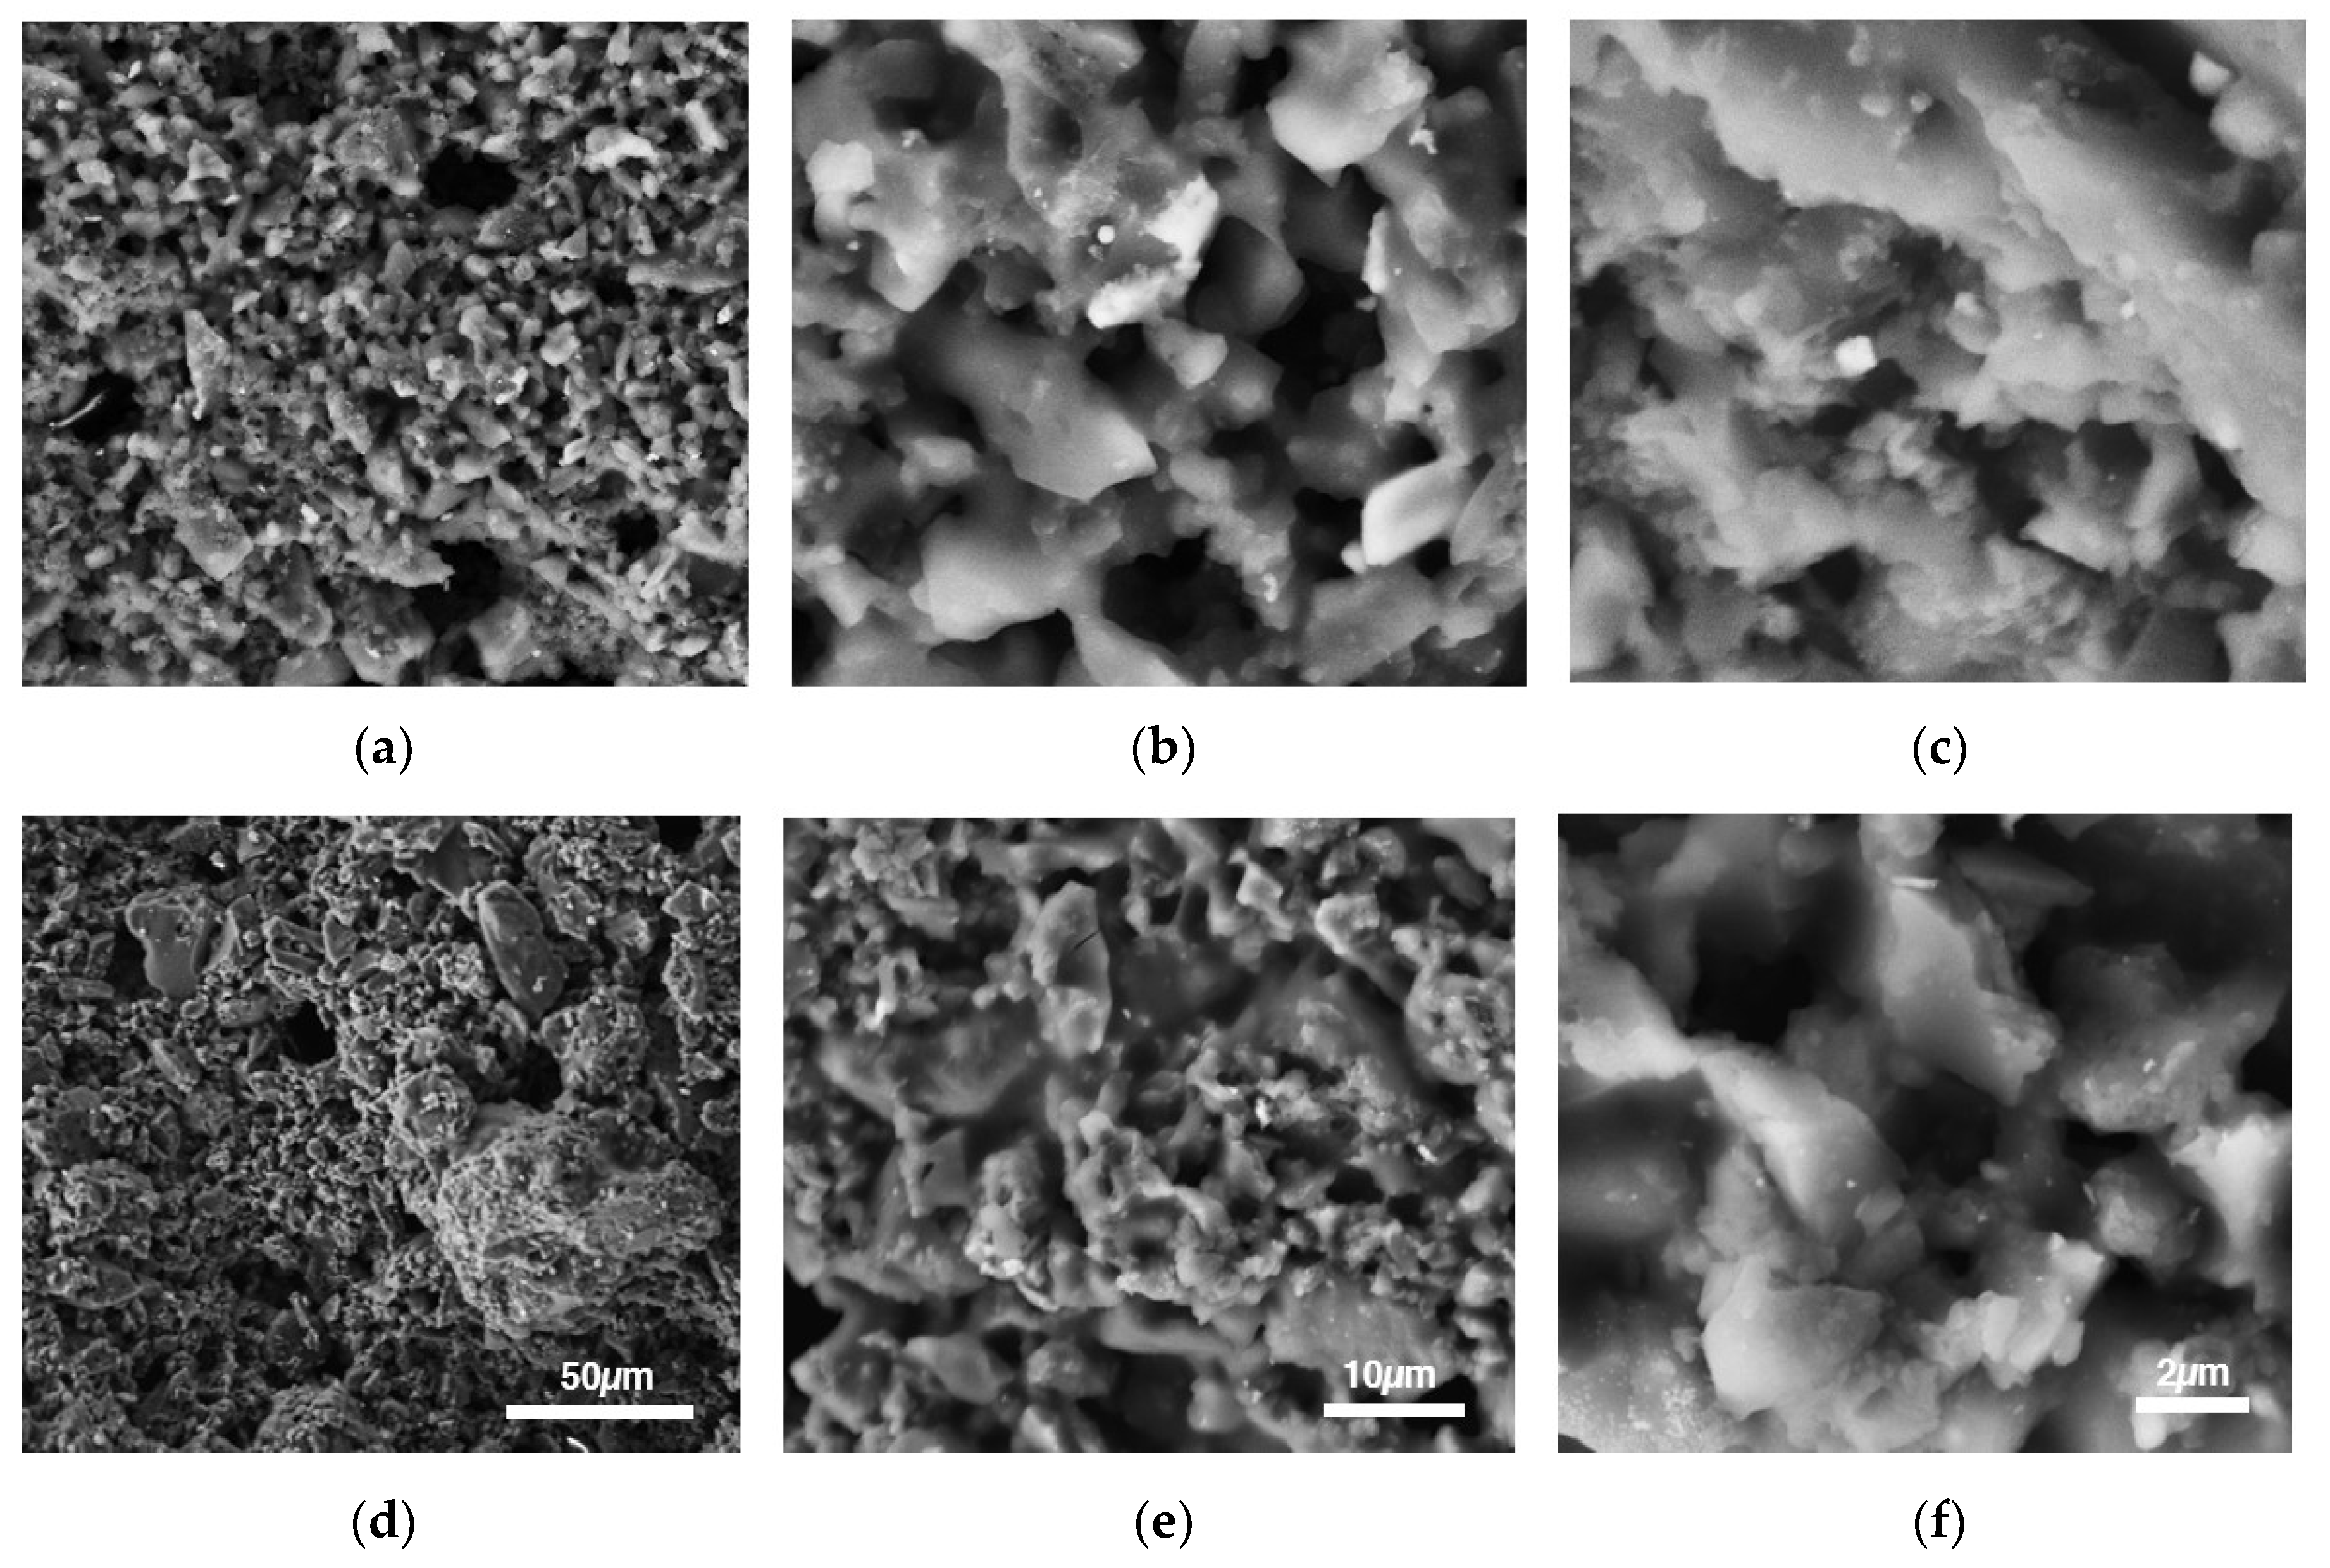
3.2. SEM Morphology
3.3. Boehm Titration
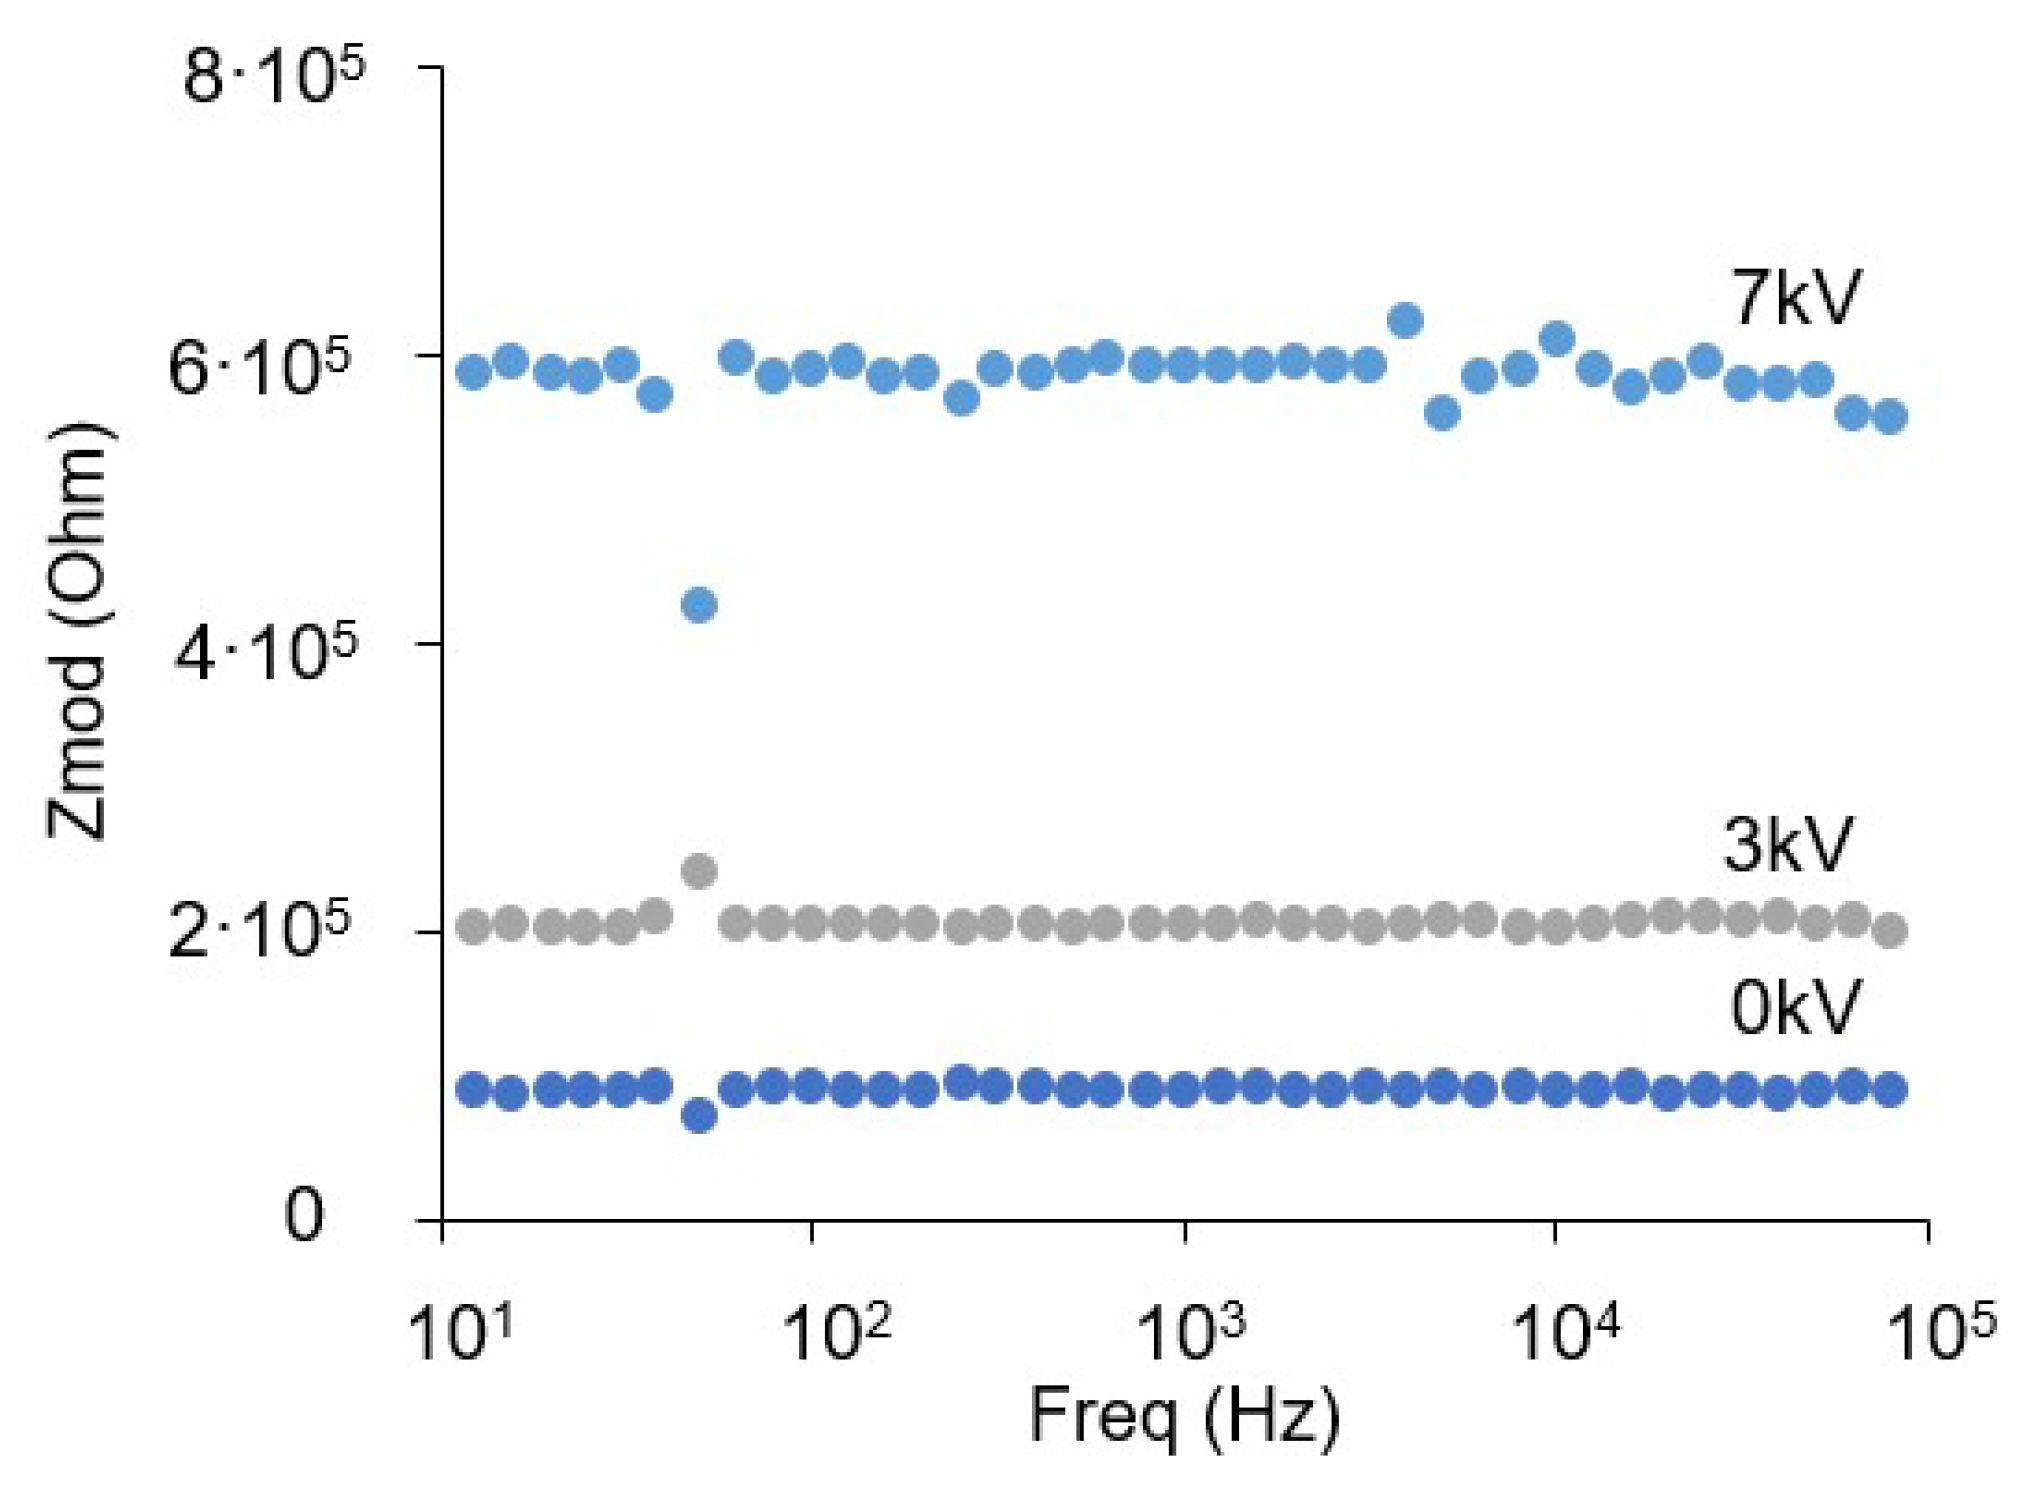
3.4. Electrical Impedance Measurement
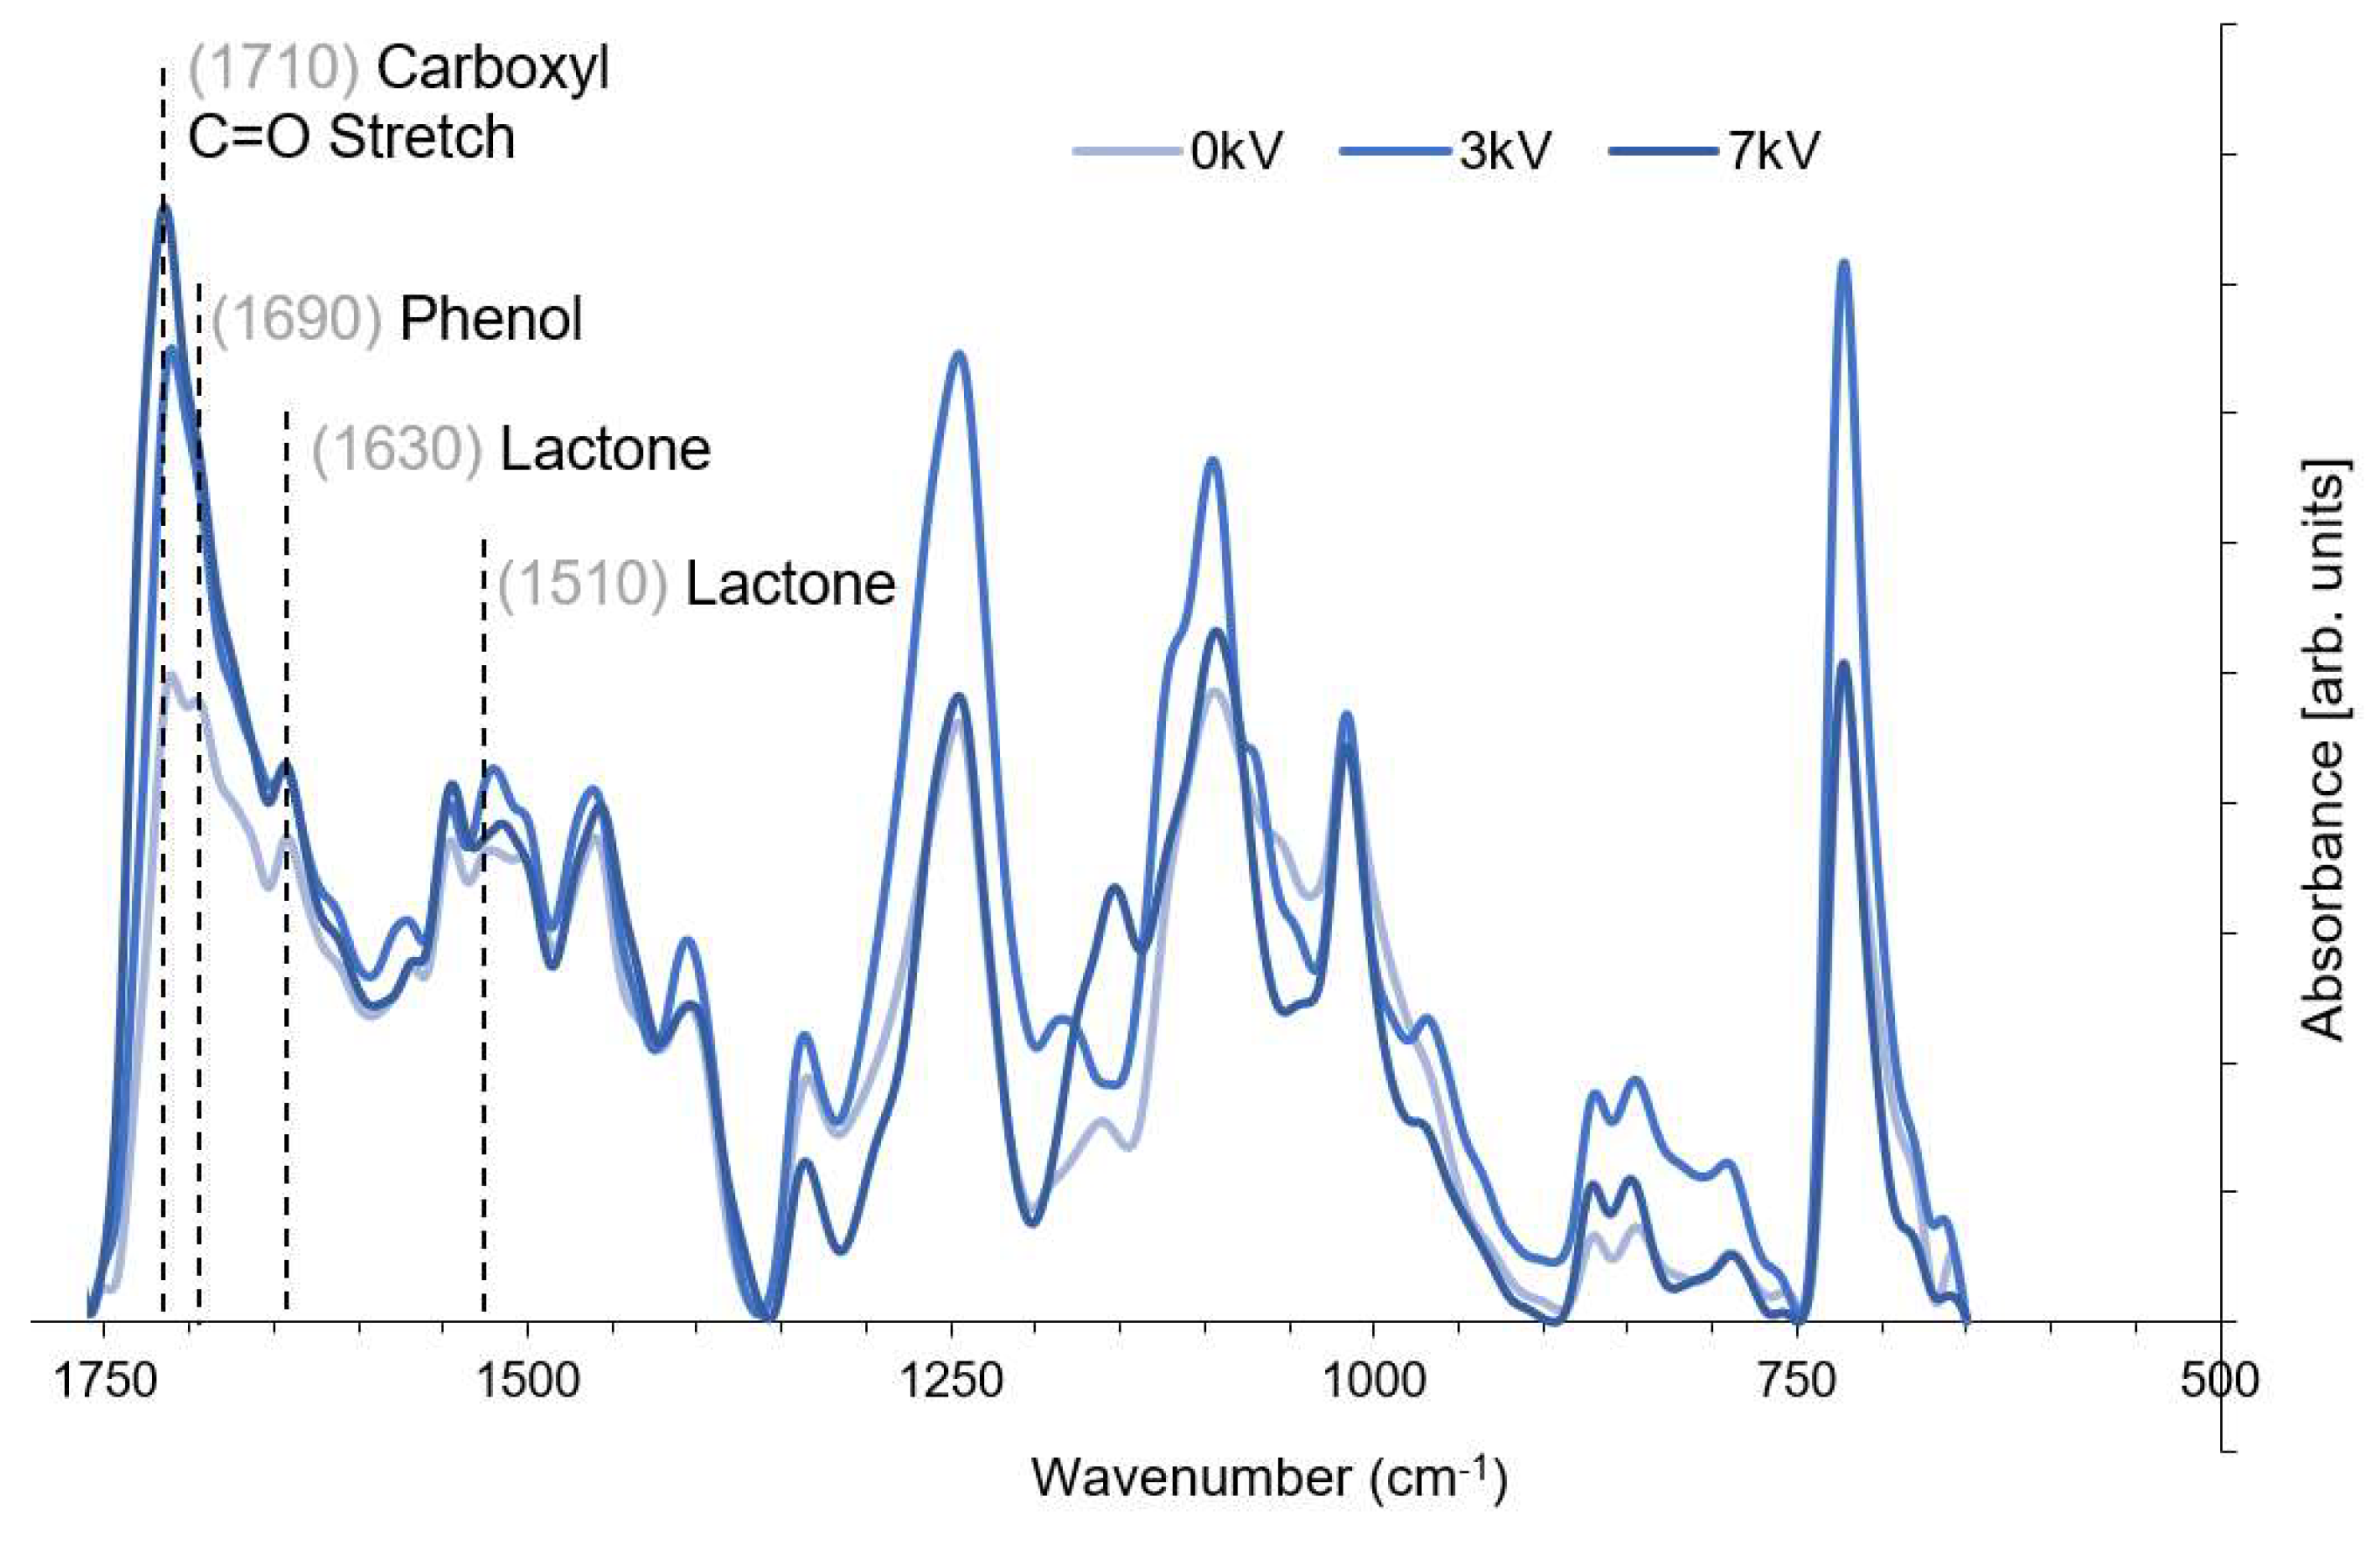
3.5. FTIR Analysis
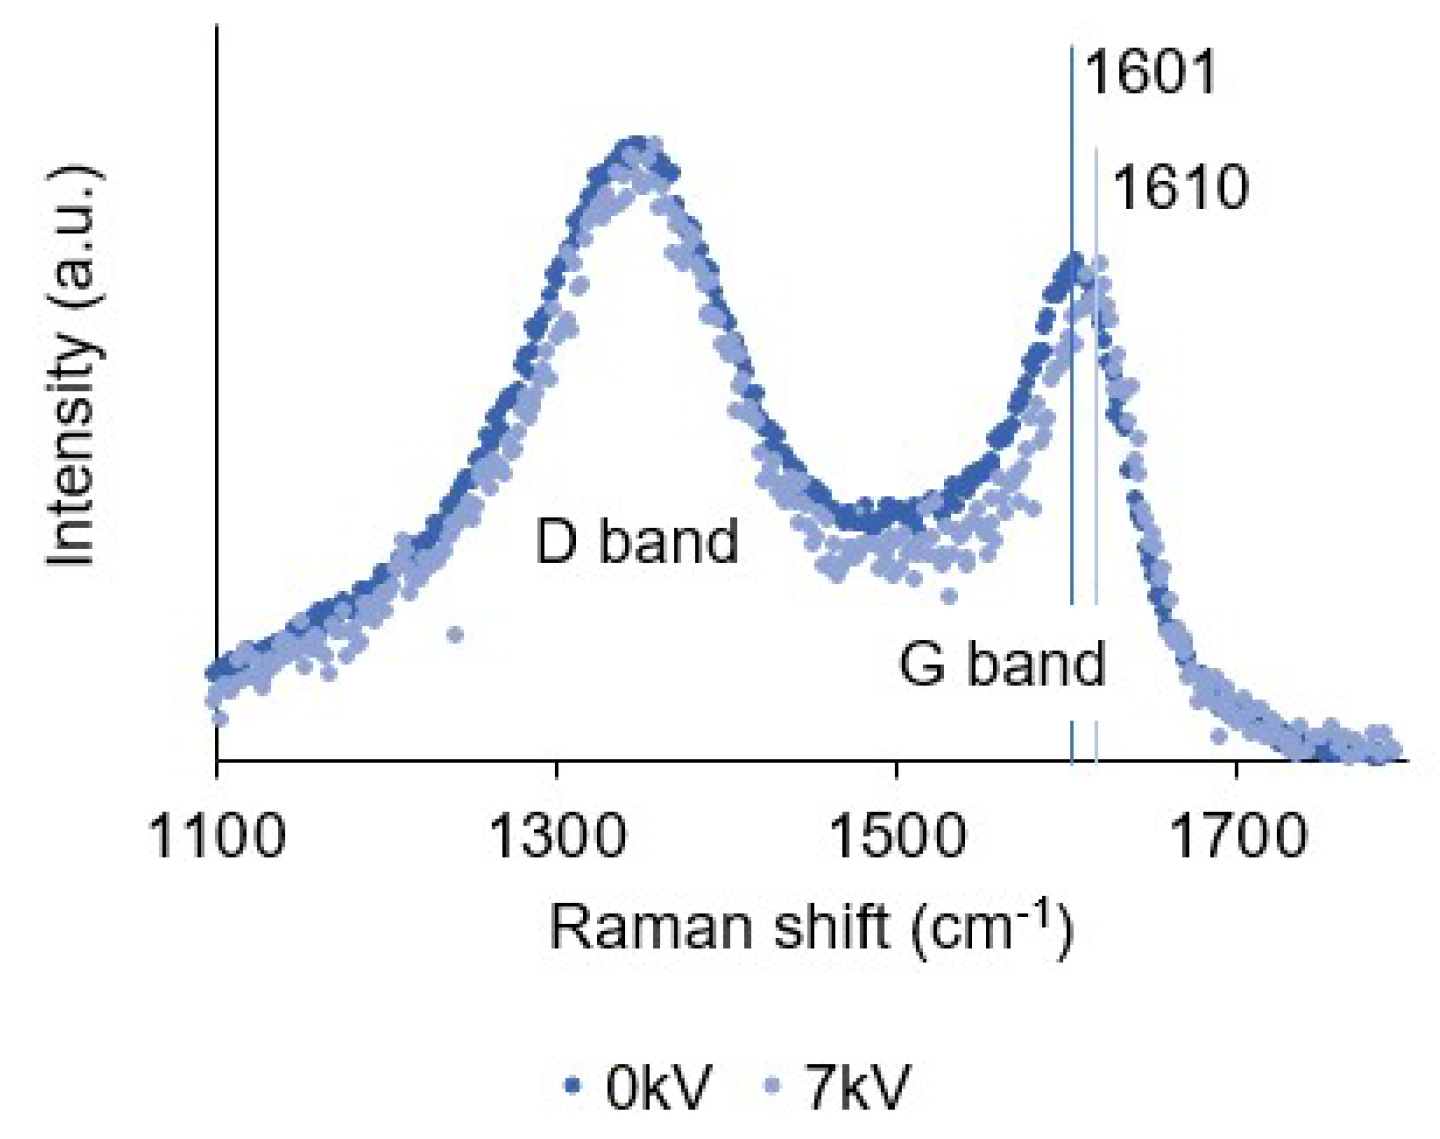
3.6. Raman Spectroscopy
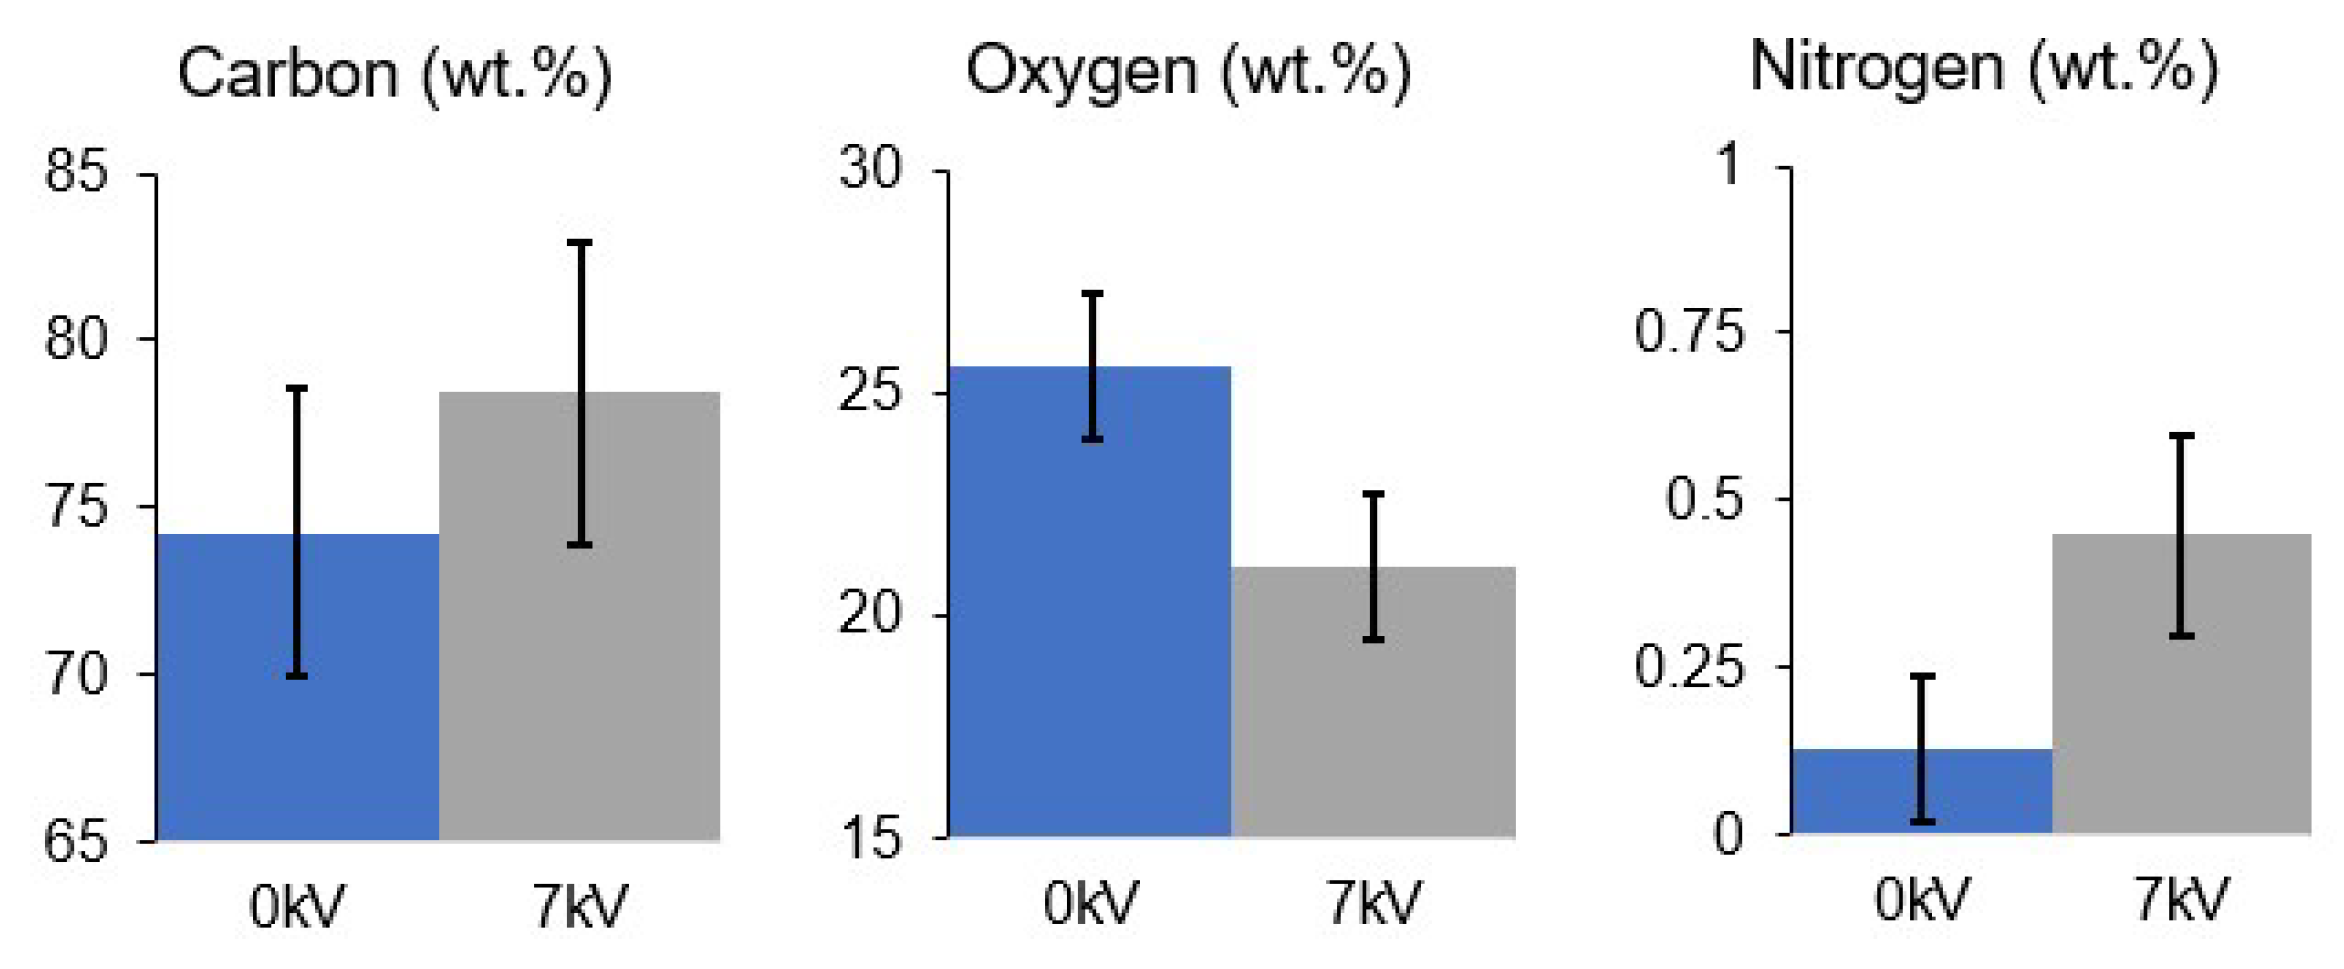
3.7. EDX Analysis
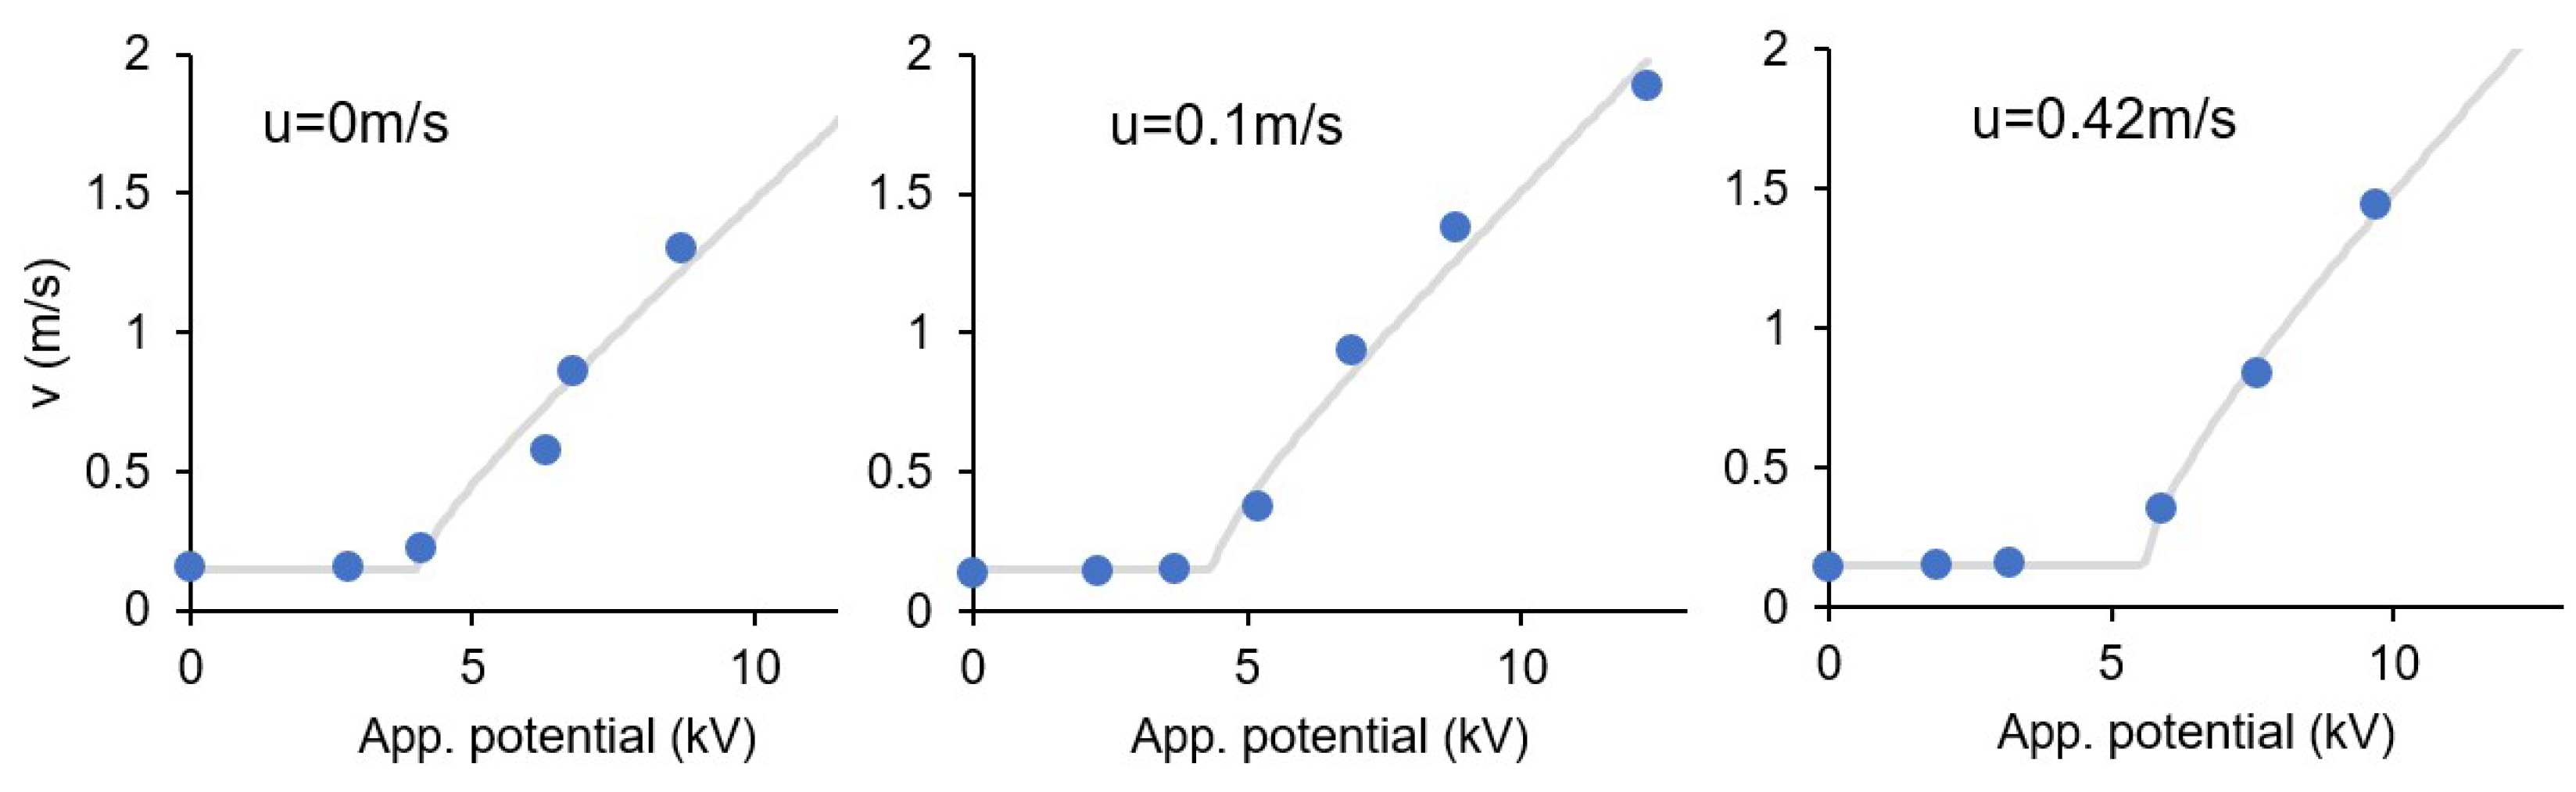
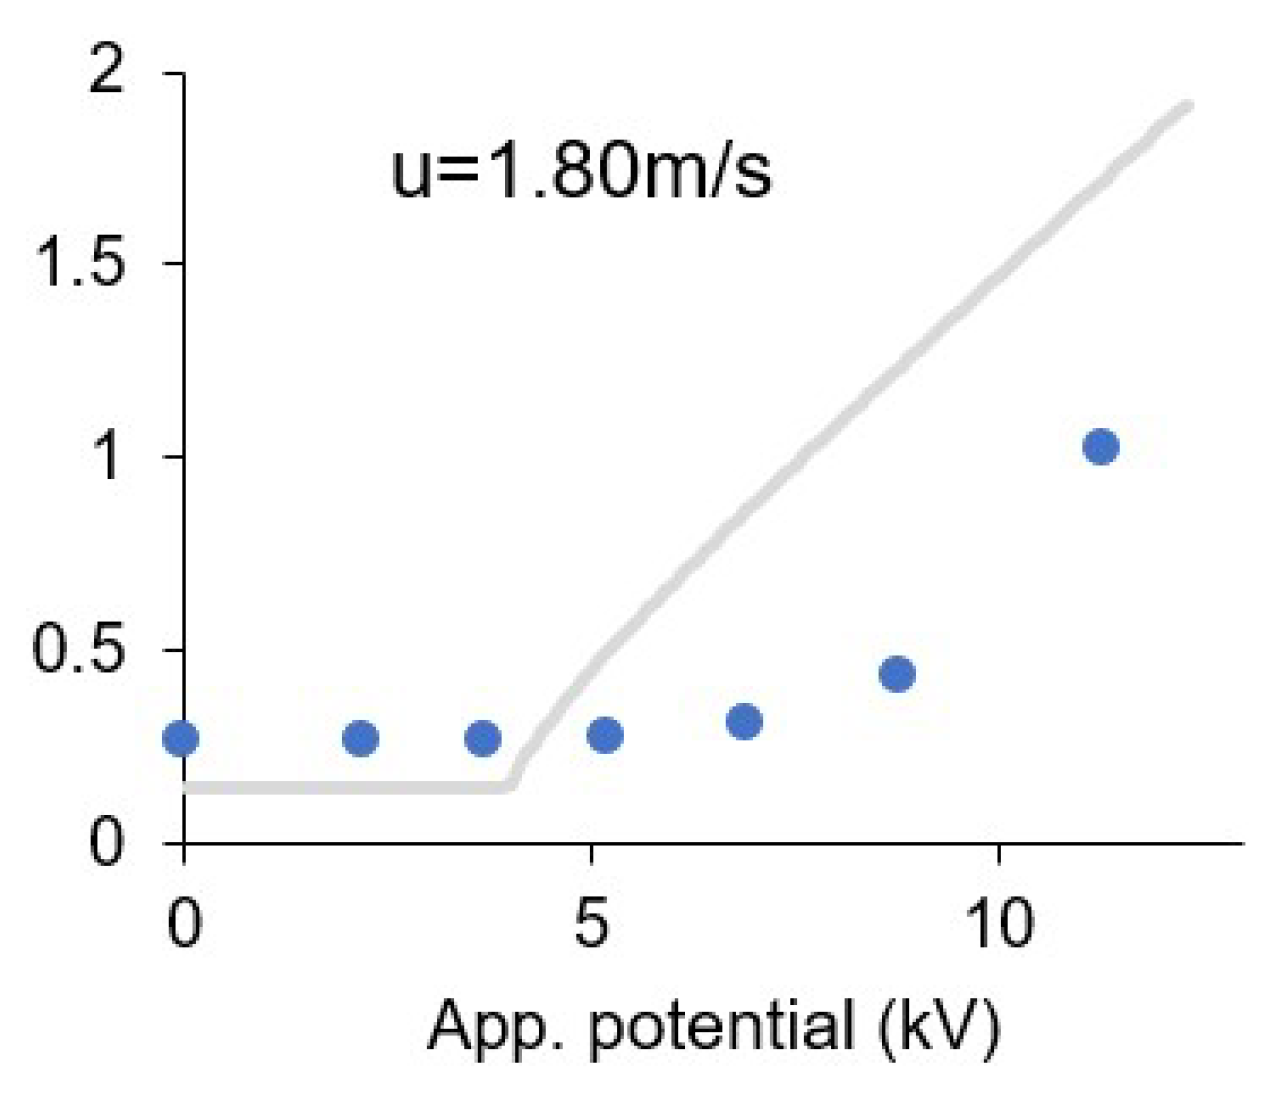
3.8. Effect of the Ionic Wind
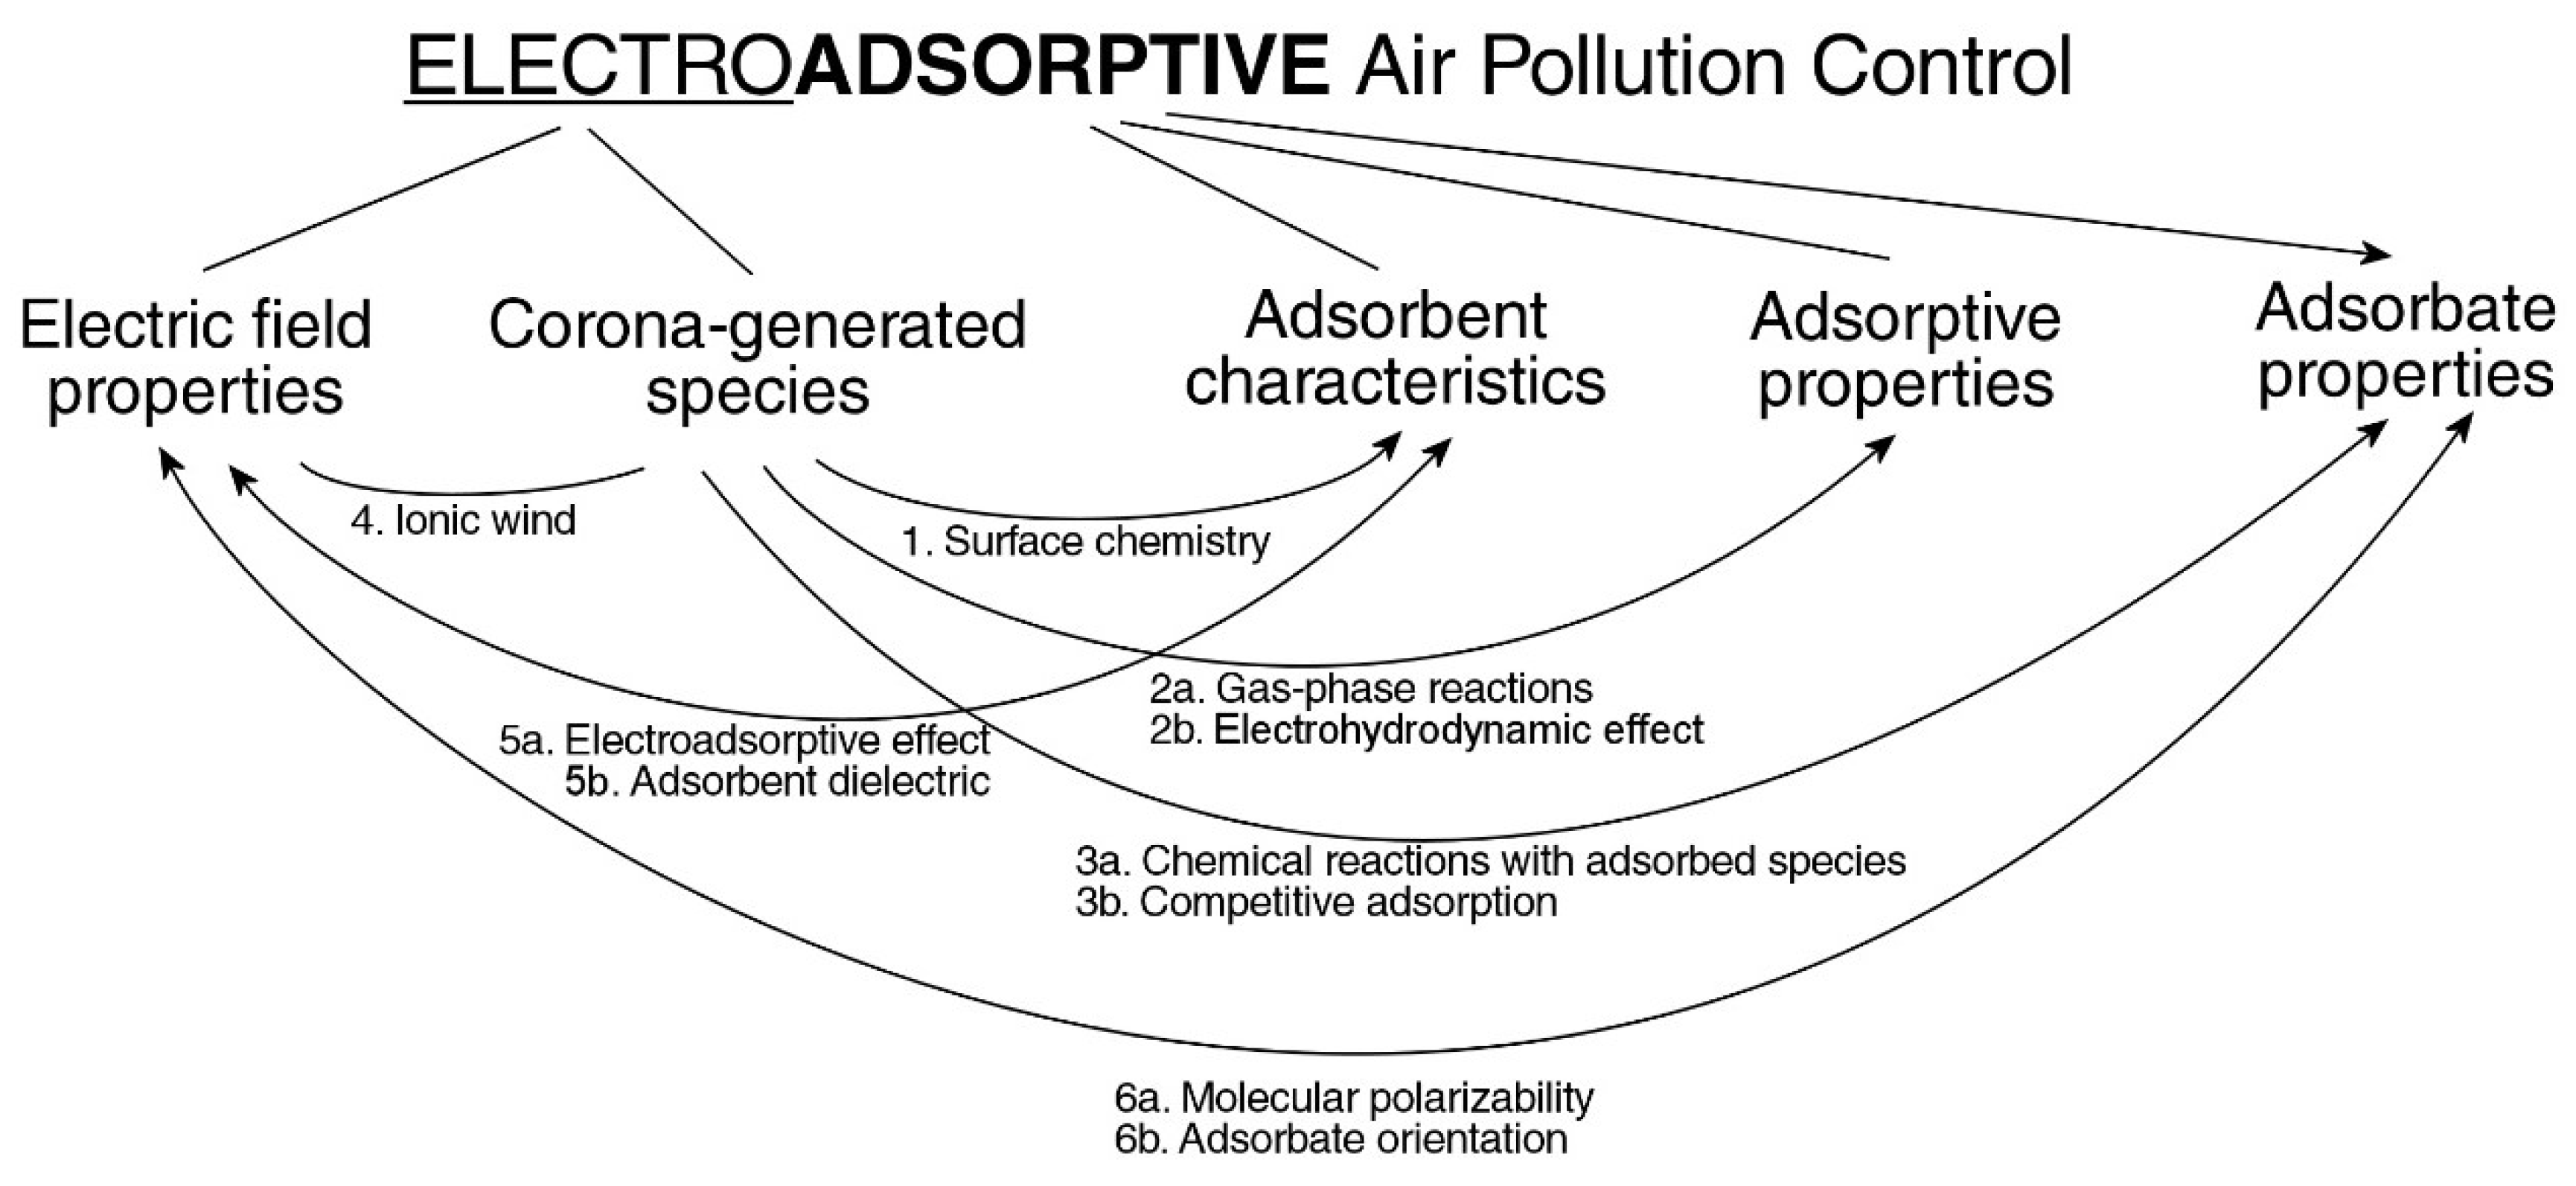
4. Discussion
4.1. Surface Chemistry
4.2. Electrohydrodynamic Effect
4.3. Molecular Polarizability
5. Conclusions
Author Contributions
Funding
Acknowledgments
Conflicts of Interest
References
- Parker, K.R. Applied Electrostatic Precipitation; Springer: Dordrecht, The Netherlands, 1996; ISBN 9789400915534. [Google Scholar]
- Mizuno, A. Electrostatic precipitation. IEEE Trans. Dielectr. Electr. Insul. 2000, 7, 615–624. [Google Scholar] [CrossRef]
- Metts, T.A.; Batterman, S.A. Effect of VOC loading on the ozone removal efficiency of activated carbon filters. Chemosphere 2006, 62, 34–44. [Google Scholar] [CrossRef] [PubMed]
- Ruthven, D.M. Adsorption, Fundamentals. Kirk-Othmer Encycl. Chem. Technol. 2001, 1, 582–617. [Google Scholar] [CrossRef]
- Fava, G.; Pierpaoli, M. A hybrid photocatalytic-electrostatic reactor for nitrogen oxides removal. Am. J. Environ. Eng. Sci. 2015, 2, 7–13. [Google Scholar]
- Fava, G.; Pierpaoli, M. Volatile Organic Compounds Removal in a Hybrid Photocatalytic-Electrostatic Reactor. Am. J. Environ. Eng. Sci. 2015, 2, 14–17. [Google Scholar]
- Pierpaoli, M.; Giosuè, C.; Ruello, M.L.; Fava, G. Appraisal of a hybrid air cleaning process. Environ. Sci. Pollut. Res. 2017, 24, 12638–12645. [Google Scholar] [CrossRef] [PubMed]
- Pierpaoli, M.; Ruello, M.; Fava, G. Enhanced Adsorption of Organic Compounds over an Activated Carbon Cloth by an External-Applied Electric Field. MDPI Environments 2017, 4, 33. [Google Scholar] [CrossRef]
- Grevillot, G. Separation Processes Based on Electrosorption Phenomena. In Adsorption: Science and Technology; Rodrigues, A.E., LeVan, M.D., Tondeur, D., Eds.; NATO ASI Series (Series E: Applied Sciences); Springer: Dordrecht, the Netherlands, 1989; Volume 158. [Google Scholar]
- Su, X.; Hatton, T.A. Electrosorption. In Kirk-Othmer Encyclopedia of Chemical Technology; John Wiley & Sons, Inc.: Hoboken, NJ, USA, 2016; pp. 1–11. [Google Scholar]
- Oren, Y. Capacitive deionization (CDI) for desalination and water treatment—Past, present and future (a review). Desalination 2008, 228, 10–29. [Google Scholar] [CrossRef]
- Porada, S.; Zhao, R.; van der Wal, A.; Presser, V.; Biesheuvel, P.M. Review on the science and technology of water desalination by capacitive deionization. Prog. Mater. Sci. 2013, 58, 1388–1442. [Google Scholar] [CrossRef]
- Li, H.; Zou, L.; Pan, L.; Sun, Z. Novel Graphene-Like Electrodes for Capacitive Deionization. Environ. Sci. Technol. 2010, 44, 8692–8697. [Google Scholar] [CrossRef]
- Tsouris, C.; Mayes, R.; Kiggans, J.; Sharma, K.; Yiacoumi, S.; DePaoli, D.; Dai, S. Mesoporous Carbon for Capacitive Deionization of Saline Water. Environ. Sci. Technol. 2011, 45, 10243–10249. [Google Scholar] [CrossRef] [PubMed]
- Lota, G.; Fic, K.; Frackowiak, E. Carbon nanotubes and their composites in electrochemical applications. Energy Environ. Sci. 2011, 4, 1592. [Google Scholar] [CrossRef]
- Frackowiak, E.; Abbas, Q.; Béguin, F. Carbon/carbon supercapacitors. J. Energy Chem. 2013, 22, 226–240. [Google Scholar] [CrossRef]
- Ponton, L.M.; Porter, M.D. High-speed electrochemically modulated liquid chromatography. Anal. Chem. 2004, 76, 5823–5828. [Google Scholar] [CrossRef] [PubMed]
- Gileadi, E. Electrosorption; Springer US: Boston, MA, USA, 2002; ISBN 1468417312. [Google Scholar]
- Bockris, J.O. Modern Aspects of Electrochemistry No. 4; Springer US: Boston, MA, USA, 1966; ISBN 9781468409130. [Google Scholar]
- Chue, K.T.; Grévillot, G.; Tondeur, D. Electrosorption an Activated Carbon Bed. Stud. Surf. Sci. Catal. 1993, 80, 97–104. [Google Scholar] [CrossRef]
- Doll, T. Advanced Gas Sensing—The Electroadsorptive Effect and Related Techniques; Doll, T., Ed.; Springer US: Boston, MA, USA, 2003; Volume 6, ISBN 978-1-4020-7433-2. [Google Scholar]
- Wolkenstein, T. The Electron Theory of Catalysis on Semiconductors. Adv. Catal. 1960, 12, 189–264. [Google Scholar] [CrossRef]
- Peek, F.W. Dielectric Phenomena in High Voltage Engineering; McGraw-Hill Book Company, Inc.: New York, NY, USA, 1915. [Google Scholar]
- Strobel, M.; Jones, V.; Lyons, C.S.; Ulsh, M.; Kushner, M.J.; Dorai, R.; Branch, M.C. A Comparison of Corona-Treated and Flame-Treated Polypropylene Films. Plasmas Polym. 2003, 8, 61–95. [Google Scholar] [CrossRef]
- Zhang, W.-J.; Bagreev, A.; Rasouli, F. Reaction of NO2 with Activated Carbon at Ambient Temperature. Ind. Eng. Chem. Res. 2008, 47, 4358–4362. [Google Scholar] [CrossRef]
- Cagnoni, D.; Agostini, F.; Christen, T.; Parolini, N.; Stevanović, I.; De Falco, C. Multiphysics simulation of corona discharge induced ionic wind. J. Appl. Phys. 2013, 114, 1–24. [Google Scholar] [CrossRef]
- Jewell-Larsen, N.E.; Karpov, S.V.; Krichtafovitch, I.A.; Jayanty, V.; Hsu, C.P.; Mamishev, A.V. Modeling of corona-induced electrohydrodynamic flow with COMSOL multiphysics. Proceedings ESA Annual Meeting on Electrostatics, Minneapolis, Minnesota, 17–19 June 2008. [Google Scholar]
- Adamiak, K. Numerical models in simulating wire-plate electrostatic precipitators: A review. J. Electrost. 2013, 71, 673–680. [Google Scholar] [CrossRef]
- Bouazza, M.R.; Yanallah, K.; Pontiga, F.; Chen, J.H. A simplified formulation of wire-plate corona discharge in air: Application to the ion wind simulation. J. Electrostat. 2018, 92, 54–65. [Google Scholar] [CrossRef]
- Boeuf, J.P.; Pitchford, L.C. Electrohydrodynamic force and aerodynamic flow acceleration in surface dielectric barrier discharge. J. Appl. Phys. 2005, 97, 103307. [Google Scholar] [CrossRef]
- Debien, A.; Benard, N.; Moreau, E. Streamer inhibition for improving force and electric wind produced by DBD actuators. J. Phys. D. Appl. Phys. 2012, 45. [Google Scholar] [CrossRef]
- Lee, D.; Hee, S.; Paek, K.; Ju, W. Adsorbability enhancement of activated carbon by dielectric barrier discharge plasma treatment. Surf. Coat. Technol. 2005, 200, 2277–2282. [Google Scholar] [CrossRef]
- Kodama, S.; Habaki, H.; Sekiguchi, H.; Kawasaki, J. Surface modification of adsorbents by dielectric barrier discharge. Thin Solid Films 2002, 407, 151–155. [Google Scholar] [CrossRef]
- Chiang, H.L.; Chiang, P.C.; Huang, C.P. Ozonation of activated carbon and its effects on the adsorption of VOCs exemplified by methylethylketone and benzene. Chemosphere 2002, 47, 267–275. [Google Scholar] [CrossRef]
- Chiang, H.L.; Huang, C.P.; Chiang, P.C. The surface characteristics of activated carbon as affected by ozone and alkaline treatment. Chemosphere 2002, 47, 257–265. [Google Scholar] [CrossRef]
- Deitz, V.R. The rates of adsorption and desorption of water vapor from air flows through activated carbons. Carbon N. Y. 1991, 29, 569–573. [Google Scholar] [CrossRef]
- Qu, G.-Z.; Li, J.; Li, G.-F.; Wu, Y.; Lu, N. DBD regeneration of GAC loaded with acid orange 7. Asia-Pac. J. Chem. Eng. 2009, 4, 649–653. [Google Scholar] [CrossRef]
- Wu, Z.; Cong, Y.; Zhou, M.; Tan, T. p-Nitrophenol abatement by the combination of electrocatalysis and activated carbon. Chem. Eng. J. 2005, 106, 83–90. [Google Scholar] [CrossRef]
- Ma, S.; Yao, J.; Gao, L.; Ma, X.; Zhao, Y. Experimental study on removals of SO2 and NOX using adsorption of activated carbon/microwave desorption. J. Air Waste Manag. Assoc. 2012, 62, 1012–1021. [Google Scholar] [CrossRef]
- Shi, S.; Hwang, J.-Y.; Li, X.; Sun, X.; Lee, B.I. Enhanced hydrogen sorption on carbonaceous sorbents under electric field. Int. J. Hydrogen Energy 2010, 35, 629–631. [Google Scholar] [CrossRef]
- Cab, C.; Medina-Esquivel, R.; Acosta, C.; Mendez-Gamboa, J.; Peñuñuri, F.; Tapia, A. Influence of Electric Field in the Adsorption of Atomic Hydrogen on Graphene. Adv. Condens. Matter Phys. 2015, 2015, 1–9. [Google Scholar] [CrossRef]
- Finamore, N.K.; Liu, C.; Mohanty, P.; Moore, D.T.; Landskron, K. Electric Field Swing Adsorption for Carbon Capture Applications. 2011. Available online: https://www.arpa-e.energy.gov/sites/default/files/documents/files/CO2_Workshop_Lehigh.pdf (accessed on 18 March 2019).
- Ho, Y.S.; McKay, G. A comparison of chemisorption kinetic models applied to pollutant removal on various sorbents. Process Saf. Environ. Prot. 1998, 76, 332–340. [Google Scholar] [CrossRef]
- Lagergren, S. Zur theorie der sogenannten adsorption geloster stoffe (About the theory of so-called adsorption of soluble substances). K. Sven. Vetenskapsakademiens. Handlingar 1898, 24, 1–39. [Google Scholar]
- Na, C.-J.; Yoo, M.-J.; Tsang, D.C.W.; Kim, H.W.; Kim, K.-H. High-performance materials for effective sorptive removal of formaldehyde in air. J. Hazard. Mater. 2019, 366, 452–465. [Google Scholar] [CrossRef]
- Raza, N.; Kim, K.H.; Agbe, H.; Kailasa, S.K.; Szulejko, J.E.; Brown, R.J.C. Recent advances in titania-based composites for photocatalytic degradation of indoor volatile organic compounds. Asian J. Atmos. Environ. 2017, 11, 217–234. [Google Scholar] [CrossRef]
- Boehm, H.-P.; Diehl, E.; Heck, W.; Sappok, R. Surface Oxides of Carbon. Angew. Chem. Int. Ed. Engl. 1964, 3, 669–677. [Google Scholar] [CrossRef]
- Kim, Y.S.; Yang, S.J.; Lim, H.J.; Kim, T.; Park, C.R. A simple method for determining the neutralization point in Boehm titration regardless of the CO2 effect. Carbon N. Y. 2012, 50, 3315–3323. [Google Scholar] [CrossRef]
- You, J.H.; Chiang, H.L.; Chiang, P.C. Comparison of adsorption characteristics for VOCs on activated carbon and oxidized activated carbon. Environ. Prog. 1994, 13, 31–36. [Google Scholar] [CrossRef]
- Lee, S.-W.; Cheon, J.-K.; Park, H.-J.; Lee, M.-G. Adsorption characteristics of binary vapors among acetone, MEK, benzene, and toluene. Korean J. Chem. Eng. 2008, 25, 1154–1159. [Google Scholar] [CrossRef]
- Srinivasan, N.R.; Shankar, P.A.; Bandyopadhyaya, R. Plasma treated activated carbon impregnated with silver nanoparticles for improved antibacterial effect in water disinfection. Carbon N. Y. 2013, 57, 1–10. [Google Scholar] [CrossRef]
- Barkauskas, J.; Dervinyte, M. An investigation of the functional groups on the surface of activated carbons. J. Serbian Chem. Soc. 2004, 69, 363–375. [Google Scholar] [CrossRef]
- Ferrari, A.C.; Robertson, J.; Ferrari, O.; Robertson, J.O.H.N. Raman spectroscopy of amorphous, nanostructured, diamond-like carbon, and nanodiamond. Philos. Trans. A Math. Phys. Eng. Sci. 2004, 15, 2477–2512. [Google Scholar] [CrossRef]
- Lota, G.; Krawczyk, P.; Lota, K.; Sierczyńska, A.; Kolanowski, Ł.; Baraniak, M.; Buchwald, T. The application of activated carbon modified by ozone treatment for energy storage. J. Solid State Electrochem. 2016, 20, 2857–2864. [Google Scholar] [CrossRef]
- McNaught, A.D.; Wilkinson, A. IUPAC. Compendium of Chemical Terminology, 2nd ed. (the “Gold Book”), 2nd ed.; Blackwell Scientific Publications: Oxford, UK, 1997; ISBN 0-9678550-9-8. [Google Scholar]
- Bogaard, M.P.; Orr, B.J. Electric Dipole Polarizabilities of Atoms and Molecules. MTP Int. Rev. Sci. Phys. Chem. 1975, 2, 149–194. [Google Scholar]
- Oura, K.; Katayama, M.; Zotov, A.V.; Lifshits, V.G.; Saranin, A.A. Surface Science; Advanced Texts in Physics; Springer Berlin Heidelberg: Berlin/Heidelberg, Germany, 2003; ISBN 978-3-642-05606-2. [Google Scholar]
- Pierpaoli, M.; Lewkowicz, A.; Ficek, M.; Ruello, M.L.; Bogdanowicz, R. Preparation and characterization of TiO2/carbon nanowall composite on a transparent substrate. Photonics Lett. Pol. 2018, 10, 54–56. [Google Scholar] [CrossRef]
- Pierpaoli, M.; Ficek, M.; Rycewicz, M.; Sawczak, M.; Karczewski, J.; Ruello, M.; Bogdanowicz, R. Tailoring Electro/Optical Properties of Transparent Boron-Doped Carbon Nanowalls Grown on Quartz. Materials 2019, 12, 547. [Google Scholar] [CrossRef]


| Term | Definition |
|---|---|
| Adsorptive | The adsorbable substance in the fluid phase |
| Adsorbent | Solid on which adsorption occurs |
| Adsorbate | The substance in the adsorbed state |
| Adsorption | The increase of the concentration of species in the vicinity of an interface |
| Chemisorption | Adsorption involving chemical bonding |
| Physisorption | Adsorption without chemical bonding |
| Adsorption from Gas-Phase | Electrosorption | |
|---|---|---|
| Adsorbent surface | Bare | Solvated |
| The standard free energy of adsorption | Higher | Lower |
| Potential difference at the interface | Is constant | Can be varied |
| Adsorbent | - | Electrically conductive |
| Solute | - | Electrically conductive |
| Objective | Coupled Process | Ads | Main Findings | Author | Ref |
|---|---|---|---|---|---|
| Regeneration of GAC exhausted with acid orange 7 | Adsorption/ DBD plasma | AC | A decrease in the AC surface area O2 is favorable for the regeneration of AC | Qu et al. 2008 | [37] |
| p-nitrophenol degradation | Electrocatalysis/ adsorption | AC | Formation of AC microelectrodes under the EF AC acted not only as an adsorbent but also as a catalyst Partial electrochemical regeneration of AC adsorption capacity | Wu et al. 2004 | [38] |
| SO2 and NO adsorption and degradation | Adsorption/ microwave irradiation | AC | SO2 and NO are desorbed from AC under microwave heating SO2 and NO under microwave irradiating over AC are decomposed AC is regenerated | Ma et al. 2012 | [39] |
| The effect of an applied electric field on hydrogen physisorption | Electric field/ Adsorption | AC | Application of EF to enhance hydrogen adsorption The enhancement is distinctive on Pt-supported carbon samples. No enhancement for the carbon samples only Effect due to stronger interaction between electrical charges in AC and the dissociated hydrogen | Shi et al. 2010 | [40] |
| The effect of an applied electric field on hydrogen adsorption | Electric field/ Adsorption | G | A linear relationship between the EF intensities and chemisorption energies The chemisorption energy values increased with the EF The chemisorption bond distance did not show a significant change with the EF intensity | Cab et al. 2015 | [41] |
| Electric Field Swing Adsorption for CO2 capture | Electric field/ Adsorption | AC | EF creates favored adsorption sites Negative charges serve as electron donating centers on sorbent surface, driving the formation of dative bonds by supplying electron density to Lewis acid center | Finamore et al. 2011 | [42] |
| Parameter | Value |
|---|---|
| Specific weight | 280 g/m2 |
| Thickness | 13 mm |
| Average particle diameter | 352 µm |
| Carbon content (w/w%) | 44% |
| Carbon BET surface area | 400 m2/g |
| Applied Potential | C0 MEK | K | qe | R2 | PC * |
|---|---|---|---|---|---|
| kV | mg m−3 | min−1 | mg m−2 | mol m−2 Pa−1 | |
| 0 | 710 | 0.11 | 1579 | 0.9997 | 0.097 |
| 0 | 2150 | 0.17 | 4673 | 0.9956 | 0.095 |
| 0 | 7100 | 0.09 | 15820 | 0.9966 | 0.097 |
| 3 | 710 | 0.18 | 1544 | 0.9833 | 0.096 |
| 3 | 2150 | 0.11 | 4638 | 0.9933 | 0.095 |
| 3 | 7100 | 0.15 | 15,330 | 0.9947 | 0.094 |
| 7 | 710 | 0.20 | 1568 | 0.9997 | 0.096 |
| 7 | 2150 | 0.16 | 4711 | 0.9976 | 0.096 |
| 7 | 7100 | 0.19 | 15,720 | 0.9941 | 0.096 |
| Amount [mmol g−1] | |||
|---|---|---|---|
| Functional Group | 0 kV | 3 kV | 7 kV |
| Carboxylic | 0.0 | 22.8 | 14.5 |
| Lactonic | 0.0 | 2.3 | 11.8 |
| Phenolic | 51.0 | 47.3 | 60.6 |
| Total acidic groups | 51.0 | 72.3 | 86.9 |
| D Band | G Band | ID/IG | |||||
|---|---|---|---|---|---|---|---|
| Peak Center | FWHM | Height | Peak Center | FWHM | Height | ||
| 0 kV | 1345 | 199 | 1.58 | 1601 | 81 | 1.15 | 3.40 |
| 7 kV | 1348 | 184 | 1.60 | 1611 | 75 | 1.17 | 3.32 |
| u (m/s) | α | V0 (kV) | R2 |
|---|---|---|---|
| 0.00 | 0.19 | 3.84 | 0.9447 |
| 0.10 | 0.20 | 4.21 | 0.9714 |
| 0.42 | 0.22 | 5.50 | 0.9946 |
© 2019 by the authors. Licensee MDPI, Basel, Switzerland. This article is an open access article distributed under the terms and conditions of the Creative Commons Attribution (CC BY) license (http://creativecommons.org/licenses/by/4.0/).
Share and Cite
Pierpaoli, M.; Fava, G.; Ruello, M.L. Electroadsorptive Removal of Gaseous Pollutants. Appl. Sci. 2019, 9, 1162. https://doi.org/10.3390/app9061162
Pierpaoli M, Fava G, Ruello ML. Electroadsorptive Removal of Gaseous Pollutants. Applied Sciences. 2019; 9(6):1162. https://doi.org/10.3390/app9061162
Chicago/Turabian StylePierpaoli, Mattia, Gabriele Fava, and Maria Letizia Ruello. 2019. "Electroadsorptive Removal of Gaseous Pollutants" Applied Sciences 9, no. 6: 1162. https://doi.org/10.3390/app9061162
APA StylePierpaoli, M., Fava, G., & Ruello, M. L. (2019). Electroadsorptive Removal of Gaseous Pollutants. Applied Sciences, 9(6), 1162. https://doi.org/10.3390/app9061162