Article

Blister Defect Detection Based on Convolutional Neural Network for Polymer Lithium-Ion Battery

1
School of Information Science and Engineering, Harbin Institute of Technology, Weihai 264209, China
2
Department of Civil Engineering, Harbin Institute of Technology, Weihai 264209, China
*
Authors to whom correspondence should be addressed.
Appl. Sci. 2019, 9(6), 1085; https://doi.org/10.3390/app9061085
Submission received: 25 January 2019 / Revised: 9 March 2019 / Accepted: 11 March 2019 / Published: 14 March 2019

Abstract

:
To ensure the quality and reliability of polymer lithium-ion battery (PLB), automatic blister defect detection instead of manual detection is developed in the production of PLB cell sheets. A convolutional neural network (CNN) based detection method is proposed to detect blister in cell sheets employing cell sheet images. An improved architecture for dense block and a learning method based on optimization of learning rate are discussed. The proposed method was superior to other machine learning based methods when the classification performance and confusion matrix were compared in experiments. The proposed CNN method had the best defect detection performance and real-time performance for industry field application.

1. Introduction

The application of lithium-ion batteries has changed consumer electronic products, which greatly reduce the weight and volume of mobile phones, notebooks, and other portable products. Lithium-ion batteries have been widely studied, including model, optimal design, and so on [1,2,3,4,5,6]. At present, the most commonly used lithium-ion battery is polymer lithium-ion battery (PLB). The cathode materials of PLB are commonly lithium cobalt acid, lithium manganese acid, ternary materials or lithium iron phosphate. The anode materials usually use carbon materials, such as artificial graphite, natural graphite, intermediate phase carbon microspheres, petcoke, carbon fiber, pyrolysis resin carbon and so on. C-rate is the measurement of the charge and discharge current with respect to its nominal capacity. At present, most PLB use polymer gel electrolyte instead of liquid electrolyte, which makes PLB have the advantages of thinning, arbitrary area and arbitrary shape. These characteristics improve the capacity of PLB, and PLB has the characteristics of miniaturization, thinning, and light quantification. PLB has been widely used in portable electronic equipment, and it is gradually being applied to more fields. With the application of PLB in more and more electronic products, the quality of PLB has more and more influence on the quality of electronic products. The quality of PLB is critical to the quality and reliability of electronic products.
Recently, an automatic line of PLB has been developed in Dongsheng Energy Corporation, Weihai, China. The PLB has a voltage of 48 V, a charging current of 2–3 A, and nominal capacity of 16 AH. The anode of PLB is a conductive high molecular polymer, the catrode is graphite, and a colloidal polymer electrolyte is used. During the production process of the PLB, several cathode pieces, anode pieces, and separator pieces are combined to produce a cell sheet. Great battery capacity can be provided with more cell sheets combined together. Thus, the quality inspection of cell sheets in automated production lines is essential to the quality of the final battery product. The cell sheet defect needs to be detected to ensure product quality. Blister is a kind of common defect in the grid net of cell sheet. There are two main reasons for blister. One is that the coating components do not mix properly with appropriate time to form a homogeneous slurry, and the other is that the feed rate is not appropriate [7]. Blister can damage the chemical properties of the battery and cause micro-short circuits. Blister seriously affects the safety, service life and other quality characteristics of PLB. The detection of blister in cell sheets is inefficient and laborsome when it is performed manually. Automated blister detection methods need to be developed.
Some automated defect detection methods for lithium-ion battery have been developed. For example, X-ray is used for electrode coating detection [8], computed tomography is employed to inspect defects and structural deformations [9], laser and thermography methods are used to detect battery electrodes [10], and thermography is used to detect defects [11,12]. Reconstruction of object surface is an important method for these detection methods [13]. Combining computer vision with senseless detection is also effective [14]. Currently, X-Ray, computed tomography, and thermography methods are mainly used for inner defect detection of lithium-ion battery and are not used for blister detection, which appears on the surface of PLB. Laser and vision inspection can be used for blister detection. This article uses vision inspection technology. Compared with laser, the main advantages of vision inspection are: First, the hardware cost of the device is low. Second, the speed is fast. Laser detection requires scanning the PLB surface line-by-line, while visual inspection can complete image capture at once.
Visual inspection is a fast, convenient and economical method for detecting surface defects. Compared with manual processing, vision inspection does not suffer from fatigue, emotion, repetitive work boredom and other factors leading to reduced detection efficiency. Due to its real-time and low-cost features, it is widely used in automated production lines and other fields [15,16,17,18]. Visual inspection has been considered for lithium-ion battery production recently employing industry camera and image processing technique [15,16,17]. These studies focus on applying traditional image processing method to the inspection of flaws, scratches, and defects in battery separator or electrode surface. Structured light is important for visual inspection, and a novel classifier subset selection for stacked generalization is reported in [19]. In these studies, feature extraction of defects or flaws is the key to successful detection.
Defect detection can be regarded as a classification problem of battery components. The battery components are classified into qualified and unqualified according to whether there are defects. Since machine learning methods have made great progress in classification problem and have produced many examples of successful applications, machine learning methods have also been used for defect detection for batteries. Some defect detection applications based on common machine learning algorithms have been developed. The neural network method is an early machine learning method. It is applied to Li-ion battery, defect diagnosis or evaluation of battery module state [20,21,22,23]. Support vector machine (SVM) is able to solve the nonlinear classification problem when the number of samples in the training dataset is small. SVM is applied to the classification of post-weld defects for battery [24]. Another improved tensor based SVM method is used for bubble detection in cell sheets [25,26]. In these machine learning methods, the selected features determine the accuracy of the classification [27,28]. These features are selected by hand, and how to select these features is a difficult problem.
With the development of machine learning recently, deep learning technology has shown impressive results in image classification applications [29,30,31,32,33,34,35,36]. As a machine learning technology, deep learning simulates the human brain. It can automatically complete feature extraction, and the features can be employed for image classification with superior performance. As a widely used deep learning model, convolutional neural network (CNN) performs well in a variety of visual recognition tasks, especially in the field of image classification. CNN can automatically extract typical and representative features from the input image. CNN uses a hierarchical structure to gradually obtain the required advanced features from the low-level features, and then it uses these advanced features to complete image classification and other tasks. CNN has been used in defect detection of industry field. For example, CNN is employed to detect whether solders, chips or circuit boards have defects [37,38,39,40,41,42,43,44,45].
In this paper, a novel blister detection method based on CNN is proposed employing images of PLB sheets. The contribution of this paper includes two aspects. On the one hand, an improved CNN architecture with optimization based learning strategy is proposed. Trainable weight parameters are added to each skip connection to improve dense block. Optimization of the learning rate is used to improve the efficiency of training process. Experimental results indicate that the proposed CNN method is superior to other machine learning based methods for blister detection. On the other hand, this paper shows that deep learning based method has potential for defect detection application of PLB.
The rest of this paper is organized as follows. Blister defect detection for PLB and the proposed CNN method is described in Section 2. The experiments and performance evaluations are discussed in Section 3. Finally, this paper is concluded in Section 4.
The main abbreviations used in this paper are listed in Table 1. The main symbols used in this paper are listed in Table 2.

2. Blister Defect Detection for PLB Based on CNN
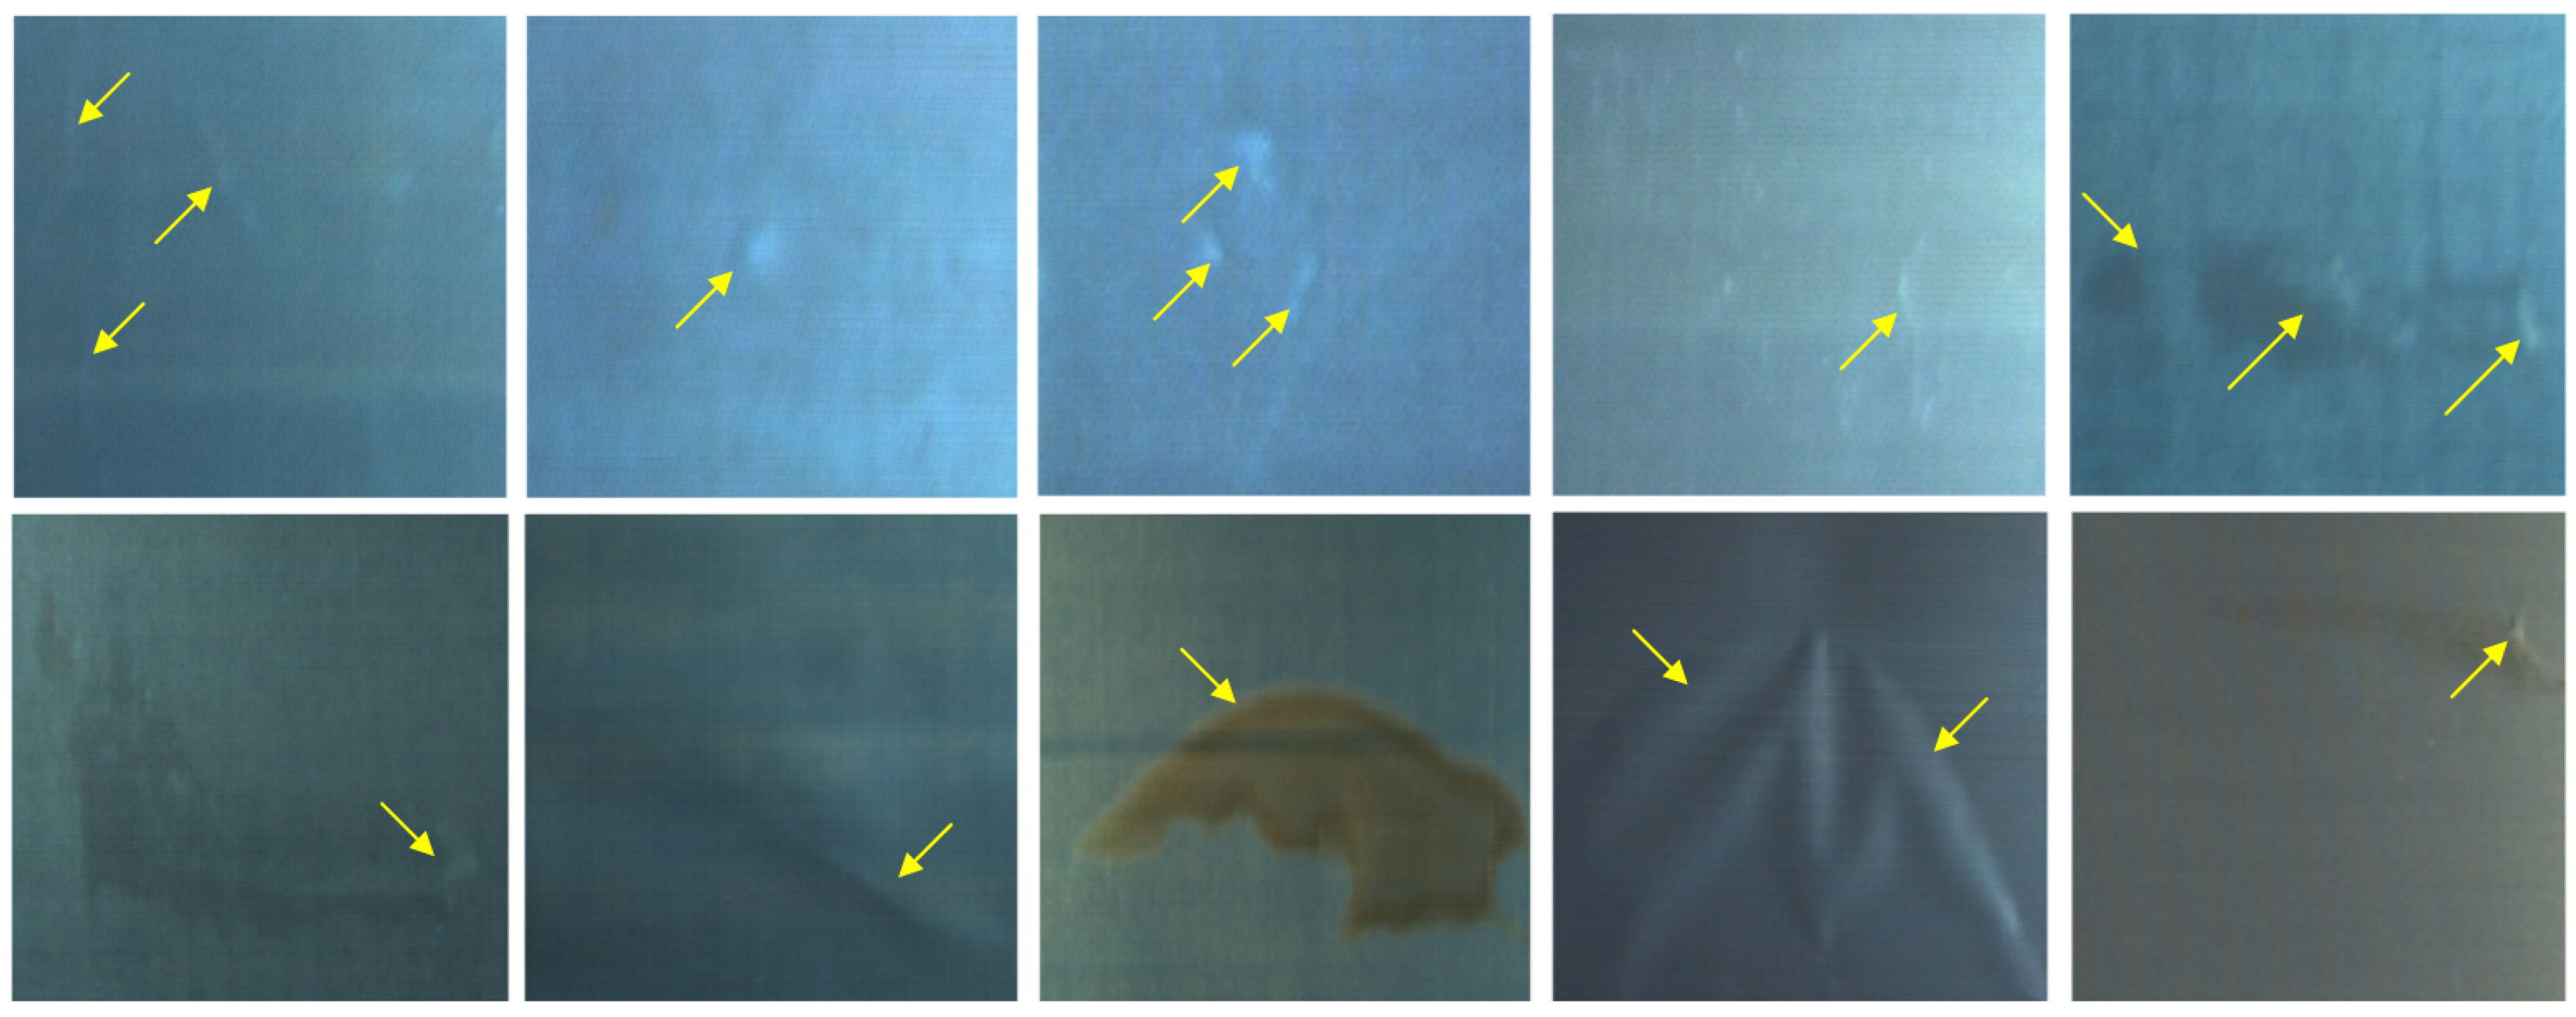
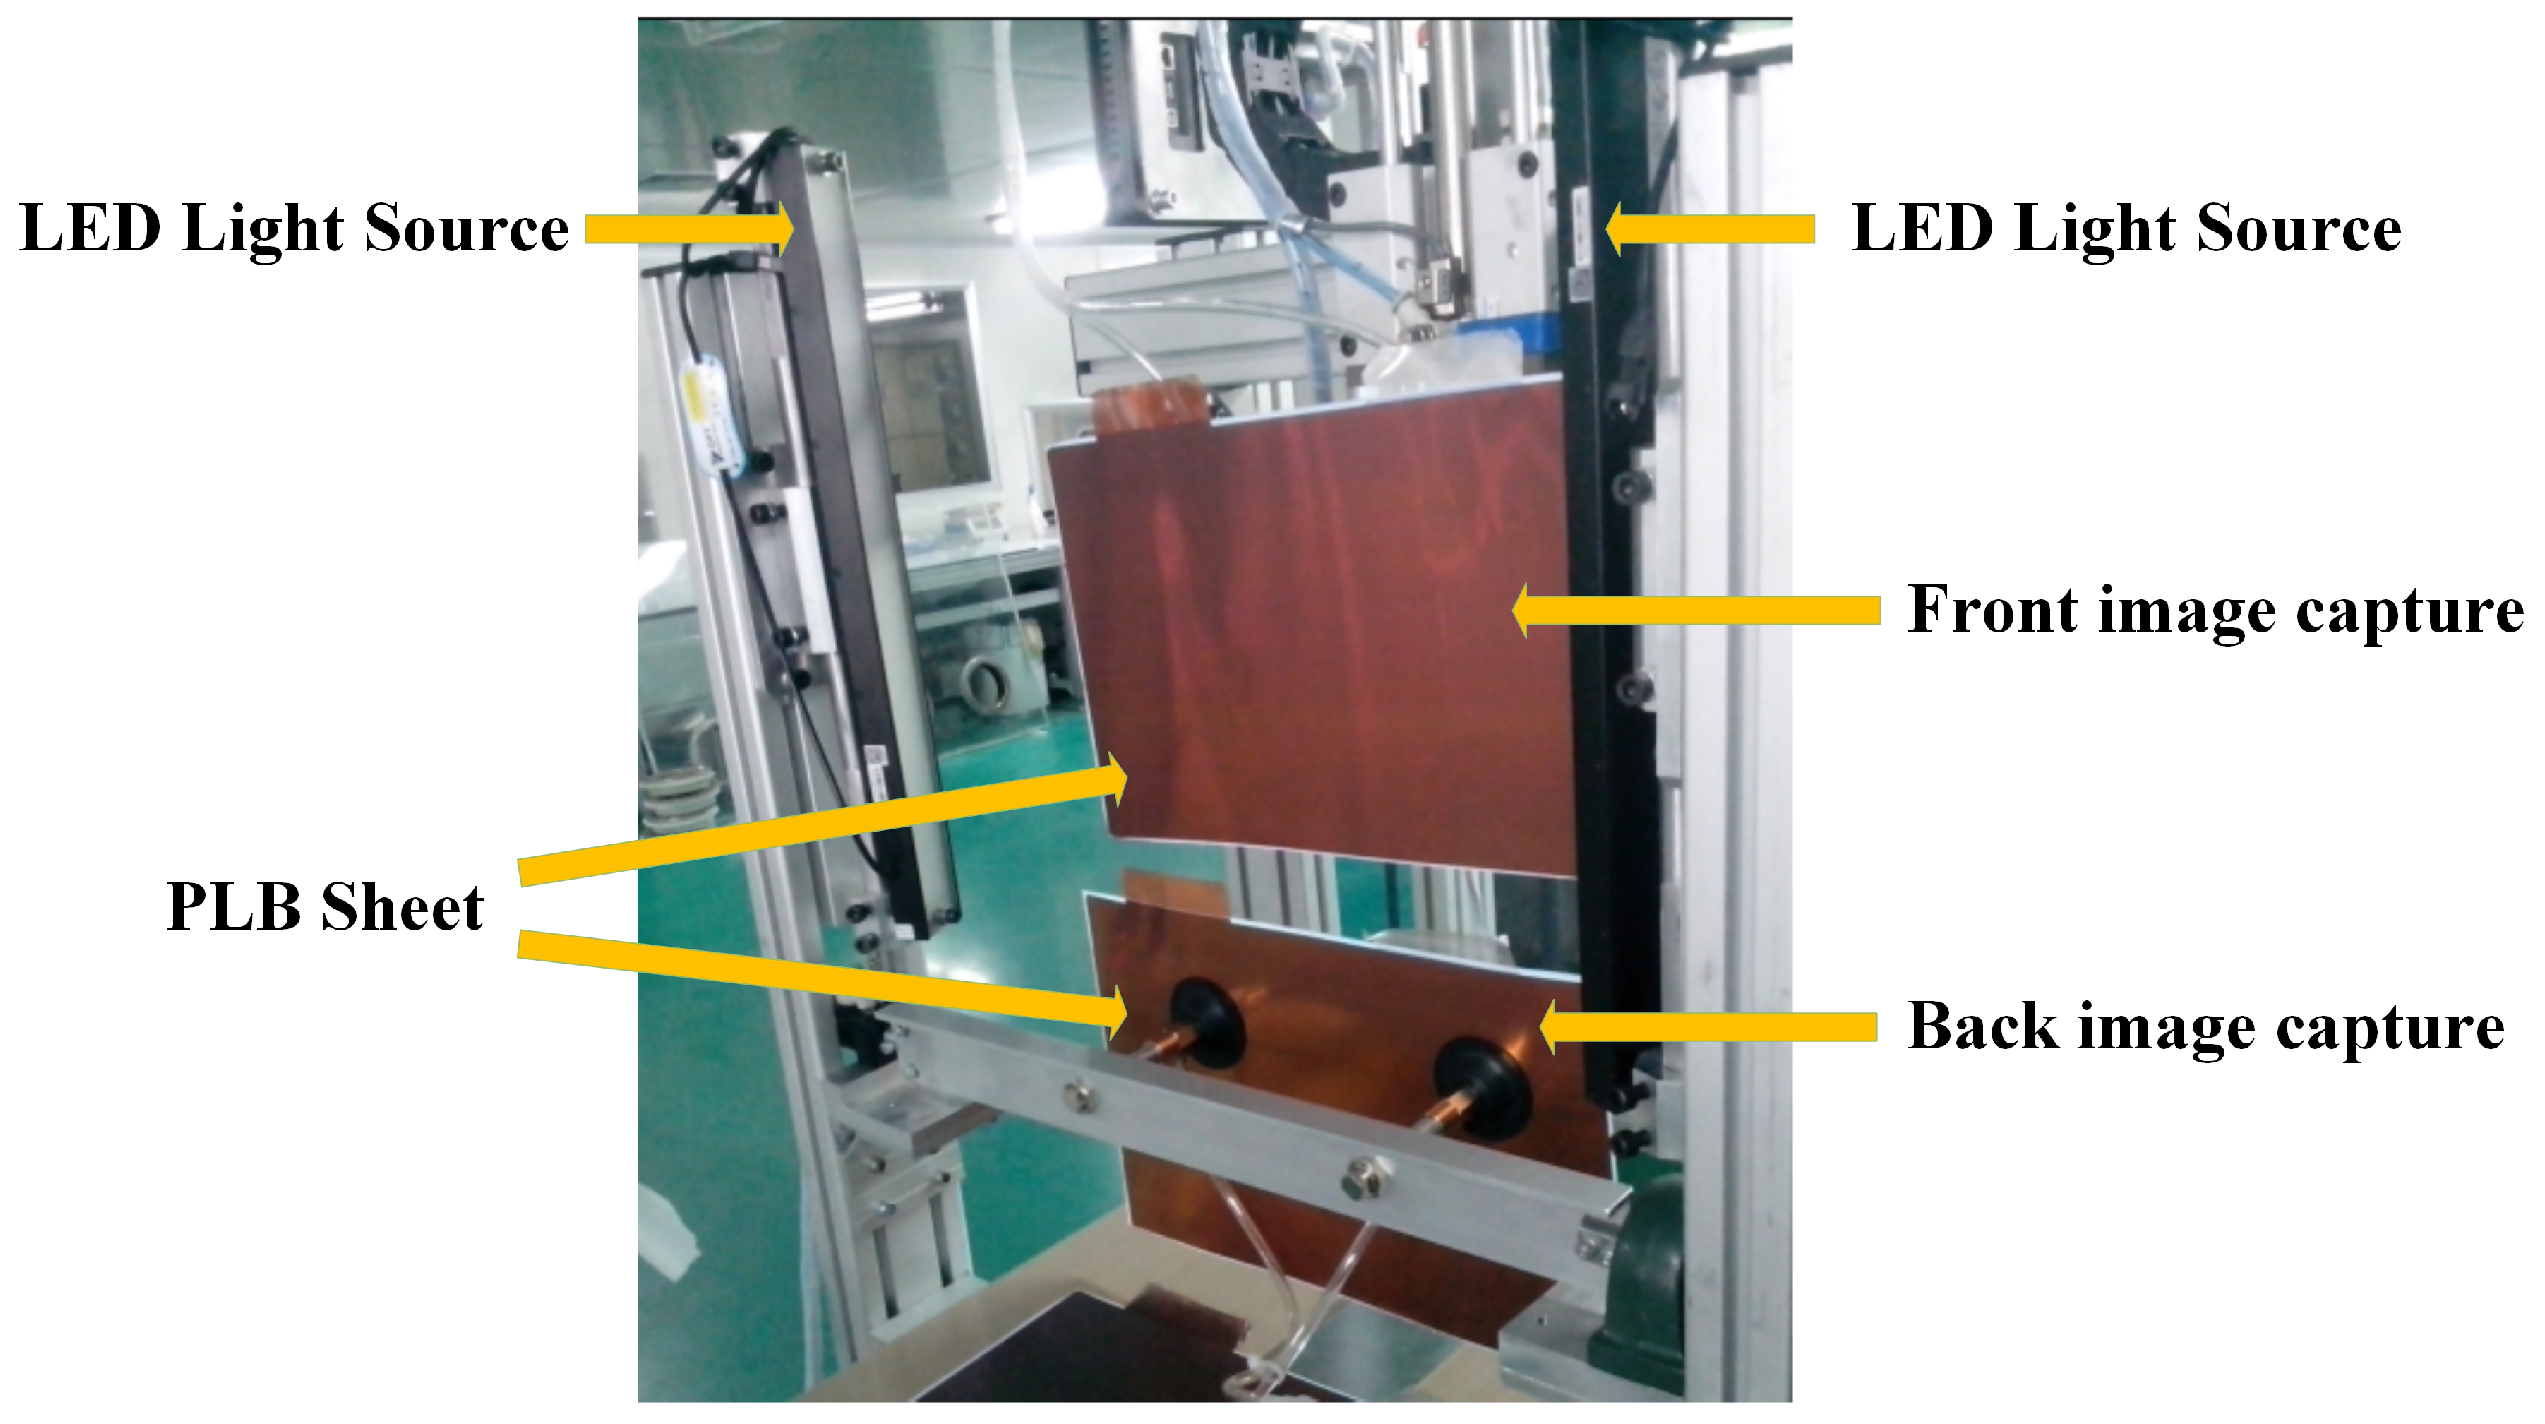
2.1. Data Capture

Visual inspection is employed to detect blister of sheet net of PLB. PLB sheet is controlled by the manipulator and images of both sides are captured. The field image acquisition in the automated production line is shown in Figure 1. The damages and scratches of PLB sheet are easy to be detected using traditional image processing methods. Due to the inconsistent background color, shape and size, blister defects cannot be well detected using the usual image processing method. The image of the PLB sheet is divided into multiple patch images, and each patch image is detected. Some images of blister defects are shown in Figure 2.

2.2. Detection Scheme Based on CNN

Blister defect detection problem of PLB is to judge whether PLB sheet has blister from images. It can be considered as an image classification problem. CNN method has achieved great success in the image classification applications. In this paper, an optimization based CNN method is proposed to detect blister defect of PLB sheet.
As an important deep learning model, CNN uses an architecture of multi-layer stack. Each layer in the stack can be considered an input-to-output conversion that is used to achieve selective extraction of image feature representations. CNN learns the mapping relationship between a large number of input samples and outputs with a combination of input layer, convolution layer, ReLU layer, pooling layer and fully connected layer. Input layer completes image preprocessing. The convolution layer implements the perception of local feature information of the image. These local information will be combined at a higher level to get global information. The convolution layer also greatly reduces the amount of computation through parameter sharing, and it extracts different features by employing multiple kernels. ReLU layer performs a nonlinear mapping of the output of convolutional layer. The pooling layer is used in the middle of a continuous convolutional layer to reduce overfitting and compress the amount of data and parameters. Fully connected layer is used to achieve the final classification using the advanced features extracted from the previous layers. The major feature of CNN is the shared convolution kernel, which works well for high-dimensional data processing. Another feature is that it is not necessary to manually select features and train weights.
Thus far, many successful architectures have been proposed for CNN, which include DenseNet [46], ResNet [47], VGG16, RCNN, etc., and some of them have been applied to defect detection [37,38,39,40,41,42,43,44,45]. VGG16 architecture is employed for pavement crack detection in [43]. Single shot multibox detector network is adopted to detect surface defects of container [44]. RCNN architecture is used for polymeric polarizer detection of liquid crystal display panel [45].
In this paper, an efficient CNN based detection method is provided for blister detection in PLB sheets. The experimental results indicate that the proposed method is superior to other machine learning based methods.

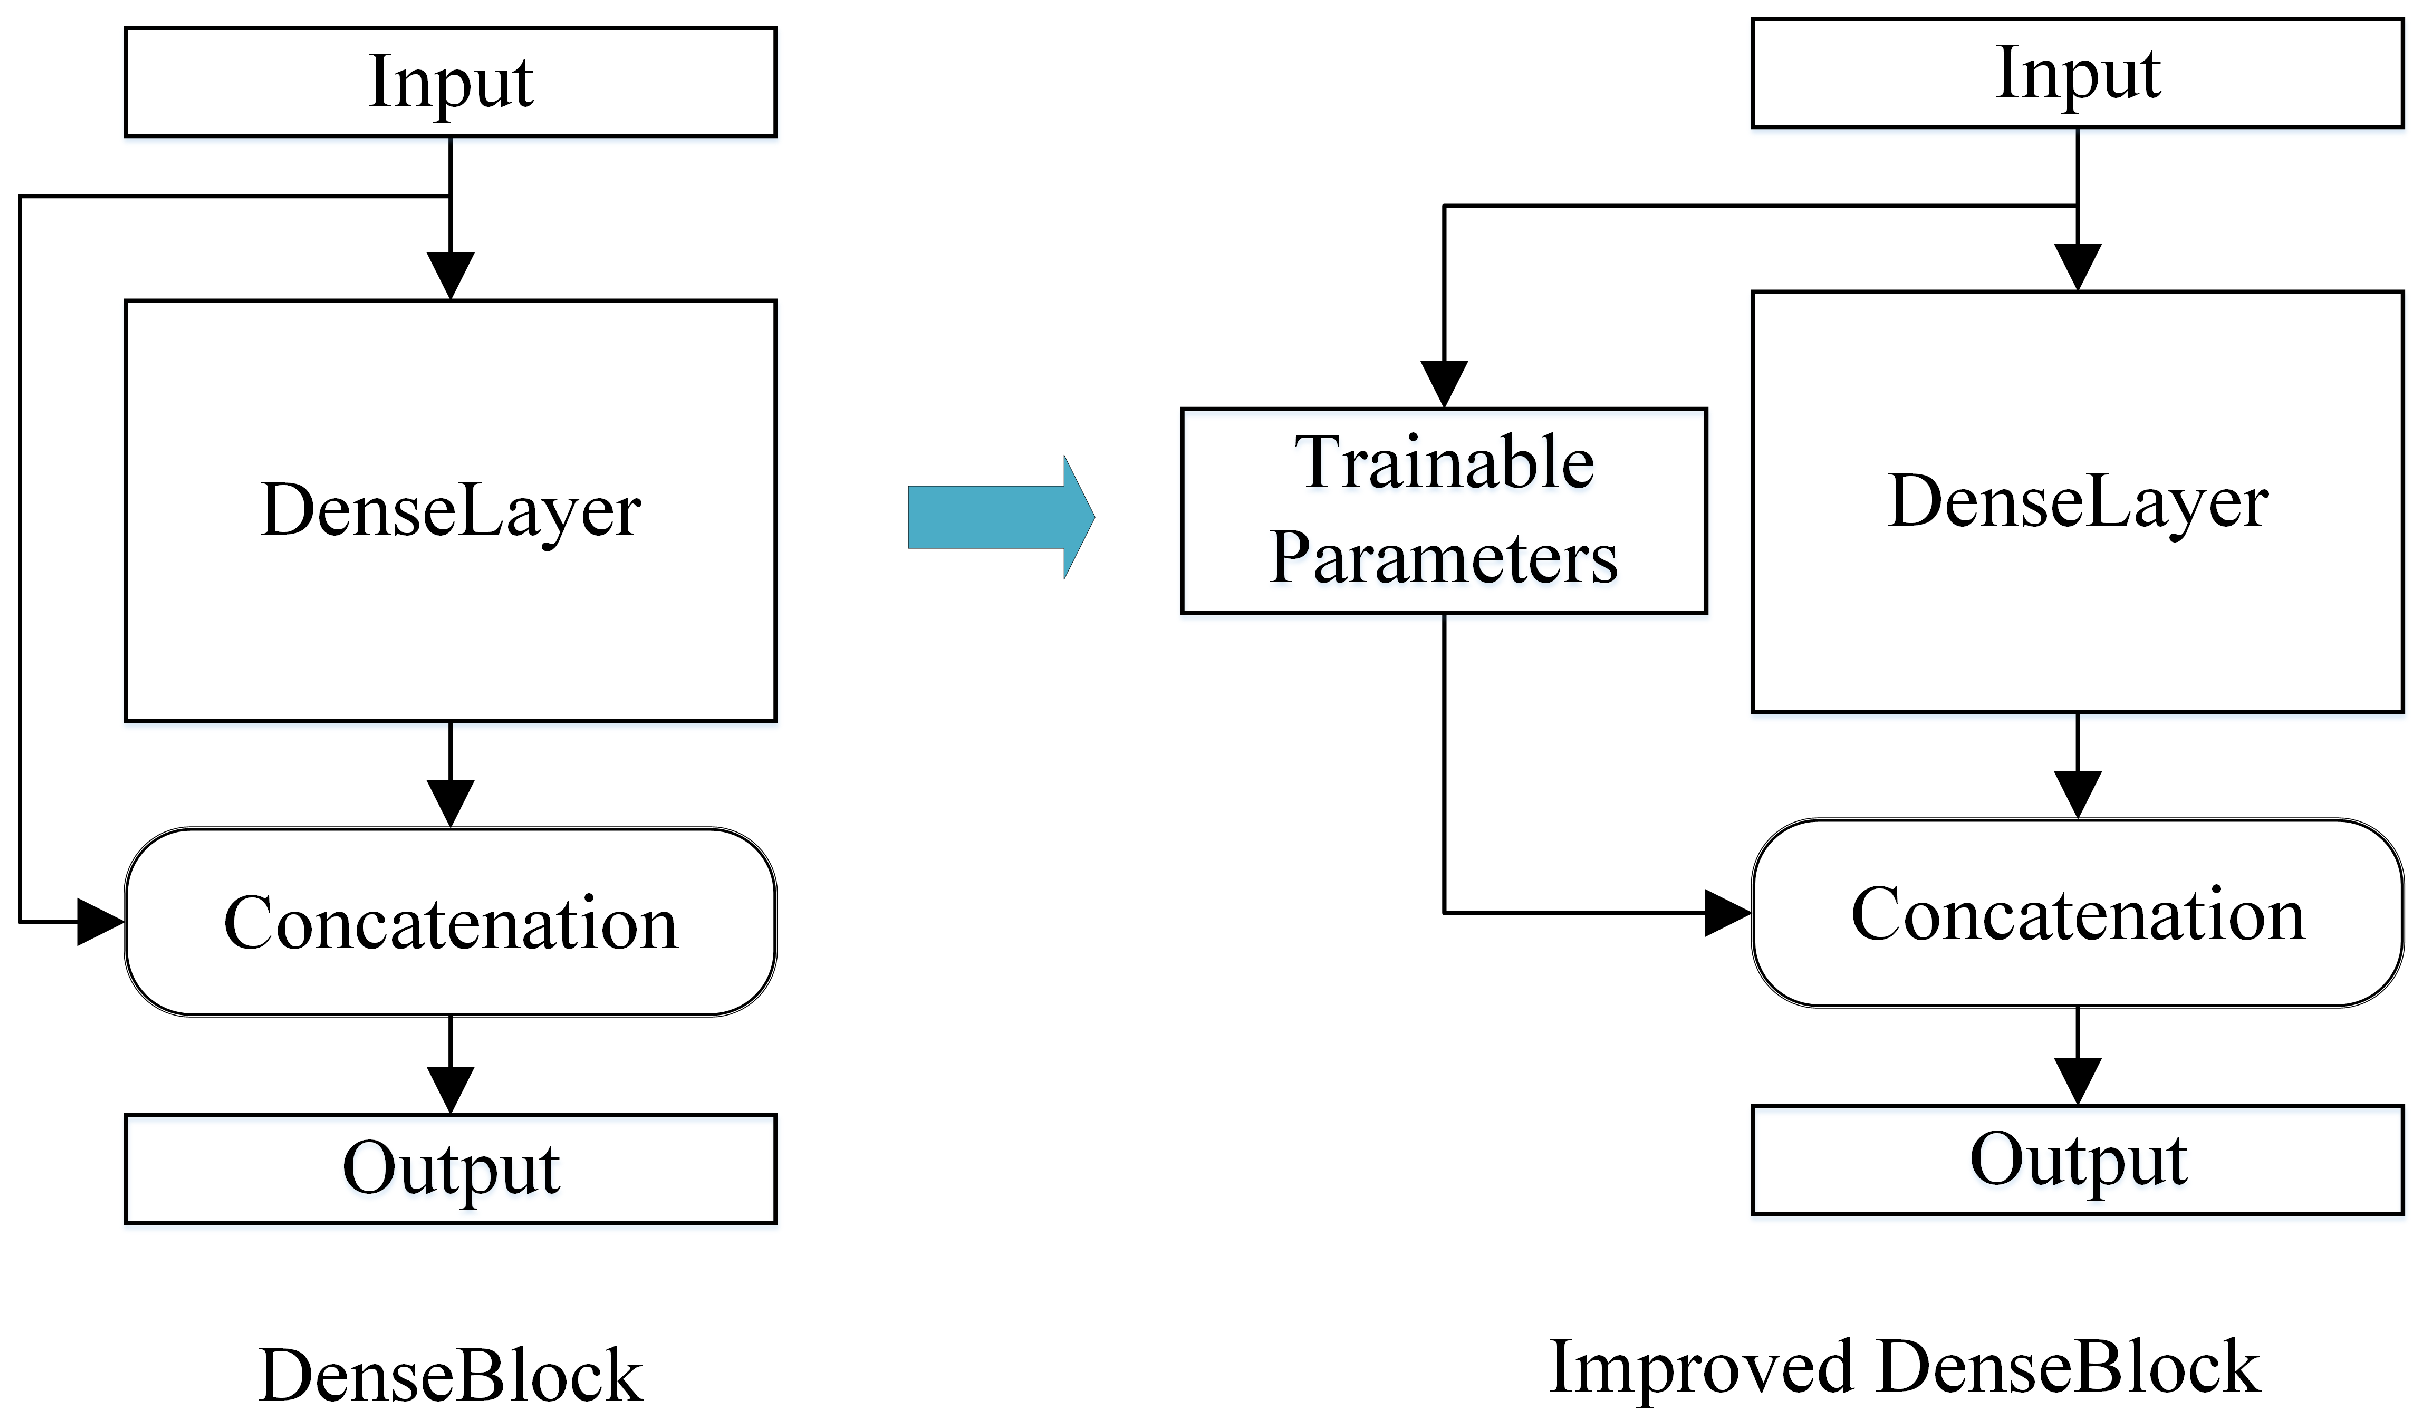
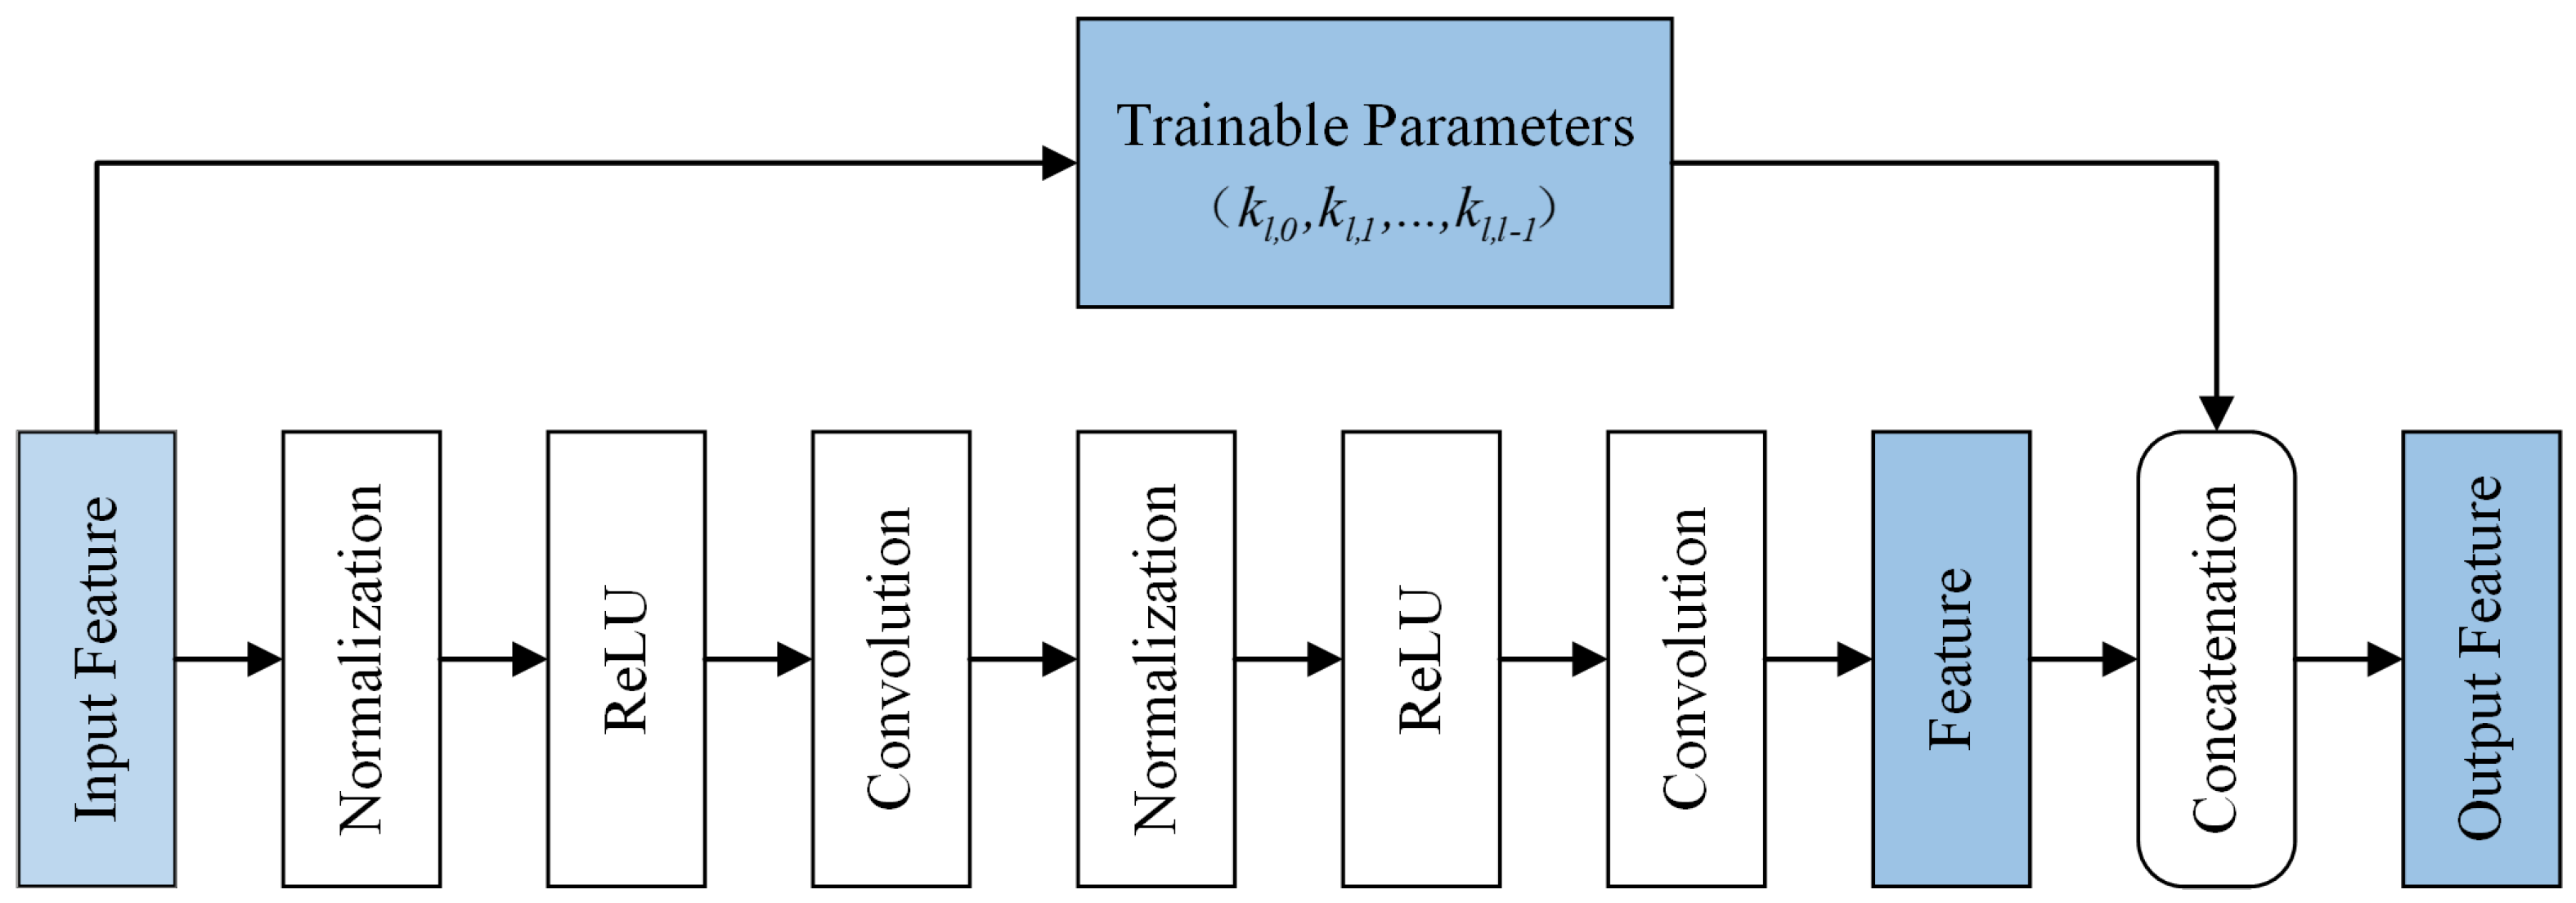
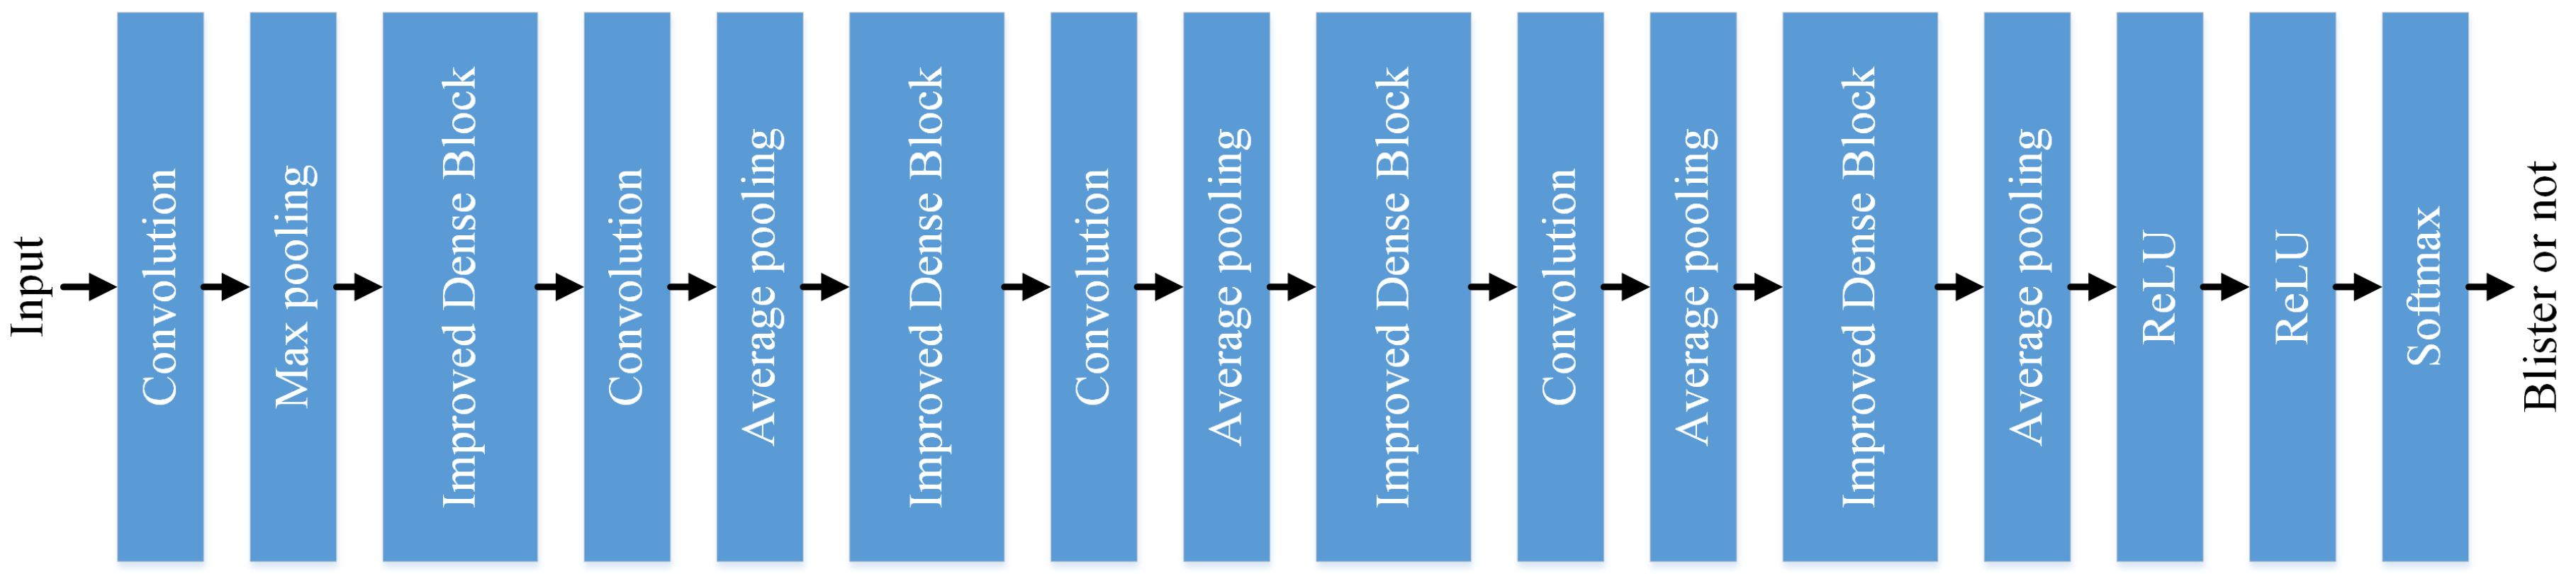
2.3. Improved Architecture for CNN

In the deep learning approach, deeper networks are used to accomplish complex tasks. The learning process of the neural network adopts the strategy of backpropagation, that is, the error calculated by the loss function is used to guide the update and optimization of the weights of the deep network through the backpropagation of the gradient. The deep neural network is composed of many nonlinear layers, and each nonlinear layer can be regarded as a nonlinear function. Therefore, the entire deep network can be regarded as a composite nonlinear function. The purpose of neural network learning is to make this nonlinear function perform a good mapping between input and output. To find the optimal solution of different input and output, the learning process is to find the appropriate depth network weights so that the loss function takes a minimum value. The gradient descent method is used to solve this minimum problem. Its idea is to take the negative direction of the current gradient as the search direction, and adjust the weights to make the loss function approach the local minimum, that is, let the loss function become smaller and smaller.
In backpropagation, the gradient is updated layer by layer. The gradient update can be seen as multiplying the output of the upper layer network nonlinear function by a factor. If the factor is less than 1, as the number of layers increases, the gradient update will decay exponentially and become smaller and smaller, gradually disappearing. This is called the gradient vanishment; it causes poor learning and training effect. To solve the gradient vanishment problem, short paths are often created from early layers to later layers in CNN architecture.
DenseNet is an efficient architecture of CNN for image classification. In DenseNet, all layers are connected directly to ensure maximum information transmission to solve the gradient vanishment problem. DenseNet uses dense block to create short paths from early layers to later layers. Dense block uses skip connections not only to connect the upper and lower layers, but also to achieve cross-layer connections. The gradients obtained from each layer are derived from the gradient concatenation of the preceding layers. Because the gradient transfers directly between layers, the effect of gradient vanishment is reduced. This kind of architecture also strengthens the transmission and usage of features.
Denote the input and output of the dth layer as x d and y d , respectively, then
y d = F d ( [ x 0 , x 1 , , x d 1 ] , W d ) ,
where F d is a nonlinear transformation function, the symbol [ ] indicates the concatenation operation, and W d is the parameters of F d in the dth layer. In the dense block of DenseNet, previous layer features are skipped and connected with concatenation operation. That is to say, the features of different layers are treated in an equivalent manner in this architecture.
However, this is not the case in actual classification systems. Not all features of the previous layers play a key role in image classification. Only some of the key features are important for classification. Inspired by this, a novel weight-based architecture is proposed to improve the network performance of dense block. An improved dense block architecture is proposed in this paper, as shown in Figure 3. Its detailed architecture is shown in Figure 4. In this architecture, the output is
y d = F d ( [ x 0 k d , 0 , x 1 k d , 1 , , x d 1 k d , d 1 ] , W d ) ,
where k d , 0 , k d , 1 , , k d , d 1 are the parameters that determine the weights of x 0 , x 1 , , x d 1 to be concatenated together. These parameters are trained during the CNN training process. The whole CNN architecture proposed in this paper is illustrated in Figure 5.
In the above architecture, the weight parameters will be effectively trained in the training of CNN network. The weight parameters here have practical meanings for indicating how important the corresponding feature map is. The greater is the weight value, the more important is the role of the corresponding feature map in the classification task. That is, the corresponding features contain more useful information for classification. When the trainable weight parameters are introduced in our proposed architecture, the important features can be quickly found and efficiently represented for image classification.

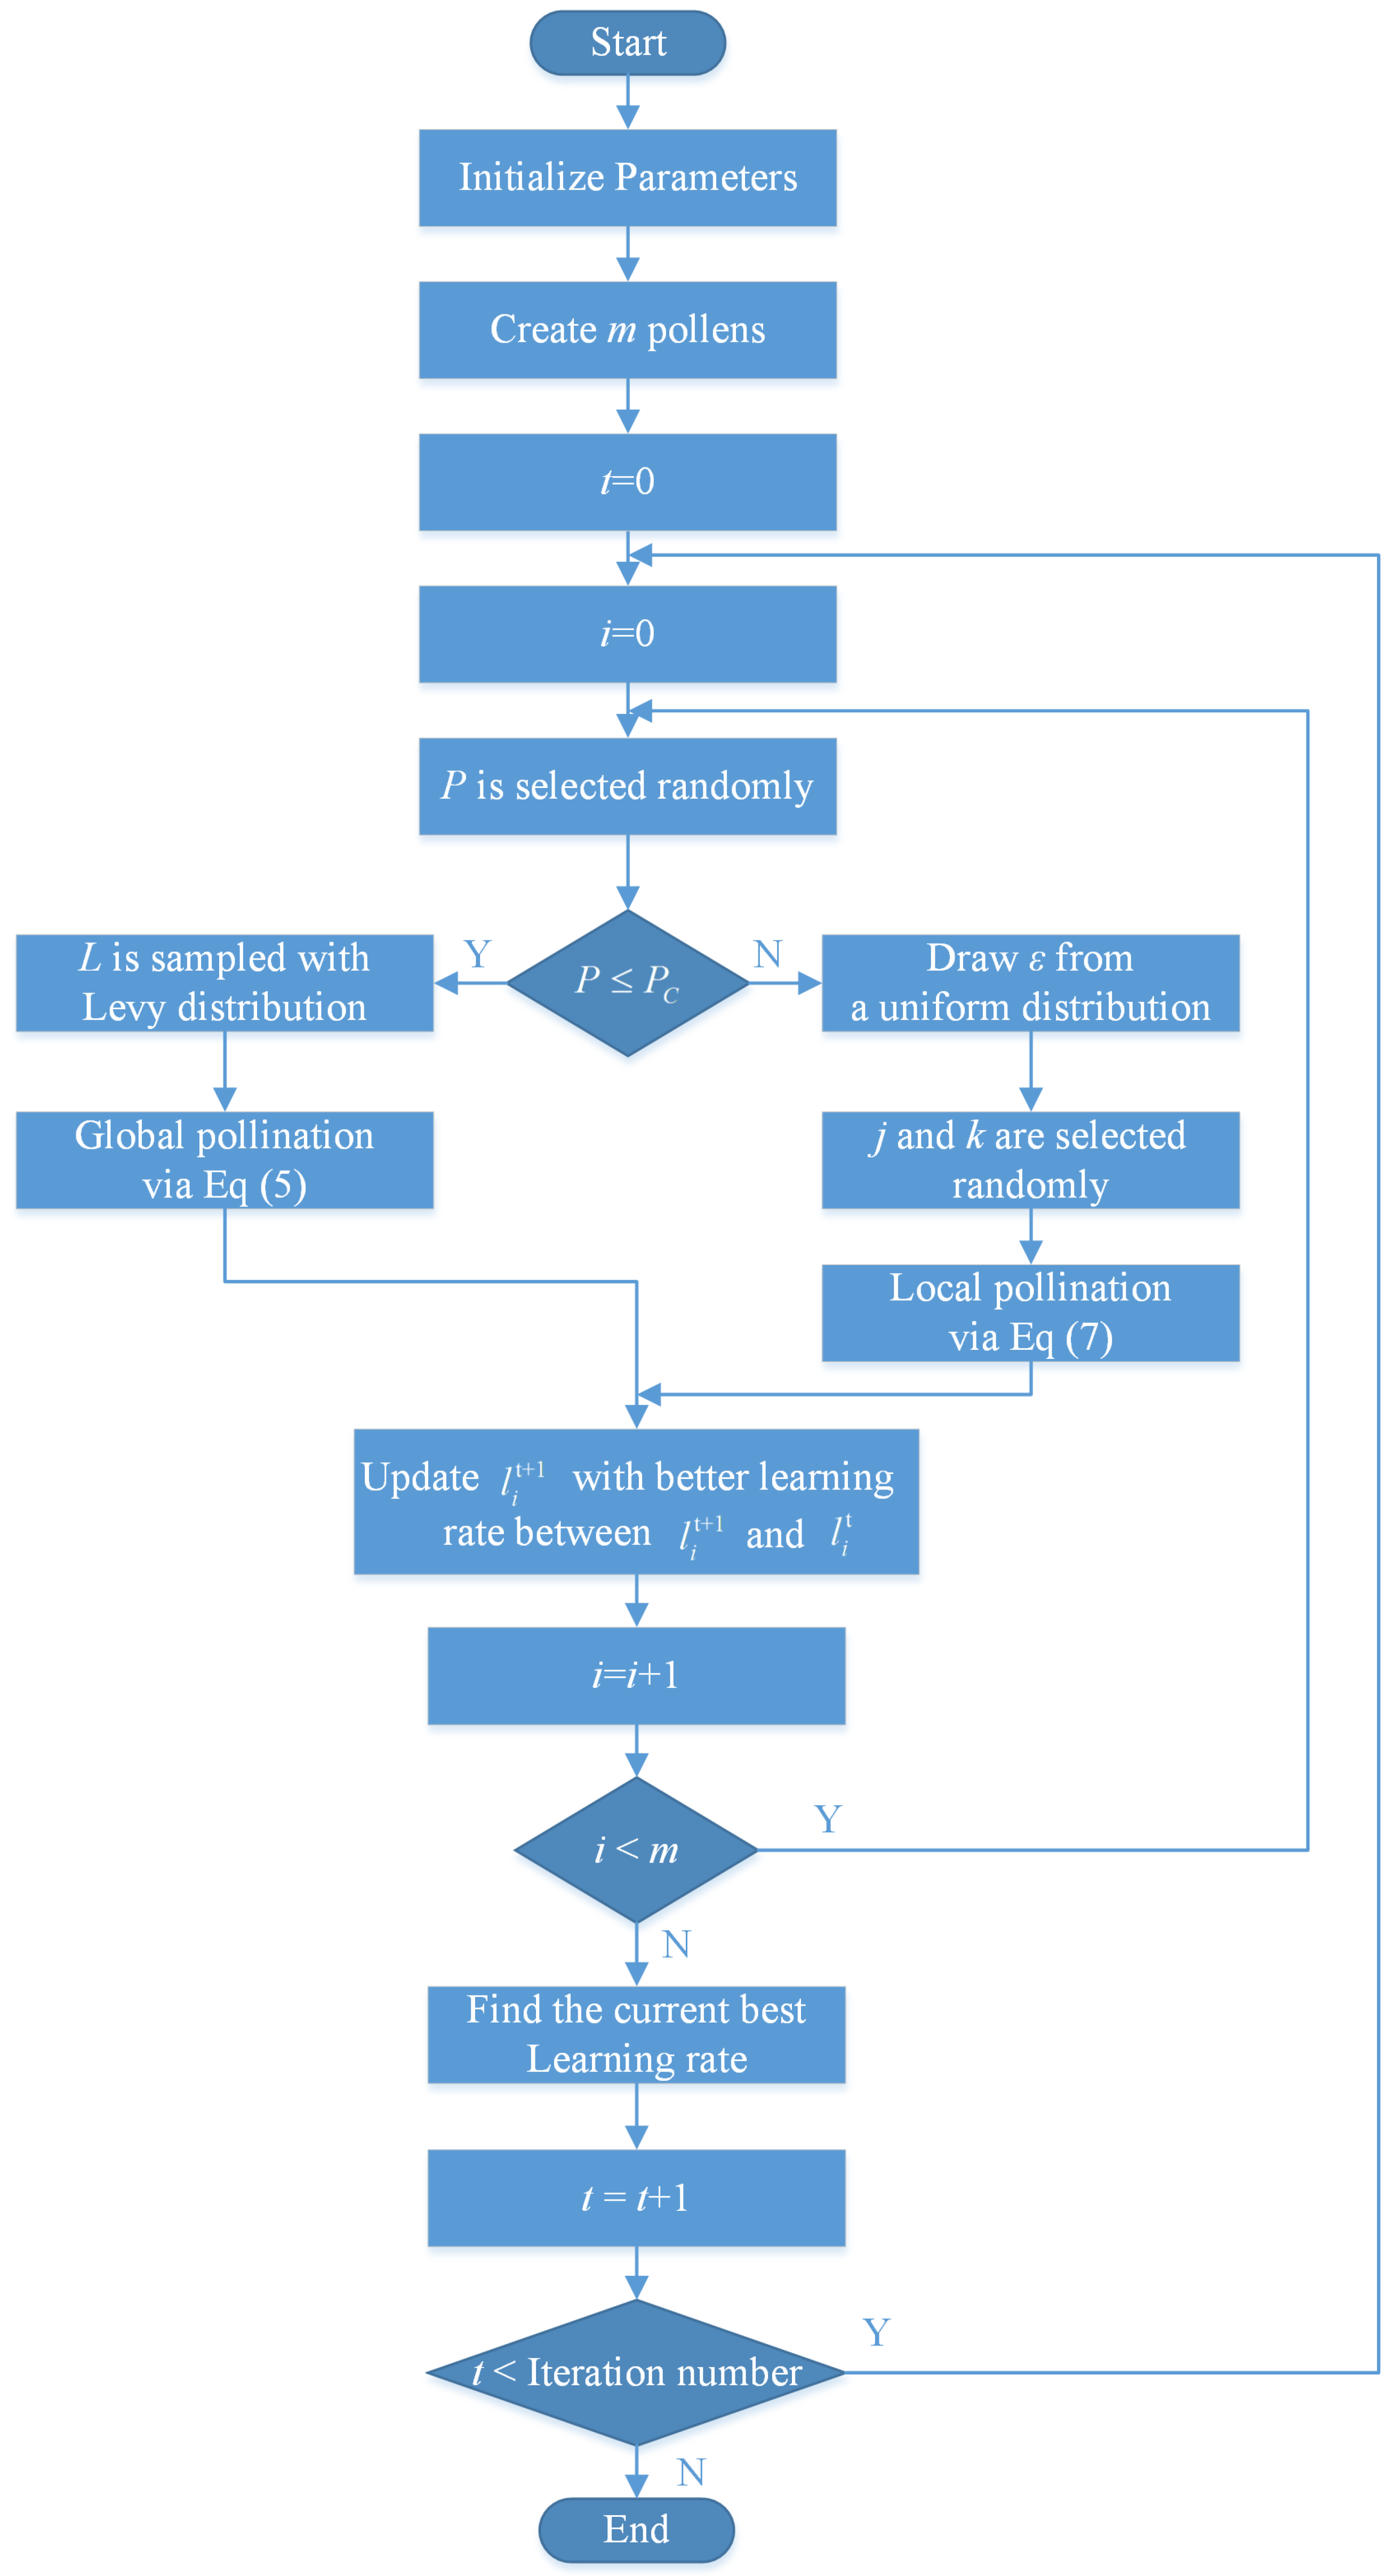
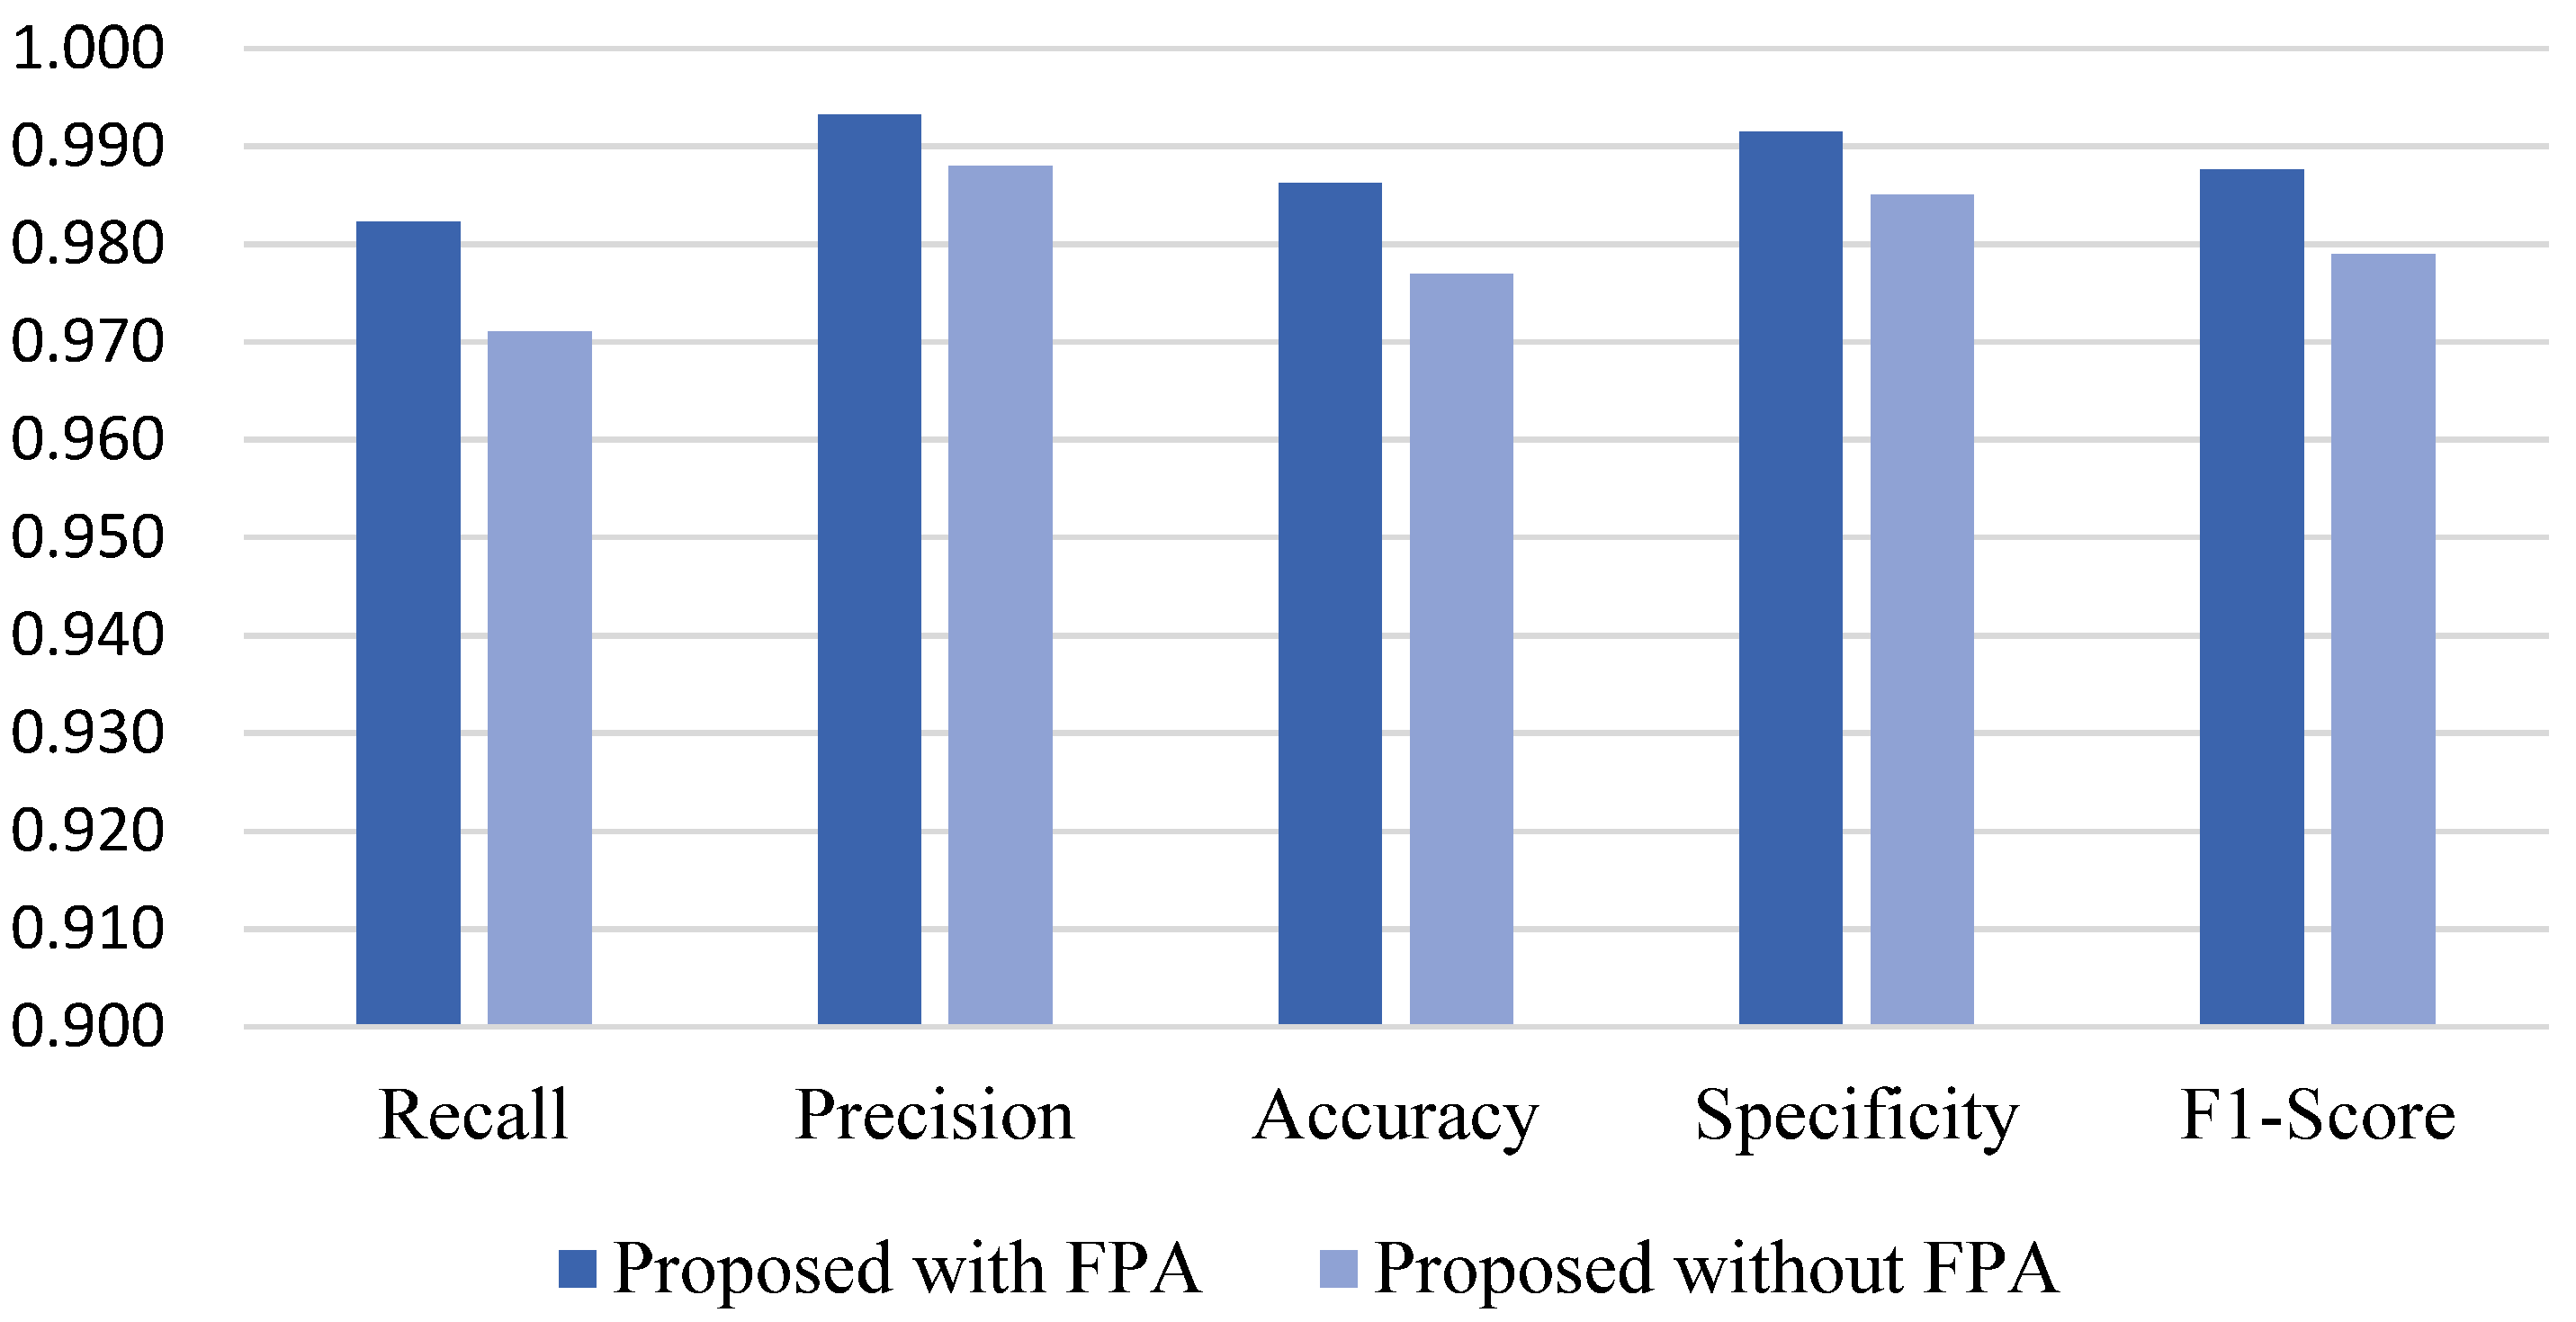
2.4. Training Method Based on Optimization of Learning Rate

Learning rate is an important super-parameter in CNN. How to adjust the learning rate is one of the key elements for training a good CNN model. When the learning rate is too large, the learning process becomes unstable, and small learning rate leads to extremely long training time. By properly setting the learning rate, it is possible to reasonably improve the training speed and reduce the training time while stabilizing the training.
When the number of samples is large, the calculation of gradient descent processing on the entire sample is slow and inefficient. The method of dividing the samples into mini-batch is usually used to increase the speed. Let x be the input of CNN network in mini-batch processing, w be the network parameter, l be the learning rate, and the output is
y = g ( x , w ) .
Using loss function can obtain the loss by comparing the output y with its label. The gradient is obtained with w = C / w . w is updated as
w t + 1 = w t l · w t ,
where t is the current iteration number.
In the process of above mini-batch-based learning, after the current mini-batch parameter w is updated, the processing and parameters of the next mini-batch data are continuously updated. However, the effect of parameter update for mini-batch learning has not been verified in this process. At the same time, the learning rate is usually manually selected based on experience, so it is likely that the calculation loss of the current mini-batch cannot be effectively reduced.
In this paper, a mechanism for optimizing the learning rate is provided. For each mini-batch, the optimal learning rate is found before the update formula (Equation (4)) is applied. Thus, the current mini-batch can reduce the loss function value. In other words, the original mini-batch does not guarantee that each update will be done in the direction of the correct gradient. The mechanism provided in this paper makes mini-batch update in the correct direction every time, which improves the efficiency of training and reduces the training time.
Flower pollination algorithm (FPA) is a new optimization algorithm of meta heuristic swarm intelligent. FPA is optimized by simulating the pollination process of flowering plants in nature. The pollination process includes two modes, self-pollination and cross-pollination, which represent local search and global search, respectively. Cross-pollination occurs between the pollens of different plants. Pollinators can fly for a long time and transmit pollen over a long distance. In contrast, self-pollination is the implantation of the same flower or different flowers of the same plant in the pollen, usually without pollinators. In the existing engineering applications, FPA shows the ability to search in the space with multiple local optima adaptively. FPA can avoid premature convergence, thus it has better performance.
FPA uses four rules as follows [48,49].
Rule 1. Biological biotic and cross-pollination is a process of global pollination by pollinators with pollen.
Rule 2. Biological abiotic and self-pollination is the process of local pollination.
Rule 3. Flower constancy. Plants and pollinators form a partnership to maximize the reproduction.
Rule 4. Switch probability controls the conversion between global pollination and local pollination.
FPA has achieved good results in solving multi-objective optimization problem and other application problems [50,51,52,53]. FPA has robust performance for applications. FPA has only few parameters. FPA is employed to find optimal learning rate in this paper.
FPA simulates two kinds of pollination, which are cross-pollination and self-pollination. Each flower in FPA is regarded as a solution to the destination function. Cross-pollination or self-pollination is selected by a flower to reproduce. This choice is selected by switch probability, the probability of choosing cross-pollination is P C , and the probability of choosing self-pollination is 1 P C . Cross-pollination operations draw on the cross-pollination method of different flowers by bees and butterflies at a long distance. The flight of pollinators is regarded as Levy flight, so the global pollination is modeled using a Levy distribution. Similarly, self-pollination models near-distance pollination in nature.
The optimal learning rate for CNN training is found in this paper employing FPA, and the main steps are summarized as below.
Step 1. Initialize parameters. The initial parameters include: maximum iteration number N, total pollen number m, and probability P C . The learning rate is the pollen in FPA model. It conforms to the standard distribution and takes values in the range of [ l m i n , l m a x ] . m learning rates are created, which are listed as l 1 , l 2 , , l m .
Step 2. FPA operation. Probability P is chosen randomly.
When P P C , the current learning rate l i is updated as below to simulate cross-pollination
l i t + 1 l i t + γ · L · ( l b e s t t l i t ) ,
where l b e s t is the optimal learning rate solution in the global. γ is the scaling factor; its value is suggested to be in the range of (0,10) in previous studies [49]. It was found that the best result can be obtained when it is set to 0.1 in this application. Thus, it was set to 0.1 in this study. L can be drawn from Levy distribution as
L λ Γ ( λ ) s i n ( π λ / 2 ) π 1 s 1 + λ ,
where Γ ( λ ) is a standard gamma function, s is step, and λ was set to 1.5 in this study as recommended [49].
When P > P C , the current learning rate l i is updated as below to simulate self-pollination operation
l i t + 1 l i t + ε · ( l u t l v t ) ,
where ε is drawn from the uniform distribution of [ 0 , 1 ] , l u and l v are two randomly pollens, which represent learning rates, and 1 u , v m . The implementation flow chart of FPA is illustrated in Figure 6. Previous studies have suggested that the range of P c is [0.1, 0.9], and the recommended value is 0.8 [54]. In the FPA implementation of this study, P c was set to 0.8.

2.5. Dataset and Training

Some images of both sides of PLB sheets were captured in the automatic line. The size of the PLB image obtained from the camera was 2448 × 2048. The size of the input image in the CNN method was 219 × 219. We cut the polar area in each image of the PLB into 160 patch images with the size of 219 × 219. Because each PLB has two sides, 320 patch images of each PLB were taken. Professional engineers selected 600 qualified PLBs and 600 blister PLBs to obtain images. After cutting out patches, a typical patch was selected as sample image. Finally, a blister sample image dataset was created including 11,600 qualified images and 10,460 blister images. Then, 1800 qualified images and 1400 blister images were selected randomly for test in the CNN training, and the other images were employed for training.
It was obvious that the dataset was not large enough. To overcome the overfitting problem caused by small dataset training in CNN, transfer learning was employed. A set of pre-trained weights was transferred from ImageNet to the network proposed in this paper. After transferring network weights, the proposed network could be trained employing the blister image dataset. To enhance CNN image classification performance, batch normalization, dropout strategy and early stop scheme were used as in other image classification task.

3. Results and Discussions

To evaluate the proposed blister detection method based on CNN, some other machine learning based methods were employed for comparison: neural network (NN) [22], support vector machine (SVM) [24], support Tucker machine (STM) [25], and CNN methods with DenseNet model [46], ResNet model [47], VGG16 model [43], and fast RCNN model [45]. The comparisons included classification performance evaluation and confusion matrix.

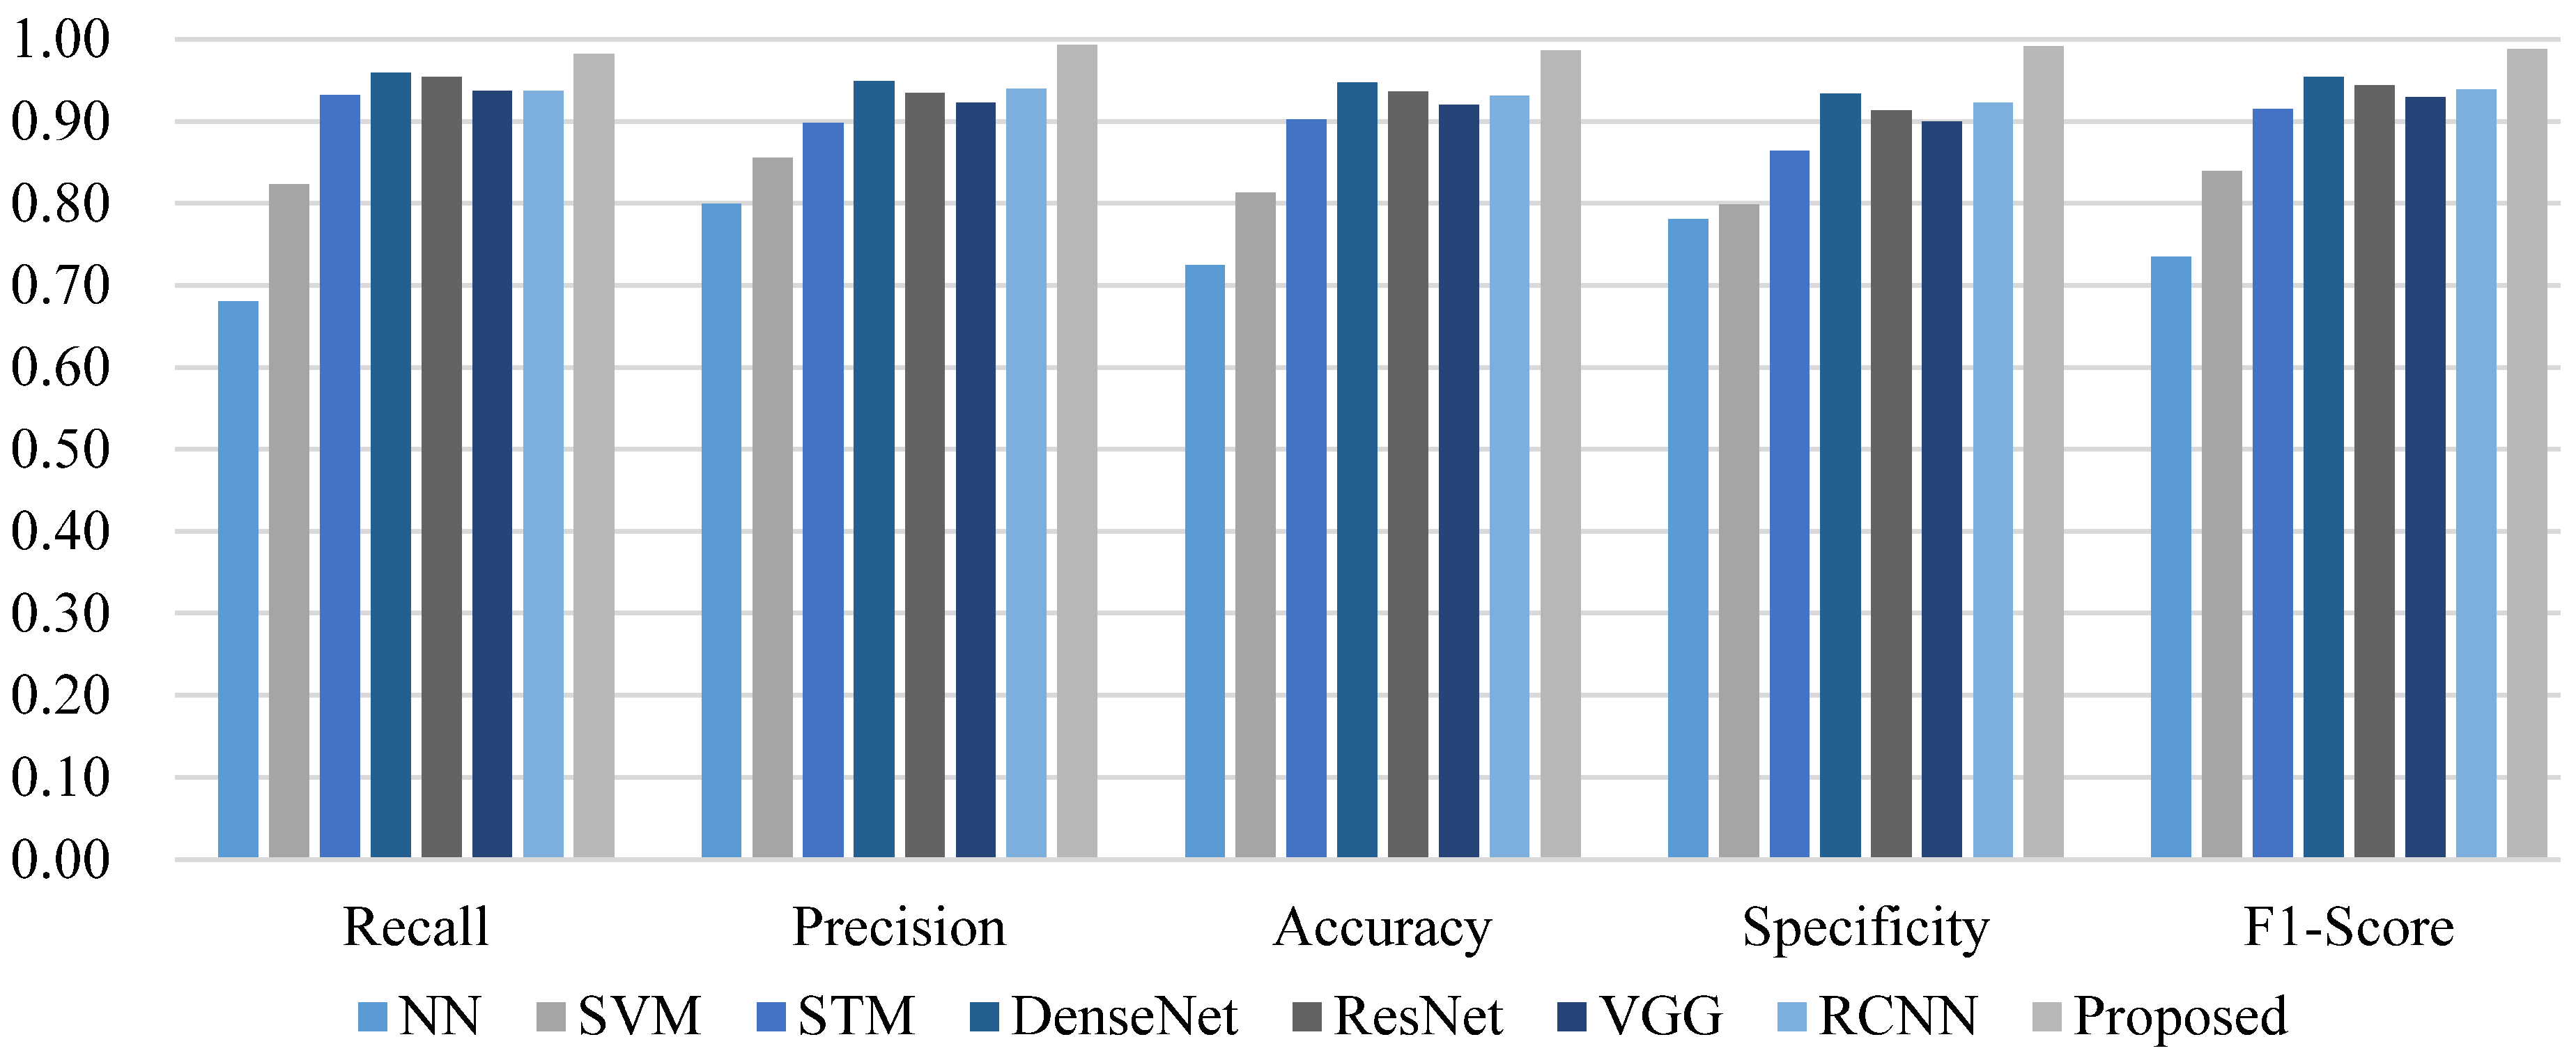
3.1. Classification Performance Evaluation

According to whether the classification results are correct, TP, TN, FP, and FN can be determined. TP means that the classification result is true and positive, TN means true negative, FP means false positive, and FN means false negative.
Recall, precision, accuracy, specificity and F1-score were employed as classification performance indicators to evaluate different methods. They are defined as follows [55].
Recall = T P T P + F N .
Precision = T P T P + F P .
Specificity = T N F P + T N .
Accuracy = T P + T N T P + T N + F P + F N .
F 1 - score = 2 T P 2 T P + F P + F N .
Recall measures the proportion of actual positives that are correctly identified as such. Specificity represents the proportion of actual negatives that are correctly identified as such. Accuracy is defined as the proportion of all samples that have been successfully classified. Precision is the ratio of samples correctly classified as positive to all the samples that are classified. F1-score is the harmonic mean of precision and sensitivity. When the above performance index is greater, the classification performance is better.
The above-mentioned five indicators of different blister classification methods are listed in Table 3. The method proposed in this paper had the greatest value for all performance indicators, meaning that the proposed CNN based method was superior to other classification methods for blister recognition of PLB sheets. The performance comparison is also shown in Figure 7, which indicates that the proposed method had the best classification performance. The improved CNN architecture with optimization based training method was efficient for blister detection when trainable weight parameters were added to skip connections in dense block.
To observe the effectiveness and efficiency of the proposed FPA optimization in this paper, an ablation study was performed on the proposed FPA optimization. The FPA optimization based method was compared with the method without FPA optimization in the experiment. The results of the comparison are shown in Table 4, and the data are also illustrated in Figure 8.
By observing the data in Table 4 and Figure 8, it can be seen that the performance was obviously improved when applying the proposed FPA optimization. Because FPA optimization could find the optimum learning rate, the training process was more efficient and the classification results were improved.

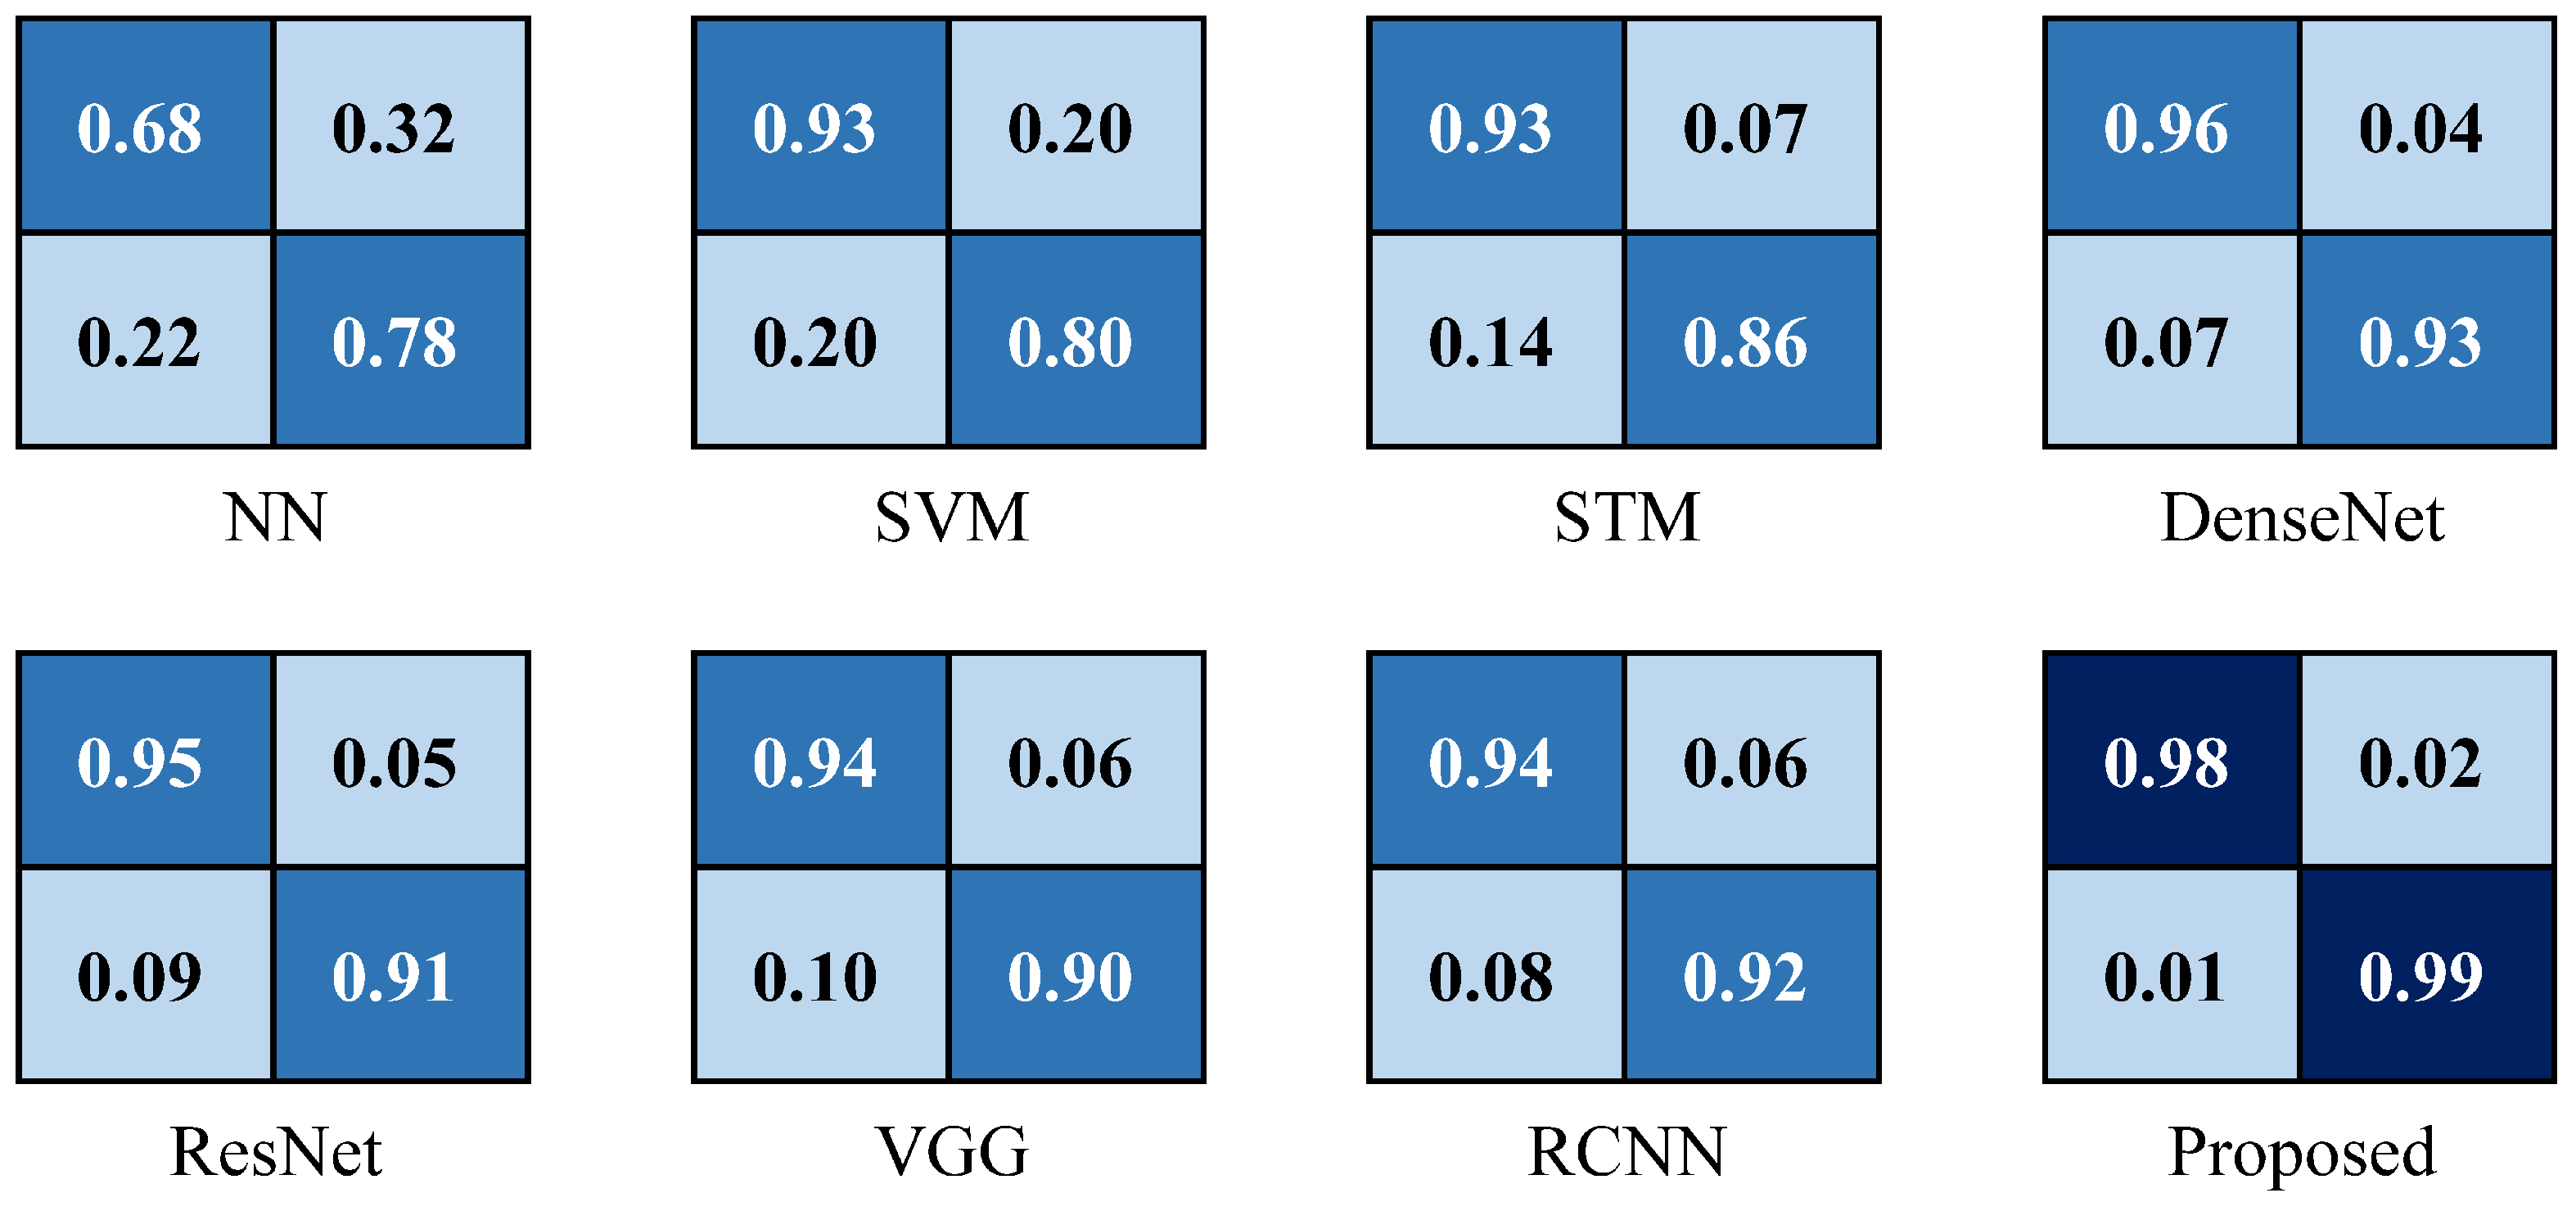
3.2. Confusion Matrix

Confusion matrix is often used to visualize the performance of supervised learning based classification. The matrix row represents samples in a predicted class while matrix column indicates the samples in an actual class [55]. Confusion matrices of the experiments in this paper are illustrated in Figure 9. The confusion matrix of the proposed method obtainEd the maximum value on the main diagonal and the minimum value in the secondary diagonal, showing that the proposed method had the best classification performance. This is consistent with the analysis results of the performance data presented in Section 3.1. This also indicates that our proposed method was the most efficient for blister detection.

3.3. Real-Time

All tests were performed on a computer with 32G RAM, Intel Xeon E5-2620 CPU, and NVIDIA GeForce 1080Ti GPU. Each sample test took no more than 0.3 s. The total processing time including capturing images of two sides and transportation on the production line for each PLB sheet was less than 10 s. If parallel processing were used, the processing speed could be improved. In the actual production line, parallel pipeline processing was adopted. The image acquisition and detection on both sides of the PLB were performed simultaneously, the time was shortened to half of the original, and the efficiency was increased to twice the manual processing. The proposed CNN based defect detection method was fast enough for real-time industry application.

4. Conclusions

Blister, a kind of common defect in the grid net of cell sheet, needs to be detected to ensure product quality of PLB. A blister detection method based on visual inspection was employed using images of PLB sheet. A deep learning detection method is proposed and it is fast enough for real-time industry application. The following conclusions can be drawn from this paper.
(1) Trainable weight parameters are added to each skip connection to improve dense block in CNN architecture. These parameters are trained during the CNN training process. This improvement efficiently finds important features for the image classification.
(2) CNN training is improved with the optimization of learning rate by FPA. Mini-batch is updated in the correct direction to improve the efficiency of training.
(3) A deep learning application for blister detection of PLB is developed. The proposed method had the best classification performance when it was compared with other methods.
(4) The proposed CNN based blister detection method is fast enough for real-time industry application.

Author Contributions

Conceptualization, L.M. and W.X.; Methodology, L.M. and Y.Z.; Writing—original draft, L.M.; and Writing—review and editing, W.X.

Funding

This research was funded by National Key R&D Program of China grant number 2018YFC0114800, Shandong Province Natural Science Foundation grant number ZR2018MF026, and University Co-construction Project at Weihai grant number ITDAZMZ001708.

Conflicts of Interest

The authors declare no conflict of interest. The funders had no role in the design of the study; in the collection, analyses, or interpretation of data; in the writing of the manuscript, or in the decision to publish the results.

References

  1. Liu, L.; Guan, P.; Liu, C. Experimental and simulation investigations of porosity graded cathodes in mitigating battery degradation of high voltage lithium-ion batteries. J. Electrochem. Soc. 2017, 164, A3163–A3173. [Google Scholar] [CrossRef]
  2. Liu, C.; Liu, L. Optimal design of Li-ion batteries through multi-physics modeling and multi-objective optimization. J. Electrochem. Soc. 2017, 164, E3254–E3264. [Google Scholar] [CrossRef]
  3. Liu, C.; Liu, L. Optimizing battery design for fast charge through a genetic algorithm based multi-objective optimization framework. ECS Trans. 2017, 77, 257–271. [Google Scholar] [CrossRef]
  4. Liu, L.; Park, J.; Lin, X.K.; Sastry, A.M.; Lu, W. A thermal-electrochemical model that gives spatial-dependent growth of solid electrolyte interphase in a Li-ion battery. J. Power Sources 2014, 268, 482–490. [Google Scholar] [CrossRef]
  5. Lin, X.K.; Park, J.; Liu, L.; Lee, Y.; Sastry, A.M.; Lu, W. A Comprehensive capacity fade model and analysis for Li-ion batteries. J. Electrochem. Soc. 2013, 160, A1701–A1710. [Google Scholar] [CrossRef]
  6. Guan, P.J.; Liu, L.; Lin, X.K. Simulation and experiment on solid electrolyte interphase (SEI) morphology evolution and Lithium-ion diffusion. J. Electrochem. Soc. 2015, 162, A1798–A1808. [Google Scholar] [CrossRef]
  7. Mohanty, D.; Hockaday, E.; Li, J.; Hensley, D.K.; Daniel, C.; Wood, D.L. Effect of electrode manufacturing defects on electrochemical performance of lithium-ion batteries: Cognizance of the battery failure sources. J. Power Sources 2016, 312, 70–79. [Google Scholar] [CrossRef]
  8. Etiemble, A.; Besnard, N.; Adrien, J.; Tran-Van, P.; Gautier, L.; Lestriez, B.; Maire, E. Quality control tool of electrode coating for lithium-ion batteries based on X-ray radiography. J. Power Sources 2015, 298, 285–291. [Google Scholar] [CrossRef]
  9. Wu, Y.; Saxena, S.; Xing, Y.J.; Wang, Y.R.; Li, C.; Yung, W.K.C.; Pecht, M. Analysis of manufacturing-induced defects and structural deformations in Lithium-ion batteries using computed tomography. Energies 2018, 11, 925. [Google Scholar] [CrossRef]
  10. Mohanty, D.; Li, J.L.; Born, R.; Maxey, L.C.; Dinwiddie, R.B.; Daniel, C.; Wood, D.L. Non-destructive evaluation of slot-die-coated lithium secondary battery electrodes by in-line laser caliper and IR thermography methods. Anal. Methods 2014, 6, 674–683. [Google Scholar] [CrossRef]
  11. Robinson, J.B.; Engebretsen, E.; Finegan, D.P.; Darr, J.; Hinds, G.; Shearing, P.R.; Brett, D.J.L. Detection of internal defects in lithium-ion batteries using lock-in thermography. ECS Electrochem. Lett. 2015, 4, A106–A109. [Google Scholar] [CrossRef]
  12. Sharp, N.; Oregan, P.; Adams, D.; Caruthers, J.; David, A.; Suchomel, M. Lithium-ion battery electrode inspection using pulse thermography. NDT E Int. 2014, 64, 41–51. [Google Scholar] [CrossRef]
  13. Qian, X.Y.; Huang, X.G. Reconstruction of surfaces of revolution with partial sampling. J. Comput. Appl. Math. 2004, 163, 211–217. [Google Scholar] [CrossRef]
  14. Pena, B.; Aramendi, G.; Rivero, A.; de Lacalle, L. Monitoring of drilling for buff detection using spindle torque. Int. J. Mach. Tools Manuf. 2005, 45, 1614–1621. [Google Scholar] [CrossRef]
  15. Huber, J.; Tammer, C.; Kempter, A.; Seidel, C.; Reinhart, G. Optical quality inspection of battery separators. Tm-Tech. Messen 2015, 82, 495–505. [Google Scholar]
  16. Huber, J.; Tammer, C.; Krotil, S.; Waidmann, S.; Hao, X.; Seidel, C.; Reinhart, G. Method for classification of battery separator defects using optical inspection. Procedia CIRP 2016, 57, 585–590. [Google Scholar] [CrossRef]
  17. Li, K.; Dan, T. Research and design of inspection of LR6 battery negative surface scratches online defects based on computer vision. In Proceedings of the International Conference on Communications, Circuits and Systems, Chengdu, China, 15–17 November 2013; pp. 120–123. [Google Scholar]
  18. Alberdi, A.; Rivero, A.; de Lacalle, L.; Etxeberria, I.; Suárez, A. Effect of process parameter on the Kerf geometry in abrasive water jet milling. Int. J. Adv. Manuf. Technol. 2010, 51, 467–480. [Google Scholar] [CrossRef]
  19. Álvarez, A.; Sierra, B.; Arruti, A.; López-Gil, J.M.; Garay-Vitoria, N. Classifier subset selection for the stacked generalization method applied to emotion recognition in speech. Sensors 2016, 16, 21. [Google Scholar] [CrossRef]
  20. Panchal, S.; Dincer, I.; Agelin-Chaab, M.; Fraser, R.; Fowler, M. Experimental and theoretical investigation of temperature distributions in a prismatic lithium-ion battery. Int. J. Therm. Sci. 2016, 99, 204–212. [Google Scholar] [CrossRef]
  21. Panchal, S.; Dincer, I.; Agelin-Chaab, M.; Fraser, R.; Fowler, M. Thermal modeling and validation of temperature distributions in a prismatic lithium-ion battery at different discharge rates and varying boundary conditions. Appl. Therm. Eng. 2016, 96, 190–199. [Google Scholar] [CrossRef]
  22. Zhao, Y.; Liu, P.; Wang, Z.; Zhang, L.; Hong, J. Fault and defect diagnosis of battery for electric vehicles based on big data analysis methods. Appl. Energy 2017, 207, 354–362. [Google Scholar] [CrossRef]
  23. Liang, X.; Bao, N.; Zhang, J.; Garg, A.; Wang, S. Evaluation of battery modules state for electric vehicle using artificial neural network and experimental validation. Energy Sci. Eng. 2018, 6, 397–407. [Google Scholar] [CrossRef]
  24. Wu, B.; Qin, L.; Zhang, Q.; Ma, Q. Research on vision-based post-welding quality inspection of power battery. Hanjie Xuebao/Trans. China Weld. Inst. 2018, 39, 122–128. [Google Scholar]
  25. Ma, L.Y.; Hu, Y.H.; Zhang, Y. Support Tucker machines based bubble defect detection of lithium-ion polymer cell sheets. Eng. Lett. 2017, 25, 46–51. [Google Scholar]
  26. Ma, L.Y. Support Tucker machines based marine oil spill detection using SAR images. Indian J. Geo-Mar. Sci. 2016, 45, 1445–1449. [Google Scholar]
  27. Murua, M.; Suarez, A.; de Lacalle, L.; Santana, R.; Wretland, A. Feature extraction-based prediction of tool wear of Inconel 718 in face turning. Insight 2018, 60, 443–450. [Google Scholar] [CrossRef]
  28. Coro, A.; Abasolo, M.; Aguirrebeitia, J.; de Lacalle, L. Inspection scheduling based on reliability updating of gas turbine welded structures. Adv. Mech. Eng. 2019, 11. [Google Scholar] [CrossRef]
  29. LeCun, Y.; Bengio, Y.; Hinton, G. Deep learning. Nature 2015, 521, 436–444. [Google Scholar] [CrossRef]
  30. Pouyanfar, S.; Sadiq, S.; Yan, Y.; Tian, H.; Tao, Y.; Reyes, M.P.; Shyu, M.L.; Chen, S.C.; Iyengar, S.S. A survey on deep learning: Algorithms, techniques, and applications. ACM Comput. Surv. 2019, 51, 92. [Google Scholar] [CrossRef]
  31. Rawat, W.; Wang, Z. Deep convolutional neural networks for image classification: A comprehensive review. Neural Comput. 2017, 29, 2352–2449. [Google Scholar] [CrossRef]
  32. Voulodimos, A.; Doulamis, N.; Doulamis, A.; Protopapadakis, E. Deep learning for computer vision: A brief review. Comput. Intell. Neurosci. 2018, 4, 7068349. [Google Scholar] [CrossRef] [PubMed]
  33. Shin, H.C.; Roth, H.R.; Gao, M.C.; Lu, L.; Xu, Z.Y.; Nogues, I.; Yao, J.H.; Mollura, D.; Summers, R.M. Deep convolutional neural networks for computer-aided detection: CNN architectures, dataset characteristics and transfer learning. IEEE Trans. Med. Imaging 2016, 35, 1285–1298. [Google Scholar] [CrossRef] [PubMed]
  34. Ma, L.Y.; Ma, C.K.; Liu, Y.J.; Wang, X.G.; Xie, W. Diagnosis of thyroid diseases using SPECT images based on convolutional neural network. J. Med. Imaging Health Inform. 2018, 8, 1684–1689. [Google Scholar] [CrossRef]
  35. Ma, L.Y.; Ma, C.K.; Liu, Y.J.; Wang, X.G. Thyroid diagnosis from SPECT images using convolutional neural network with optimization. Comput. Intell. Neurosci. 2019, 5, 6212759. [Google Scholar] [CrossRef] [PubMed]
  36. Sun, M.J.; Zhang, X.; Qu, G.; Zou, M.S.; Du, H.; Ma, L.Y.; Qu, Y.W. Automatic polyp detection in colonoscopy images: Convolutional neural network, dataset and transfer learning. J. Med. Imaging Health Informat. 2019, 9, 126–133. [Google Scholar]
  37. Chen, F.C.; Jahanshahi, M.R. NB-CNN: Deep learning-based crack detection using convolutional neural network and Naive Bayes data fusion. IEEE Trans. Ind. Electron. 2018, 65, 4392–4400. [Google Scholar] [CrossRef]
  38. Kim, J.; Kim, S.; Kwon, N.; Kang, H.; Kim, Y.; Lee, C. Deep learning based automatic defect classification in through-silicon Via process: FA: Factory automation. In Proceedings of the 29th Annual SEMI Advanced Semiconductor Manufacturing Conference, Saratoga Springs, NY, USA, 30 April–3 May 2018; pp. 35–39. [Google Scholar]
  39. Park, J.K.; Kwon, B.K.; Park, J.H.; Kang, D.J. Machine learning-based imaging system for surface defect inspection. Int. J. Precis. Eng. Manuf. Green Technol. 2016, 3, 303–310. [Google Scholar] [CrossRef]
  40. van Veenhuizen, M. Void detection in solder bumps with deep learning. Microelectron. Reliab. 2018, 88, 315–320. [Google Scholar] [CrossRef]
  41. Cai, N.; Cen, G.; Wu, J.; Li, F.; Wang, H.; Chen, X. SMT solder joint inspection via a novel cascaded convolutional neural network. IEEE Trans. Compon. Packag. Manuf. Technol. 2018, 8, 670–677. [Google Scholar] [CrossRef]
  42. Tao, X.; Zhang, D.P.; Ma, W.Z.; Liu, X.L.; Xu, D. Automatic metallic surface defect detection and recognition with convolutional neural networks. Appl. Sci. 2018, 8, 1575. [Google Scholar] [CrossRef]
  43. Gopalakrishnan, K.; Khaitan, S.K.; Choudhary, A.; Agrawal, A. Deep convolutional neural networks with transfer learning for computer vision-based data-driven pavement distress detection. Constr. Build. Mater. 2017, 157, 322–330. [Google Scholar] [CrossRef]
  44. Li, Y.T.; Huang, H.S.; Xie, Q.S.; Yao, L.G.; Chen, Q.P. Research on a surface defect detection algorithm based on MobileNet-SSD. Appl. Sci. 2018, 8, 1678. [Google Scholar] [CrossRef]
  45. Lei, H.W.; Wang, B.; Wu, H.H.; Wang, A.H. Defect detection for polymeric polarizer based on faster R-CNN. J. Inf. Hid. Multimed. Sign. Process. 2018, 9, 1414–1420. [Google Scholar]
  46. Huang, G.; Liu, Z.; Van Der Maaten, L.; Weinberger, K.Q. Densely connected convolutional networks. In Proceedings of the 30th IEEE Conference on Computer Vision and Pattern Recognition, Honolulu, HI, USA, 21–26 July 2017; pp. 2261–2269. [Google Scholar]
  47. He, K.; Zhang, X.; Ren, S.; Sun, J. Deep residual learning for image recognition. In Proceedings of the IEEE Conference on Computer Vision and Pattern Recognition, Las Vegas, NV, USA, 27–30 June 2016; pp. 770–778. [Google Scholar]
  48. Yang, X.S.; Karamanoglu, M.; He, X.S. Flower pollination algorithm: A novel approach for multiobjective optimization. Eng. Optim. 2014, 46, 1222–1237. [Google Scholar] [CrossRef]
  49. Abdel-Basset, M.; Shawky, L.A. Flower pollination algorithm: a comprehensive review. Artif. Intell. Rev. 2018, 50, 1–25. [Google Scholar] [CrossRef]
  50. Galvez, J.; Cuevas, E.; Avalos, O. Flower Pollination Algorithm for multimodal optimization. Int. J. Comput. Intell. Syst. 2017, 10, 627–646. [Google Scholar] [CrossRef]
  51. Nabil, E. A modified flower pollination algorithm for global optimization. Expert Syst. Appl. 2016, 57, 192–203. [Google Scholar] [CrossRef]
  52. Shen, L.; Fan, C.; Huang, X. Multi-level image thresholding using modified flower pollination algorithm. IEEE Access 2018, 6, 30508–30519. [Google Scholar] [CrossRef]
  53. Xu, S.H.; Wang, Y.; Liu, X. Parameter estimation for chaotic systems via a hybrid flower pollination algorithm. Neural Comput. Appl. 2018, 30, 2607–2623. [Google Scholar] [CrossRef]
  54. Zhou, Y.; Zhang, S.; Luo, Q.; Wen, C. Using flower pollination algorithm and atomic potential function for shape matching. Neural Comput. Appl. 2018, 29, 21–40. [Google Scholar] [CrossRef]
  55. Power, D. Evaluation: from precision, recall and F-factor to ROC, informedness, markedness & correlation. J. Mach. Learn. Technol. 2011, 2, 37–63. [Google Scholar]
Figure 1. Image capture of PLB sheets.
Applsci 09 01085 g001
Figure 2. Blister defect samples of PLB sheet.
Applsci 09 01085 g002
Figure 3. Improved dense block with trainable parameters for concatenation.
Applsci 09 01085 g003
Figure 4. Improved dense block architecture.
Applsci 09 01085 g004
Figure 5. Proposed CNN architecture for blister detection.
Applsci 09 01085 g005
Figure 6. Flow chart of FPA implementation.
Applsci 09 01085 g006
Figure 7. Classification performance comparison of different methods.
Applsci 09 01085 g007
Figure 8. Classification performance comparison on FPA optimization.
Applsci 09 01085 g008
Figure 9. Confusion matrices of different methods.
Applsci 09 01085 g009
Table 1. Abbreviations.
AbbreviationDefinition
CNNConvolutional Neural Network
CPUCentral Processing Unit
FPAFlower Pollination Algorithm
GPUGraphic Processing Unit
NNNeural Network
PLBPolymer Lithium-ion Battery
RAMRandom Access Memory
RCNNRegion Convolutional Neural Network
ReLURectified Linear Unit
SVMSupport Vector Machine
STMSupport Tucker Machine
VGGVisual Geometry Group
Table 2. Alphabetic symbols.
SymbolMeaning
dlayer number
F i nonlinear transformation function of ith layer
gfunction
k i , j parameters which determinate weights of x j in ith layer
l i ith learning rate
l b e s t optimal learning rate solution
Lvariable drawn from Levy distribution
mtotal pollen number
P C probability of choosing cross-pollination
sstep
titeration number
xinput of CNN network
x i input of ith layer
youtput of CNN network
y i output of ith layer
wnetwork parameters
W i parameters of ith layer
γ scaling factor
ε variable drawn from uniform distribution
λ variable of gamma function
Γ standard gamma function
Table 3. Classification performance of different methods for blister detection.
MethodNNSVMSTMDenseNetResNetVGGRCNNProposed
Recall0.6800.8240.9320.9590.9540.9370.9370.982
Precision0.7990.8550.8980.9490.9340.9230.9390.993
Accuracy0.7240.8130.9020.9480.9360.9200.9310.986
Specificity0.7810.7980.8640.9340.9140.8990.9220.991
F1-score0.7350.8390.9150.9540.9440.9300.9380.988
Table 4. Classification performance comparison on the proposed FPA optimization.
MethodProposed Method with FPAProposed Method without FPA
Recall0.9820.971
Precision0.9930.988
Accuracy0.9860.977
Specificity0.9910.985
F1-score0.9880.979

