Article

Bioelectrochemical CO2 Reduction to Methane: MES Integration in Biogas Production Processes

by
Anirudh Bhanu Teja Nelabhotla
and
Carlos Dinamarca
*
Department of Process, Energy and Environmental Technology, University of South-Eastern Norway, Kjølnes ring 56, 3918 Porsgrunn, Norway
*
Author to whom correspondence should be addressed.
Appl. Sci. 2019, 9(6), 1056; https://doi.org/10.3390/app9061056
Submission received: 31 January 2019 / Revised: 28 February 2019 / Accepted: 6 March 2019 / Published: 13 March 2019
(This article belongs to the Section Environmental Sciences)

Abstract

:
Anaerobic digestion (AD) is a widely used technique to treat organic waste and produce biogas. This article presents a practical approach to increase biogas yield of an AD system using a microbial electrosynthesis system (MES). The biocathode in MES reduces carbon dioxide with the supplied electrons and protons (H+) to form methane. We demonstrate that the MES is able to produce biogas with over 90% methane when fed with reject water obtained from a local wastewater treatment plant. The optimised cathode potential was observed in the range of −0.70 V to −0.60 V and optimised feed pH was around 7.0. With autoclaved feed, these conditions allowed methane yields of about 9.05 mmol/L(reactor)-day. A control experiment was then carried out to make a comparison between open circuit and MES methanogenesis. The highest methane yield of about 22.1 mmol/L(reactor)-day was obtained during MES operation that performed 10–15% better than the open circuit mode of operation. We suggest and describe an integrated AD-MES system, by installing MES in the reject water loop, as a novel approach to improve the efficiency and productivity of existing waste/wastewater treatment plants.

Graphical Abstract

1. Introduction

Electrochemical carbon dioxide reduction has garnered immense attention in recent times, given the interest in reducing carbon emissions from industries and transport fuels. Increasing government policies on carbon reduction targets have also made businesses on the lookout for cheaper carbon abatement technologies. The other aspect that has empowered electrochemical biogas upgradation is the utilisation of excess renewable electricity for transportation. The concept of electrochemical reduction involves the conversion of carbon dioxide which is the non-energy-rich component of the biogas produced in the anaerobic digester to the energy-rich component of methane. This reduction is possible through the chemical reaction between carbon dioxide, protons and electrons (from electricity) in a microbial electrosynthesis system (MES) [1]. This is otherwise known as Power-to-Gas (PtG) technology, which allows electrochemical units to act as carbon sinks for industrial waste and more importantly industrial CO2 emissions [2]. With PtG, it is possible to generate biogas of natural gas grade without the need to remove CO2 using expensive techniques such as amine scrubbing or pressure swing adsorption [3]. This allows biogas (biomethane) generated from waste treatment plants to be directly connected to existing gas grids or to be used as a transport fuel.
Many studies have described the concept of electrochemical CO2 reduction under various conditions such as short-term experiments [4,5,6,7,8,9], batch studies [6,10,11,12] two-chambered systems [13,14,15], and with buffered nutrient medium [13,16,17,18]. Electrochemical studies combining anaerobic digestion (AD) units have been demonstrated with both processes taking place in a single reactor [19]. A few researchers have suggested combining AD and microbial electrolysis cells (MECs) as two separate units where the MECs were used for in-situ hydrogen gas injection into AD reactors for biogas enrichment [20,21,22,23]. Several studies on biogas upgrading technologies using in situ and/or ex situ hydrogen gas injection have been discussed by Aryal et al., 2018 [24]. Bioelectrochemical upgrading has also been reviewed in detail by the authors where small scale batch and continuous setups have been discussed. The authors suggest further research in the areas of long-term electrode stability, high current densities, electron transfer mechanism and reactor design and configuration [24] and some of these issues are addressed in the present article.
Direct Electron Transfer:
CO2 + 8H+ + 8e → CH4 + 2H2O  E = −0.244 V vs. NHE
Indirect Electron Transfer:
2H+ + 2e → H2  E = −0.414 V vs. NHE
CO2 + 4H2 → CH4 + 2H2O
From the above-mentioned research studies and chemical reactions, the concept of electrochemical CO2 reduction has been successfully established in theory and in practice albeit in short-term and laboratory scale experiments. The process stability with long-term experiments carried out on actual wastewater, as a post processing step for AD, is one of the least explored. Here, we describe a method to treat reject water from a local wastewater treatment plant using an MES, specifically as a biogas upgrading technology by placing it in the recycling loop of an AD system. This system allows efficient direct interspecies electron transfer (DIET; Reaction (1)) that is much more efficient than electrolysis (Reactions (2) and (3)) and is able to produce biogas with less than 10% carbon dioxide. The article also analyses process stability in terms of cathode potentials and pH in continuous flow MES systems over 1-month operation periods.

2. Materials and Methods

2.1. Electrode Materials and Preparation

Two electrode materials were chosen for these experiments—the cathode was a Carbon felt (20 mm × 20 mm × 3 mm; Alfa Aesar, Thermo Fisher GmbH, Karlsruhe, Germany) while the anode was a Graphite rod (L: 152 mm × D: 6.15 mm; Alfa Aesar, Thermo Fisher GmbH, Karlsruhe, Germany). To remove organic impurities, both materials were prepared by soaking them in 1 M HCl for 24 h followed by 1 M NaOH for a further 24 h [25]. These materials were selected based on a cyclic voltammetry study [26] showing comparable performance with a platinum-coated titanium electrode (which had the same geometrical dimensions as the carbon felt electrode). Additionally, these carbon-based electrodes are the most inexpensive-efficient materials available that make electrochemical processes scalable and practical [27].

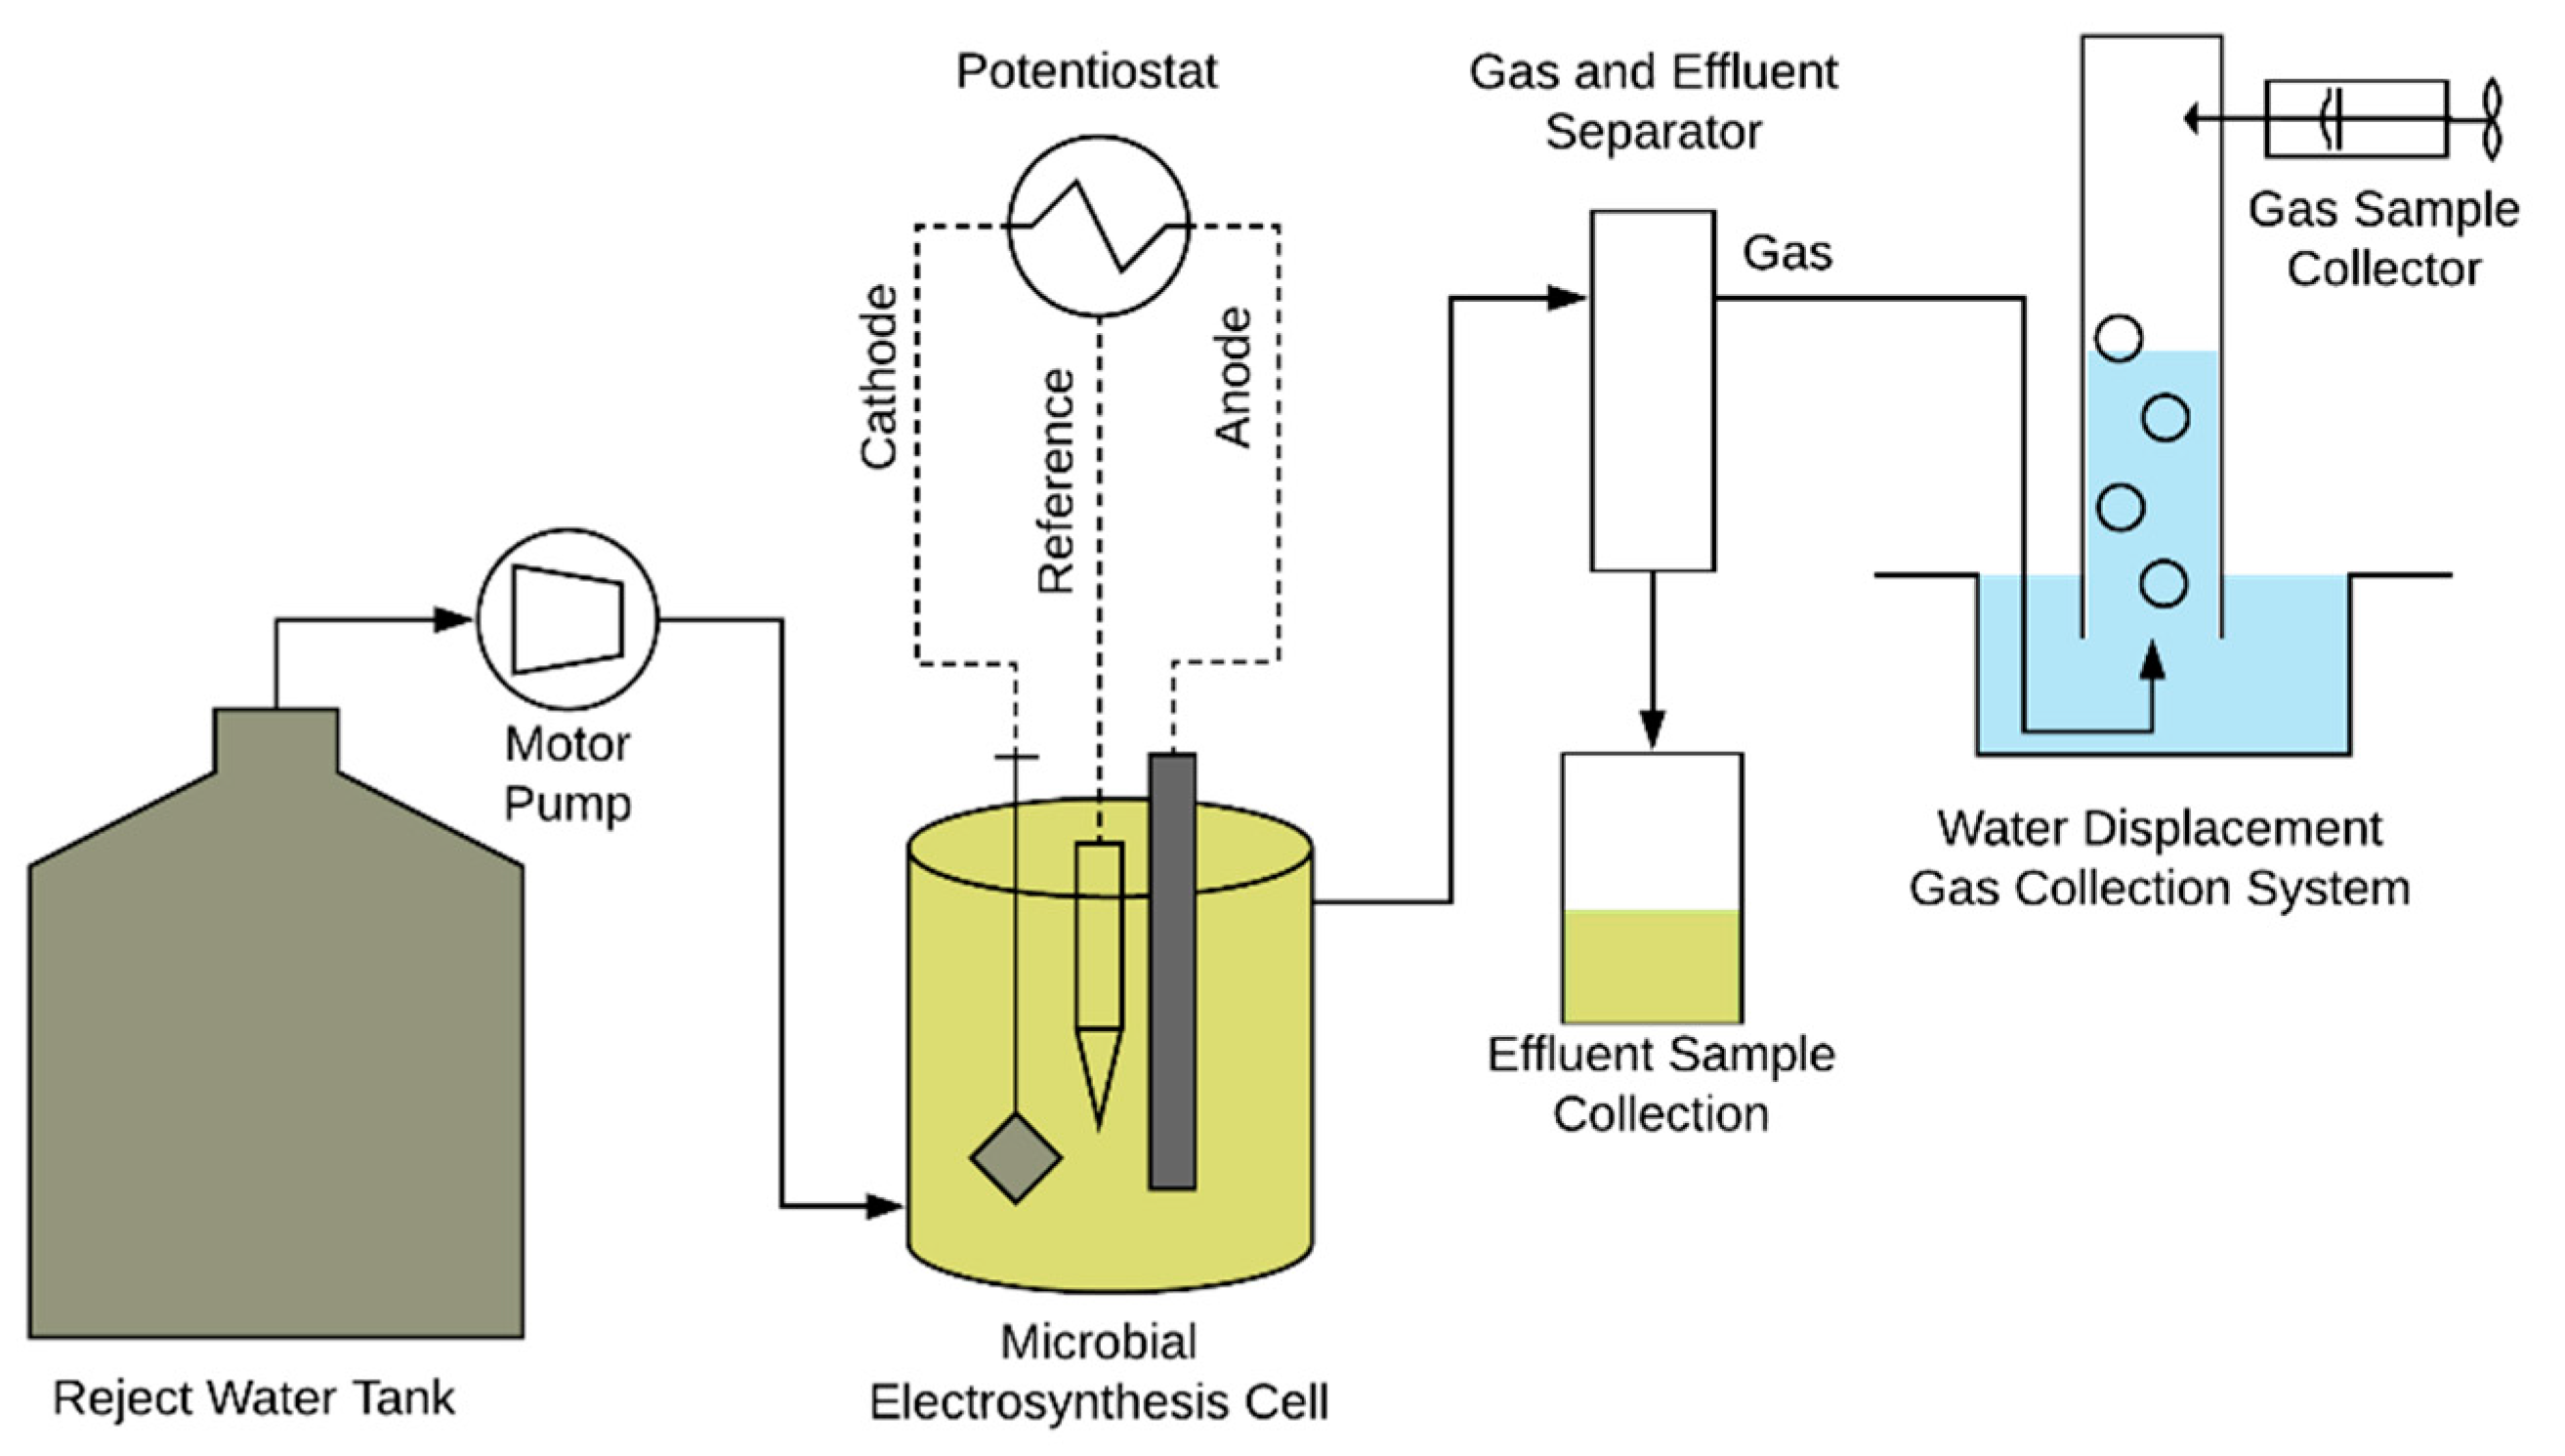
2.2. Reactor Setup and Operation

2.2.1. Biofilm Growth

Biofilm was cultured in fed batch mode in a 3.0-L large glass vessel (R1) with 6 side ports and a multiport glass top cover. Raw reject wastewater (W) was obtained from Knarrdalstrand wastewater treatment plant (WWTP), Porsgrunn, Norway. The plant treats municipal wastewater collected from the counties of Porsgrunn and Skien serving a total population of approximately 80,000. Reject water was centrifuged at 10,000 rpm for 15 min and was analysed for total solids (TS), volatile solids (VS), chemical oxygen demand (COD) and acetic acid concentration. W was then spiked with 1 mL/L acetic acid (17.5 mM) to provide easily digestible COD for biofilm growth (Wa). Seven g/L of sodium bicarbonate (83.3 mM) was then added to provide a carbonate source that can be reduced to methane (Wa). Reject water pH changed from 7.8 (W) to 7.0 (Wa) and was used for carrying out the biofilm growth and biomethane production experiments.
The carbon felt cathode pieces were arranged as an elliptical chain by stringing them on a titanium wire. They were separated from each other by 1 cm Tygon tubes of 0.5 mm inner diameter and were strung on the titanium wire after each electrode piece. The graphite rod electrode was used as the anode and an Ag/AgCl electrode (+0.209 V vs. SHE; 3 M NaCl, QVMF2052, ProSense, BB Oosterhout, The Netherlands) was used as the reference electrode. All the potentials mentioned in this article are presented as vs Standard Hydrogen Electrode (SHE).
R1 was fitted with a carbon felt cathode chain, graphite rod anode and the reference electrode through the multiport top cover. The reactor was then filled with 2.5 L of the prepared reject water (Wa) leaving 500 mL of headspace. The reactor was inoculated with a total 5 mL digested anaerobic sludge obtained from various treatment plants. The reactor was bubbled with nitrogen gas for 20 min while the magnetic stirrer mixed the prepared reject water. The electrodes were then connected to their respective terminals and the reactor was operated at potentials of −1.00, −0.95, −0.90 and −0.85 V vs. SHE each for 1 week during the 1st month of operation. The reactor was then operated for another 1-month period at a constant potential of -0.80 V. During the 2-month biofilm growth period, 500 mL of wastewater was removed every week and was replaced with freshly prepared Wa of the same volume.

2.2.2. Biomethane Production Experiment

Biofilm growth was observed on most electrodes after the 2-month operation (not documented). Two of the 2 × 2 cm2 cathodes which showed maximum biofilm cover were selected for the biomethane production experiment. This experiment was performed in a 135 mL reactor (R2), a modified version of standard 135 mL Duran glass bottle with a 3-port Teflon screw cap, used as a continuous-flow stirred tank reactor (CSTR; Figure 1). The two biocathodes were tied together using a titanium wire, which also acted as the electrode terminal and was connected to the potentiostat. Wa was fed to R2 continuously at 1-day hydraulic retention time (HRT) and was operated potentiostatically at −0.80 V vs SHE at 35 °C. It was operated for 1 month to regrow the biofilm lost during the transfer from R1 to R2 achieving steady state conditions (constant current). The experiment was then measured for various parameters during a 1-week operation of the biomethane production process.

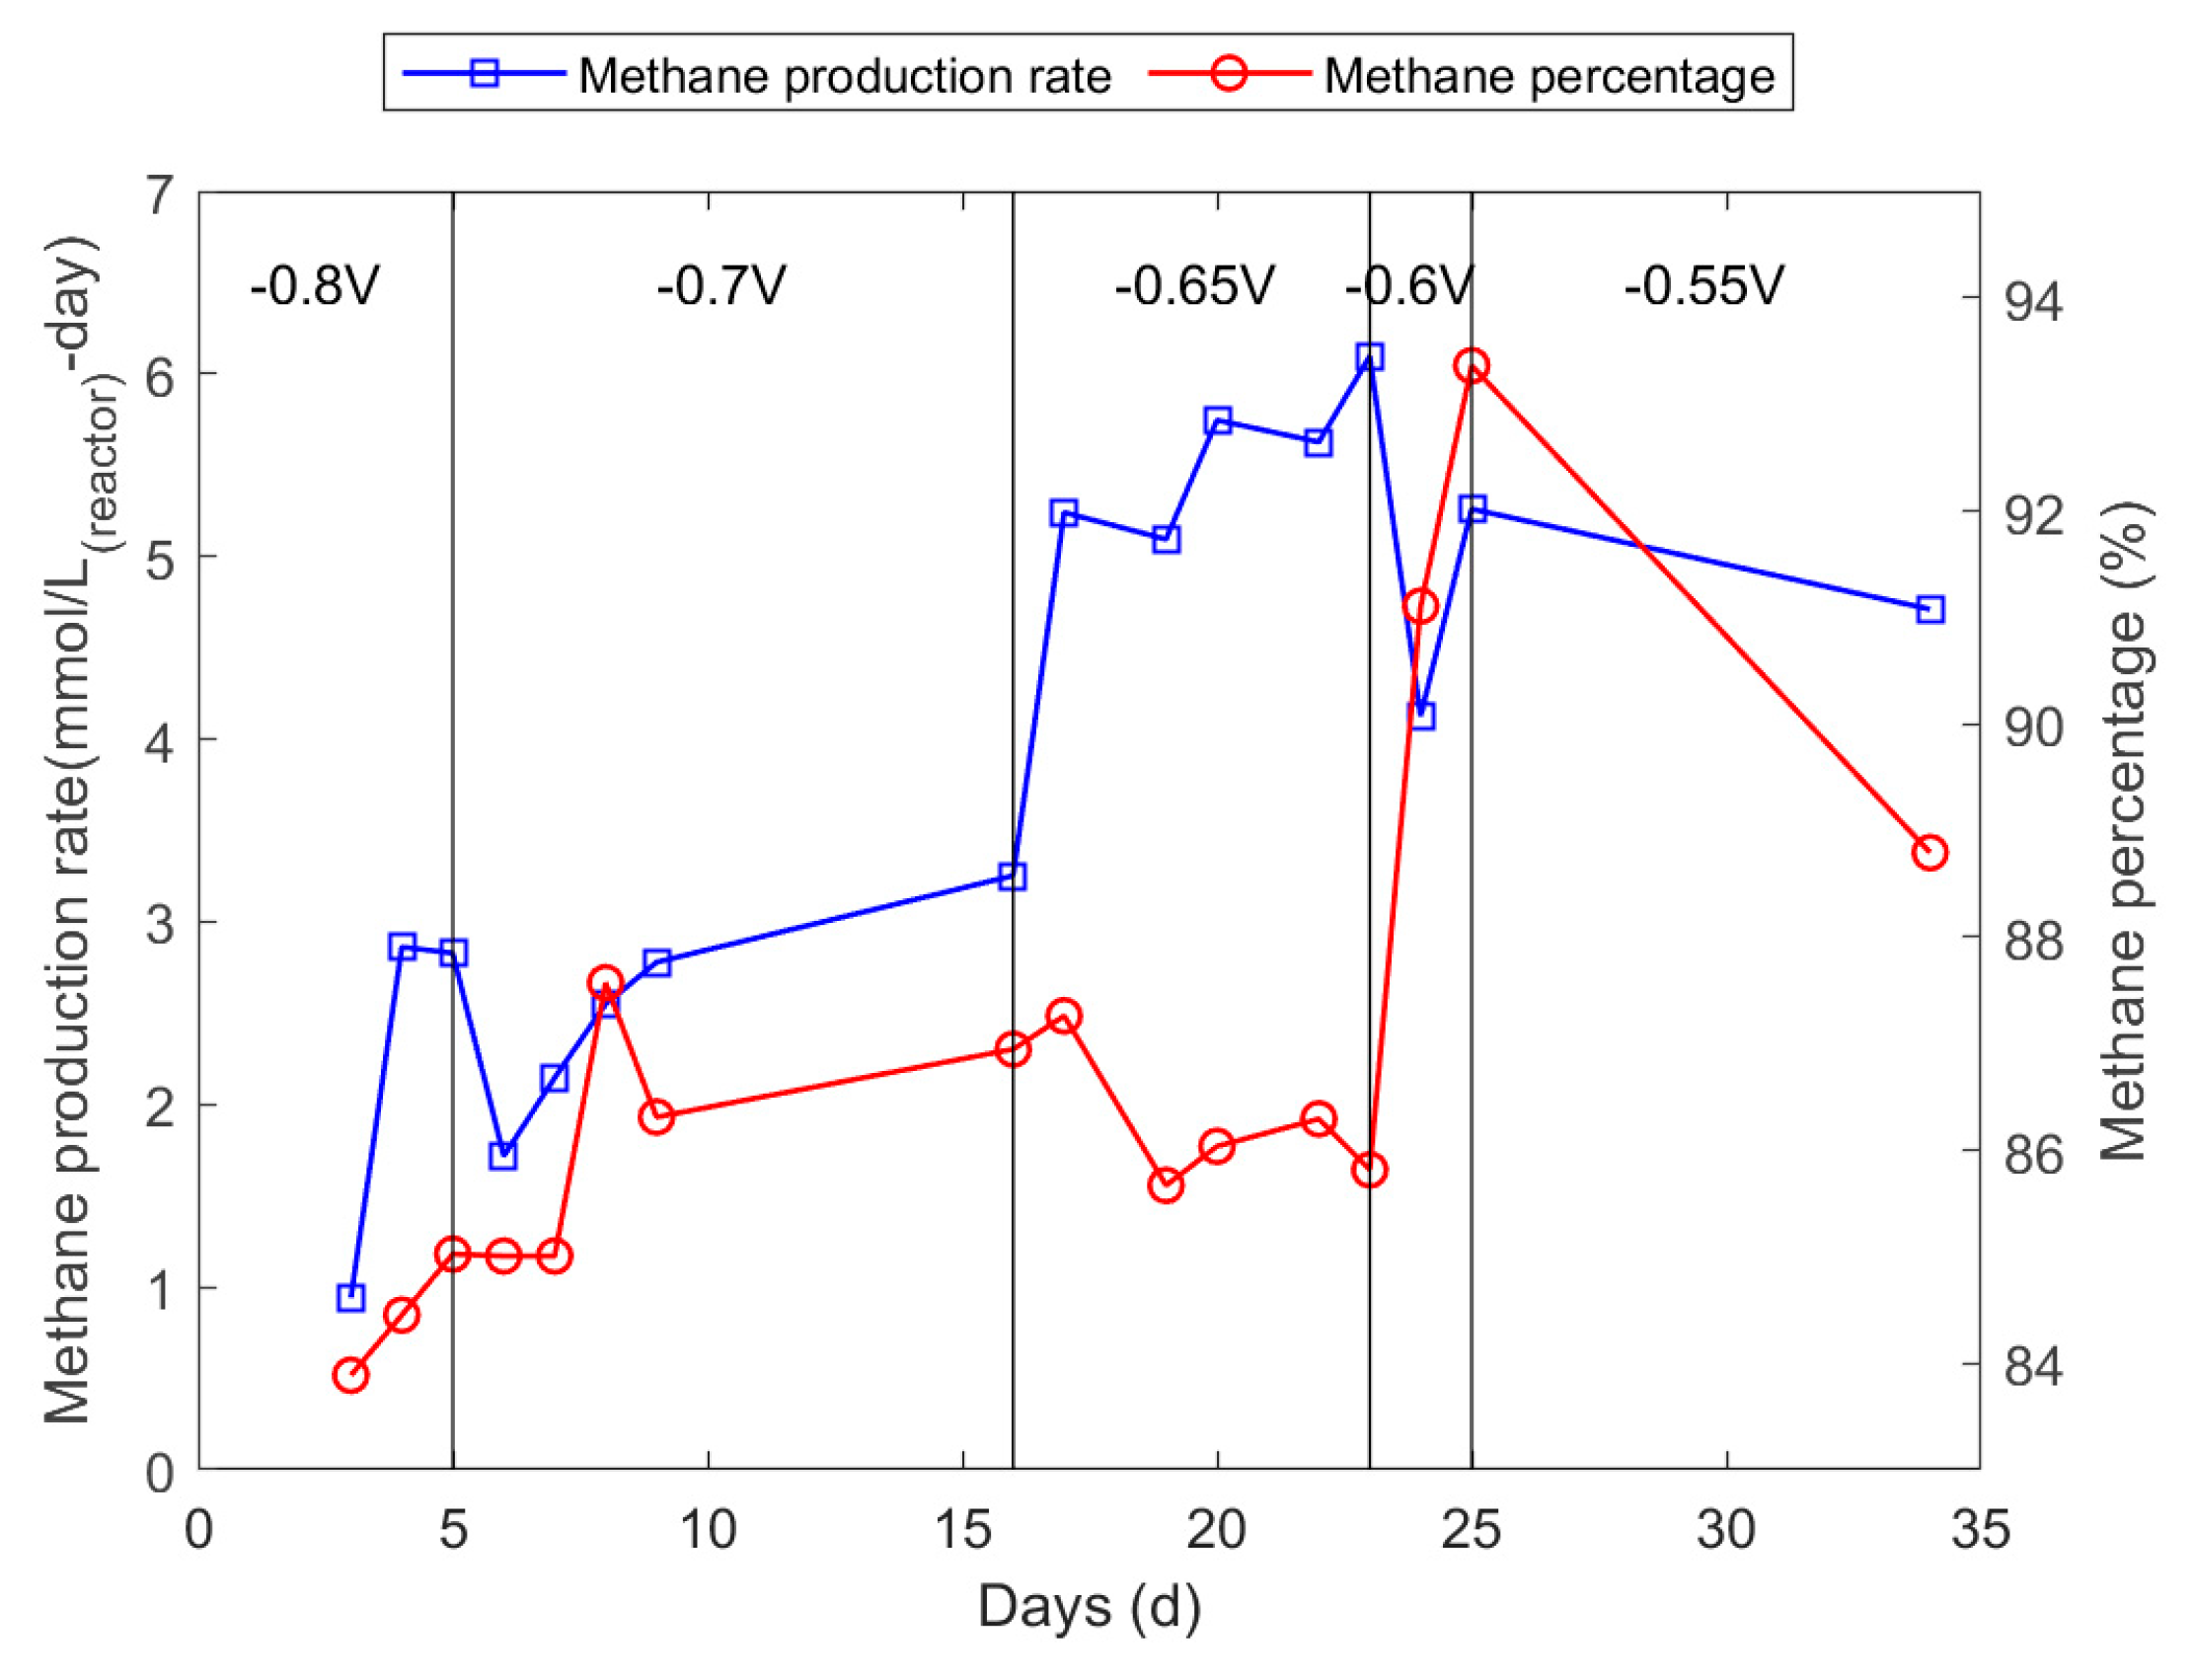
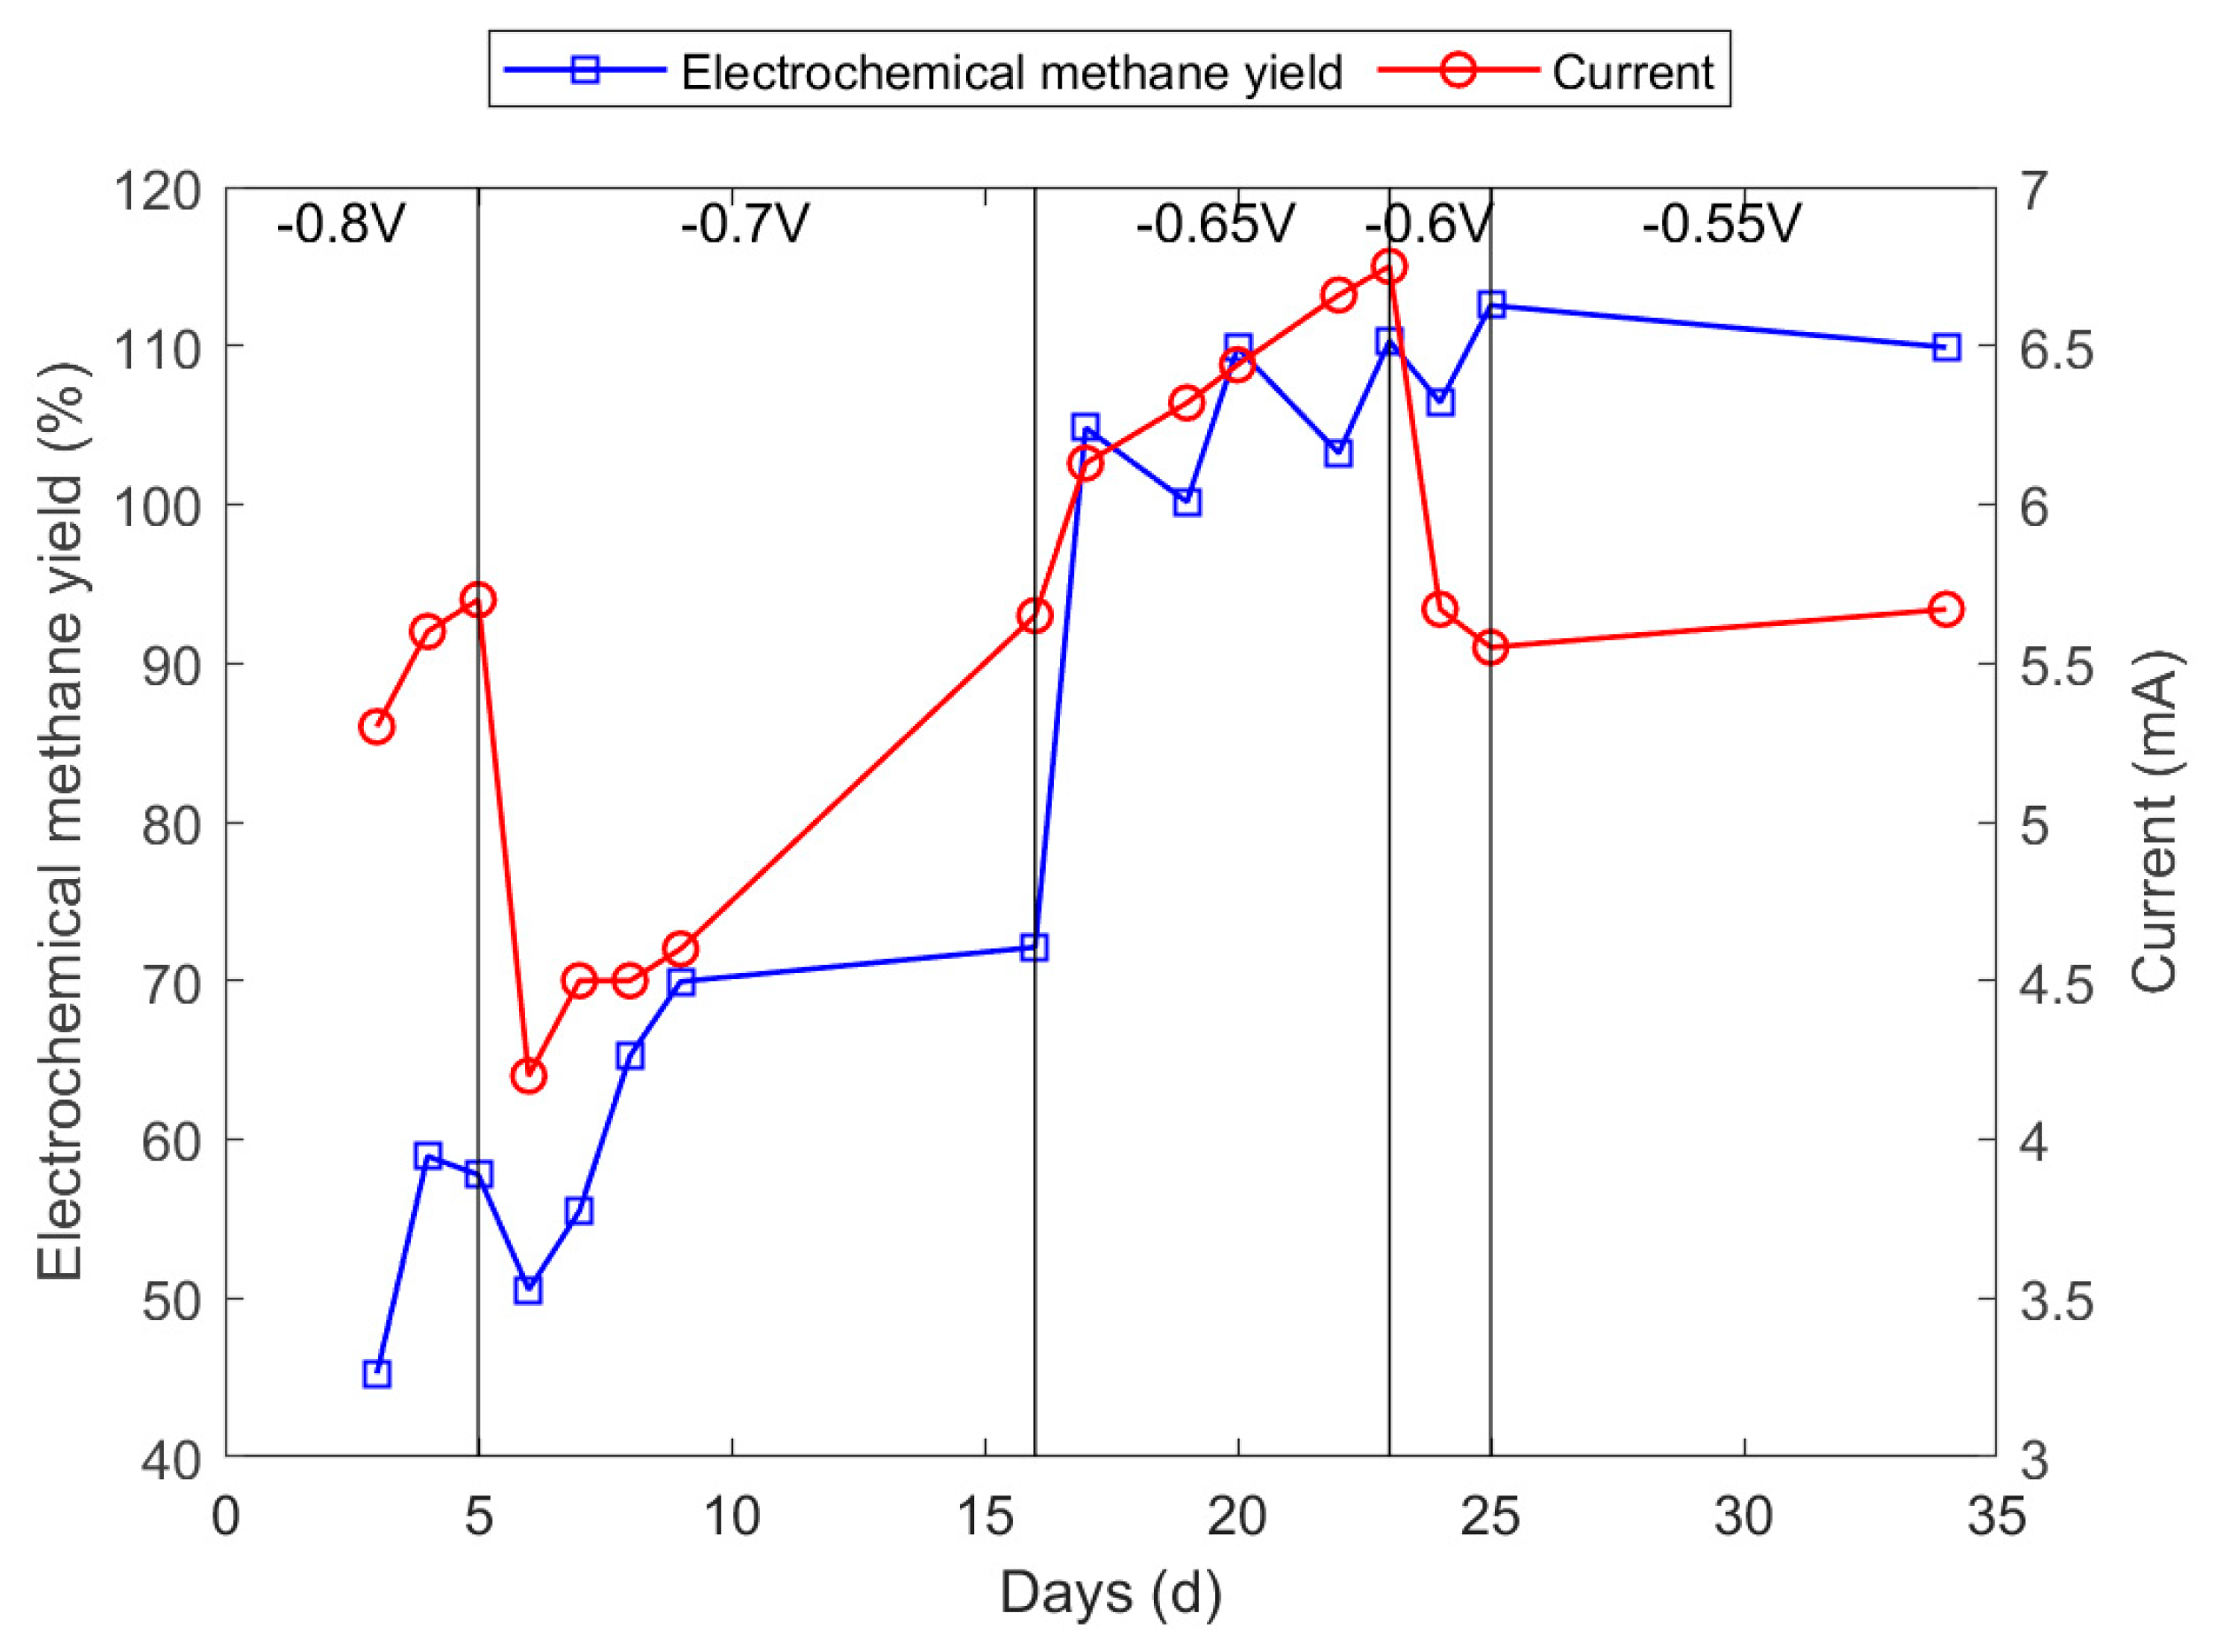
2.2.3. Optimisation of Cathode Potential

Reactor R2 was used in these experiments with a modified feed (WaA); it was prepared in the same way as Wa with an additional step of autoclaving prior to the addition of acetic acid and sodium bicarbonate. It had an initial pH of 7.8. This was done to ensure all the biomethane produced is from the biofilm present on the carbon felt cathodes and not from suspended biomass. The aim of the experiment was to identify the activity of biofilm, optimum voltage and to ensure consistent performance in long term operation. The experiment was carried out for a total of 34 days in continuous flow with an HRT of 24 h at 35 °C. The initial cathode potential was set at −0.80 V vs. SHE and was reduced gradually, when the electrochemical methane yield (EMY; Methane(actual)/Methane(electro-conversion) ×100) either remained unchanged or reduced. The EMY reduced drastically when the applied potential was −0.55 V and the experiment was terminated. Parameters such as pH, average current, biogas production and methane content were measured for all the experiments.

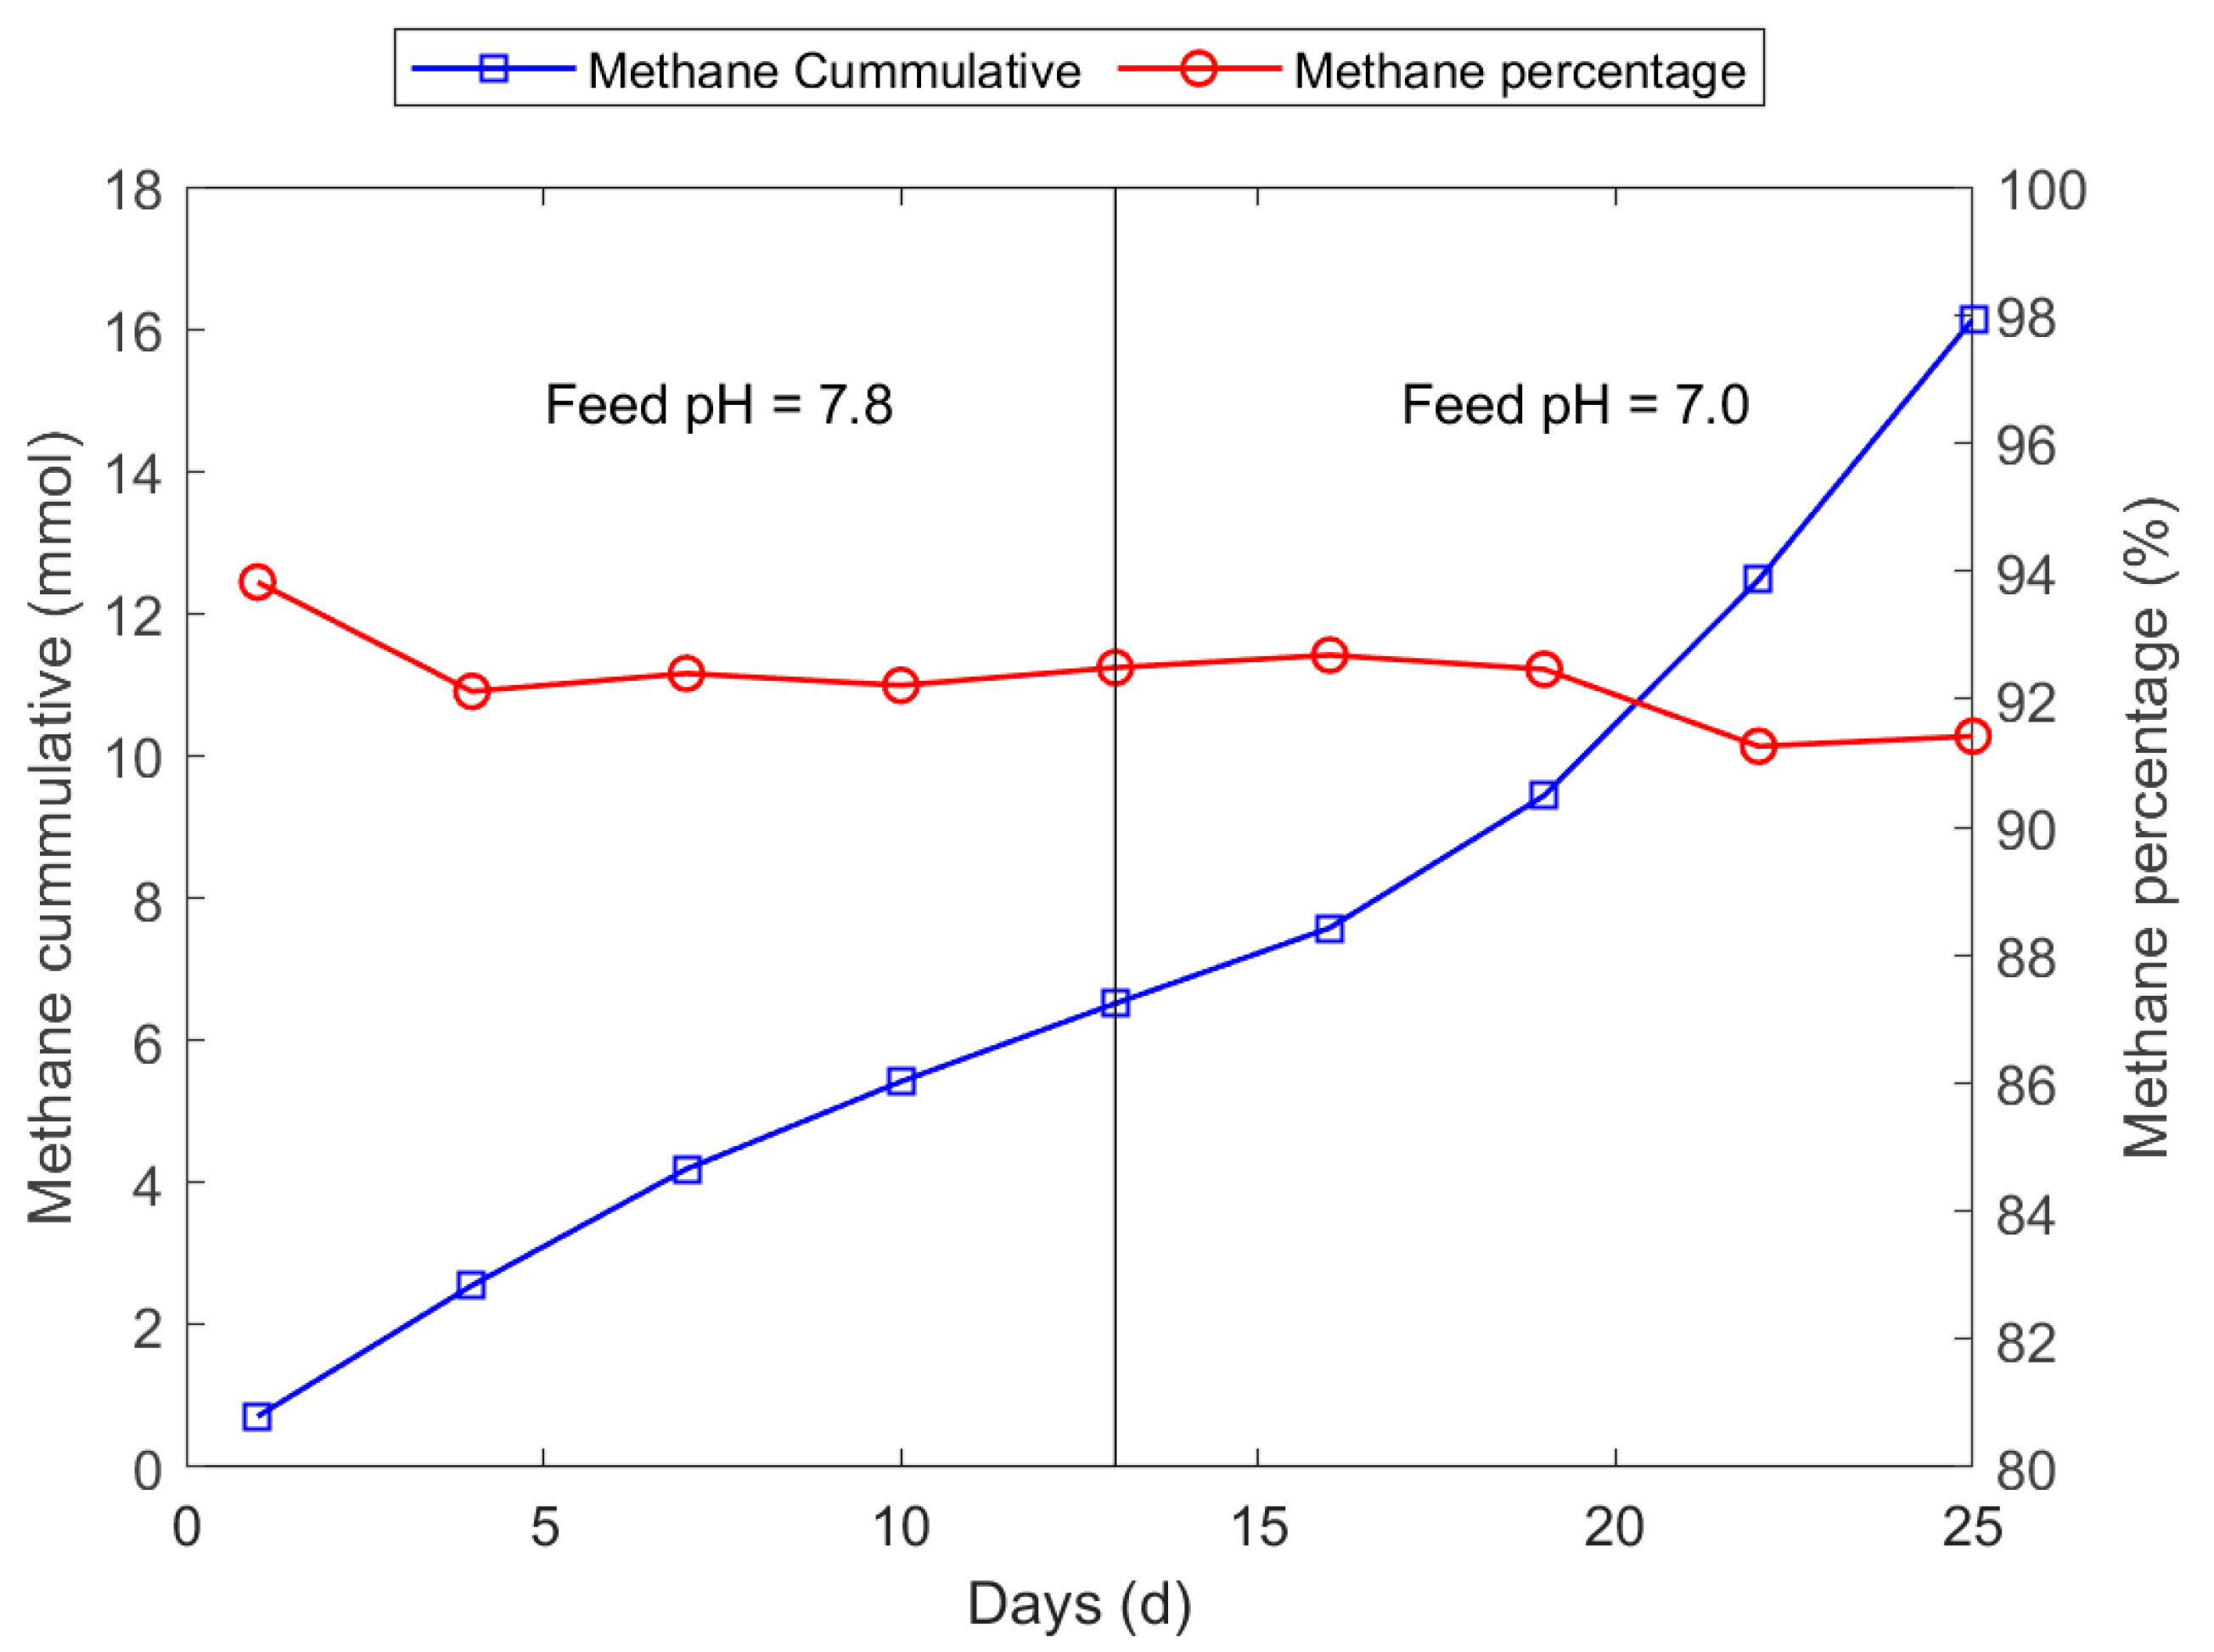
2.2.4. Optimisation of pH

A 25-day continuous flow electrochemical treatment of reject water at 24-h HRT was carried out to investigate the effect of pH on biogas production and coulombic efficiency. The experiment started with an initial feed pH of 7.8 (WaA) at −0.70 V cathode potential. After 13 days, WaA was modified with the addition of phosphate buffer to maintain the feed pH between 6.8–7.0 (WaB). This was done to control the effluent pH below 8.5, and the effects of pH were observed over the final 12 days.

2.2.5. Verification of Optimised MES Performance

Following the optimisation experiments, a set of open circuit and electrochemical experiments were carried out. These experiments help to differentiate between heterotrophic and electrochemical methane production. The experimental setup used was the same as all the experiments described previously (Figure 1). Wa feed was used for both open circuit and MES operations. All the parameters such as COD, alkalinity and gas measurements were recorded at regular intervals. The open circuit operation was carried out over 10 days followed by MES operation for 9 days.

2.3. Analytical Methods and Calculations

The voltage and current were both set and measured using Gamry 1000B potentiostat and the Gamry Framework v7.06 (Gamry Instruments, Warminster, PA, USA) respectively. Chemical oxygen demand and alkalinity of wastewater samples were analysed using COD and Acid capacity Cell Test kits, respectively (Merck, Darmstadt, Germany). Biogas was analysed using the 8610C gas chromatograph (SRI Instruments, Torrance, CA, USA) equipped with a thermal conductivity detector and with a Haysep-D (HD) and MoleSieve (MS13X) column which separates oxygen, nitrogen, methane and carbon dioxide. The carrier gas was Helium at 4 bar pressure and the oven temperature was kept constant at 80 °C.
The electrochemical methane yield (EMY) was calculated according to Equation (4). Eight electrons are required to reduce 1 mole CO2 to produce 1 mole of CH4. The heterotrophic methane yield (HMY) was calculated according to Equation (5). One mole of acetic acid requires 64 g of oxygen for complete oxidation (COD) and 1 mole of COD produces 1 mole of methane gas.
E M Y = [ X   ( m L ) 24,450   m L ] [ n e   ( C ) 8 F   ( C ) ] × 100
H M Y = [ X   ( m L ) 24,450   m L ] [ ( C O D f e e d C O D e f f l u e n t ) v o l u m e   o f   f e e d 64 ] × 100
where X is the volume of methane produced, and one mole gas at 25 °C at 1 atm occupies a volume of 24,450 mL. ne is the number of electrons consumed, which can be calculated as an integral of current over time (obtained from Gamry Echem Analyst v7.06) and F is Faradaic constant (96,485 C/mol e).

3. Results and Discussion

3.1. Biofilm Growth

The total solids and volatile solids of centrifuged reject wastewater (W) were 6915 mg/L and 5185 mg/L, respectively. COD of W was 1600 mg/L and the acetic acid concentration was 66.7 mg/L. Biofilm growth was visibly significant on the electrodes that were positioned in the middle and bottom of reactor R1. The current corresponding to −1.00 V vs. SHE was measured at 0.20 mA initially and gradually increased to around 7.50 mA where it attained steady state. As the potential was decreased by 0.05 V every week, the current decreased immediately (around 1–2 mA) and increased gradually over the week to a steady current by the end of the week. The biofilm growth was determined to be stable when current remained constant over a period of one week in continuous operation.

3.2. Biomethane Production Experiment

The biomethane production experiment was carried out under potentiostatic conditions at −0.80 V vs. SHE and was able to produce 550 mL of biogas during the 1-week evaluation period (Table 1). The methane content was approximately 91%. The methane production rate was recorded as approximately 21.7 mmol/L(reactor)-day. The COD was reduced from 3160 mg/L to 1422 mg/L and the pH of the effluent changed to around 7.8–7.9 from the feed pH of around 7.0 (Wa). The overall efficiency was 80.5% with methane conversion rate of 304.1 mL/mg-COD (87% of max. theoretical conversion). The simultaneous occurrence of electrochemical and heterotrophic methanogenesis results in such high COD to methane conversion rates. The EMY was measured to be 467.8% and suggests that a large portion of methane was produced via heterotrophic methanogenesis.
However, low concentrations of CO2 in the biogas (i.e., 7%; CO2 concentrations of around 35–45% are found in biogas produced via traditional anaerobic digestion reaction [28]) suggests electrochemical reduction of CO2. With an aim to determine the electrochemical activity, the next set of experiments were performed by autoclaving the reject water before the addition of acetic acid and sodium bicarbonate (WaA) effectively reducing heterotrophic methanogenesis.

3.3. Optimisation of Cathode Potential

The total methane production in the 34 days of continuous flow operation was about 541 mL (22.1 mmol) with an average methane percentage of about 85% (432 mL or 17.7 mmol). It has been previously reported that when the applied cathode potentials are more negative than −0.75 V vs. SHE electrochemical CO2 reduction reactions result in simultaneous production of acetic acid (electrochemical) and methane rather than methane alone [5]. Therefore, to identify the optimal cathode potential for methane production, we begin the experiment at −0.80 V and reduce it step by step to −0.55 V.
The methane production rates (MPR; Figure 2) in these experiments ranged from 0.94 to 6.10 mmol/L(reactor)-day. The lower production rates during first two days of the experiment could be due to the use of autoclaved feed and the total dependence on biocathode for methane production. However, the MPRs increase and stabilize around 1.5 to 3 mmol/L(reactor)-day over the next few days, suggesting biofilm acclimatization to the experimental conditions. The production rates increased as the cathode potentials were changed from −0.80 to −0.65 V and decreased thereafter. High MPRs of about 5.75 to 6.10 mmol/L(reactor)-day occurred when the cathode potential was maintained at −0.65 V, which was double the production rate obtained in Section 3.2. MPRs were also low when the cathode potentials were more negative than −0.65 V which could be due to CO2 conversion to acetic acid rather than methane [4]. The electrochemical reduction of CO2 to acetic acid contributes to the increase in COD concentration of the effluent and thereby results in a low COD to methane conversion rate. The methane concentration in biogas was found to be around 83–87% during the first 23 days of operation that correspond to cathode potentials of −0.8 to −0.65 V. High concentrations of methane (90–93%) were obtained when the applied potential was −0.60 V. Therefore, the optimum cathode potential for electrochemical CO2 reduction to methane with relatively high MPRs was found to be between −0.70 V and −0.60 V.
This is also reflected in the EMY plot (Figure 3) where the yield gradually increased from 45% to 110% when the potentials were changed from −0.80 V to −0.55 V. The slight dips in the EMY plot correspond to the changes in applied cathode potentials. However, the EMY recovers and surpasses its previous value at every cathode potential. Unlike EMY, the current generated increased gradually from the applied potentials of −0.80 V to −0.65 V and decreased abruptly at a potential of −0.60. The current remained constant and never recovered even after 9 days of potentiostatic operation at −0.55 V.
It can also be observed that at cathode potentials of −0.60, and −0.55 V, the EMY is consistently maintained above 100% even with decreasing current from 6.43 mA to 5.40 mA, respectively (Figure 3). This can be attributed to favourable heterotrophic methane production. In other words, cathode potentials more positive than −0.65 V limit the electrochemical activity of CO2 reduction to either acetic acid or methane, and cathode potentials more negative than −0.65 V support simultaneous electrochemical acetic acid and methane production. An optimised cathode potential or voltage provides an opportunity to decrease the input cost of the electrochemical technology.
EMYs above 100% denote simultaneous electrochemical and heterotrophic methanogenic activities, albeit at a low rate due to the high pH. The pH of the effluent in the beginning of the experiment was about 8.1, but it gradually increased to about 8.7 (not represented graphically). This can be attributed to the consumption of protons through electrochemical activity, thereby affecting heterotrophic methanogenesis. This is also reflected in the overall methane production rate that was lower than when the effluent pH was 7.8 (Section 3.2). These preliminary observations on the effect of pH form the basis for the next set of experiments.

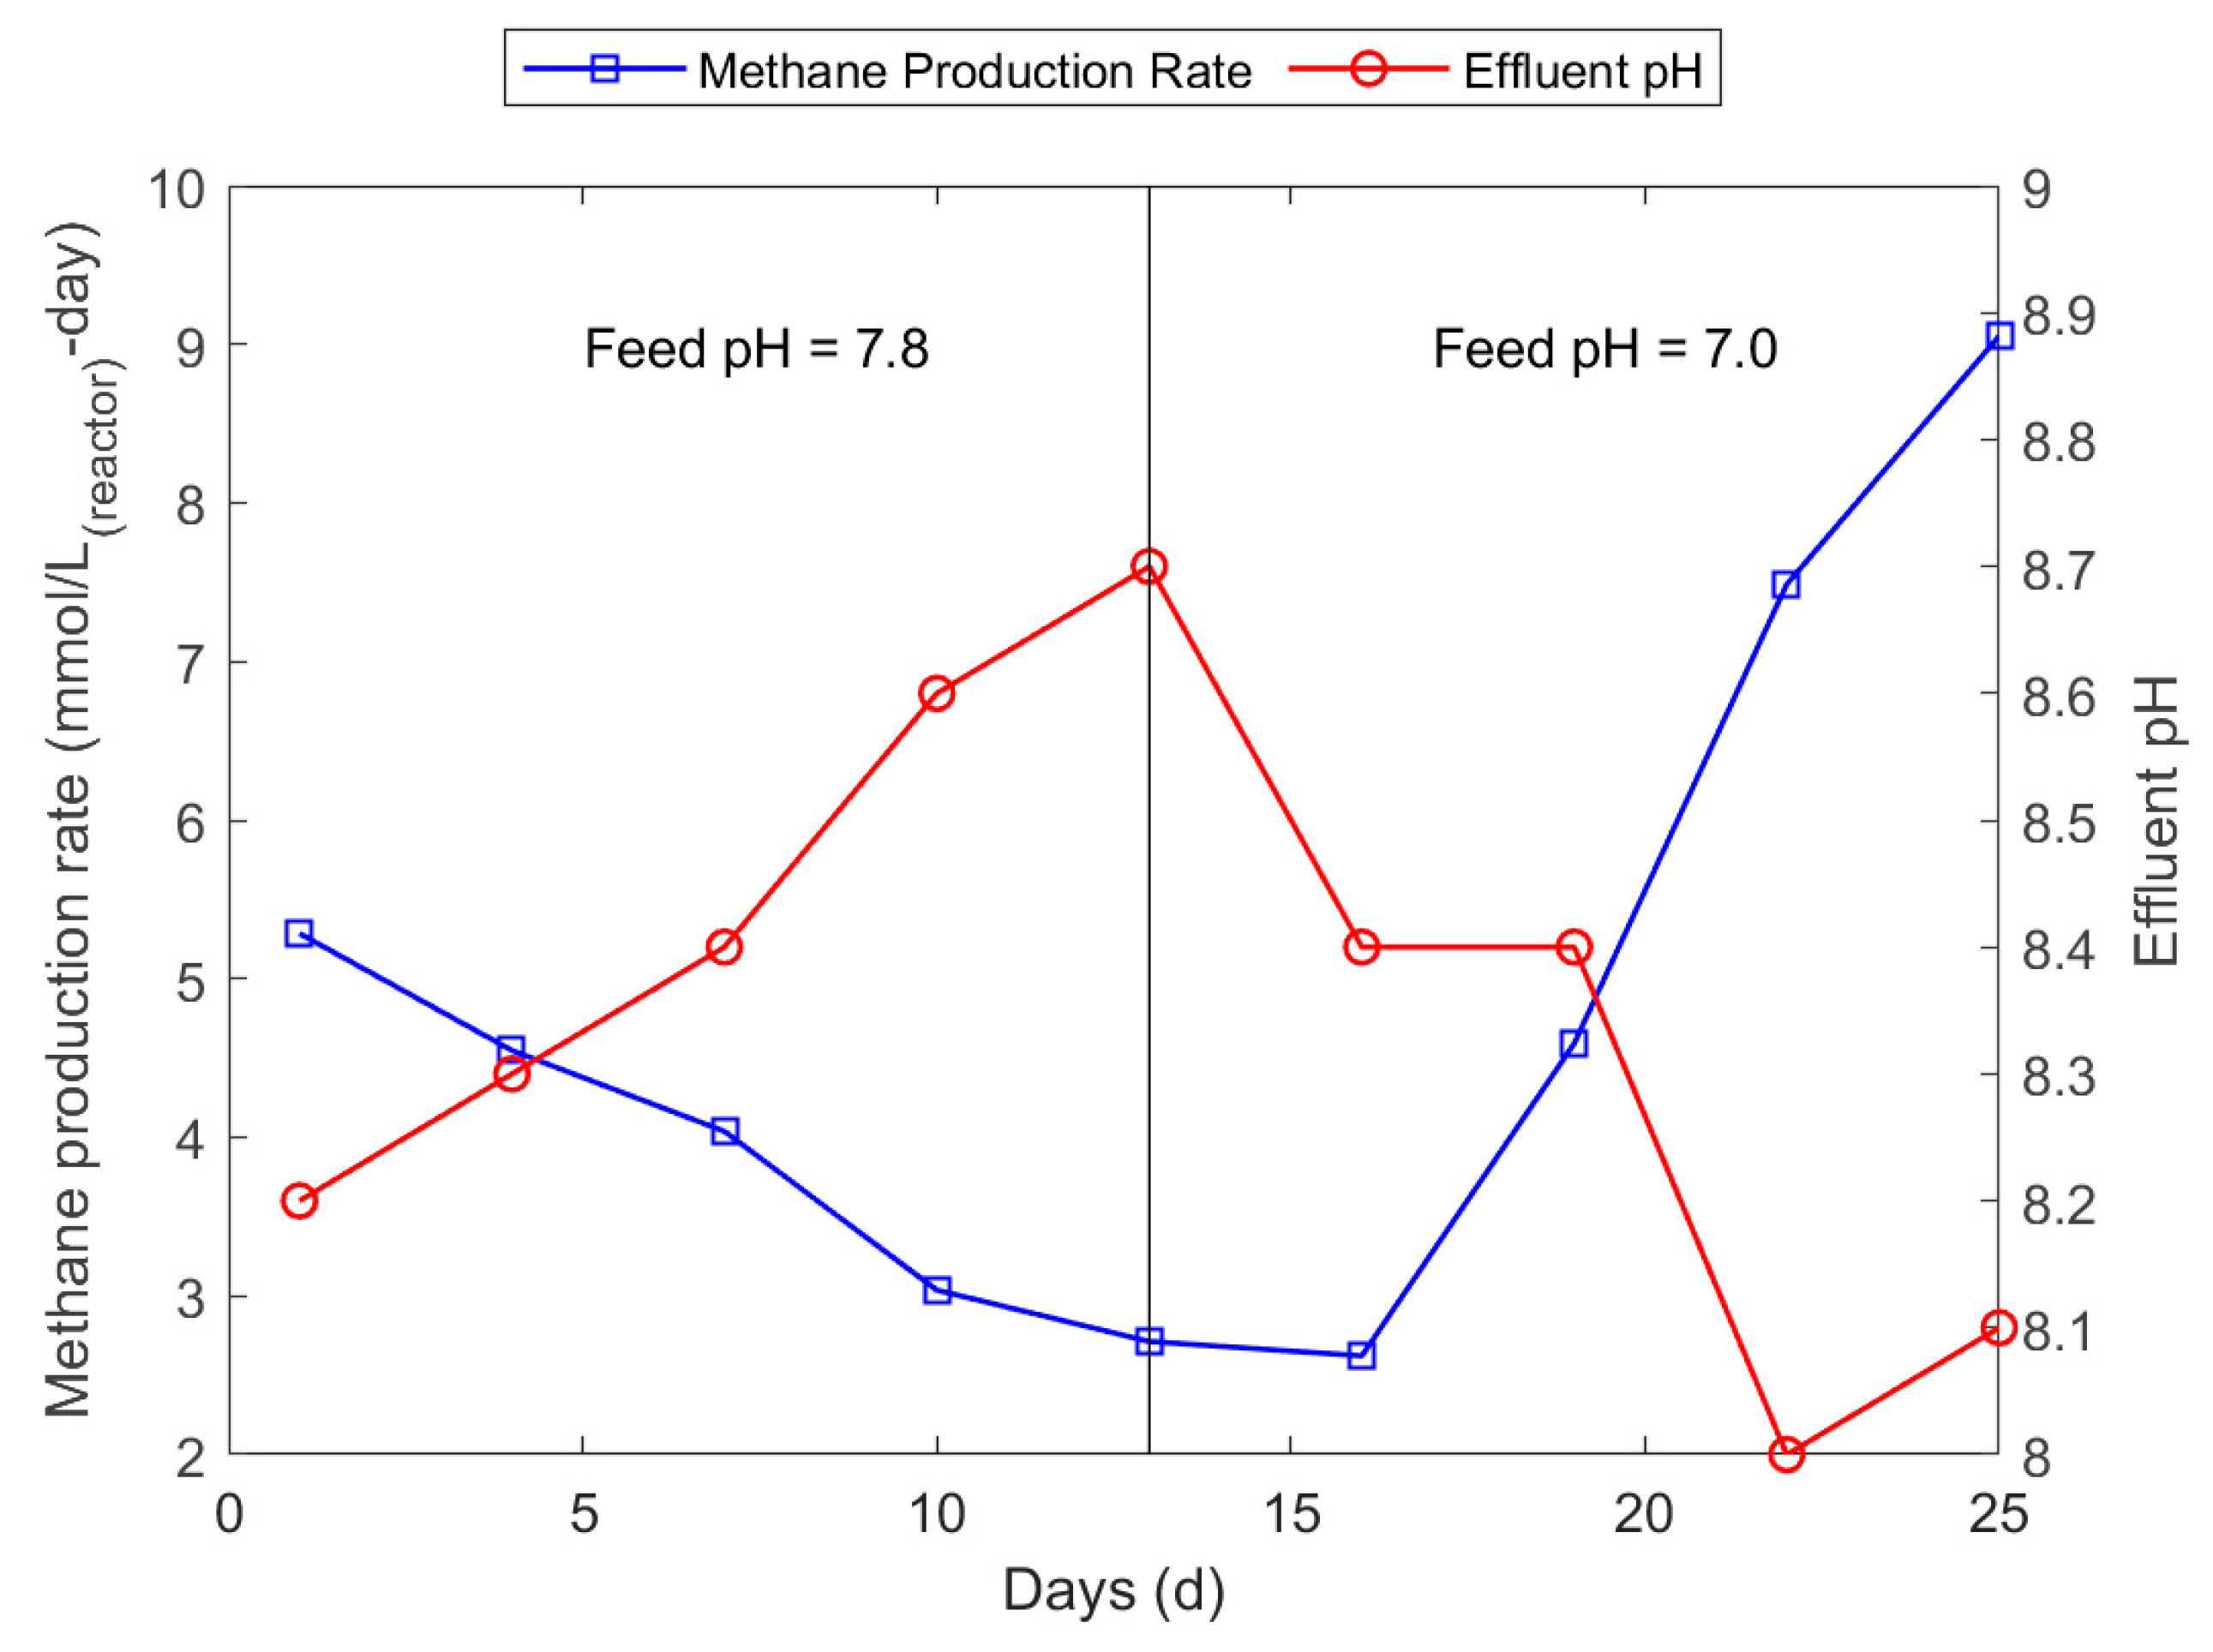
3.4. Optimisation of pH

The overall methane production in the 25 days of this −0.70 V potentiostatically operated experiment was around 432 mL (17.7 mmol) with an average methane concentration of about 91.4% (395 mL or 16.1 mmol; Figure 4). While the reaction was continuously fed with WaA (feed pH ~7.8) and operated potentiostatically at −0.70 V, the effluent pH can be seen increasing from 8.2 to 8.7. Correspondingly, a fall in methane production rates (MPRs) from about 5.28 mmol/L(reactor)-day to its lowest value of 2.62 mmol/L(reactor)-day is observed (Figure 5). Thereafter, a change of feed to WaB (pH of ~7.0) generated a significant impact on the effluent pH and thereby the MPRs. The effluent pH was gradually brought down to 8.1 and this in turn improved the MPR significantly to 9.05 mmol/L(reactor)-day (Figure 5).
EMY during the first half of the experiment starts at 87.7%, reaches the lowest value of 70% and stabilises at around 77% (Figure 6). However, during the second half of the experiment, it rises to 225% at an exponential rate. This clearly shows the impact of pH on methane production. High ranges of pH ~8.7 have been reported to eliminate or reduce the heterotrophic methanogenesis activity [29]. This means that during the first half of the experiment, a majority of methane production was autotrophic and during the second half, a large portion of methane production was heterotrophic. This suggests that the pH directly affects only heterotrophic methanogenesis. This can also be confirmed from the values of current generated (or electrons supplied) in the last week of the experiment that have remained constant, while the MPR and EMY have increased significantly. This emphasizes that the impact of pH was not significant on the electrochemical CO2 reduction to methane.
Another observation that contributes to this hypothesis is the methane concentration in biogas. It can be observed in Figure 4 that the methane percentage is continually maintained around 92–93% for the first 20 days. As the feed pH is decreased, the increased heterotrophic activity leads to a slight decrease in the methane concentration to about 91%. This can be attributed to the production of heterotrophic biogas that contains relatively higher concentrations of CO2 [28]. These observations provide a new argument that electrochemical CO2 reduction does depend on pH indirectly, as it reduces the heterotrophically generated CO2. Moreover, it can be concluded that electrochemical methane production is not directly dependent on the pH but more dependent on the biofilm cover and the applied potential. An open circuit experiment is carried out to determine the share of methane production through each of the two production pathways.

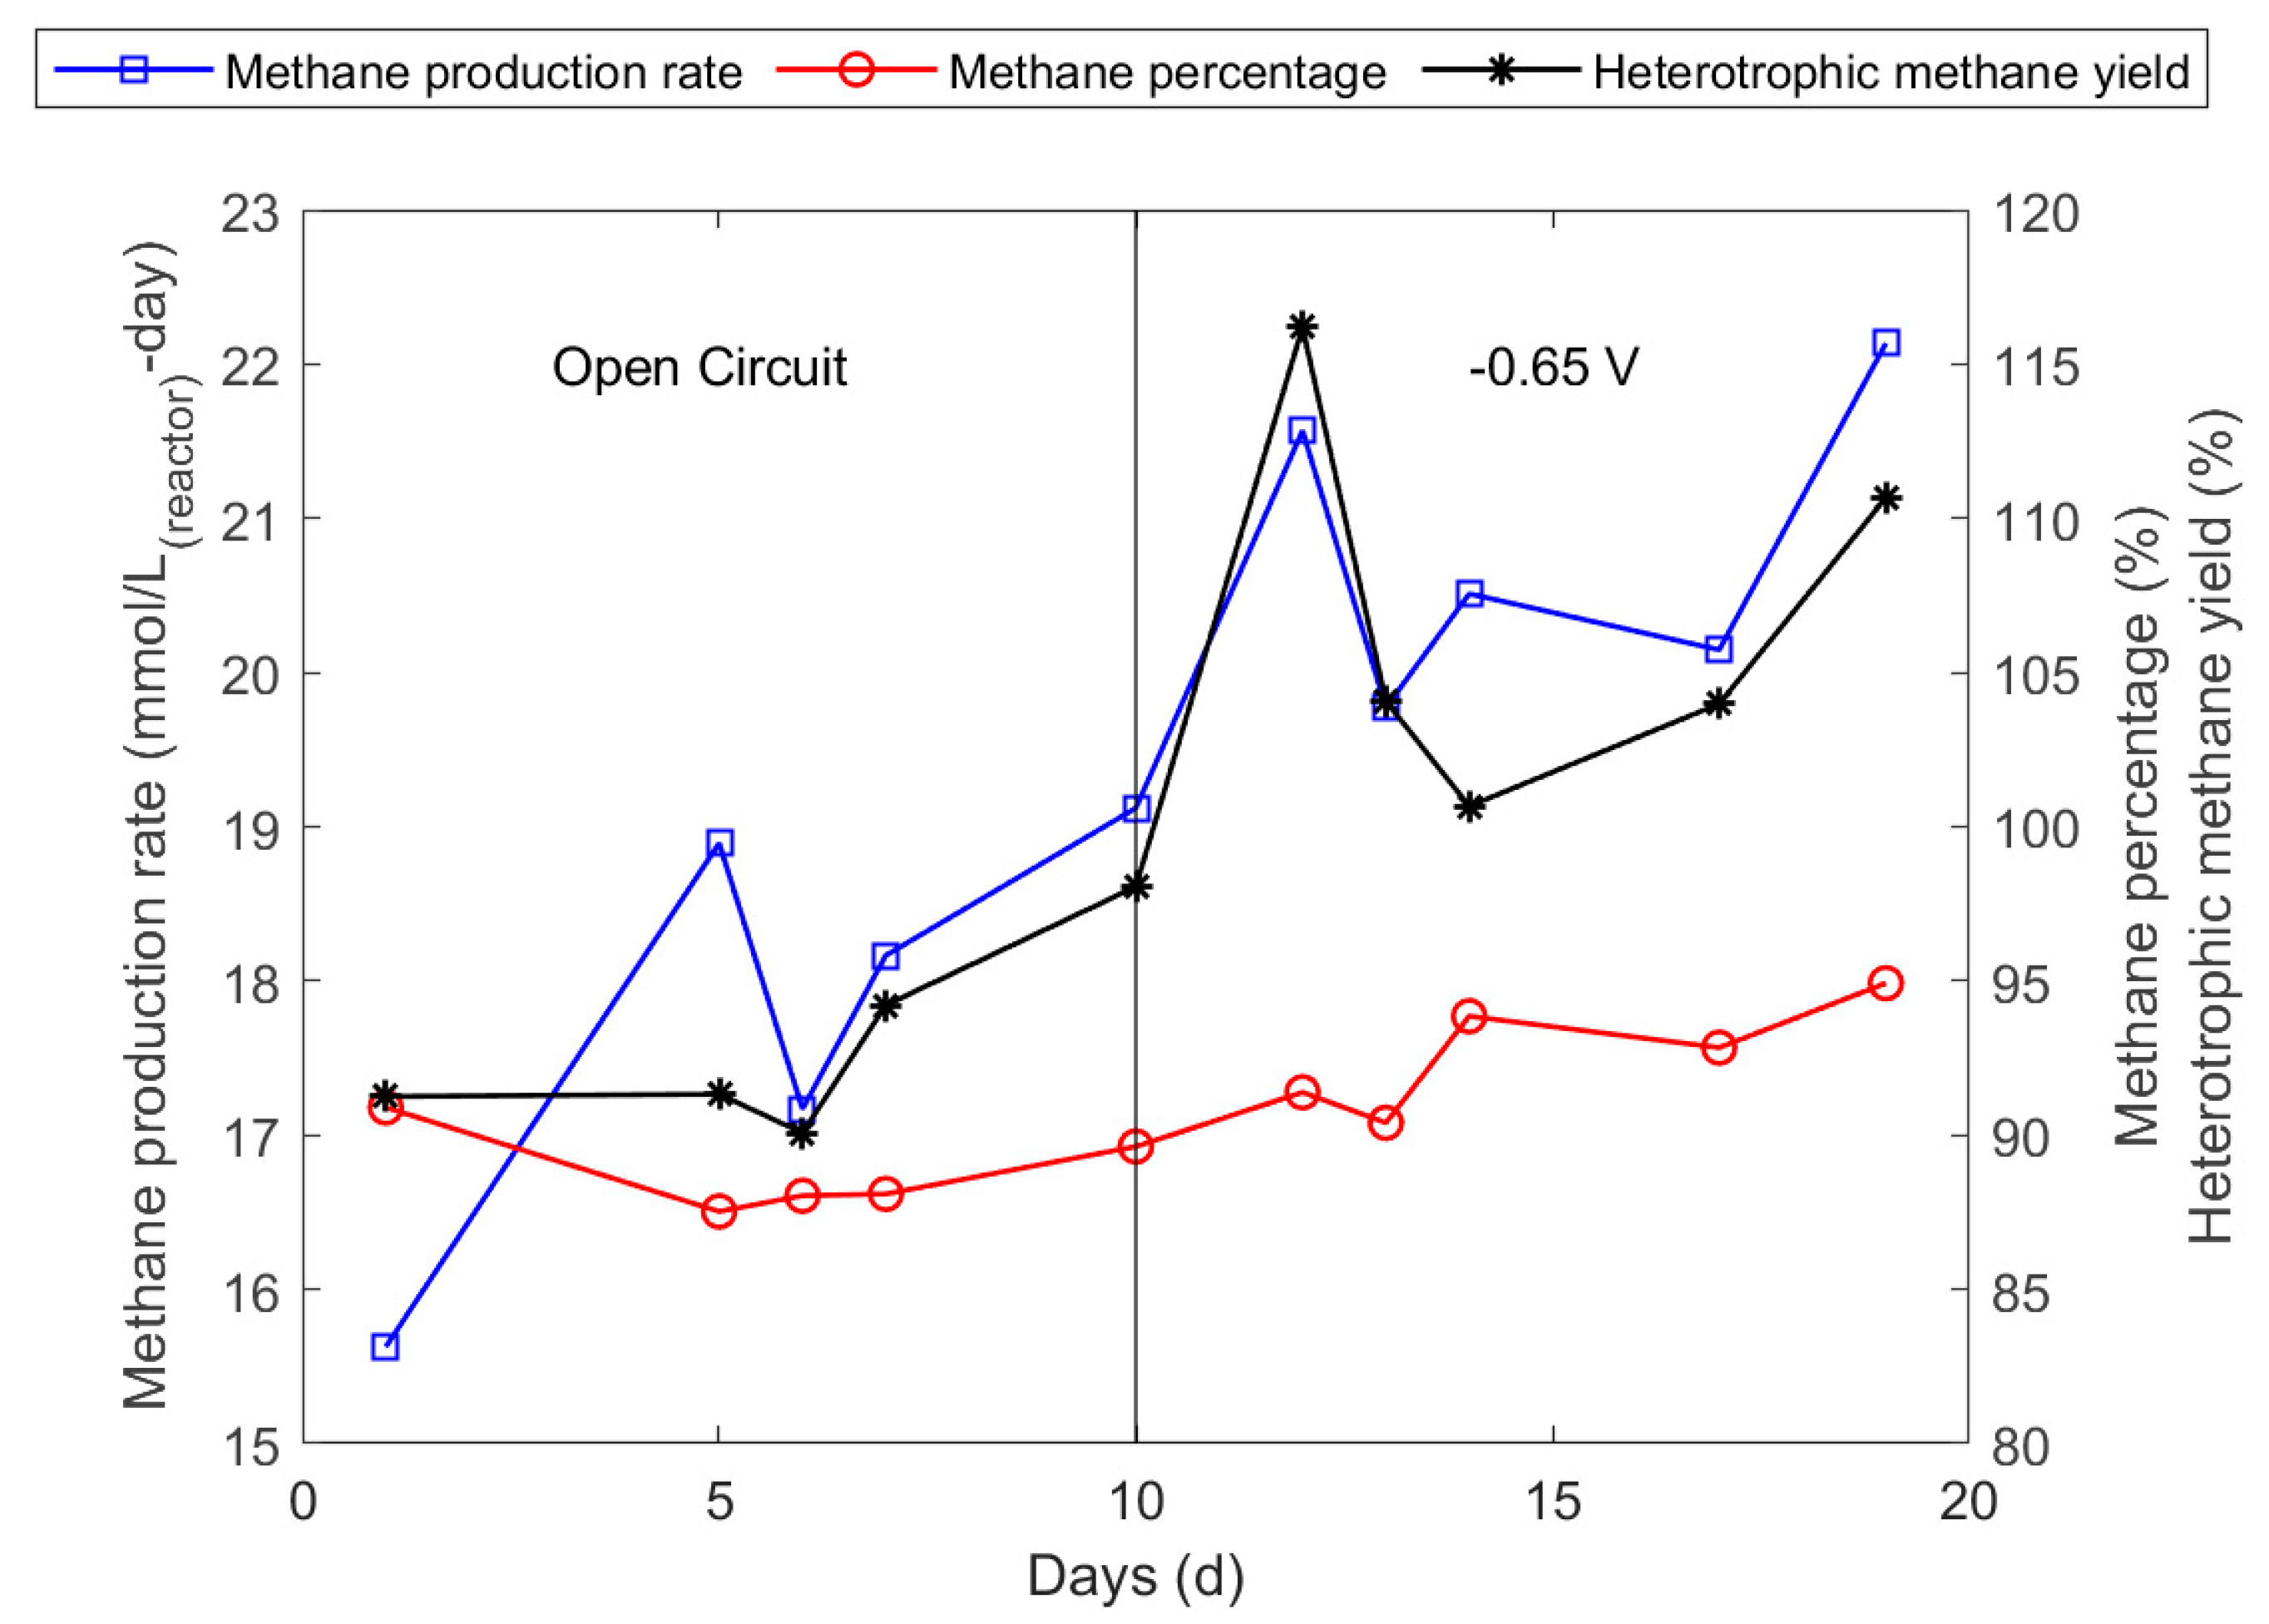
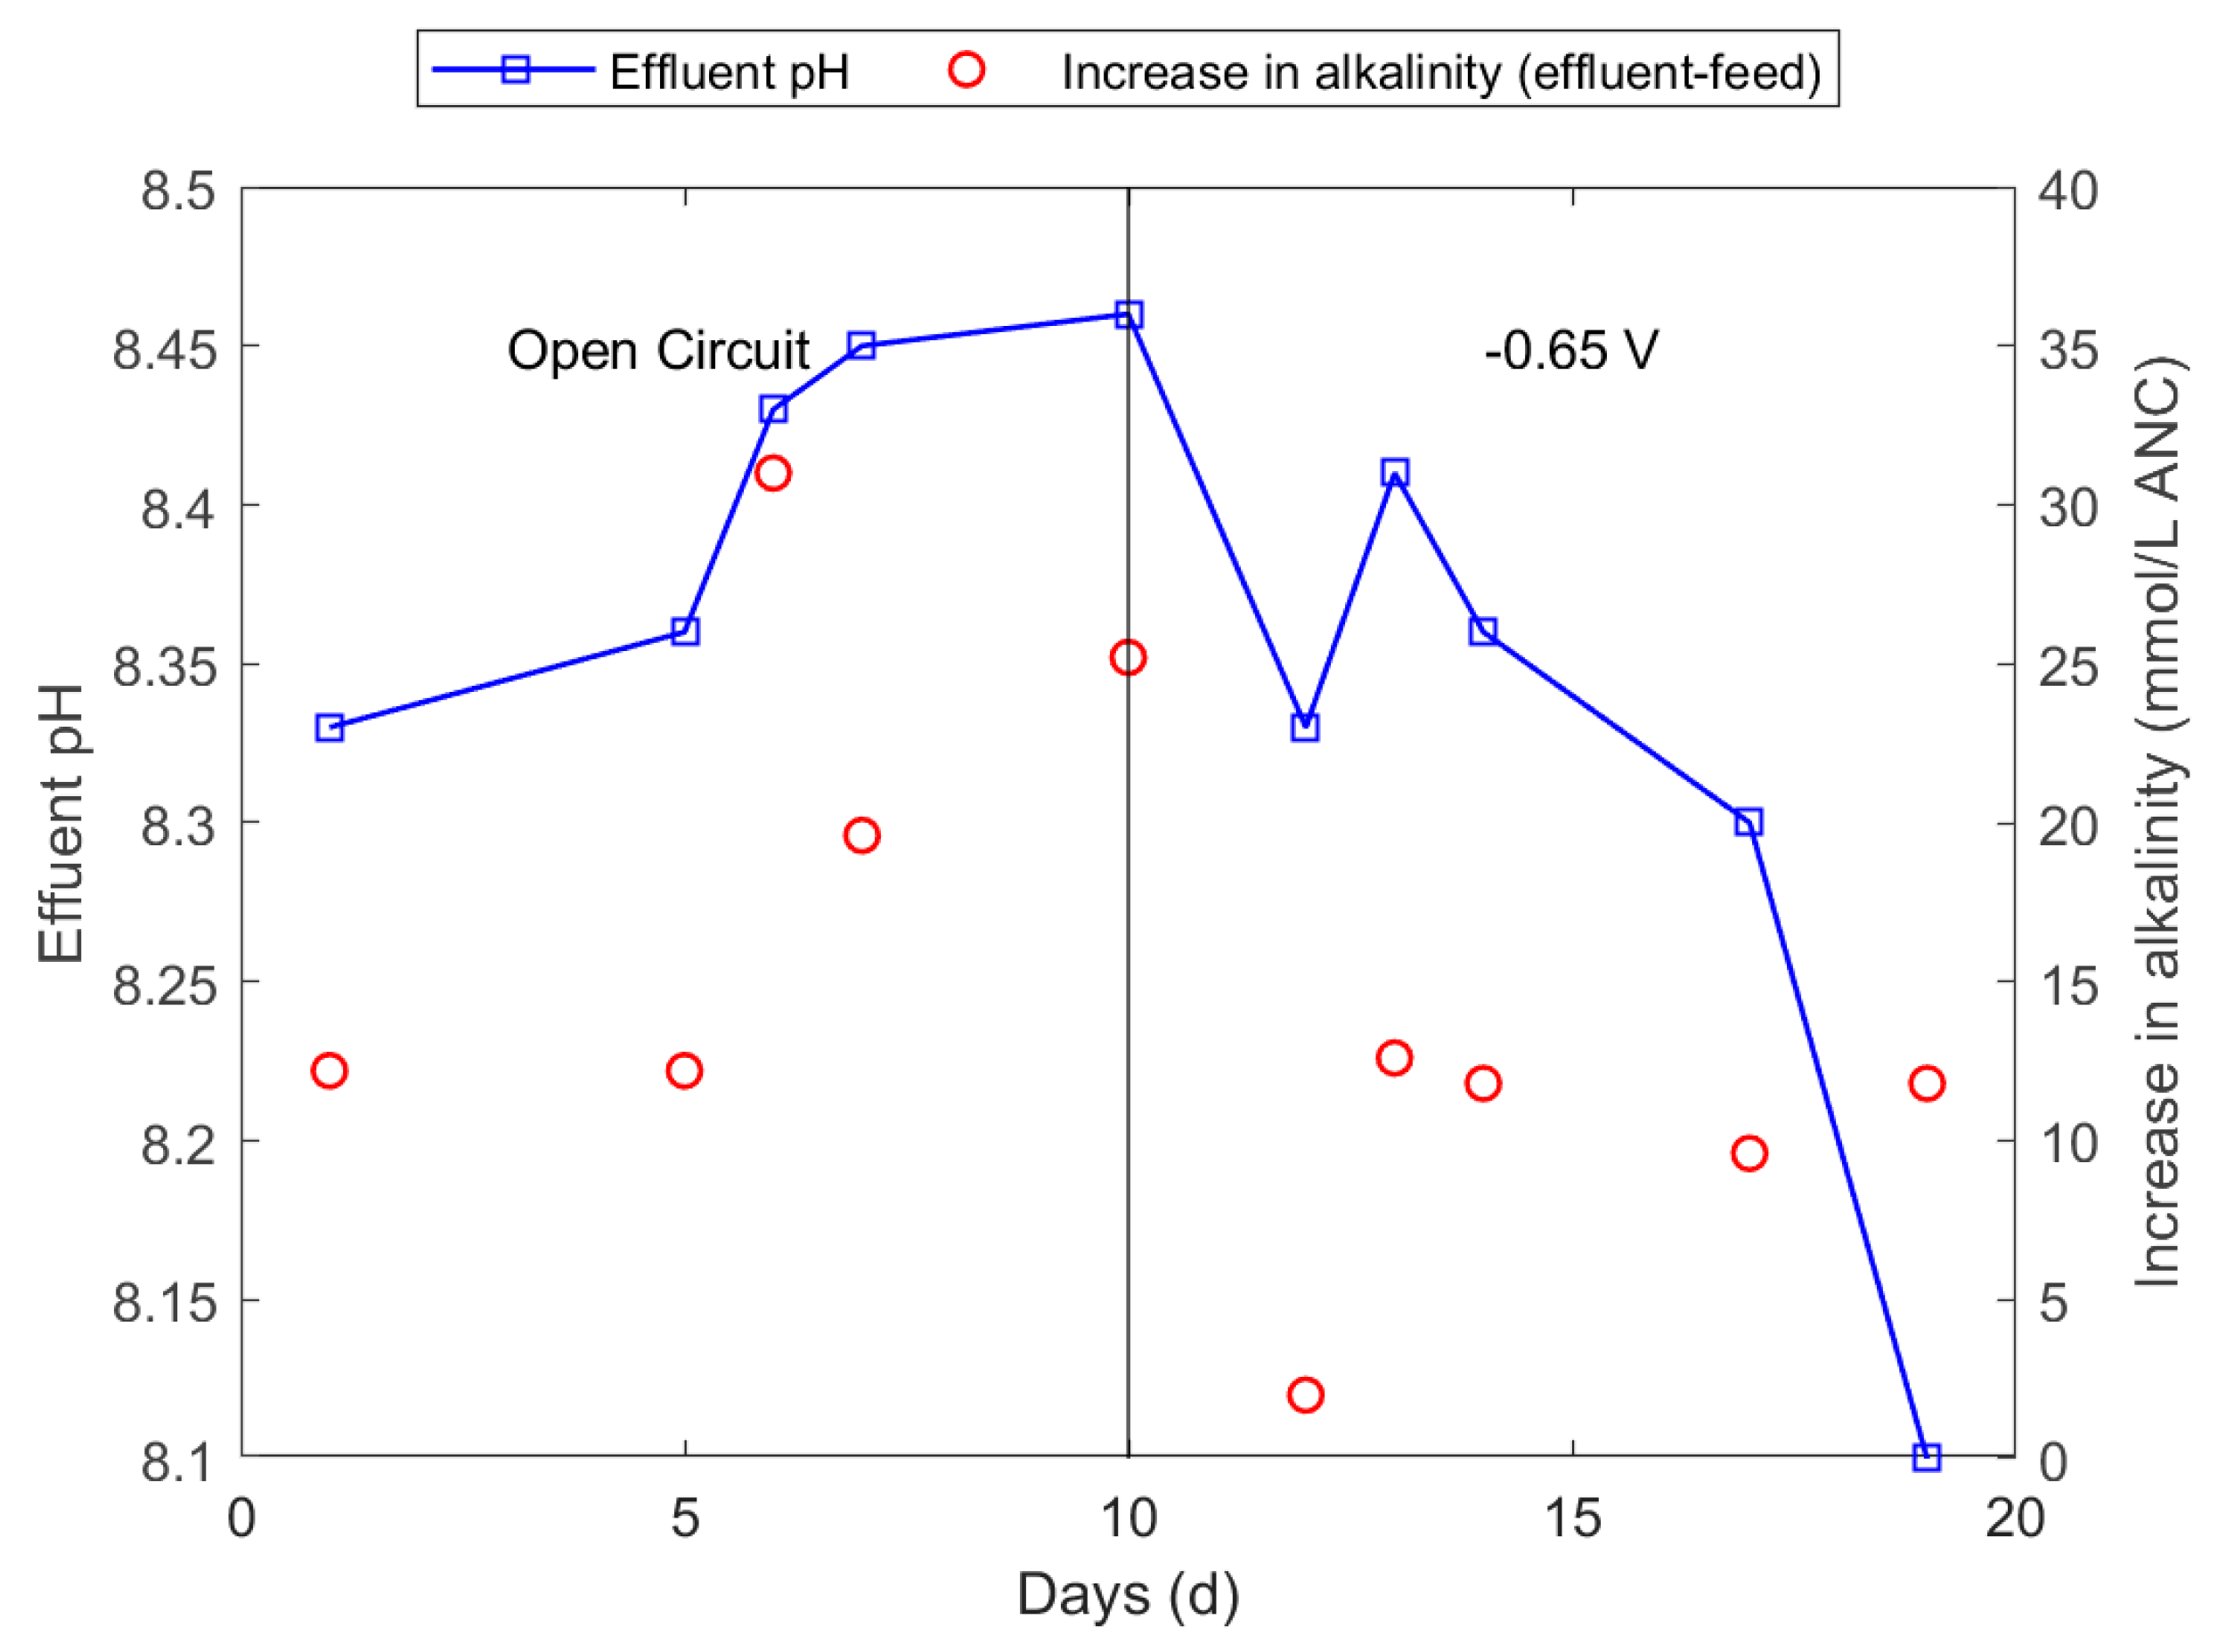
3.5. Verification of Optimised MES Performance

The open circuit experiment was carried out at feed pH 7.0 with the potentiostat turned off and for the MES experiment, a cathode potential of −0.65 V was provided keeping the same feed. The average MPR (Figure 7) during open circuit operation (10 days) was measured to be 18.4 ± 1.3 mmol/L(reactor)-day and for the MES mode operation was around 20.9 ± 0.9 mmol/L(reactor)-day. This is an increase of approximately 13.6% in MPR due to the supply of electricity. Highest MPR of about 19.1 mmol/L(reactor)-day was obtained during open circuit operation whereas during MES mode, the peak MPR was about 22.1 mmol/L(reactor)-day. Further, COD analysis (Figure 7) during open circuit operation reveals HMY to be approximately 93.5% of COD consumed (607 mL/649.3 mL) whereas for MES mode, HMY was around 107.7% (623.6 mL/578.7 mL). The extra methane produced represents electrochemical CO2 reduction to methane, which is 98.9% (44.9 mL/45.4 mL) efficiency in supplied electrons to methane conversion. At the same time, the methane concentration (Figure 7) in biogas for open circuit operation is consistently below 90% whereas for MES operation it has been consistently above 90%. High methane percentages in open circuit operation indicate CO2 solubilisation within the reactor and therefore, require alkalinity analysis.
Alkalinity of the reactor effluent denotes the acid capacity of the liquid in terms of dissolved hydroxide, bicarbonate or carbonate and is measured as mmol/L acid neutralizing capacity (ANC). When the pH is in the range of 8 to 8.4, alkalinity is mainly found in the form of bicarbonate [30] and as pH decreases, bicarbonate is transformed into CO2. The red circles in Figure 8 represent the ‘increase in alkalinity’ or the change in amount of dissolved carbon dioxide within the reactor compared to the feed Wa. It can be observed that during open circuit operation the increase in alkalinity was more than the increase during the MES mode of operation. A similar trend can be seen with effluent pH (Figure 8) which also decreased as the experiment progressed towards electrochemical operation. These trends denote a decrease in CO2 solubility within the reactor. Combined with high methane percentages in produced biogas, these results indicate electrochemical CO2 conversion to methane. However, during the MES operation, the average current production remained very low at approximately 2 mA. Further attempts are being made to divert more microorganisms towards electrochemical methane production and increase current density. More importantly, new strategies must be developed to extract more energy-rich compounds from the carbon dioxide fed or produced within the reactor. This could mainly be done by controlling the pH within the reactor and keeping it less than 8.0 while maintaining the feed pH at 7.0. It will also be interesting to look at the effects of decreasing HRT on MES performance, as increased flow rate could control pH effectively.

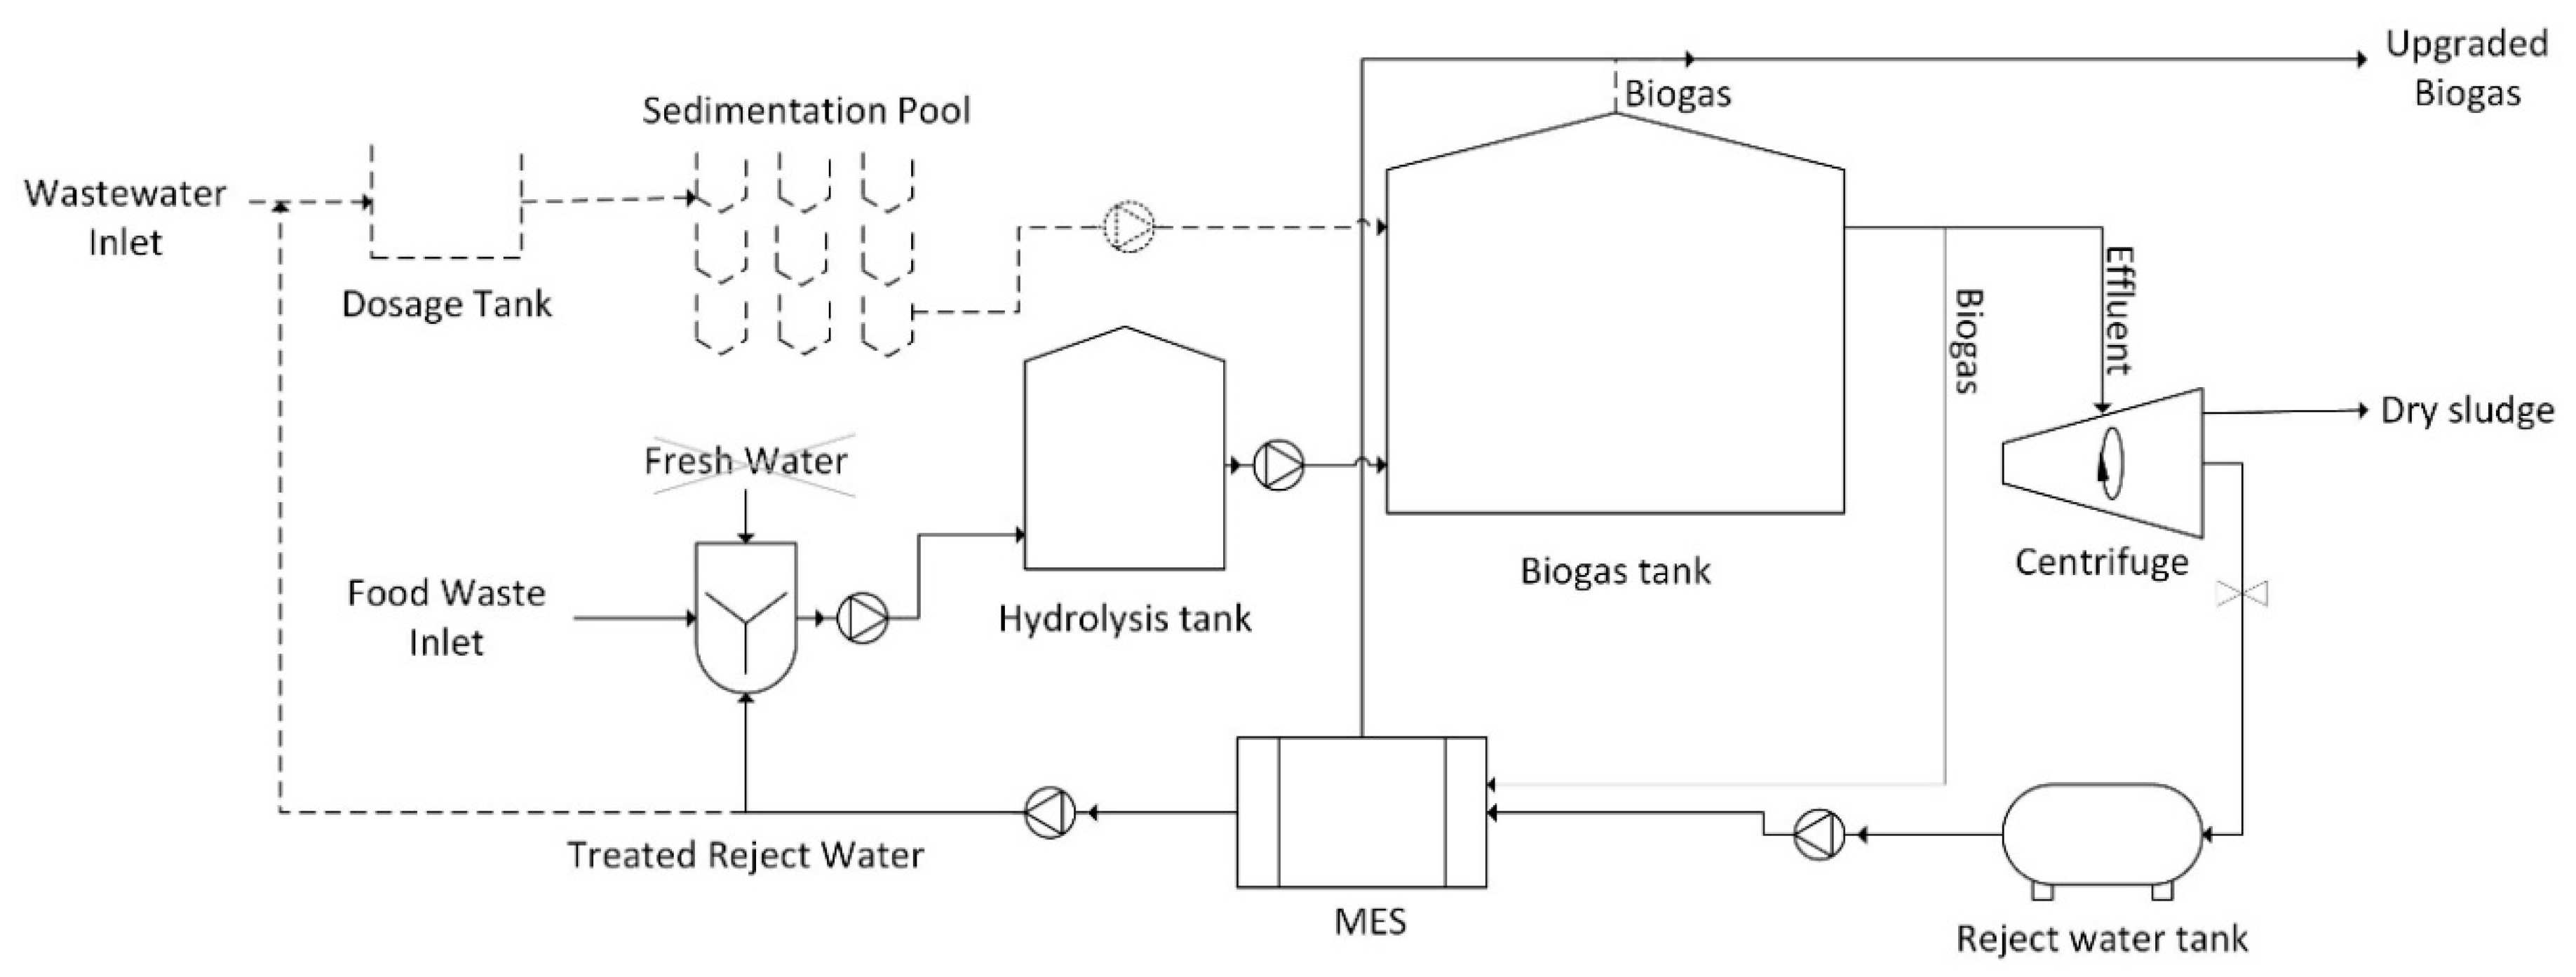
3.6. Proposed AD-MES Integrated System

Results indicate that the electrochemical treatment of reject water can be used as a biogas upgradation technology. The optimised cathode potentials and pH provide proof-of-concept for electrochemical CO2 reduction. Figure 9 describes the assembly of a food waste (solid lines) and/or wastewater treatment plant (dashed lines) and suggests implementation of an integrated MES unit. The inlets follow through a series of processing steps until the slurry is pumped into a biogas tank. The biogas generated is collected from the top and is sent either for upgrade or low value usage. Digested sludge is then centrifuged to separate the solids and liquid fraction otherwise called reject water. Reject water can contain a COD concentration ranging from 1000 to 8000 mg/L [31] depending on the type of feed and efficiency of biogas tank.
In food waste treatment plants, reject water is generally recycled for reducing total solids (TS) in the inlet feed, such that the mixture can be pumped without hindrance. It is also a common practice to use fresh water (make-up water) to achieve the desired TS and control inlet ammonium concentration. While in a WWTP, reject water goes back to the main wastewater inlet, that could be in the order of 1/100 of the total inlet flow and can, in many cases, causes instabilities in the main treatment train (coagulation-sedimentation); it therefore necessitates a reject water treatment system in existing WWTPs [32].
The proposed MES unit integration in a generalized biogas process as shown in Figure 9 has several advantages in addition to the benefit of biogas upgradation, such as the potential to reduce COD, ammonium and sulphide concentrations of reject water. An improved quality of the reject water will result in overall process optimization. It could completely eliminate the use of fresh water for food waste treatment plants and avoid variations in the main treatment train of typical WWTPs. Furthermore, there is a possibility of feeding biogas generated from the anaerobic digester to be upgraded to methane via electrochemical reduction of CO2 already present in the biogas. This can be achieved by reducing the pH of reject water such that the CO2 in biogas is made to dissolve in the feed. At the same time, the design of the MES reactor should allow the dissolved CO2 to react with the electrons from the cathode.
Existing food waste or wastewater treatment plants could be refitted with the MES process as it neither interferes with the infrastructure present in the treatment plant nor is it a limiting capital investment. The system does not require extra feed as it generates more (methane, less pollution) from what is already available in the process and in this way, it is able to generate much more value than the investment it demands. However, research at this stage lacks information on mass balance, control experiments, hydraulic retention time and other waste feeds. Also, an economic analysis of integrated anaerobic digesters and microbial electrosynthesis systems is required to completely understand the scalability of such an integrated system.

4. Conclusions

From these experiments, it can be said that electrochemical methane production has huge potential to be one of the alternate fuel solutions. The cathode potential analysis revealed that electrochemical methane production is possible even at potentials as low as −0.55 V vs. SHE. The optimum cathode potential remains between −0.70 V and −0.60 V. Methane concentrations above 90% were consistently achieved. The carbon dioxide concentrations in biogas were kept below 15% in all the cases, achieving 50–60% reduction in CO2 emissions in biogas production processes. We could also observe that when the feed/effluent pHs were kept high (i.e., >7.0/8.4 respectively), most of the methane is produced via the electrochemical pathway. As the pH moves closer towards neutral, coulombic efficiencies of over 200% were achieved, which is evidence of simultaneous electrochemical and heterotrophic methane production. The control experiments provide evidence of electrochemical CO2 reduction showing an improvement of about 13.6% in terms of the average methane production rate. These experiments also show a decrease in the amount of CO2 dissolving within the reactor when the electrodes are supplied with electricity. Further investigations are required to distinguish the mechanism of electron transfer during electrosynthesis of methane and/or acetic acid and how they depend on the applied cathode potential.

Author Contributions

Conceptualization, A.B.T.N. and C.D.; Methodology, A.B.T.N.; Validation, C.D.; Investigation, A.B.T.N.; Resources, C.D.; Data curation, A.B.T.N.; Writing—original draft preparation, A.B.T.N.; Writing—review and editing A.B.T.N. and C.D.

Funding

This research was funded by the Norwegian Ministry of Education and Research through the Ph.D. program in Process, Energy and Automation Engineering at University of South-Eastern Norway. The APC was funded by University of South-Eastern Norway.

Acknowledgments

Authors acknowledge Mrs. Sruthi Subramanyam for helping with the schematic diagram (Figure 1) in the article.

Conflicts of Interest

The authors declare no conflict of interest.

References

  1. Nelabhotla, A.B.T.; Dinamarca, C. Electrochemically mediated CO2 reduction for bio-methane production: A review. Rev. Environ. Sci. Bio/Technol. 2018, 17, 531–551. [Google Scholar] [CrossRef]
  2. Sánchez, O.G.; Birdja, Y.Y.; Bulut, M.; Vaes, J.; Breugelmans, T.; Pant, D. Recent advances in industrial CO2 electroreduction. Curr. Opin. Green Sustain. Chem. 2019, 16, 47–56. [Google Scholar] [CrossRef]
  3. Angenent, L.T.; Usack, J.G.; Xu, J.; Hafenbradl, D.; Posmanik, R.; Tester, J.W. Integrating electrochemical, biological, physical, and thermochemical process units to expand the applicability of anaerobic digestion. Bioresour. Technol. 2018, 247, 1085–1094. [Google Scholar] [CrossRef] [PubMed]
  4. Mueller, J.R. Microbial Catalysis of Methane from Carbon Dioxide. Ph.D. Thesis, The Ohio State University, Columbus, OH, USA, 2012; pp. 1–107. [Google Scholar]
  5. Jiang, Y.; Su, M.; Zhang, Y.; Zhan, G.; Tao, Y.; Li, D. Bioelectrochemical systems for simultaneously production of methane and acetate from carbon dioxide at relatively high rate. Int. J. Hydrog. Energy 2013, 38, 3497–3502. [Google Scholar] [CrossRef] [Green Version]
  6. Siegert, M.; Li, X.F.; Yates, M.D.; Logan, B.E. The presence of hydrogenotrophic methanogens in the inoculum improves methane gas production in microbial electrolysis cells. Front. Microbiol. 2015, 5, 778. [Google Scholar] [CrossRef] [PubMed]
  7. Luo, X.; Zhang, F.; Liu, J.; Zhang, X.; Huang, X.; Logan, B.E. Methane production in microbial reverse-electrodialysis methanogenesis cells (MRMCs) using thermolytic solutions. Environ. Sci. Technol. 2014, 48, 8911–8918. [Google Scholar] [CrossRef] [PubMed]
  8. Fu, Q.; Kuramochi, Y.; Fukushima, N.; Maeda, H.; Sato, K.; Kobayashi, H. Bioelectrochemical analyses of the development of a thermophilic biocathode catalyzing electromethanogenesis. Environ. Sci. Technol. 2015, 49, 1225–1232. [Google Scholar] [CrossRef] [PubMed]
  9. Moreno, R.; San-Martín, M.I.; Escapa, A.; Morán, A. Domestic wastewater treatment in parallel with methane production in a microbial electrolysis cell. Renew. Energy 2016, 93, 442–448. [Google Scholar] [CrossRef]
  10. Siegert, M.; Yates, M.D.; Call, D.F.; Zhu, X.; Spormann, A.; Logan, B.E. Comparison of nonprecious metal cathode materials for methane production by electromethanogenesis. ACS Sustain. Chem. Eng. 2014, 2, 910–917. [Google Scholar] [CrossRef] [PubMed]
  11. Liu, W.; He, Z.; Yang, C.; Zhou, A.; Guo, Z.; Liang, B.; Varrone, C.; Wang, A.J. Microbial network for waste activated sludge cascade utilization in an integrated system of microbial electrolysis and anaerobic fermentation. Biotechnol. Biofuels 2016, 9, 83. [Google Scholar] [CrossRef] [PubMed]
  12. Liu, W.; Cai, W.; Guo, Z.; Wang, L.; Yang, C.; Varrone, C.; Wang, A. Microbial electrolysis contribution to anaerobic digestion of waste activated sludge, leading to accelerated methane production. Renew. Energy 2016, 91, 334–339. [Google Scholar] [CrossRef] [Green Version]
  13. Villano, M.; Monaco, G.; Aulenta, F.; Majone, M. Electrochemically assisted methane production in a biofilm reactor. J. Power Sources 2011, 196, 9467–9472. [Google Scholar] [CrossRef]
  14. Xu, H.; Wang, K.; Holmes, D.E. Bioelectrochemical removal of carbon dioxide (CO2): An innovative method for biogas upgrading. Bioresour. Technol. 2014, 173, 392–398. [Google Scholar] [CrossRef]
  15. Dykstra, C.M.; Pavlostathis, S.G. Methanogenic Biocathode Microbial Community Development and the Role of Bacteria. Environ. Sci. Technol. 2017, 51, 5306–5316. [Google Scholar] [CrossRef]
  16. Villano, M.; Aulenta, F.; Ciucci, C.; Ferri, T.; Giuliano, A.; Majone, M. Bioelectrochemical reduction of CO2 to CH4 via direct and indirect extracellular electron transfer by a hydrogenophilic methanogenic culture. Bioresour. Technol. 2010, 101, 3085–3090. [Google Scholar] [CrossRef] [PubMed]
  17. Bo, T.; Zhu, X.; Zhang, L.; Tao, Y.; He, X.; Li, D.; Yan, Z. A new upgraded biogas production process: Coupling microbial electrolysis cell and anaerobic digestion in single-chamber, barrel-shape stainless steel reactor. Electrochem. Commun. 2014, 45, 67–70. [Google Scholar] [CrossRef] [Green Version]
  18. Yin, Q.; Zhu, X.; Zhan, G.; Bo, T.; Yang, Y.; Tao, Y.; He, X.; Li, D.; Yan, Z. Enhanced methane production in an anaerobic digestion and microbial electrolysis cell coupled system with co-cultivation of Geobacter and Methanosarcina. J. Environ. Sci. (China) 2016, 42, 210–214. [Google Scholar] [CrossRef] [PubMed] [Green Version]
  19. Zhao, Z.; Zhang, Y.; Chen, S.; Quan, X.; Yu, Q. Bioelectrochemical enhancement of anaerobic methanogenesis for high organic load rate wastewater treatment in a up-flow anaerobic sludge blanket (UASB) reactor. Sci. Rep. 2014, 4, 6658–6665. [Google Scholar] [CrossRef]
  20. Xu, H.; Gong, S.; Sun, Y.; Ma, H.; Zheng, M.; Wang, K. High-rate hydrogenotrophic methanogenesis for biogas upgrading: The role of anaerobic granules. Environ. Technol. 2015, 36, 529–537. [Google Scholar] [CrossRef]
  21. Agneessens, L.M.; Ottosen, L.D.M.; Voigt, N.V.; Nielsen, J.L.; de Jonge, N.; Fischer, C.H.; Kofoed, M.V.W. In-situ biogas upgrading with pulse H2additions: The relevance of methanogen adaption and inorganic carbon level. Bioresour. Technol. 2017, 233, 256–263. [Google Scholar] [CrossRef]
  22. Luo, G.; Angelidaki, I. Hollow fiber membrane based H2 diffusion for efficient in situ biogas upgrading in an anaerobic reactor. Appl. Microbiol. Biotechnol. 2013, 97, 3739–3744. [Google Scholar] [CrossRef] [PubMed]
  23. Luo, G.; Angelidaki, I. Integrated biogas upgrading and hydrogen utilization in an anaerobic reactor containing enriched hydrogenotrophic methanogenic culture. Biotechnol. Bioeng. 2012, 109, 2729–2736. [Google Scholar] [CrossRef]
  24. Aryal, N.; Kvist, T.; Ammam, F.; Pant, D.; Ottosen, L.D.M. Bioresource Technology An overview of microbial biogas enrichment. Bioresour. Technol. 2018, 264, 359–369. [Google Scholar] [CrossRef]
  25. Gregory, K.B.; Bond, D.R.; Lovley, D.R. Graphite electrodes as electron donors for anaerobic respiration. Environ. Microbiol. 2004, 6, 596–604. [Google Scholar] [CrossRef]
  26. Nelabhotla, A.B.T.; Dinamarca, C. Optimisation of Electrochemical Treatment of Artificial Wastewater using Cyclic Voltammetry. Int. J. Environ. Sci. Dev. 2018, 9, 218–221. [Google Scholar] [CrossRef]
  27. Huong Le, T.X.; Bechelany, M.; Cretin, M. Carbon felt based-electrodes for energy and environmental applications: A review. Carbon N. Y. 2017, 122, 564–591. [Google Scholar] [CrossRef]
  28. Li, R.; Chen, S.; Li, X. Biogas production from anaerobic co-digestion of food waste with dairy manure in a two-phase digestion system. Appl. Biochem. Biotechnol. 2010, 160, 643–654. [Google Scholar] [CrossRef] [PubMed]
  29. Ghaly, A.E. Effect of reseeding and pH control on the performance of a two-stage mesophilic anaerobic digester operating on acid cheese whey. Can. Agric. Eng. 2000, 42, 173–183. [Google Scholar]
  30. Dodds, W.K.; Whiles, M.R. Chapter 13—Carbon. In Aquatic Ecology, 2nd ed.; Academic Press: London, UK, 2010; pp. 323–343. ISBN 978-0-12-374724-2. [Google Scholar]
  31. Dębowski, M.; Szwaja, S.; Zieliński, M.; Kisielewska, M.; Stańczyk-Mazanek, E. The Influence of Anaerobic Digestion Effluents (ADEs) Used as the Nutrient Sources for Chlorella sp. Cultivation on Fermentative Biogas Production. Waste Biomass Valorization 2017, 8, 1153–1161. [Google Scholar] [CrossRef]
  32. Hashemi, S.; Niazi, S.; Dinamarca, C.; Janka, E.; Heggholmen, A.; Wang, S.; Bakke, R. Biological reject water treatment for enhanced carbon recovery. In Proceedings of the 2nd International Conference Bioresource Technology for Bioenergy Bioproducts and Environmental Sustainability, Sitges, Spain, 16–19 September 2018. [Google Scholar]
Figure 1. Biomethane production experimental setup for both optimisation and control experiments.
Applsci 09 01056 g001
Figure 2. Methane production and methane percentage at different cathode potentials.
Applsci 09 01056 g002
Figure 3. Electrochemical methane yield and current production with respect to cathode potential.
Applsci 09 01056 g003
Figure 4. Cumulative methane production and methane percentage during optimisation of the pH experiment.
Applsci 09 01056 g004
Figure 5. Methane production rate and effluent variation with feed pH.
Applsci 09 01056 g005
Figure 6. Electrochemical methane yield and currents production with respect to feed pH.
Applsci 09 01056 g006
Figure 7. Comparison of methane production and efficiency in open circuit and MES mode operations.
Applsci 09 01056 g007
Figure 8. Comparison of pH and alkalinity in open circuit and MES mode operations.
Applsci 09 01056 g008
Figure 9. Proposed (generalized and simplified) AD-MES integrated treatment plant setup.
Applsci 09 01056 g009
Table 1. Results of 1-week biomethane production experiment.
ParameterResult
Biogas production550 mL (22.5 mmol)
Methane500 mL (20.5 mmol)
Carbon dioxide34 mL (1.4 mmol)
COD Consumption1644.3 mg (52%)
Voltage−0.8 V vs. SHE
Methane Concentration90.9%
Mass Balance Efficiency80.5%
Electrochemical Methane Yield 467.8%

