Article

Study of a Miniaturizable System for Optical Sensing Application to Human Cells

by
Emanuele Luigi Sciuto
1,
Giusy Villaggio
2,
Maria Francesca Santangelo
1,
Samuele Laudani
2,
Concetta Federico
3,
Salvatore Saccone
3,
Fulvia Sinatra
2 and
Sebania Libertino
1,*
1
CNR-IMM Headquarters, Strada VIII Z.I. 5, 95121 Catania, Italy
2
Department of Biomedical and Biotechnological Sciences, Via S. Sofia 87, 95100 Catania, Italy
3
Department of Biological, Geological and Environmental Sciences, Univ. of Catania, 95124 Catania, Italy
*
Author to whom correspondence should be addressed.
Appl. Sci. 2019, 9(5), 975; https://doi.org/10.3390/app9050975
Submission received: 20 February 2019 / Revised: 28 February 2019 / Accepted: 3 March 2019 / Published: 7 March 2019
(This article belongs to the Special Issue Nano-Biointerface for Biosensing)

Abstract

:

Featured Application

Miniaturizable optical system for human intracellular sensing.

Abstract

Conventional approaches to human intracellular optical sensing, generally, require dedicated laboratories with bulky detection systems. They are performed by cell labeling procedures based on the use of fluorophores that are, mostly, phototoxic, invasive, bleached in case of prolonged light exposures, which require carriers and/or structural modifications for the cellular uptake. These issues, together with the sensitivity of the eukaryotic cell model, could be problematic towards the development of a robust sensing system suitable for biomedical screening. In this work, we studied a sensing system resulting from the combination of the commercial tris(2,2’bipyridyl)ruthenium(II) fluorophore, for cell labeling, with a potentially miniaturizable optical system composed by a laser source and a photomultiplier tube, for the fluorescence analysis.
We used the human dermal fibroblasts (HDF) as a cell model for the characterization of the proposed approach together with MTT assays, to validate the cells viability after treatments, and fluorescence and confocal laser scanning microscopy, to confirm the labeling. We investigated the versatility of this carrier-free labeling method with other cell models by using human colon adenocarcinoma (LoVo) cells, performing the cellular uptake and testing the cytotoxicity of Ru(bpy)32+, as a possible application in biomedical diagnostics.

1. Introduction

Optical sensing applied to the human intracellular environment represents the best way for the analysis of cell functioning and its behavior in response to specific physiological conditions. Cell ultrastructure, embryogenic development [1], pH–calcium–chloride–oxygen monitoring [2] and, most importantly, metastasis proliferation [3] are a few examples of what this type of optical sensors would help to analyze.
Intracellular optical sensing works by the introduction of a luminescent (fluorescent or chemiluminescent) probe inside the target cell and its subsequent detection.
The configuration of an optical sensing strategy, generally, starts with the fluorophore choice (considering its optical and biochemical properties) and its characterization, mainly consisting of testing cells survival after treatment and photostability. Once defined, the fluorescent dye must be transferred through the membrane of the investigated cell model by an uptake procedure that often requires fluorophore structural modifications, carriers and cell permeabilization [4,5,6]. Finally, a high performances optical sensing system for the fluorescence detection must be chosen.
Nowadays, research efforts are moving towards the miniaturization, time/cost-saving and user-friendly sensing detection systems, in order to provide the basis for portable Point-of-Care platforms and patient self-monitoring. In this sense, one of the most representative examples is the use of photomultiplier-based systems having the greatest advantage, with respect to traditional detection instruments, of being highly miniaturizable, integrable and cheap hence, perfectly matching with the goal of a portable application, by using solid state photomultipliers (e.g. silicon photomultipliers, SiPM). However, this type of technology coupled with traditionally employed dyes, usually, implies the issue of the electronic management for luminescence analysis, which is quite sophisticated due to the chemical-physical properties of the luminescent probe used. Prolonged exposure times and high irradiation powers, affect conventional dyes emission efficiency, resulting in a bleaching process that reduces the fluorescence intensity and, sometimes, brings a series of toxic intracellular effects such as free radicals production [7]. Moreover, room temperature storage degrades the organic dyes normally employed for cells labeling [8,9].
Cyanine dyes, for example, suffer from self-quenching of fluorescence [10], caused by the proximity and overlap of absorption and emission’s peaks, and is photobleached after prolonged exposure to the laser beam [11,12], hence dark conditions are required during the labeling experiment, which is problematic for fluorescence sensing, especially in time-lapse applications. Moreover, its short lifetime implies a complex electronic management of the fluorescence detection, thus increasing the complexity of sensing technology. Other evidences report a Rhodamine 6G, Fluorescein, Pyrene and Indo-1 bleaching process caused by an increase in the molecules intrinsic temperature, following the light absorption and the source irradiation power [13]. There are, also, some examples of luminescent quantum dots (nanocrystals composed by heavy metal atoms like Cd, Hg, Pb and As) causing cytotoxicity after the cell uptake, due to the release of metallic ions that can bind the sulfhydryl groups of many biomolecules, such as proteins, leading to the decrease in various sub-cellular organelles activity [14].
In order to surpass all of the limitations related to conventional optical intracellular sensing methods, we investigated an approach that used a miniaturizable photomultiplier-based system in combination with a cell labeling method performed by the use of fluorophore Tris(2,2’bipyridyl)ruthenium(II) (Ru(bpy)32+), whose structure is schematically shown in Figure 1. This molecule is an octahedral coordination complex of transition metal ruthenium bounded to three heteroaromatic bypiridine units.
Its optical properties would allow for the solving of some issues, related to the use of the conventional fluorophores described before. Ru(bpy)32+ has two absorption peaks at 290 nm and 450 nm, ligand-center (LC) and metal-ligand (MLCT) electronic transitions, respectively, and a lifetime of 360 ns suspended in water. Absorption peaks are far away from the emission one at 630 nm [15,16] and 100 nm to the closest absorption peak, thus strongly reducing the self-quenching of fluorescence since the absorption and emission curves do not overlap. Therefore, the incident radiation can be shielded using a simple and cheap band-pass filter. Moreover, the molecular properties do not change even in stressful environmental conditions [12]. We already proved the Ru(bpy)32+ stability by monitoring its absorption, emission and lifetime under very unsustainable chemical-physical conditions [12]. More precisely, we tested fluorophore in a variable range of temperatures, from RT to 100 °C; pH, from 1 to 11; light irradiation, up to 24 hours. All of the experiments that were performed indicated that Ru(bpy)32+ could be used in a wide range of conditions, therein including the environmental light.
Most of the evidences of Ru-based complexes for intracellular labeling report examples other than the commercial Ru(bpy)32+, as a result of long and expensive chemical functionalization [17,18,19,20] including, sometimes, carrier mediations [21]. As an example, in [17] uptake in cells was performed using a Ru(bpy)2dppz2+ molecule modified by changing bypiridine with 4,7-diphenyl-1,10-phenanthroline ligand in order to make the fluorophore more hydrophobic for uptake, but strongly increasing the costs and dye preparation time. Moreover, characterizations of cell uptake processes of modified Ru-based complexes in human cells revealed that the bigger the aromatic surface of the N-N ligand in the [Ru(bpy)2 (N-N)]2+ starting molecule the higher the cytotoxicity of the final compound was, thus affecting the cell viability [22].
For these reasons, we introduced a different approach to the intracellular analysis of human cells, based on the Ru(bpy)32+ performances and stability and its suitability for the development of an innovative intracellular optical sensing system.
We performed a full characterization of the labeling and sensing approaches by introducing the fluorophore Ru(bpy)32+ in human dermal fibroblasts (HDF) and, subsequently, detected its fluorescence by a sensitive and miniaturizable laser beam-photomultiplier based system. HDFs uptake of Ru(bpy)32+ was confirmed by Fluorescence Microscopy (FM) and Confocal Laser Scanning Microscopy (CLSM). Cells survival to the labeling method was checked by MTT assays of cells exposed to the fluorophore.
A further investigation of cell sensitivity to Ru(bpy)32+ was performed on a human tumor cell model, performing the fluorophore uptake within the human colon adenocarcinoma (LoVo) cells and monitoring their vitality and fluorescence intensity across time.

2. Materials and Methods

2.1. Materials

Human Dermal Fibroblasts adult- 106-05A, HDF, were from Sigma. Human colon adenocarcinoma, LoVo, were from ATCC® CCL-229™. Medium for HDF line was Dulbecco Modified Eagle Medium (DMEM) with 4.5 g/L Glucose with L-Glutamine. Medium for LoVo was RPMI-1640 with L-glutamine and sodium bicarbonate. Media were supplemented with antibiotic-antimycotic (10,000 U/mL Penicillin, 10 μg/ml Streptomycin, 25 μg/ml Fungizon) and 10% Fetal Bovine Serum. To detach cells, we used Trypsin - EDTA·4Na (0.05%/0.02% w/v). All products were purchased from GIBCO, Thermo Fisher Scientific. Cuvettes for spectrophotometric analysis were UV-transparent disposable Ultra-Micro, 2 × 3.5 mm2 with 10 mm optical path. Slides for fluorescence microscopy were micro coverglasses by Electron Microscopy Sciences (EMS), mounted on a glass slide 25 mm × 75 mm (EMS). Powder of tris(2,2′-bipyridyl)dichlororuthenium(II) hexahydrate was from Sigma-Aldrich. Dulbecco’s Phosphate buffer saline 1× (PBS) was from GIBCO, Thermo Fisher Scientific.

2.2. Cell Culture and Labeling

HDF and LoVo cells were expanded in 75 cm3 flasks in medium and maintained at 37 °C in a humidified atmosphere of 5% CO2 and 95% air. Medium changes were performed after 3–4 days and, upon confluence (80%), cells were trypsinized and prepared for experiments. Vital cell count was performed in a Bürker chamber with Trypan blue method. The solution of 13.5 µM (corresponding to 10 mg/mL) Ru(bpy)32+ was prepared by dissolving the fluorophore in PBS 1×. Subsequently, the solution was sonicated for 20 min in order to avoid the formation of fluorophore molecules aggregates. 13.5 µM Ru(bpy)32+ solution was, then, diluted to 0.14 µM, 0.4 µM, 0.7 µM, 1 µM, 1.4 µM, corresponding to 0.1 mg/mL, 0.25 mg/mL, 0.5 mg/mL, 0.75 mg/mL, 1 mg/mL, respectively. Finally, cells were incubated in modified medium for 24, 48, or 96 h, to perform the fluorophore uptake for labeling.
As control samples for all assays, we prepared both HDF and LoVo cell using the same medium without fluorophore, and keeping the same experimental conditions reported before.

2.3. Fluorescence and Confocal Microscopy

In fluorescence (FM) and confocal laser scanning microscopy (CLSM) experiments, 1x10⁴ cells were seeded on micro coverglasses. Treated samples were exposed to 0.4, 0.7, or 1 µM solution of Ru(bpy)32+ in specific cell medium and analyzed after 24, 48, and 96 h, while control samples were growth in medium without fluorophore. Then, all samples were washed three times in PBS, in order to remove all of the fluorophore excess, and fixed using 4% paraformaldehyde/PBS. After washing, slides were dried, mounted with Fluor Gel (EMS) and observed at 488 nm wavelength with an Olympus BX50 fluorescence microscope equipped with a DC500 camera (Leica). Emission bandwidths of 515–580 nm (for intrinsic fluorescence) and above 590 nm (long passband filter for Ru(bpy)32+) were monitored. The images of the same samples were acquired with a CLSM (Zeiss LSM700) and analyzed using the ZEN 2011 software [23]. The fluorescence signal intensity of the cells in the serial sections were evaluated using ImageJ software (NIH, Bethesda, MD; available at http://rsb.info.nih.gov/ij/index.html).

2.4. Optical Measurement for Bio-Sensing Applications

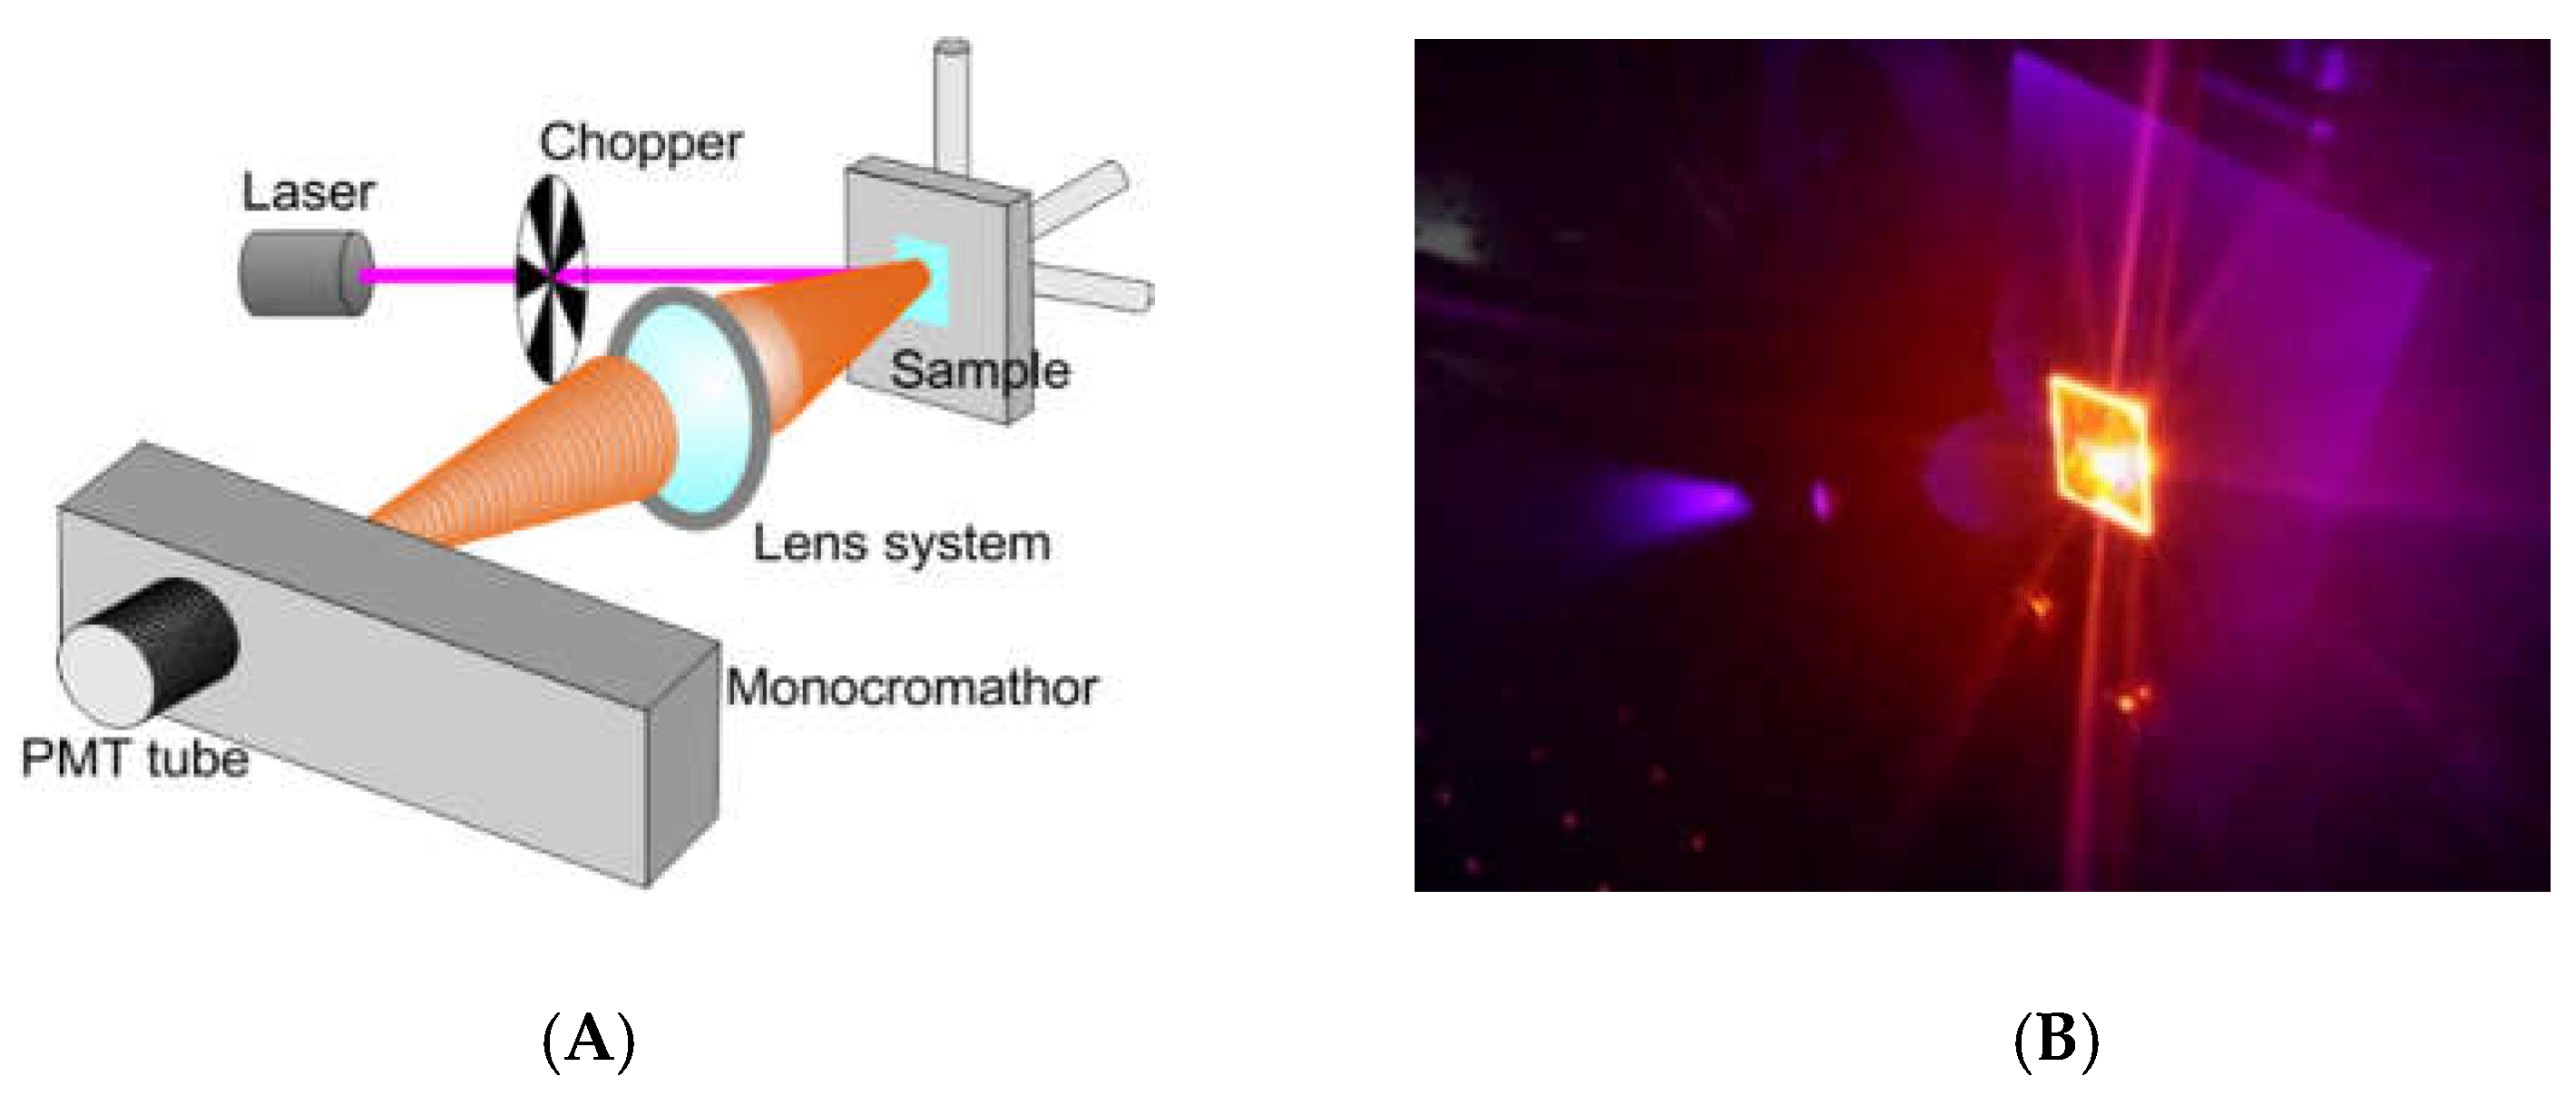
We tested the optical behavior of Ru(bpy)32+ based labeling with a non-conventional system for bio-analysis, reported in Figure 2A. We performed a fluorescence emission analysis of HDFs treated with 0.4, 0.7, and 1 µM of fluorophore for 24, 48 and 96 h (see experimental section for details). The system used for analysis included: A laser source (Coherent) operating at 405 nm to a power of 50 mW. This laser wavelength fell within the Ru(bpy)32+ excitation curve. A chopper; a monochromator; a PMT Hamamatsu R-908; a lock-in, and a series of lenses to collect the signal at the monochromator entrance slits, completing the detection system. Measurements were collected from 550 nm to 730 nm by using the monochromator to select the wavelength with an error of 0.1 nm. Cells were fixed and dried on a glass coverslip, blocked in a sample holder (Figure 2B). A computerized system for instruments management and data acquisition completed the system. A laser spot of about 3 mm in diameter was used, to a surface covered of ~7 mm2. The average number of cells measured was ~3 × 10⁵. Each spectrum was collected and, using an off-line analysis, the peak maximum recorded.

2.5. MTT Assay on HDF and LoVo

We tested Ru(bpy)32+ effect on the cells vitality by MTT assay. HDF cells were exposed to fluorophore concentrations ranging from 0.14 µM to 14 µM for 24 h and incubated with 0.05 mg/mL of 3-(4,5-dimethylthiazol-2-yl)-2,5-diphenyltetrazolium bromide salt. After 2.30 h of incubation at 37 °C, formazan salts, produced by succinate dehydrogenase activity in live cells, were solubilized with 0.1 N isopropanol/HCl and quantified spectrophotometrically by a Cary 50, Varian. The absorbance values were converted to optical density (Δ OD: λ570650). All samples were measured in triplicate. LoVo cells were exposed to 0.14 µM of Ru(bpy)32+ for 24 h and MTT assays. The same procedure described above was performed 1, 2 or 5 days after exposure.

3. Results

3.1. Method Characterization

3.1.1. HDFs Fluorescent Labeling

Fluorescence microscopy images of human dermal fibroblast exposed to Ru(bpy)32+ is shown in Figure 3. For intracellular uptake experiments, we used HDFs as representative of a typical healthy cell model, treated using the protocol described before.
Control cells (Figure 3A) exhibited only a weak green signal after excitation with blue light (488 nm), which was related to an intrinsic fluorescence (of intracellular aromatic aminoacids) that cells emit regardless of the optical marker used to label them. On the other hand, cells treated with the fluorophore (Figure 3B) showed a Ru(bpy)32+ strong signal, mostly localized in the central region of cells.
The results led us to infer that the fluorophore was inside cells. All samples treated with fluorophore, in fact, were repeatedly washed in PBS before the microscopy analysis, in order to remove the fluorophore from the outer part of the cell membrane.

3.1.2. HDFs Confocal Microscopy

To get more details on the intracellular distribution of Ru(bpy)32+, we analyzed the HDF treated cells by confocal laser scanning microscopy (CLSM), as shown in Figure 4. In order to detect the fluorophore signal, we used three lasers with 405 nm, 488 nm and 555 nm wavelengths for the analysis. Signal distribution across cell layers, detected with the 555 nm wavelength laser, proved the presence of the red fluorophore inside the cells after the uptake process. Moreover, CLSM allowed us to observe that Ru(bpy)32+ was, mostly, localized in the cytoplasmic compartment, as proven by the distribution of signal intensity across cell layers, and largely absent from the nucleus, as demonstrated by the lack, or at least by the very low presence, of red signals in the nuclear region (Figure 4).

3.1.3. Photomultiplier-based System for Labeled Fibroblast Analysis

To complete the characterization of the whole system (labeling and detection), we tested the optical behavior of HDF cells, once exposed to Ru(bpy)32+, by the optical system described in Figure 2 (see Materials and Methods, Section 2.5).
Fluorescence emission data, shown in Figure 5, were acquired at three different concentrations of fluorophore (0.4, 0.7 and 1 µM) and at three time points (24 h, 48 h and 96 h) of cell growth. As shown in the figure, the analysis revealed the presence of a fluorescence signal from cells that increased gradually with both fluorophore concentrations (Figure 5A) and time of exposure to the medium containing the fluorophore (Figure 5B).
Figure 6 summarizes the fluorescence emission spectra as a function of the wavelength at three different fluorophore concentration. The plot describes, clearly, how the intensity of Ru(bpy)32+ emission inside the cells increases with the concentration used at a fixed time point exposure (24 h). The figure also reports the HDFs auto-fluorescence signal, shown as a black curve. The auto-fluorescence spectrum in the figure exhibits an emission peak at 550 nm (green light), which is related to ultrastructural proteins; the same signal that we observed by fluorescence microscopy.

3.1.4. HDFs Vitality

Effect of Ru(bpy)32+ exposure on cells vitality was tested by MTT assay on treated HDFs, exposed to 0.14 up to 13.5 µM of fluorophore for 24 h (see Materials and methods). Figure 7 shows that labeling with fluorophore in concentrations up to 1 µM did not modify strongly the cell vitality. In fact, the comparison with control cells (0) indicated a decrease in the vitality of less than 10%, within the experimental errors, while labeling at 1.4 and 13.5 µM caused a vitality fall up to 50 % of the control, as supported by the significance analysis (see * in figure). Validation was performed in triplicated measurements. It should be stressed that all the labeling experiments were performed by using a Ru(bpy)32+ concentration below 1.4 µM, with the maximum concentration at 1 µM, hence in a condition in which the cell vitality was fully preserved.

3.2. Tumor Cell Fluorescent Time-Lapse Analysis

3.2.1. LoVo Uptake of Ru(bpy)32+

After the definition and full characterization of a valid approach for the cellular uptake of Ru(bpy)32+ in HDFs, we moved to a first application of this intracellular sensing method to a human tumor analysis across time, by using the epithelial cells of colon adenocarcinoma LoVo.
To this purpose, we labeled LoVo cells with the same protocol used for HDFs, getting the results below. Fluorescence microscopy images of LoVo cells exposed to Ru(bpy)32+ are shown in Figure 8. Control cells (Figure 8A) exhibited only the intrinsic weak green signal after excitation with blue light (488 nm), while cells treated with the fluorophore (Figure 8B) showed the Ru(bpy)32+ fluorescent signal.
The magnification of microscopy revealed the intracellular distribution of fluorophore, confirming the success of the uptake procedure and its reproducibility in a different cell model.

3.2.2. LoVo Fluorescence Analysis

We investigated the fluorescence of LoVo tumor cells labeled with Ru(bpy)32+ across time and cell generations. This experimental condition was typical of time-lapse fluorescence analysis for cell biology, which allows for the determination of the kinetics of fluorophores through tissue or cells and investigation of different features relative to the intracellular system, an important issue in tumoral cells analysis.
Results of MTT and FM analysis on LoVo at 1, 2, and 5 days after Ru(bpy)32+ labeling are reported in Figure 9.
MTT assay (Figure 9A) showed that the labeled cells vitality did not change with respect to the controls, not treated HDFs, for each time point of analysis.
Fluorescence analysis revealed cell proliferation, as confirmed by the green population appearing in Figure 9C,D. Moreover, Ru(bpy)32+ segregation from cell to cell across time was, also, proven by the orange and light orange cells in the figures. Controls reported only the growth of cells keeping the same green intrinsic fluorescence (data not shown).
The figure clearly shows that the dye was transferred to daughter cells maintaining its functionality. The results indicated that there was no decomposition of the dye over time or because of the cell proliferation. In fact, if the fluorescence is reported as a function of the number of cells, a linear decrease in the luminescence intensity by increasing the number of cells across generations is observed (see Figure 10).

4. Discussion

We investigated a strategy aimed for the implementation of a miniaturized intracellular optical sensing for human cells. The approach is based on the use of a cell labeling process, performed through the fluorophore Tris(2,2’-bipyridyl)ruthenium(II), in combination with a miniaturizable detection system suitable for portable optical sensing applications.
Ru(bpy)32+ fluorophore for cell labeling brings a series of optimizations to both sample preparation and optical detection. Conventional dyes share some chemical-physical properties that are quite limiting towards a possible integration and miniaturization of the sensing system.
Literature report some evidences of photobleaching and phototoxicity processes for some dyes stressed by prolonged laser exposures, so that dark condition and low energy laser beam are needed. Other evidences highlight, also, the risk of self-quenching for most of the conventional dyes, due to their absorption and emission peaks short gap and overlap, which imply a complex architecture and electronic management of the luminescence detection system.
The use of Ru(bpy)32+ for cell labeling allows overpassing all these limitations, thanks to its structural and optical properties. The fluorophore, in fact, is robust and able to keep its structural and functional integrity under very unsustainable chemical-physical conditions [12], and exhibits long gap absorption/emission peaks, that avoid the risk of self-quenching, thus simplifying the detection technology. Moreover, the molecule is commercially available, thus reducing costs and time related to structural modifications, carriers functionalization and/or cell permeabilization.
The characterization of the sensing strategy, in terms of labeling efficiency and detection sensitivity, was performed on HDFs, representative of the human cell model. FM and CLSM revealed that Ru(bpy)32+ passed through the HDFs membrane to reach the intracellular environment with a cytosolic localization. The specific uptake mechanism was not characterized, since there are some studies in the literature [17]. The optical characterization of labeled HDFs by the unconventional photoluminescence system (Figure 2) proved the suitability of our method for the integration in an optical biosensor device; the use of miniaturized photomultipliers, already employed in sensing applications [25,26,27] may result in the fabrication of a portable sensing system that could be used also within incubators. Results from optical testing reported a sensitive Ru(bpy)32+ fluorescence detection, highlighting a strong correlation with both fluorophore concentration and labeling duration. Finally, cell vitality was not affected by the labeling technique. In fact, MTT assays revealed that HDF cells treated with different fluorophore concentrations (0.14 µM to 1.4 µM) kept their vitality, if compared to controls.
Once characterized and validated, we investigated the versatility of this strategy studying other cell models such as the human colon adenocarcinoma cells, LoVo. We performed the uptake of Ru(bpy)32+, as reported in Figure 8, and tested the intracellular fluorescence of LoVo cells and their vitality at 1, 2, and 5 days after uptake, emulating a fluorescent time-lapse analysis of tumor cell proliferation. Results reported in Figure 9 proved that the labeling method did not affect LoVo viability, since there were no divergences between control and treated samples, and the fluorescence signal was perfectly detectable across time and cell generations, thanks to the robustness of Ru(bpy)32+. This result led us to infer the possible application of this sensing strategy in oncogenesis analysis, where a combination of the labeling and detection properties with an appropriate imaging software would enable one to distinguish between healthy and tumor cells in a population, following the speed of growth and the spatial localization.

5. Conclusions

We propose a miniaturizable and integrable strategy for intracellular optical sensing applications to the human cell, such as tumor cell fluorescent time-lapse analysis. Combining an easy and cheap method for cells labeling and preparation, based on commercial Ru(bpy)32+, with a sensitive photomultiplier-based optical system for cell fluorescence detection. Our approach paves the basis for new portable high performances technologies suitable for biomedical diagnostics.

Author Contributions

Conceptualization, S.L. (Sebania Libertino), F.S. and E.L.S.; investigation, E.L.S., G.V., M.F.S., C.F. and S.S.; data curation, E.L.S., G.V., S.S. and S.L. (Samuele Laudani); writing—original draft preparation, E.L.S.; writing—review and editing, F.S., S.S. and S.L. (Sebania Libertino); supervision, C.F., S.S., F.S. and S.L. (Sebania Libertino); project administration, F.S. and S.L. (Sebania Libertino); funding acquisition, S.L. (Sebania Libertino)

Funding

This research received no external funding.

Acknowledgments

The authors would like to acknowledge Prof. Travali, of the University of Catania, for providing human dermal fibroblast cell line, we used in our experiments; E.L.S. acknowledges the regional project “Sviluppo ed applicazione di tecnologie biosensoristiche in genomica” [CIP 2014.IT.05.SFOP.014/3/10.4/9.2.10/0008, CUP G67B17000170009] for funding the time spent on this activity.

Conflicts of Interest

The authors declare no conflicts of interest.

References

  1. Strickland, L.; von Dassow, G.; Ellenberg, J.; Foe, V.; Lenart, P.; Burgess, D. Light Microscopy of Echinoderm Embryos. Met. Cell Biol. 2004, 74, 371–409. [Google Scholar]
  2. Sud, D.; Mycek, M.A. Calibration and validation of an optical sensor for intracellular oxygen measurements. J. Biomed. Opt. 2009, 14, 020506. [Google Scholar] [CrossRef] [PubMed] [Green Version]
  3. Wong, A.D.; Searson, P.C. Live-Cell Imaging of Invasion and Intravasation in an Artificial Microvessel Platform. Cancer Res. 2014, 74, 4937–4945. [Google Scholar] [CrossRef] [PubMed] [Green Version]
  4. Abulateefeh, S.R.; Spain, S.G.; Thurecht, K.J.; Aylott, J.W.; Chan, W.C.; Garnett, M.C.; Alexander, C. Enhanced uptake of nanoparticle drug carriers via a thermoresponsive shell enhances cytotoxicity in a cancer cell line. Biomat. Sci. 2013, 1, 434–442. [Google Scholar] [CrossRef]
  5. Bastiat, G.; Pritz, C.O.; Roider, C.; Fouchet, F.; Lignières, E.; Jesacherd, A.; Glueckert, R.; Ritsch-Mart, M.; Schrott-Fischer, A.; Saulnier, P.; et al. A new tool to ensure the fluorescent dye labeling stability of nanocarriers: A real challenge for fluorescence imaging. J. Control. Release 2013, 170, 334–342. [Google Scholar] [CrossRef] [PubMed] [Green Version]
  6. Bradley, M.; Alexander, L.; Sanchez-Martin, R.M. Cellular uptake of fluorescent labeled biotin-streptavidin microspheres. J. Fluoresc. 2008, 18, 733–739. [Google Scholar] [CrossRef] [PubMed]
  7. Meijering, E.; Smal, I.; Dzyubachyk, O.; Olivo-Marin, J. Time-Lapse Imaging; Elsevier Academic Press: Cambridge, MA, USA, 2008; Chapter 15; pp. 401–440. [Google Scholar]
  8. Celis, J.E. Cell Biology, 3rd ed.; Elsevier Academic Press: Cambridge, MA, USA, 2006; ISBN 9780121647308. [Google Scholar]
  9. Herman, B. Fluorescence Microscopy, 2nd ed.; Bios Scientific Pub.: Milton Park, UK, 1998; ISBN 0387915516. [Google Scholar]
  10. Lakowicz, J.R. Radiative Decay Engineering: Biophysical and Biomedical Applications. Anal. Biochem. 2001, 298, 1–24. [Google Scholar] [CrossRef] [PubMed]
  11. Santangelo, M.F.; Sciuto, E.L.; Lombardo, S.A.; Busacca, A.C.; Petralia, S.; Conoci, S.; Libertino, S. Si Photomultipliers for Bio-Sensing Applications. IEEE Select. Top. Quantum Electron. 2016, 22, 3. [Google Scholar]
  12. Sciuto, E.L.; Santangelo, M.F.; Villaggio, G.; Sinatra, F.; Bongiorno, C.; Nicotra, G.; Libertino, S. Photo-physical characterization of fluorophore Ru(bpy)32+ for optical biosensing applications. SBSR 2015, 6, 67–71. [Google Scholar]
  13. Cannone, F.; Chirico, G.; Diaspro, A. Two-photon interactions at single fluorescent molecule level. J. Biomed. Opt. 2003, 8, 391–395. [Google Scholar] [CrossRef] [PubMed]
  14. Medepalli, K.; Alphenaar, B.W.; Keynton, R.S.; Sethu, P. A new technique for reversible permeabilization of live cells for intracellular delivery of quantum dots. Nanotechnology 2013, 24, 205101. [Google Scholar] [CrossRef] [PubMed]
  15. Kalyanasundaram, K. Photophysics, photochemistry and solar energy conversion with tris(bipyridyl)ruthenium(II) and its analogues. Coord. Chem. Rev. 1982, 46, 159–244. [Google Scholar] [CrossRef]
  16. Van Houten, J.; Watts, R.J. Temperature dependence of the photophysical and photochemical properties of the tris(2,2′-bipyridyl)ruthenium(II) ion in aqueous solution. J. Am. Chem. Soc. 1976, 98, 4853–4858. [Google Scholar] [CrossRef]
  17. Gill, M.R.; Thomas, J.A. Ruthenium(II) polypyridyl complexes and DNA—From structural probes to cellular imaging and therapeutics. Chem. Soc. Rev. 2012, 41, 3179–3192. [Google Scholar] [CrossRef] [PubMed]
  18. Tsui, W.; Chung, L.; Wong, M.M.; Tsang, W.; Lo, H.; Liu, Y.; Leung, C.; Ma, D.; Chiu, S.; Wong, C. Luminescent Ruthenium(II) Complex Bearing Bipyridine and N-Heterocyclic Carbene-based C∧N∧C Pincer Ligand for Live-Cell Imaging of Endocytosis. Sci. Rep. 2015, 5, 9070. [Google Scholar] [CrossRef] [PubMed] [Green Version]
  19. Puckett, C.A.; Barton, J.K. Methods to Explore Cellular Uptake of Ruthenium Complexes. J. Am. Chem. Soc. 2007, 129, 46–47. [Google Scholar] [CrossRef] [PubMed] [Green Version]
  20. Turrell, S.J.; Filby, M.H.; Whitehouse, A.; Wilson, A.J. Cellular uptake of highly-functionalized ruthenium(II) tris-bipyridine protein-surface mimetics. Bioorg. Med. Chem. Lett. 2012, 22, 985–988. [Google Scholar] [CrossRef] [PubMed]
  21. Gyenge, E.B.; Darphin, X.; Wirth, A.; Pieles, U.; Walt, H.; Bredell, M.; Maake, C. Uptake and fate of surface modified silica nanoparticles in head and neck squamous cell carcinoma. J. Nanobiotech. 2011, 9, 32. [Google Scholar] [CrossRef] [PubMed] [Green Version]
  22. Schatzschneider, U.; Niesel, J.; Ott, I.; Gust, R.; Alborzinia, H.; Wçlfl, S. Cellular Uptake, Cytotoxicity, and Metabolic Profiling of Human Cancer Cells Treated with Ruthenium(II) Polypyridyl Complexes [Ru (bpy)2 (N_N)]Cl2 with N_N=bpy, phen, dpq, dppz, and dppn**. Chem. Med. Chem. 2008, 3, 1104–1109. [Google Scholar] [CrossRef] [PubMed]
  23. Federico, C.; Gil, L.; Bruno, F.; D’Amico, A.G.; D’Agata, V.; Saccone, S. Phosphorylated nucleolar Tau protein is related to the neuronal in vitro differentiation. Gene 2018, 664, 1–11. [Google Scholar] [CrossRef] [PubMed]
  24. Gil, L.; Federico, C.; Pinedo, F.; Bruno, F.; Rebolledo, A.B.; Montoya, J.J.; Olazabal, I.M.; Ferrer, I.; Saccone, S. Aging dependent effect of nuclear tau. Brain Res. 2017, 1677, 129–137. [Google Scholar] [CrossRef] [PubMed]
  25. Petralia, S.; Sciuto, E.L.; Messina, M.A.; Mirabella, S.; Scandurra, A.; Priolo, F.; Conoci, S. Miniaturized and Multi-Purpose Electrochemical Sensing Device based on thin Ni Oxides. Sens. Act. B Chem. 2018, 263, 10–19. [Google Scholar] [CrossRef]
  26. Petralia, S.; Sciuto, E.L.; Santangelo, M.F.; Messina, M.A.; Libertino, S.; Conoci, S. Sulphide Species Optical Monitoring by Miniaturized Silicon Photomultiplier. Sensors 2018, 18, 727. [Google Scholar] [CrossRef] [PubMed]
  27. Petralia, S.; Cosentino, T.; Sinatra, F.; Favetta, M.; Fiorenza, P.; Bongiorno, C.; Sciuto, E.L.; Conoci, S.; Libertino, S. Silicon Nitride Surfaces as Active Substrate for Electrical DNA Biosensors. Sens. Act. B Chem. 2017, 252, 492–502. [Google Scholar] [CrossRef]
Figure 1. Structure of Ru(bpy)32+.
Applsci 09 00975 g001
Figure 2. (A) Optical sensing system used for intracellular Ru(bpy)32+ labeling analysis. (B) Detail of holder containing labeled HDFs sample.
Applsci 09 00975 g002
Figure 3. Uptake of Ru(bpy)32+ in human dermal fibroblast after 24 h labeling, observed by fluorescence microscopy: (A) green intrinsic auto-fluorescence of HDFs control; (B) red fluorescence of HDFs induced by 0.4 µM Ru(bpy)32+, with a high density in the central region. Fluorescence was acquired with a 488 nm light source and collected at 620–630 nm.
Applsci 09 00975 g003
Figure 4. Fluorophore uptake in HDFs, treated with 0.7 µM Ru(bpy)32+ for 24 h, observed by CLSM with 555 nm wavelength laser. (AL): Serial sections with 0.33 µm/section obtained as reported in [24]. (M): Signal intensity along the cell section indicated on the right. (N): 3-D reconstruction of the cell (sectioned along the broken line) shown in the panel (M). (O): Signal intensity detected in the A to L serial sections shown above, evaluated using the cell on the left. Pale blue and red bars indicate the fluorescence intensity of the entire cell and of its nucleus, respectively. S.E.: Standard error.
Applsci 09 00975 g004
Figure 5. Fluorescence emission (Photoluminescence) trend of HDF cells labeled with Ru(bpy)32+: increase of fluorescence signal with (A) fluorophore concentration and (B) time of exposure. Fluorescence was acquired with a 405 nm laser source at 50 mW power and revealed at 620–630 nm. Fluorescence values at 620–630 nm (i.e., the Ru(bpy)32+ emission peak) were used to plot the data.
Applsci 09 00975 g005
Figure 6. Emission spectra of HDFs controls (black curve) and exposed to 0.4 (red curve), 0.5 (blue curve) and 1 (green curve) µM of Ru(bpy)32+ for 24 hours. Fluorescence emission was acquired with a 405 nm laser source and revealed a peak at 620–630 nm, specific of fluorophore used, for treated samples while a peak at 550 nm was evidenced for control cells, provided by the intrinsic fluorescence of HDFs.
Applsci 09 00975 g006
Figure 7. MTT assay plot of HDF cells vitality: Controls (0) and exposed samples to 0.14; 1; 1.4; 13.5 µM of Ru(bpy)32+. Significance of data is reported (*).
Applsci 09 00975 g007
Figure 8. Uptake of Ru(bpy)32+ in epithelial cells of colon adenocarcinoma, observed by fluorescence microscopy: Intrinsic green fluorescence of LoVo controls (A) and red fluorescence of samples treated with 0.4 µM of fluorophore (B), after 24 h labeling, with a high density in the cells central region. Fluorescence was acquired with a 488 nm light source and collected at 620–630 nm.
Applsci 09 00975 g008
Figure 9. (A) MTT assay and fluorescence analysis of LoVo cells at (B),1 day, (C) 2 days and (D) 5 days after 0.14 µM Ru(bpy)32+ labeling. New generations of cells appeared in green, proving the cell proliferation and detailing the kinetics of fluorophore segregation. Fluorescence was acquired with a 488 nm light source and collected at 620–630 nm.
Applsci 09 00975 g009
Figure 10. LoVos fluorescence as a function of their number for 0.14 µM Ru(bpy)32+ labeling across cell generations (600 cells correspond to 5 days recovery time). Fluorescence was acquired with a 488 nm light source and collected at 620–630 nm.
Applsci 09 00975 g010

