1. Introduction
A reciprocating compressor is the core component dominating the refueling process in a compressed natural gas (CNG) refueling station. In fact, natural gas vehicles (NGVs) have been proved to contribute fewer CO
2, CO and HC emissions compared to gasoline vehicles since CNG is considered much more clean than petrol and diesel [
1]. CNG is stored in a high-pressure cylinder of the vehicle (19–25 MPa). Therefore, natural gas with a low pressure about 0.5 MPa from the distribution pipeline must be compressed to a much higher value (20 MP–25 MPa) in a CNG station [
2]. The high pressure ratio achievement is realized though using a large multi-stage reciprocating compressor (three or four stages). This equipment plays a key role in both initial and operating costs at any CNG filling station due to its a huge amount of input energy. Any inefficient working conditions will result in considerable waste energy. While designing CNG compressors, particular attention is thus paid to the enhancement of efficiency and reliability through more detailed and accurate design processes.
In this view, the contributions of well-tuned numerical models are unquestionable for evaluating the compressor performance and correctly defining the main design parameters, especially during the preliminary design phases [
3]. Experimental investigation of CNG compressors is essentially very costly, and is not conducted for large-size machines. Furthermore, compared with trial-and-error experimental methods, numerical simulation needs much less time and fewer facility investments and generates more physical knowledge. A well-tuned numerical model should preserve the accuracy to meet engineering demands without damaging computational cost.
Compressor models based on computational fluid dynamic (CFD) technology enabling consideration of the complex geometries can give the most detailed characterization of performance [
4,
5]. Pereira et al. [
6] presented a CFD analysis of reciprocating refrigeration compressor, and numerical results demonstrated that compressor efficiency could be dramatically increased by improvement of the suction muffler and flow area of discharge valve. Byeon et al. [
7] applied a recently proposed overset grid method to the solution of the flow around a moving boundary. Kim et al. [
8] applied a 3D compressible Reynolds-averaged numerical model to examine the compressor flow and the acoustic behavior of a suction muffler. Hwang et al. [
9] investigated the behavior characteristics of a circular plate discharge valve in a liner compressor. Bin et al. [
10] investigated the effects of an RNG
k-
ε turbulence model and a DES turbulence model on pressure pulsation. Results demonstrated that the former model reproduced pressure pulsation below 500 Hz fairly well, while the latter model enhanced the limitation to 1500 Hz. Wang et al. [
11] applied a 3D FSI model to find out the effective flow area of the valves. Liu et al. [
12] studied the impact of a tapered cylinder nozzle on pressure pulsation in a high-speed reciprocating compression system. The CFD model, however, seems to be unsuitable for specific goals in natural gas stations because it is very arduous to read the entire geometry into the CFD program, even if in the future the current unrealistically long computational time becomes shorter. Moreover, any modification of the geometry would require a new simulation of the entire compression system.
The lumped parameter models being simplified ones give results efficiently and describe the compressor performance globally. Elhaj et al. [
13] modelled a two-stage reciprocating compressor with a focus on the expansion of diagnostic features for predictive condition monitoring. Castaing-Lasvignottes and Gibout [
14] developed a compressor model to evaluate volumetric, isentropic and effective efficiencies based on two parameters of the clearance volume and friction factor. Damle et al. [
15] established a numerical model to calculate the thermodynamic performance and work consumption in the compression phase. Yang et al. [
16] reported a comprehensive model by considering leakages and frictions to analyze the performance of a semi-hermetic CO
2 compressor. Farzaneh-Gord et al. [
17] analyzed the effects of natural gas compositions on the thermodynamic process and it was demonstrated that natural gas with lower molar weight consumes more power per cycle than natural gas with higher molar weight. Tuhovcak et al. [
18] compared various integral correlations of heat transfer inside the cylinder for different settings and fluids. A numerical model that only considered the compressor will result in approximation in the evaluation of compressor performance, ignoring pulsation propagating inside suction and discharge systems.
In this view, few linear hybrid models have emerged by coupling the acoustic description of pipelines to the lumped parameter approach. Elson and Soedel [
19] reported the importance influence of pressure pulsation on the thermodynamic process with a hybrid model by combining acoustic wave theory. This hybrid approach was further employed to investigate the coupling between compressor and the connected pipelines system [
20,
21]. Similarly, Srinivas and Padmanabhan [
22] developed a hybrid model of a refrigeration reciprocating compressor by simplifying the plenum cavity based on plane wave theory. Zhou et al. [
23] conducted an iteration scheme to overcome the poor convergence problem of suction pressure. Park et al. [
24,
25] built a comprehensive simulation model of a multicylinder automotive air-conditioning reciprocating compressor. In order to model the complex fluid domain, some authors used the acoustic finite element method (FEM) for geometries with single input and single outlet [
26,
27,
28] and geometries with multi-ports [
29]. However, the main limitation of these linear hybrid models lies in the event of pulsations with large amplitude [
30,
31].
A more promising reciprocating compressor model is thus potentially obtained by simultaneously simulating the thermodynamic cycle and the in-pipe unsteady flow. Xu et al. [
32] highlighted that the predictions of finite disturbance theory were much more accordance with experimental data than results from acoustic wave theory. Liu and Duan [
33] developed a transient gas dynamic mathematical model considering thermodynamics with gas leakage, kinematics, valve dynamics, gas flow through valves and transient unsteady flow in the duct system. Brun et al. [
34] revealed that pulsations can be damped by large piping volumes with weak impedances, and conversely amplified by strong impedance systems.
The parametric optimization of reciprocating compressors in a CNG refueling station can lead to higher compressor efficiency and increased reliability. As noted before, pressure pulsations have been recognized as having an important impact on compressors. In order to find alternative means to reduce pressure pulsation influence, it is of fundamental importance to understand the interaction between pressure pulsations and thermodynamic processes.
The objective of this work is to investigate effects of pressure pulsations on reciprocating natural gas compressor performance thermodynamically by applying the developed hybrid numerical model. This detailed numerical methodology could simultaneously evaluate the compressor performance and the pipeline pulsation. The thermodynamic properties of methane as the working fluid are computed based on ideal and real gas assumptions. For the real gas model, the thermodynamic properties are obtained by means of calling the NIST REFPROP database [
35]. Validation of the model has been carried out through comparing the predictions against previous experimental results. The effects of pressure pulsations with or without resonance on the compressor performance have been compared between ideal and real gas models.
2. Hybrid Numerical Model
The methodology proposed herein describes each component of the compressor gas system. The procedure accounts for the in-cylinder thermodynamic processes, piston-driven mechanism, valve dynamics and pressure pulsation inside the pipeline system. Several key parameters could be predicted, such as in-cylinder temperature and pressure, mass flow rate and mass, in-put work, pressure pulsation inside the pipelines. Thermodynamic properties for the real gas model of working fluid are calculated through a program link to the NIST REFPROP database. More details on the features of each above-mentioned modelling are given in the following sections.
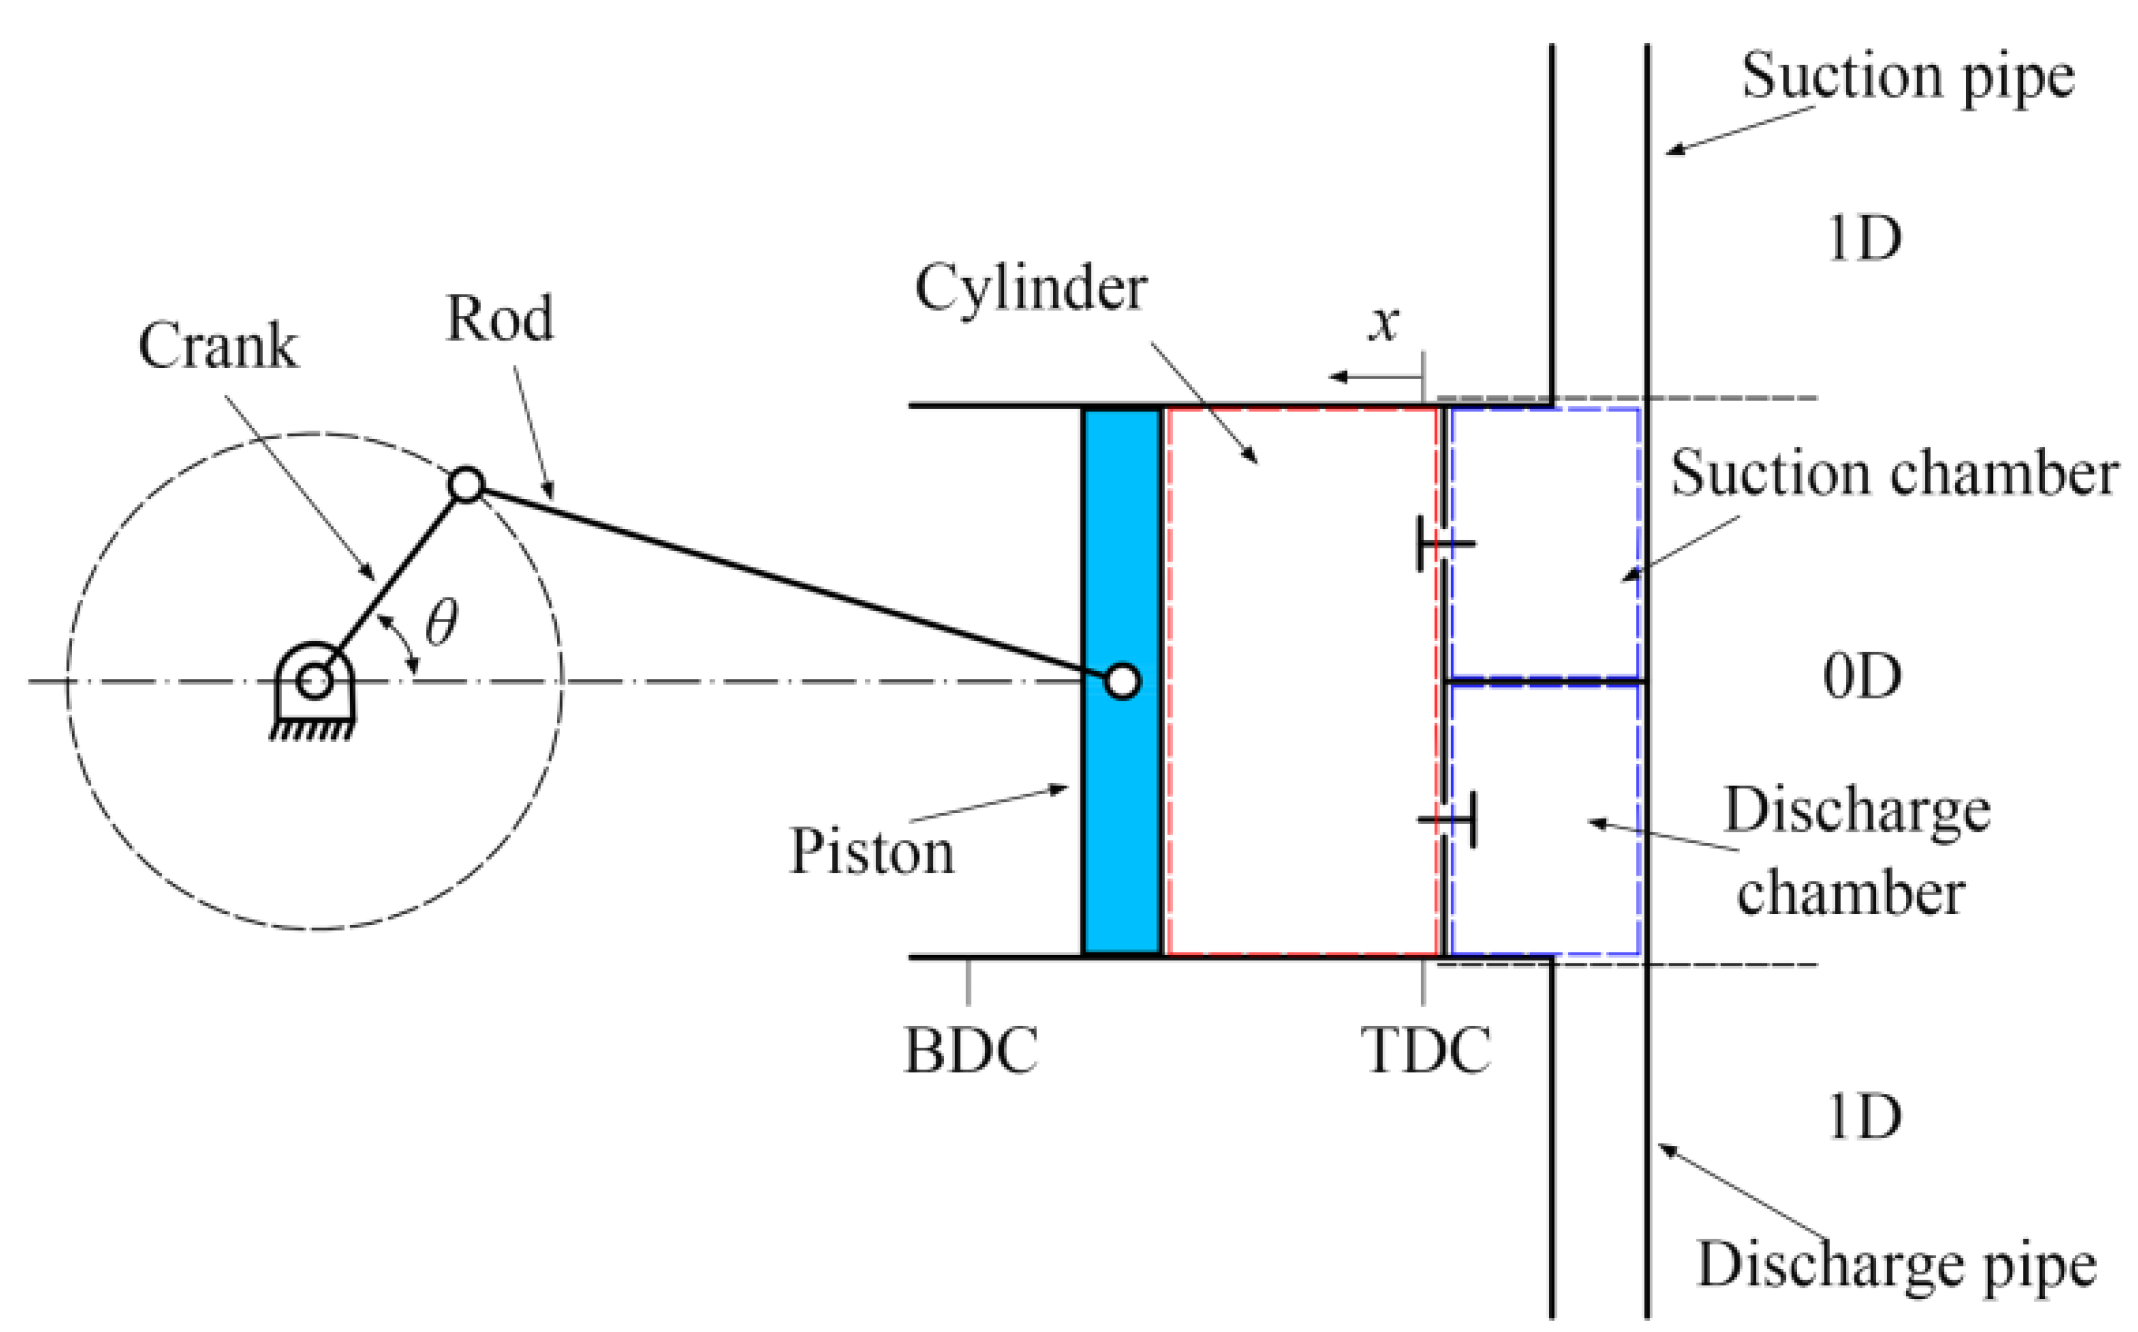
A schematic diagram of a CNG reciprocating compressor with suction and discharge systems is shown in
Figure 1. For the simulation, the hybrid numerical model is composed of two sub-models. The 0D compressor thermodynamic model consists of piston-driven mechanism, a cylinder, suction/discharge chambers and suction/discharge self-acting valves; the 1D gas dynamic model consists of suction and discharge pipelines.
2.1. Thermodynamic Model
In the 0D modelling method, the first law of thermodynamics and mass conservation are the bases to find thermodynamic properties. Distributions of pressure and temperature in control volumes are ignored due to the elimination of momentum equation. This lump open system will undergo a quasi-state process and leakage is assumed to not take place.
As shown in
Figure 1, the instantaneous position of the piston displacement by considering the top dead center (TDC) as the original point is calculated by [
3]:
in which
rcs and
l are the crank radius and the length of the connecting rod, respectively. The momentary volume inside cylinder is then obtained by:
where
Vcl is the clearance volume and
Dc is the cylinder diameter; subscript
c represents the compressor cylinder.
The first thermodynamic law over a control volume is given by [
36]:
where
E,
t,
Q,
W and
h are system energy, time, heat transfer, work and specific enthalpy, respectively;
cv,
in and
out subscripts represent the control volume, flow through inlet and outlet ports, respectively.
The potential and kinetic energy in the control volume is negligible, and thus only the internal energy is considered as the energy of system:
Here,
m and
e are the gas mass and specific internal energy, respectively.
The work rate can be written as:
where
p and
V are pressure and volume, respectively.
The mass conservation law for a control volume is written as [
37]:
After taking into account relations (4), (5) and (6) in Equation (3), the following formula is achieved:
Differentiating with respect to time results in the conversion of the crank angle
θ:
where
ω is the angular speed of the crank shaft. Finally, the continuity equation and the first law of thermodynamics could be separately rearranged as the following equations:
In the above two equations, expressions for the cylinder control volume are different from those for the chamber control volume. For the compressor cylinder volume, mass flow rate through the valves could be written as [
3]:
where
φv is the semi-empirical flow coefficient that accounts for the non-idealities of valve;
Av is the flow area through the compressor valve;
y is displacement from the closed orientation of valve plate;
ρ denotes density;
s and
d subscripts are suction and discharge, respectively. Heat exchange due to convection in the cylinder is given by the well-known formulation [
38]:
Here,
Ahex,
Tw and
Tc are the wall surface area in contact with the gas, wall temperature and in-cylinder gas temperature, respectively;
α is the convective heat transfer coefficient and it is defined in this work by the representative correlation formulated by Woschni [
18,
39]:
In the above equation,
u is the characteristic velocity in which
u = 6.18
up for suction and discharge processes and
u = 2.28
up for compression and expansion processes. Here,
up is the average speed of the piston.
For the suction chamber, mass flow rates can be expressed by:
and for the discharge chamber, mass flow rates can be expressed by:
It is noteworthy that suction and discharge chambers are assumed to be adiabatic and work is regarded as zero due to the fixed control volume:
For the valve dynamic simulation, the valve is assumed as a one-degree-of-freedom mass-spring-damper system, and valve placement
y is restricted by the valve seat (
y = 0) and limiter (
y =
ymax). Based on Newton’s second law, the general equation of valve plate motion is written by a 2nd-order ordinary differential equation:
where
meq,
keq,
AD and
y0 are the equivalent mass of the valve, equivalent stiffness of the spring, surface area of the valve plate and pre-load displacement, respectively;
is the damping coefficient that is often neglected [
18];
CD is the drag coefficient that is obtained from previous investigation [
4];
is the pressure difference described by
for the suction valve and described by
for the discharge valve. In order to represent the collision impact between the valve plate and valve limiter/seat, a so-called rebound coefficient is defined here [
38]:
where
Cr is the rebound coefficient and is considered as 0.3 in this work.
2.2. Gas Dynamic Model
In the present work, the compressible unsteady flow in the pipeline systems is simulated via a 1D gas dynamic numerical model. In fact, the flow in the pipe is thoroughly governed by compressible Navier–Stokes equations. However, they could be simplified to Euler equations since viscosity has been considered to have a minor influence on wave motion. In addition, due to the length of pipes being paramount compared to diameter, the propagation of pressure pulsation waves can be essentially assumed to be 1D. Furthermore, it is more realistic to involve the non-homentropic phenomena such as the variation of cross-sectional area and friction and heat transfer processes between gas and walls. To this end, a non-homogeneous hyperbolic system of the continuity, momentum and energy equations with a strong conservative arrangement is naturally given by the following equations [
40]:
where
z is the spatial dimension;
U and
F are, respectively, the solution vector and flux vector;
B1 and
B2 are the source term vectors representing the respective contribution of area variation and that of heat transfer processes and friction;
G and
q denotes the respective friction term and heat transfer term; subscript 0 represents the stagnation state. The closure of the conversation system is performed by the equation of gas properties. Since the hyperbolic system cannot be solved analytically, it could be only computed by using numerical techniques.
2.3. Model of Ideal Gas
As methane is considered to be a real gas, Equations (9), (10) and (23) are applied for the simulation. For the case of assuming ideal gas behavior, we have:
where
Rg is the gas constant.
After taking into account relations (24) in Equation (10), the energy conservation equation takes the following form:
By replacing Equation (24) in Equation (23), the vectors of the hyperbolic system take the following form:
For ideal gas assumption, specific heat transfer of methane in this work is calculated as a function of gas temperature [
41]:
Cinematic viscosity of methane is given by [
41]:
Thermal conductivity of methane is computed by [
41]:
3. Numerical Procedure
The hybrid numerical model consists of the suction-compression-discharge chamber thermodynamic sub-model and the pipe gas dynamic sub-model, which achieves the mutual interaction of the two systems. The former one simulates the thermodynamic processes based on an integral approach. The resolution of the latter one follows two different numerical techniques depending on points considered (internal points or end-points of pipe). The flow properties of internal points are updated by solving the fundamental conservation equations using the LW2 numerical scheme [
33,
34]. The flow properties at end-points are computed by means of the Trapezoidal Method of Characteristics (TMOC) developed by authors [
33]. The boundary conditions applied follow the Benson’s quasi-steady physical models [
42] for specific boundaries. For the real gas model, it is noteworthy here that the TMOC formulation for ideal gas is applied but gas properties are calculated by calling the NIST REFPROP database. An improvement of evaluating the influence of friction and heat transfer along the characteristic lines and the path-line is thus obtained due to the non-ideal formulation of the TMOC without substantially increasing the complexity and computation effort [
43].
In the developed numerical model, the coupling between pipelines and cylinder is realized through estimating the temperature and pressure in the suction and discharge chambers. For each time step, the independent points of the pipelines are solved by using the LW2 numerical scheme, but the boundary condition connected to chambers must be solved simultaneously with the thermodynamic sub-model in an iterative fashion. Firstly, the mass flow rate and energy flow through the ports contiguous to chambers are used as inputs to the thermodynamic integral solution. Differential Equations (9), (10) or (25) and (20) correspond in sequence to the first law of thermodynamics, the continuity equation and valve dynamic are calculated simultaneously by using the standard 4th order Runge–Kutta method. Specific internal energy e and gas mass m inside control volumes can be obtained and one can compute the instantaneous density by:
The two independent thermodynamic properties (specific internal energy and density) are enough to select the rest of the properties in the control volumes handily. Subsequently, the new solutions for the temperature and pressure in the suction and discharge chambers are applied as boundary conditions for updating the flow properties of pipe end-points, which are transferred as new inputs to the thermodynamic integral solution. This re-evaluation process could be repeated as many times as required until further significant improvements are not reached. It is found, however, that application of the correcting step only once is accurate enough since the computational time grid for thermodynamic solution is usually short [
18]. Through this methodology, the pressure pulsation propagation in the pipeline system is coupled into the compressor thermodynamic processes.
The time-step of the numerical simulation must be properly set. It is common sense that for pipe calculation, the spatial mesh size Δ
x is usually defined by the user to achieve a suitable trade-off between accuracy and computational cost. However, the time interval Δ
t will be determined by the stability criterion of Courant-Friedrichs-Lewy (CFL) applied to each pipe in the system [
41]:
where
a is the speed of sound. It is general that the time-marching procedure will be most efficient when Equation (31) has an equal sign. In addition, the working processes of the reciprocating compressor are carried out in a cyclic pattern. At each cycle, the simulation must start just at the beginning of the period and finish at the end of the period. Thus, in this work the time discretization is performed with a constant value Δ
t =
t0/
n (
t0 indicates the compressor period) but most compatible with Equation (31). It is noteworthy, however, that commonly the compressor thermodynamic calculation is more restrictive than the pipelines. For instance, a crankshaft cycle is usually discretized into at least 3600 steps [
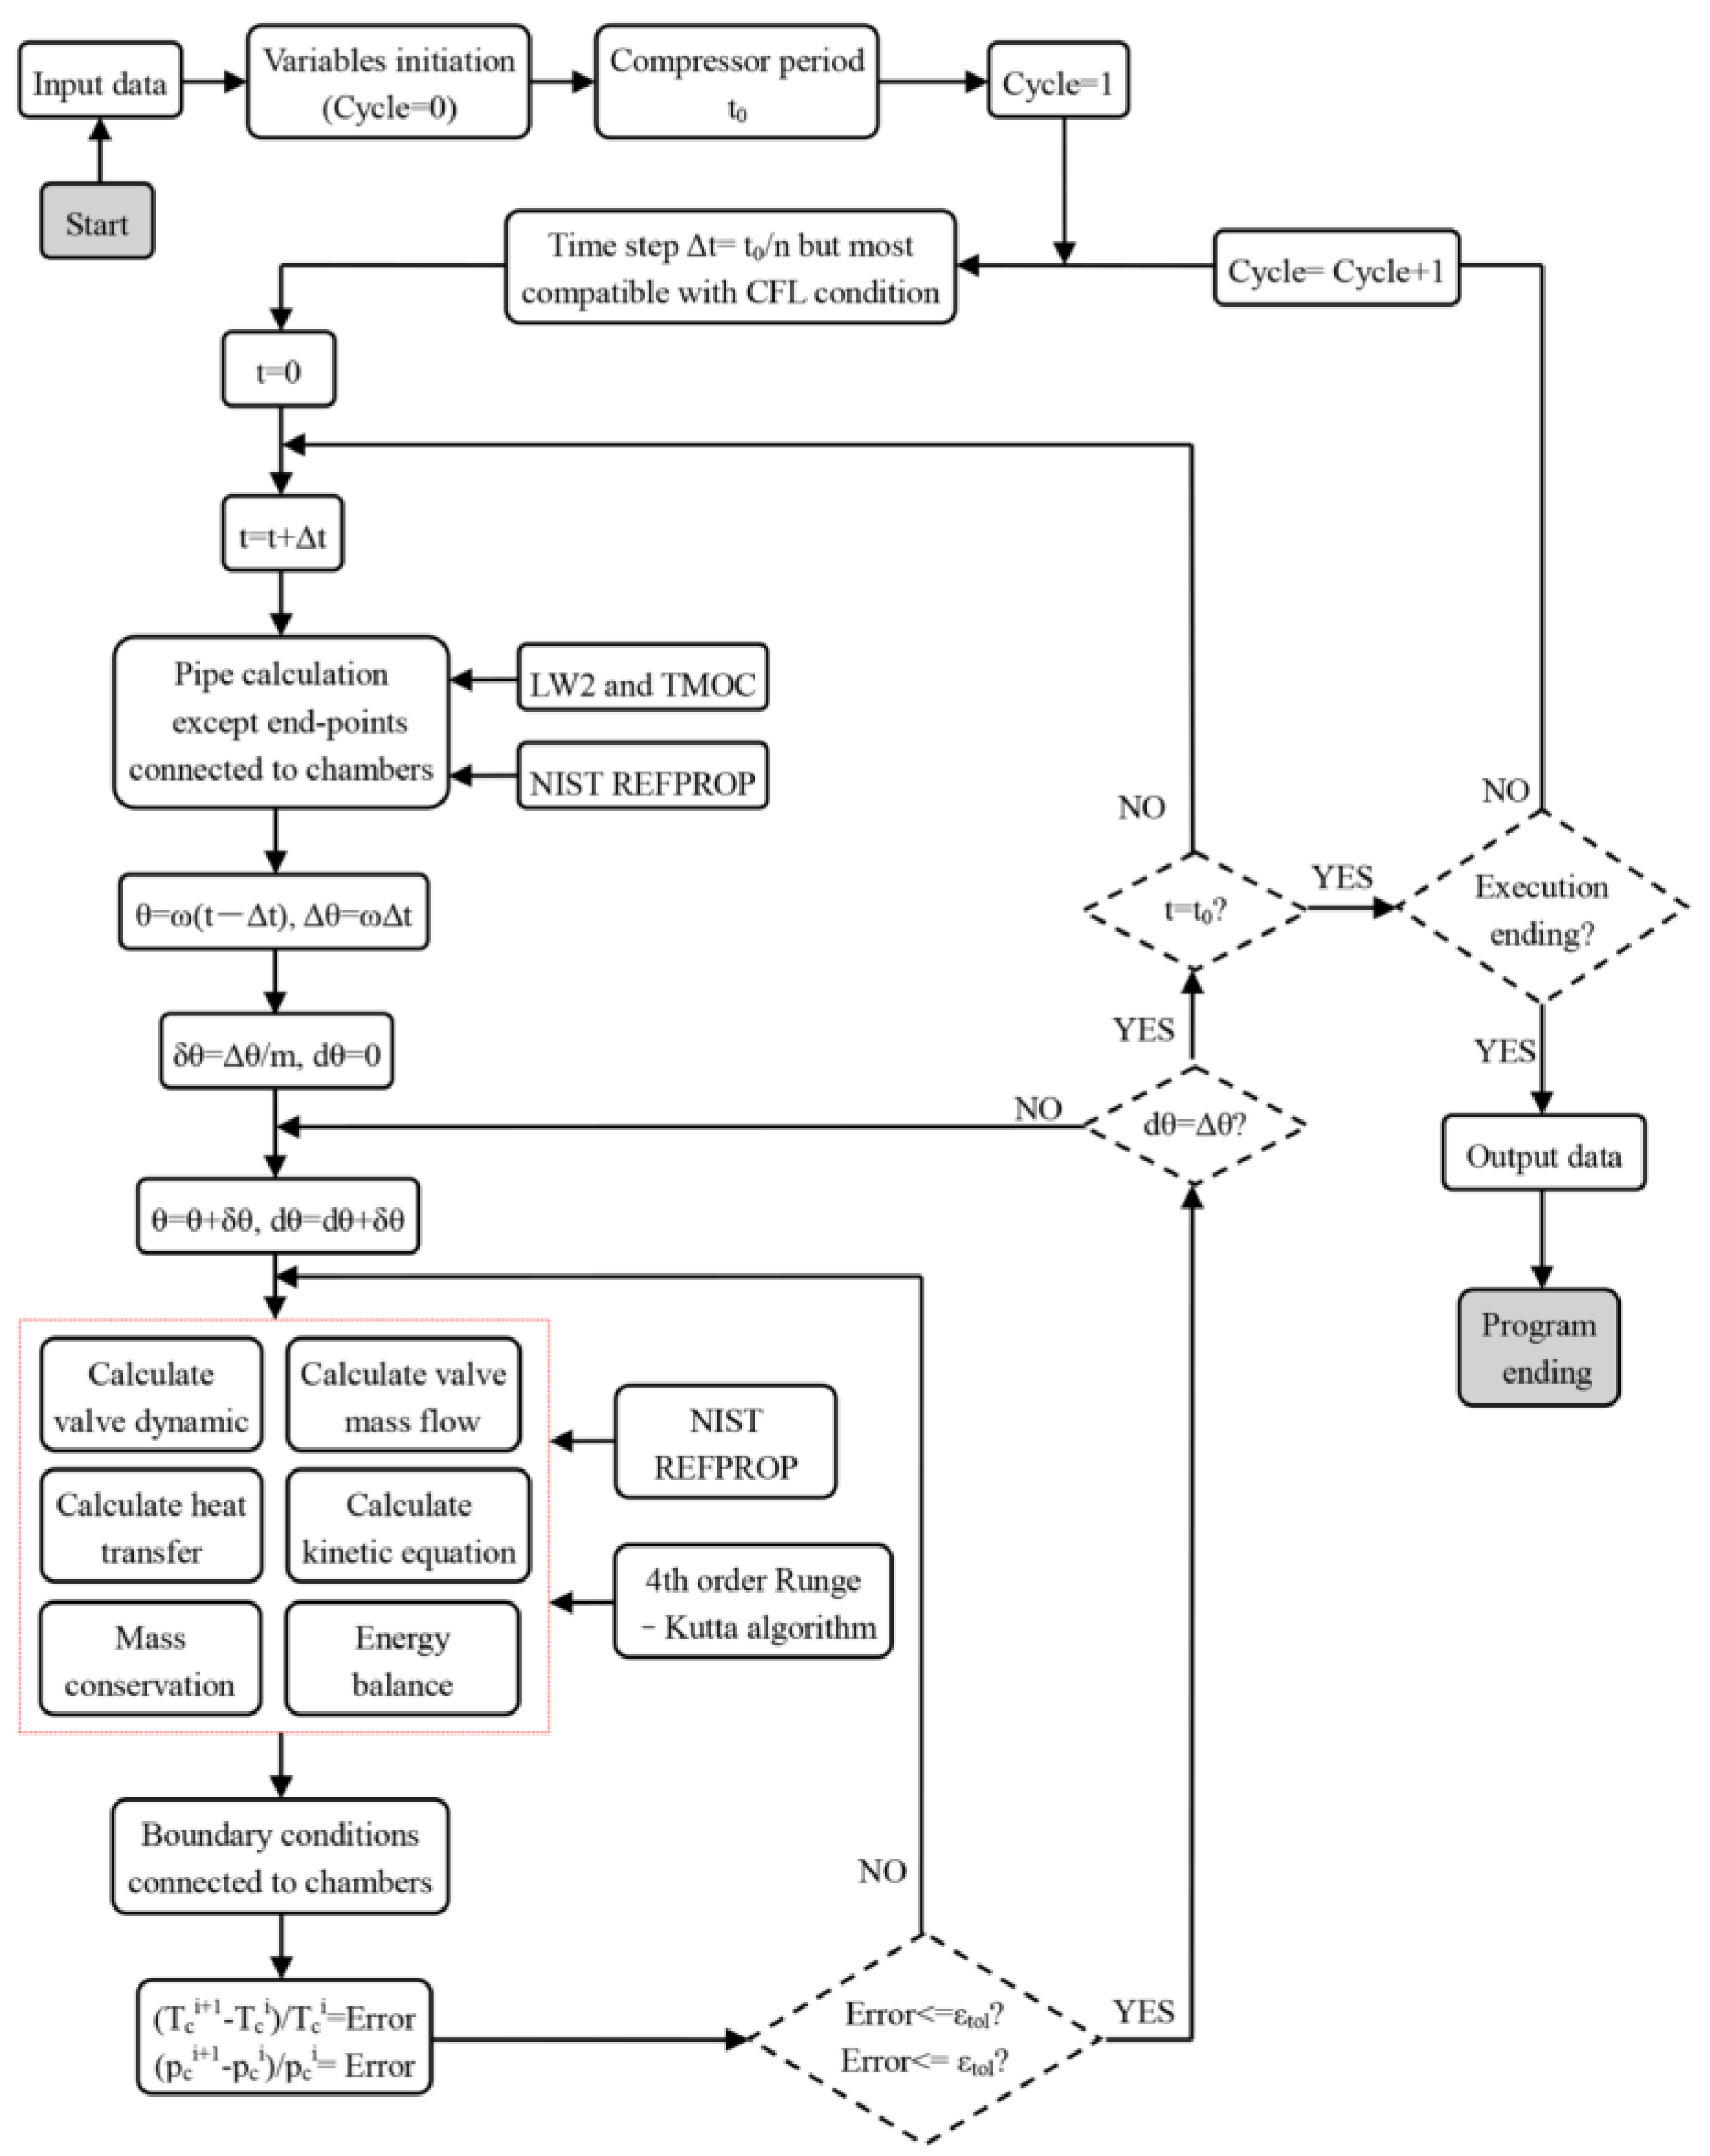
18]. The common time discretization will strongly influence the global computational cost required for the whole system simulation. A Local Climbing Method is thus developed by authors to overcome this problem [
30,
33], which is more economical for the global calculation cost, especially for the real gas model. The flowchart of the hybrid approach for the real gas model is shown in
Figure 2, and for the ideal gas model the procedure is the same except the call of the NIST REFPROP database.
The mass flow rate, indicated power and specific work of the compressor are calculated as in the following equations:
where
N is the compressor rotational speed.
4. Results and Discussion
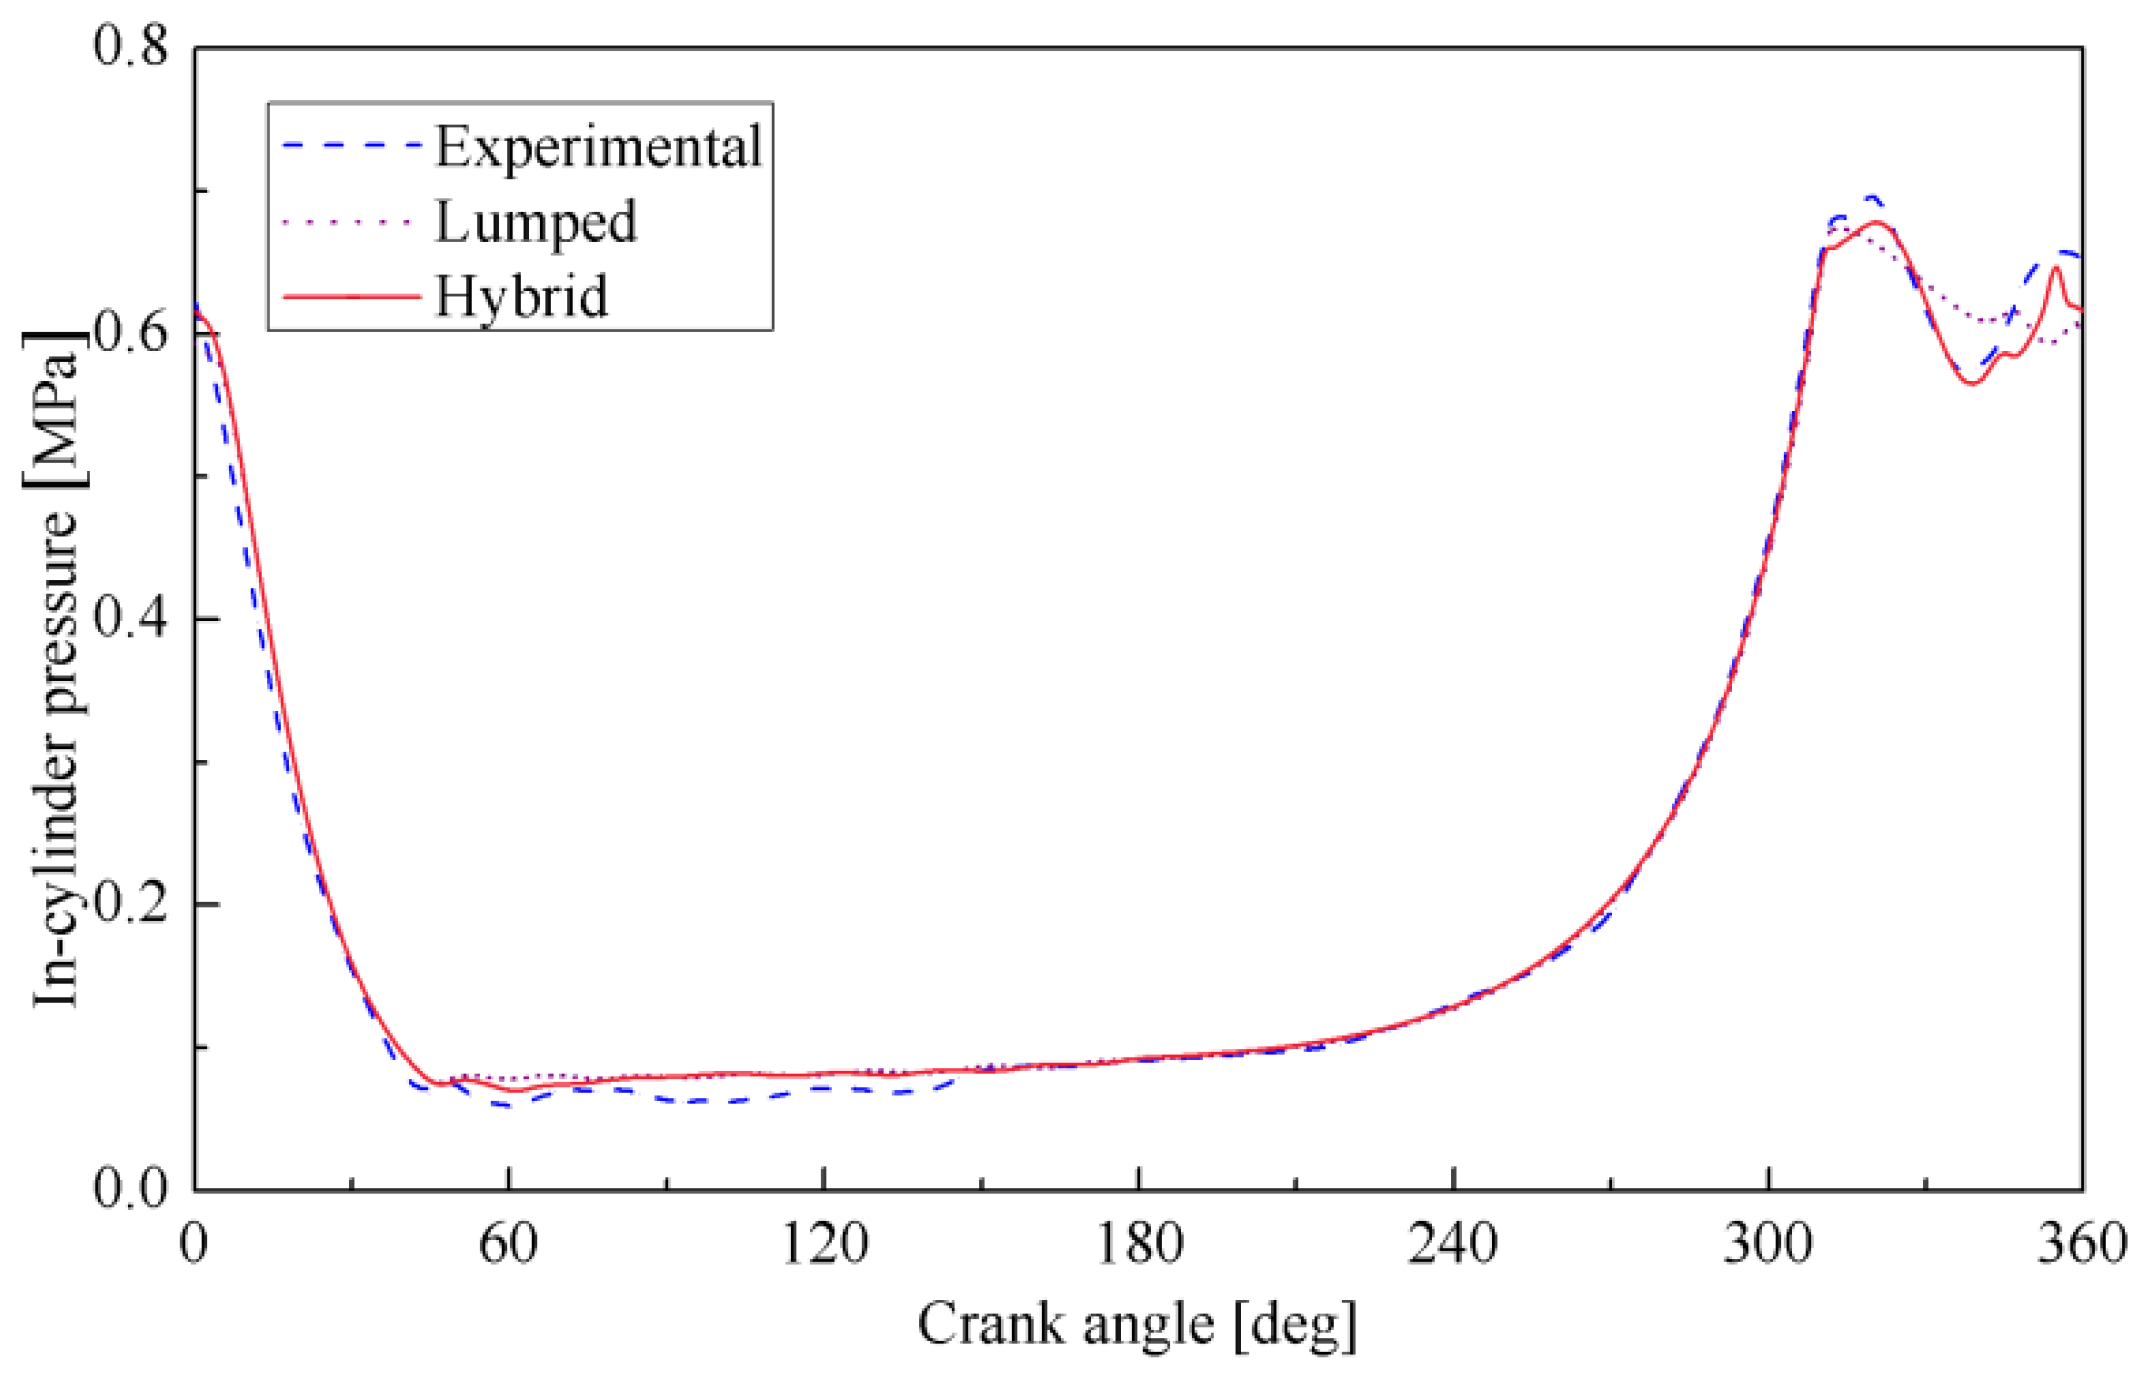
In order to validate the hybrid numerical model and also assess its advantages, the predicted results are compared with available measure values [
38], together with the data from the lumped model, as shown n the comparison of in-cylinder pressure variation in
Figure 3. The experimental measurements performed by reference [
38] were typical and valuable for testing the thermodynamic cycles of reciprocating compressors, and the experimental results have been widely cited by many researchers for comparing their numerical results. Generally, both models can give similar pressure variation trends that follow well with the measuring history. Especially during the expansion and compression stages, numerical model results are consistent with the measured values. However, the merits of the hybrid model predicting the thermodynamic cycle can be clearly explained by examining in detail the pressure changes in the suction and discharge phases. As can be seen in
Figure 3, here the hybrid model predicts the in-cylinder pressure oscillations much better than the lumped model by comparing with the experimental ones, which directly corresponds to the pressure pulsation waves in the suction and discharge chambers. The lumped model is mainly limited in not evaluating the pressure pulsations, while the above detailed analysis confirmed effectively the feasibility of the developed computational model allowing the compressor-pipeline interaction. It is also worthwhile to notice that the developed model is able to simulate accurately the pipeline pressure pulsations with large amplitude, which is much more advantageous than the current acoustic wave models.
The following results presented in this work are for a reciprocating natural gas compressor with the specifications mentioned in
Table 1. The effects of pressure pulsations are investigated in separate sections.
4.1. Suction Pressure Pulsation Influence on Compressor Operation for Ideal and Real Gas Models
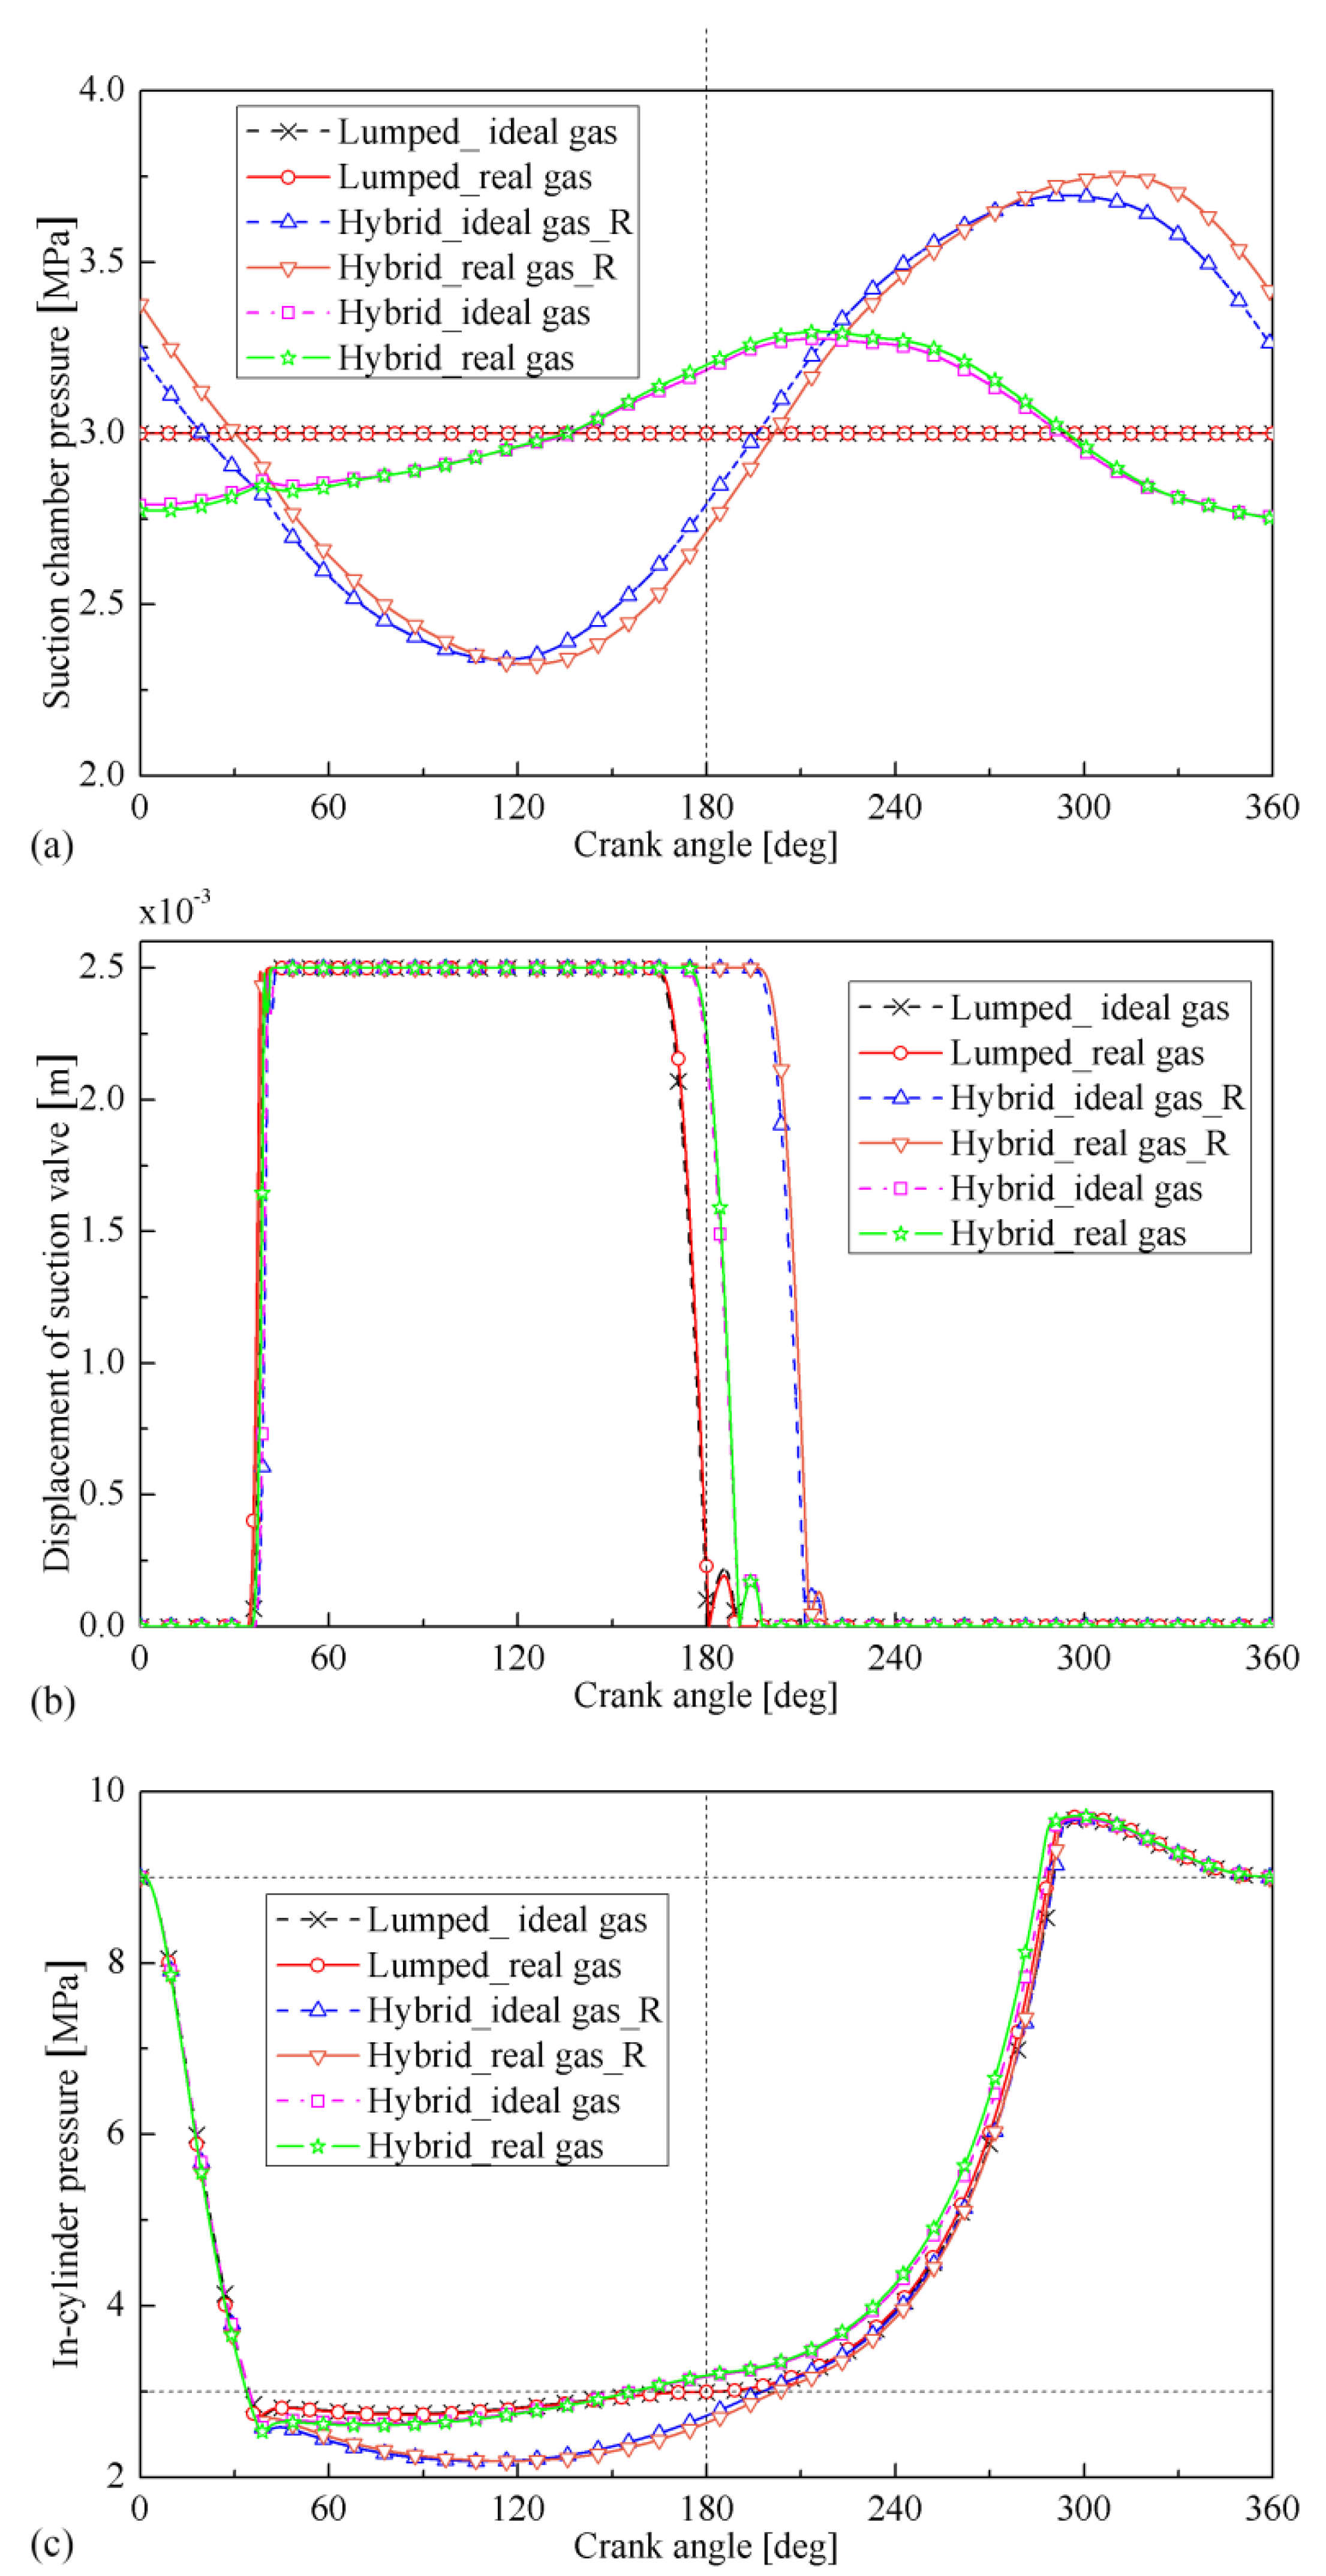
With the purpose to further verify the reliability of the developed methodology, in this section the effects of suction pressure pulsation on compressor operation with ideal and real gas models are examined. The investigated suction system is adjusted as three cases of no piping configurations, a 2.232 m long suction pipe and a 3.133 m long suction pipe for about 1st harmonic resonance. For each case the discharge system is set to no piping configurations with constant pressure boundaries. It is worth pointing out that in
Figure 4a the pressure fluctuation is about 46% of the mean pressure, which is much more than 8%. This indicates that current linear acoustic theory will not be accurate for predicting the pressure pulsations in this work since the large magnitude of pressure fluctuation violates the assumption on which the acoustic equation is based, i.e., acoustic pressure should be small compared to the mean pressure.
The variation of (a) suction chamber pressure, (b) displacement of suction valve and (c) in-cylinder pressure for ideal and real gas model is shown in
Figure 4. Generally, there is a clear influence of pressure pulsations in the suction chamber directly on the motion law of suction valve and the in-cylinder pressure oscillations, especially for the case of resonance. For these figures, the working cycle begins from Top Dead Center (TDC) where the cylinder volume is the same as the clearance volume. With the piston moving from TDC to BDC, the cylinder volume is increased and thus in-cylinder pressure decreases sharply with the curves, showing good agreement for all the cases until the suction valve is opened. The suction valve is opened slightly later for the hybrid model than the lumped model since the former suction chamber pressure is lower than the latter constant pressure. Once the suction valve is opened, the suction process begins. The pressure pulsation waves are subsequently transferred into cylinder, leading to the pressure oscillations in the cylinder. Also, the closing of the suction valve is strongly influenced. For instance, the pressure pulsations in the suction system lead to a delay in the closing of the valve in this work due to the suction pulsating pressure increasing at the end of the suction portion. Furthermore, the offset of pressure waves in the suction chamber between ideal gas and real gas models becomes larger for the resonance case than for that without resonance.
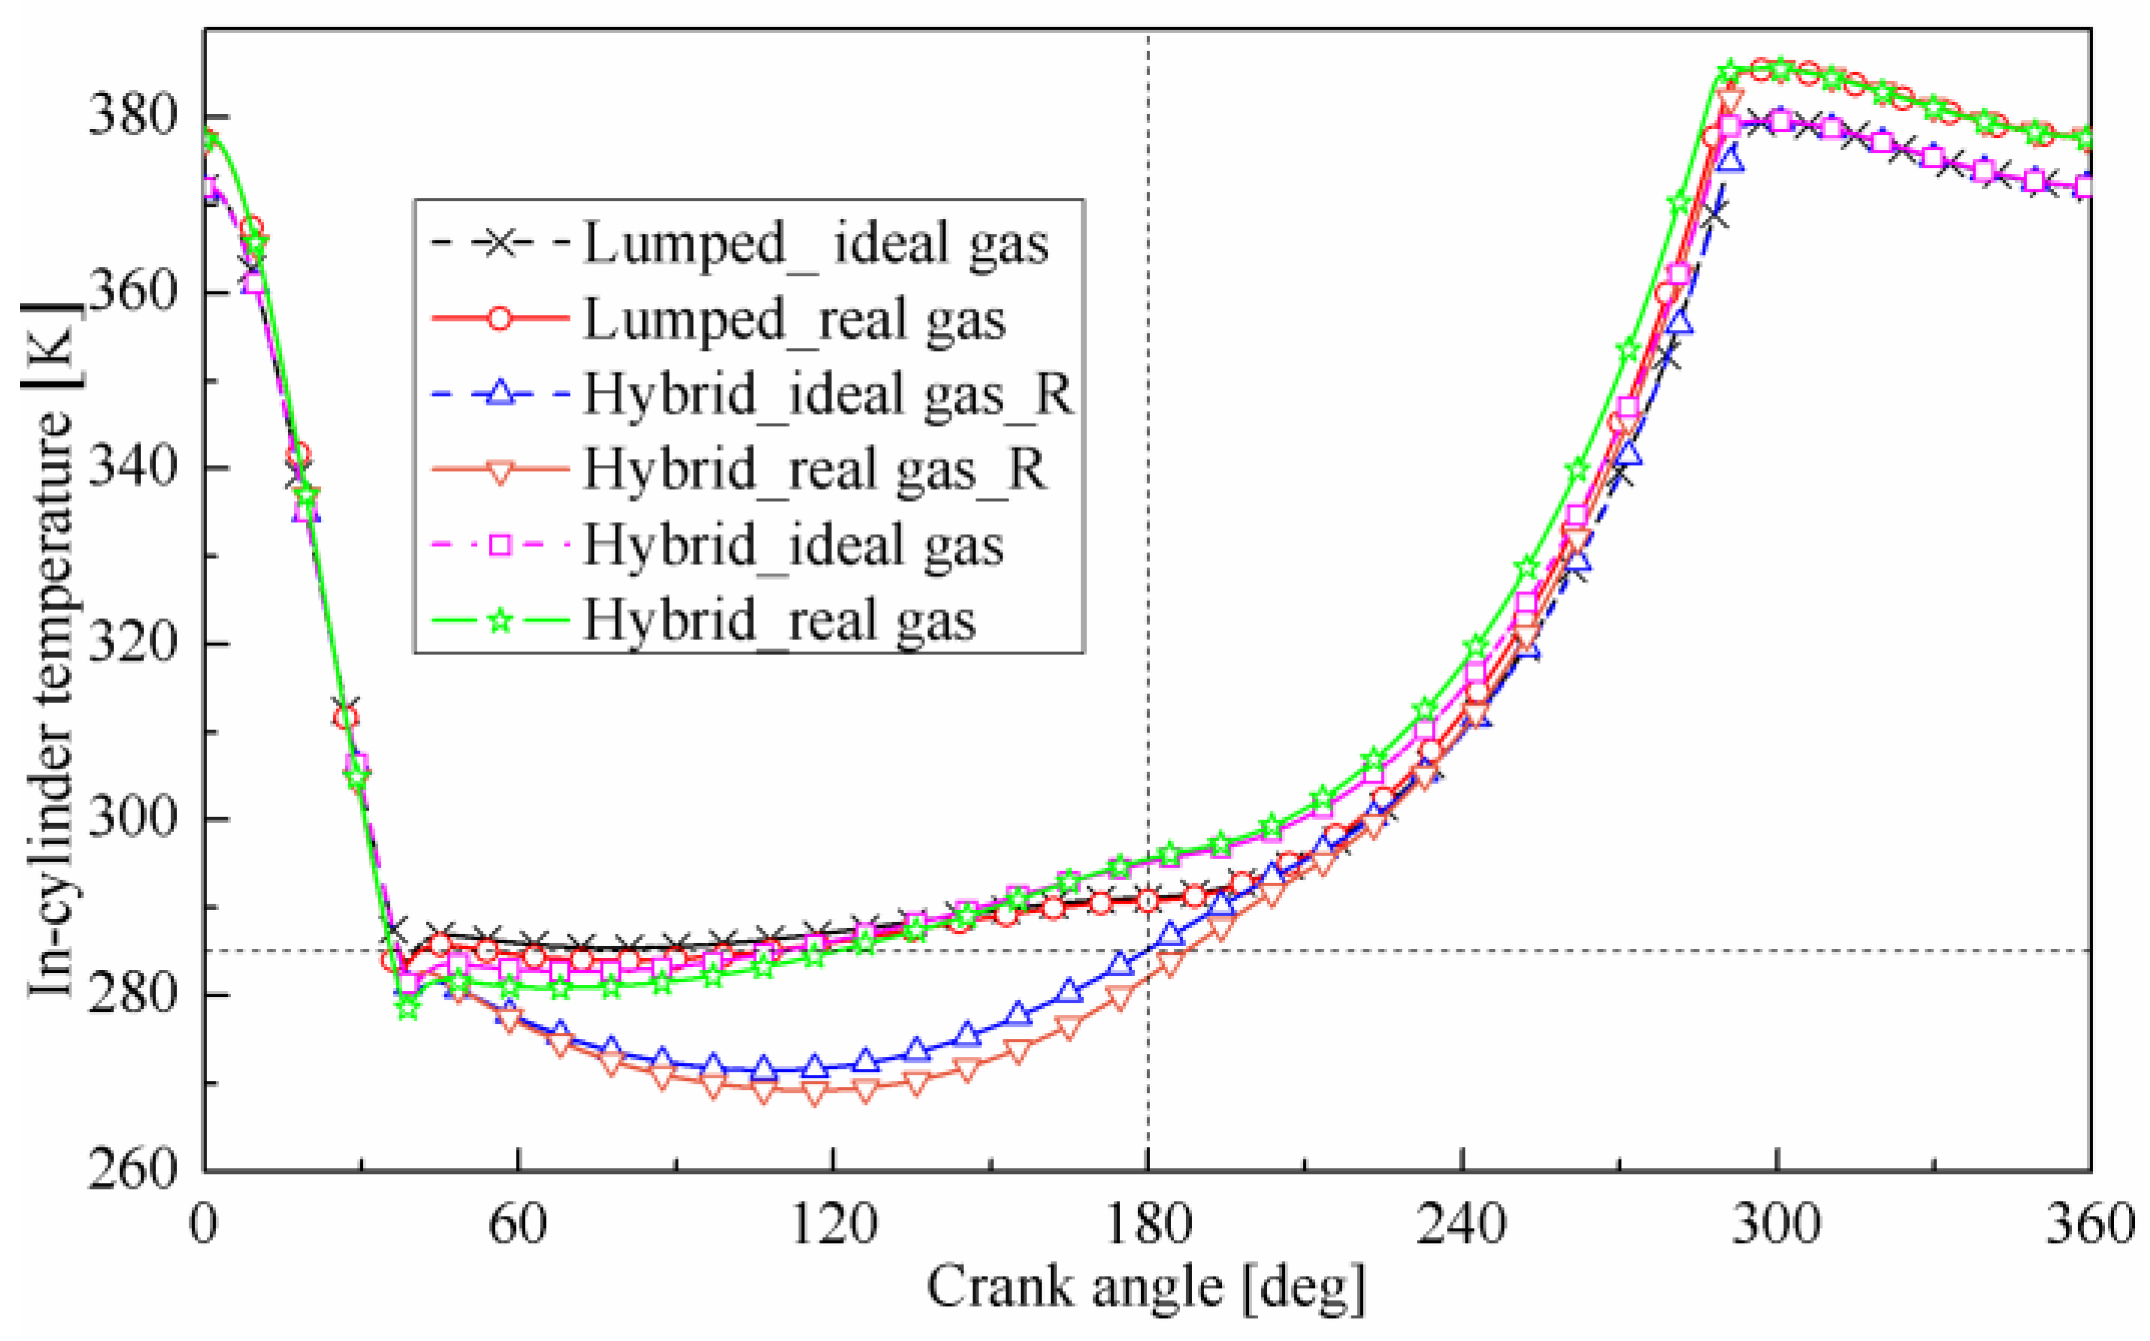
Figure 5 depicts the effects of pressure pulsations on the dynamic in-cylinder temperature for real and ideal gas models under different suction configurations. With the similar variation of in-cylinder pressure illustrated previously in
Figure 4, in-cylinder temperature declines strongly with the piston moving from TDC to BDC, following similar curves until the suction valve is opened. Also, the in-cylinder temperature oscillation during the suction phase is linked directly to the pulsating flow in the suction system. In addition, during the compression and discharge phases of the cycle, the in-cylinder temperature of the real gas is higher than that of the ideal gas model because the in-cylinder fluid mass of the real gas is larger than that under the ideal gas assumption. The maximum temperature is about 379.5 K for the ideal gas and about 385.4 K for the real gas.
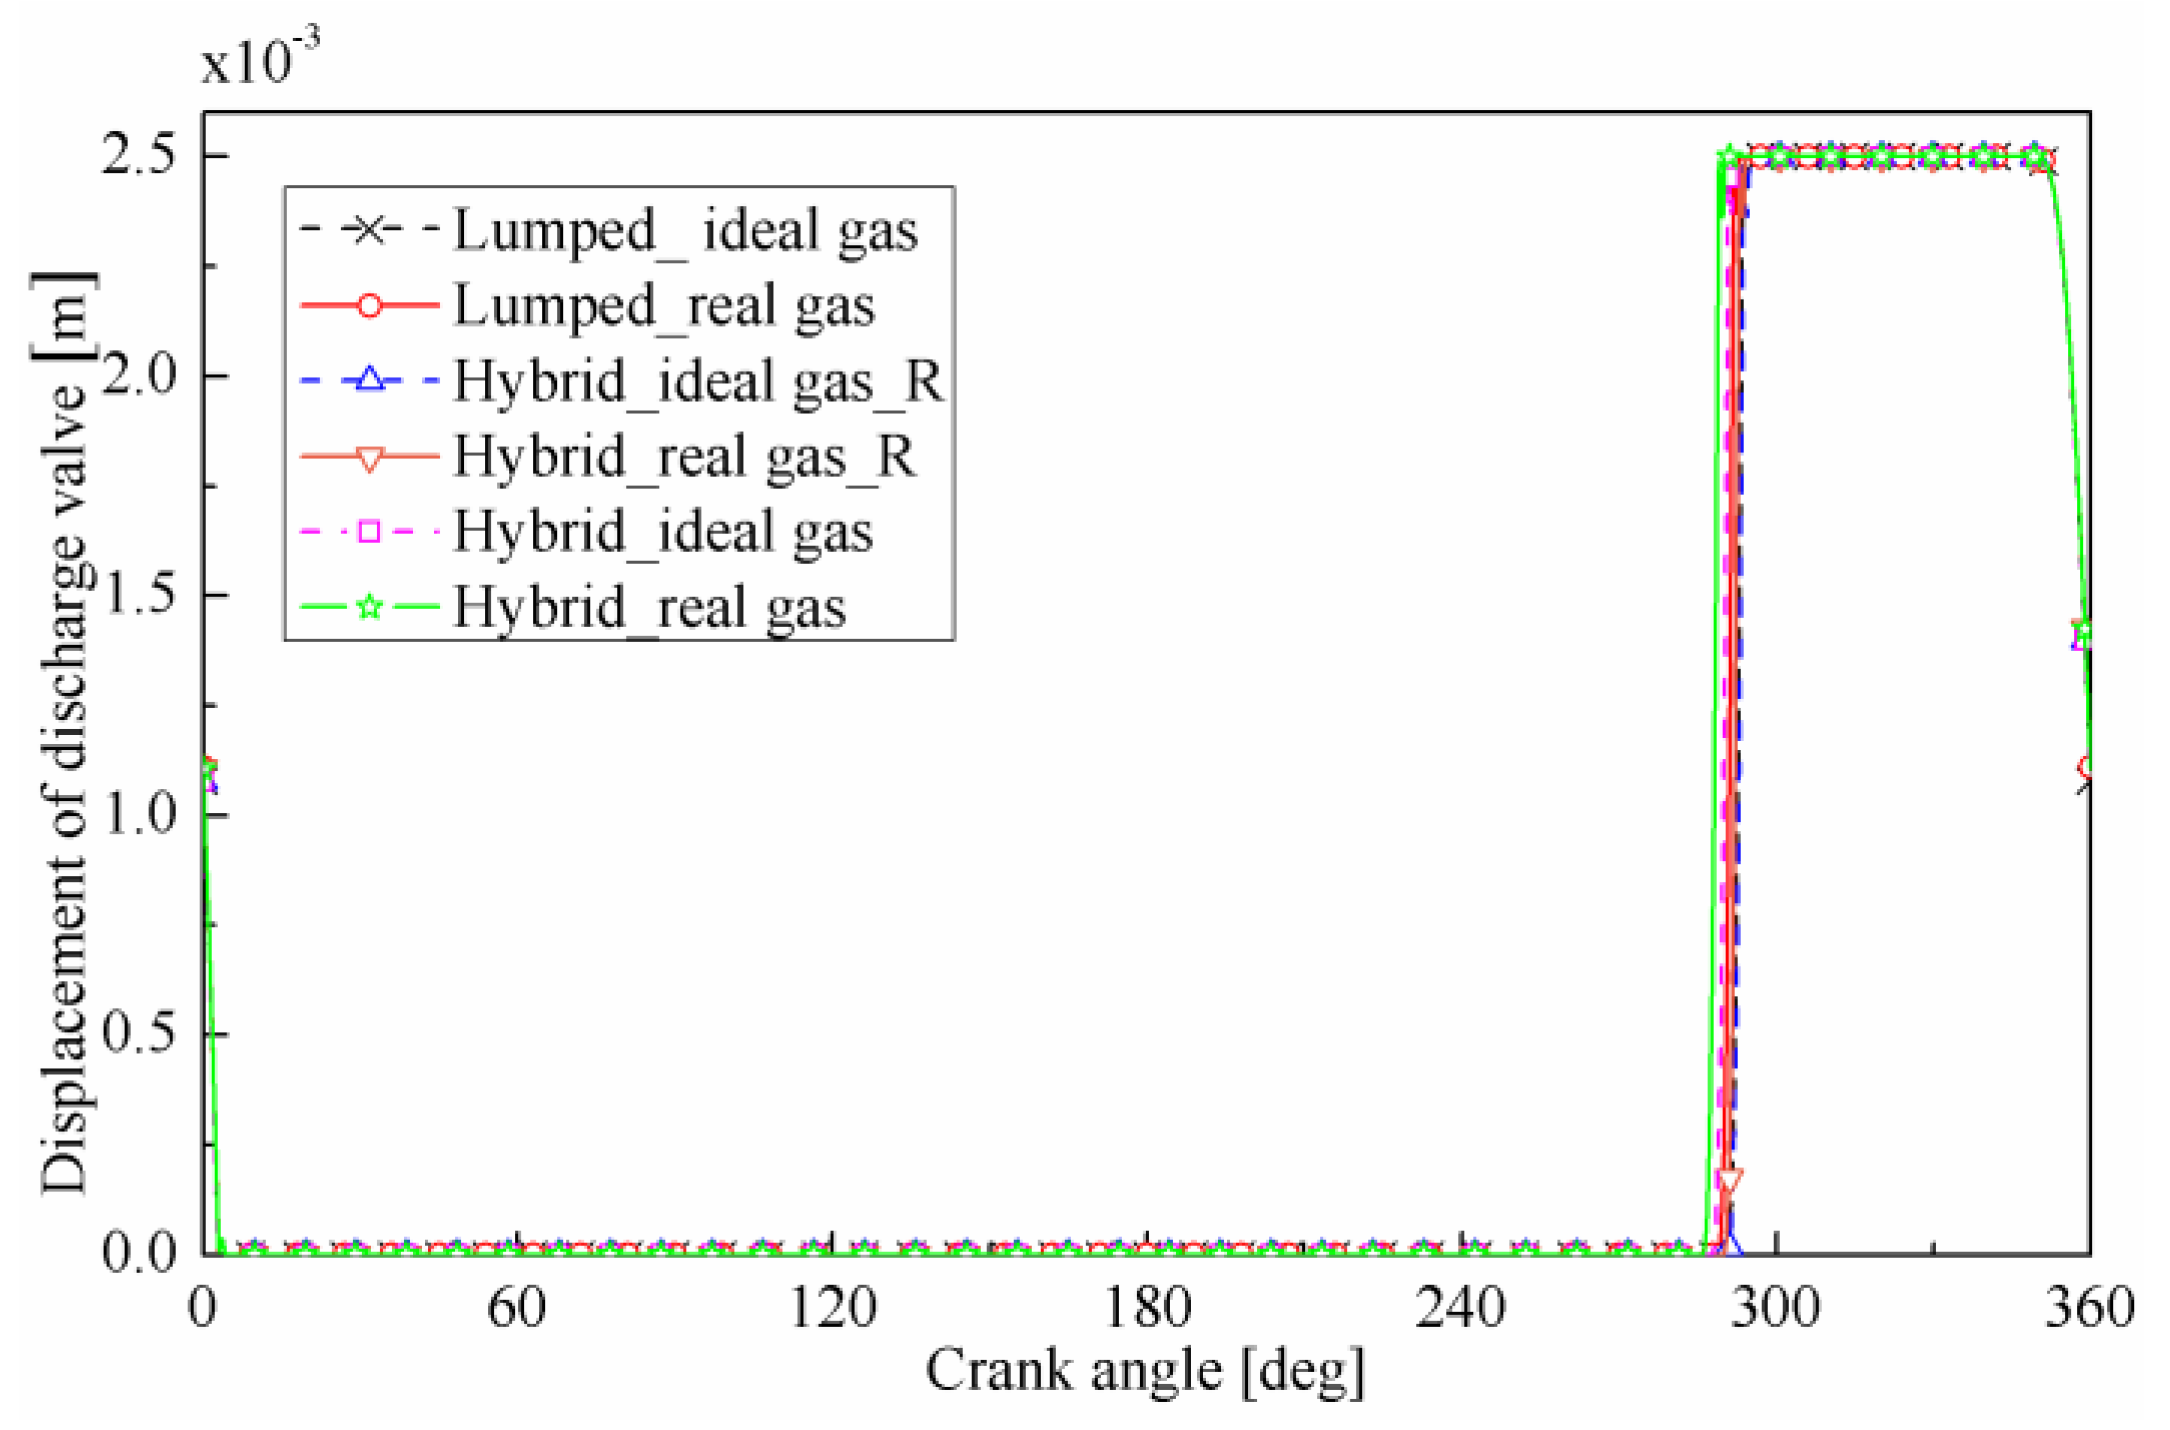
The effects of pressure pulsations under different suction configurations on the motion of discharge valve for real and ideal gas models are illustrated in
Figure 6. The figure shows a slight influence of suction pressure pulsations on the discharge valve motion.
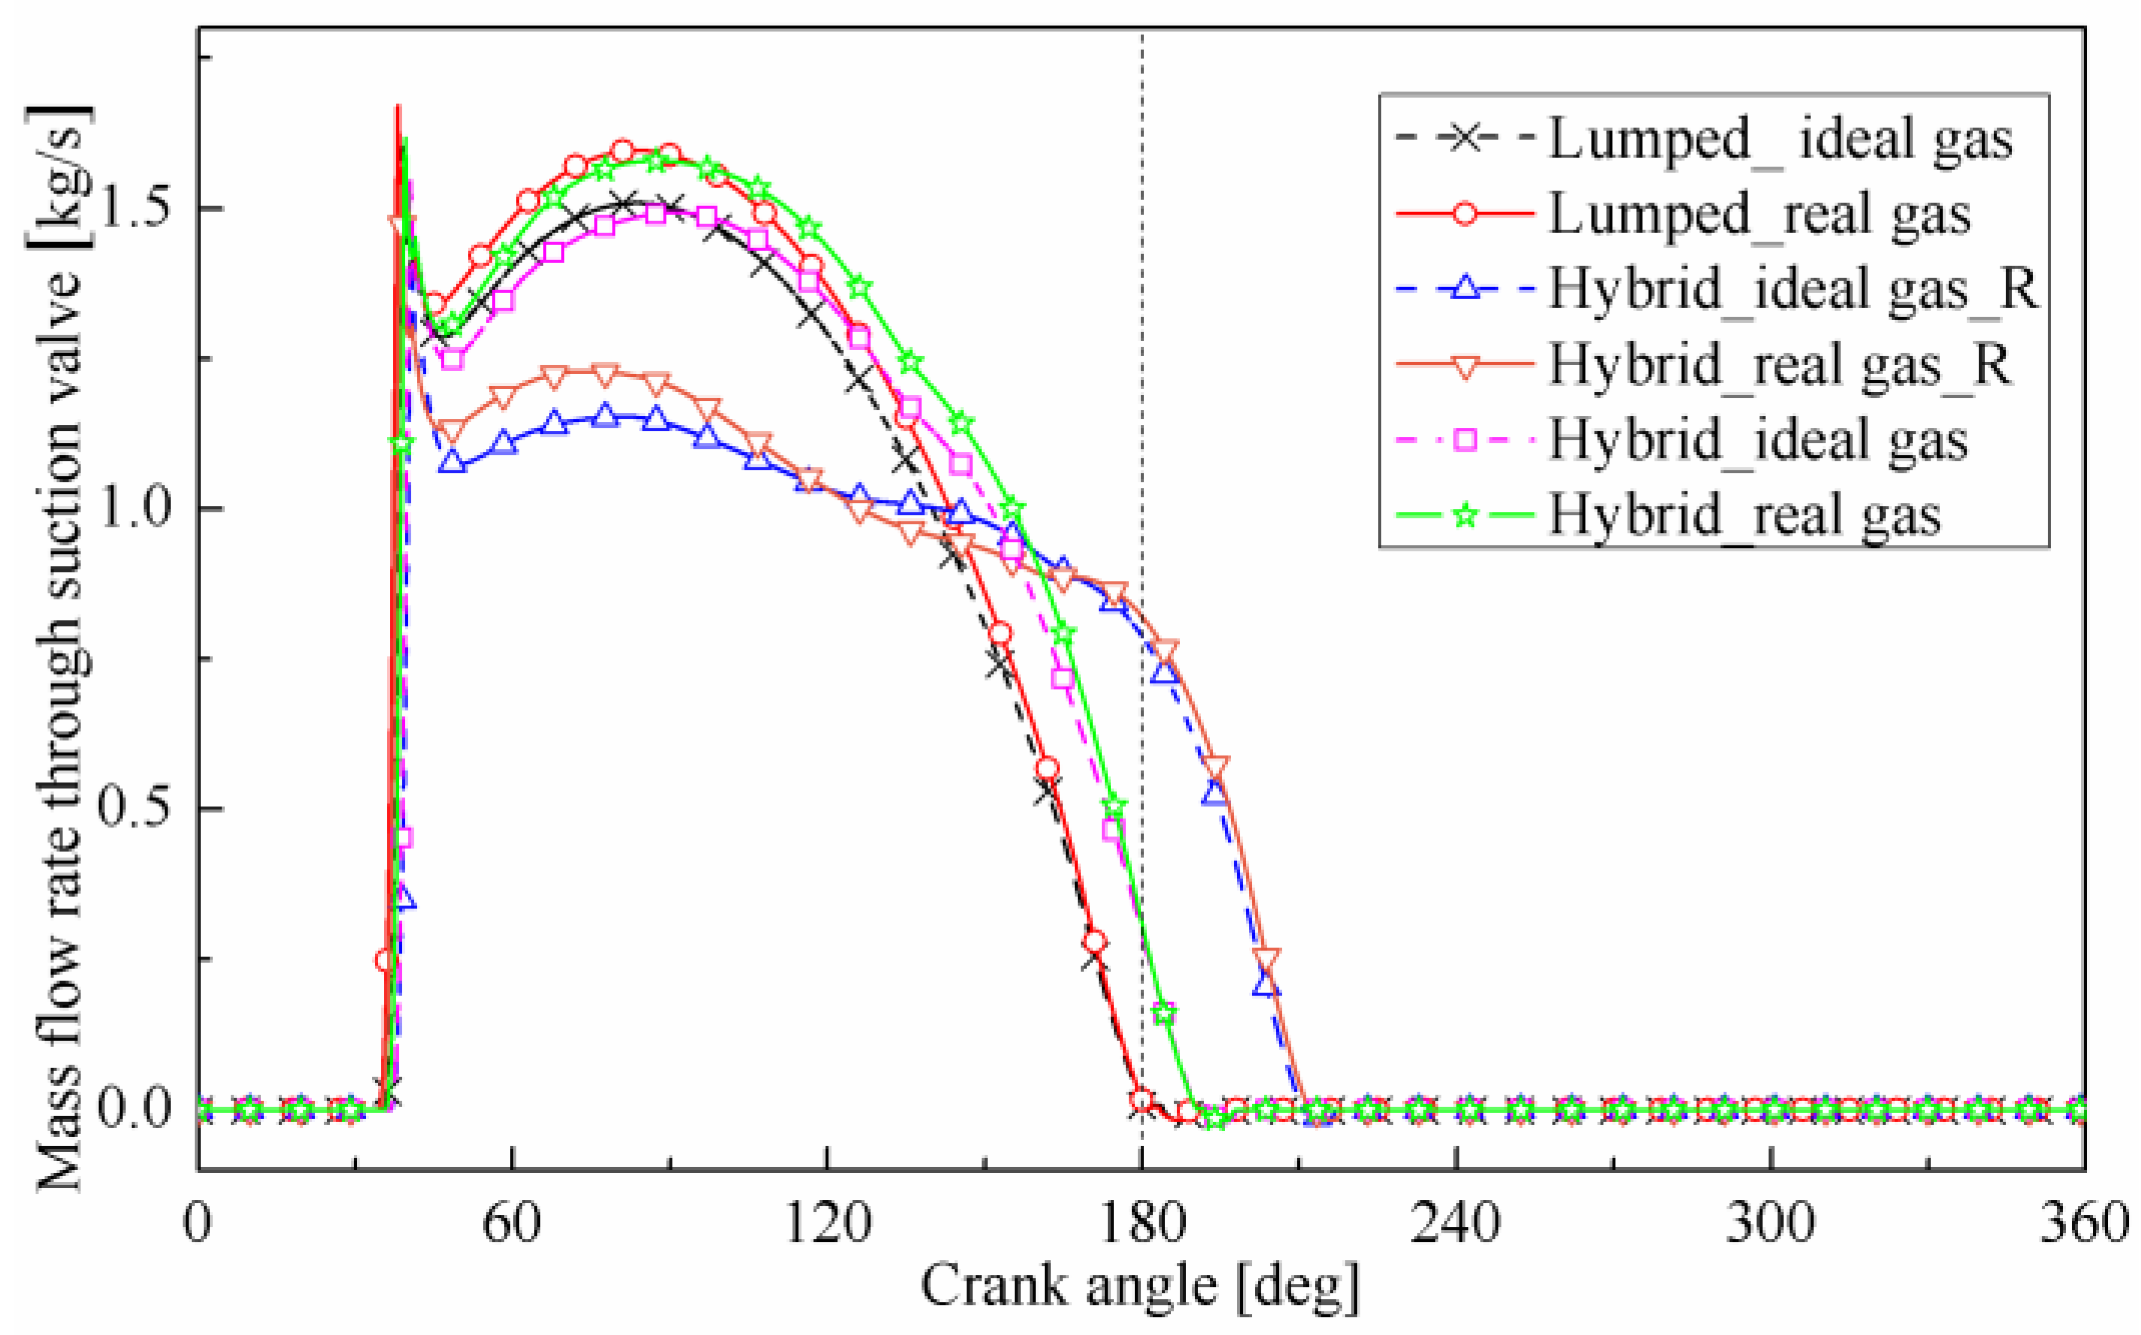
Figure 7 shows the variation of the instantaneous suction mass flow rate for real and ideal gas models under different suction configurations. Also, pressure pulsations have a clear influence on the momentum mass flow rate. The mass flow rate reaches the maximum rapidly with the opening of the suction valve. Moreover, in the same case, the mass flow rate that enters the cylinder is higher for the real gas model compared to the ideal gas model since the gas density is higher for the real gas model.
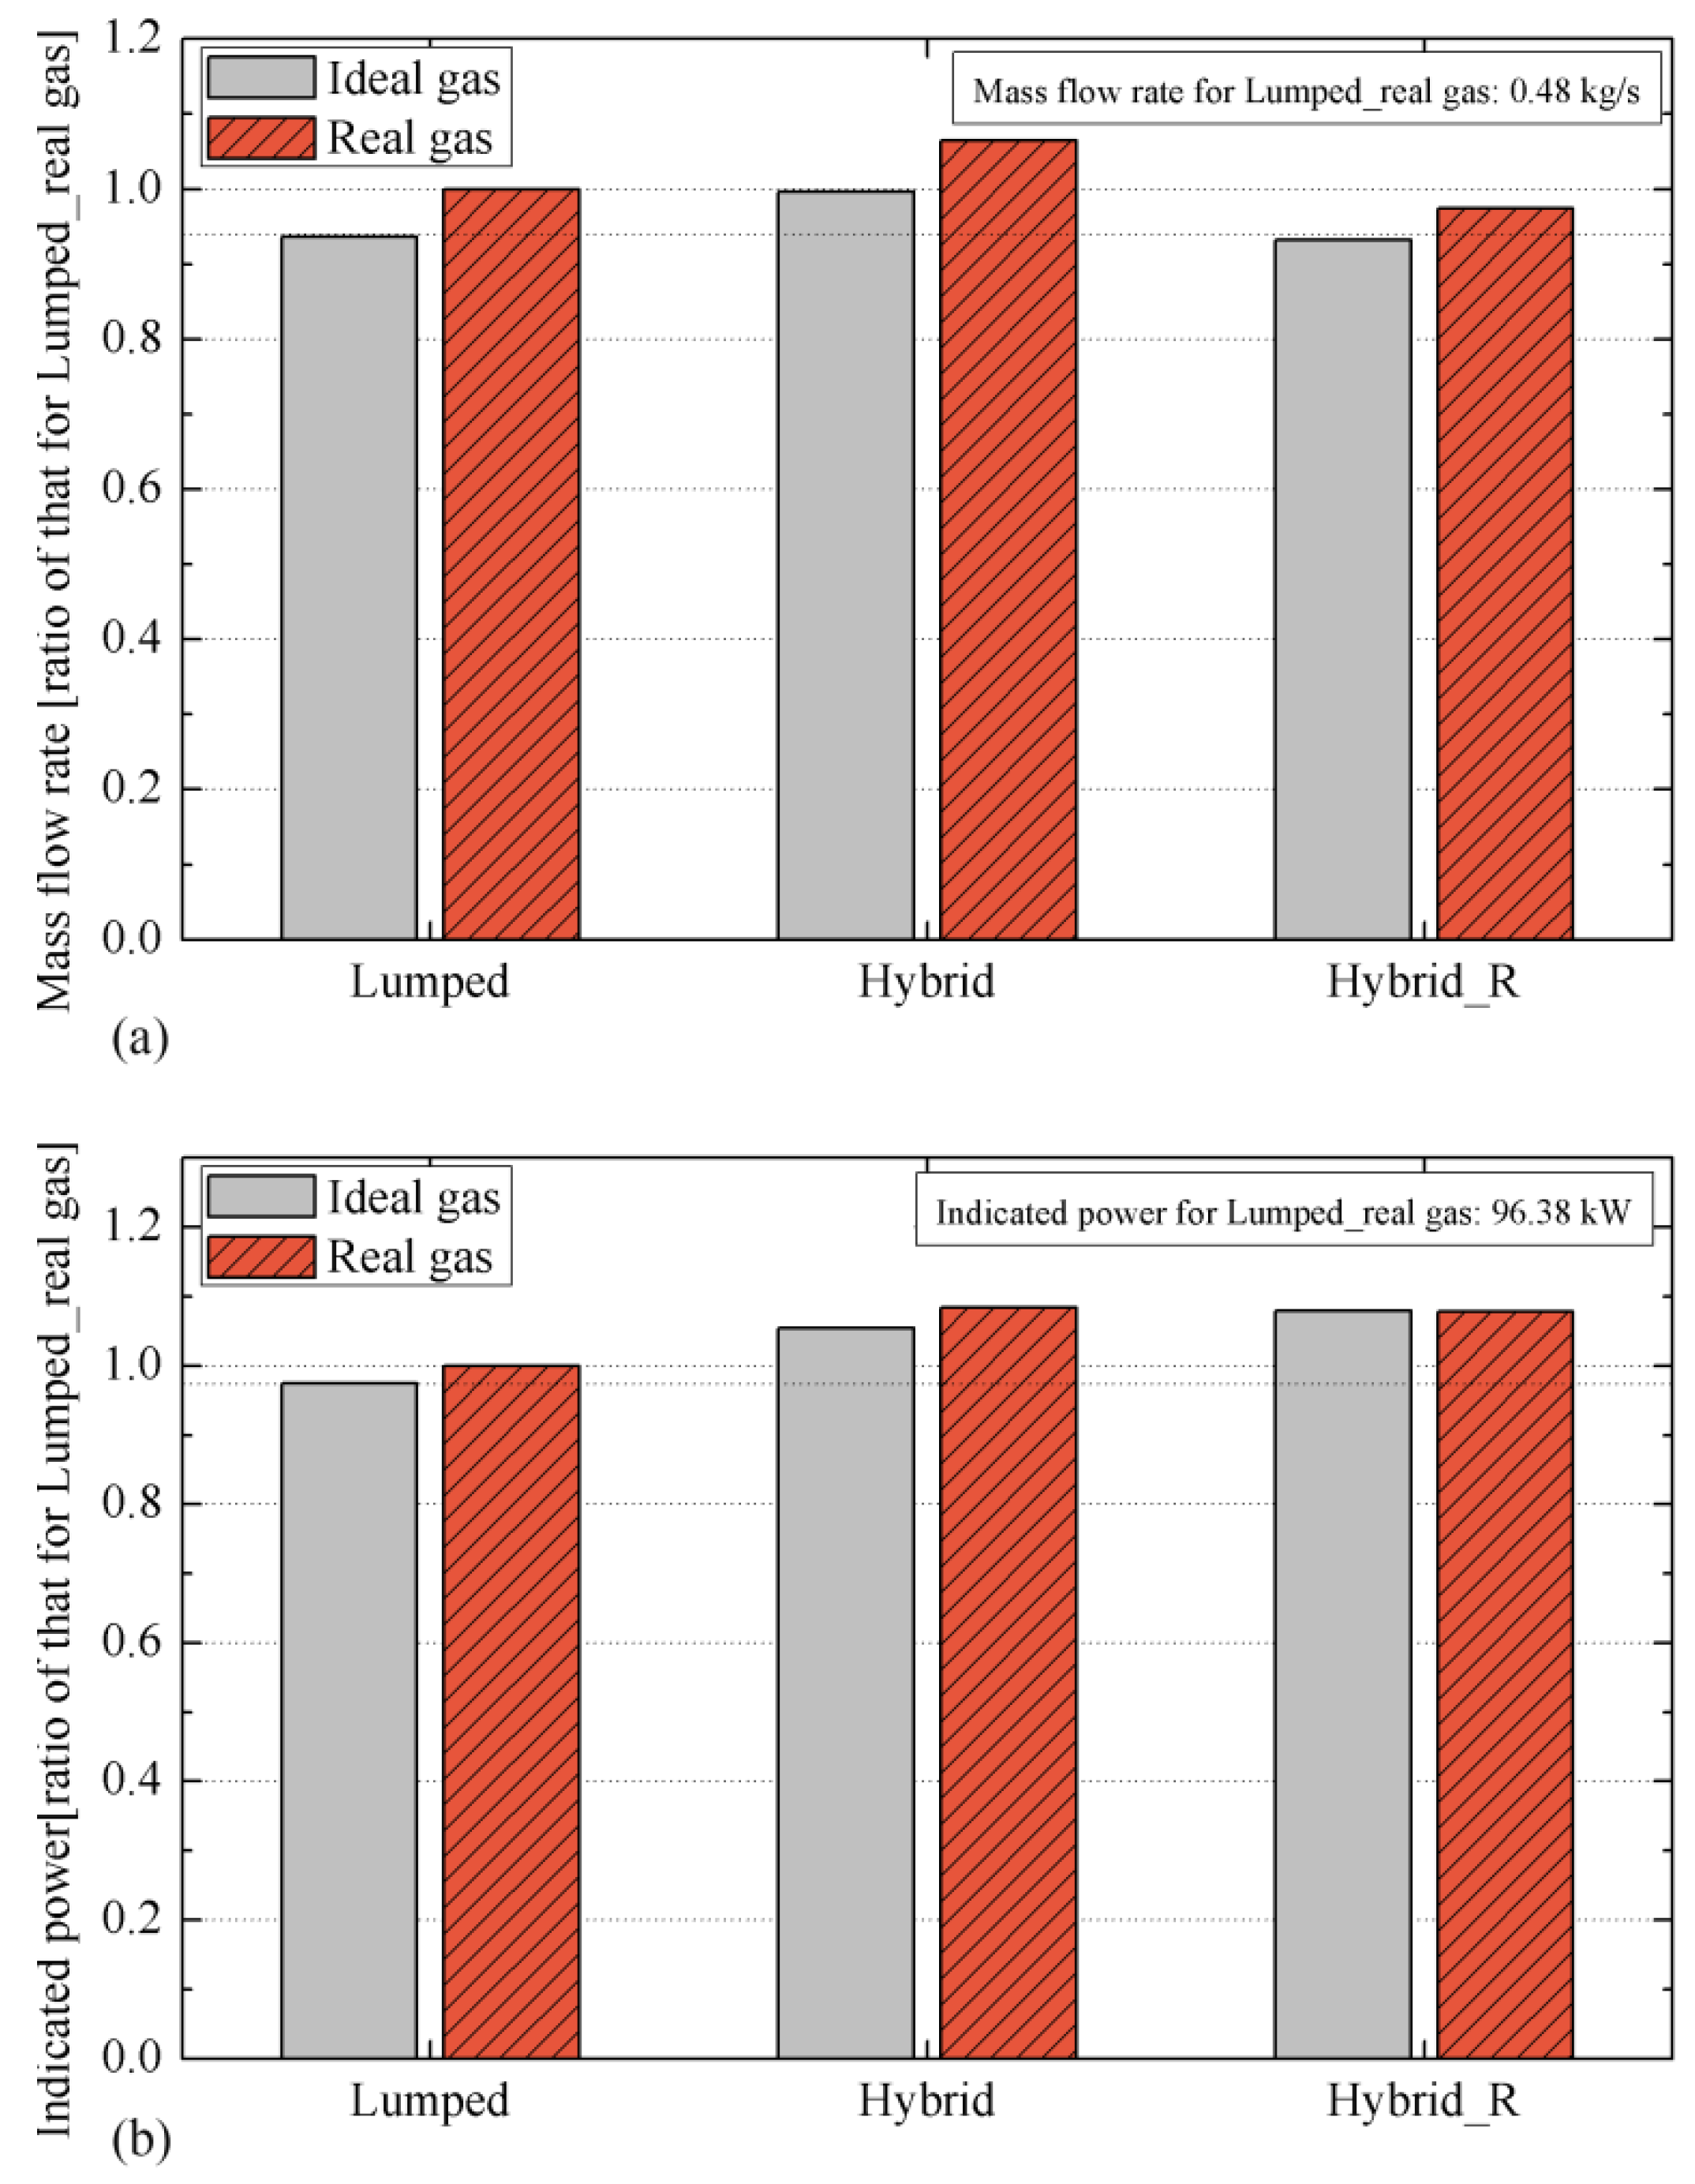
Figure 8 shows the comparison of the (a) compressor mass flow rate and (b) indicates power with different suction configurations for ideal and real gas models. A direct comparison amongst the results of different configurations is made in terms of the ratio variation of both the above variables compared to the values of the compressor lumped configuration for real gas. Based on
Figure 8a, gas pulsations in the suction system can considerably influence the compressor mass flow rate. If the wave action in the suction system is tuned properly, the so-called supercharging effect can be obtained. In
Figure 8b it is concluded that the consumed power is higher for the real gas model compared to the ideal one, as more in-cylinder working fluid needs higher compression power.
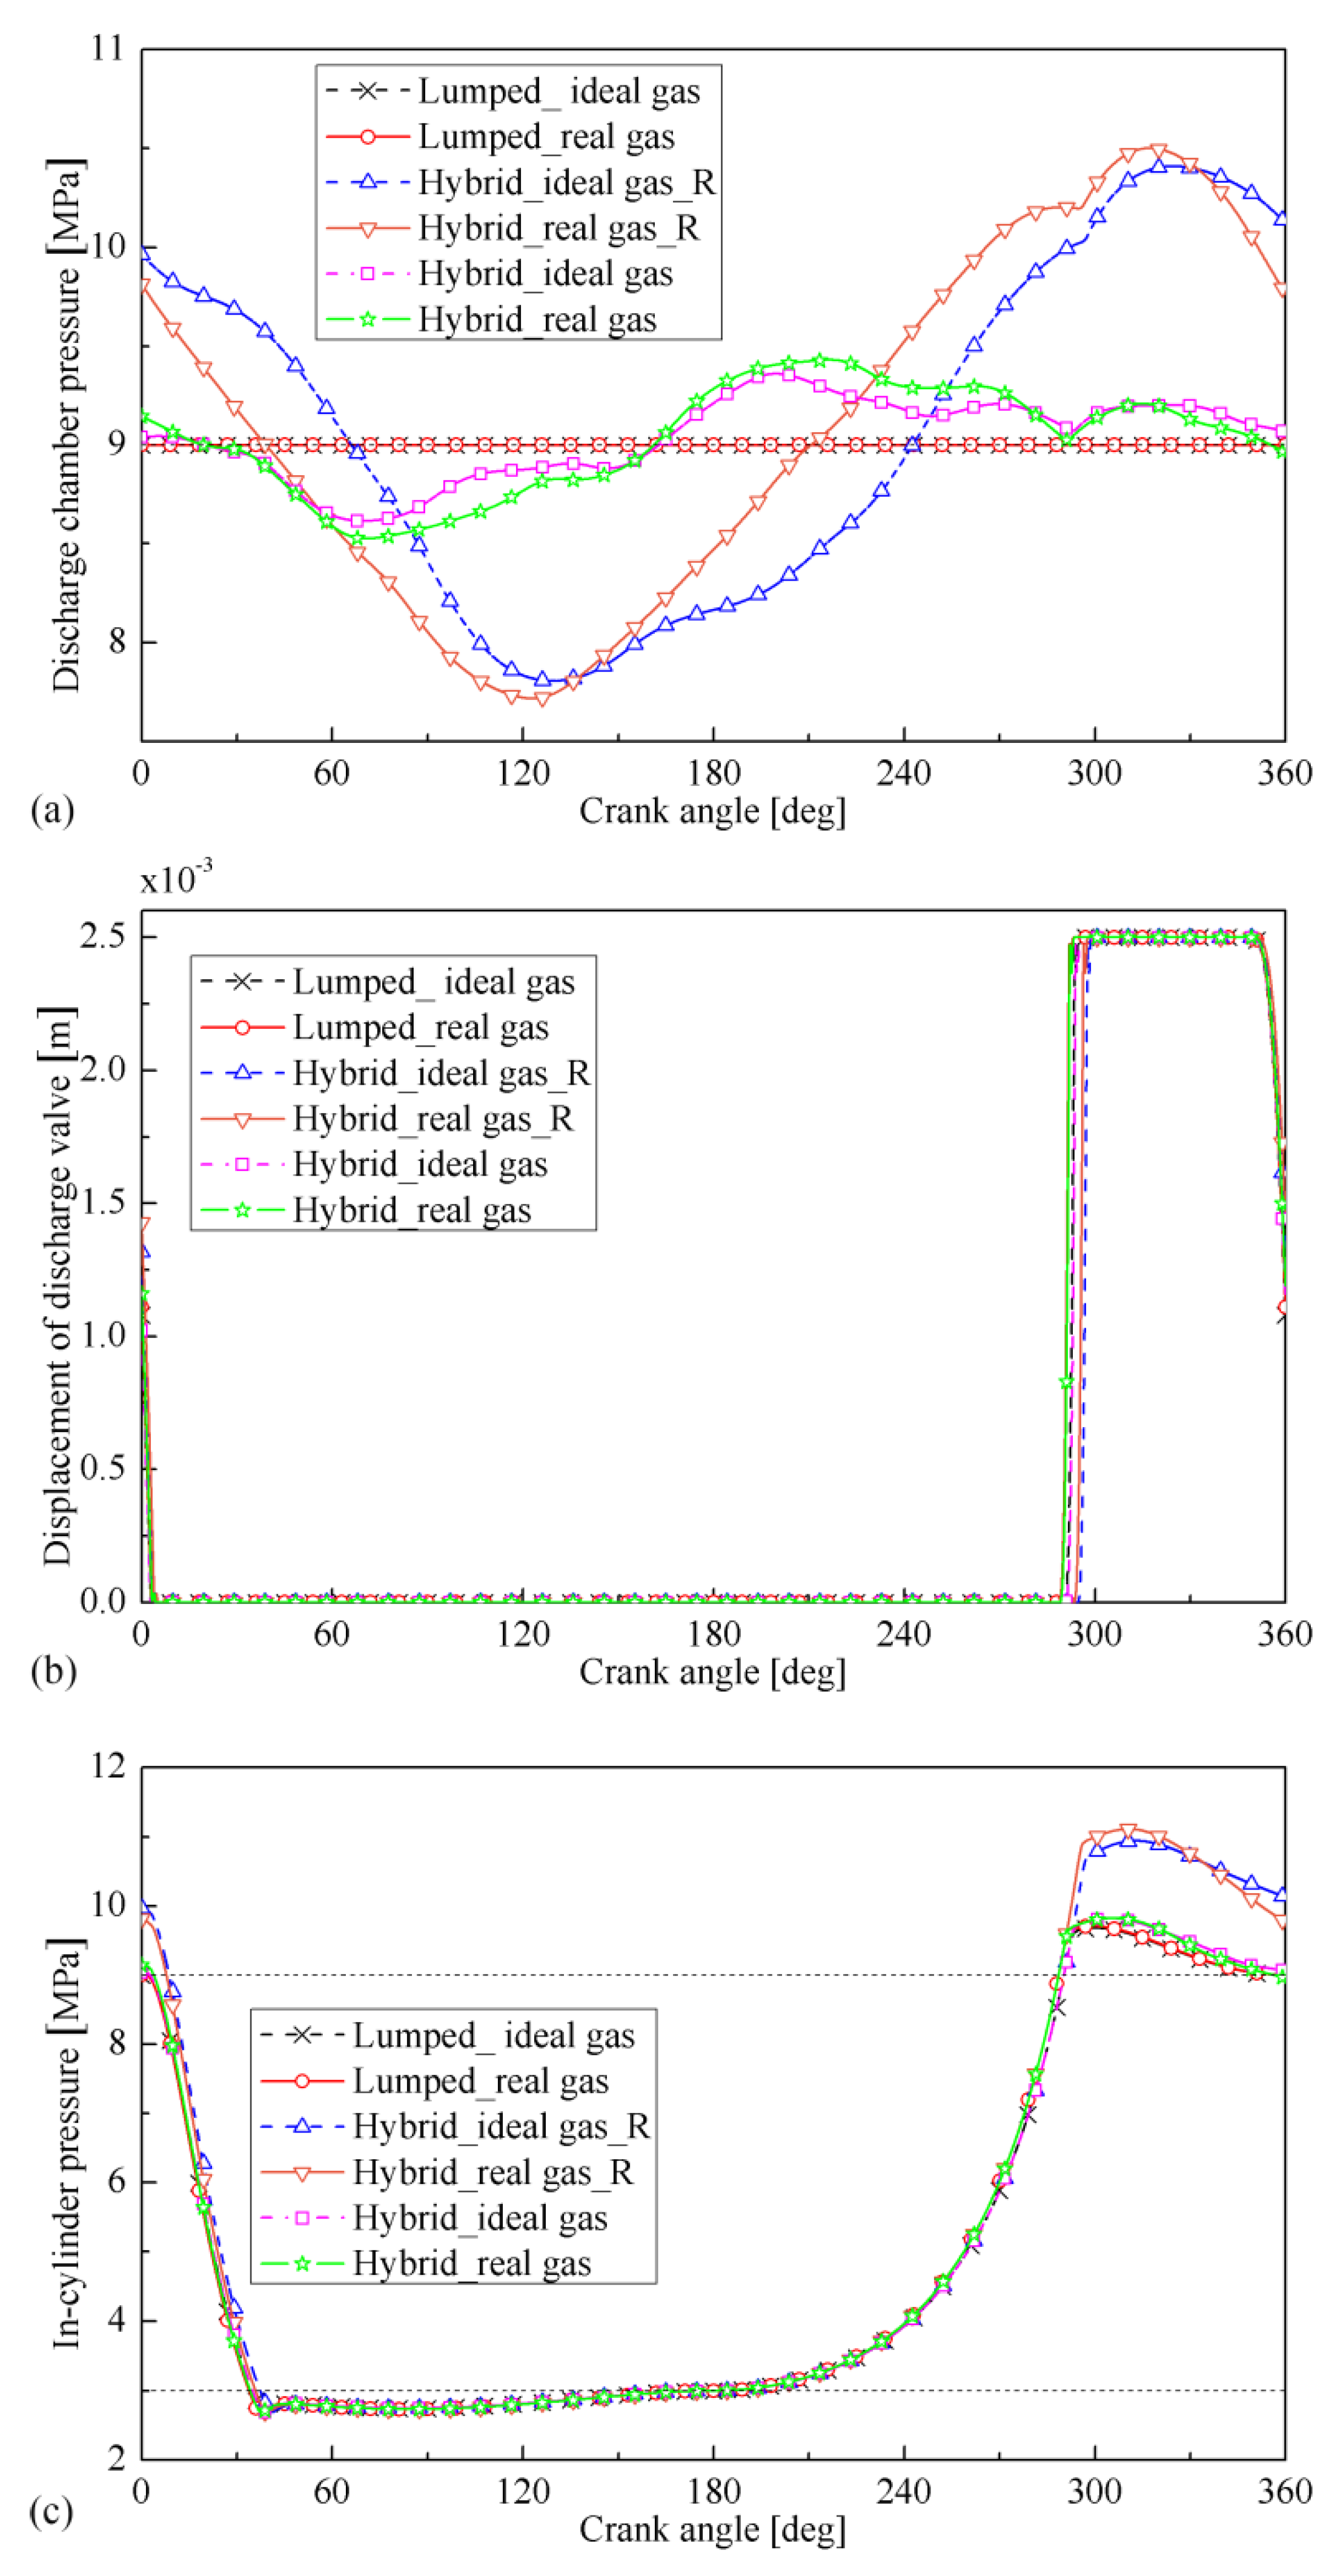
4.2. Discharge Pressure Pulsation Influence on Compressor Operation for Ideal and Real Gas Models
In this section the effects of discharge pressure pulsation on compressor operation with ideal and real gas models are examined. The investigated discharge system is adjusted in three cases of no piping configurations, a 2.755 m long discharge pipe and a 3.816 m long discharge pipe for about 1st harmonic resonance. For each case, the suction system is set to no piping configurations with constant pressure boundaries.
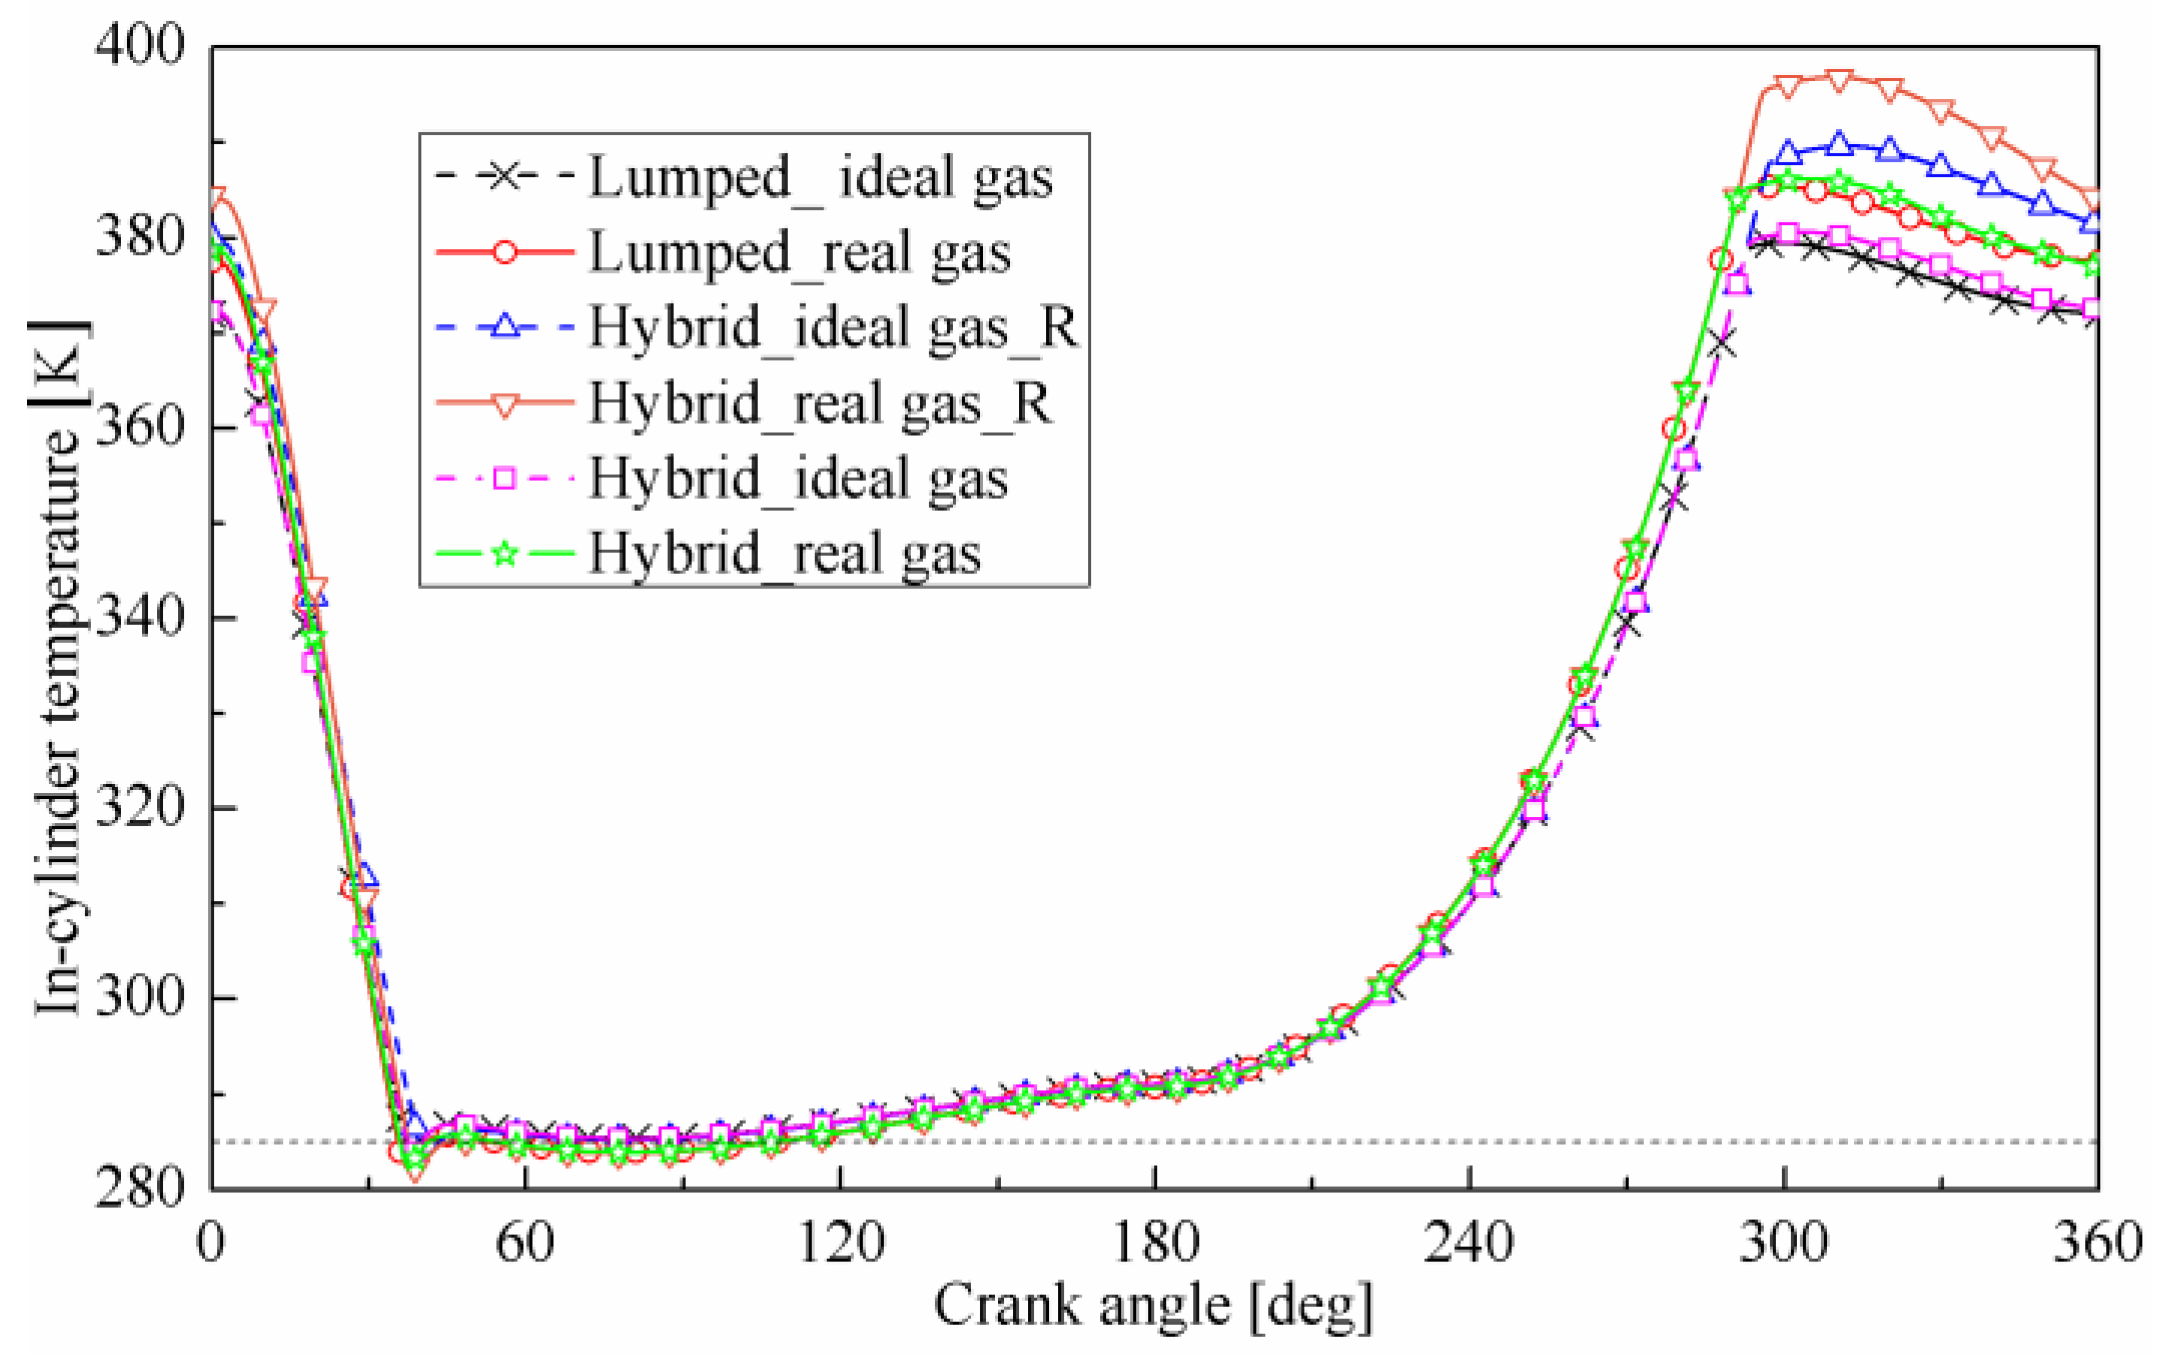
Figure 9 presents the variation of (a) discharge chamber pressure, (b) displacement of discharge valve and (c) in-cylinder pressure with various discharge configurations for ideal and real gas models. As it is shown, during the discharge phase with increasing pressure in the discharge system at the state of 1st harmonic resonance, there is a delay of approximately 5° in the discharge valve opening because the piston has to move further away from the BDC to increase the in-cylinder pressure to a value above the pressure in the discharge chamber.
Figure 10 depicts the effects of pressure pulsations on the dynamic in-cylinder temperature for real and ideal gas models under different discharge configurations. Similar to the above explanation, greater compression will increase the in-cylinder maximum gas temperature. For instance, for the real gas model there is an 11.5 K increase in the final compression temperature inside the cylinder, from 385.4 K for the compressor lumped configuration to 396.9 K for the configuration with 1st harmonic resonance in the discharge system.
Figure 11 shows the comparison of (a) compressor mass flow rate and (b) indicates power with different discharge configurations for ideal and real gas models. As it is seen, gas pulsations in the discharge system can also affect the compressor mass flow rate because the gas pressure and temperature and the residual volume at the end of discharge portion influence the cycle expansion phase. With the resonance state in the discharge system, there is a considerable increase in the consumed power for compressing the in-cylinder working fluid.
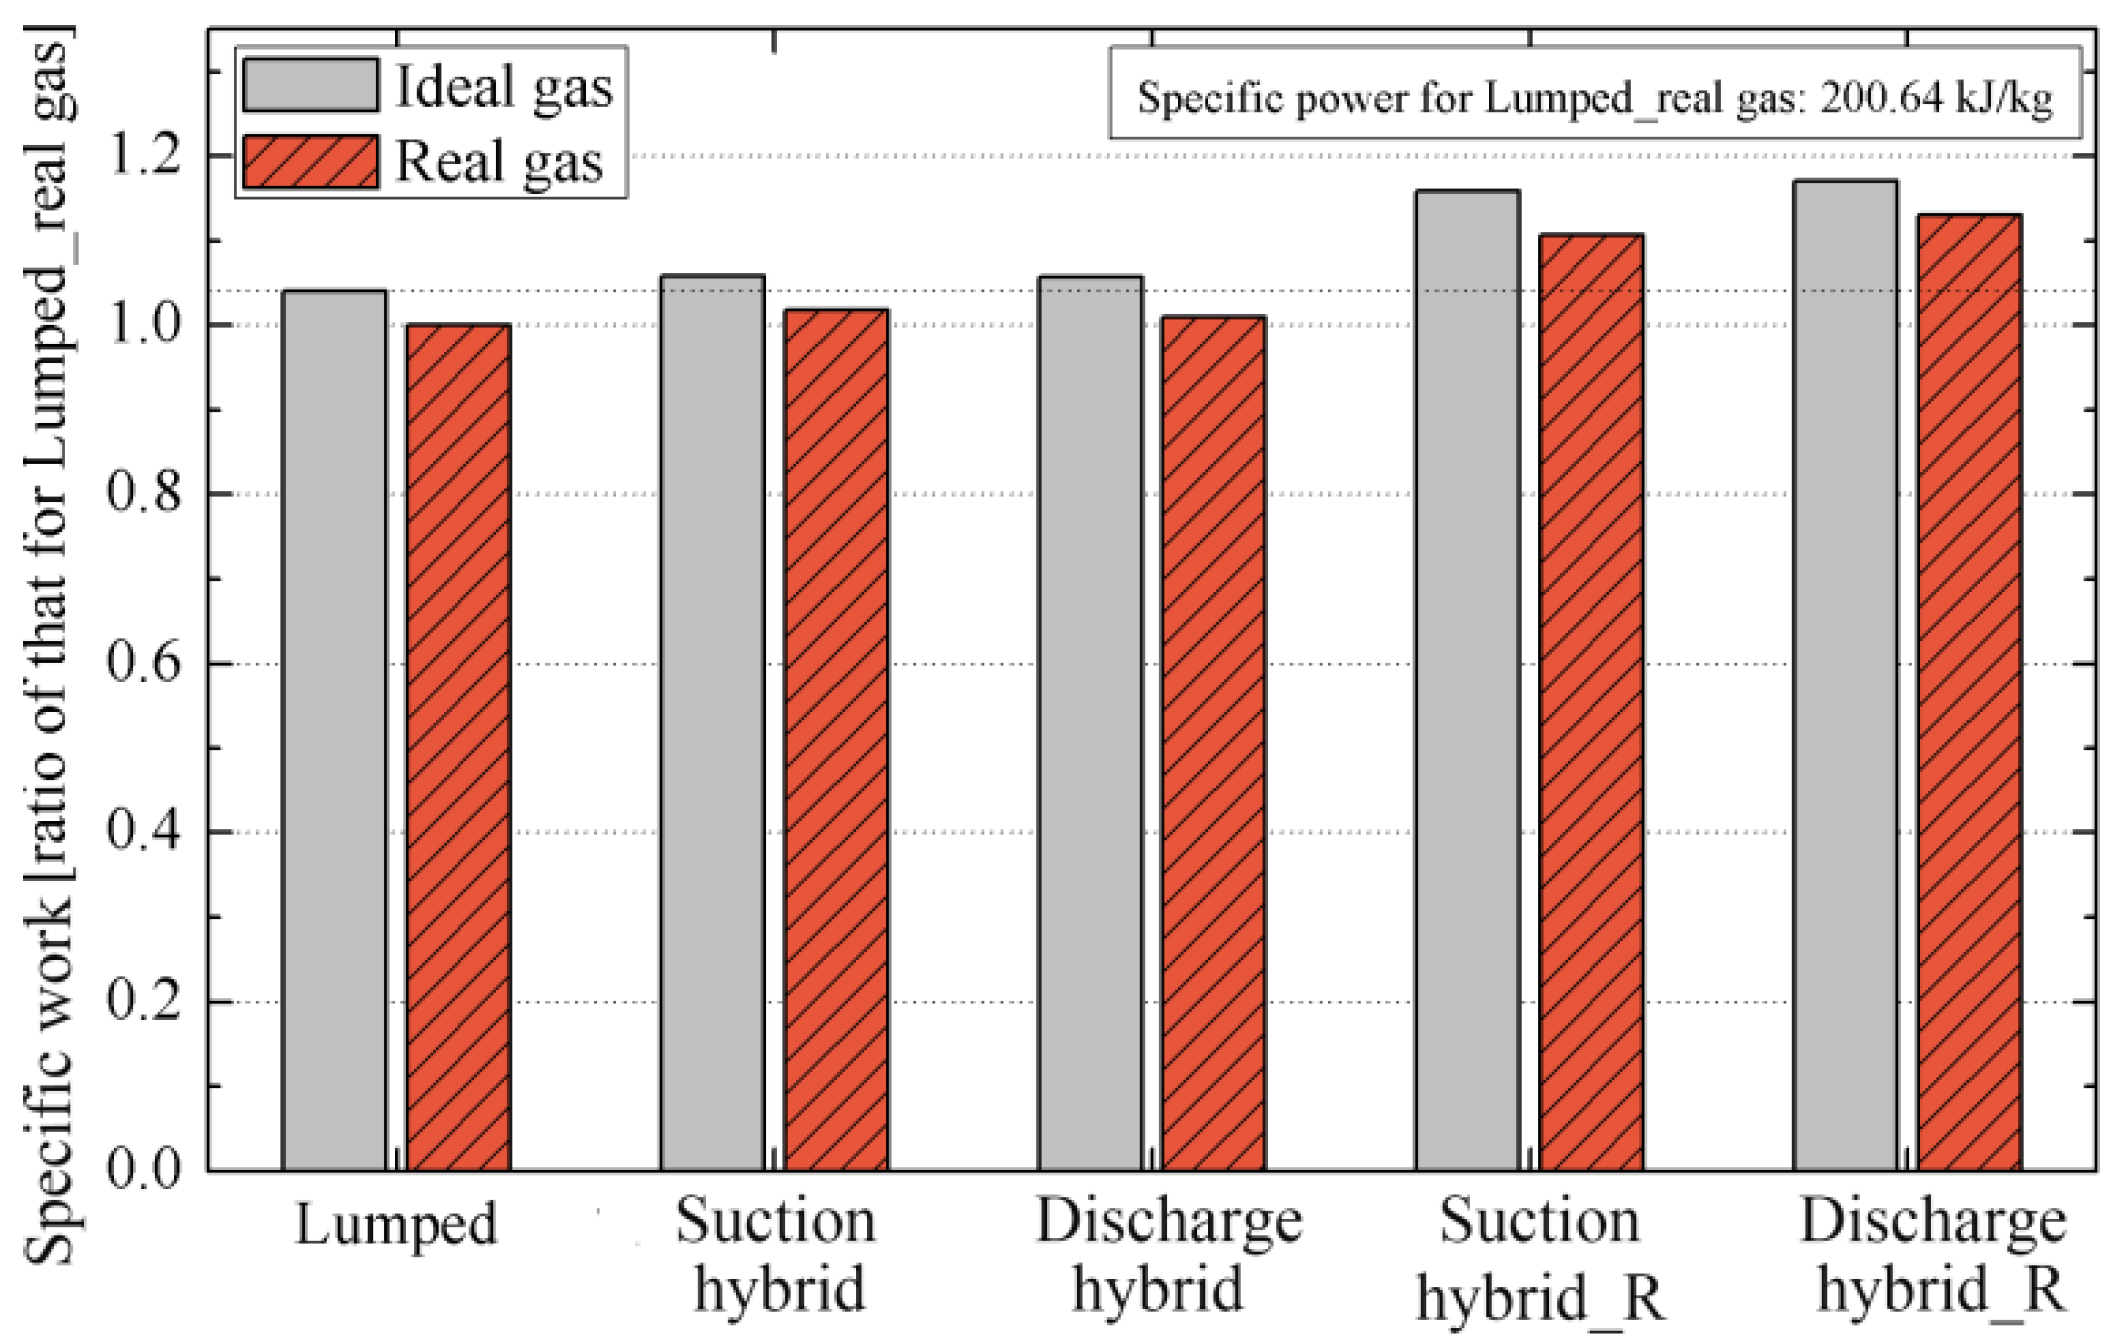
4.3. Comparison of Suction and Discharge Pressure Pulsation Influence
Figure 12 shows the comparison of suction and discharge pressure pulsation influence on specific work for ideal and real gas models. As can be seen, results illustrate that pressure pulsations with small amplitude in the suction or discharge system have a slight effect on specific work in both gas models, with a increment about 1~2%. However, the specific work will increase significantly as the suction or discharge system is located in the 1st order resonance state. Furthermore, discharge resonance increases work to compress one cycle working gas than that needed by suction resonance, with the ratio of 13% and 10.7% for the real gas model. In
Figure 8 and
Figure 11 the indicated power in the real gas model is slightly higher than that in the ideal gas model, and the specific work for the real gas model is less than that for the ideal gas model.
4.4. Effects of Harmonic Response on Compressor Operation for Ideal and Real Gas Models
In this section the effects of harmonic response on compressor mass flow rate, indicated power and specific work are examined for both ideal and real gas models, as shown in
Figure 13. The first four order harmonic responses are carefully selected for analysis since most of the energy in the compressor is usually associated with the first few harmonics. These key compressor harmonics that have strong response are properly tuned by altering the length of the pipe in this work. Also, the acoustic responses of suction system are separated from those belonging to the discharge system. The base compressor is the one without pressure pulsations in the suction and discharge systems.
As can be seen, with the first harmonic response in the suction system, the compressor mass flow rate is reduced, but the indicated power and specific work required to compress the working fluid increased considerably. As an example, the specific work is augmented by 10.7% for real gas. With transference to the second harmonic with a weaker response compared to the first harmonic, however, the mass flow rate is raised significantly with a so-called supercharging effect but the specific work is increased slightly. For instance, the mass flow rate and specific work increased by 10.2% and 1.6%, respectively, for the real gas. As the response is shifted to harmonics higher than second order, the pressure pulsations will have not much effect on the compressor operation. The mass flow rate and specific work gradually stabilized at a certain value somewhat higher than those for the base compressor. As for the harmonic responses in discharge system, it is generally deduced that both the increase in mass flow rate and reduction of indicated power and specific work versus harmonic order behave in a monotonous pattern. Moreover, although the mass flow rate is changed little by pressure pulsations in harmonic response, the indicated power and specific work increased significantly compared to the base compressor. For instance, the specific work increased by 13% in the first harmonic response for the real gas.


