Lifetime Assessment and Optimization of a Welded A-Type Frame in a Mining Truck Considering Uncertainties of Material Properties and Structural Geometry and Load


Abstract
:1. Introduction
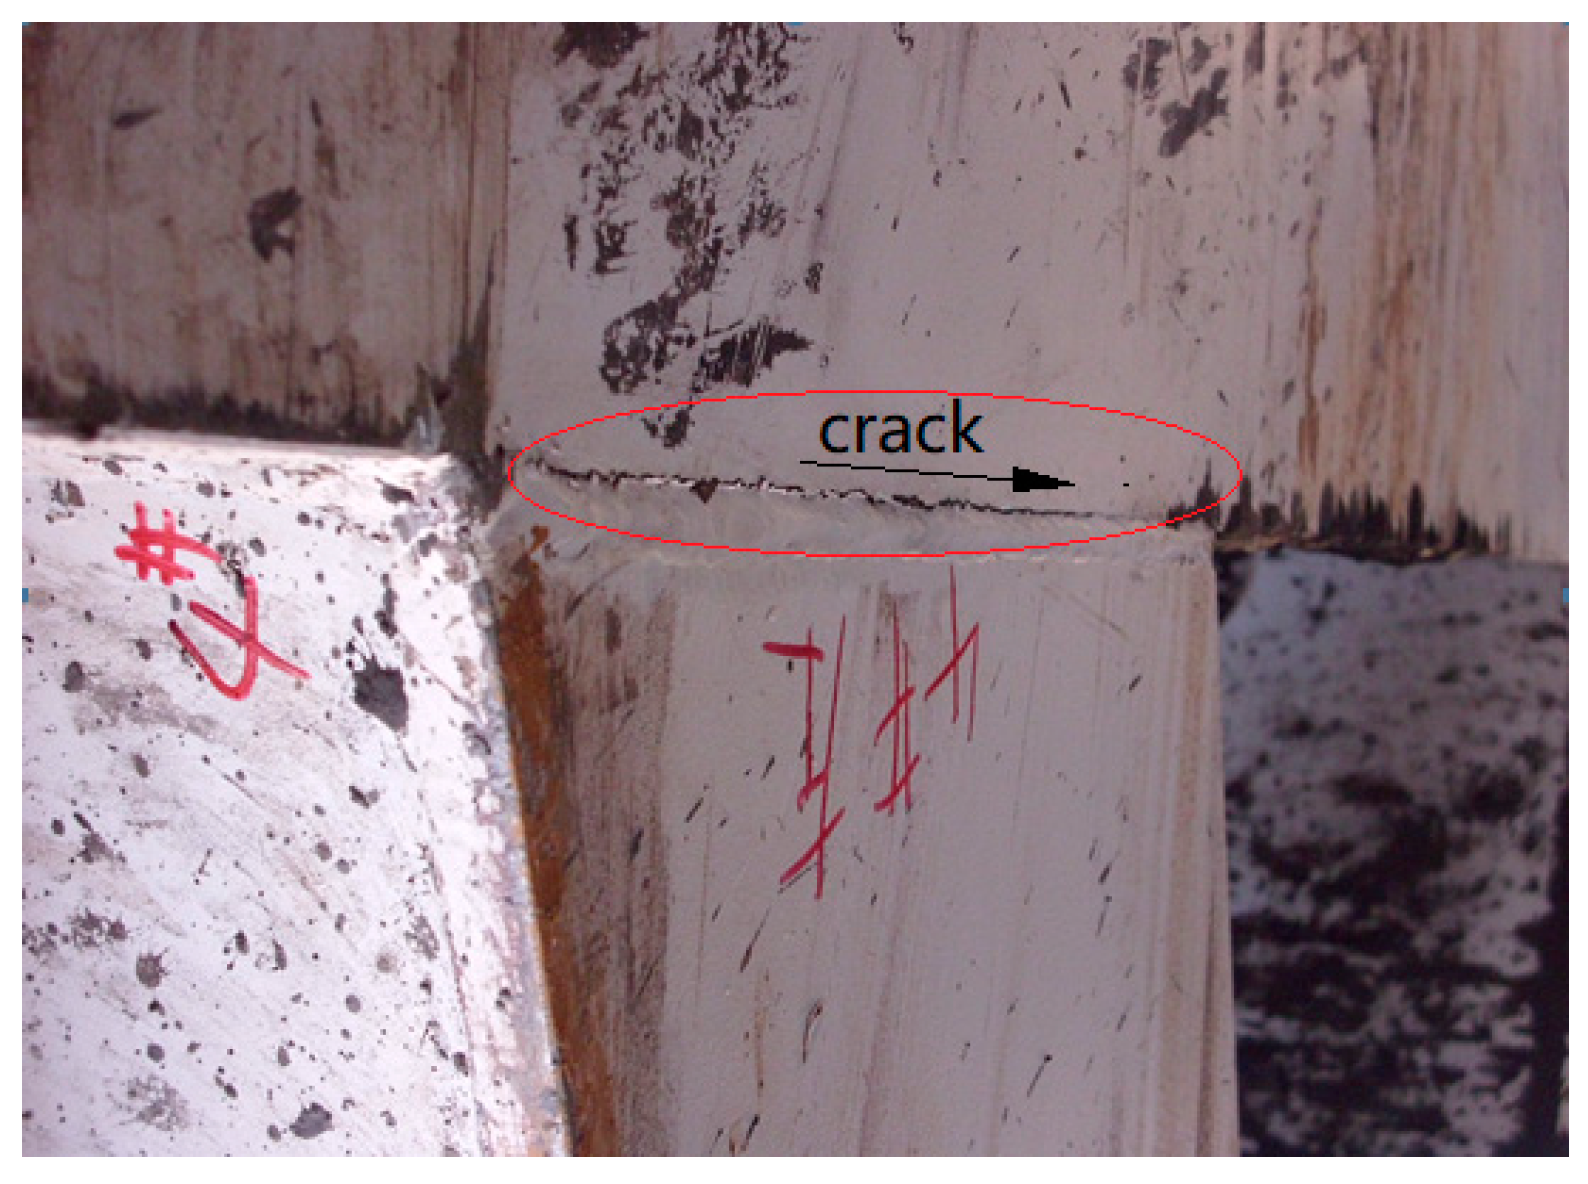
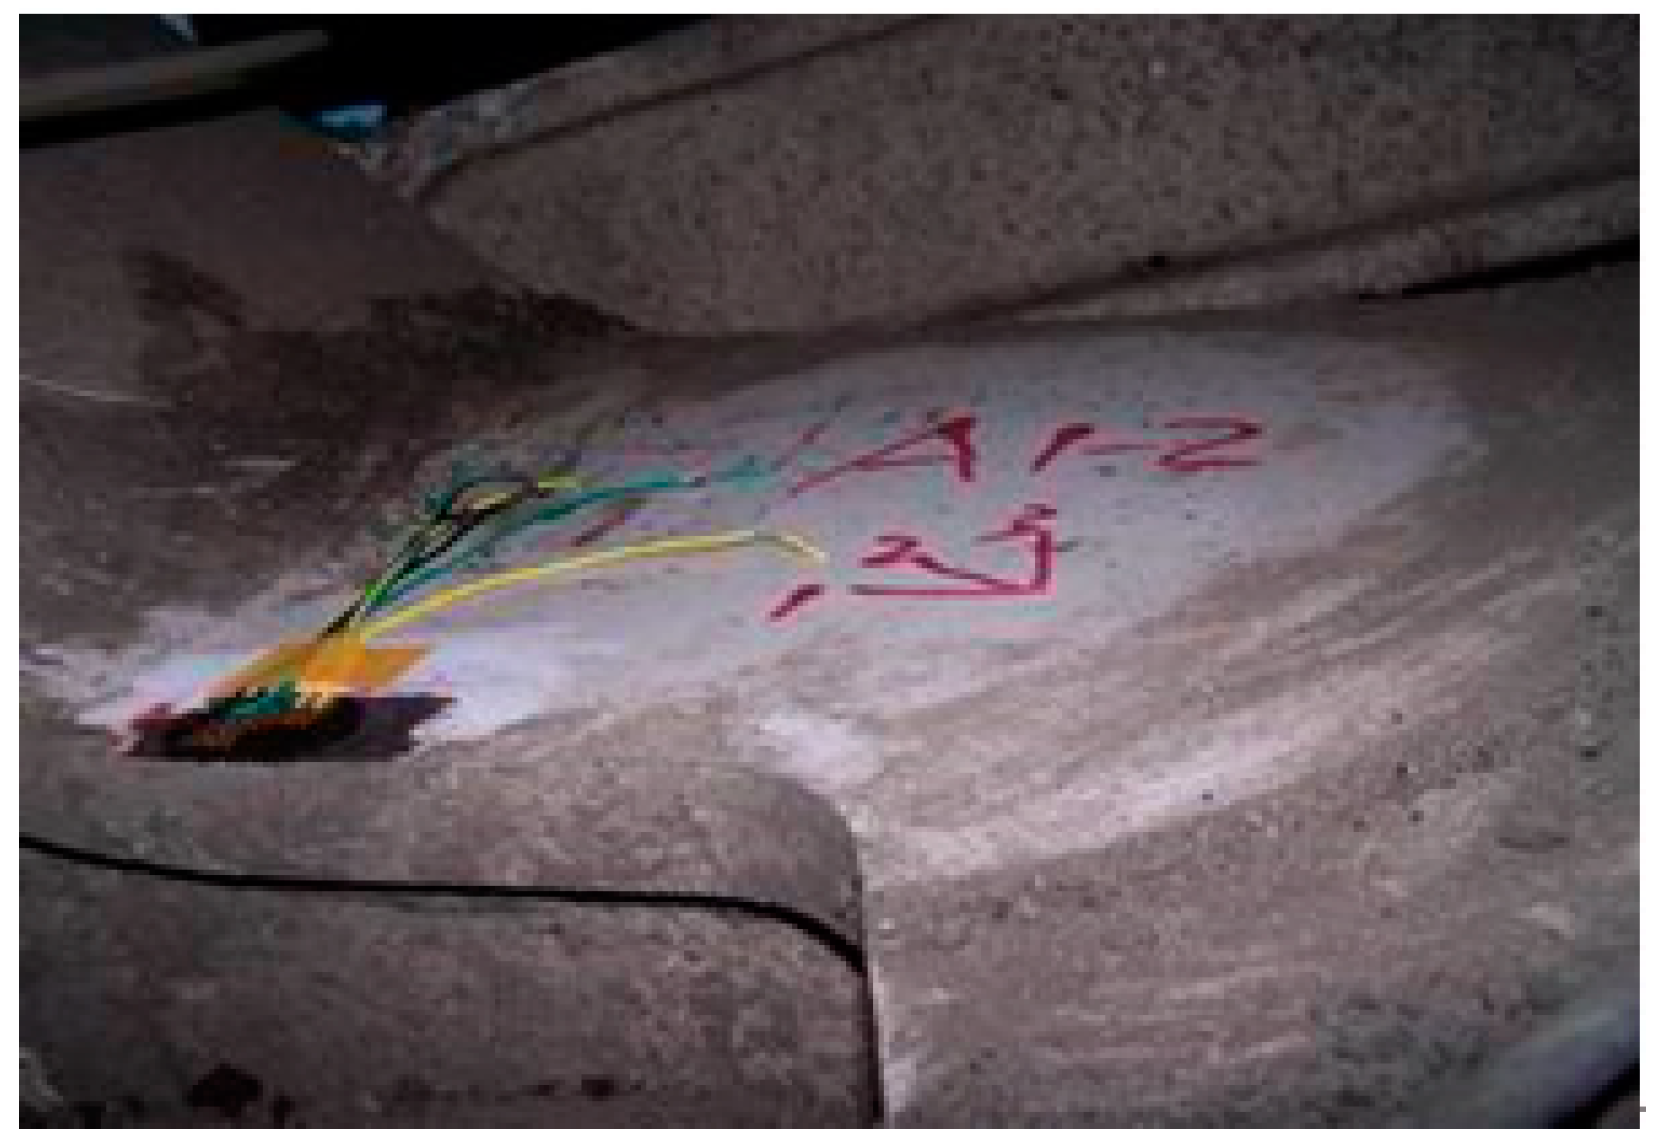
2. Cracks in Local Positions
3. Experimental Work
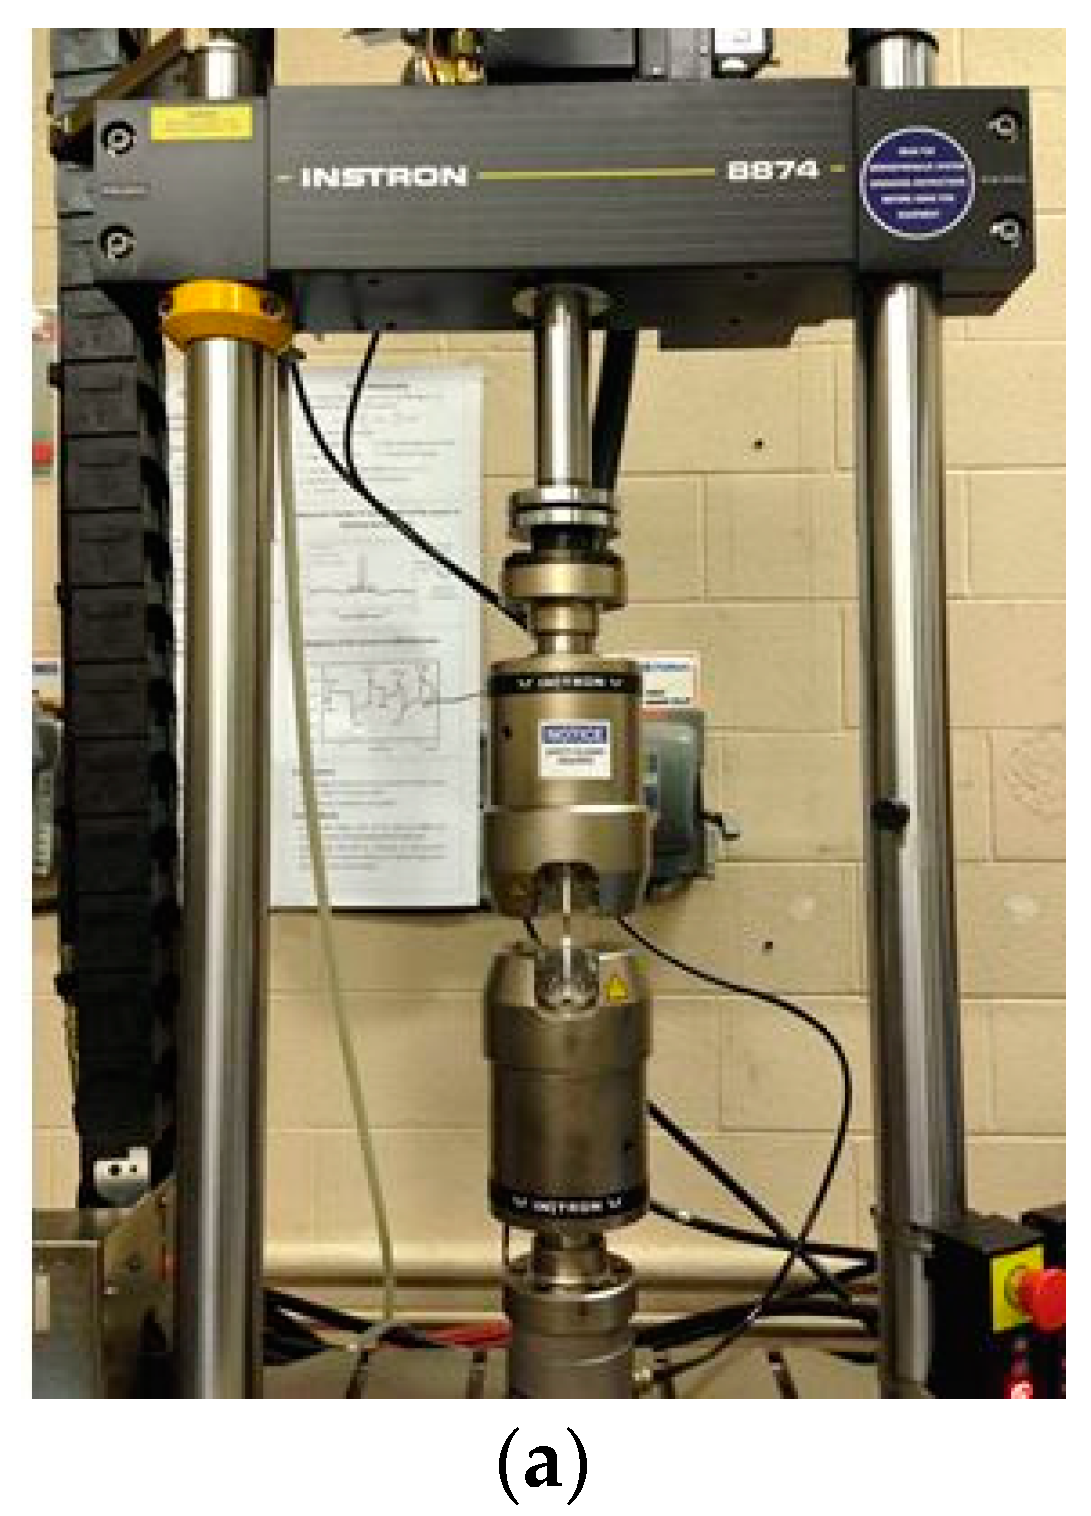
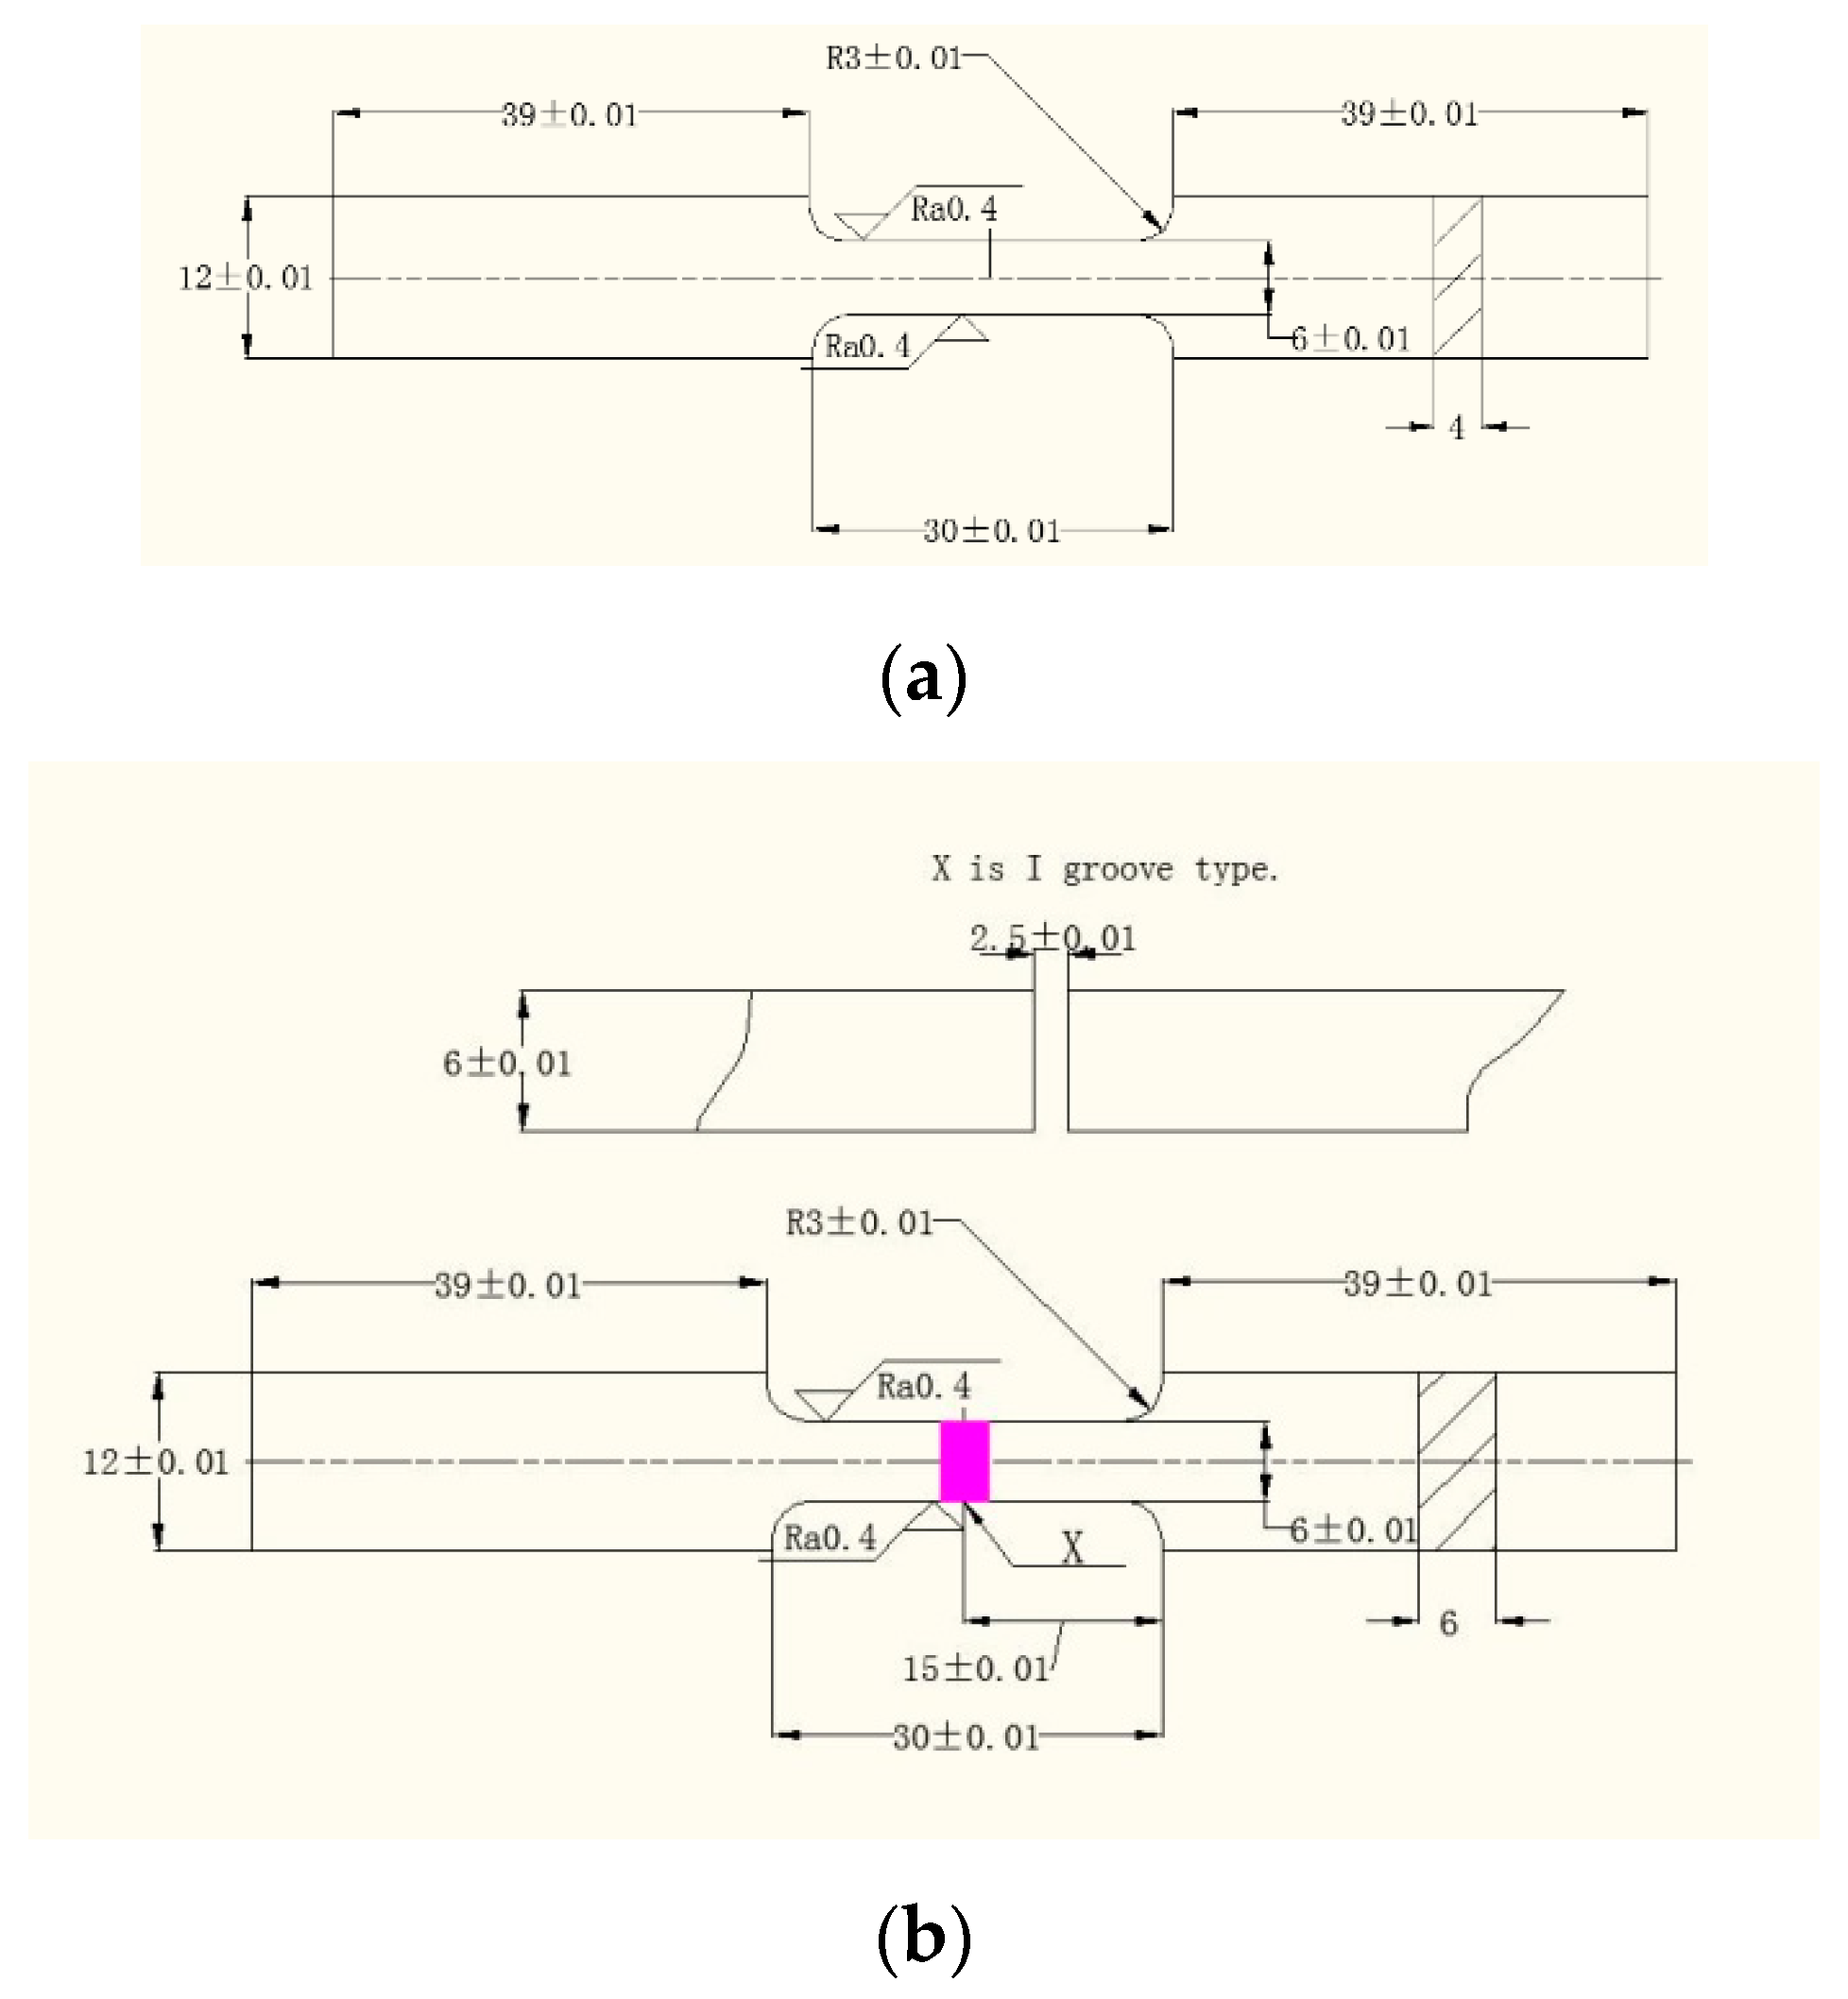
3.1. Specimen and Elements
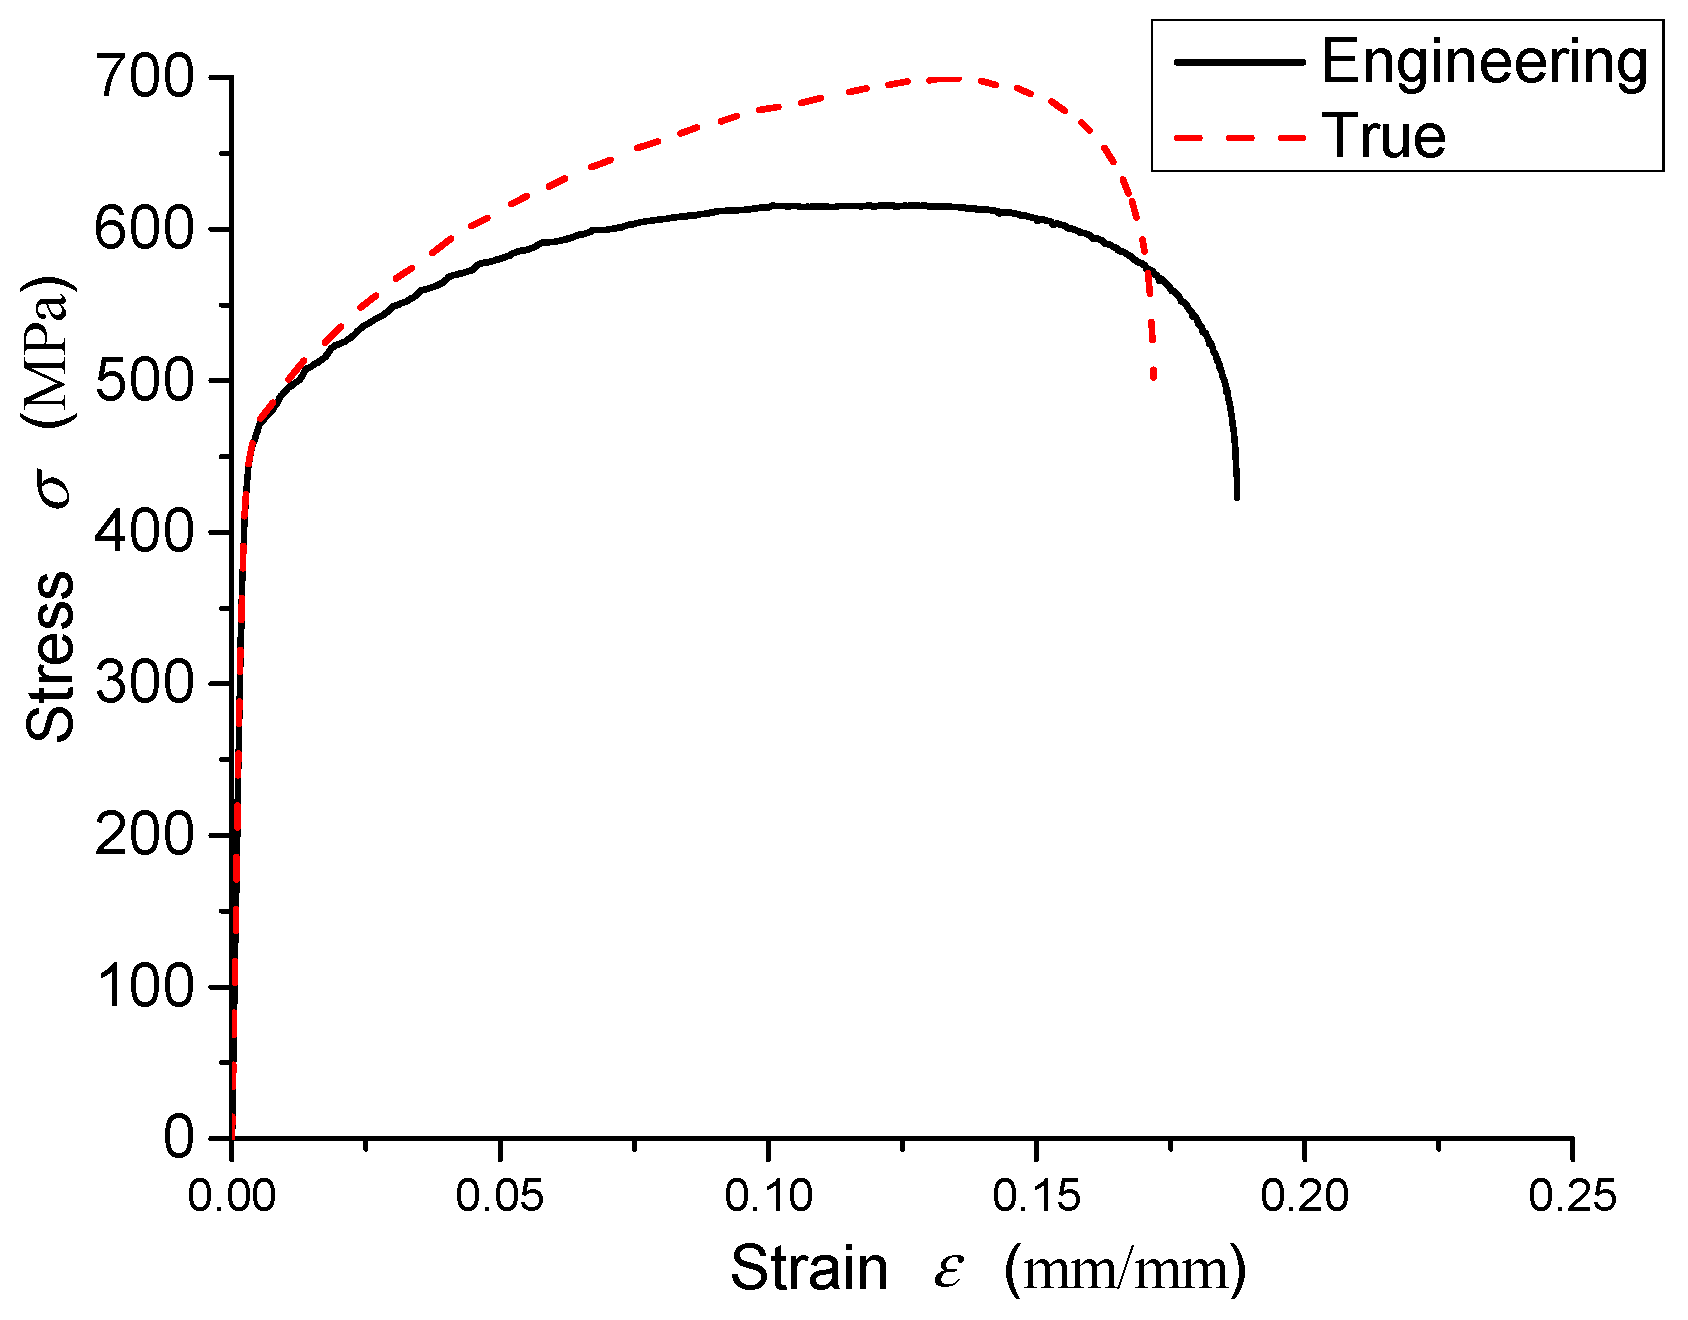
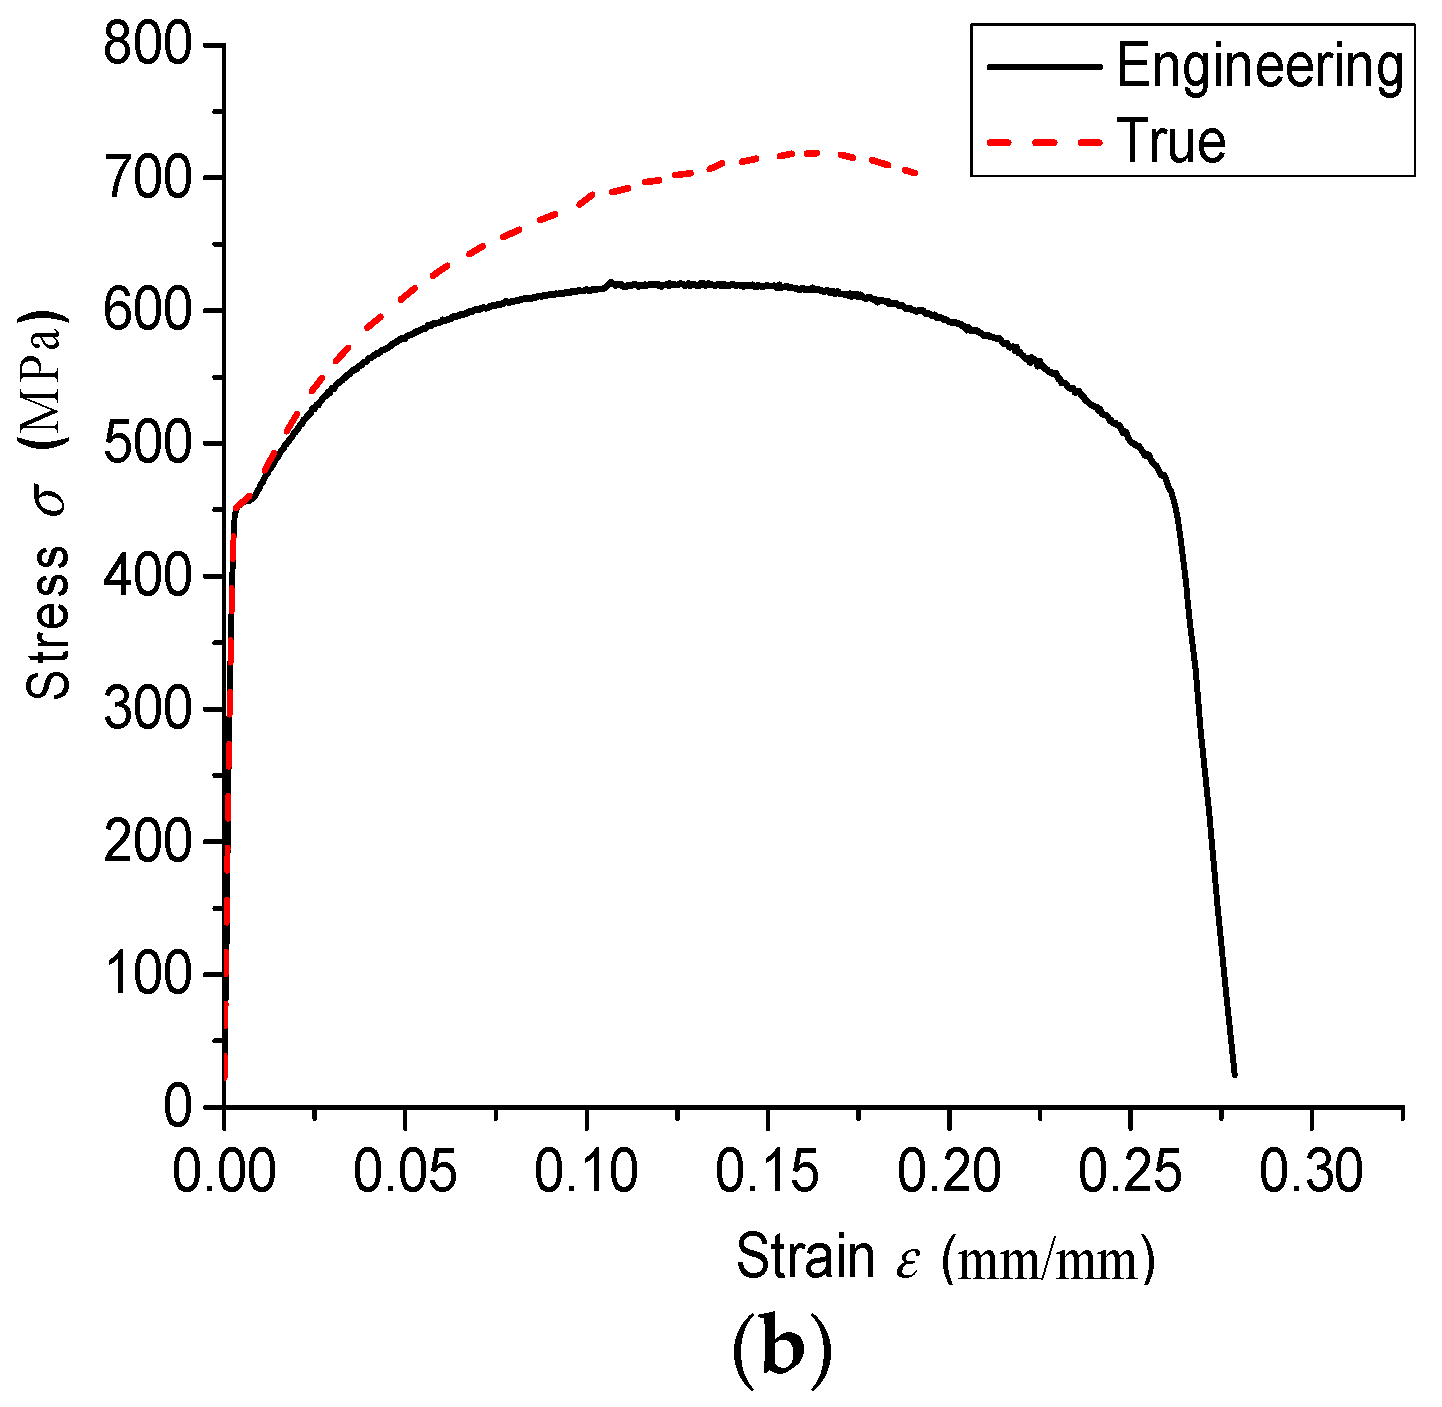
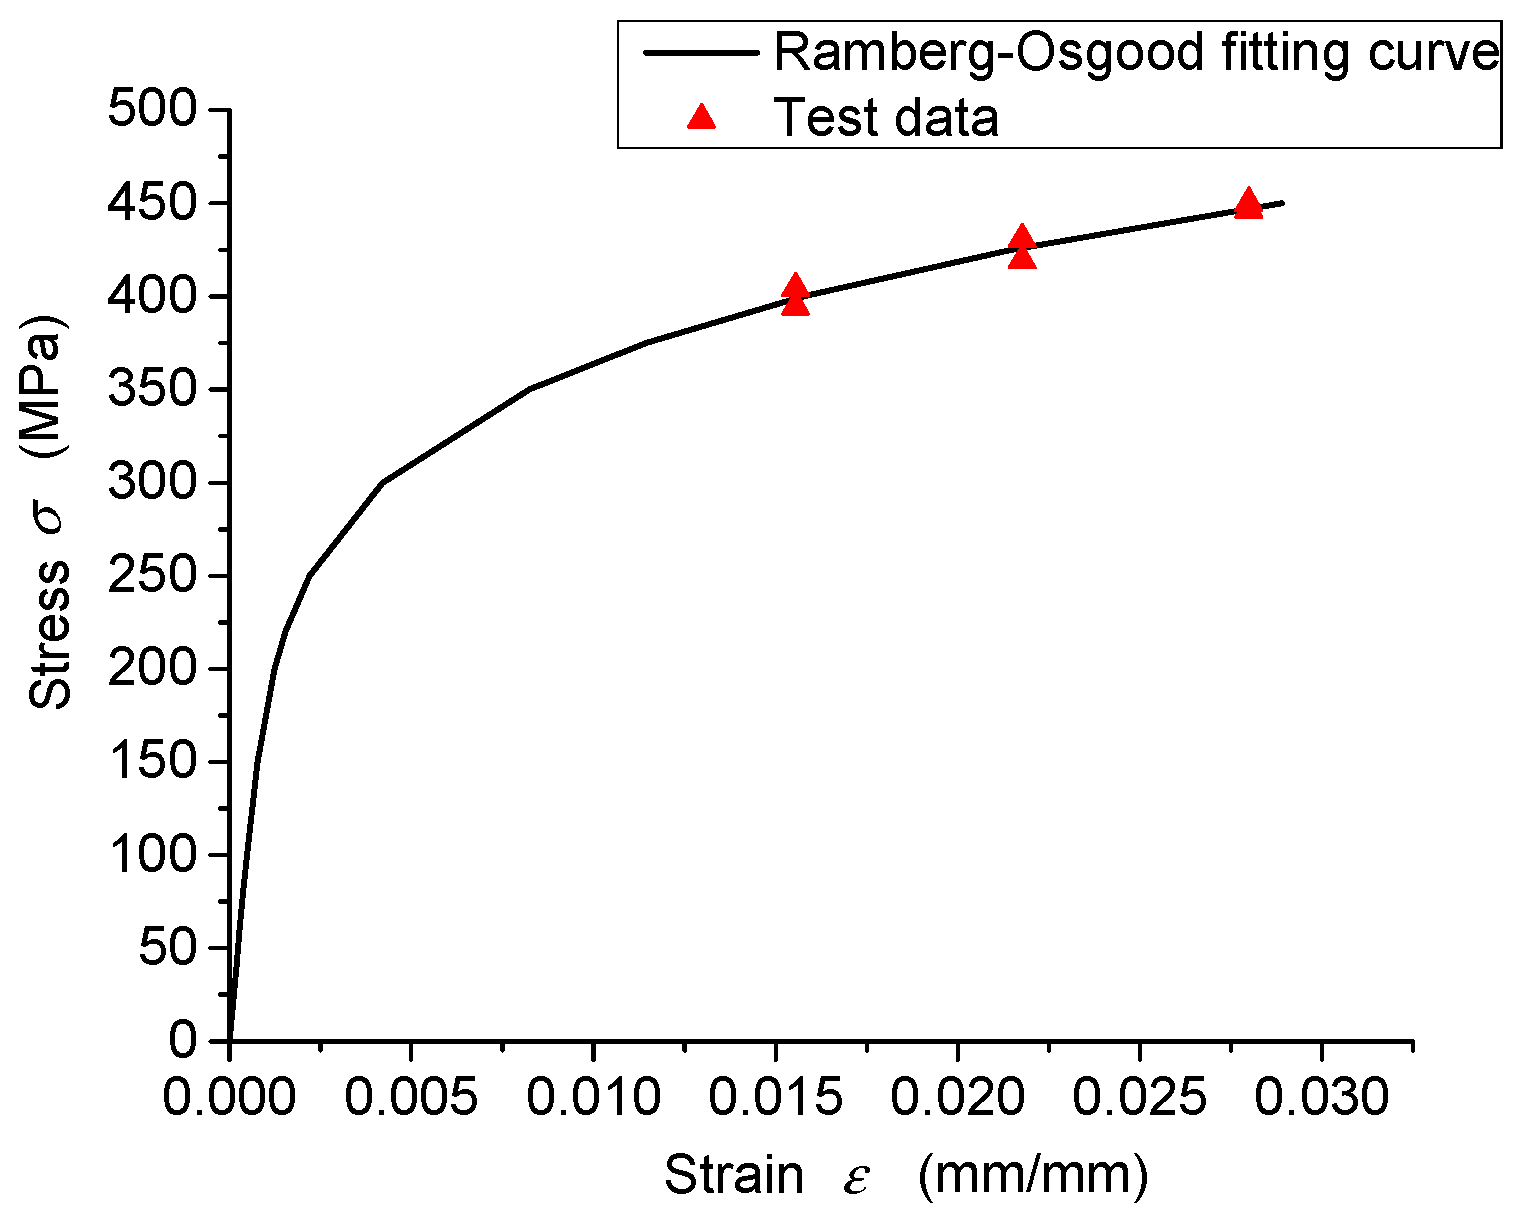
3.2. Mechanical Properties
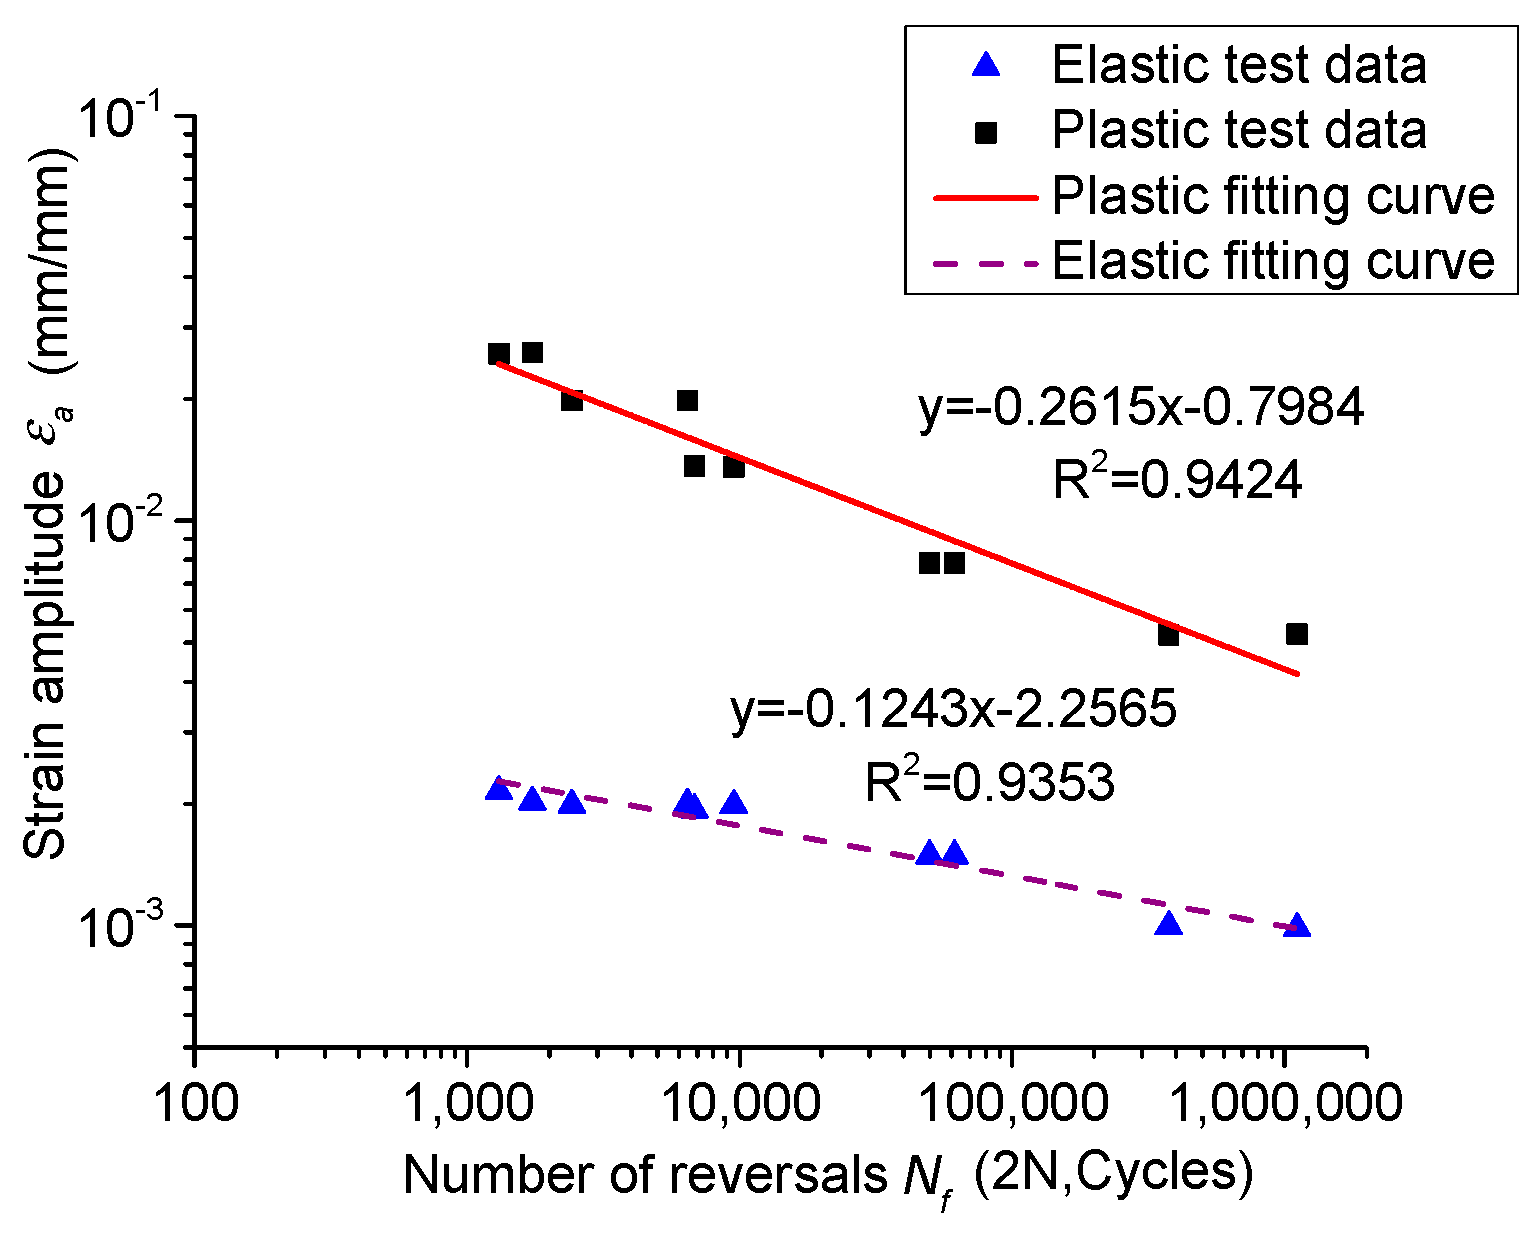
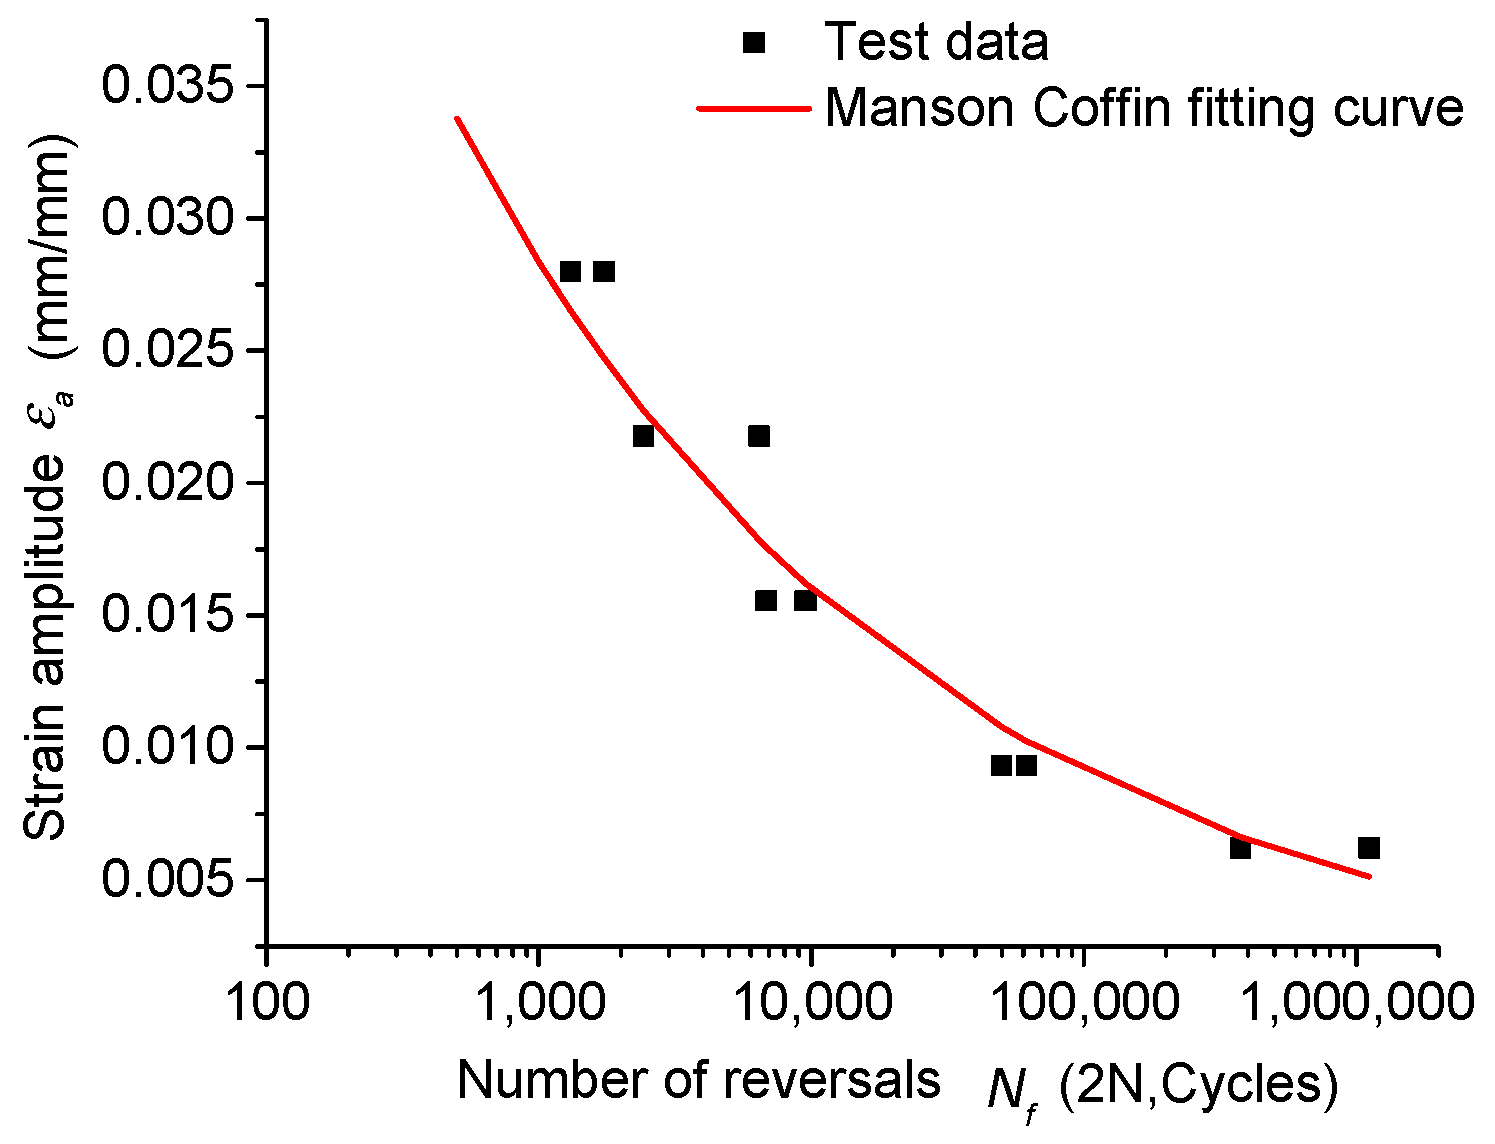
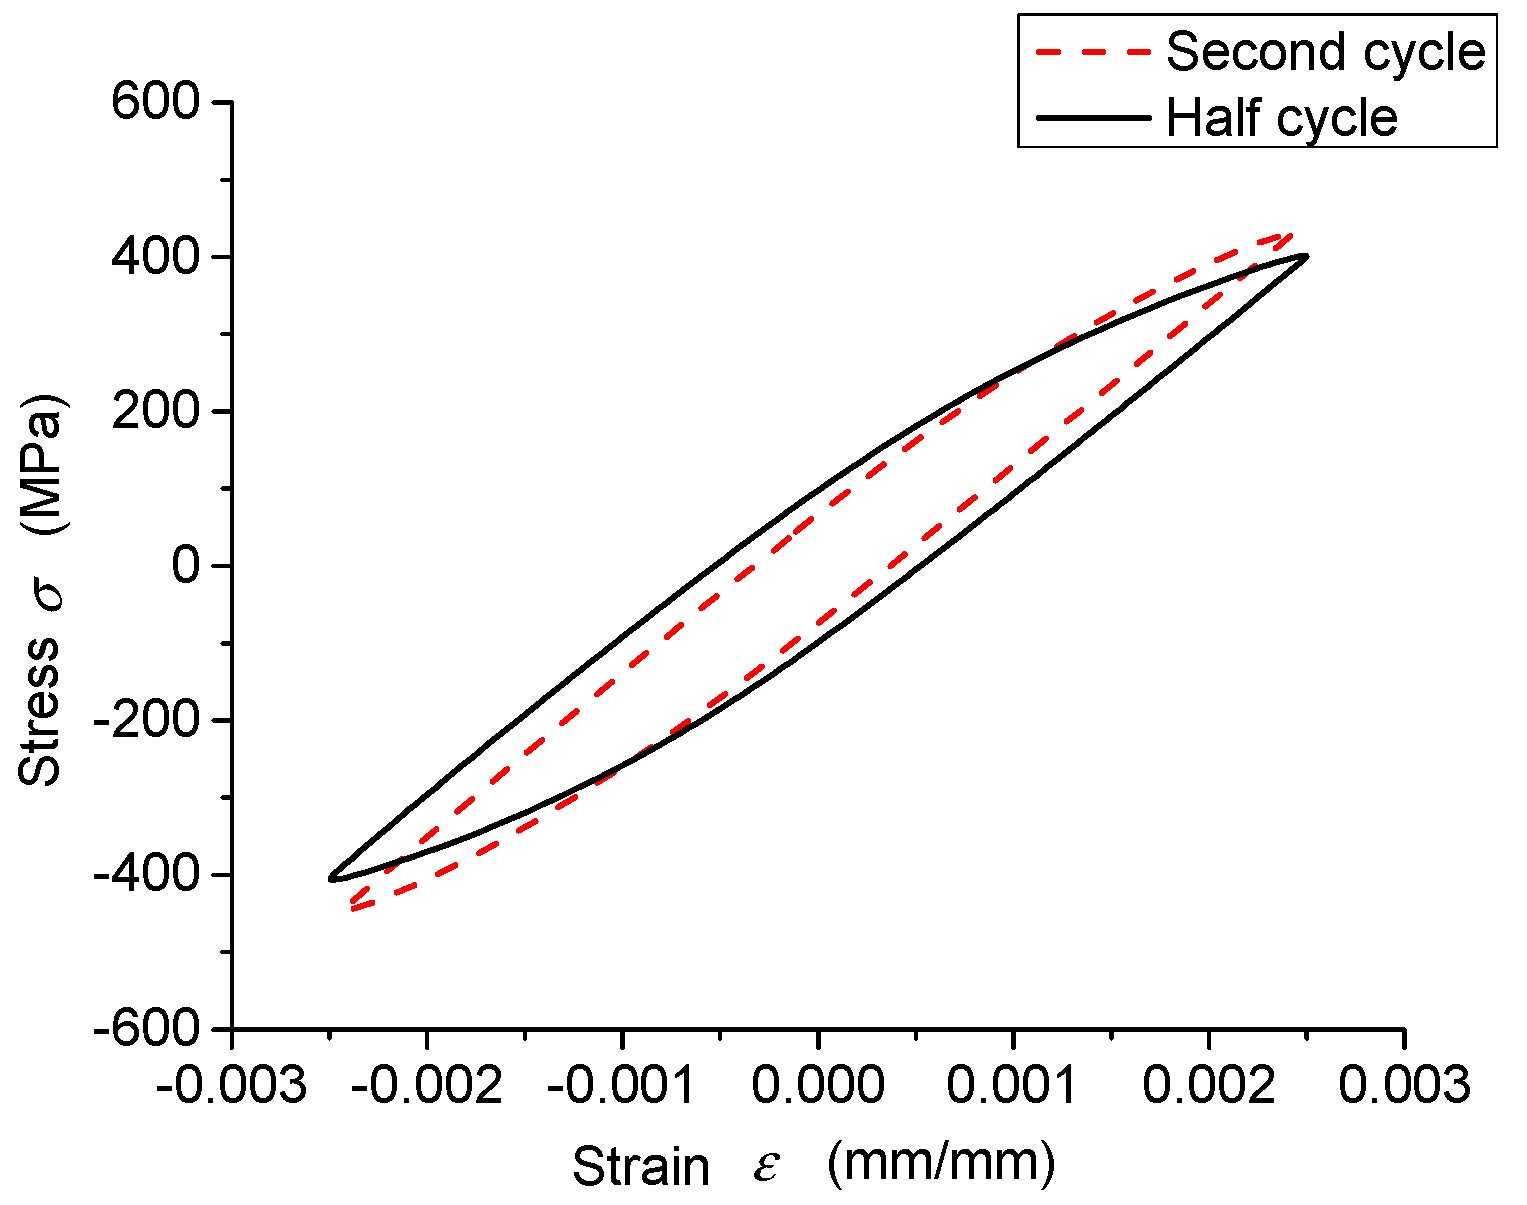
3.3. Cyclic Properties of a Welded Joint
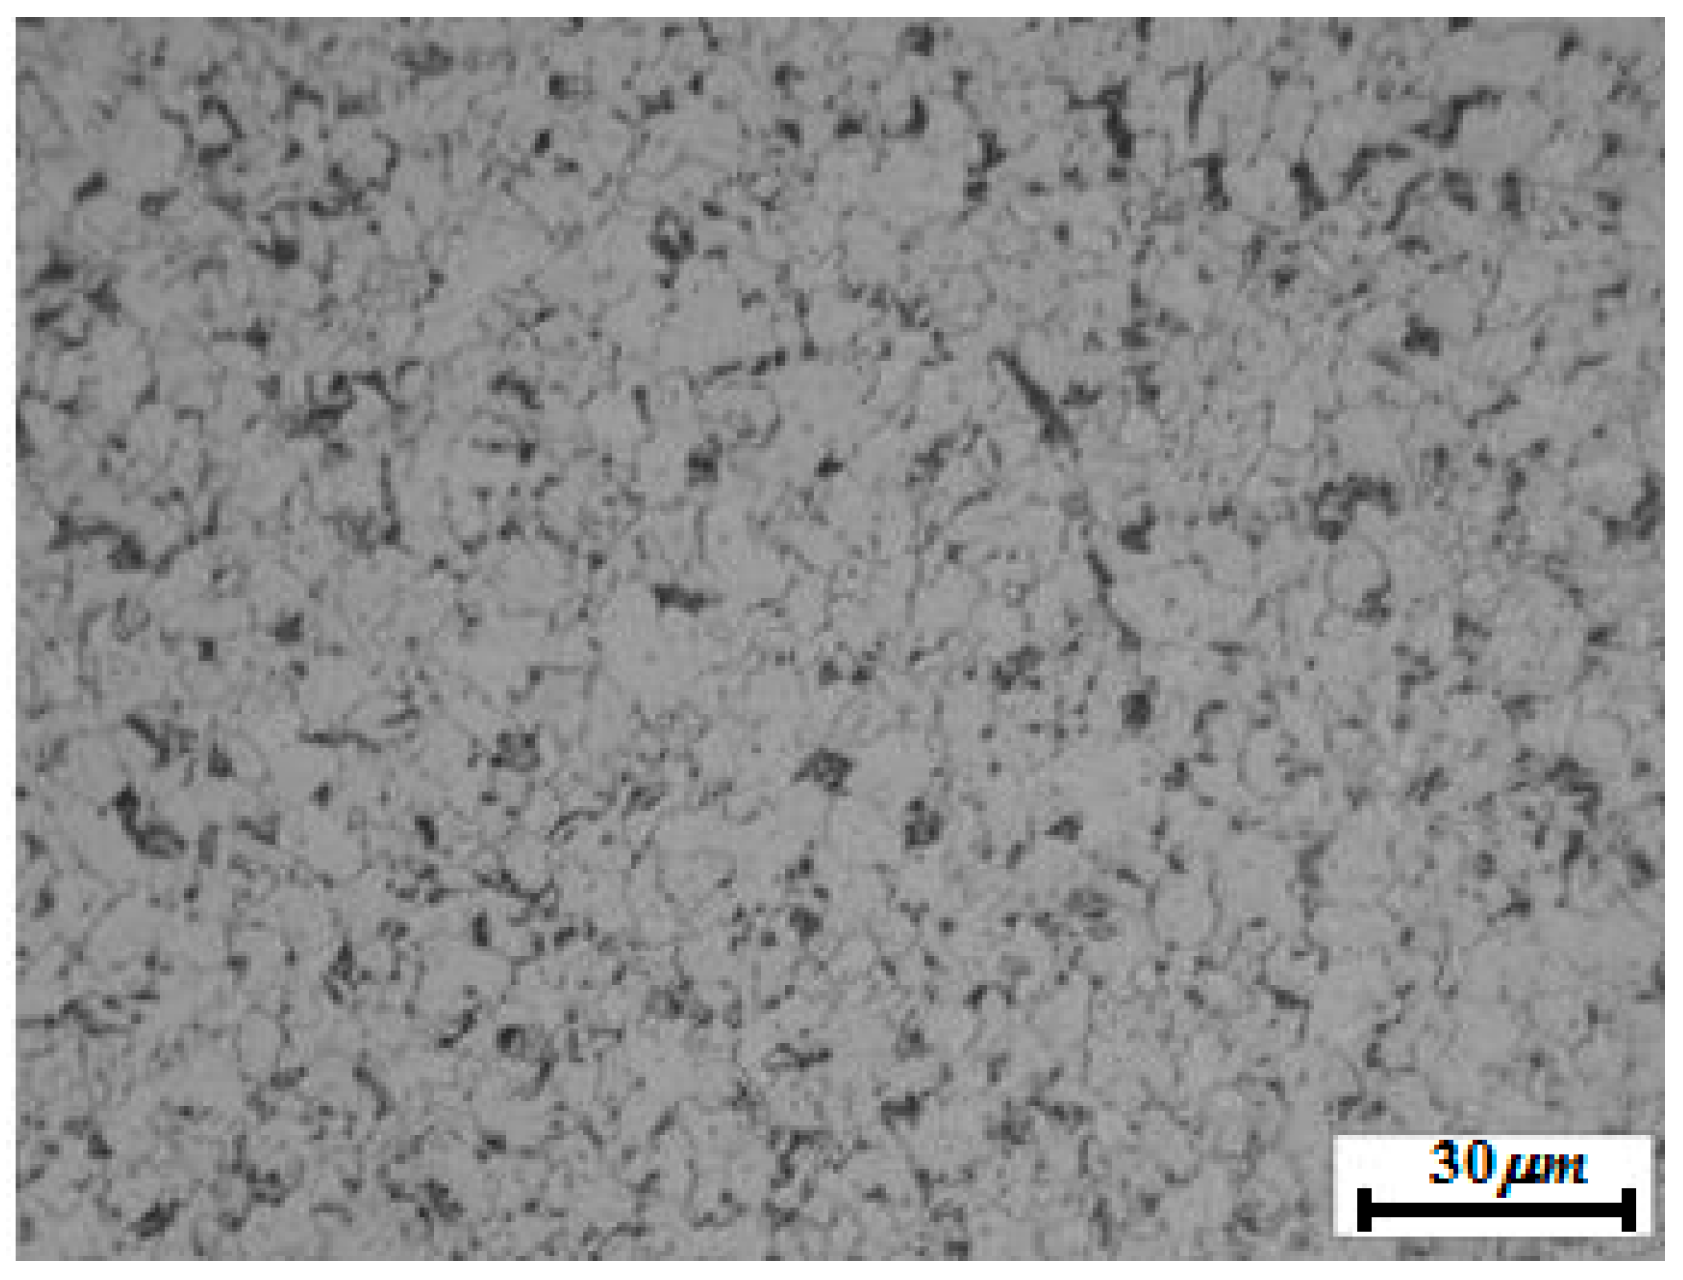
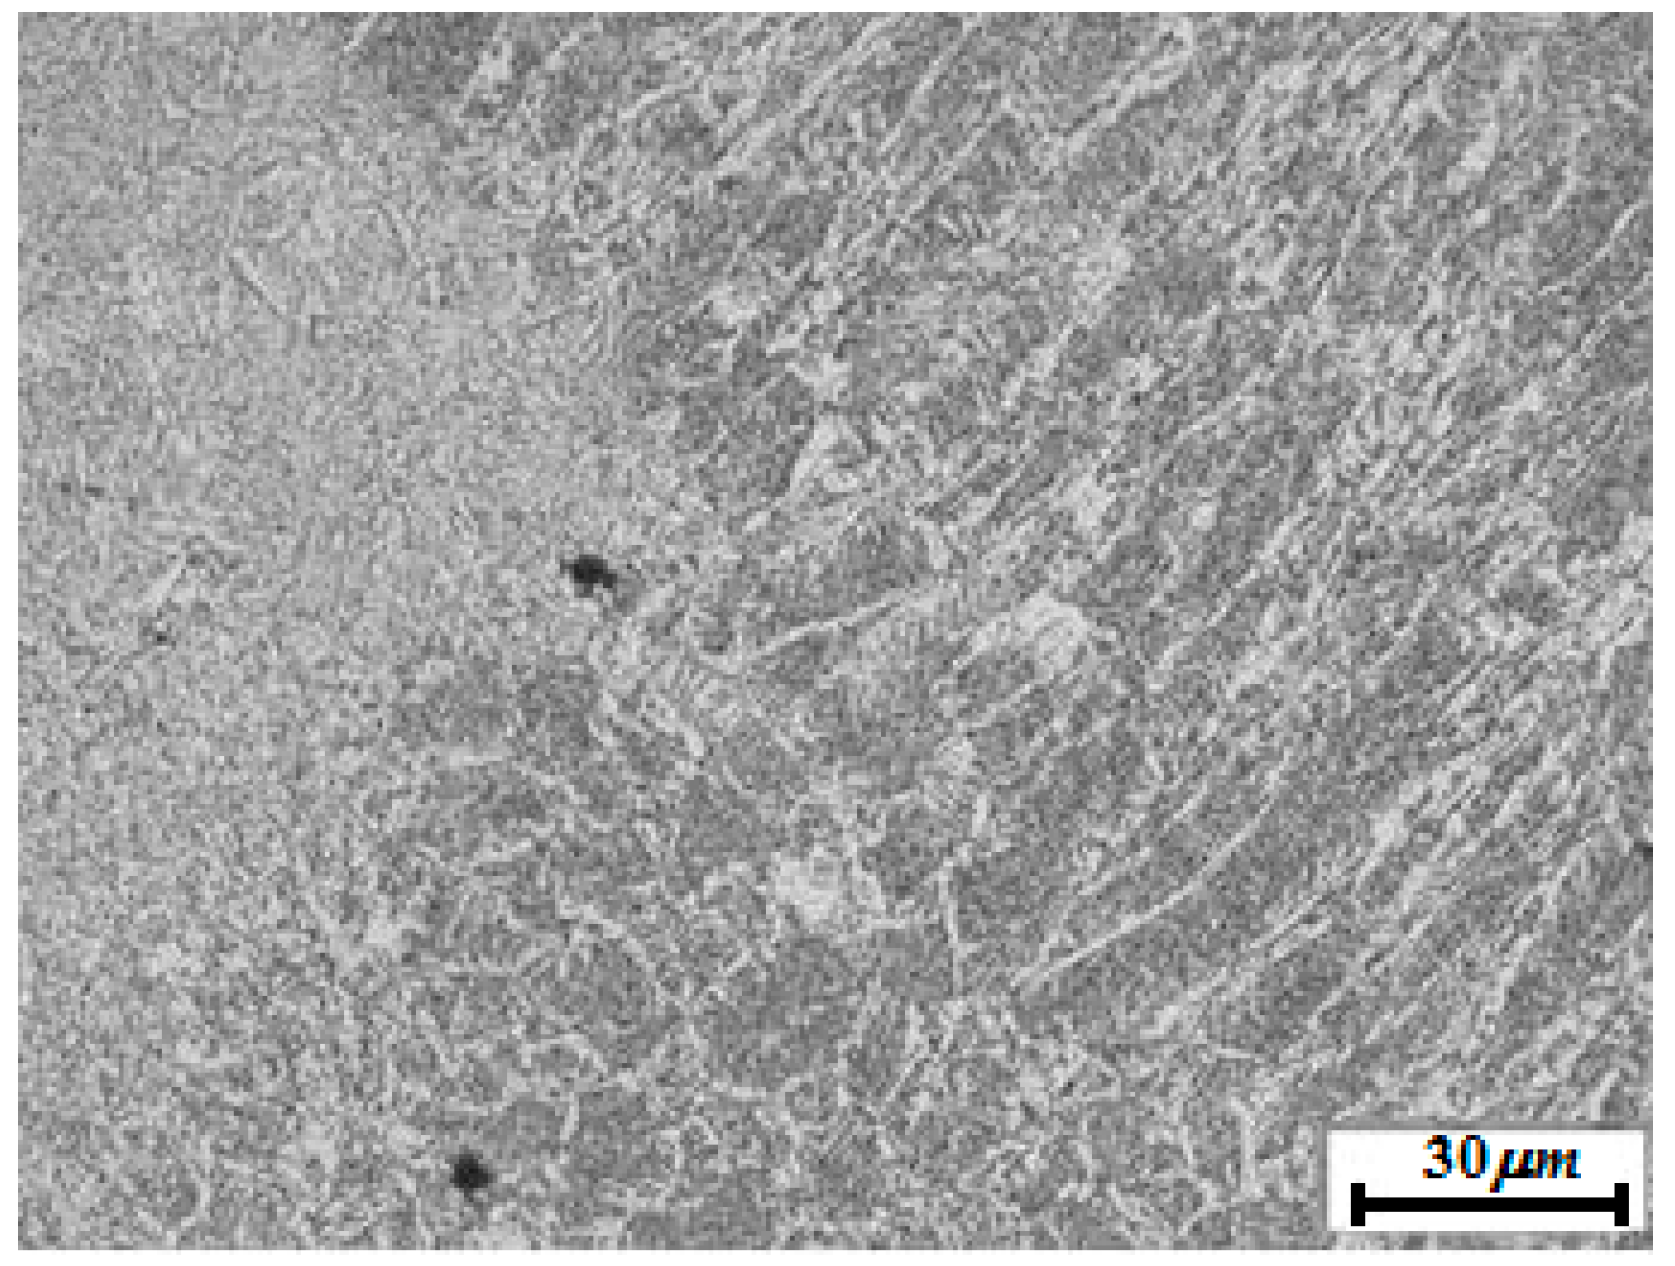
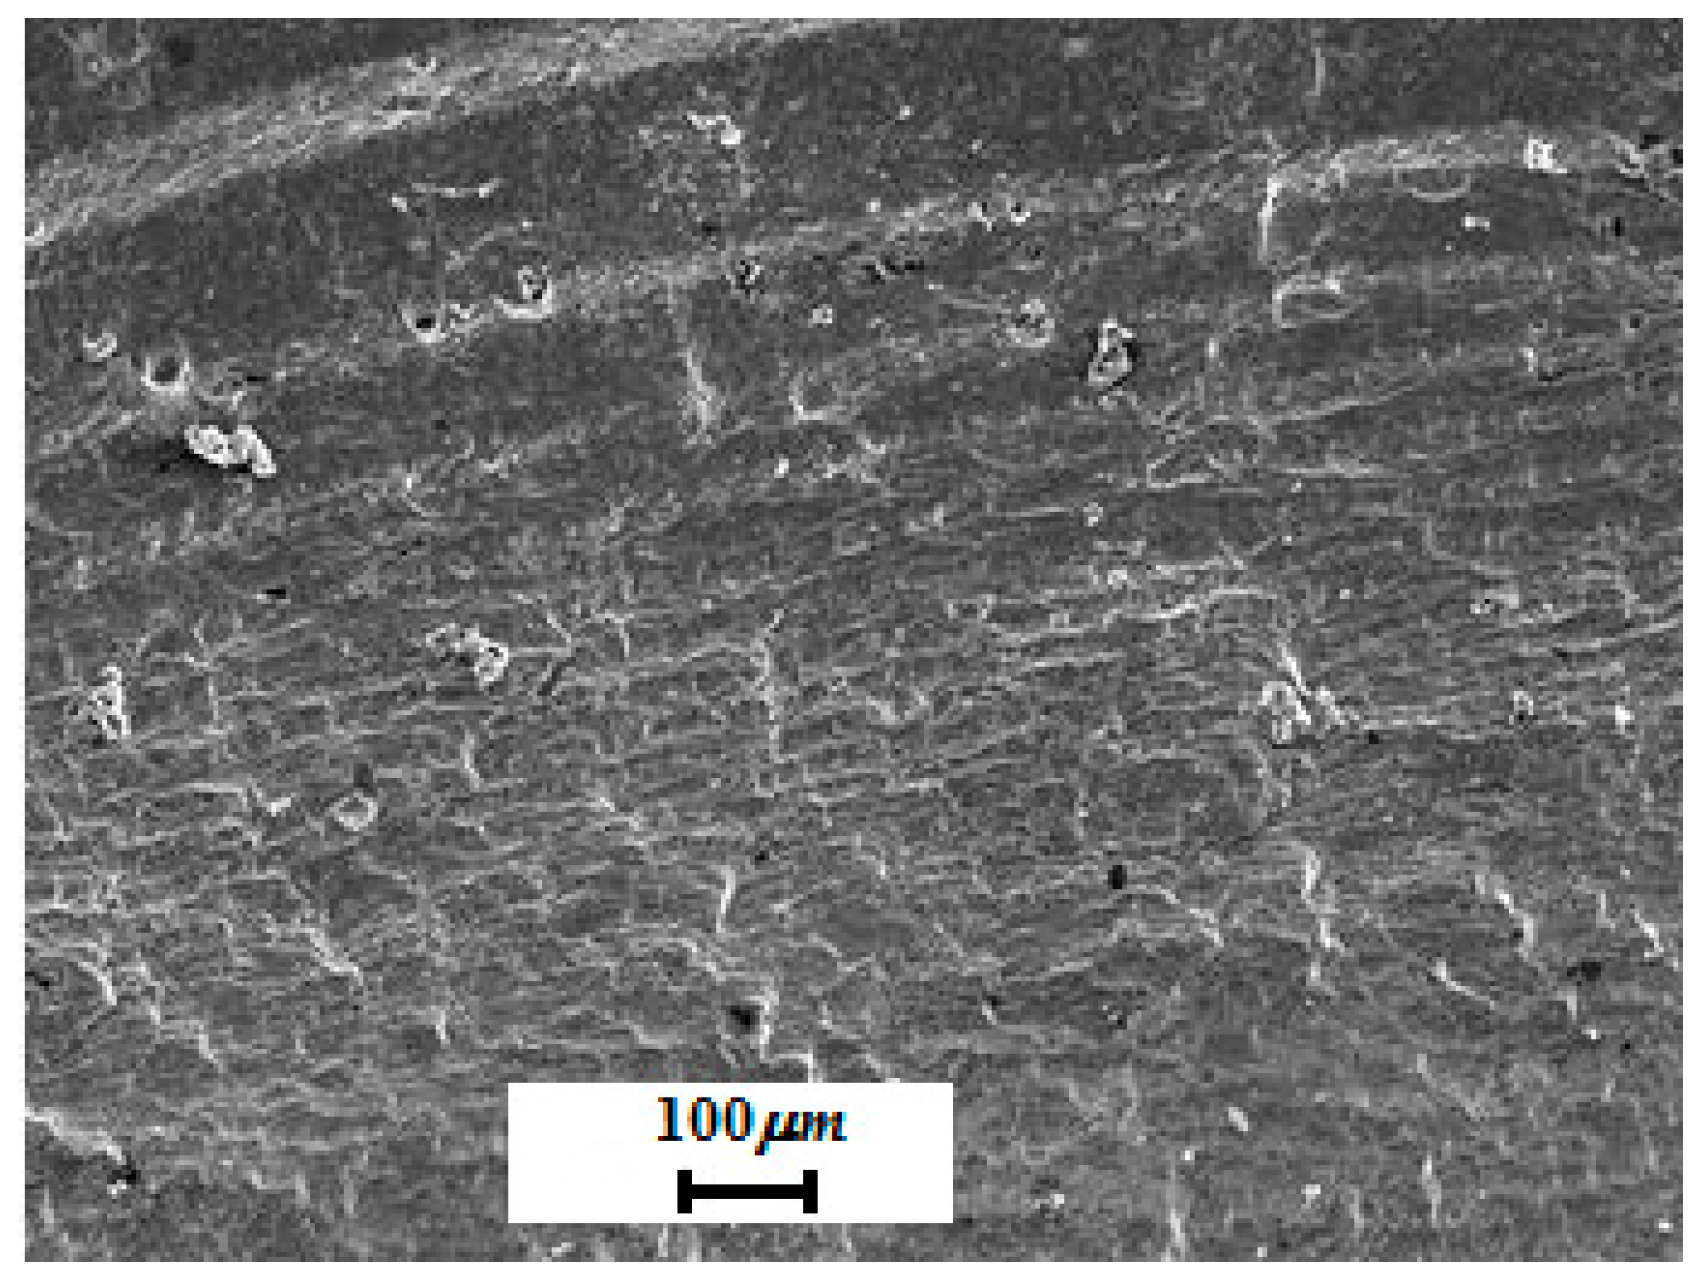
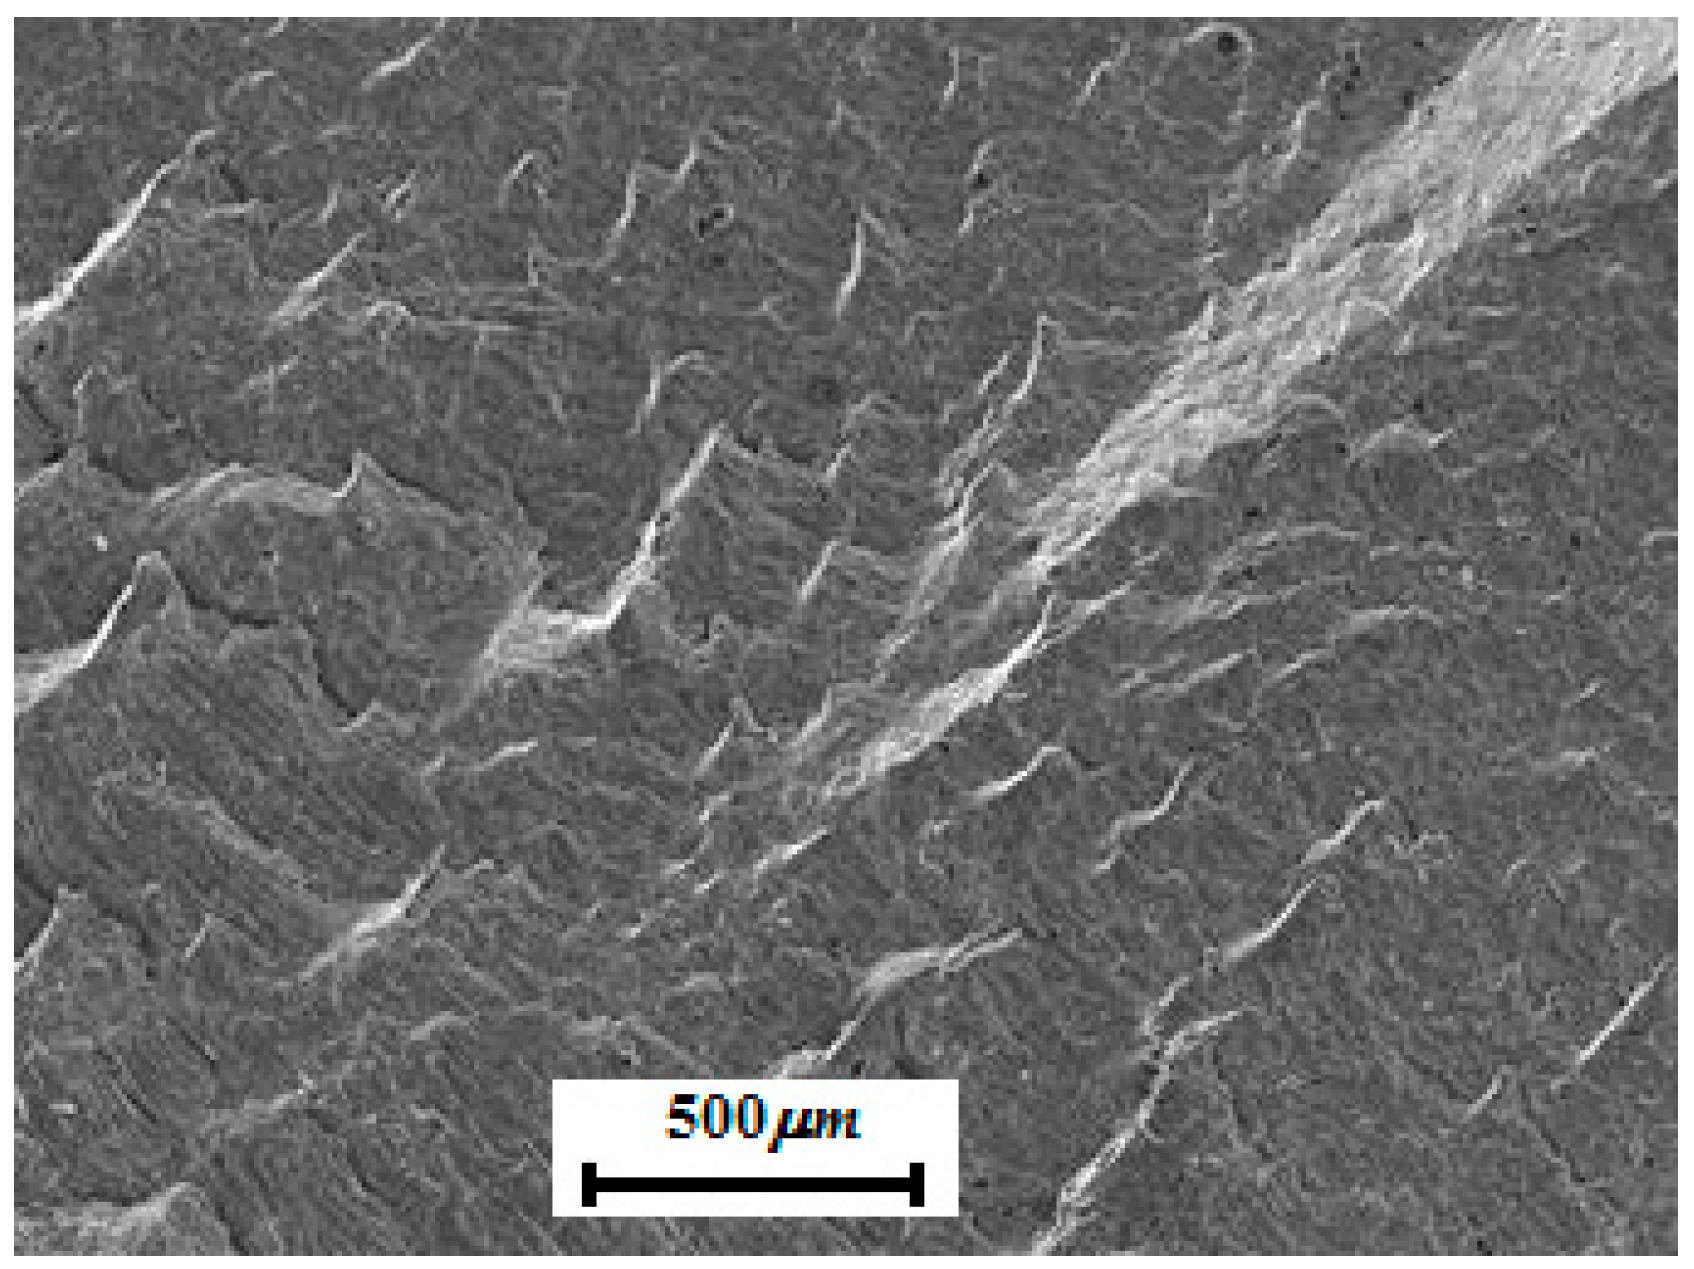
3.4. Microscopic Properties
4. Fatigue Life Estimation
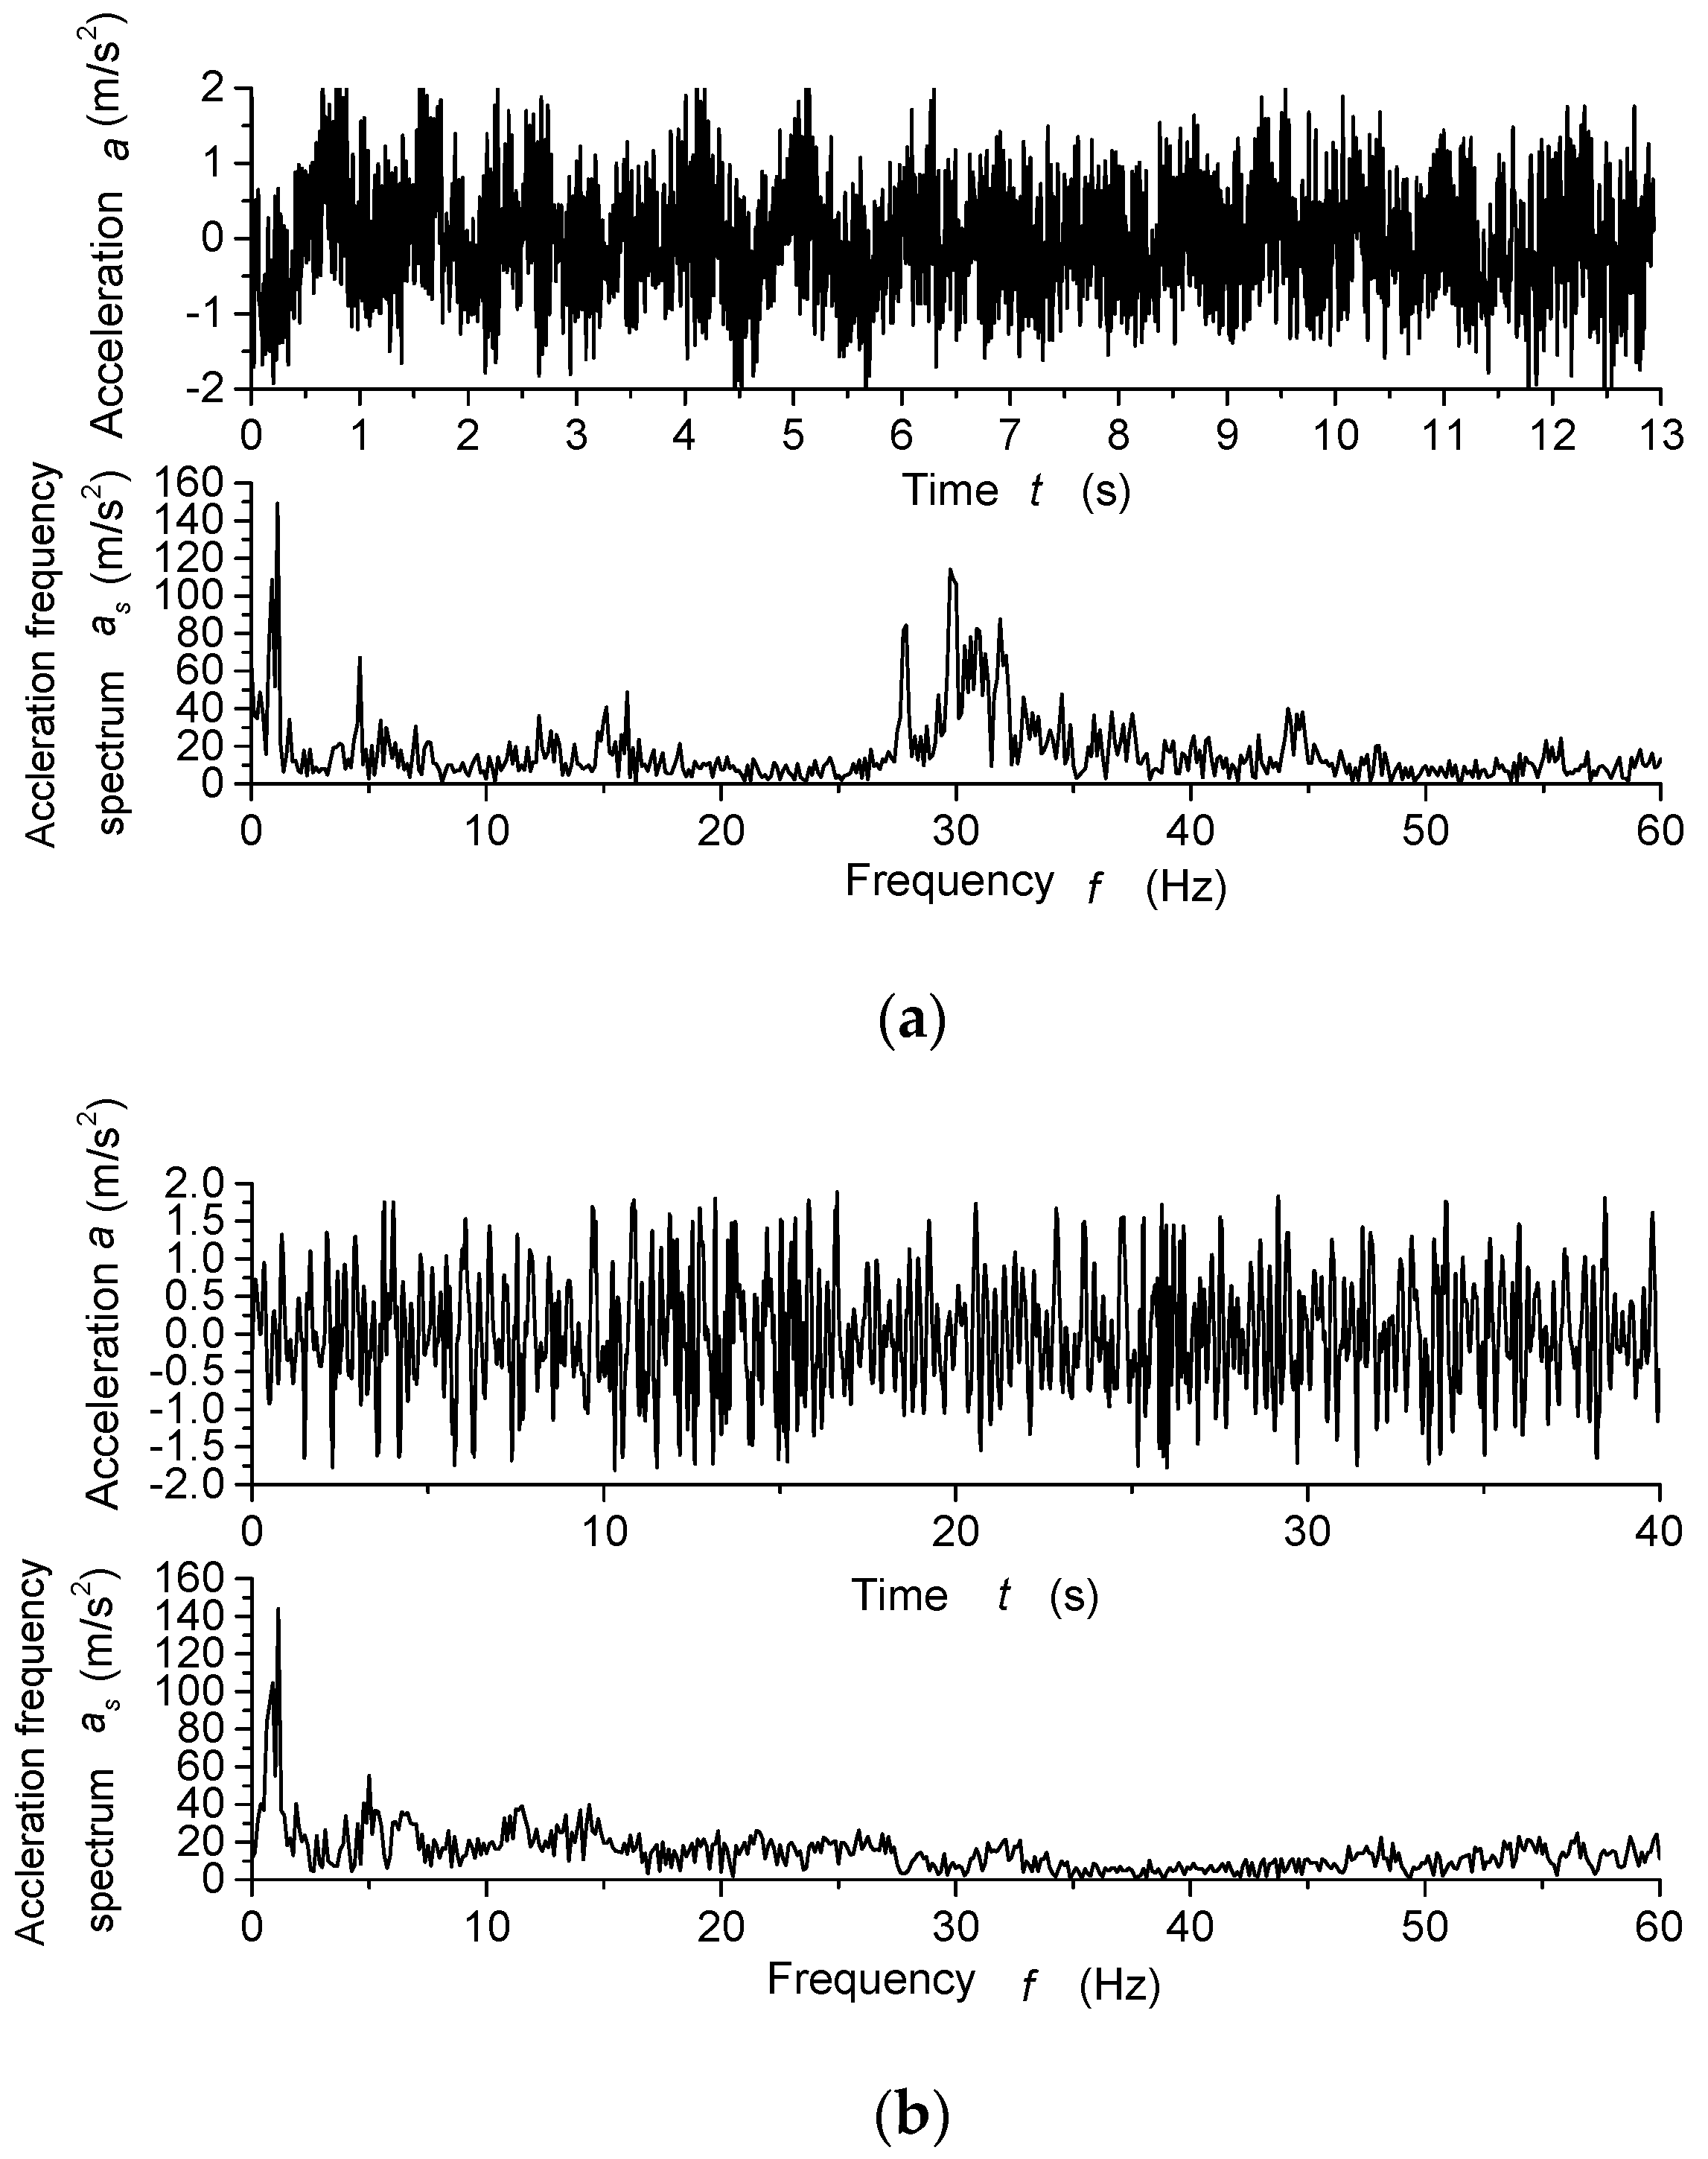
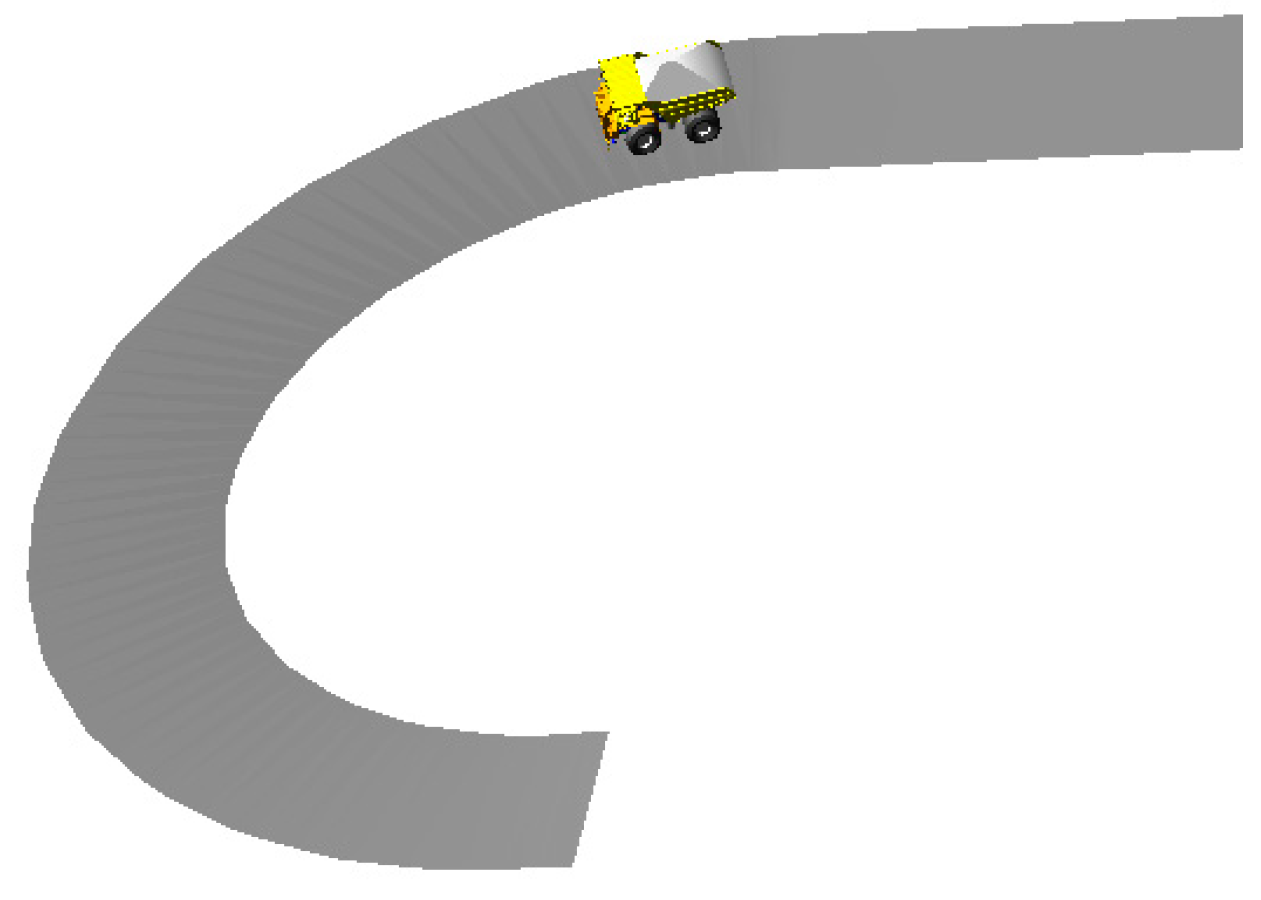
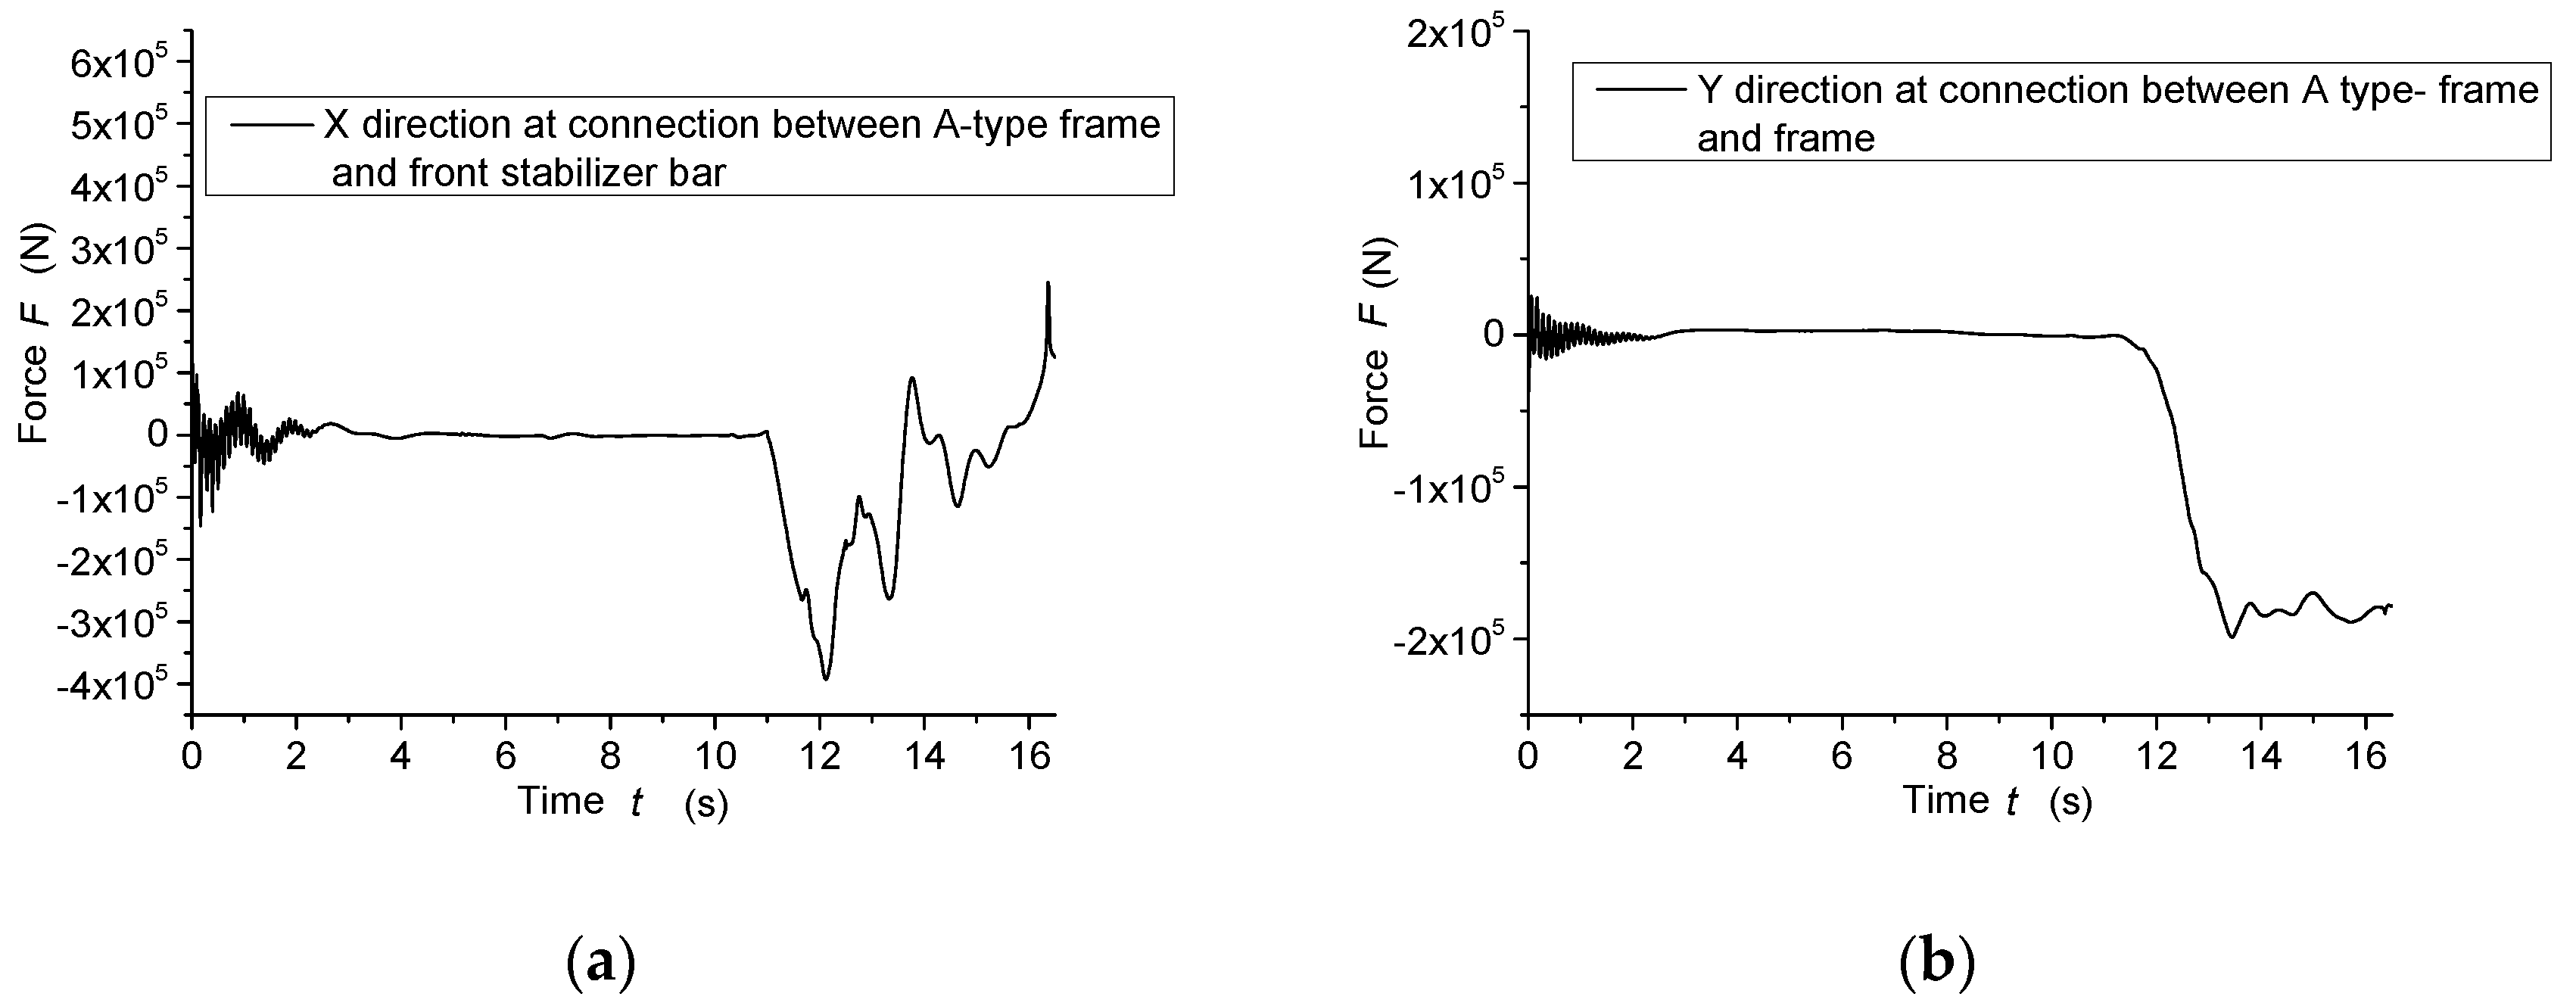
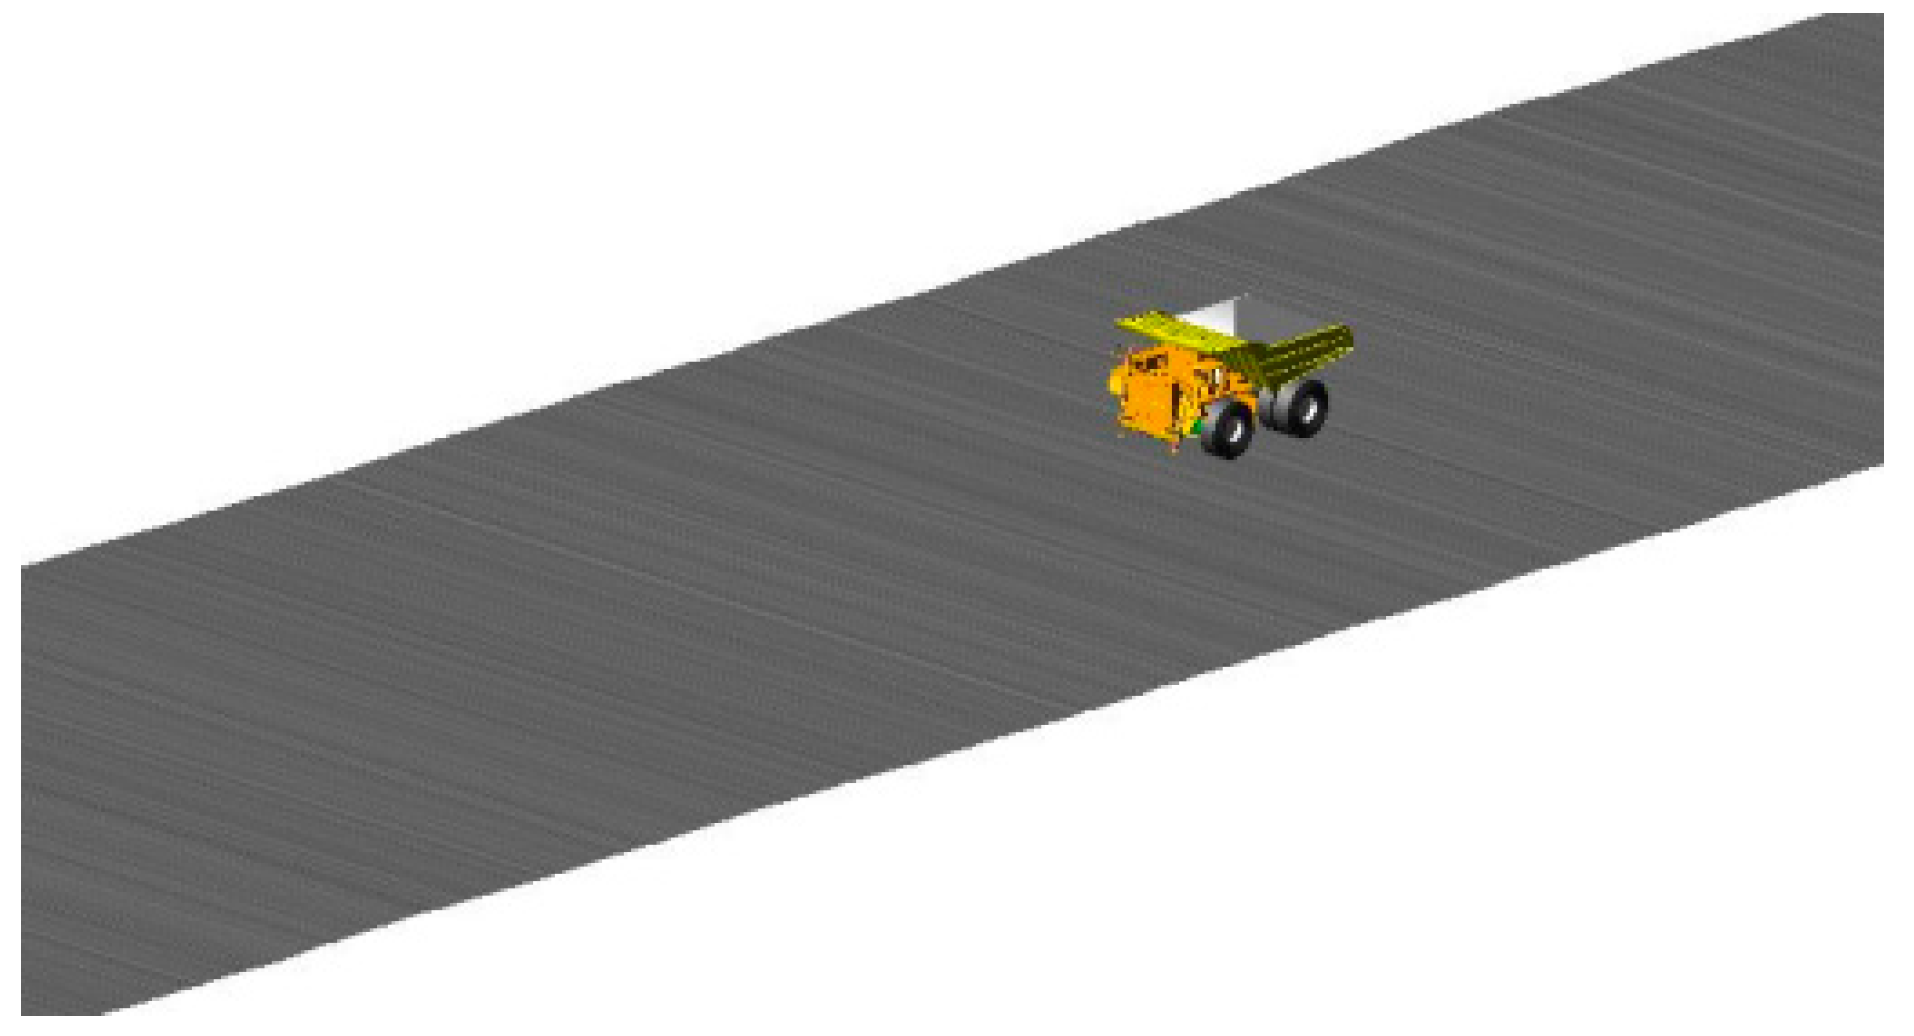
4.1. Multibody Dynamics Analysis
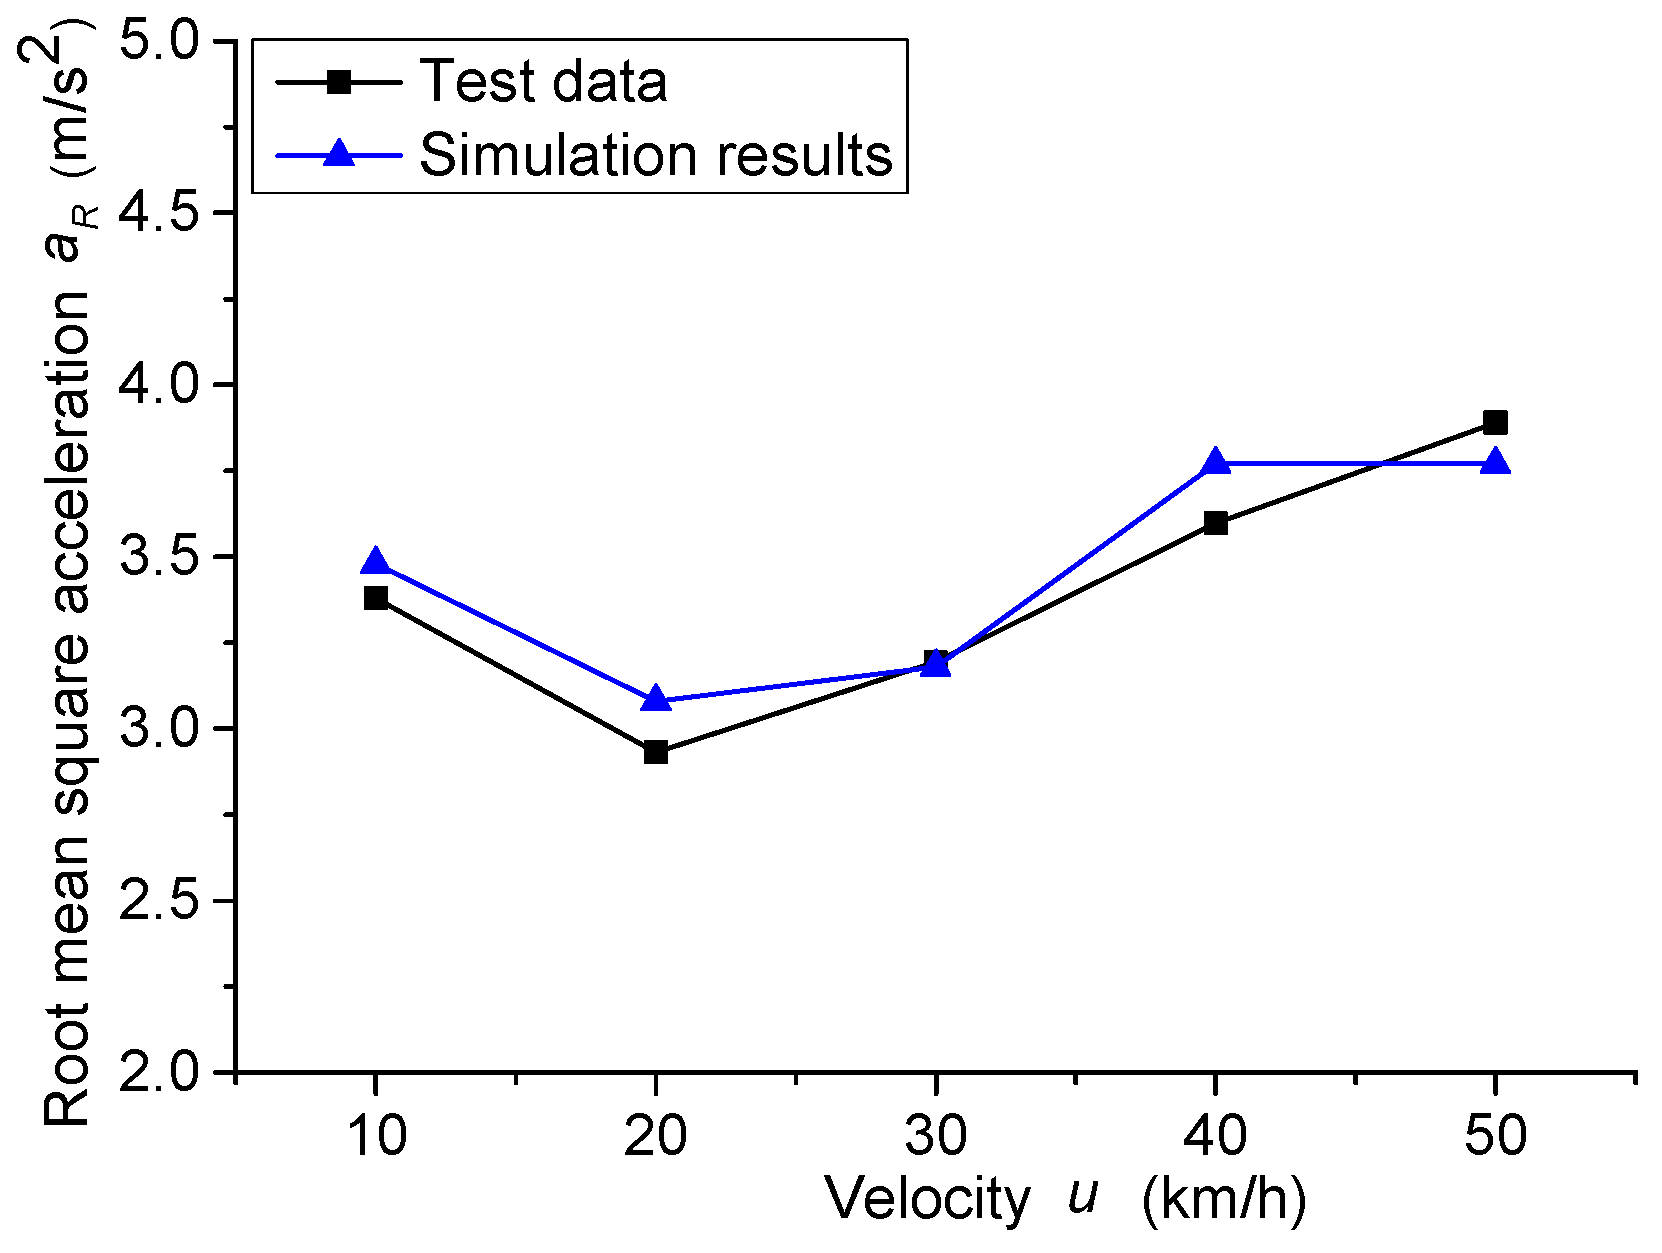
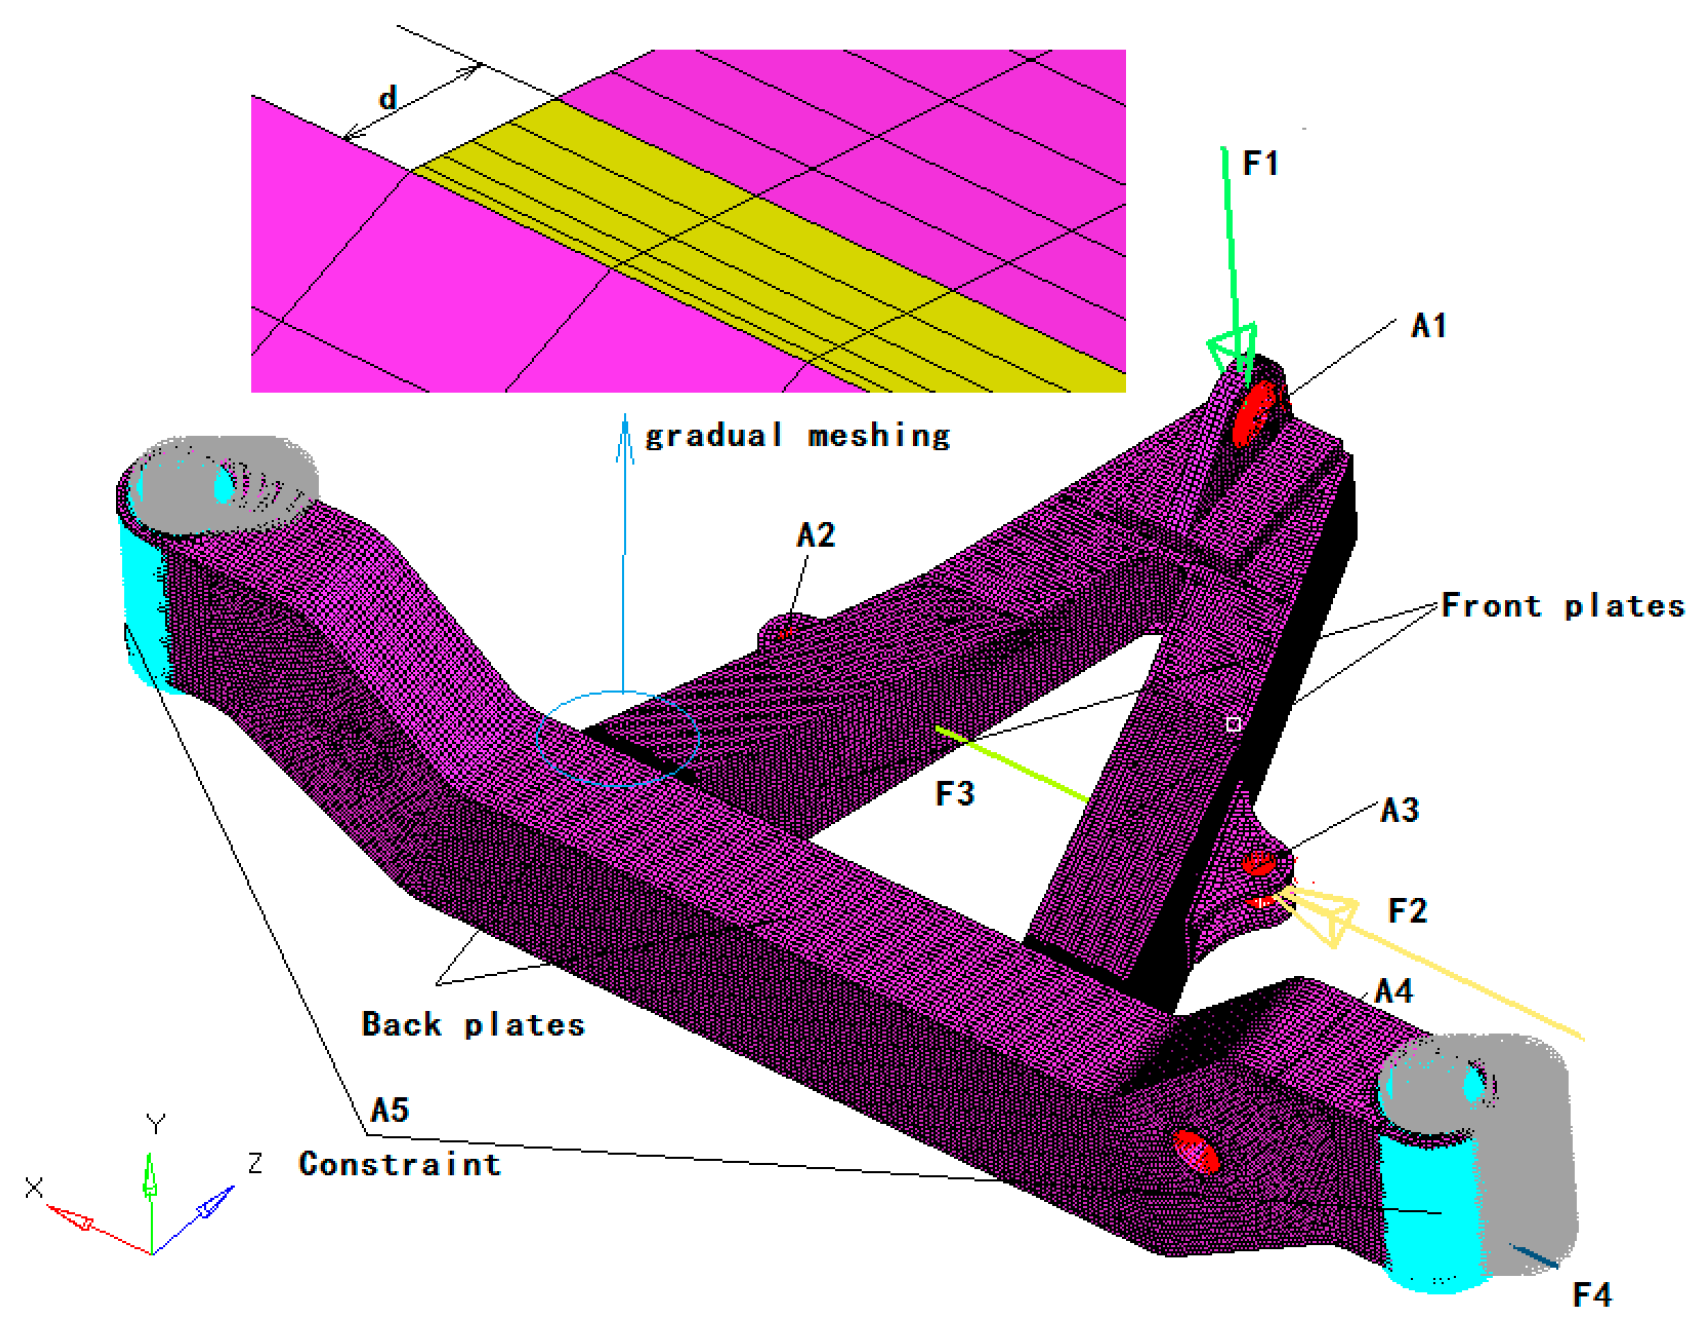
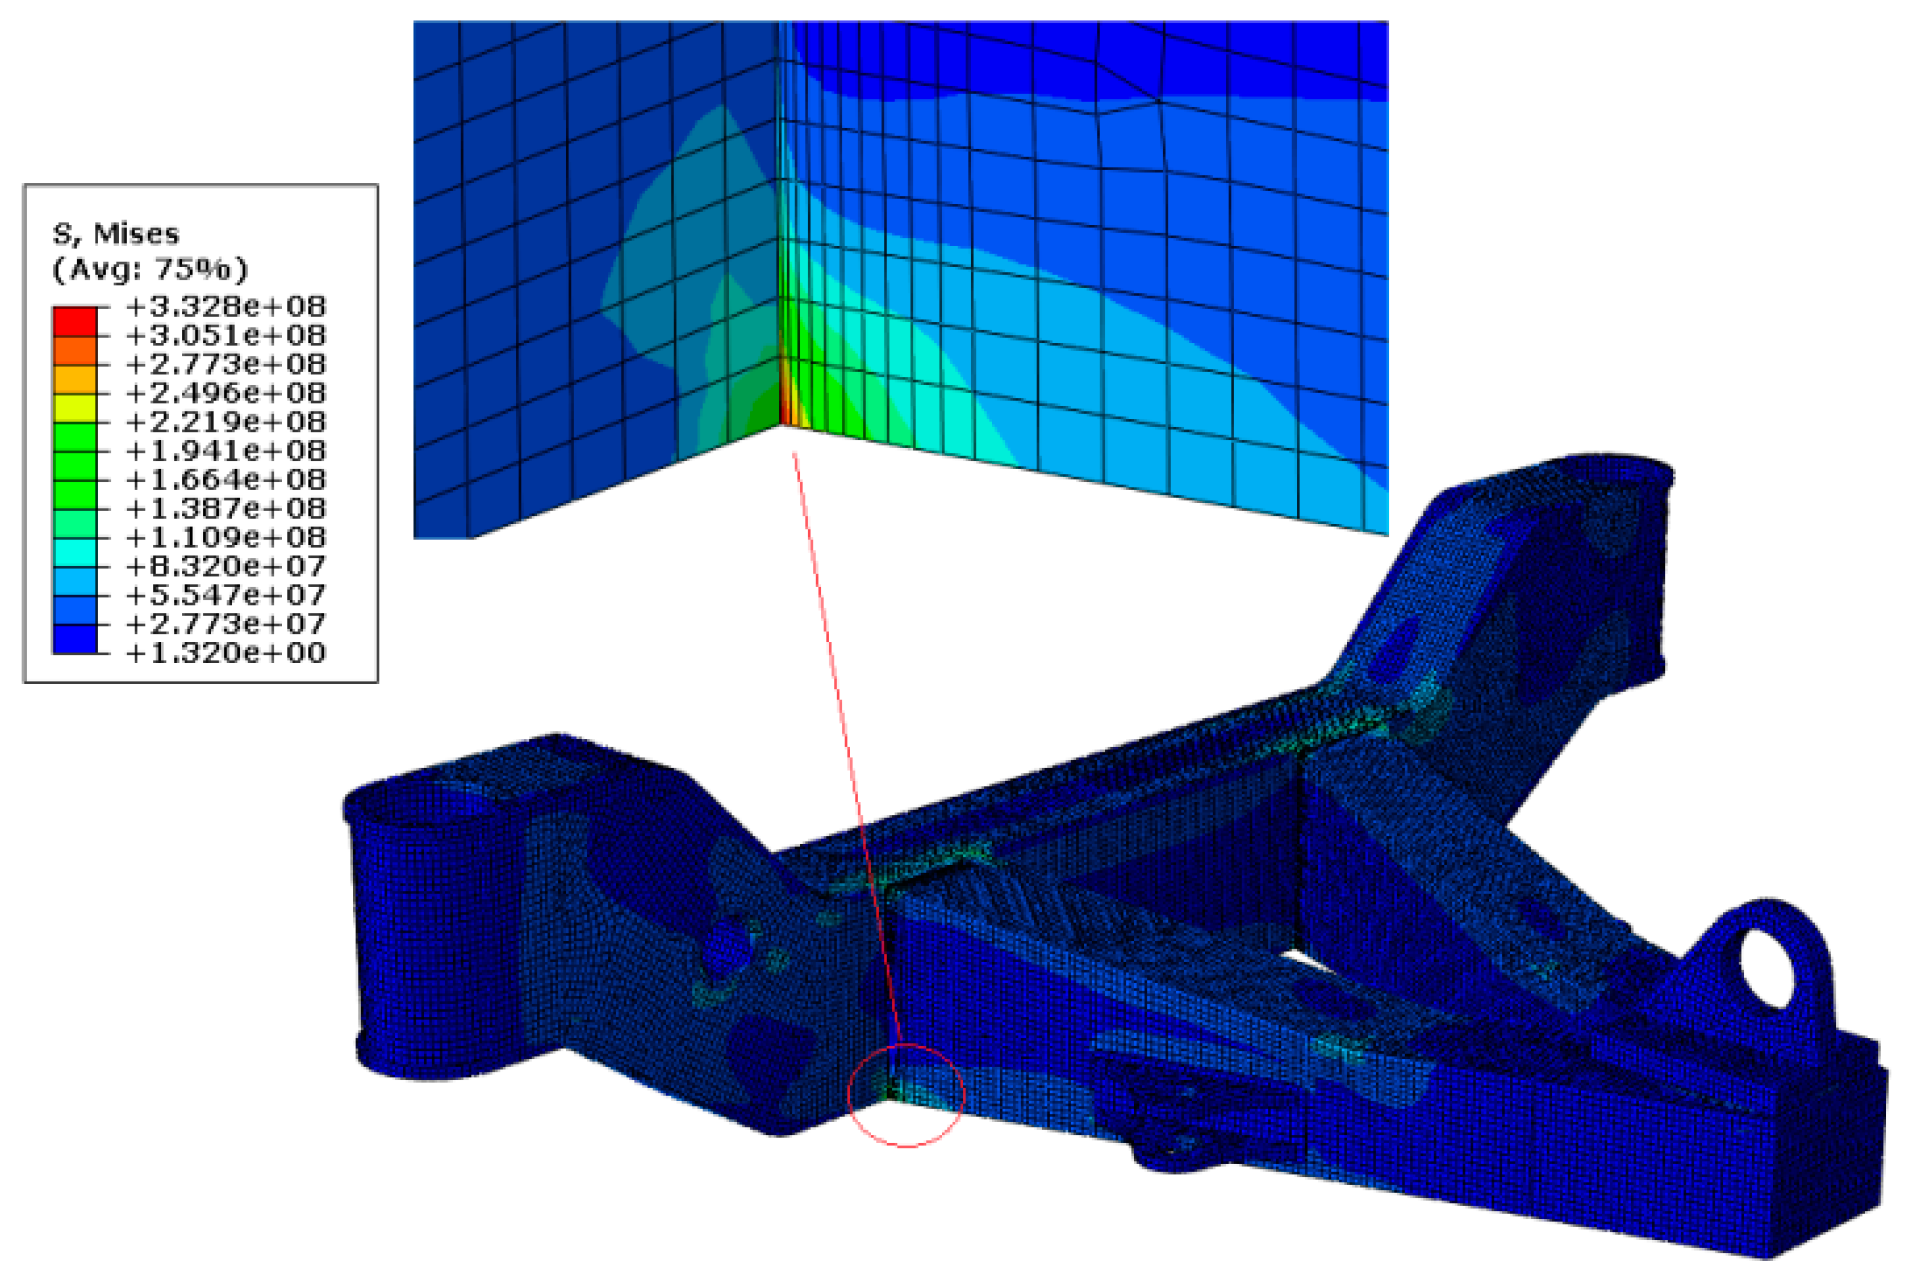
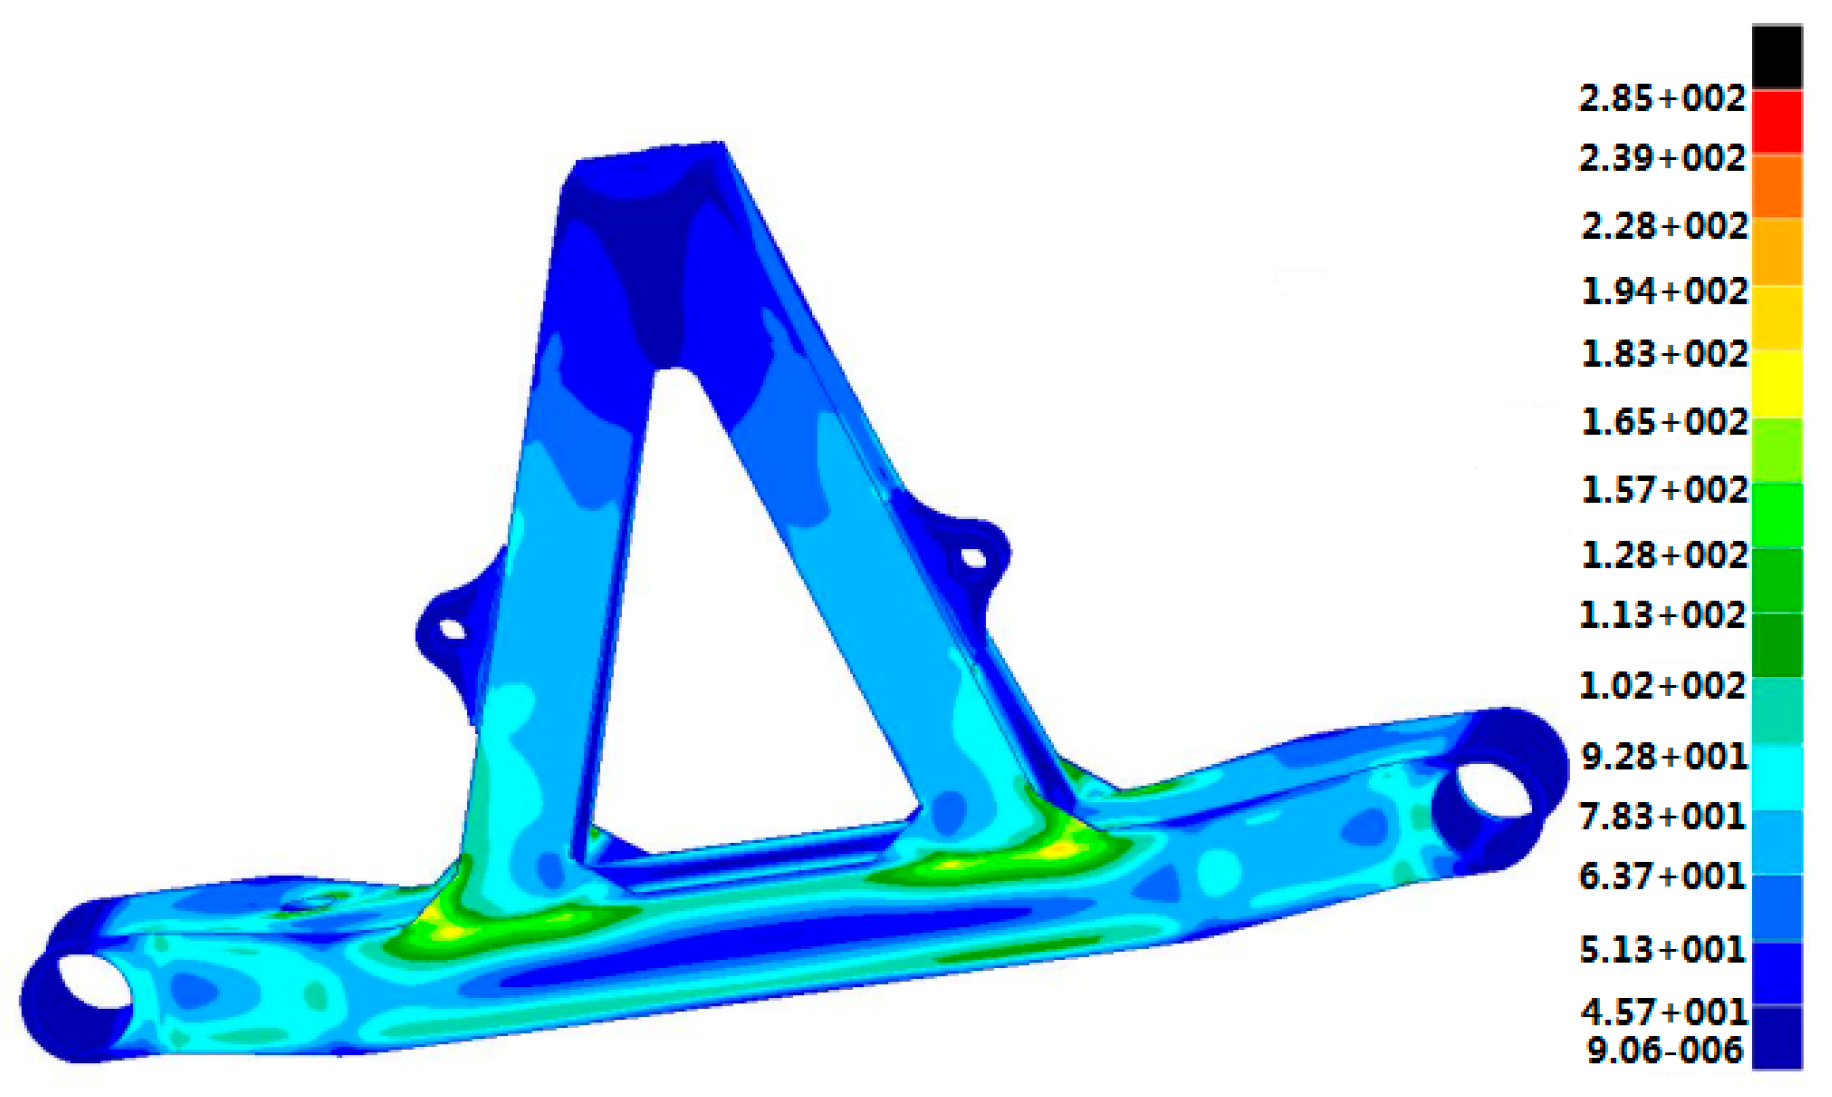
4.2. Elastic/Plastic Analysis and Verification
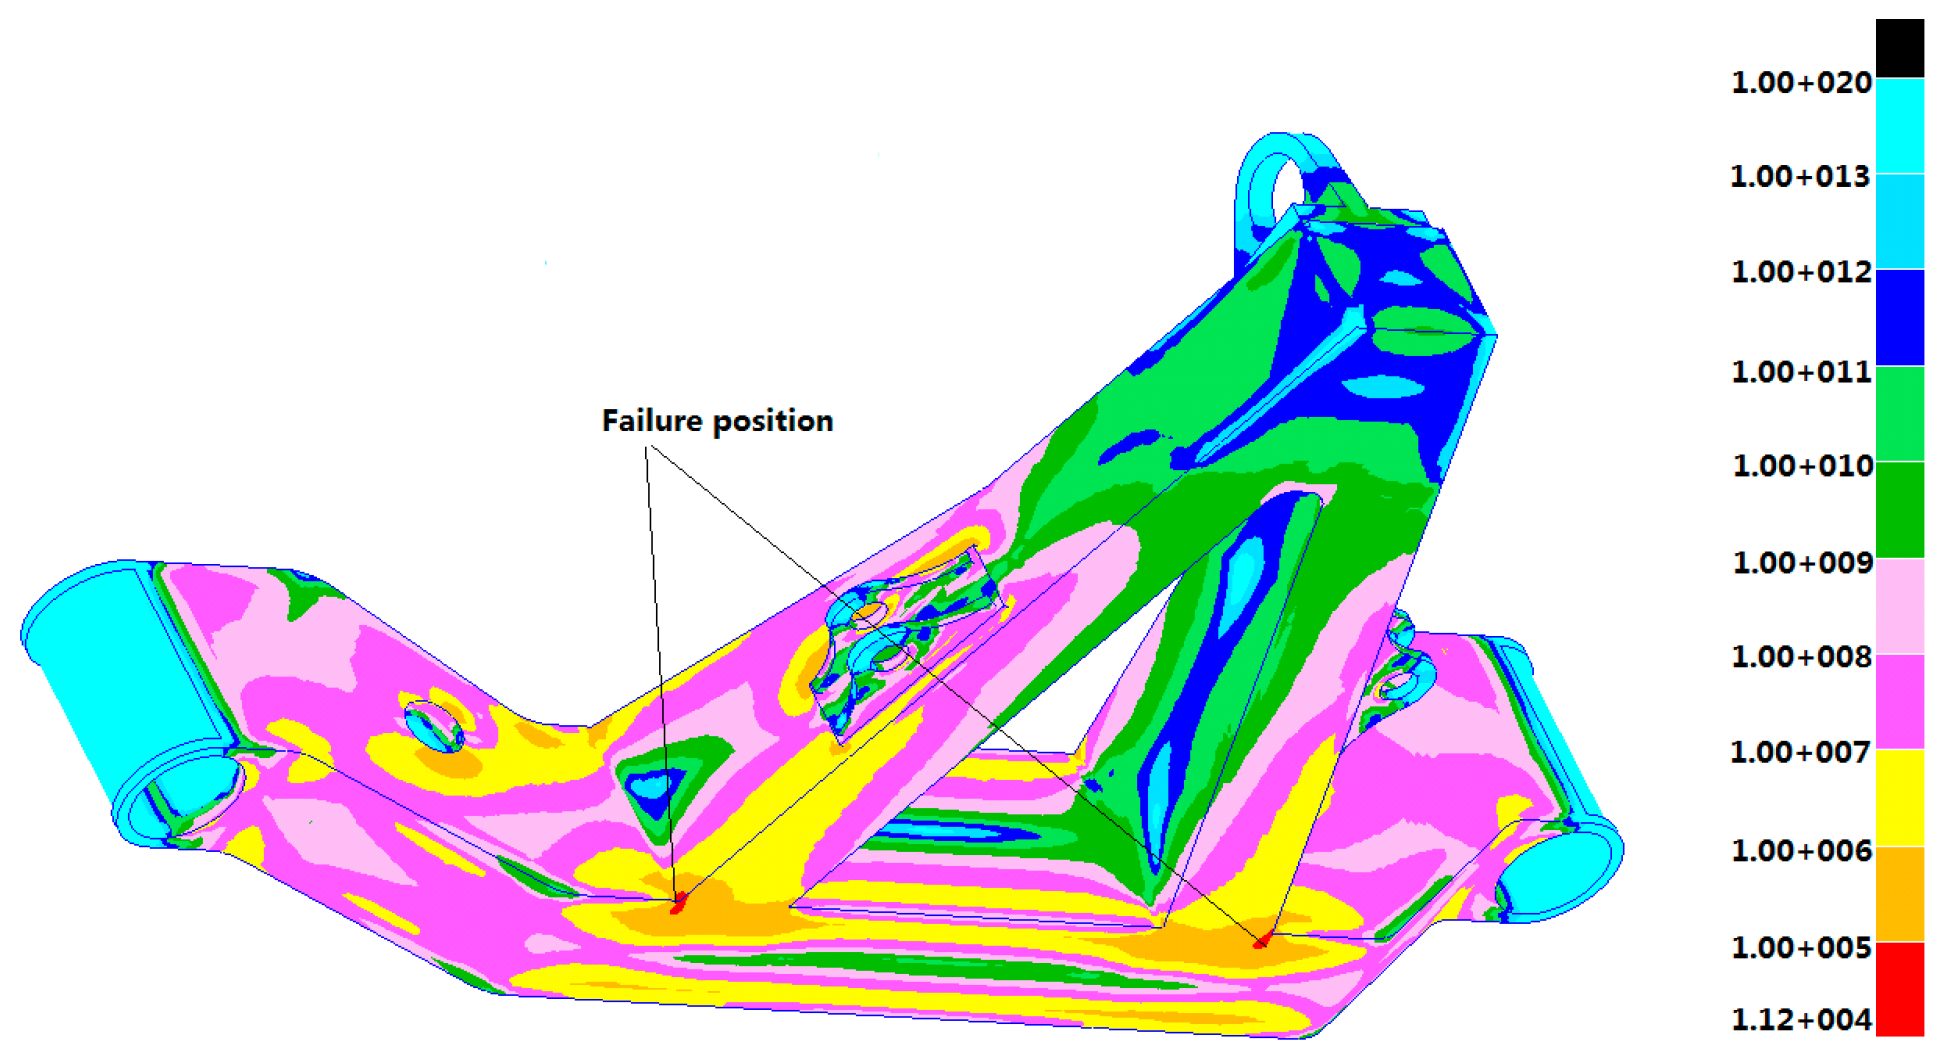
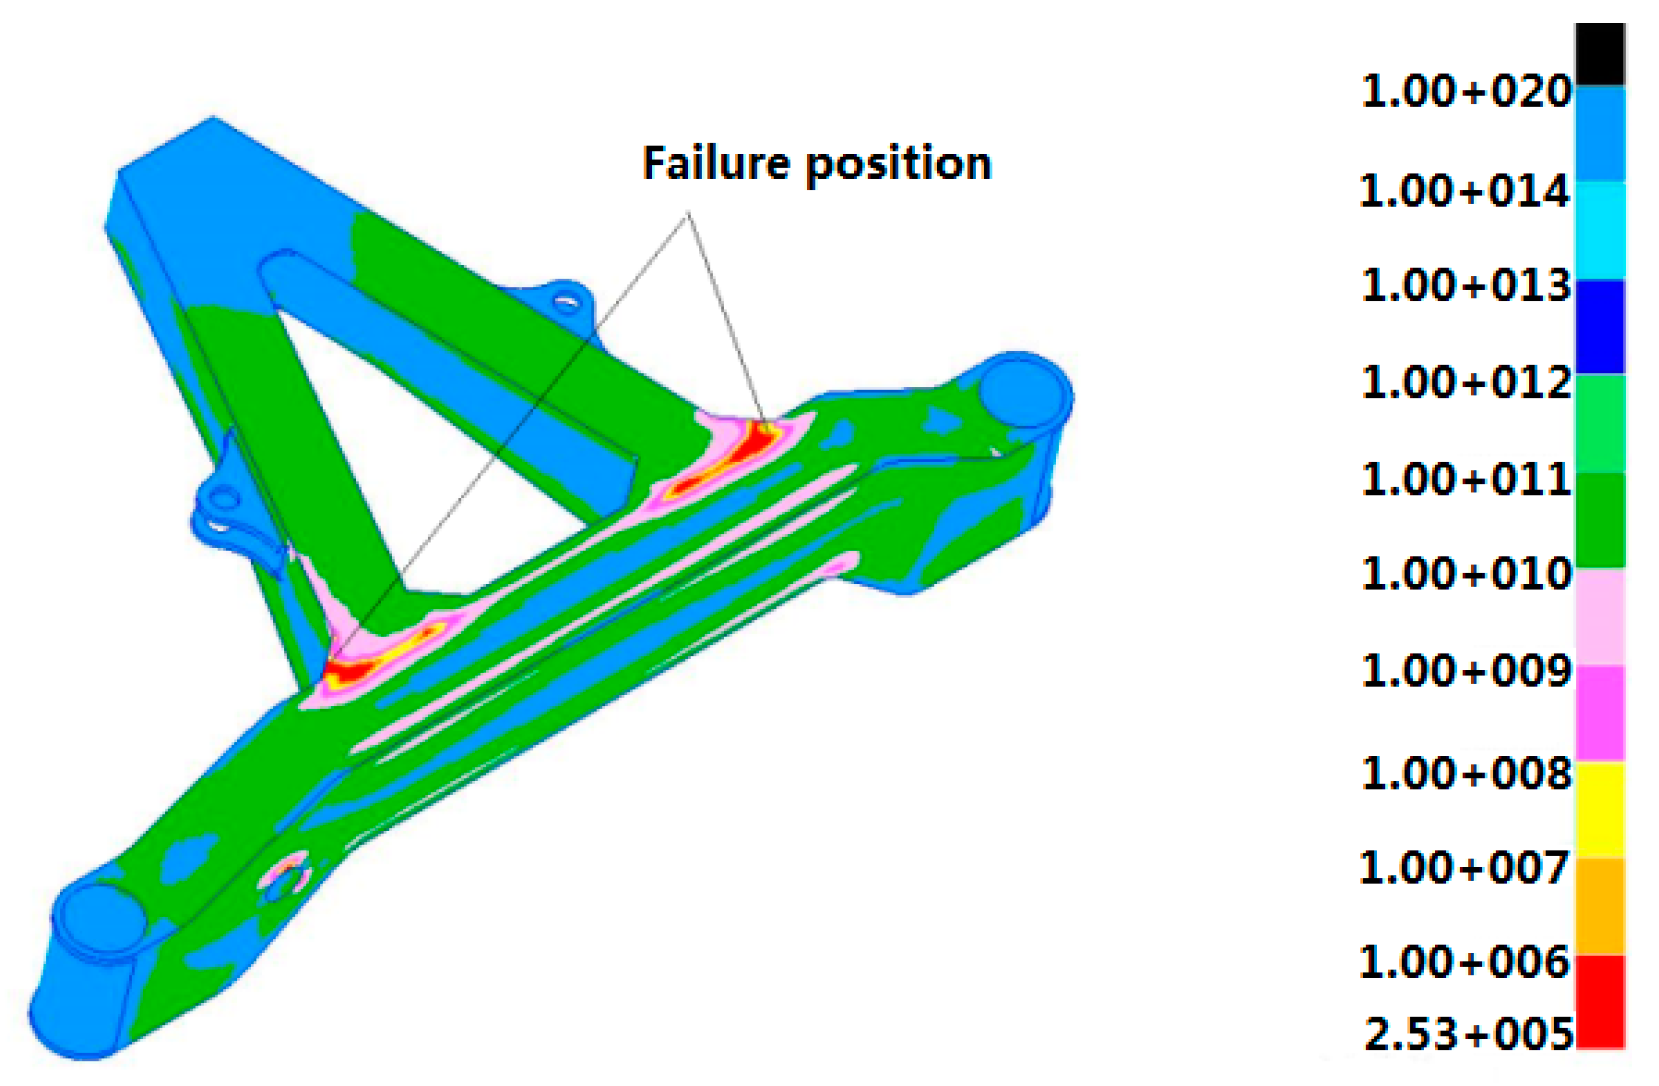
4.3. Fatigue Life Prediction
5. Lifetime and Weight Co-Optimization
5.1. Multi-Objective Optimization Function
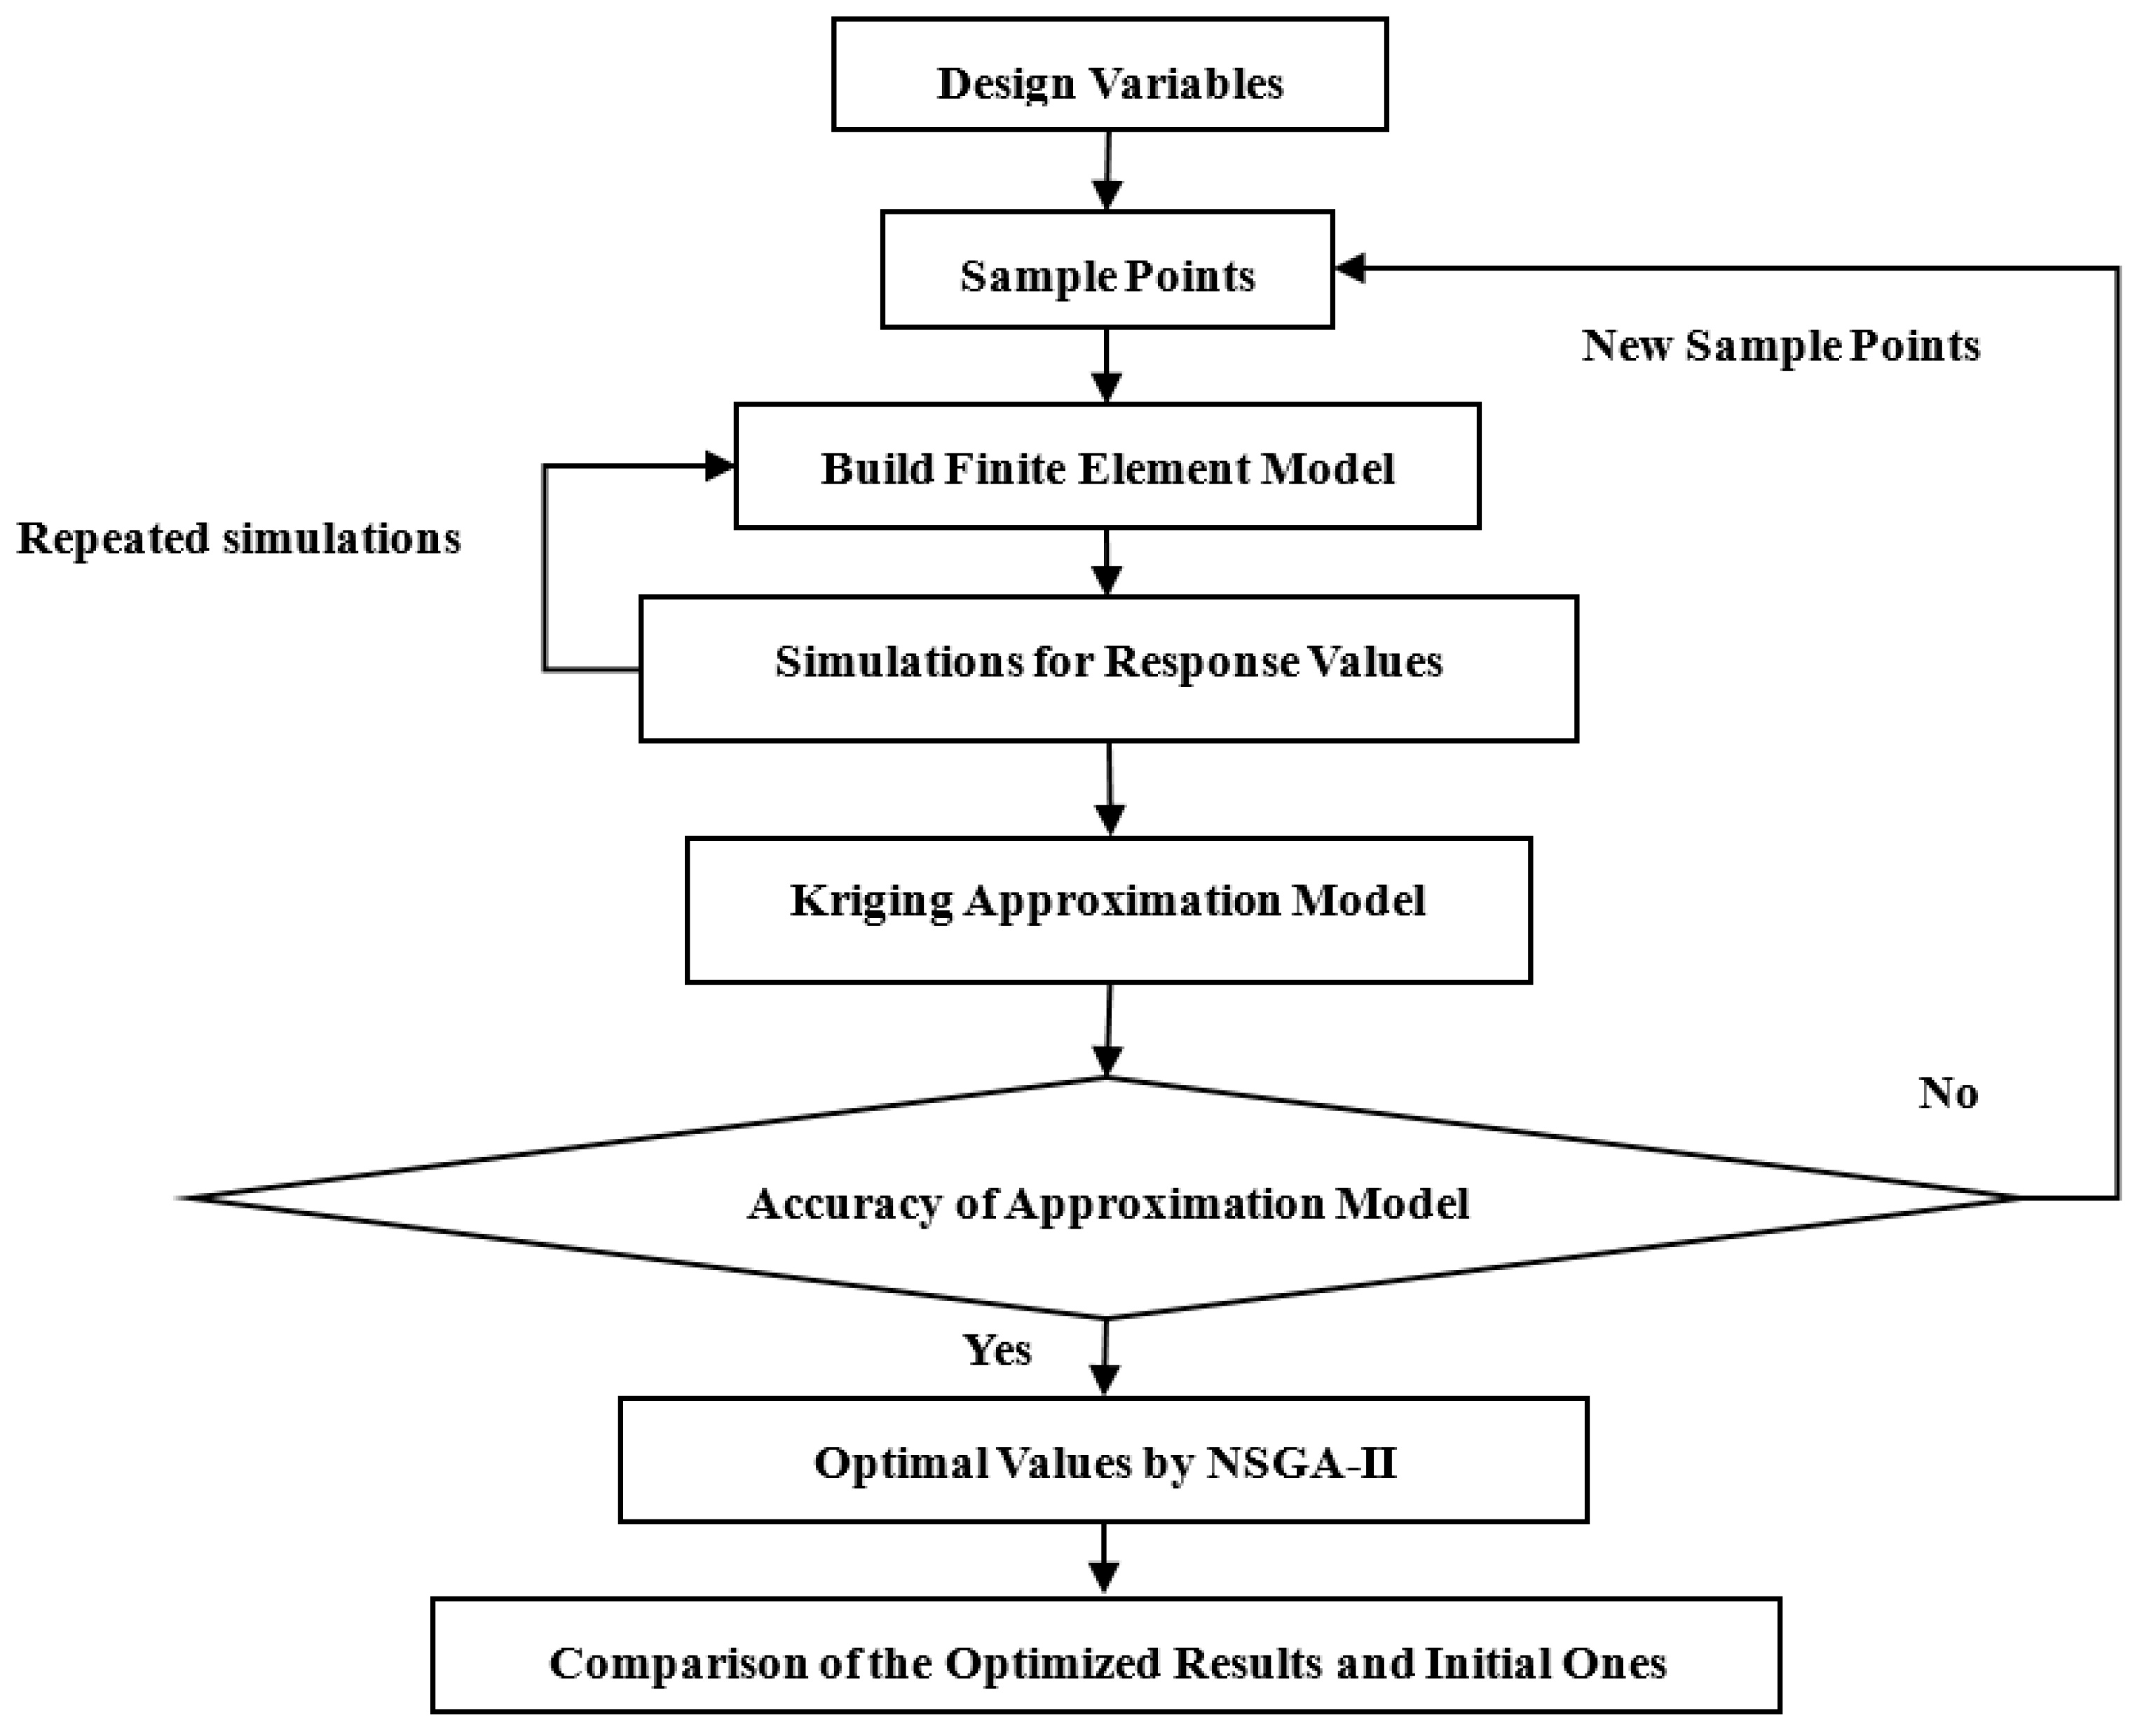
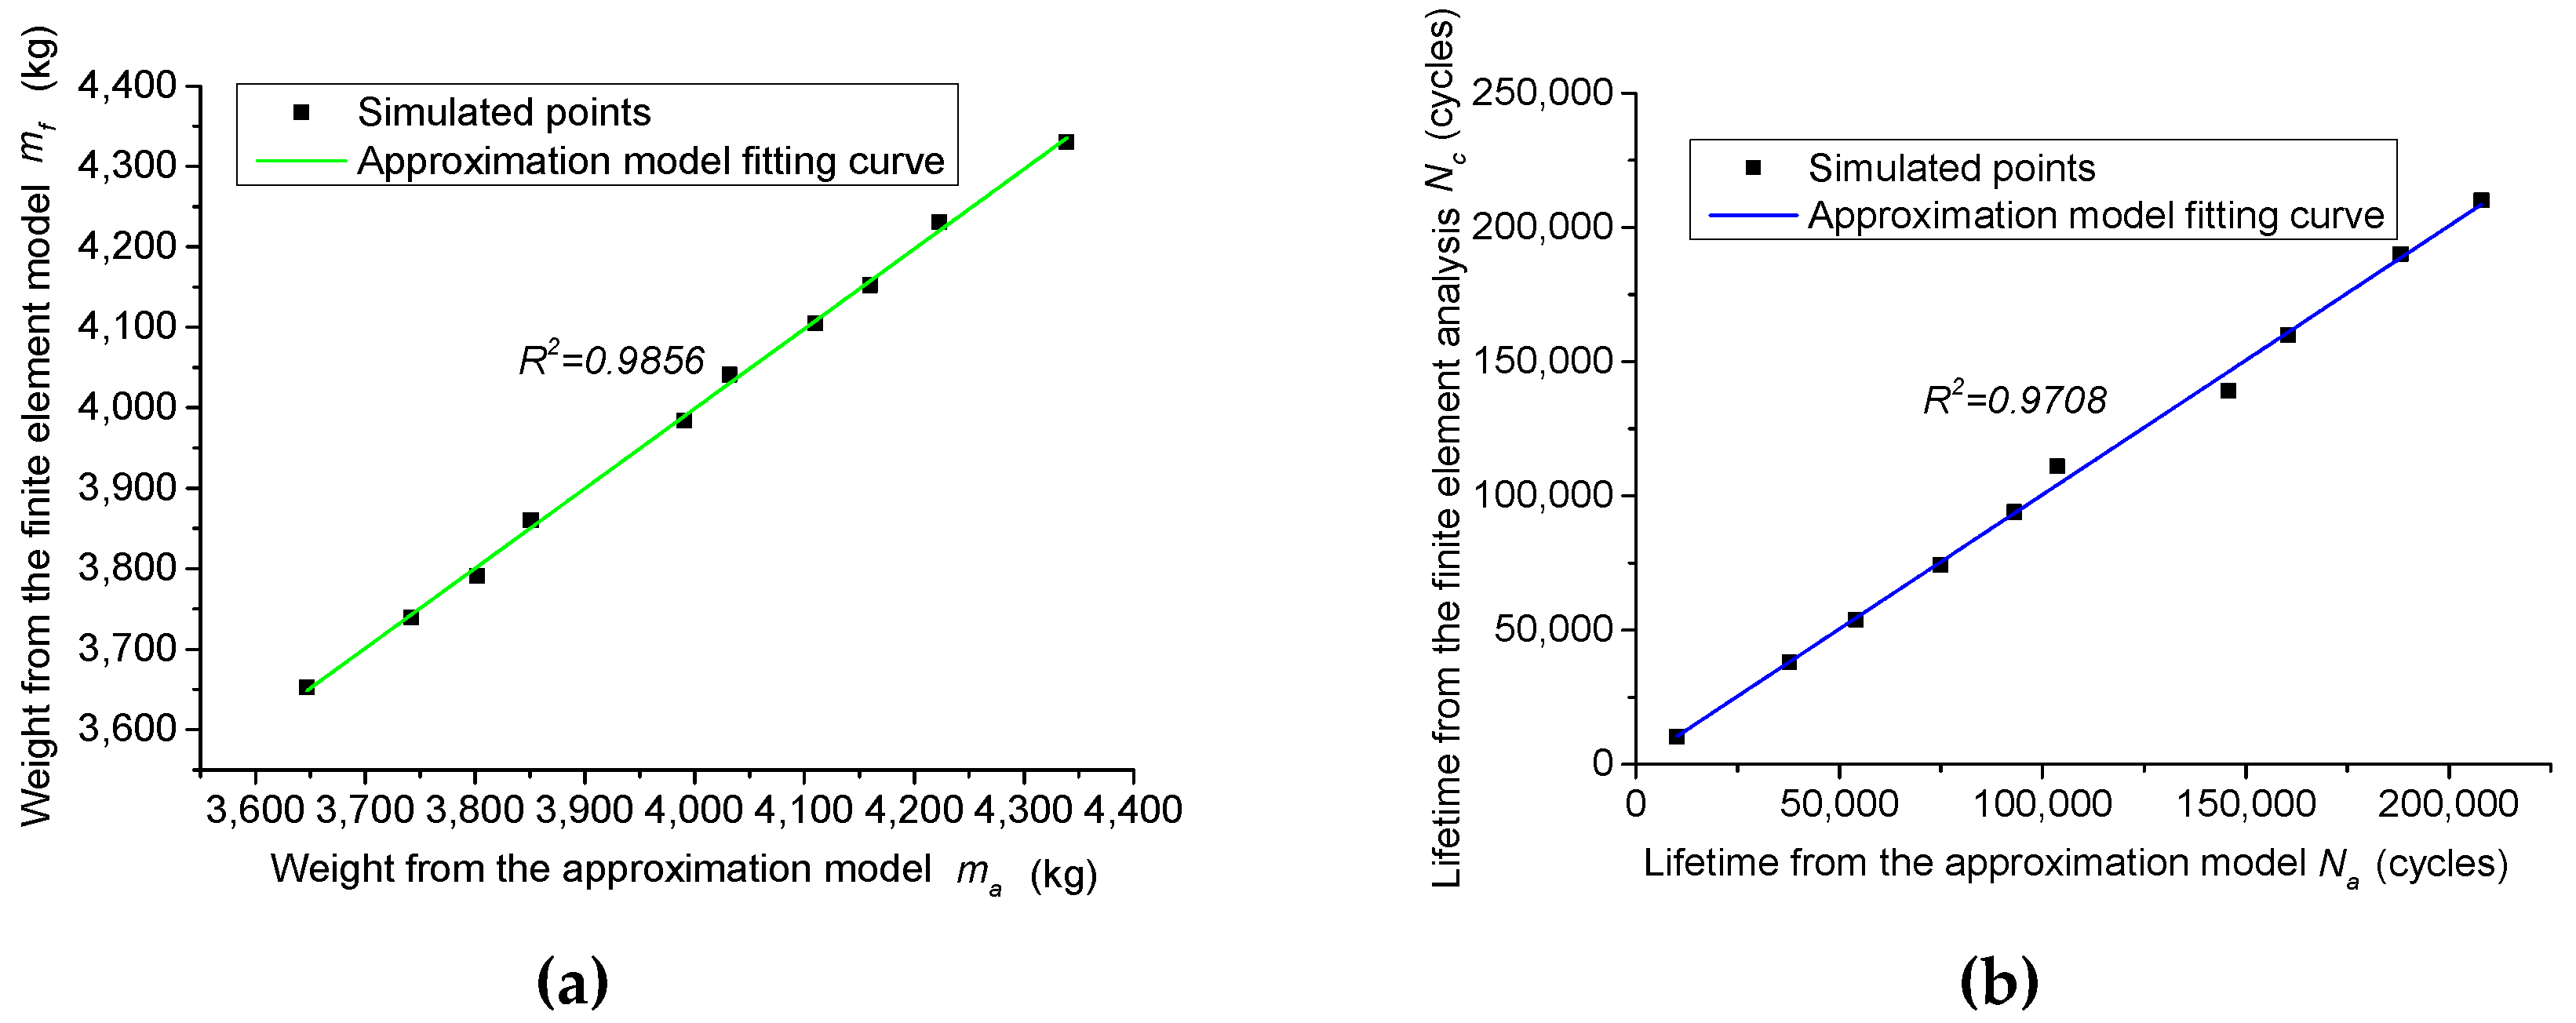
5.2. Approximation Model
5.3. Optimization Results
6. Conclusions
Author Contributions
Funding
Acknowledgments
Conflicts of Interest
References
- Gu, Z.; Mi, C.; Wang, Y.; Jang, J. A-type frame fatigue life estimation of a mining dump truck based on modal stress recovery method. Eng. Fail. Anal. 2012, 26, 89–99. [Google Scholar] [CrossRef]
- Wannenburg, J.; Heyns, P.S.; Raath, A.D. Application of a fatigue equivalent static load methodology for the numerical durability assessment of heavy vehicle structures. Int. J. Fatigue 2009, 31, 1541–1549. [Google Scholar] [CrossRef]
- Tovo, R.; Livieri, P. A numerical approach to fatigue assessment of spot weld joints. Fatigue Fract. Eng. Mater. Struct. 2010, 34, 32–45. [Google Scholar] [CrossRef]
- Kang, H.T. Fatigue prediction of spot welded joints using equivalent structural stress. Mater. Des. 2007, 28, 837–843. [Google Scholar] [CrossRef]
- Varvani-Farahani, A.; Kodric, T.; Ghahramani, A. A method of fatigue prediction in notched and un-notched components. J. Mater. Process. Technol. 2005, 169, 94–102. [Google Scholar] [CrossRef]
- Wang, P.C.; Ewing, K.W. Fracture mechanics analysis of fatigue resistance of spot welded coach-peel joints. Fatigue Fract. Eng. Mater. Struct. 1991, 14, 915–930. [Google Scholar] [CrossRef]
- Ayala-Uraga, E.; Moan, T. Fatigue reliability based assessment of welded joints applying consistent fracture mechanics formulations. Int. J. Fatigue 2007, 29, 444–456. [Google Scholar] [CrossRef]
- Fischer, C.; Fricke, W.; Rizzo, C.M. Review of the fatigue strength of welded joints based on the notch stress intensity factor and SED approaches. Int. J. Fatigue 2016, 84, 59–66. [Google Scholar] [CrossRef]
- Jahed, H.; Varvani Farahani, A.; Noban, M.; Khalaji, I. An energy based fatigue life assessment model for various metallic materials under proportional and non-proportional loading conditions. Int. J. Fatigue 2007, 29, 647–655. [Google Scholar] [CrossRef]
- Jiang, C.; Liu, Z.C.; Wang, X.G.; Zhang, Z.; Long, X.Y. A structural stress-based critical plane method for multi-axial fatigue life estimation in welded joints. Fatigue Fract. Eng. Mater. Struct. 2016, 39, 372–383. [Google Scholar] [CrossRef]
- Michael, K. Improvements in the fatigue assessment of large welded structure using the nominal stress approach. SAE 2012, 1, 1910. [Google Scholar]
- Shao, Y.; Liu, J.; Mechefske, C.K. Drive axle housing failure analysis of a mining dump truck based on the load spectrum. Eng. Fail. Anal. 2011, 18, 1049–1057. [Google Scholar] [CrossRef]
- Mi, C.; Gu, Z.; Yang, Q.; Nie, D. Frame fatigue life assessment of a mining dump truck based on finite element method and multi-body dynamic analysis. Eng. Fail. Anal. 2012, 23, 18–26. [Google Scholar] [CrossRef]
- Yang, Q.; Gu, Z.; Mi, C. An analysis on the fatigue life of frame in SF33900 mining dump truck. Autom. Eng. 2012, 23, 1015–1019. [Google Scholar]
- Gu, Z.; Mi, C.; Ding, Z.; Zhang, Y.; Liu, S.; Nie, D. An energy-based fatigue life prediction of a mining truck welded frame. J. Mech. Sci. Technol. 2016, 30, 3615–3624. [Google Scholar] [CrossRef]
- Berto, F.; Campagnolo, A.; Chebat, F.; Cincera, M.; Santini, M. Fatigue strength of steel rollers with failure occurring at the weld root based on the local strain energy values: Modelling and fatigue assessment. Int. J. Fatigue 2016, 82, 643–657. [Google Scholar] [CrossRef]
- Berto, F.; Vinogradov, A.; Filippi, S. Application of the strain energy density approach in comparing different design solutions for improving the fatigue strength of load carrying shear welded joints. Int. J. Fatigue 2017, 101, 371–384. [Google Scholar] [CrossRef]
- Fang, J.; Gao, Y.; Sun, G.; Xu, C.; Li, Q. Multi-objective robust design optimization of fatigue life for a truck cab. Reliab. Eng. Syst. Saf. 2015, 135, 1–8. [Google Scholar] [CrossRef]
- Aoues, Y.; Pagnacco, E.; Lemosse, D.; Khalij, L. Reliability-based design optimization applied to structures submitted to random fatigue loads. Struct. Mulidisc. Optim. 2017, 55, 1471–1482. [Google Scholar] [CrossRef]
- Hu, W.; Choi, K.K.; Cho, H. Reliability-based design optimization of wind turbine blades for fatigue life under dynamic wind load uncertainty. Struct. Mulidisc. Optim. 2016, 54, 953–970. [Google Scholar] [CrossRef]
- Gao, Y.; Liu, Q.; Wang, Y.; Zhao, W. Lightweight design with weld fatigue constraints for a three-axle bogie frame using sequential approximation optimization method. Int. J. Veh. Des. 2017, 73, 3–19. [Google Scholar] [CrossRef]
- Mi, C.; Gu, Z.; Zhang, Y.; Liu, S.; Zhang, S.; Nie, D. Frame weight and anti-fatigue co-optimization of a mining dump truck based on Kriging approximation model. Eng. Fail. Anal. 2016, 66, 99–109. [Google Scholar] [CrossRef]
- Mi, C.; Gu, Z.; Jian, H. Anti-fatigue and lightweight design for frame structures of electric wheel dump truck. China Mech. Eng. 2017, 28, 2455–2462. [Google Scholar]


| Material | Fe | Mn | S | Cr | Ni | Si | Ti | C |
|---|---|---|---|---|---|---|---|---|
| Base metal | 96.19 | 2.11 | 0.30 | 0.25 | 0.30 | 0.46 | 0.19 | Bal. |
| Weldment | 96.15 | 1.61 | 0.18 | 0.39 | 0.62 | 0.89 | 0.05 | Bal. |
| Base Metal | Weldment | |
|---|---|---|
| Young’s modulus (GPa) | 200.4 | 210.1 |
| Yield Strength (MPa) | 451 | 456 |
| UTS (MPa) | 621.5 | 615.9 |
| Elongation (%) | 27 | 18 |
| True fracture stress (MPa) | 57 | 24 |
| True fracture strain (%) | 0.336 | 0.279 |
| (MPa) | |||||
|---|---|---|---|---|---|
| 1163.4 | −0.1243 | 0.159 | −0.2615 | 860.99 | 0.1792 |
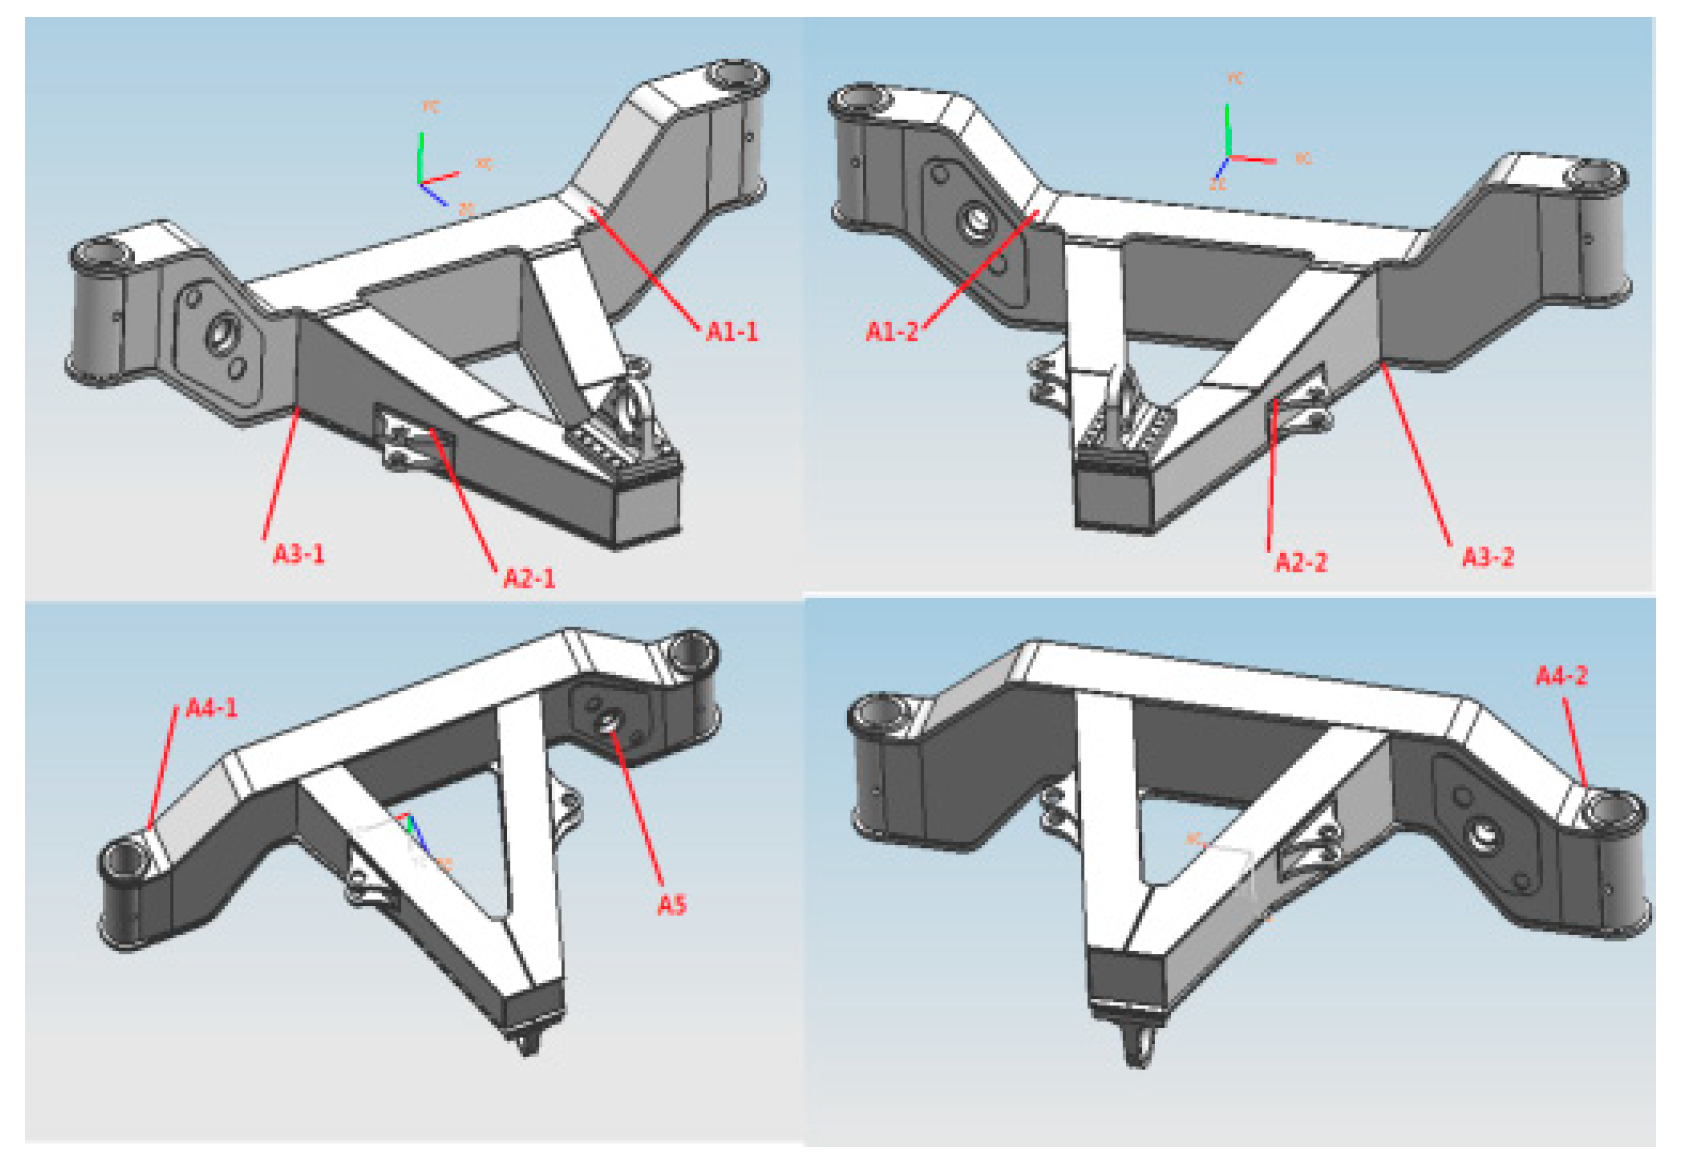
| A1-1 | A1-2 | A2-1 | A2-2 | A3-1 | A3-2 | A4-1 | A4-2 | A5 | |
|---|---|---|---|---|---|---|---|---|---|
| Simulated stress | 101 | 117 | 79 | 98 | 333 | 301 | 75 | 81 | 109 |
| Tested stress | 92 | 105 | 71 | 92 | 316 | 285 | 69 | 78 | 97 |
| Error | 9.8% | 11.4% | 11.3% | 6.5% | 5.4% | 5.6% | 8.7% | 5.1% | 12.4% |
| Run Counter | (mm) | (mm) | (mm) | (MPa) | (×105N) | (×105N) | (×105N) | (×105N) | |||
|---|---|---|---|---|---|---|---|---|---|---|---|
| 1 | 0 | 18 | 27 | 1311.8 | −0.0995 | 0.119 | −0.2788 | −1.89 | 0.86 | 1.01 | −3.83 |
| 2 | 10 | 22 | 31 | 1098.1 | −0.1287 | 0.169 | −0.3002 | −1.96 | 1.02 | 0.88 | −3.66 |
| 3 | 20 | 16 | 29 | 1430.5 | −0.1313 | 0.197 | −0.2228 | −1.65 | 1.07 | 0.81 | −5.01 |
| 4 | 30 | 24 | 35 | 1003.1 | −0.1135 | 0.168 | −0.2575 | −1.85 | 1.18 | 1.14 | −4.07 |
| 5 | 40 | 19 | 36 | 1193.1 | −0.1376 | 0.125 | −0.3242 | −1.87 | 0.99 | 0.95 | −4.43 |
| 6 | 50 | 15 | 26 | 1169.3 | −0.1439 | 0.132 | −0.2067 | −2.04 | 1.11 | 1.31 | −4.03 |
| 7 | 60 | 21 | 37 | 1406.8 | −0.1414 | 0.187 | −0.2362 | −1.81 | 0.92 | 1.01 | −4.28 |
| 8 | 70 | 20 | 34 | 920.0 | −0.0982 | 0.189 | −0.2815 | −2.25 | 1.22 | 1.03 | −4.97 |
| 9 | 80 | 17 | 35 | 1371.2 | −0.1351 | 0.155 | −0.2468 | −2.49 | 0.83 | 1.06 | −3.29 |
| … | … | … | … | … | … | … | … | … | … | … | |
| 50 | 100 | 23 | 38 | 1121.85 | −0.1300 | 0.164 | −0.2175 | −2.22 | 0.84 | 0.84 | −4.93 |
(mm) | (mm) | (mm) | (MPa) | (×105N) | (×105N) | (×105N) | (×105N) | Lifetime (Cycles) | Weight (kg) | ||||
|---|---|---|---|---|---|---|---|---|---|---|---|---|---|
| initial | 0 | 20 | 32 | 1163.4 | −0.1243 | 0.159 | −0.2615 | −2.03 | 1.05 | 1.06 | 4.01 | 11203 | 4135 |
| optimized | 40 | 24 | 27 | 1381.1 | −0.1393 | 0.189 | −0.2956 | 1.84 | 0.89 | 0.93 | −3.32 | 240180 | 3797 |
© 2019 by the authors. Licensee MDPI, Basel, Switzerland. This article is an open access article distributed under the terms and conditions of the Creative Commons Attribution (CC BY) license (http://creativecommons.org/licenses/by/4.0/).
Share and Cite
Mi, C.; Li, W.; Xiao, X.; Jian, H.; Gu, Z.; Berto, F. Lifetime Assessment and Optimization of a Welded A-Type Frame in a Mining Truck Considering Uncertainties of Material Properties and Structural Geometry and Load. Appl. Sci. 2019, 9, 918. https://doi.org/10.3390/app9050918
Mi C, Li W, Xiao X, Jian H, Gu Z, Berto F. Lifetime Assessment and Optimization of a Welded A-Type Frame in a Mining Truck Considering Uncertainties of Material Properties and Structural Geometry and Load. Applied Sciences. 2019; 9(5):918. https://doi.org/10.3390/app9050918
Chicago/Turabian StyleMi, Chengji, Wentai Li, Xuewen Xiao, Haigen Jian, Zhengqi Gu, and Filippo Berto. 2019. "Lifetime Assessment and Optimization of a Welded A-Type Frame in a Mining Truck Considering Uncertainties of Material Properties and Structural Geometry and Load" Applied Sciences 9, no. 5: 918. https://doi.org/10.3390/app9050918
APA StyleMi, C., Li, W., Xiao, X., Jian, H., Gu, Z., & Berto, F. (2019). Lifetime Assessment and Optimization of a Welded A-Type Frame in a Mining Truck Considering Uncertainties of Material Properties and Structural Geometry and Load. Applied Sciences, 9(5), 918. https://doi.org/10.3390/app9050918