Article

Influence of Initial Phase Modulation on the Sensitivity of the Optical Fiber Sagnac Acoustic Emission Sensor

1
State Key Laboratory of Mechanics and Control of Mechanical Structures, Nanjing University of Aeronautics and Astronautics, Nanjing 210016, China
2
College of Electrical and Information Engineering, Anhui University of Technology, Maanshan 243002, China
*
Author to whom correspondence should be addressed.
Appl. Sci. 2019, 9(5), 1018; https://doi.org/10.3390/app9051018
Submission received: 26 January 2019 / Revised: 1 March 2019 / Accepted: 6 March 2019 / Published: 12 March 2019
(This article belongs to the Special Issue Recent Progress in Fiber Optic Sensors: Bringing Light to Measurement)

Abstract

:
Improving the phase sensitivity of the optical fiber Sagnac sensor is very important for accurately detecting weak signals of acoustic emission. Theoretical analysis shows that the initial phase of the sensor is π under ideal conditions, and the maximum phase sensitivity is obtained when the bias phase is π/2. In this work, an experimental system was built with an aluminum alloy plate as the experimental object. The initial phase of the sensor was modulated by a Y-branch waveguide, and the fitting curve of the experimental data was in good agreement with the curve of the numerical simulation. Moreover, our experiments show there was a single value for the bias phase of π/2, which significantly deviated from the theoretical value. The results show that the greatest phase sensitivity of the sensor not only could be increased by nearly nine times through modulating the initial phase, but also could suppress the harmonic interferences in the sensing system. This study can provide a useful reference for improving the phase sensitivity of the optical fiber Sagnac AE sensor in practical applications.

1. Introduction

Acoustic emission (AE) is a class of phenomena whereby transient elastic waves are generated by the rapid release of energy from a localized source or sources within a solid material [1,2], which also exists in the situation of partial discharge [3,4]. If AE signals can be detected and located by sensors, their accurate position can be provided for damage evaluation and timely repair of the equipment [5,6,7,8]. Therefore, many efforts have been made to develop various sensors for detecting AE signals [9,10].
The conventional piezoelectric transducers (PZT) have been widely used for detecting AE signals, because of their high detecting frequency, high sensitivity, and low cost [11,12]. However, some deficiencies such as susceptibility to electromagnetic interference (EMI) and complex installation, limit their applications in many conditions. In recent years, optical fiber sensors have undergone rapid development in AE signal detection because of their advantages, such as small size, light weight, remote sensing, efficiency at high temperature, etc. [13,14]. Read et al. [15] and Fu et al. [16] used optical fiber AE sensors to detect damages in composite structures. Matsuo et al. [17] reported an optical fiber AE system based on the Mach–Zender interferometer sensor for monitoring molten salt attacks. Zhao et al. [18] employed the fiber-optic Fabry–Perot sensor to detect the simulated AE signals generated from impact and pencil-lead breaks. Wang et al. [19] developed a detection system for partial discharges using the fiber optic Sagnac sensor. In addition, fiber Bragg grating (FBG) sensors have been adopted for AE monitoring in aluminum alloy material structures and delaminated glass fiber-reinforced epoxy (GFRP) composites [20,21]. These studies show fiber optic sensors have some merits of corrosion resistance, EMI immunity, embeddability, and so on, which are very suitable for detecting AE signals.
Among the optical fiber sensors, the optical fiber Sagnac sensor combines the Sagnac effect with optical fiber sensing technology, thus presenting not only the characteristics of optical fiber sensors but also the advantages of good reciprocity and low requirement for light sources. Moreover, Fomitchov et al. reported that the optical fiber Sagnac AE sensor has a higher detecting frequency of more than 3 MHz and is affected by the loop length difference of Sagnac interferometers [22]. Zhang et al. pointed out that the optical fiber Sagnac sensor has a wide frequency response range in the detection of AE signals [23].
It is very important to improve the sensitivity of the optical fiber Sagnac AE sensor, especially in situations where AE signals are comparatively weak, such as the initial stage of partial discharges, slow crack growth of materials, and higher background noises. Therefore, the non-reciprocal phase shifts generated by AE signals are quite small. Currently, there are a few techniques which can improve the sensitivity of the optical fiber Sagnac AE sensor, such as selecting a light source with greater power or increasing the length of sensing fiber [24]. But these have a high cost and bring difficulties in sensor miniaturization. Another way to improve the sensitivity is phase modulation of the sensor. Jang et al. [25] showed that the sensitivity of surface-bonded fiber optic Sagnac AE sensors is almost twice that of noncontact-type fiber sensors. Fomitchov et al. [22] also found that optimum sensitivity can be obtained if the initial phase of the optical fiber Sagnac AE sensor is π/2. Jang et al. [26] and Liang et al. [27] modulated the initial phase of the sensor using a PZT phase controller, but the modulation frequency was no more than 100 kHz and was only modulated by sinusoidal signals. Another problem in these studies is that the influence of the 2 × 2 single-mode fiber coupler on the initial phase was not reported.
In this paper, attention is focused on the improvement of the phase sensitivity of the optical fiber Sagnac AE sensor. The influence of the initial phase modulation on the phase sensitivity was analyzed theoretically, and the relationship between them in an ideal case was obtained by numerical simulations. An experimental system was built on this basis, and then the initial phase of the sensor was modulated by a Y-branch waveguide, which is an excellent integrated optical device with the functions of a polarizer, a coupler, and two wideband phase modulators. Our work shows the fitting curve of the experimental data is in good agreement with the results of numerical simulation. The results show that the initial phase of the sensor is not π because of the influence of the 2 × 2 single-mode fiber coupler, and the greatest phase sensitivity can be acquired, with approximately a nine-fold increase, when the initial phase is modulated close to 3π/2, whilst decreasing the harmonic interferences dramatically.

2. Theoretical Analysis

2.1. Relationship between the Initial Phase and the Phase Sensitivity

The structure of the optical fiber Sagnac AE sensor is shown in Figure 1. It is composed of a light source, a sensing probe, a 3 dB coupler, a polarization controller, a fiber delay coil, a photo-detector (PD), and a data acquisition card (DAQ). The light beam from the source is coupled into a single-mode fiber and is then split into clockwise (CW) beam 3 and counter-clockwise (CCW) beam 4 at port 1 by a 3 dB coupler. The two reverse propagating light beams will arrive at the PD after passing through the sensing probe, polarization controller, and delay coil. Ideally, there is no interference if the sensing probe is not affected by external signals.
When the sensing probe bonded on the surface of the structure is affected by the ultrasonic waves generated by AE, the phase of the two light beams passing through the sensing probe will be modulated, which will result in a non-reciprocal phase shift. If there is no loss during the propagation of light and the power-coupling coefficient of the coupler is the ideal value 0.5, then the two optical fields denoted by E CW and E CCW respectively, at the PD, can be expressed as
E CW = 0.5 E 0 exp { j [ ω t + ϕ CW ϕ s ( t t 1 ) ] }
E CCW = 0.5 E 0 exp { j [ ω t + ϕ CCW ϕ s ( t t 2 ) ] }
where E 0 is the amplitude of the light field produced by the light source, ω is the angular frequency of the light waves, and ϕ CW and ϕ CCW are the initial phases of CW and CCW light beams at the coupler, respectively; ϕ s ( t t 1 ) and ϕ s ( t t 2 ) are the phase changes of CW and CCW light beams at the sensing probe caused by ultrasonic waves, respectively; t 1 and t 2 are the times needed for the two light beams to return from the sensing probe to the PD through CW and CCW, respectively. The synthetic intensity of the two light beams at the PD can be expressed as
I D = ( E CCW + E CCW ) · ( E CW + E CCW ) * = 0.5 I 0 [ 1 + cos ( ϕ 0 + Δ ϕ s ) ]
where ϕ 0 = ϕ CW ϕ CCW is the initial phase difference of the sensor, Δ ϕ s = ϕ s ( t t 1 ) ϕ s ( t t 2 ) represents the non-reciprocal phase difference caused by ultrasonic waves, and I 0 = E 0 2 is the light intensity of the light source.
Assuming the phase change by ultrasonic waves at the sensing probe is given by
ϕ s ( t ) = ϕ s 0 cos ω u t
where ϕ s 0 is the amplitude of phase change, ω u is the angular frequency of ultrasonic waves, Δ ϕ s can be expressed as
Δ ϕ s = ϕ s 0 cos ω u ( t t 1 ) ϕ s 0 cos ω u ( t t 2 ) = 2 ϕ s 0 sin ω u ( t t 1 + t 2 2 ) sin ω u ( t 1 t 2 2 )
Because of the existence of the delay coil, therein t 1 > > t 2
t 1 + t 2 t 1 t 2 = L d / c = Δ τ
where L d is the length of fiber delay coil, c is the propagation velocity of the light in the optical fiber.
Equation (5) can be expressed as
Δ ϕ s = 2 ϕ s 0 sin ω u ( t Δ τ 2 ) sin ω u ( Δ τ 2 )
As shown in Figure 1, the propagation path of the CW light beam is Port 1 → Port 3 → fiber optic ring → Port 4 → Port 2, and there is no coupling in this progress. The propagation path of the CCW light beam is Port 1 → Port 4 → fiber optic ring → Port 3 → Port 2, which is coupled twice at the 3 dB coupler, and each of them introduces a π / 2 phase shift. So, the initial phase difference between the two light beams at the PD is ϕ 0 = π / 2 + π / 2 = π .
From Equations (3) and (7), the phase sensitivity denoted by S ϕ can be obtained:
S ϕ = d I D d Δ ϕ s = d ( 0.5 I 0 cos ( π + Δ ϕ s ) ) d Δ ϕ s = 0.5 I 0 sin Δ ϕ s
It can be found that the phase sensitivity of the sensor is very small because Δ ϕ s produced by AE signals is small in general. Therefore, it is difficult to detect AE signals effectively.
If a bias phase Δ ϕ is introduced into the sensor, then
I D = 0.5 I 0 ( 1 + cos ( Δ ϕ + π + Δ ϕ s ) ) = 0.5 I 0 ( 1 + sin Δ ϕ sin Δ ϕ s cos Δ ϕ cos Δ ϕ s )
When Δ ϕ = π / 2 , the initial phase will be modulated to ϕ 0 = π + π / 2 = 3 π / 2 , and the phase sensitivity can be expressed as
S ϕ = d I D d Δ ϕ s = 0.5 I 0 cos Δ ϕ s
Therefore, the smaller the non-reciprocity phase shift caused by AE signals is, the greater the phase sensitivity will be. This is helpful for detecting weak AE signals.

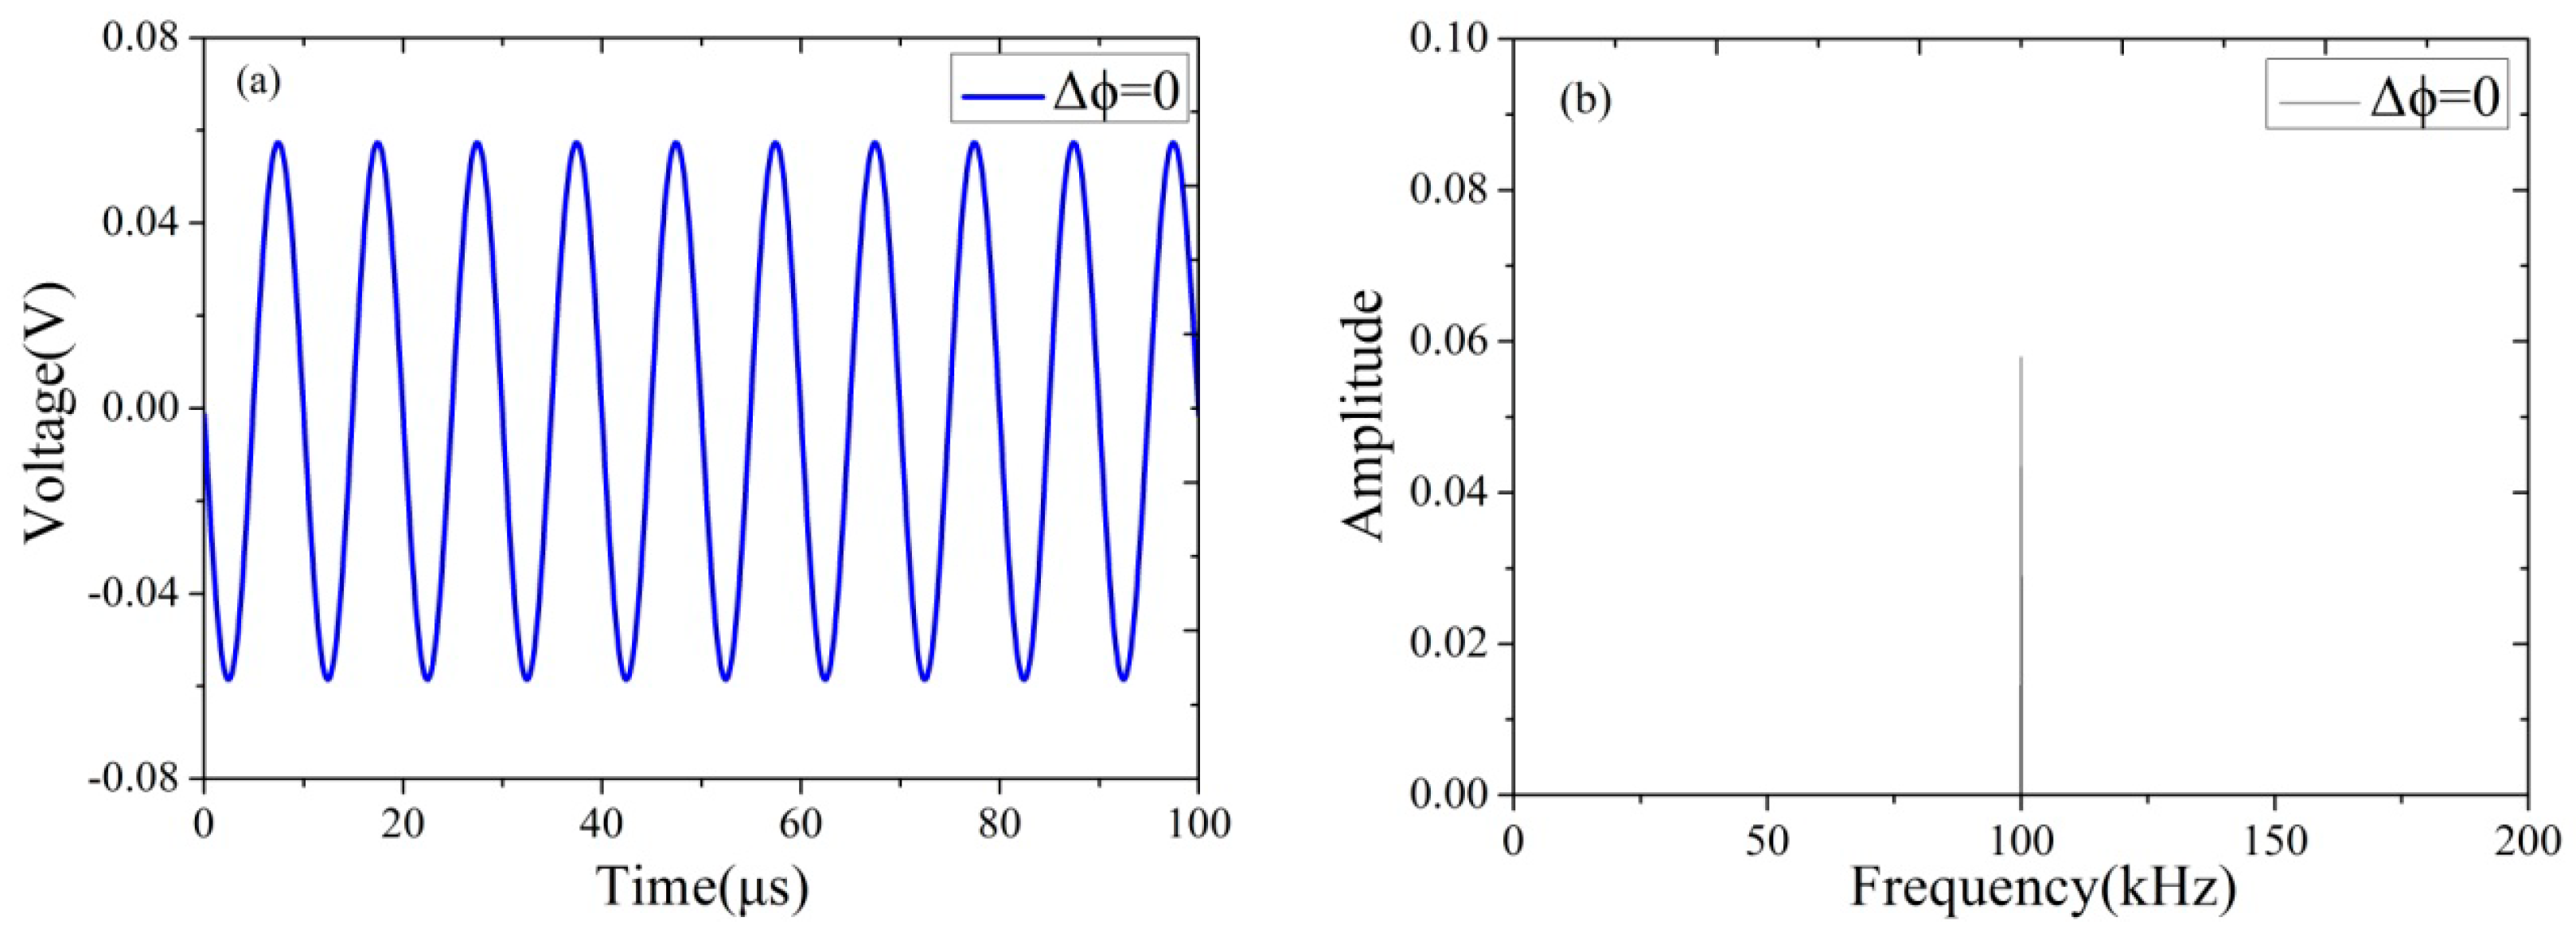
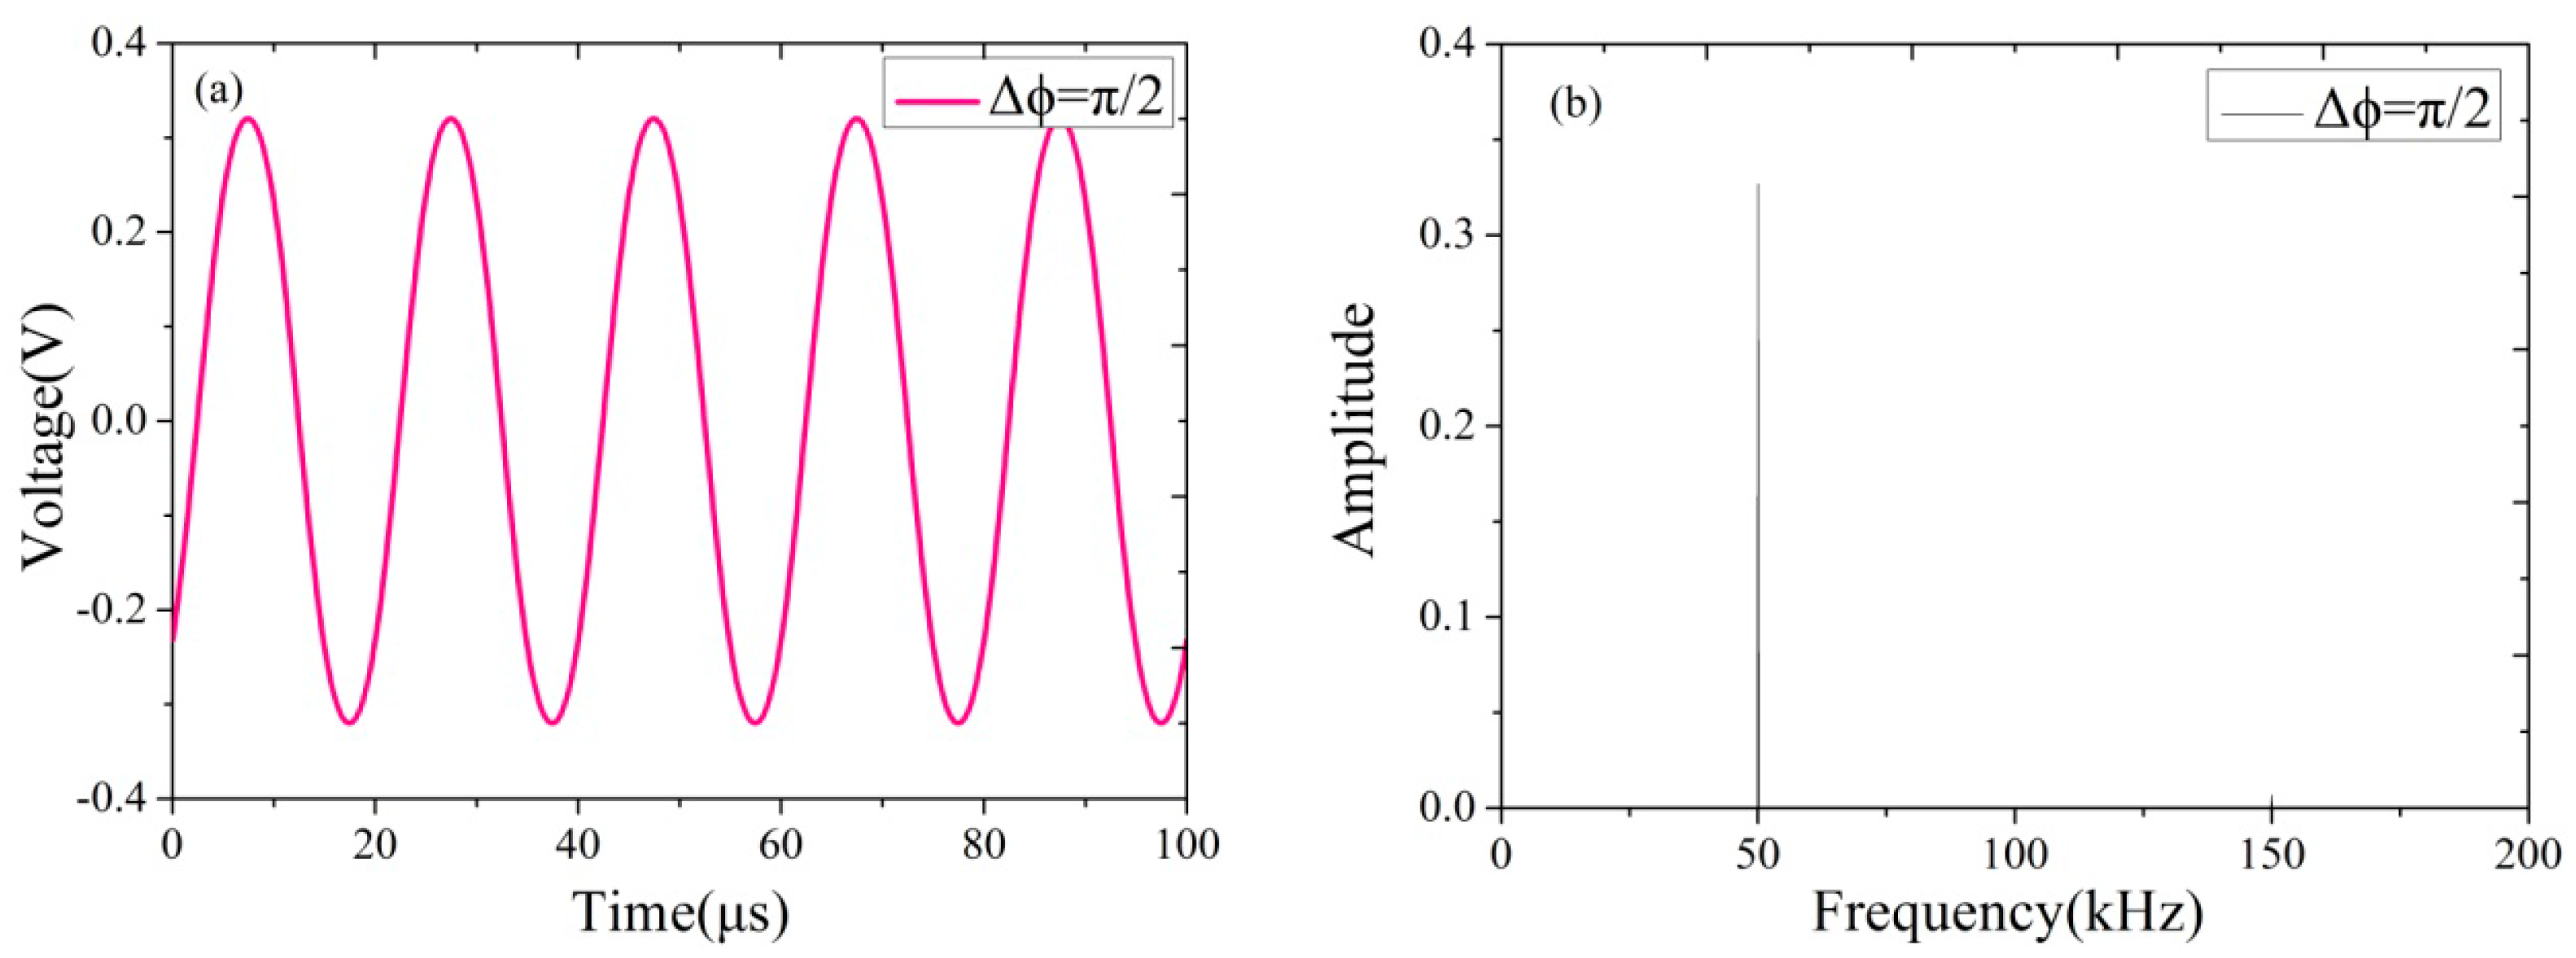
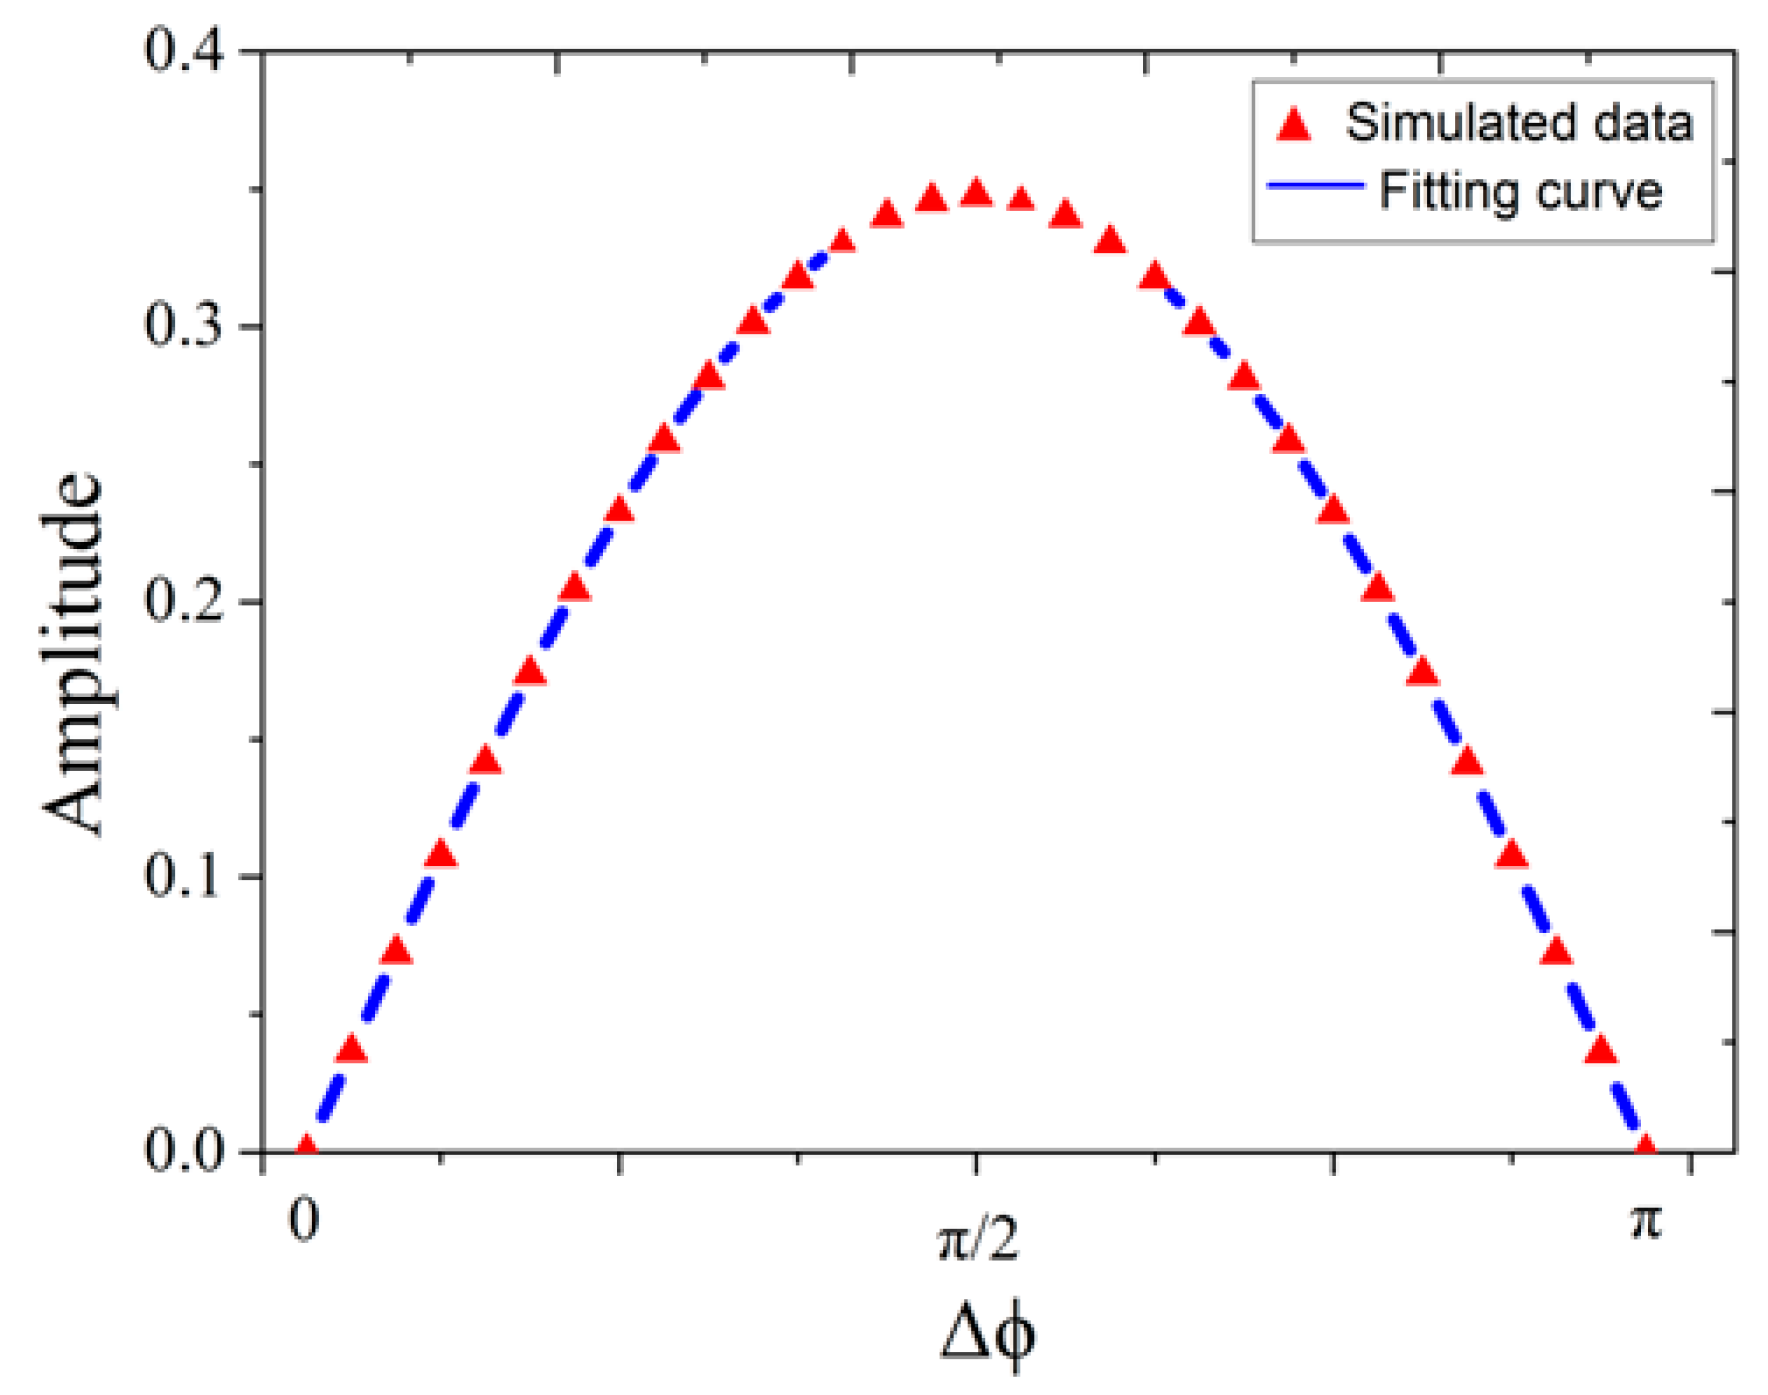
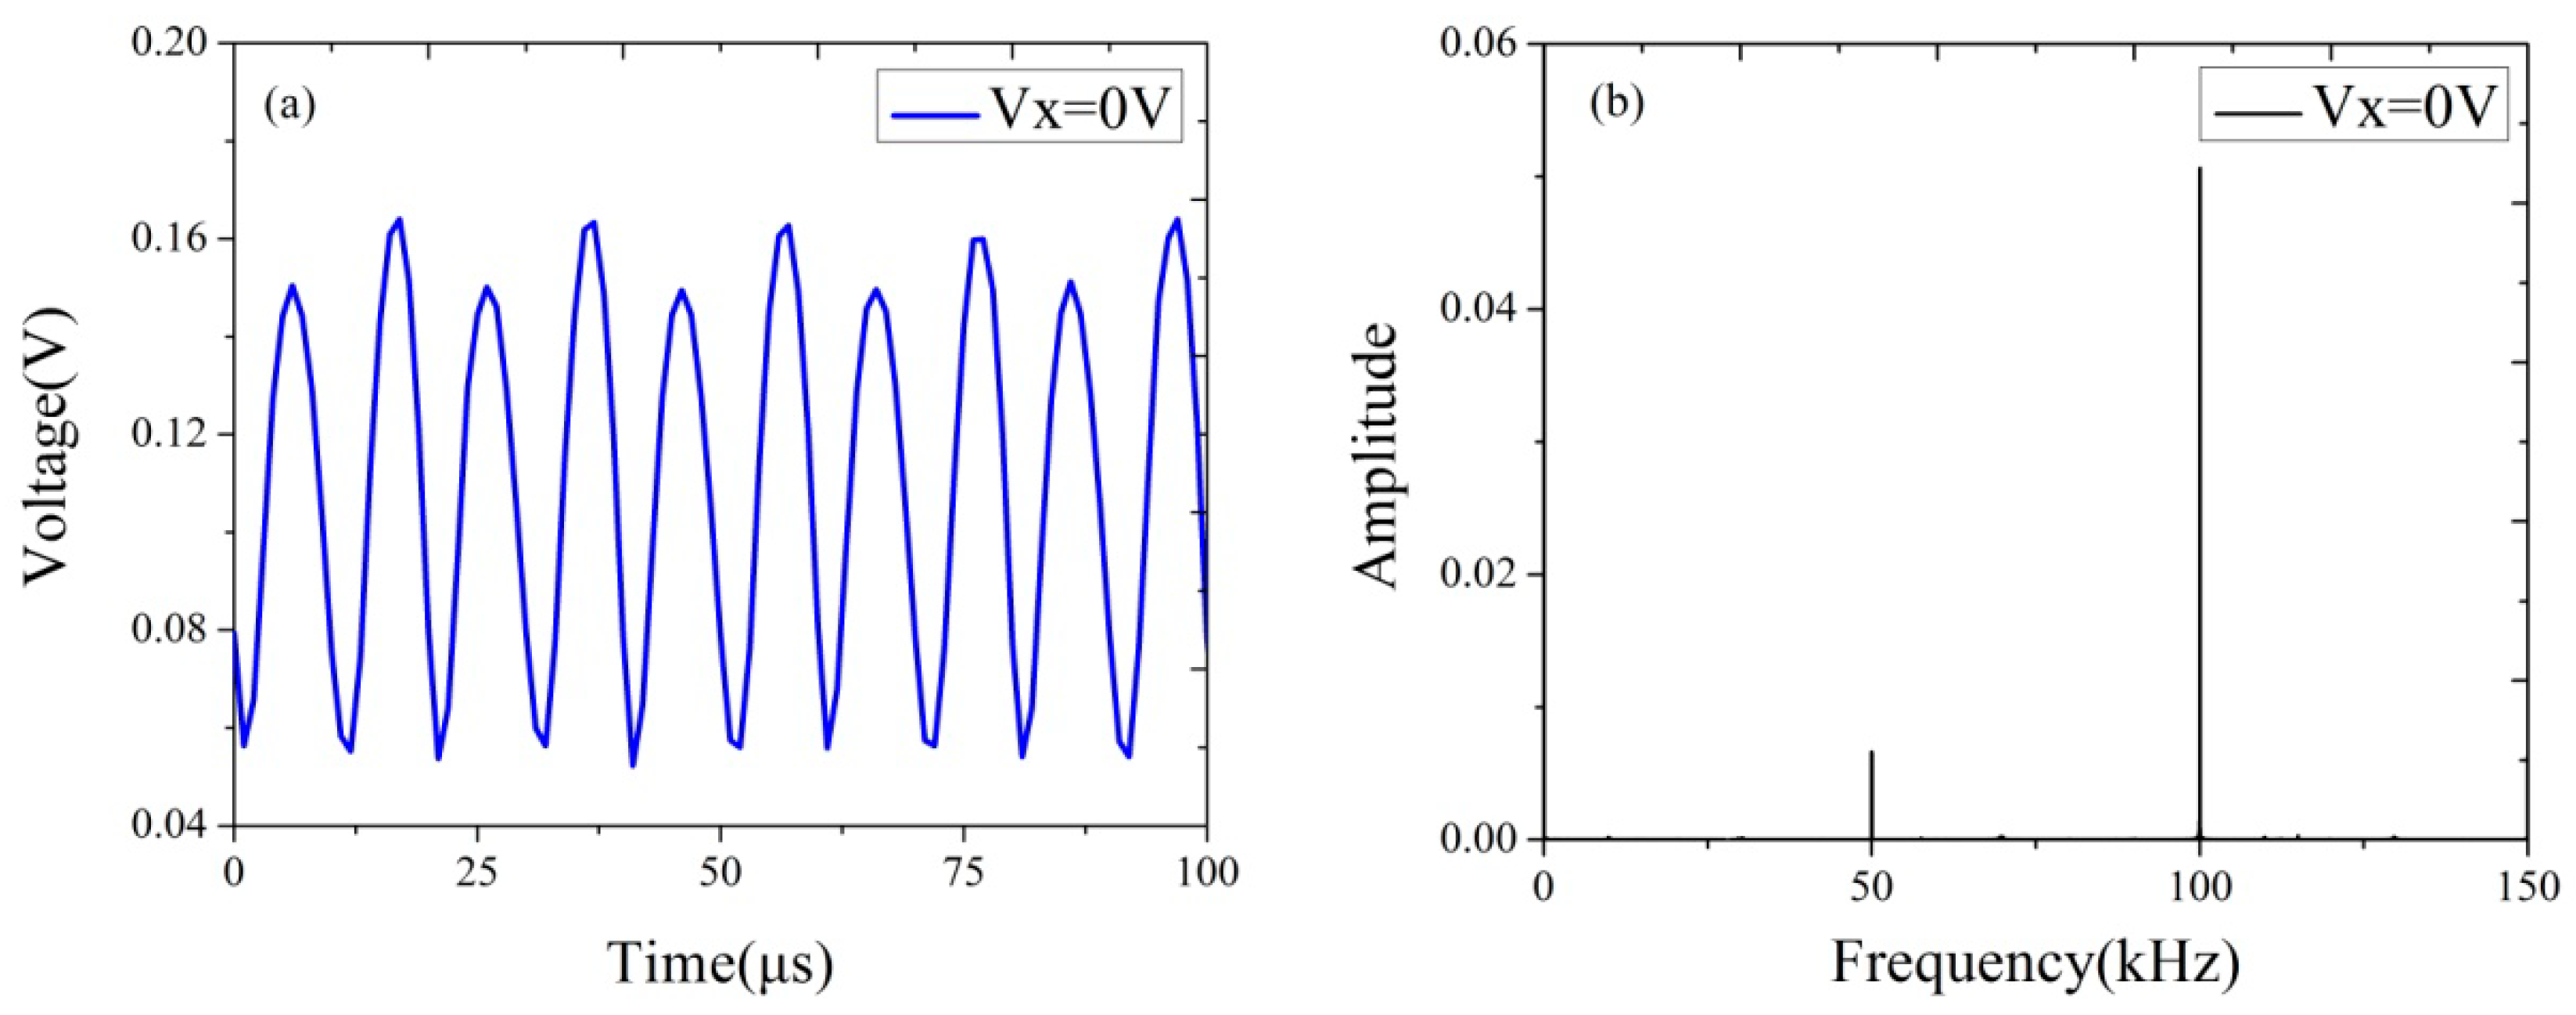
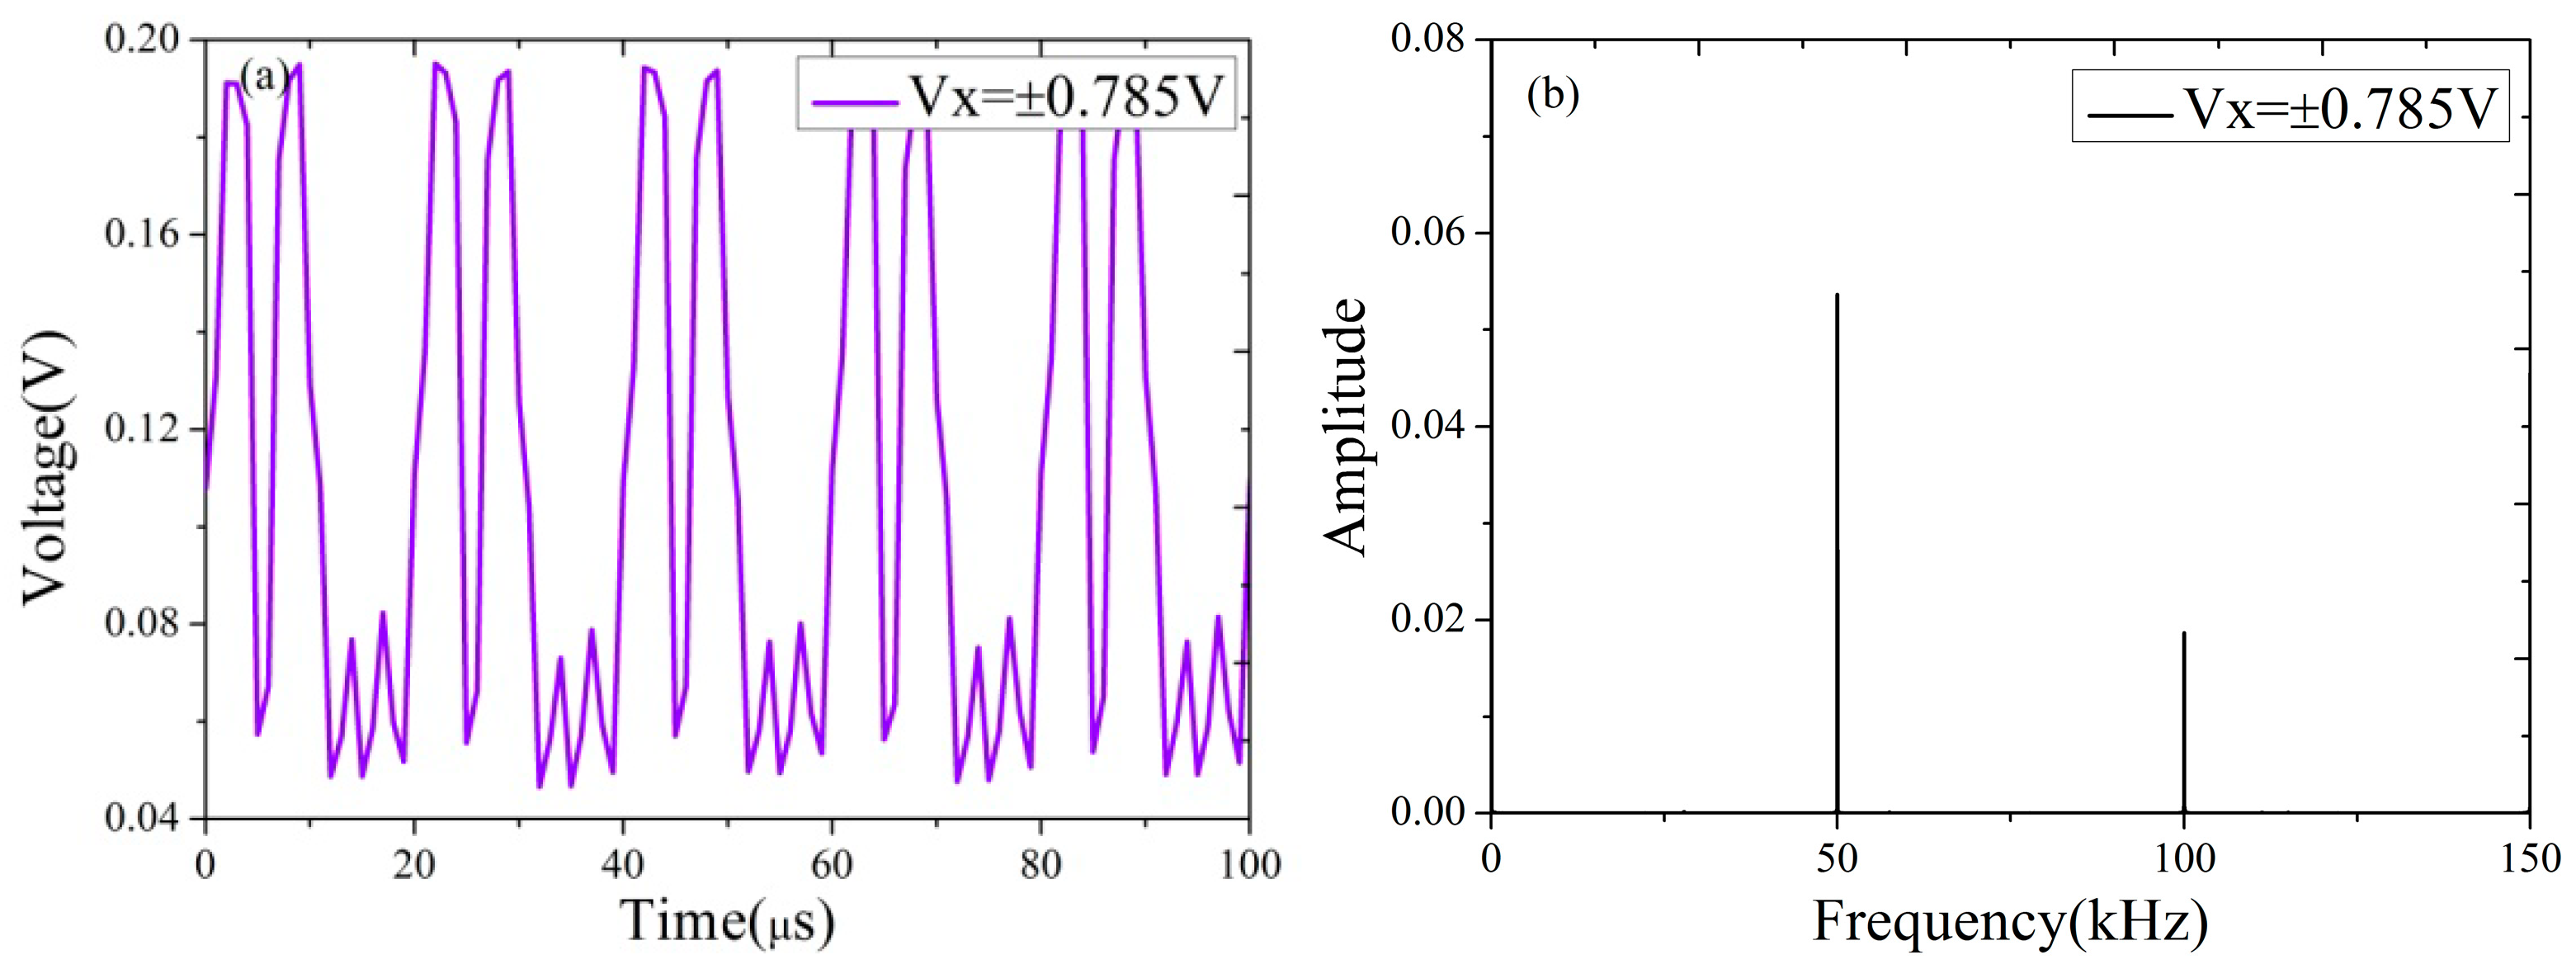
2.2. Numerical Simulation

In order to validate the theoretical analysis and set up the corresponding experimental device, numerical simulations were implemented. In the simulations, the effect of Δ ϕ is the main consideration for the output voltage of the sensor. In this work, I 0 = 1 , ϕ s 0 = 0.5 , ϕ 0 = π , and k = 1 , which represents the conversion coefficient between the light intensity and the output voltage in the sensing system. The frequency of ultrasonic waves was 50 kHz, the length of the delay coil was 1000 m, and c = 2.045 × 10 8   m / s (the effective refractive index of a single-mode quartz crystal fiber is n eff = 1.467 ).
Figure 2 shows the waveform of the output voltage and its corresponding frequency spectrum in initial status. It can be seen that the frequency was 100 kHz, while the frequency of 50 kHz could not be observed, and the amplitude of voltage was relatively small. Figure 3 is the waveform of the output voltage and its corresponding frequency spectrum when a bias phase of Δ ϕ = π / 2 was introduced into the sensor. It can be seen that the waveform presents a regular sinusoidal characteristic, the amplitude of voltage was increased more than six times, and the frequency spectrum shows that the frequency of 50 kHz was detected accurately. It is also evident that there is a third harmonic component, but it had little effect on the fundamental component. From Figure 2 and Figure 3, it can be seen that the voltage was increased effectively, which means the phase sensitivity of the sensor improved, and the results of the theoretical analysis were validated.
To investigate the influence of phase modulation on phase sensitivity, an interval of π / 30 within Δ ϕ [ 0 , π ] was adopted in the numerical simulations. The relationship between the amplitude of the output fundamental voltage and Δ ϕ is shown in Figure 4. It can be seen that there is a characteristic of sinusoidal function between the bias phase and the output fundamental voltage. The phase sensitivity was the largest when the bias phase was Δ ϕ = π / 2 and it was the smallest when the bias phase was Δ ϕ = 0 , π .

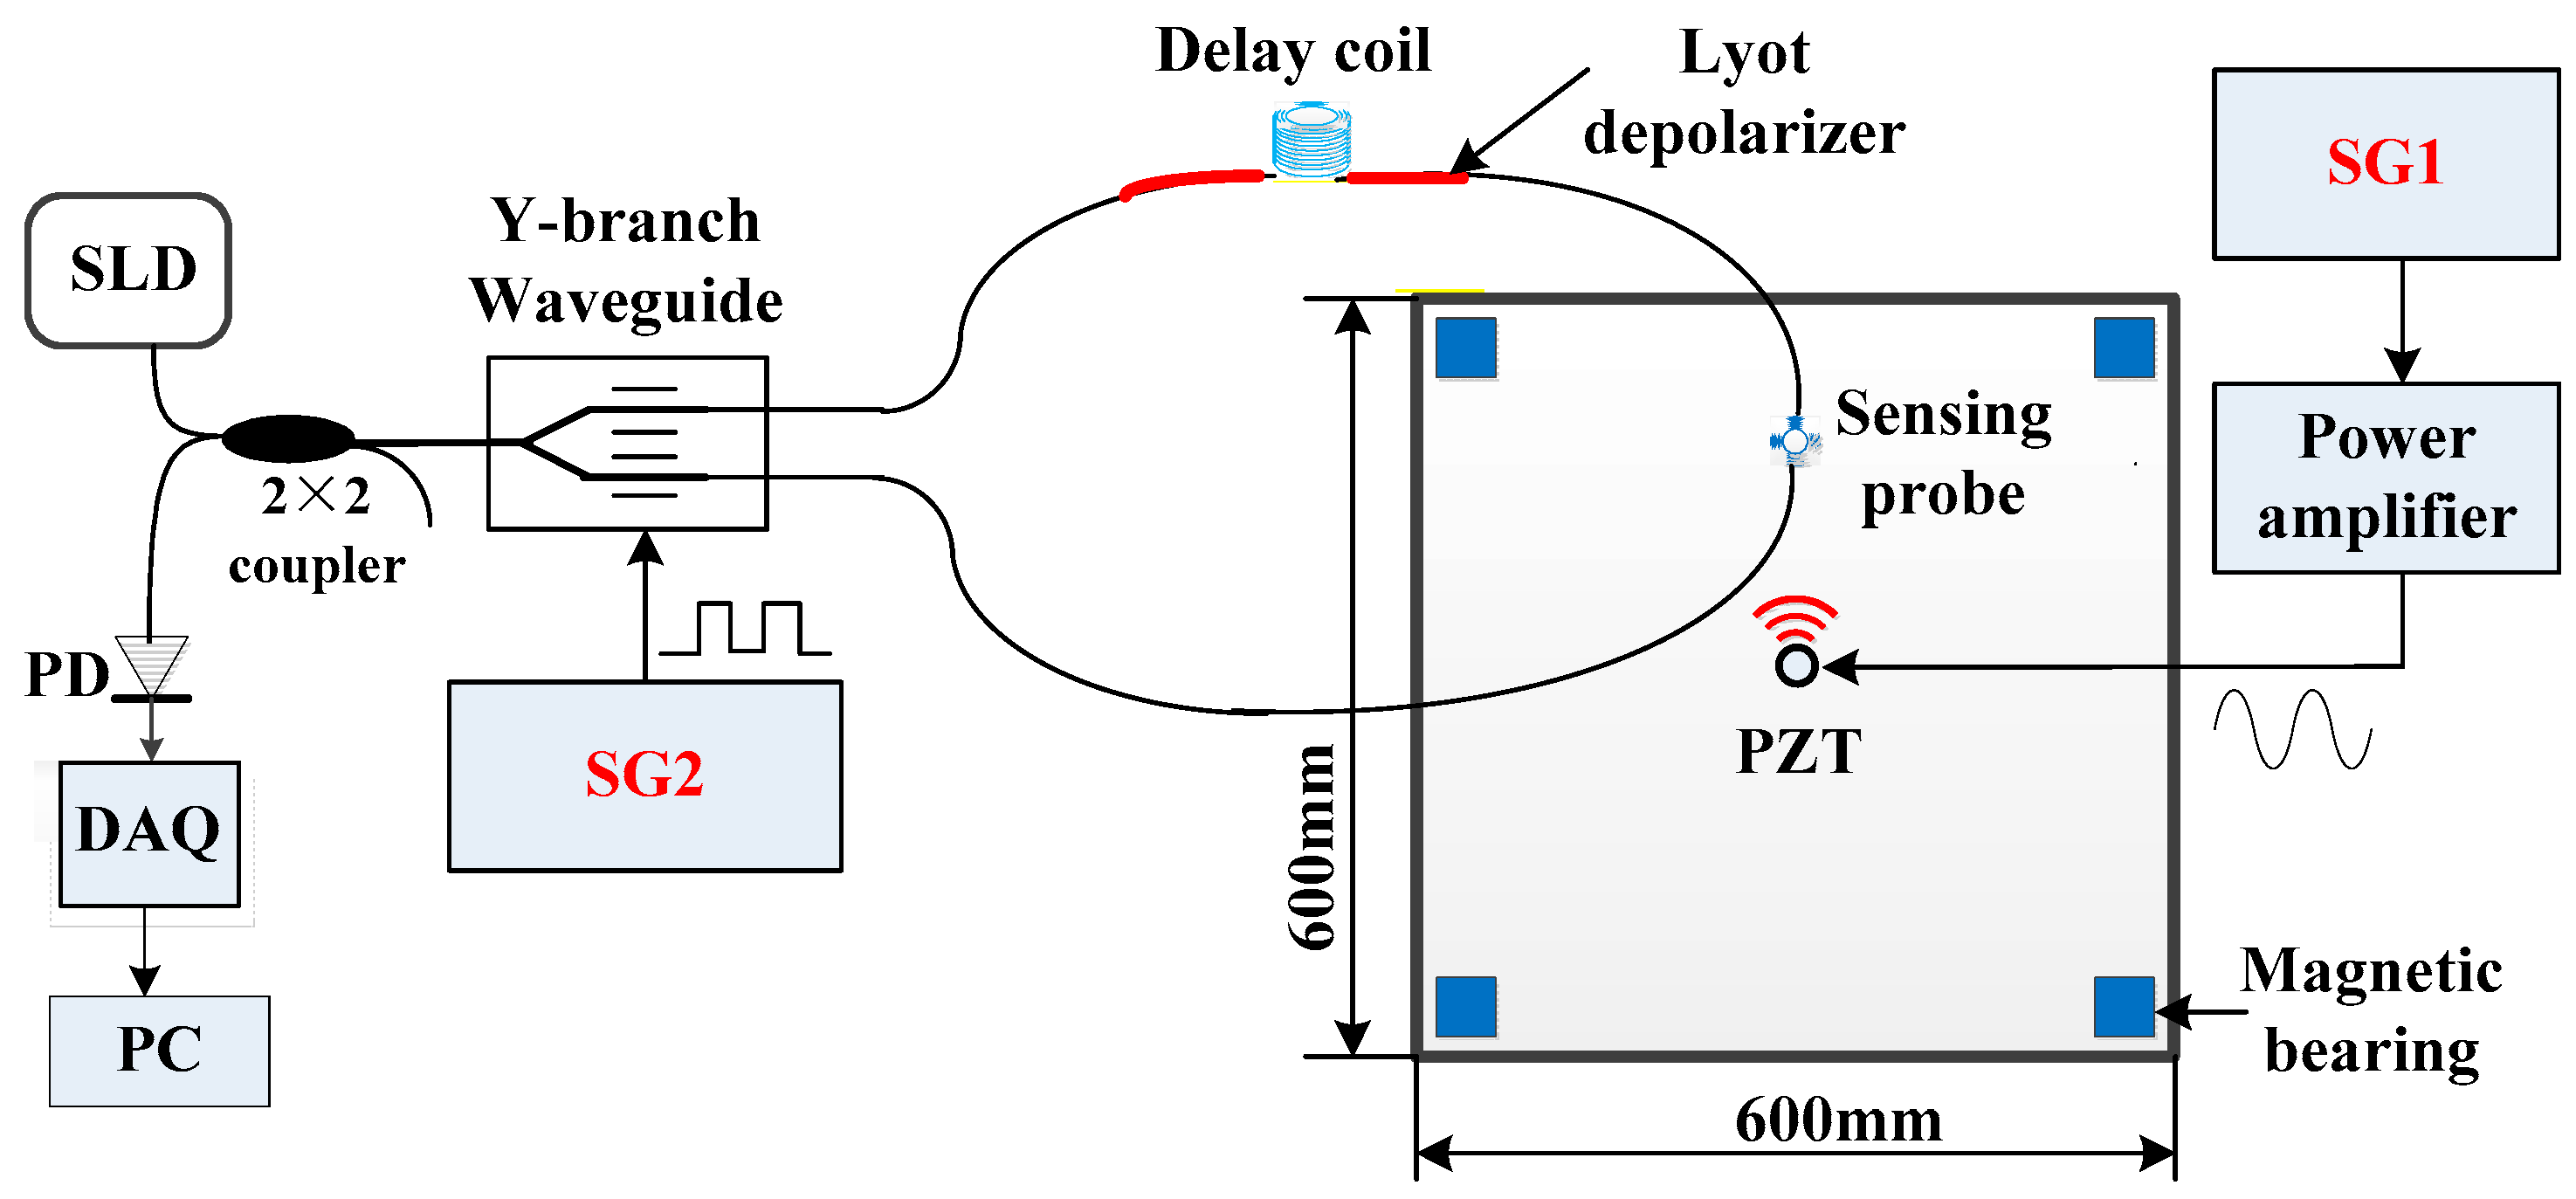
3. Experimental Setup

The phase modulation experimental system of the optical fiber Sagnac AE sensor is shown in Figure 5. It includes a super luminescent diode (SLD) light source, a delay coil, a Lyot-type depolarizer, a sensing probe, a photo-detector, a DAQ and a computer. The central wavelength of the SLD was 1295 ± 20 nm with a power of 1.6 mW. The PD had a voltage responsivity of 50 V/W and a response time of 1.5 ns. The DAQ was NI USB-6366 with a highest sampling frequency of 2 MHz. SG1 and SG2 were the signal generators (Agilent 33500B, made by Agilent Technologies Inc., State of California, USA) used for simulating AE signals and modulating the initial phase, respectively. An aluminum alloy plate was selected as an object, which was fixed on the seismic metal test platform by four magnetic bearings, whose dimensions were 600 mm × 600 mm × 2 mm. The sensing probe was made of a skeleton of light hollow aluminum ring with an outer diameter of 15 mm and height of 20 mm. A short piece of single-mode fiber with the length of 3 m was wound around the skeleton. Ultraviolet glue was used to hold the fiber and prevent it from falling off the skeleton. In this experiment, the sensing probe was bonded on the plate by epoxy adhesive with the coordinates of (300 mm, 450 mm). It is difficult to ensure the production of stable and controllable signals in simulating wideband AE signals by using general methods, such as pencil-lead breaks and impact. The main purpose of this work was to investigate the changes of the sensor’s sensitivity in the initial phase modulation using a constant stimulation. Therefore, a PZT attached on the plate with the coordinates of (300 mm, 300 mm) was used for simulating AE signals.
The output voltages of the PD with eight-fold reversed amplification were transferred to the computer by the DAQ. The splitting ratio of the 2 × 2 coupler used in this experiment was 53:47, and the insertion losses of port 3 and port 4 were 2.91 dBm and 3.58 dBm, respectively. The delay coil was wound by a single-mode fiber with the wavelength of 1310 nm. The velocity of the light was c = 2.045 × 10 8   m / s , so the intrinsic frequency of the sensor was f 0 = 1 / ( 2 τ ) 100   kHz . The Y-branch waveguide was PMD1338-M, whose half-wave voltage was 3.14 V, center wavelength was 1310 nm, splitting ratio was 50.2:49.8, and insertion loss was 2.95 dB. The phase change produced by Y-branch waveguide modulation can be expressed as
Δ ϕ ( t ) = π V x V π
where V x is the modulation voltage loaded on the Y-branch waveguide and V π is the half-wave voltage when the change of phase modulation is Δ ϕ = π .

4. Experimental Results and Discussion

The experiments were carried out at 20 °C in order to ensure the reduction of the influence of temperature. Sinusoidal waves with the amplitude of 5 V and the frequency of ω u / 2 π = 50   kHz produced by the signal generator after 10-fold amplification were used for exciting the PZT as AE sources. The sampling frequency of the DAQ was set to 1 MHz. The data were recorded in each experiment when the output voltage of the sensing system was stable.
Figure 6 shows the output voltage waveform and the corresponding frequency spectrum of the fiber optic Sagnac sensing system under the action of AE signals in the initial status. As shown in Figure 6a, the amplitude of the voltage was about 0.11 V, but the waveform did not have a regular sinusoidal shape, which means there were harmonic interferences. The frequency spectrum in Figure 6b shows that the sensor can correctly recognize AE signals with a frequency of 50 kHz. However, the ratio of the amplitude of fundamental waves to that of second-harmonic waves was only 0.13, which indicates that the harmonic interferences were relatively high and therefore affected the sensor in detecting AE signals effectively.
The square wave modulation voltage generated by SG1 was V x = ± 0.785   V and was applied to the Y-branch waveguide, which means that a bias phase of Δ ϕ = π / 2 was introduced into the sensor. The output voltage waveform and the corresponding frequency spectrum are shown in Figure 7. It can be seen from Figure 7a that the amplitude of the output voltage improved, but it is difficult to accurately identify useful features because the signals were obviously affected by the phase modulation. Compared with Figure 6b, the amplitude of fundamental voltage in Figure 7b improved by more than seven times, from 0.0066 to 0.0537, while the amplitude of second-harmonic voltage was reduced by nearly two times, from 0.0506 to 0.0187. Considering the same experimental conditions, the amplitude of the fundamental voltage increased obviously, which demonstrates that the phase sensitivity was greatly improved.
In order to investigate the influence of phase modulation on phase sensitivity in a larger range, a series of square-wave voltages from V x = 0   V to V x = ± 1.5   V with a step of Δ V x = ± 0.1   V were applied on the Y-branch waveguide to change the initial phase of the sensor. The relationship between VX and the corresponding amplitude of fundamental voltages is shown in Table 1. It can be seen that the amplitude of the fundamental voltage increased continuously with the increase of VX, when VX was less than or equal to ± 0.7   V , whereas it decreased when VX was greater than ± 0.7   V . The main reason is that the half-wave voltage of the Y-branch waveguide was 3.14 V, and the bias phase introduced into the sensor was quite close to π/2 when VX was equal to ± 0.7   V . It can be seen from the experimental results that the maximum phase sensitivity could be increased nearly nine times when the initial phase of the sensor was modulated.
Figure 8 shows a corresponding fitting curve based on the experimental data in Table 1, with two additional data points of V x = ± 0.785   V and V x = ± 1.57   V , where the amplitude of the fundamental voltages were 0.05365 and 0.01302, respectively. The results indicate the fitting equation can be described by y = 0.02612 + 0.003564 * sin [ π * ( x 0.17962 ) / 1.0695 ] with a decision coefficient R 2 of 0.99345. It was found that the experimental fitting curve was in good agreement with the numerical simulation curve shown in Figure 4, which confirms the validity of the experimental results. It can be seen from the experimental results that the maximum phase sensitivity of the sensor cold be increased nearly nine times when the initial phase of the sensor was modulated.
As shown in Figure 8, it can be seen that the maximum phase sensitivity of the sensor did not correspond to V x = ± 0.785   V , and the minimum value did not correspond either to V x = 0   V or to V x = ± 1.57   V . The main reason is that the insertion loss in the 2 × 2 coupler and the power-coupling coefficient was not 0.5, which led to a left deviation of 3π/25 on the experimental fitting curve in comparison with the ideal situation.
In addition, there were two obvious singular values which can be observed in Figure 8. One of them, corresponding to V x = ± 1.57   V , is normal because the sum of the bias phase and the initial phase was a litter greater than 2 π and therefore out of the range of the fitting curve. However, the value of V x = ± 0.785   V was abnormal. In order to further investigate this problem, we reduced the intensity of AE signals and performed similar experiments with Δ ϕ [ π , 2 π ] , obtaining a similar value. Thus, this phenomenon may be related to the inherent characteristics of the Y-branch waveguide and needs to be further studied in the future.

5. Conclusions

In this work, a mathematical model between initial phase and phase sensitivity of the optical fiber Sagnac AE sensor was established. Theoretical analysis and numerical simulation showed that the relationship between them was nonlinear, and the maximum phase sensitivity could be obtained when the initial phase was modulated to 3 π / 2 . An experimental system for the optical fiber Sagnac AE sensor was built, and phase modulation experiments were carried out using a Y-branch waveguide when the frequency of square-wave modulation signal was equal to the intrinsic frequency of the sensor. The experimental fitting curve was consistent with the theoretical analysis and numerical simulation. The results showed that the maximum phase sensitivity could be obtained by a suitable phase modulation, and the harmonic interference of the sensing system could be reduced. This study provides a theoretical and technical basis for improving the phase sensitivity of the optical fiber Sagnac sensor in practical engineering and the use of Y-branch waveguides.

Author Contributions

Conceptualization, Z.C. and J.Z.; methodology, Z.C.; validation, Z.C. and C.C.; formal analysis, D.L.; data curation, C.C.; writing—original draft preparation, Z.C.; writing—review and editing, B.W.; supervision, J.Z.; funding acquisition, D.L.

Funding

This research was funded by the National Natural Science Foundation of China (Nos. U1537102 and 61472282), the Aeronautical Science Foundation of China (grant NO. 20170252004), the Natural Science Research Project of Colleges in Anhui Province (grant Nos. KJ2018A0042 and KJ2017A041), and the Development Project of the State Key Laboratory of Mechanics and Control of Mechanical Structures (grant NO. MCMS0516K01). The APC was funded by the Aeronautical Science Foundation of China (grant NO. 20170252004).

Conflicts of Interest

The authors declare no conflict of interest.

References

  1. Eaton, M.; Pearson, M.; Lee, W.; Pullin, R. Accurate damage location in complex composite structures and industrial environments using acoustic emission. In Proceedings of the 11th International Conference on Damage Assessment of Structures, Ghent, Belgium, 24–26 August 2015. [Google Scholar]
  2. He, J.J.; Guan, X.F.; Peng, T.S.; Liu, Y.M.; Saxena, A.; Celaya, J.; Goebel, K. A multi-feature integration method for fatigue crack detection and crack length estimation in riveted lap joints using Lamb waves. Smart Mater. Struct. 2013, 22, 105007. [Google Scholar] [CrossRef]
  3. Jaroszewicz, L.R.; Krajewski, Z.; Solarz, L.; Teisseyer, R. Application of the fibre-optic Sagnac interferometer in the investigation of seismic rotational waves. Meas. Sci. Technol. 2006, 17, 1186–1193. [Google Scholar] [CrossRef]
  4. Qian, S.; Chen, H.; Xu, Y.; Su, L. High Sensitivity Detection of Partial Discharge Acoustic Emission within Power Transformer by Sagnac Fiber Optic Sensor. IEEE Trans. Dielectr. Electr. Insul. 2018, 25, 2313–2320. [Google Scholar] [CrossRef]
  5. Sohaib, M.; Islam, M.; Kim, J.Y.; Jeon, D.C.; Kim, J.M. Leakage Detection of a Spherical Water Storage Tank in a Chemical Industry Using Acoustic Emissions. Appl. Sci. 2019, 9, 196. [Google Scholar] [CrossRef]
  6. Ghosh, R.; Chatterjee, B.; Dalai, S. A method for the localization of partial discharge sources using partial discharge pulse information from acoustic emissions. IEEE Trans. Dielectr. Electr. Insul. 2017, 24, 237–245. [Google Scholar] [CrossRef]
  7. Chai, M.Y.; Zhang, J.; Zhang, Z.X.; Duan, Q.; Cheng, G.X. Acoustic emission studies for characterization of fatigue crack growth in 316LN stainless steel and welds. Appl. Acoust. 2017, 126, 101–113. [Google Scholar] [CrossRef]
  8. Zhou, W.; Zhang, P.F.; Zhang, Y.N. Acoustic Emission Based on Cluster and Sentry Function to Monito Tensile Progressive Damage of Carbon Fiber Woven Composites. Appl. Sci. 2018, 8, 2265. [Google Scholar] [CrossRef]
  9. Wu, Q.; Yu, F.M.; Okabe, Y.; Kobayashi, S. Application of a novel optical fiber sensor to detection of acoustic emissions by various damages in CFRP laminates. Smart Mater. Struct. 2015, 24, 015011. [Google Scholar] [CrossRef]
  10. Yalcinkaya, H.; Ozevin, D. The design and calibration of particular geometry piezoelectric acoustic emission transducer for leak detection and localization. Meas. Sci. Technol. 2013, 24, 095103–095112. [Google Scholar] [CrossRef]
  11. Perelli, A.; De Marchi, L.; Marzani, A.; Speciale, N. Acoustic emission localization in plates with dispersion and reverberations using sparse PZT sensors in passive mode. Smart Mater. Struct. 2012, 21, 025010. [Google Scholar] [CrossRef]
  12. Ciampa, F.; Meo, M. Acoustic emission source localization and velocity determination of the fundamental mode A0 using wavelet analysis and a Newton-based optimization technique. Smart Mater. Struct. 2010, 19, 045027. [Google Scholar] [CrossRef]
  13. Lee, J.R.; Lee, S.S.; Yoon, D.J. Simultaneous multipoint acoustic emission sensing using fibre acoustic wave grating sensors with identical spectrum. J. Opt. A Pure Appl. Opt. 2008, 10, 085307–085315. [Google Scholar] [CrossRef]
  14. Cho, S.I.; Lee, J.K.; Lee, J.O.; Jung, S.S.; Lee, D.H.; Seo, W.C. PZT transducer response to an epicentral acoustic emission signal during glass capillary breakage. J. Korean Phys. Soc. 2008, 53, 3213–3219. [Google Scholar] [CrossRef]
  15. Read, I.; Foote, P.; Murray, S. Optical fibre acoustic emission sensor for damage detection in carbon fibre composite structures. Meas. Sci. Technol. 2002, 13, 5–9. [Google Scholar] [CrossRef]
  16. Fu, T.; Liu, Y.; Li, Q.; Leng, J. Fiber optic acoustic emission sensor and its applications in the structural health monitoring of CFRP materials. Opt. Lasers Eng. 2009, 47, 1056–1062. [Google Scholar] [CrossRef]
  17. Matsuo, T.; Cho, H.; Takemoto, M. Optical fiber acoustic emission system for monitoring molten salt attack. Sci. Technol. Adv. Mater. 2006, 7, 104–110. [Google Scholar] [CrossRef] [Green Version]
  18. Zhao, J.H.; Shi, Y.K.; Shan, N.; Yuan, X.Q. Stabilized fiber-optic extrinsic Fabry-Perot sensor system for acoustic emission measurement. Opt. Laser. Technol. 2008, 40, 874–880. [Google Scholar] [CrossRef]
  19. Wang, L.T.; Fang, N.; Wu, C.X.; Qin, H.J.; Huang, Z.M. A Fiber Optic PD Sensor Using a Balanced Sagnac Interferometer and an EDFA-Based DOP Tunable Fiber Ring Laser. Sensors 2014, 14, 8398–8422. [Google Scholar] [CrossRef] [Green Version]
  20. Zhu, X.B. Aluminum alloy material structure impact Localization by using FBG Sensors. Photonic Sens. 2014, 4, 344–348. [Google Scholar] [CrossRef]
  21. Lam, P.M.; Lau, K.T.; Ling, H.Y.; Su, Z.Q.; Tam, H.Y. Acousto-ultrasonic sensing for delaminated GFRP composites using an embedded FBG sensor. Opt. Lasers Eng. 2009, 47, 1049–1055. [Google Scholar] [CrossRef]
  22. Fomitchov, P.A.; Krishnaswamy, S.; Achenbach, J.D. Compact phase-shifted Sagnac interferometer for ultrasound detection. Opt. Laser Technol. 1997, 29, 333–338. [Google Scholar] [CrossRef]
  23. Zhang, G.; Liang, Y.J.; Xi, C.; Zuo, H.G. Dual-Sagnac Optical Fiber Sensor Used in Acoustic Emission Source Location. In Proceedings of the 2011 Cross Strait Quad-Regional Radio Science and Wireless Technology Conference, Harbin, China, 26–30 July 2011. [Google Scholar]
  24. Wei, P.; Han, X.L.; Xia, D.; Liu, T.L.; Lang, H. Novel fiber-optic ring acoustic emission sensor. Sensors 2018, 18, 215. [Google Scholar]
  25. Jang, T.S.; Lee, S.S.; Kim, Y.G. Surface-bonded fiber optic Sagnac sensors for ultrasound detection. Ultrasonics 2004, 42, 837–841. [Google Scholar] [CrossRef]
  26. Jang, T.S.; Lee, J.J.; Yoon, D.J.; Lee, S.S. Non-contact detection of laser-generated surface acoustic waves using fiber optic Sagnac interferometer. Ultrasonics 2002, 40, 803–807. [Google Scholar] [CrossRef]
  27. Liang, Y.J.; Mu, L.L.; Liu, J.F.; Yu, X.T. Combined optical fiber interferometric sensors for the detection of acoustic emission. Opt. Lett. 2008, 4, 0184–0187. [Google Scholar] [CrossRef]
Figure 1. Principle of the optical fiber Sagnac acoustic emission (AE) sensor.
Applsci 09 01018 g001
Figure 2. Ooutput voltage signal without phase modulation in the numerical simulation. (a) Output voltage waveform; (b) corresponding frequency spectrum.
Applsci 09 01018 g002
Figure 3. Output voltage with a phase modulation of Δ ϕ = π / 2 in the numerical simulation. (a) Output voltage waveform; (b) corresponding frequency spectrum.
Applsci 09 01018 g003
Figure 4. Relationship between the amplitude of the output fundamental voltage and Δ ϕ . The red scatter points represent the simulative values, and the blue curve is the corresponding fitting curve.
Applsci 09 01018 g004
Figure 5. Experimental system of the optical fiber Sagnac AE sensor.
Applsci 09 01018 g005
Figure 6. Output voltage of the sensor without phase modulation in the experiments. (a) Output voltage waveform; (b) Corresponding frequency spectrum.
Applsci 09 01018 g006
Figure 7. Output voltage of the sensor with a phase modulation of Δ ϕ = π / 2 in the experiments. (a) Output voltage waveform; (b) Corresponding frequency spectrum.
Applsci 09 01018 g007
Figure 8. Result of experimental fitting. The horizontal axis represents the amplitude of the modulation voltage, and the longitudinal axis represents the amplitude of the fundamental voltage.
Applsci 09 01018 g008
Table 1. Experimental results.
V x   ( V ) Amplitude of Fundamental Voltage
00.00660
±0.10.01910
±0.20.02873
±0.30.04117
±0.40.04509
±0.50.05245
±0.60.06120
±0.70.06305
±0.80.06194
±0.90.05681
±1.00.04740
±1.10.04076
±1.20.03112
±1.30.02242
±1.40.00960
±1.50.00276

