Abstract
To ease the installation of perforating rebars through multi-holes, an alternative notched perfobond shear connector was proposed by cutting out the hole edge. This paper presents the test results of six pull-out specimens with conventional and notched perfobond shear connectors. The objective was to compare the failure modes and pull-out behaviors of perfobond shear connectors using circular holes and notched holes. Furthermore, the explicit finite element method was introduced and validated to generate parametric results for pull-out tests of notched perfobond shear connectors. A total of 33 parametric simulations were performed to further study the influences of several variables, including the hole diameter, the cut width, the perfobond thickness, the concrete strength, the diameter and strength of the rebar, and the strength of the structural steel. The experimental and numerical results were used to evaluate the previous equations for perfobond shear connectors. Finally, an alternative equation was proposed to estimate the pull-out resistance of notched perfobond shear connectors.
1. Introduction
In recent decades, steel and concrete composite structures have been increasingly used in bridge engineering due to their great structural performance and favorable construction cost. The shear connection between steel and concrete is critical for the design of composite structures. Among the various types of shear connectors in the literature [1,2,3,4,5,6,7,8], the perfobond shear connector is one of the most competitive shear connectors in practice, having a great shear resistance, shear stiffness, and fatigue strength [9,10]. The conventional perfobond shear connector is a flat steel plate which makes circular holes. Concrete dowels will form in these circular holes to resist shear forces and prevent separation between steel and concrete. With the merits of easier installation, no obvious fatigue problems, higher stiffness, and greater shear resistance, the perfobond shear connectors have been increasingly used in many types of innovative composite structures [11,12].
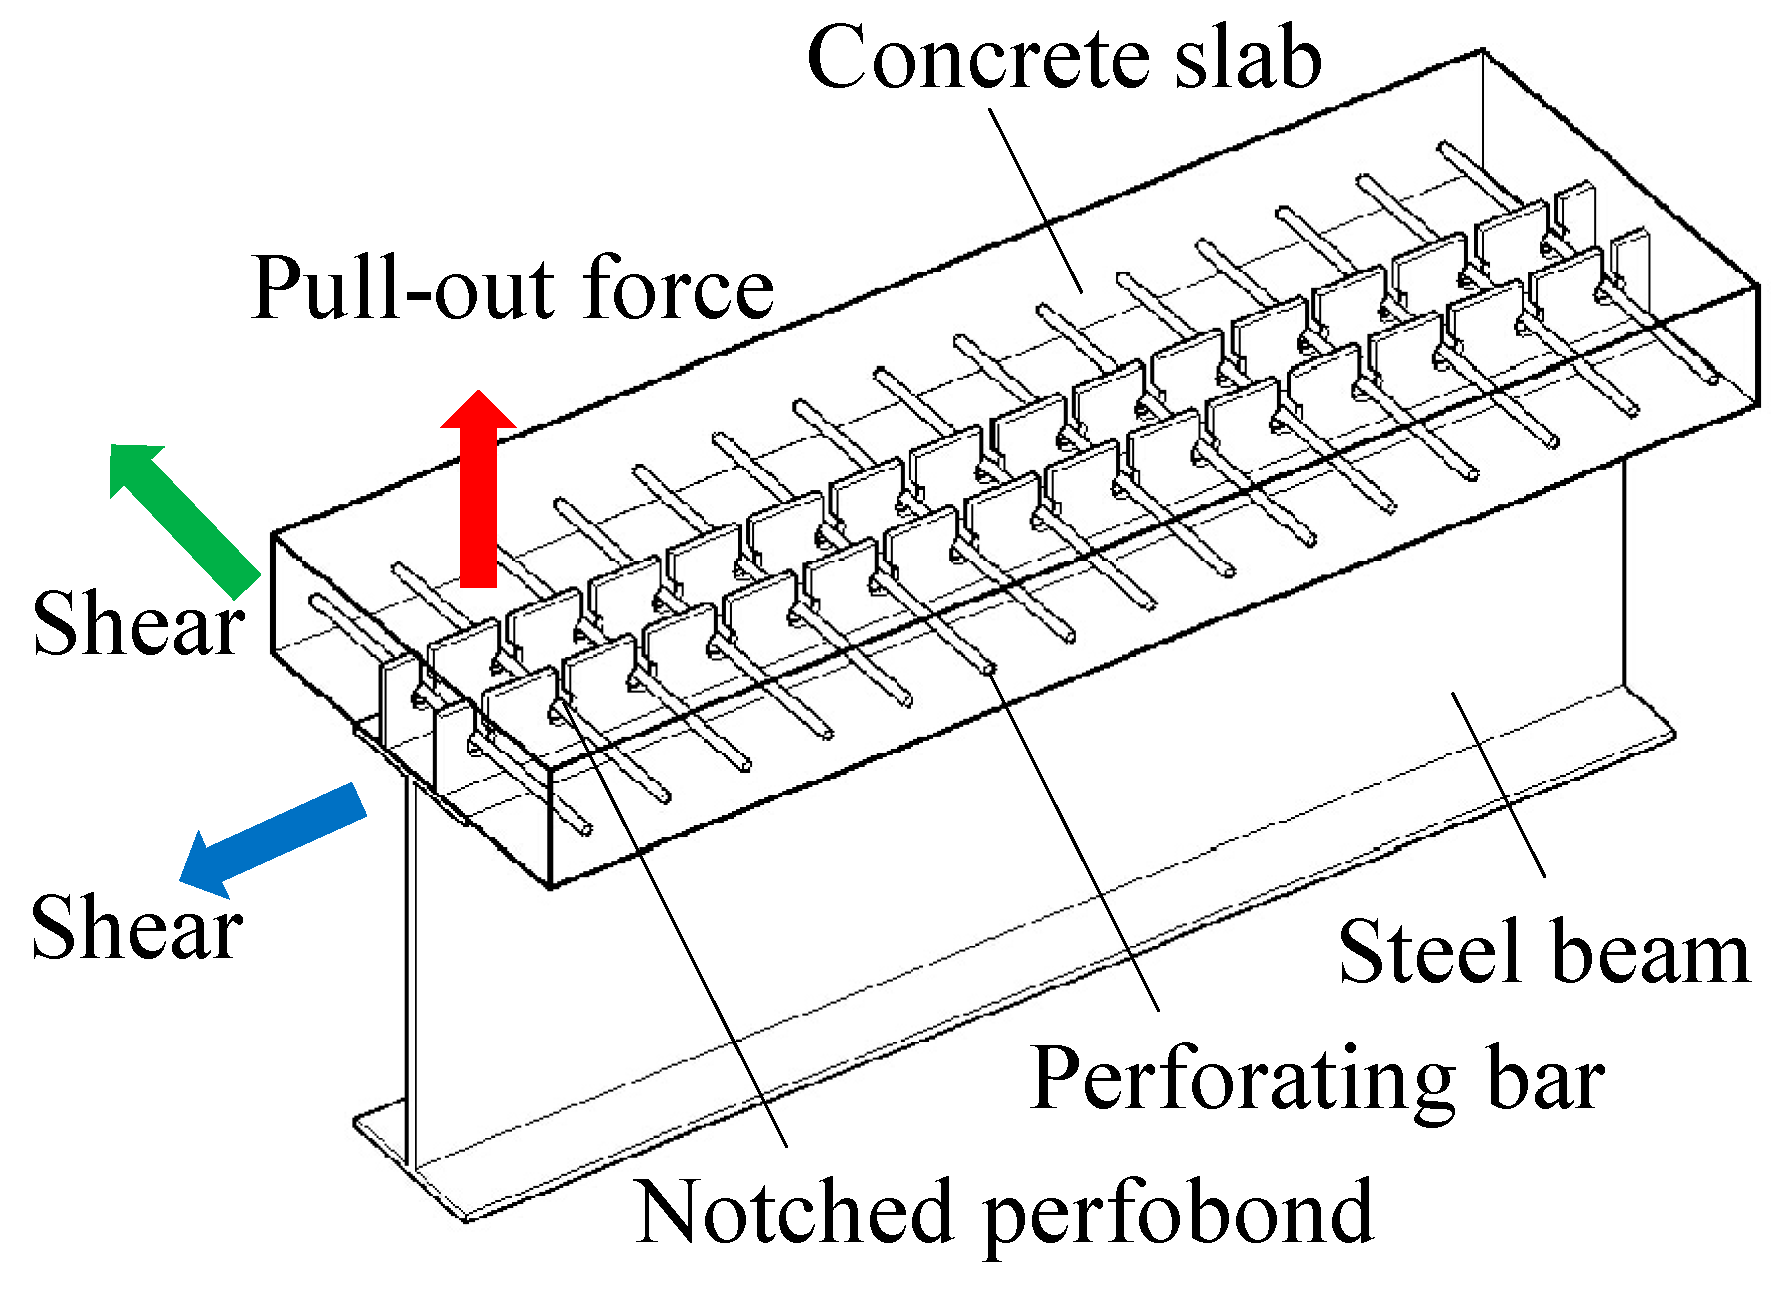
When perfobond shear connectors were installed with multi-ribs, it was time-consuming to perforate the reinforcing bars through many holes on these ribs. To increase the construction efficiency, a new type of notched perfobond shear connector was developed by cutting out the hole edge of the perfobond rib, which enabled the reinforcing bars to be directly put into many holes at the same time, as shown in Figure 1. Extensive research has been performed to study the shear behavior of the conventional perfobond shear connectors [13,14,15,16,17]. The influences of the specimen dimension, the number and size of the hole, the configuration of the rebar in the hole, and the material properties were investigated. Based on experimental and numerical analysis results, several equations were proposed to estimate the shear resistance of perfobond shear connectors [13,14,15,16,17]. In comparison, little research has been done to reveal the shear behavior of notched-type perfobond shear connectors. The reference was made to the analysis work by Kraus and Wurzer [18].

Figure 1.
Application of notched perfobond shear connector.
Shear connectors are usually used to transfer the shear forces between the concrete slab and steel beams when composite beams are subjected to longitudinal bending moments. In recent years, some newly built steel and concrete composite bridges have been designed to bear more lanes by using steel beams of wide distances and a concrete slab with long cantilevers. In this circumstance, local transverse bending moments are induced by the wheel load and balanced by contact with the steel top flange and the pull-out force of shear connectors. A large pull-out force may cause vertical separation between the steel beam and the concrete slab, which should be prevented to ensure the structural performance of composite bridges, referring to the study of Lin et al. [19]. However, little research has been reported on the pull-out behaviors of conventional and notched perfobond shear connectors [20,21].
In this study, a total of six pull-out tests were performed to compare the failure modes and the load–separation behaviors of conventional and notched perfobond shear connectors. Moreover, 33 nonlinear finite element models of notched perfobond shear connectors were built to further study the effects of several parameters, including the hole diameter, the cut width, the perfobond thickness, the concrete strength, the rebar diameter, the rebar strength, and the steel strength. The parametric results were generated to evaluate the pull-out behavior of perfobond shear connectors. Finally, an analytical model was proposed to predict the pull-out resistance of notched perfobond shear connectors in steel and concrete composite structures.
2. Pull-Out Test
2.1. Test Program
As listed in Table 1, six pull-out tests on specimens with conventional perfobond and notched perfobond shear connectors were conducted, referring to the previous research in the literature [20,21] and Eurocode 4 [22]. The aim was to obtain the failure modes, pull-out resistance, and load–separation behaviors of perfobond shear connectors and to verify the reliability of finite element analysis. These specimens could be equally divided into two groups in terms of the connector type. The CPT specimens installed a conventional perfobond rib with a circular hole. The NPT specimens used a notched perfobond rib with a cut on the hole edge. The main parameters of the pull-out test specimens were the hole diameter dp, the cut width cw, the cut ratio cw/dp, the diameter of the rebar dr, the rib length lp, the rib height hp, and the rib thickness tp.

Table 1.
Pull-out test specimens.
2.2. Specimen Layout
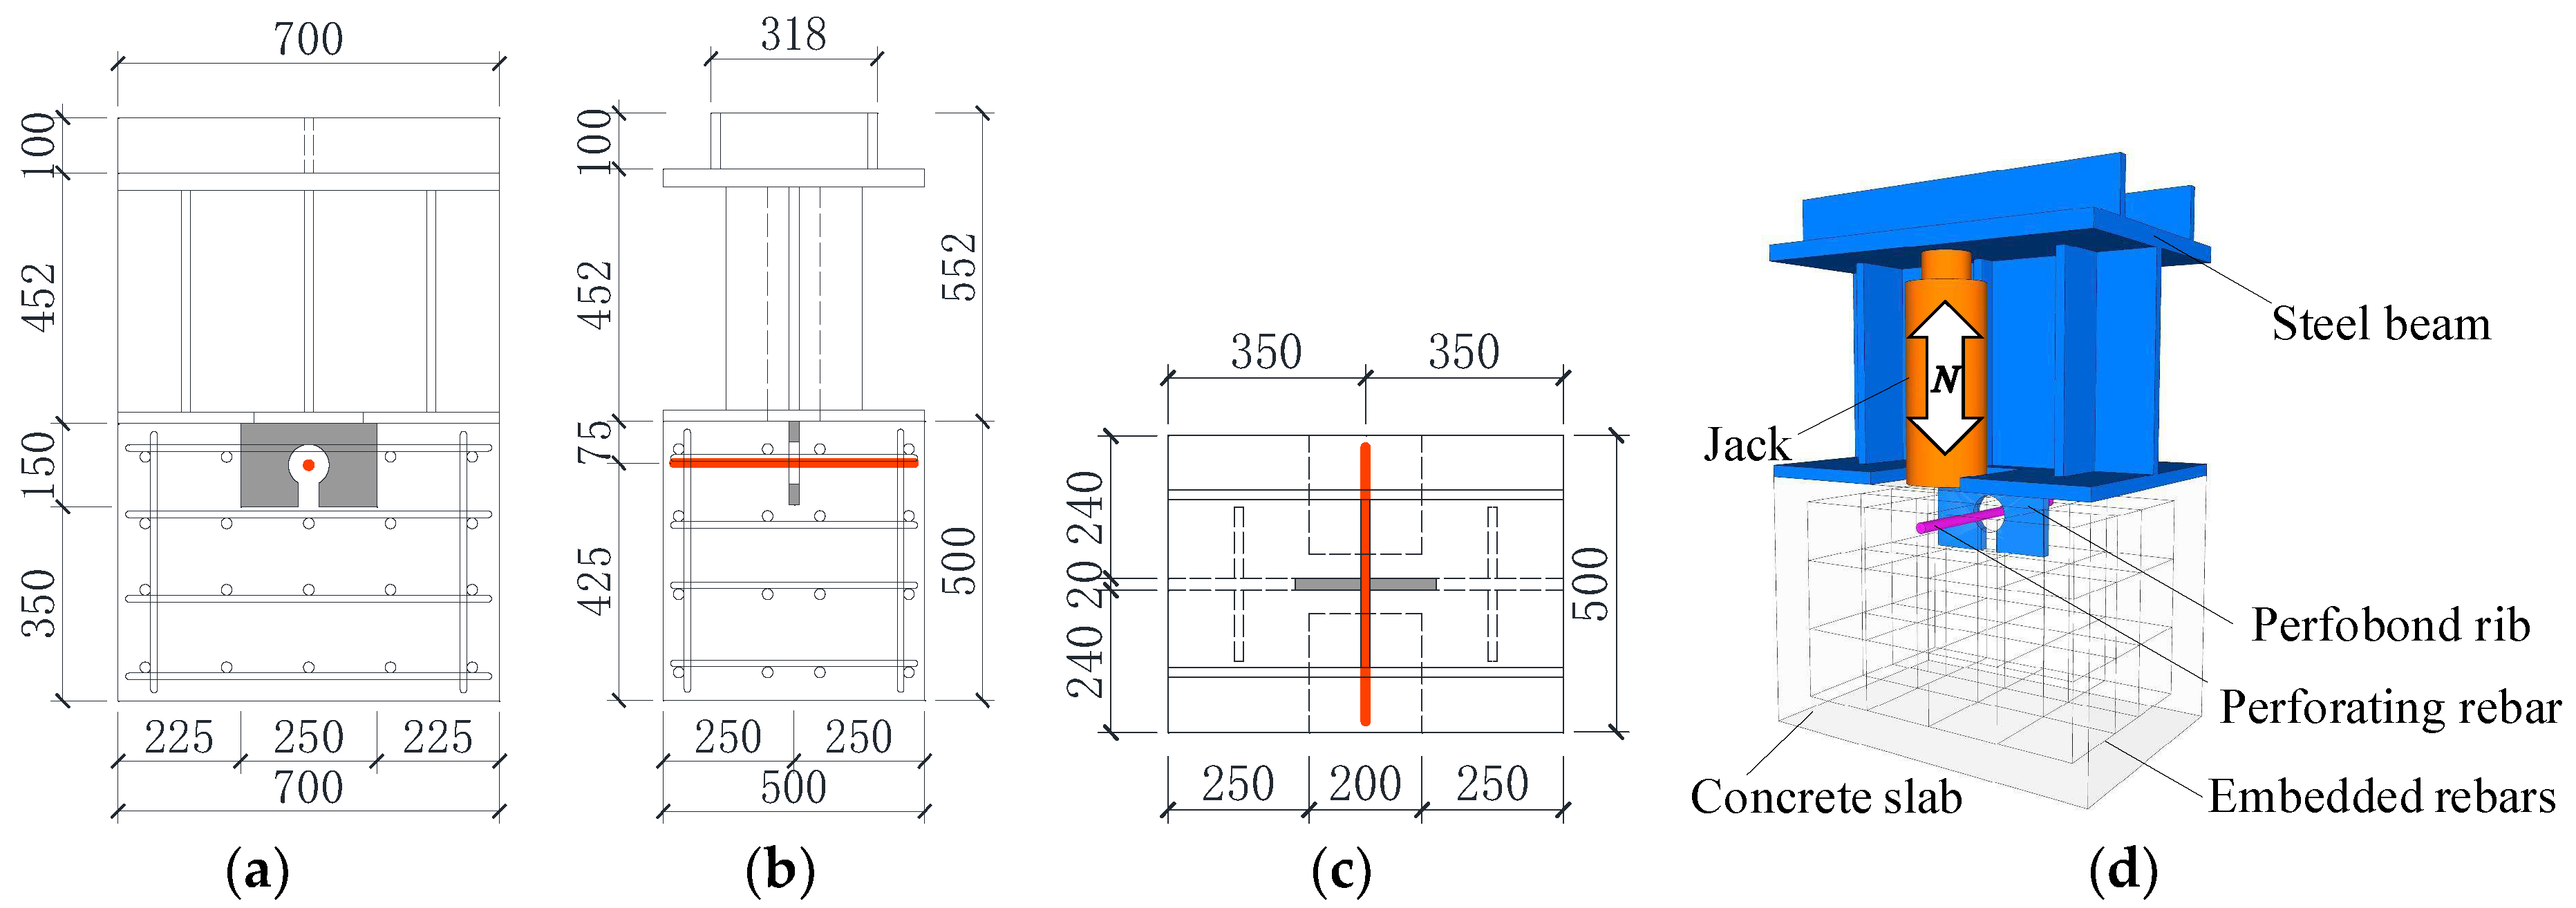
Figure 2 shows the typical layout of a pull-out test specimen. All the test specimens had the same dimensions. The difference was that the CPT and NPT specimens used perfobond ribs with circular holes and notched holes, respectively. Each pull-out specimen was composed of one steel H-beam and one concrete slab. The conventional perfobond ribs with circular holes and the new type of notched perfobond ribs were both welded upright to one side of the steel beam flange. A perforating rebar was installed at the center of the hole for each perfobond rib. The steel surface in contact with concrete was greased to minimize the bonding before concrete casting.
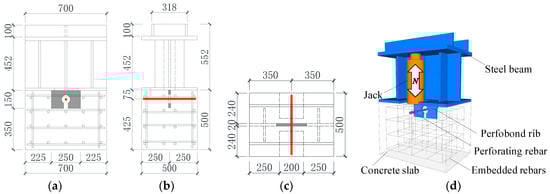
Figure 2.
Layout of push-out test specimen. (a) Front view; (b) side view; (c) top view; (d) 3D view.
2.3. Details of Perfobond Ribs
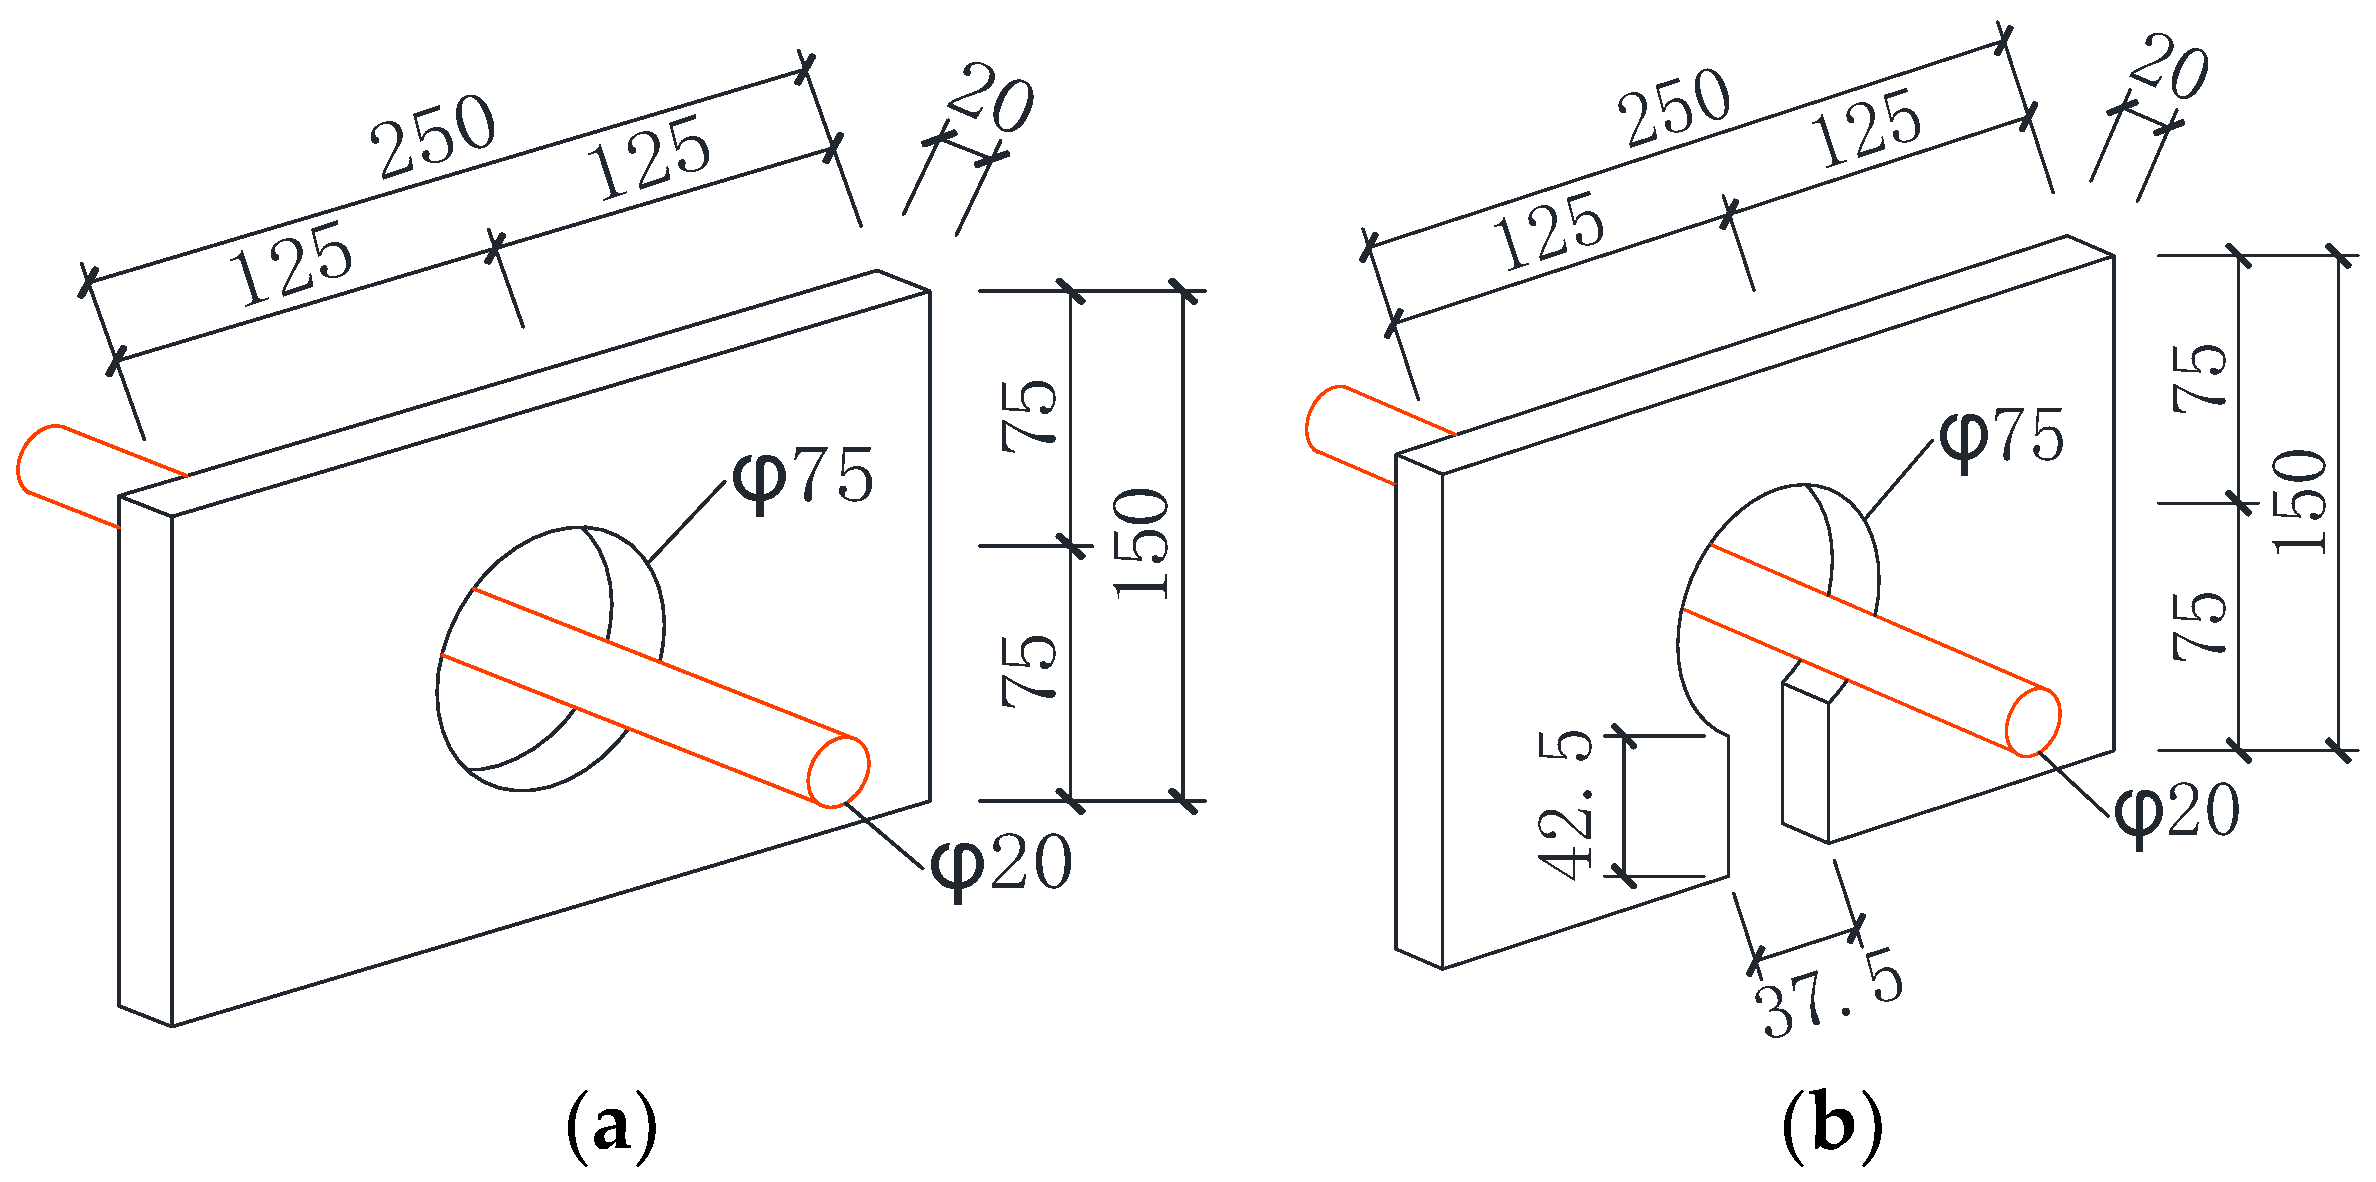
The details of the conventional perfobond rib and the notched perfobond rib were illustrated in Figure 3. Both types of perfobond ribs were identical in terms of the hole diameter (dp = 75 mm), the rib length (lp = 250 mm), the rib height (hp = 150 mm), and the rib thickness (tp = 20 mm). The conventional perfobond rib of CPT specimens made a closed circular hole on the steel plate, while the notched perfobond rib of NPT specimens made an open hole with a cut on the hole edge. In this pull-out test program, the cut width cw was designed as 37.5 mm, representing half of the hole diameter dp. Thus, the cut ratio cw/dp of the notched perfobond rib was equal to 0.5.
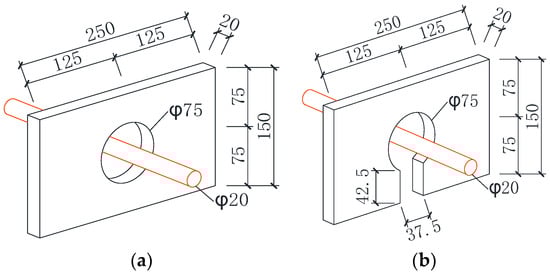
Figure 3.
Details of perfobond ribs. (a) Conventional perfobond rib; (b) notched perfobond rib.
2.4. Material Properties
The concrete cube strength fcu was 63.4 MPa, obtained from 150 mm × 150 mm × 150 mm concrete cube tests after a 28-day air curing period. The uniaxial compressive strength of concrete fc was taken as 50.7 MPa, equal to 0.8fcu. The yield strength fry and tensile strength fru of the reinforcing steel were 382.0 MPa and 547.0 MPa, respectively. The yield strength fsy and tensile strength fsu of the structural steel were 410.0 MPa and 545.0 MPa, respectively.
2.5. Test Setup and Instrumentation
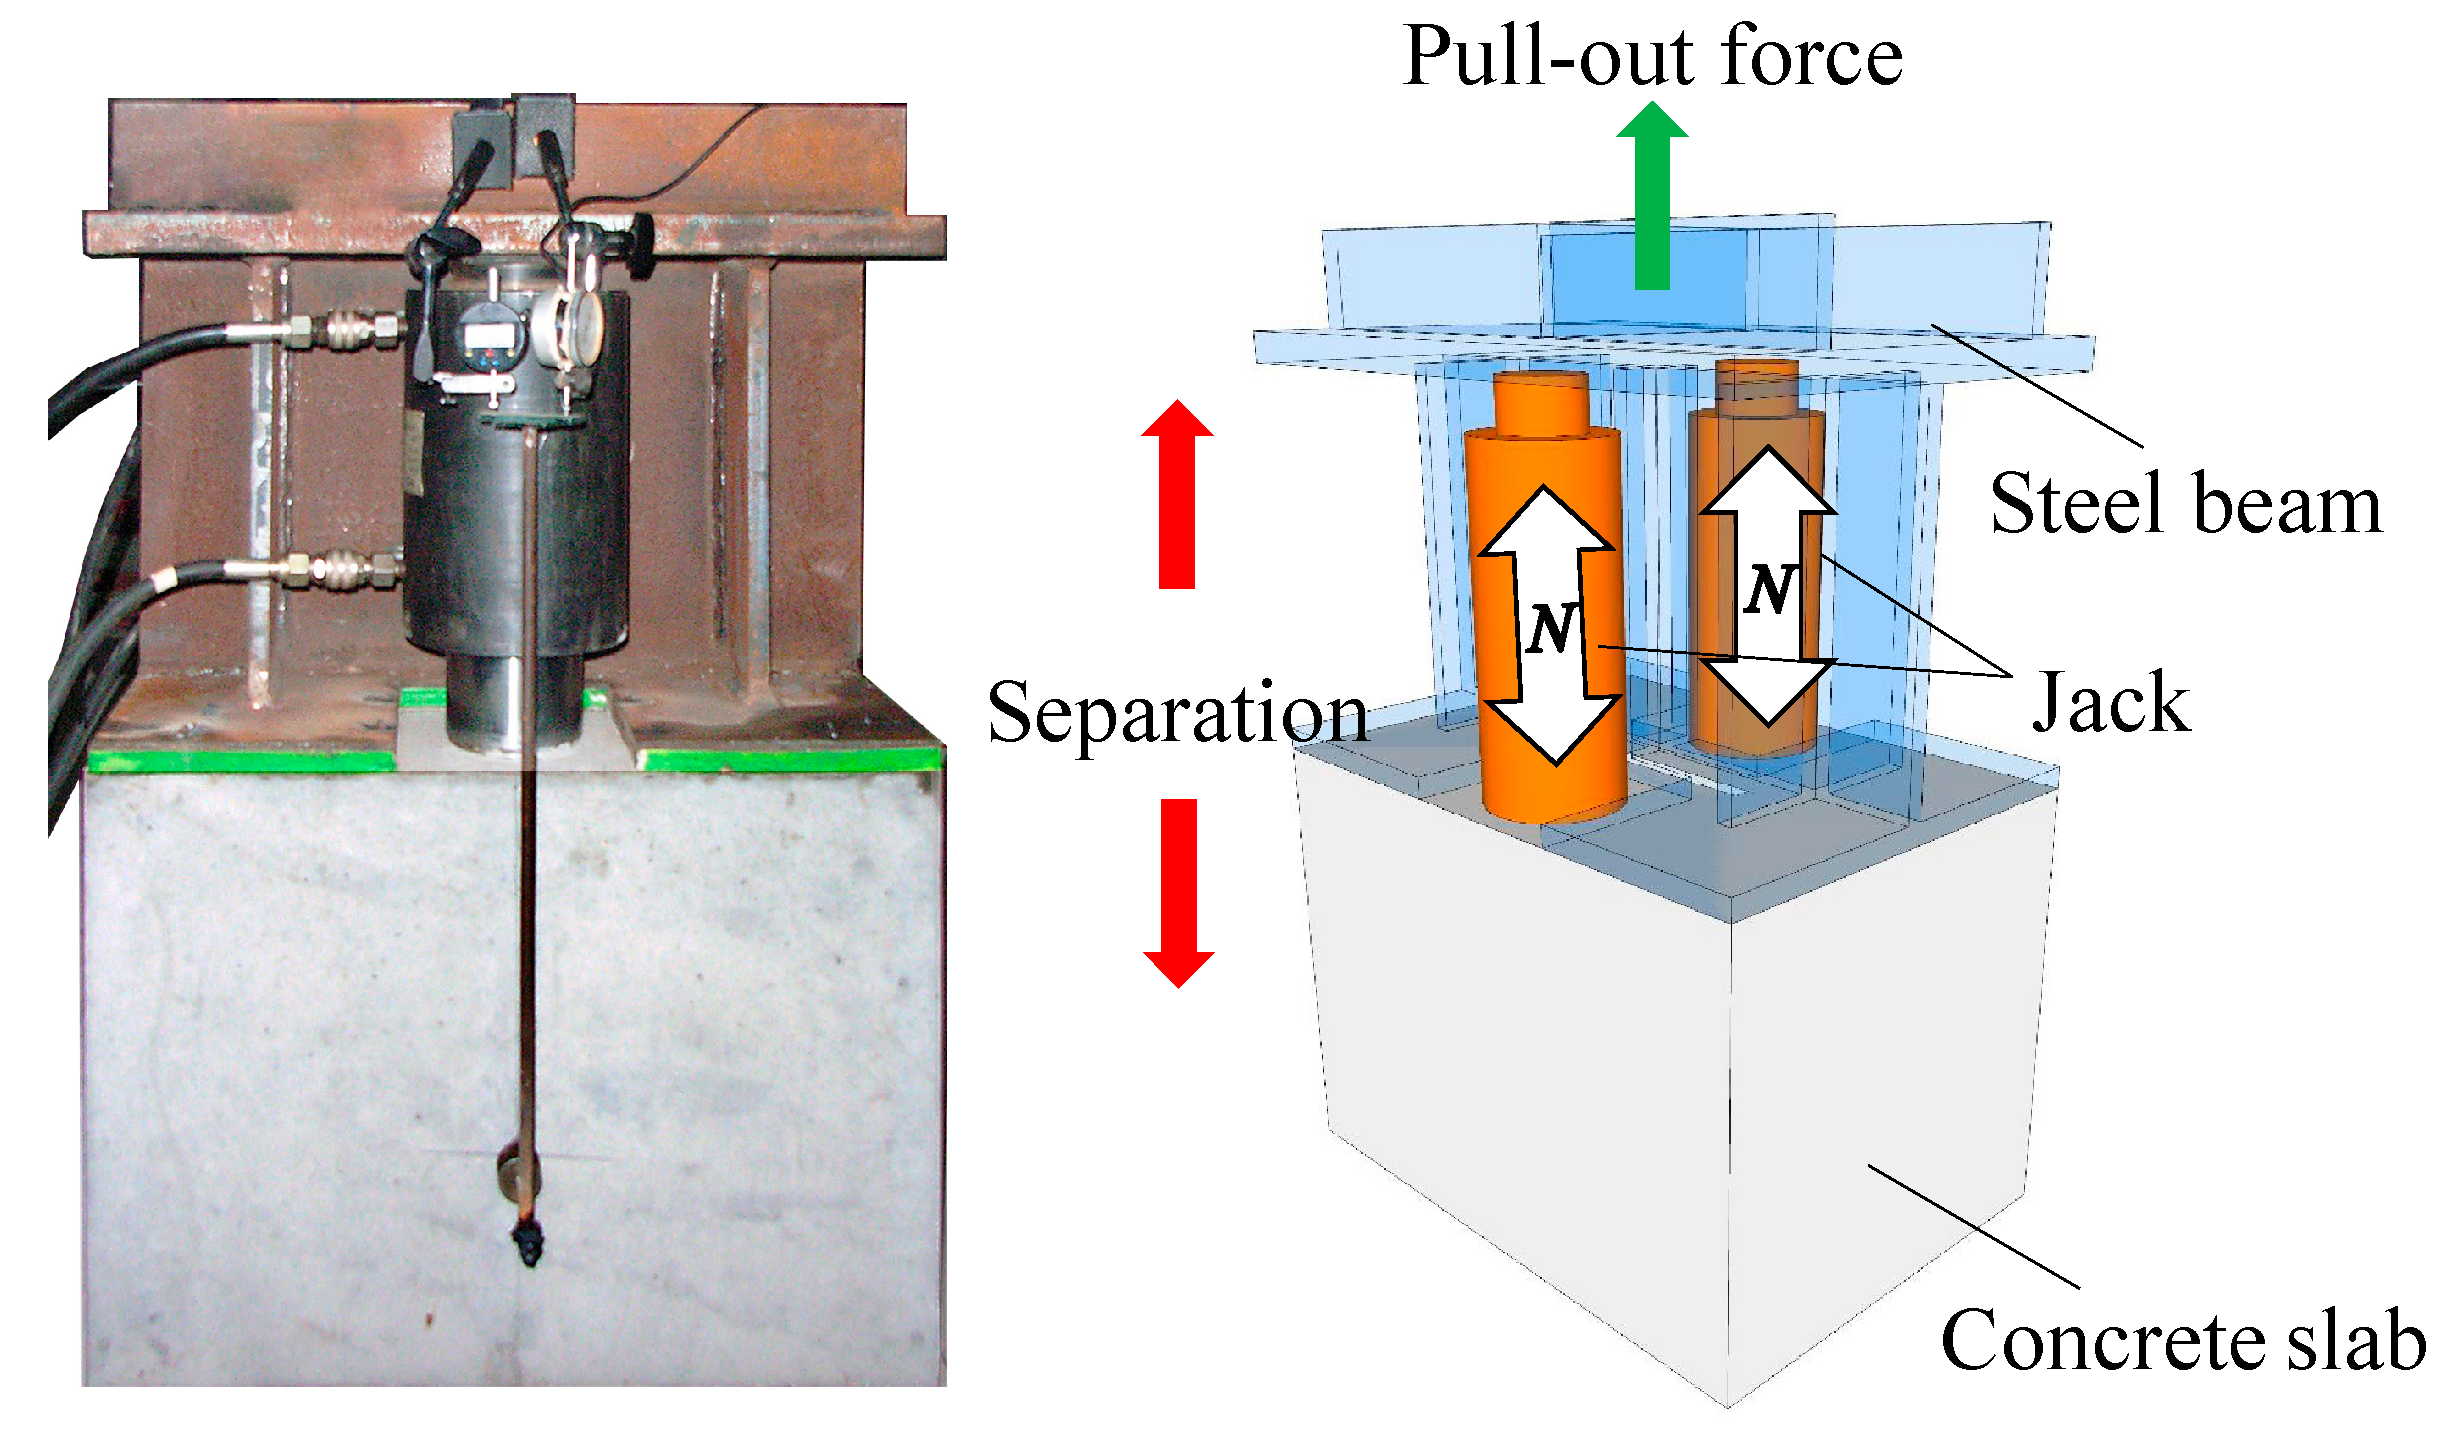
As shown in Figure 4, the pull-out specimens of perfobond shear connectors were loaded to failure by using twin hydraulic jacks. The pull-out force between steel and concrete was applied by pushing up the steel H-beam. As a result, the perfobond shear connector embedded in concrete would be pulled out. The specimens CPT–1 and NPT–1 were tested under monotonic loading, while the other specimens were tested under uniaxial cyclic loading. Two displacement gauges were installed at the front and back of the specimens to measure the separation between steel and concrete. The applied pull-out load and the relative separations were continuously and automatically recorded. Therefore, the failure modes, pull-out resistance, and load–separation behaviors of perfobond shear connectors could be obtained, and the reliability of finite element analysis could be verified by comparison with the pull-out test results.

Figure 4.
Test setup and instrumentation.
3. Test Results and Analysis
3.1. Failure Mode
The pull-out failure modes of conventional and notched perfobond shear connectors were characterized by cracks in the concrete slab, shear of the concrete dowel, and deformation of the perforating rebar. With the increase of the load, the perfobond ribs were pulled out from concrete, which induced great tension forces near the top surface of the concrete slab. As a result, great cracks were observed in the concrete slab at specimen failure. The concrete dowels in the hole failed in shear. For specimens with a circular hole, the rebar was retained in the hole and yielded with large bending deformation. In comparison, the rebar in the notched hole was not pulled out with the perfobond ribs since there was a cut on the hole edge. There was no obvious deformation observed in the conventional and notched perfobond ribs.
3.2. Load–Separation Behavior
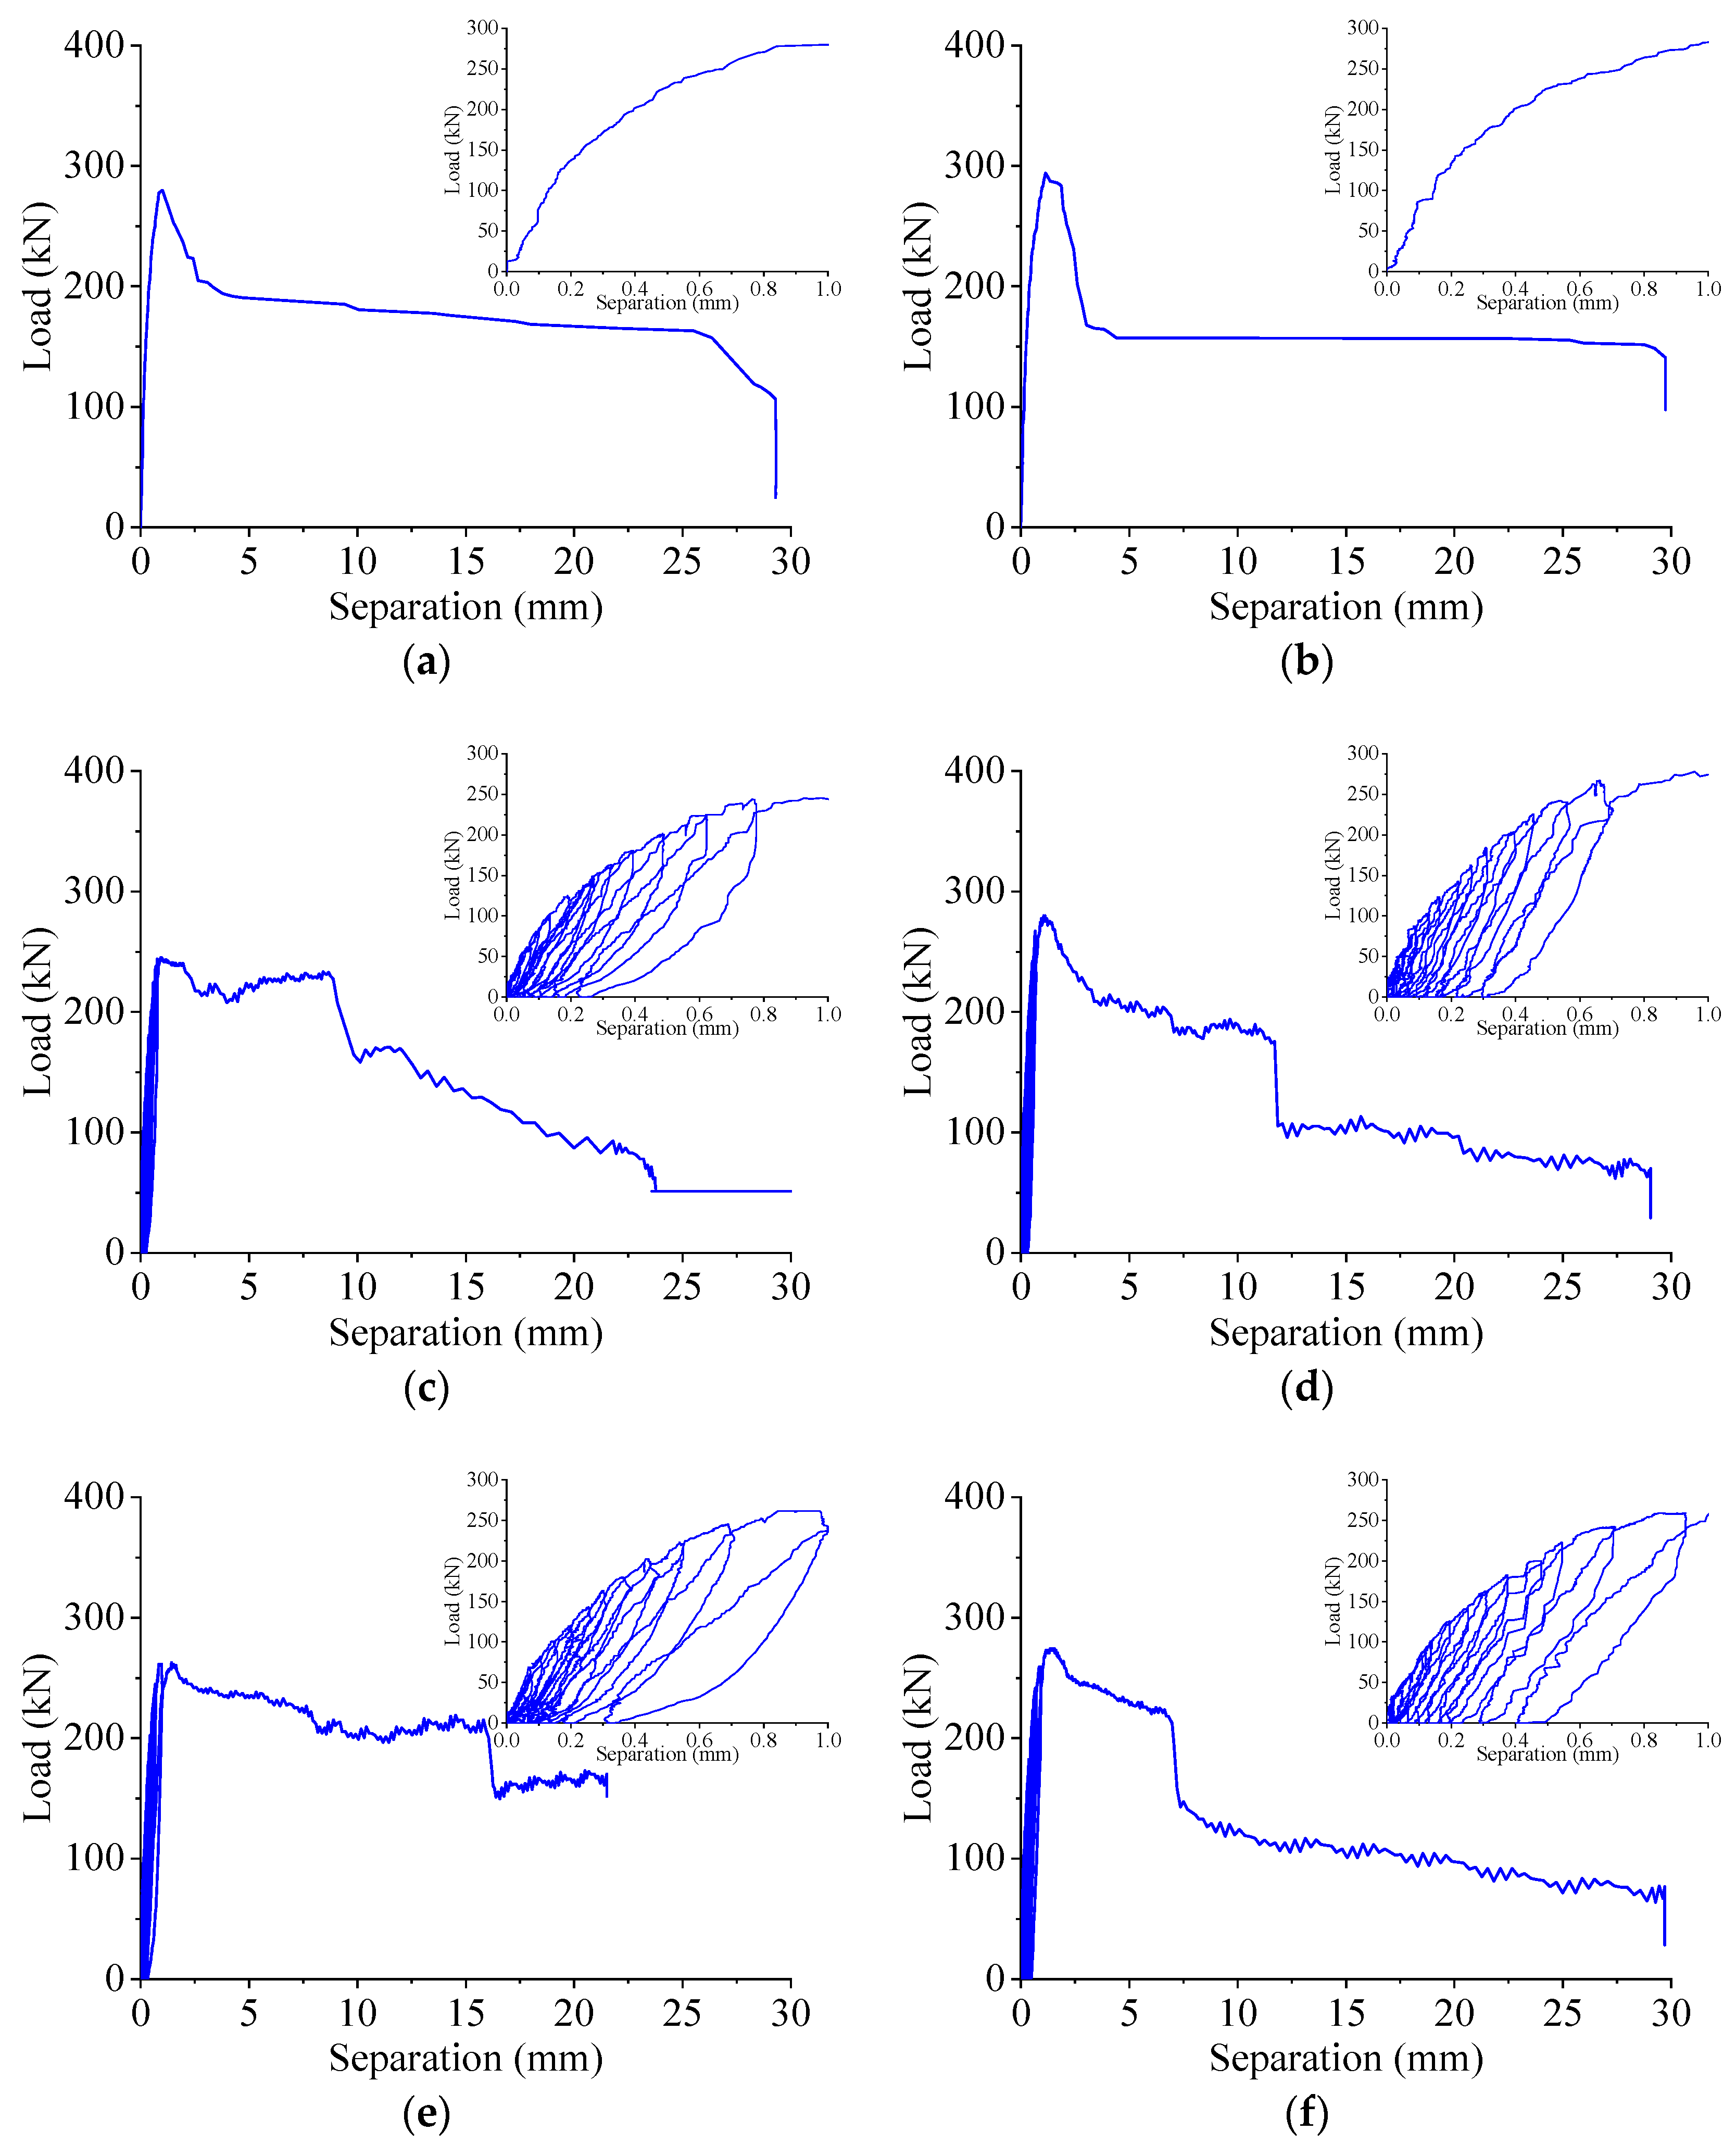
The separation between the steel beam and the concrete slab occurred as the applied pull-out load increased. The average separation from two LVDTs versus the pull-out load is shown in Figure 5. The envelopes of load–separation curves under uniaxial cyclic loading resembled those under monotonic loading. Three stages were observed in the typical load–separation curves of both conventional and notched perfobond shear connectors. At the first stage, these curves were steep without obvious separations, showing elastic behavior and great stiffness. The following stage was a parabolic curve where the load increased and the stiffness reduced slowly with the separation. Beyond the ultimate load, the separation continued to increase as the pull-out load decreased.
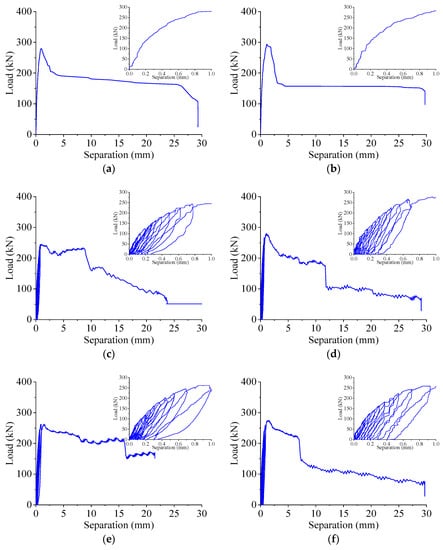
Figure 5.
Load–separation curves. (a) CPT–1; (b) NPT–1; (c) CPT–2; (d) NPT–2; (e) CPT–3; (f) NPT–3.
The pull-out test results are summarized in Table 2, including the pull-out resistance, stiffness, and separation deformation of the perfobond shear connectors. The pull-out resistance (Tu) is defined as the maximum load during the tests. The pull-out stiffness (kt) represents the secant slope at the separation of 0.2 mm [9]. The separation deformation is evaluated by the peak separation (sp), which is the separation corresponding to the pull-out resistance (Tu).
Table 2.
Pull-out test results.
3.3. Pull-Out Mechanism
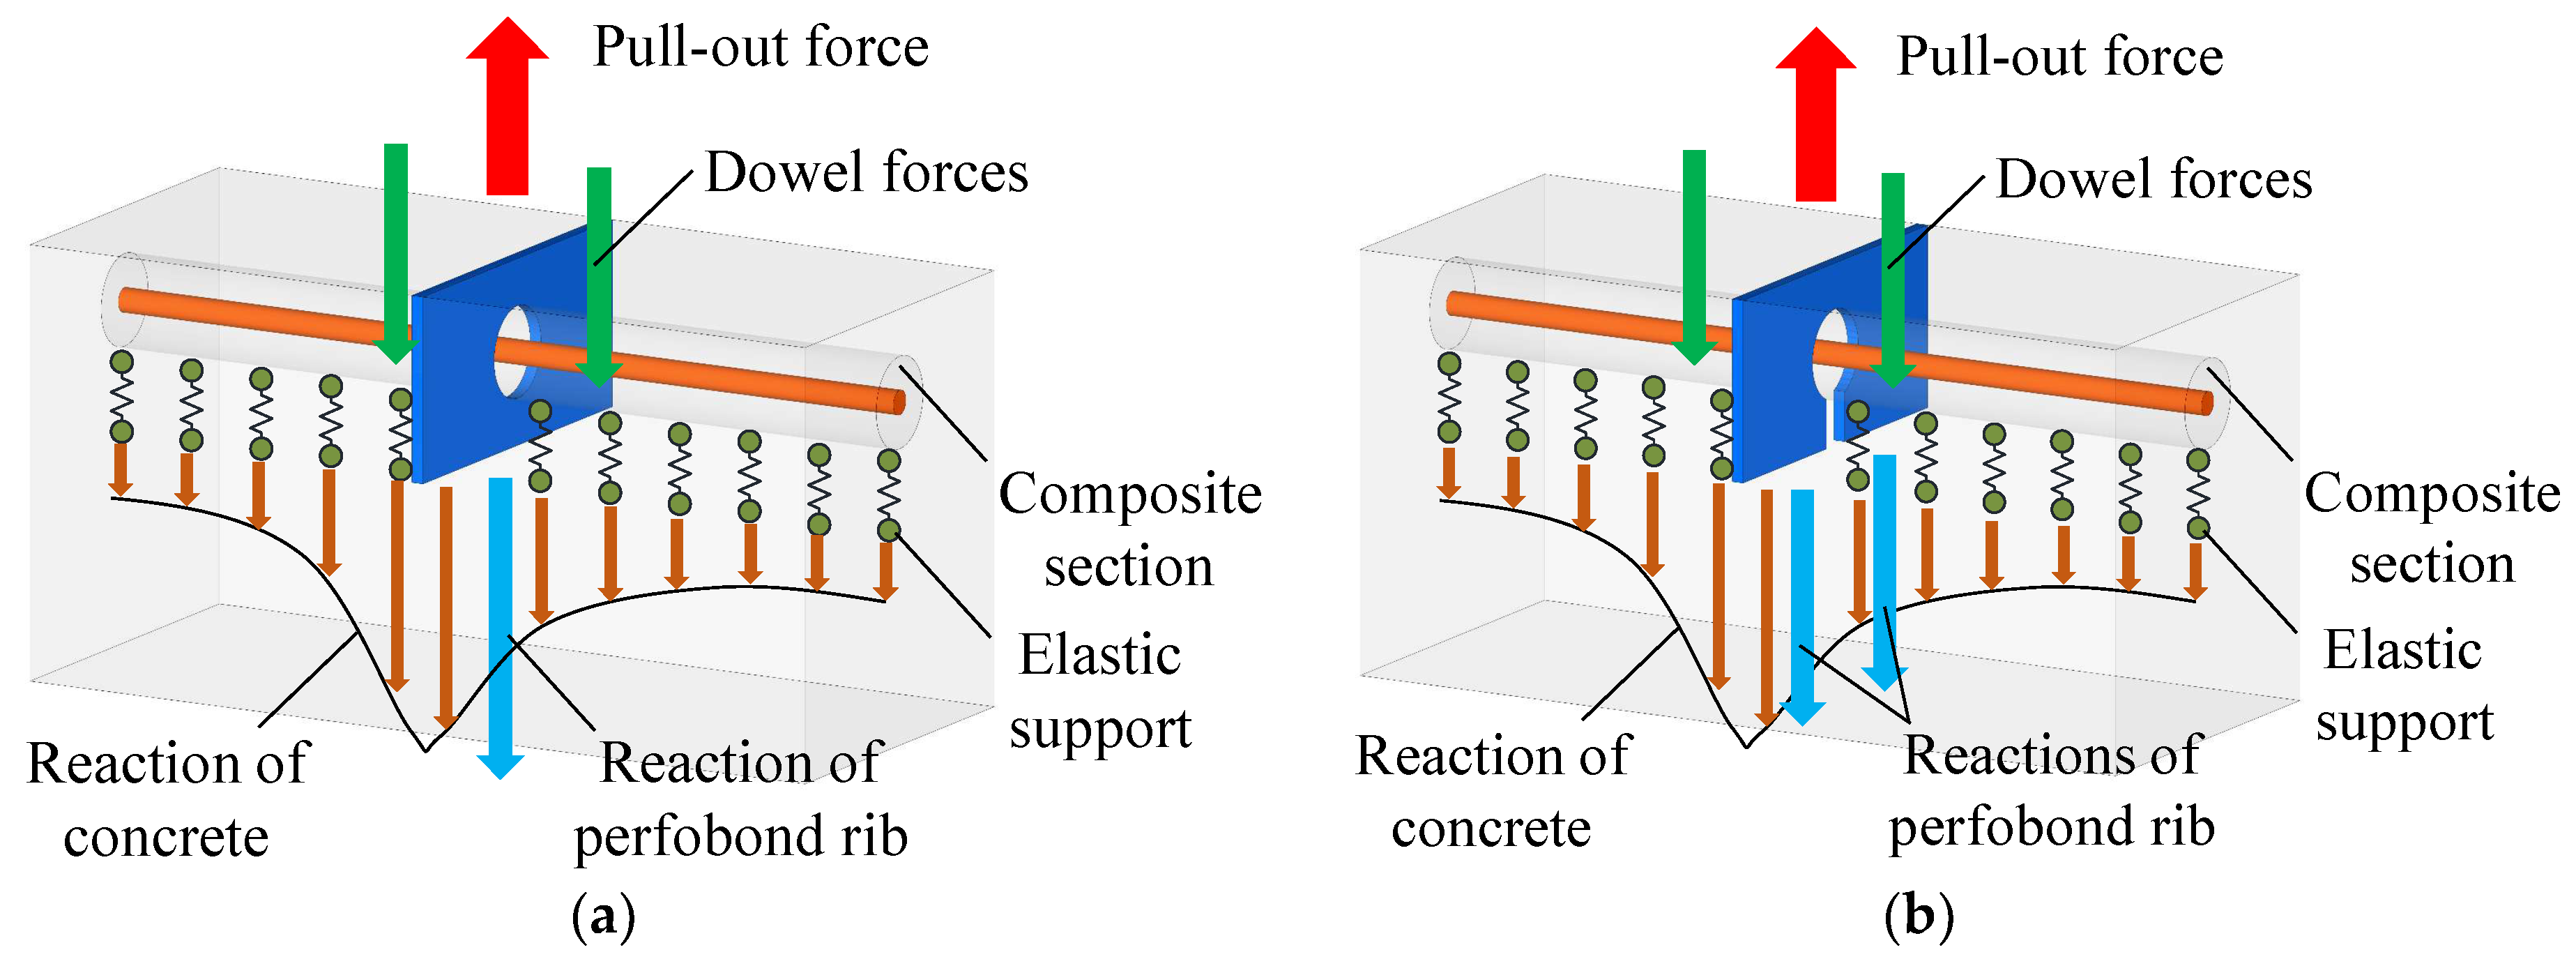
The pull-out failure mechanisms of the conventional and notched perfobond shear connectors are depicted in Figure 6. At first, the load was applied on the top of the steel beam flange and transmitted to the perfobond rib. Then, the load was transferred to the concrete dowel and the perforating rebar in the hole by contact at the hole edge. The composite section of the concrete dowel and the perforating rebar could be assumed as an elastic beam on the foundation. The surrounding concrete could be taken as the foundation, which provided the reaction forces for the composite elastic beam. At specimen failure, a pyramid wedge of the concrete slab near the surface was pulled out for excessive tension forces. The concrete dowel and the perforating rebar in the hole failed in shear. Stress concentration occurred at the hole edge of the perfobond rib, whose failure mechanism was similar to that of cutout elements in previous studies [23,24]. Therefore, the pull-out resistance of the notched perfobond shear connector was determined by the interactions among the concrete dowel, the perforating rebar, and the perfobond rib.
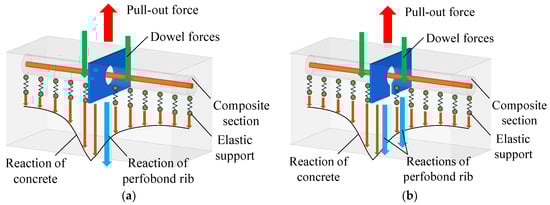
Figure 6.
Pull-out mechanism. (a) Conventional perfobond shear connector; (b) notched perfobond shear connector.
4. Finite Element Analysis
4.1. General
The pull-out tests of conventional and notched perfobond shear connectors were simulated by using the finite element method, as shown in Figure 7. The aim of this numerical analysis was to study the failure mechanism and the pull-out resistance of perfobond shear connectors. The general analysis package ABAQUS [25] was adopted to generate validated finite element models instead of expensive and time-consuming pull-out tests. The material and geometric nonlinearities were considered by using the dynamic explicit method. The loading rate of the pull-out tests was slow enough to be taken as a quasi-static loading procedure.
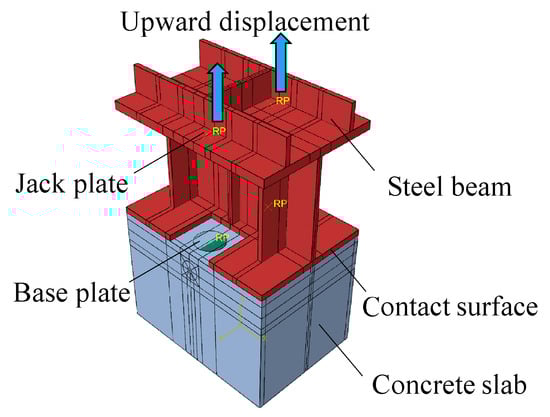
Figure 7.
Finite element model.
4.2. Finite Element Type and Mesh
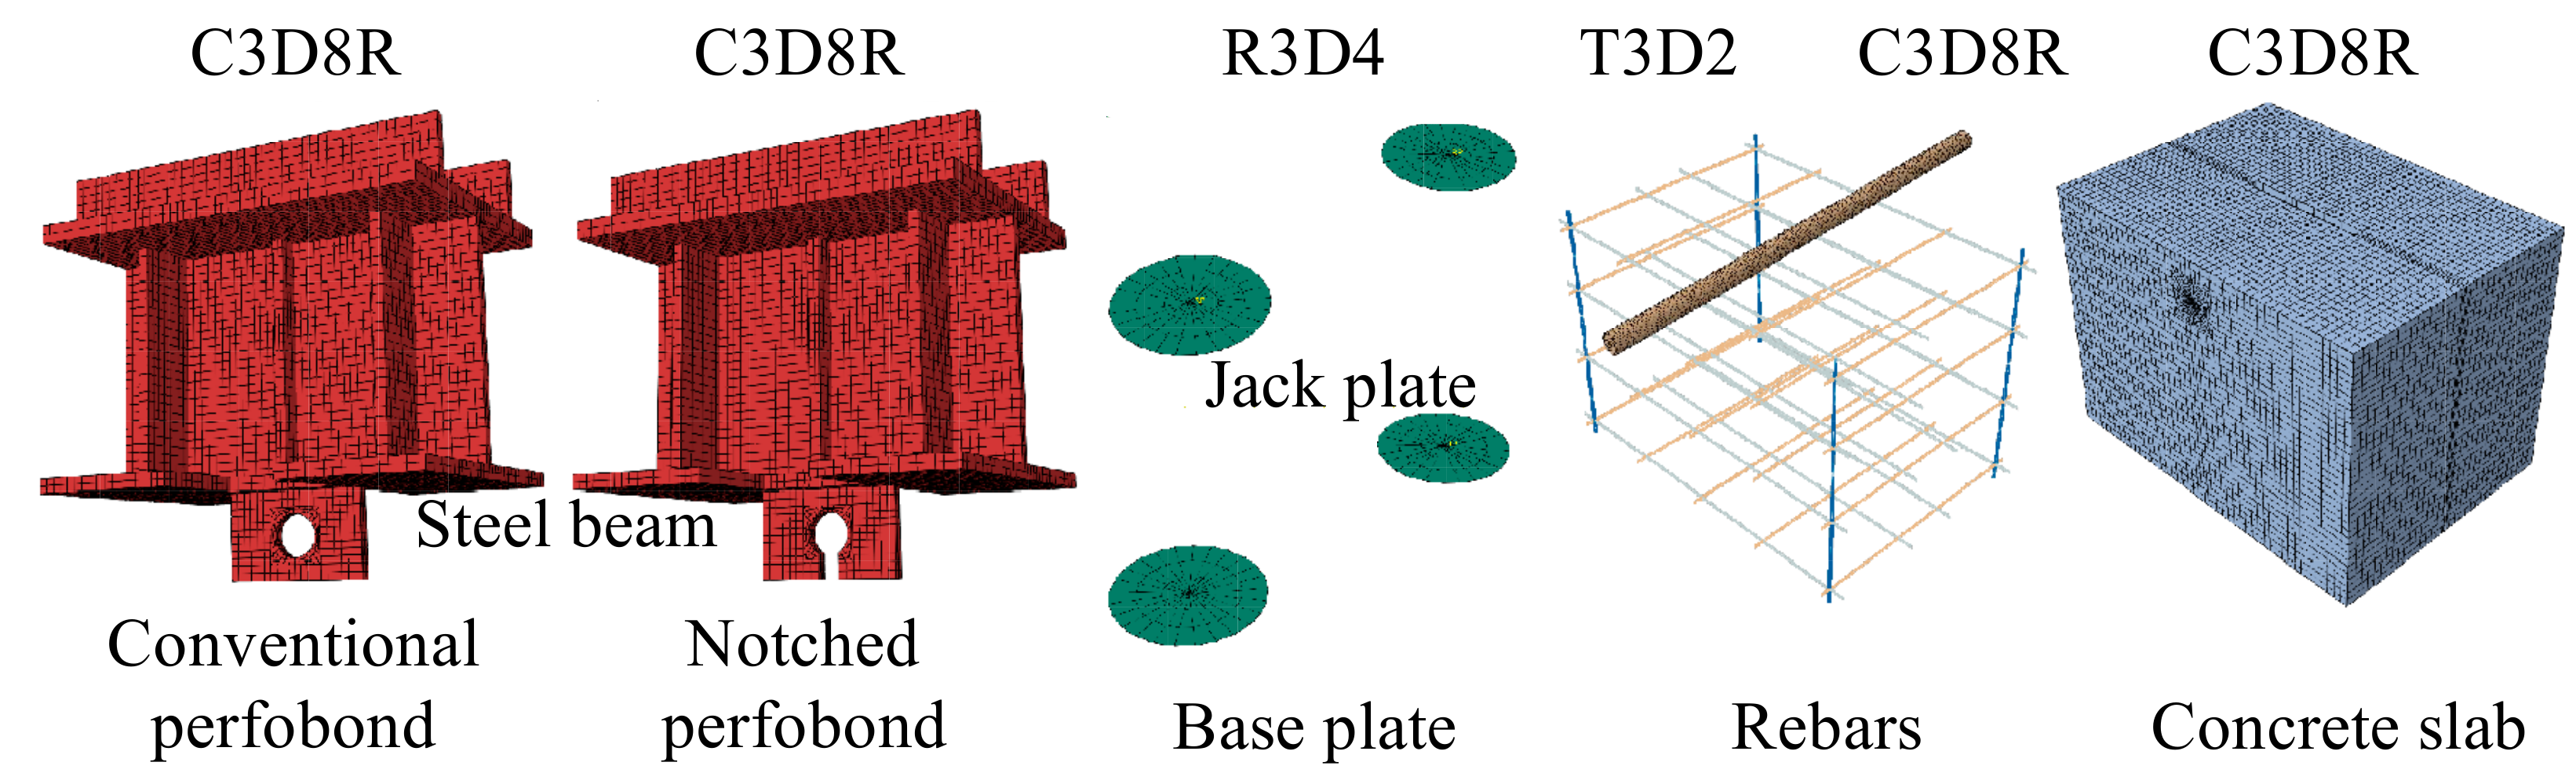
As shown in Figure 8, the pull-out tests of perfobond shear connectors were meshed by using solid elements, rigid elements, and truss elements. The concrete slab, the steel beam, the perfobond rib, and the perforating rebar were modeled with eight-node reduced integration elements (C3D8R). The other reinforcing bars embedded in concrete were represented with three-dimensional two-node truss elements (T3D2). The jacking header and the base plate were meshed by using discrete rigid elements (R3D4). A global coarse mesh with an average size of 10 mm was applied to save the analysis time. A locally refined mesh with the smallest size of about 5 mm was applied near the hole of perfobond ribs to increase the accuracy.
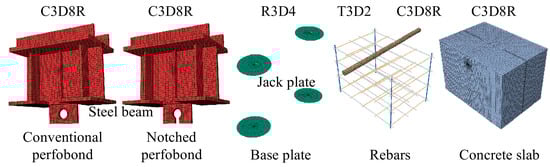
Figure 8.
Finite element type and mesh.
4.3. Interaction and Boundary Conditions
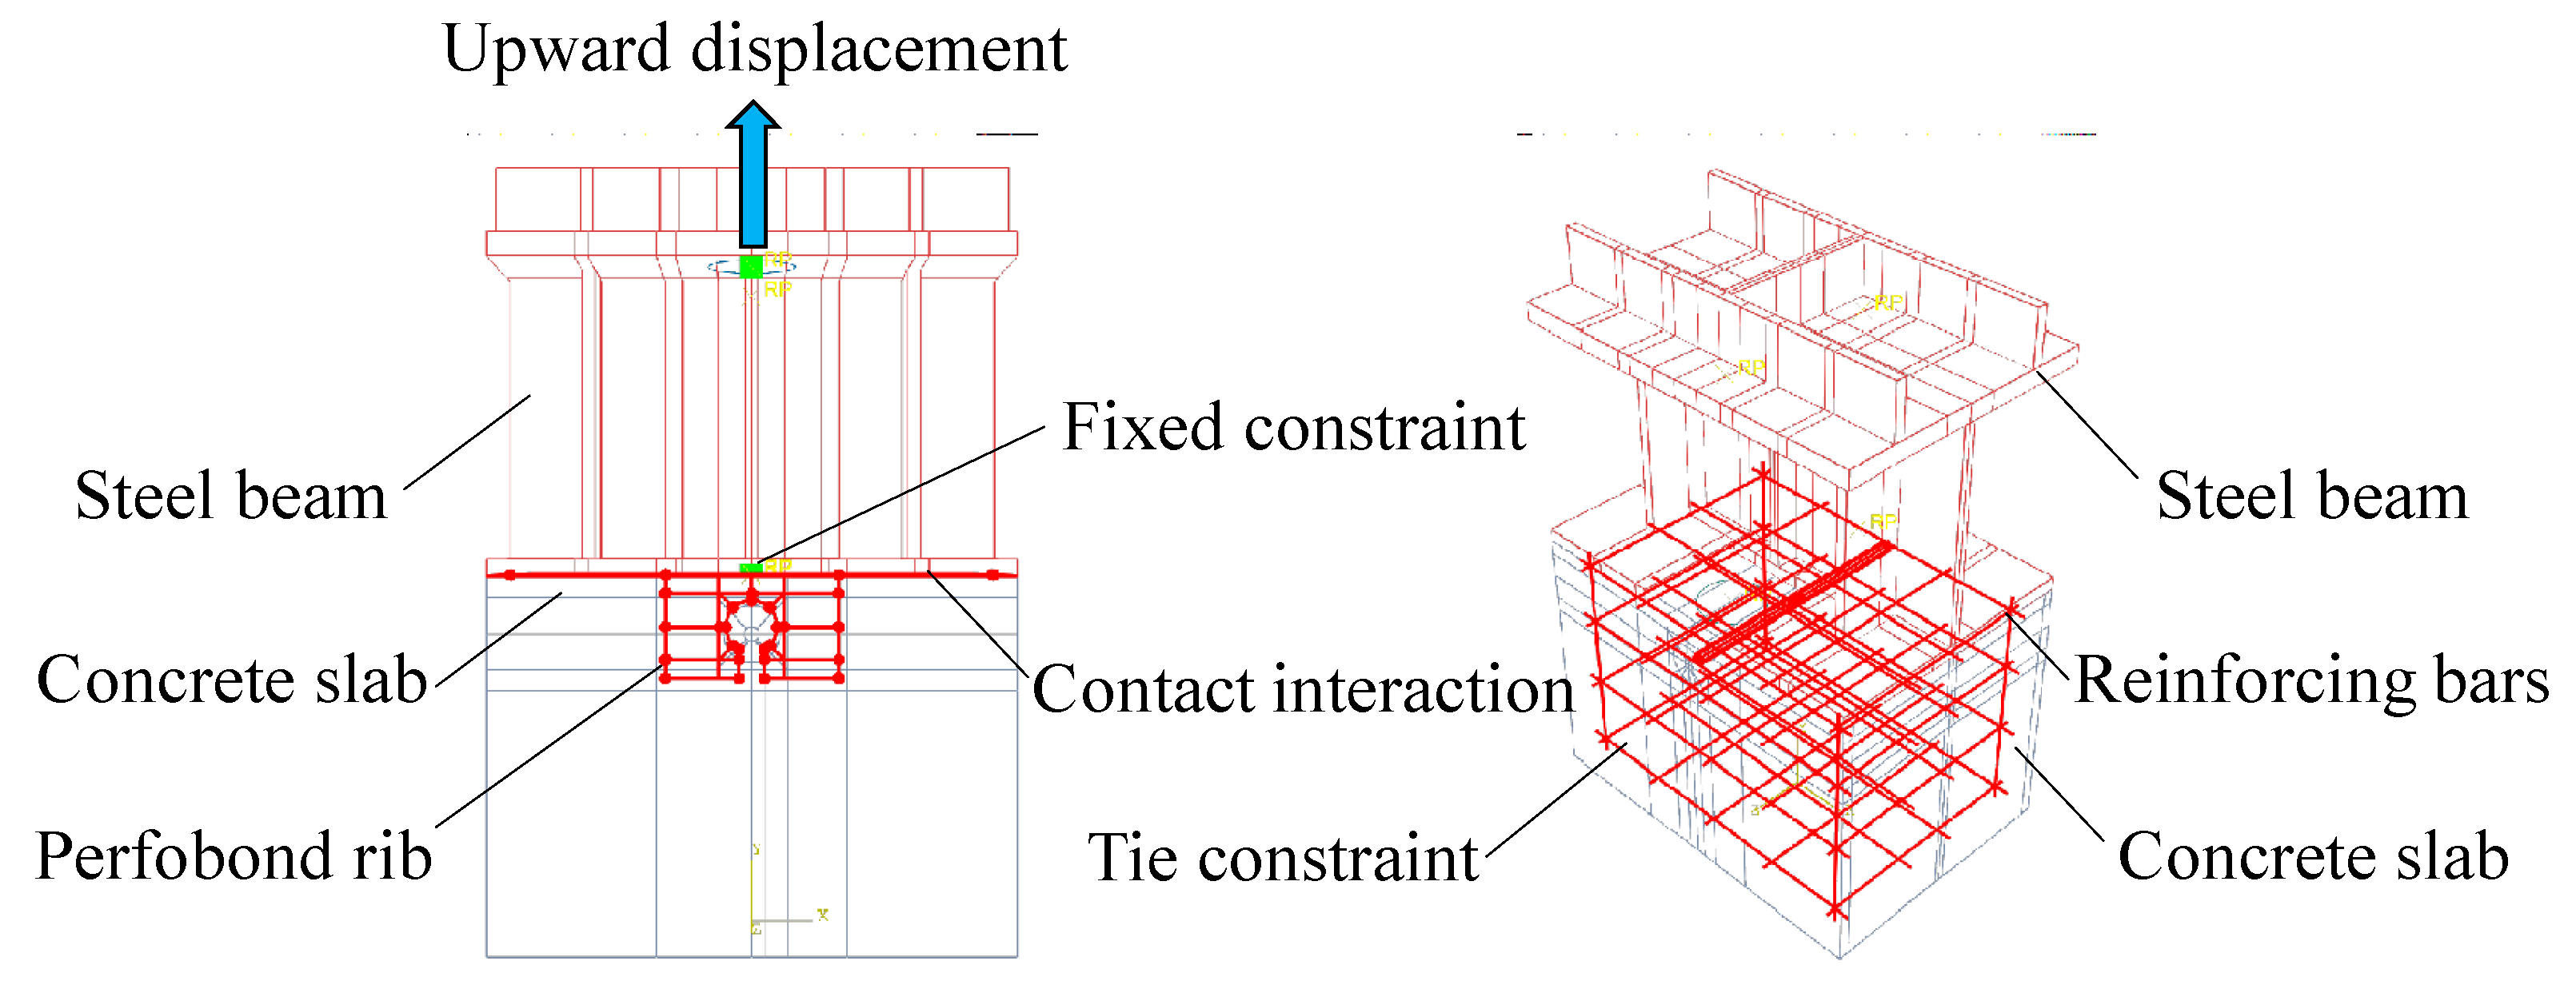
The reference point of the base plate was fixed in all translational and rotational directions, as shown in Figure 9. An upward enforced displacement was applied to the reference point of the jack plate. The perforating rebar was tied to the surrounding concrete in the hole. The other reinforcing bars were embedded inside the whole concrete slab. Contact interactions were applied at the interfaces of the concrete and shear connectors. A “hard” contact was used in the normal direction to prevent penetration. The penalty frictional formulation was applied in the tangential direction. The contact interactions were assumed to be frictionless since greasing was applied to the steel surface in contact with concrete.

Figure 9.
Interaction and boundary conditions.
4.4. Material Constitution of Concrete
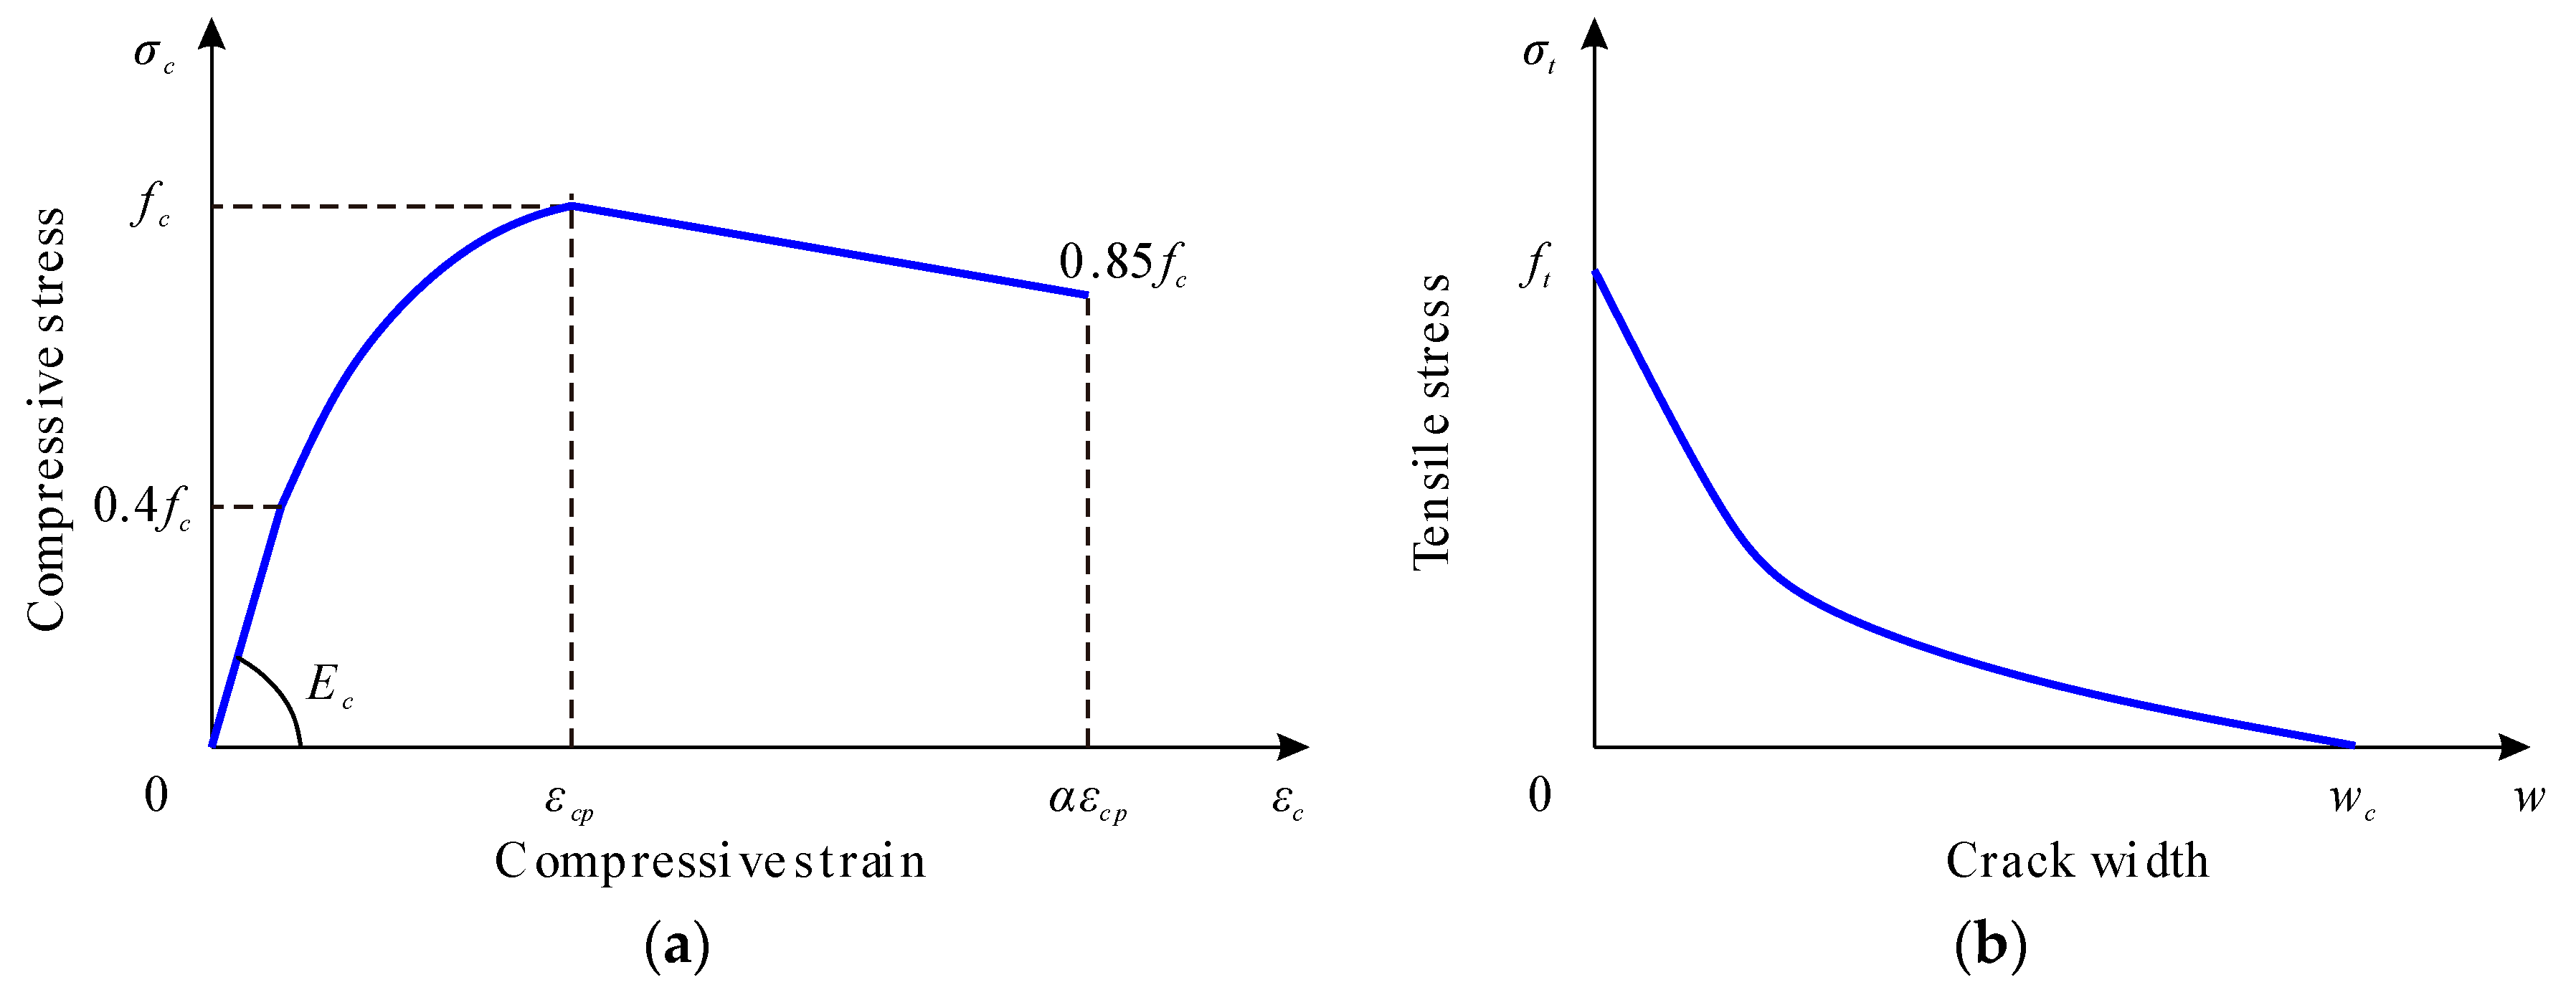
The nonlinear behavior of the concrete material in compression and tension was characterized by a uniaxial compressive stress–strain curve and a tensile stress-crack width relationship, as shown in Figure 10.
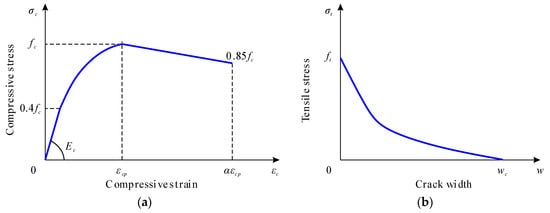
Figure 10.
Material constitution of concrete. (a) Compression; (b) tension.
The concrete material constitutions in compression are described by Equation (1) [26,27]. As shown in Figure 10a, the initial branch of the stress-strain curve is assumed to be elastic. The next two branches are a nonlinear parabolic portion and a descending branch, respectively.
where σc is the compressive stress (MPa); εc is the compressive strain; Ec is the Young’s modulus (MPa); fc is the compressive strength of concrete (MPa); k is the plasticity number, k = Ec·εcp/fc; η is the ratio of strain to peak strain, where η = εc/εcp; εcp = 0.002; and εcu = 0.0033.
A linear stress–strain relationship was adopted to depict the uncracked concrete in tension. For a cracked section, as shown in Figure 10b, a nonlinear approach for the stress-crack width relationship can be determined by using Equation (2) [28].
where σt is the tensile stress (MPa); ft is the tensile strength of concrete (MPa); w is the crack width (mm); wc is the crack width at the complete release of stress, wc = 5.14 GF/ft (mm); GF is the fracture energy required to create a unit area of stress-free crack, GF = 0.073 fc0.18 (N/mm); and the constants are c1 = 3 and c2 = 6.93.
The concrete damaged plasticity model was adopted to describe the degraded response of the concrete material. Two independent uniaxial damage variables, dc and dt, were used to evaluate the damage of concrete due to compressive crushing and tensile cracking [25].
For concrete in compression, the evolution of dc is related to the plastic strain εcpl, determined to be proportional to the inelastic strain εcin = εc–σc/Ec, using a constant factor bc (0 < bc < 1) in Equation (3) [29].
where dc is the concrete compressive damage component; and bc is the ratio of plastic strain to inelastic strain, bc = εcpl/εcin, where bc is taken as 0.7 [29].
For concrete in tension, the damage evolution component dt is associated with the “plastic” crack width wpl, which is proportional to the crack width w, using a constant factor bt (0 < bt < 1) in Equation (4), referring to [29].
where dt is the tensile damage variable of concrete; l0 is assumed to be unit length; and bt is the ratio of the “plastic” crack width to the crack width, bt = wpl/w, where bt is set as 0.1 [29].
4.5. Material Constitution of Steel
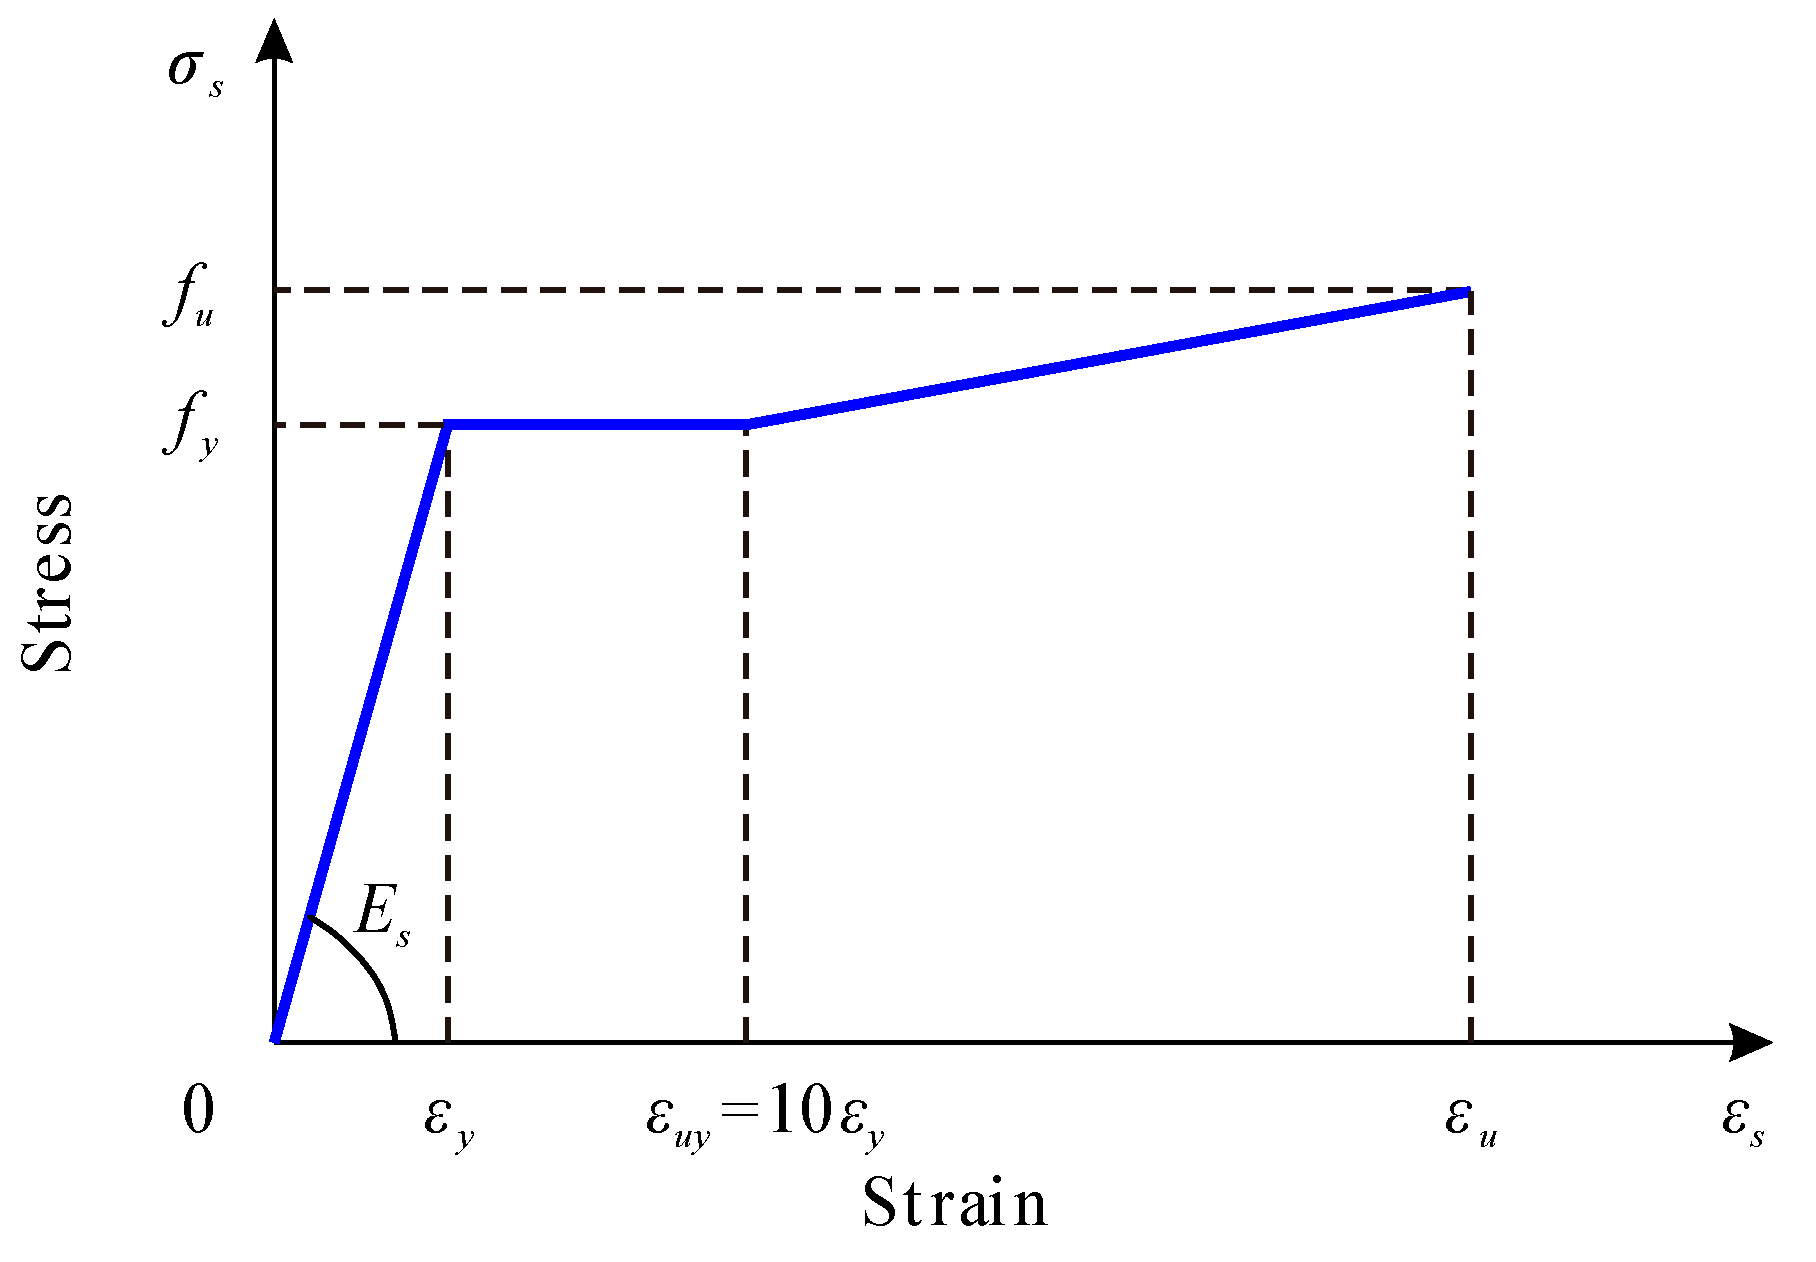
Figure 11 shows the stress-strain relationship of the structural and reinforcing steel modeled by tri-linear curves. The first stage is assumed to be elastic with Young’s modulus Es, followed by a stage of yielding, and finally a regime of strain hardening. The stress-strain relationships for steel in tension and compression were assumed to be the same.
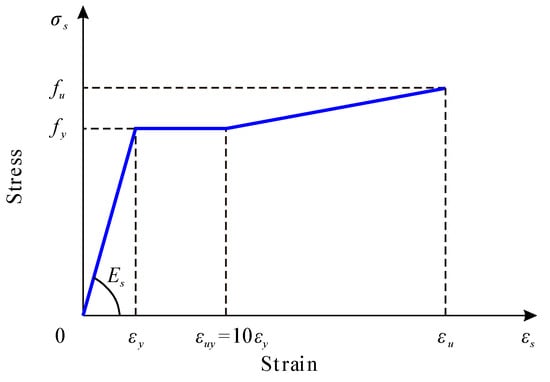
Figure 11.
Material constitution of steel.
4.6. Verification of Finite Element Model
The numerical results resembled the pull-out failures of conventional and notched perfobond shear connectors reasonably well, as shown in Figure 12. The concrete crack initially occurred near the perfobond shear connectors and spread out across the concrete slab as the load increased. The rebar in the hole of conventional perfobond shear connectors yielded at the locations of perforation due to interlock effects. In comparison, smaller deformation was observed in the analyzed failure mode of notched perfobond shear connectors. The concrete dowels in the hole failed in shear.
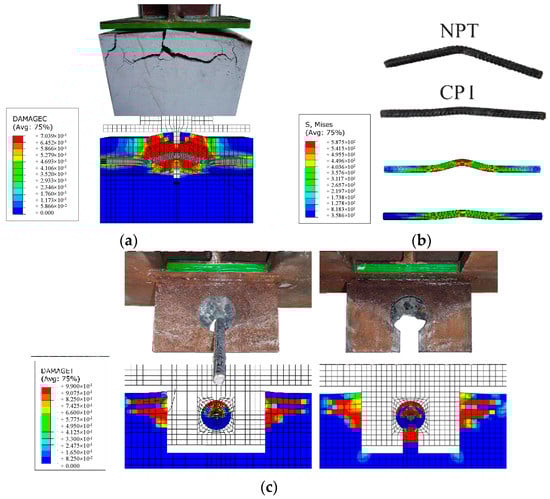
Figure 12.
Tested and analyzed failure modes. (a) Crack in concrete slab; (b) deformation of perforating rebar; (c) shear of concrete dowel.
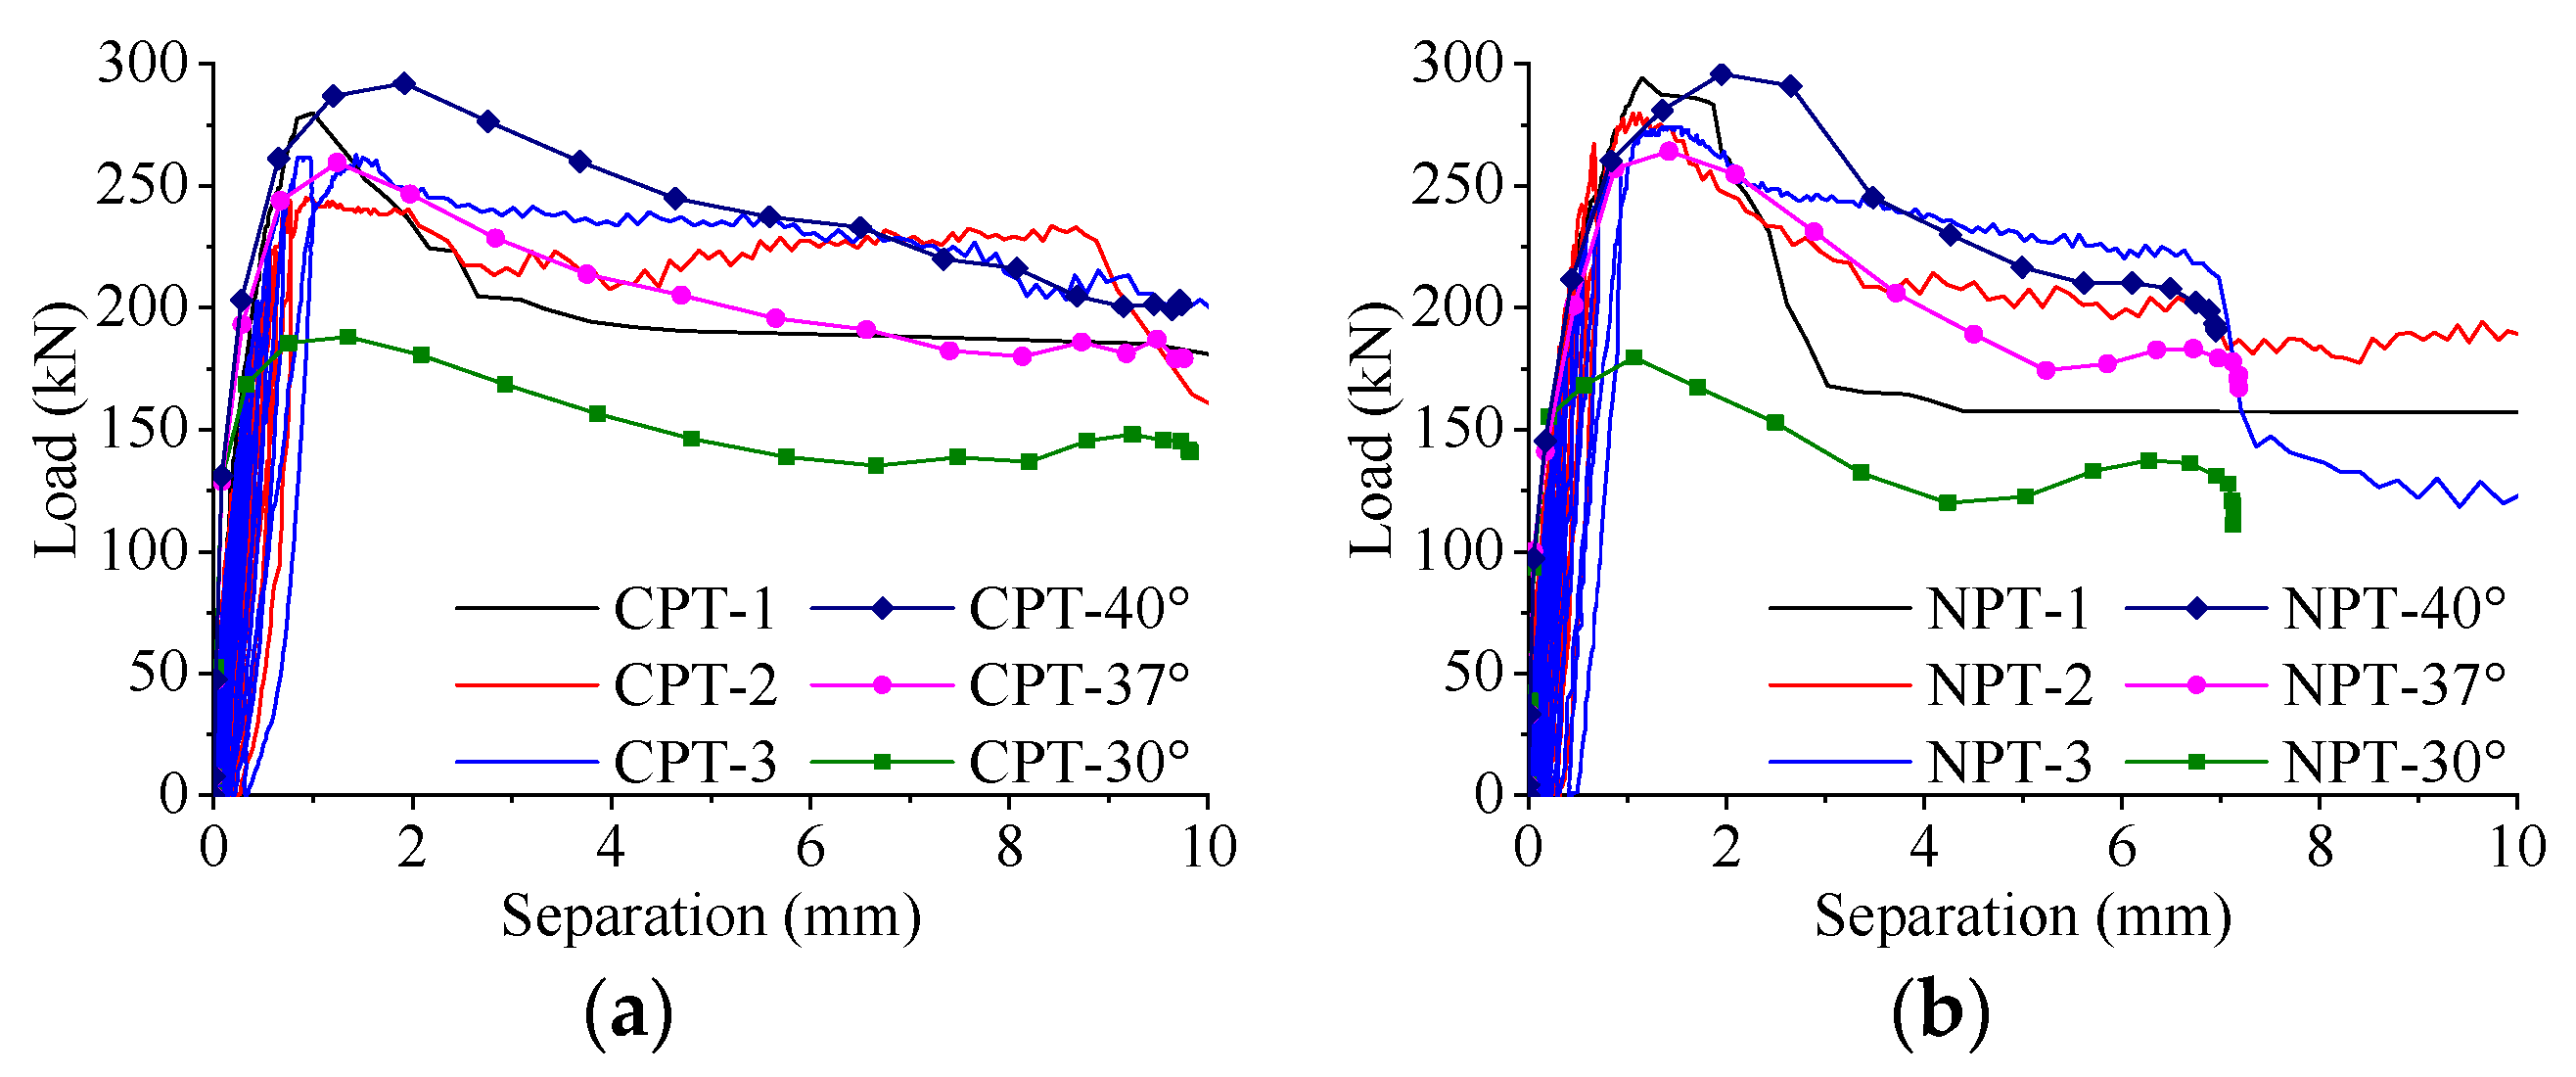
As shown in Figure 13, the load–separation curves obtained from finite element analysis were compared with pull-out test results. Three stages were identified in the typical load–separation curves of both conventional and notched perfobond shear connectors, including an elastic stage, a nonlinear parabolic regime, and a descending branch. When the dilation angles of concrete were changed among 30°, 37°, and 40°, the analyzed pull-out resistance of conventional perfobond shear connectors was 188.1 kN, 259.5 kN, and 292.1 kN, respectively, accounting for 71.6%, 98.8%, and 111.2% of the mean test result, which equaled 262.6 kN. For notched perfobond shear connectors with the dilation angles of 30°, 37°, and 40°, the analyzed pull-out resistances were 179.6 kN, 264.1 kN, and 295.8 kN, respectively, taking up 63.5%, 93.4%, and 104.6% of the mean test result, which equaled 282.7 kN. Variations of the viscosity among 0, 0.1, and 0.01 showed no influences on the load–separation curves. It was indicated that the calibrated finite element model could be used to generate reasonable analysis results for both conventional and notched perfobond shear connectors. In this study, the dilation angle could be preferably set as 37° and the viscosity could be taken as zero.

Figure 13.
Tested and analyzed load–slip curves. (a) Conventional perfobond shear connector; (b) notched perfobond shear connector.
5. Parametric Study
As shown in Table 3, a total of 33 simulations were performed to study the further influences of connector dimension and material properties on the pull-out resistance of notched perfobond shear connectors. The parameters included the hole diameter dp, the cut width cw, the perfobond thickness tp, the concrete strength fcu, the rebar diameter dr, the yield strength fry of the rebar, and the yield strength fsy of the structural steel.
Table 3.
Generalization of parametric models.
5.1. Influence of Hole Diameter
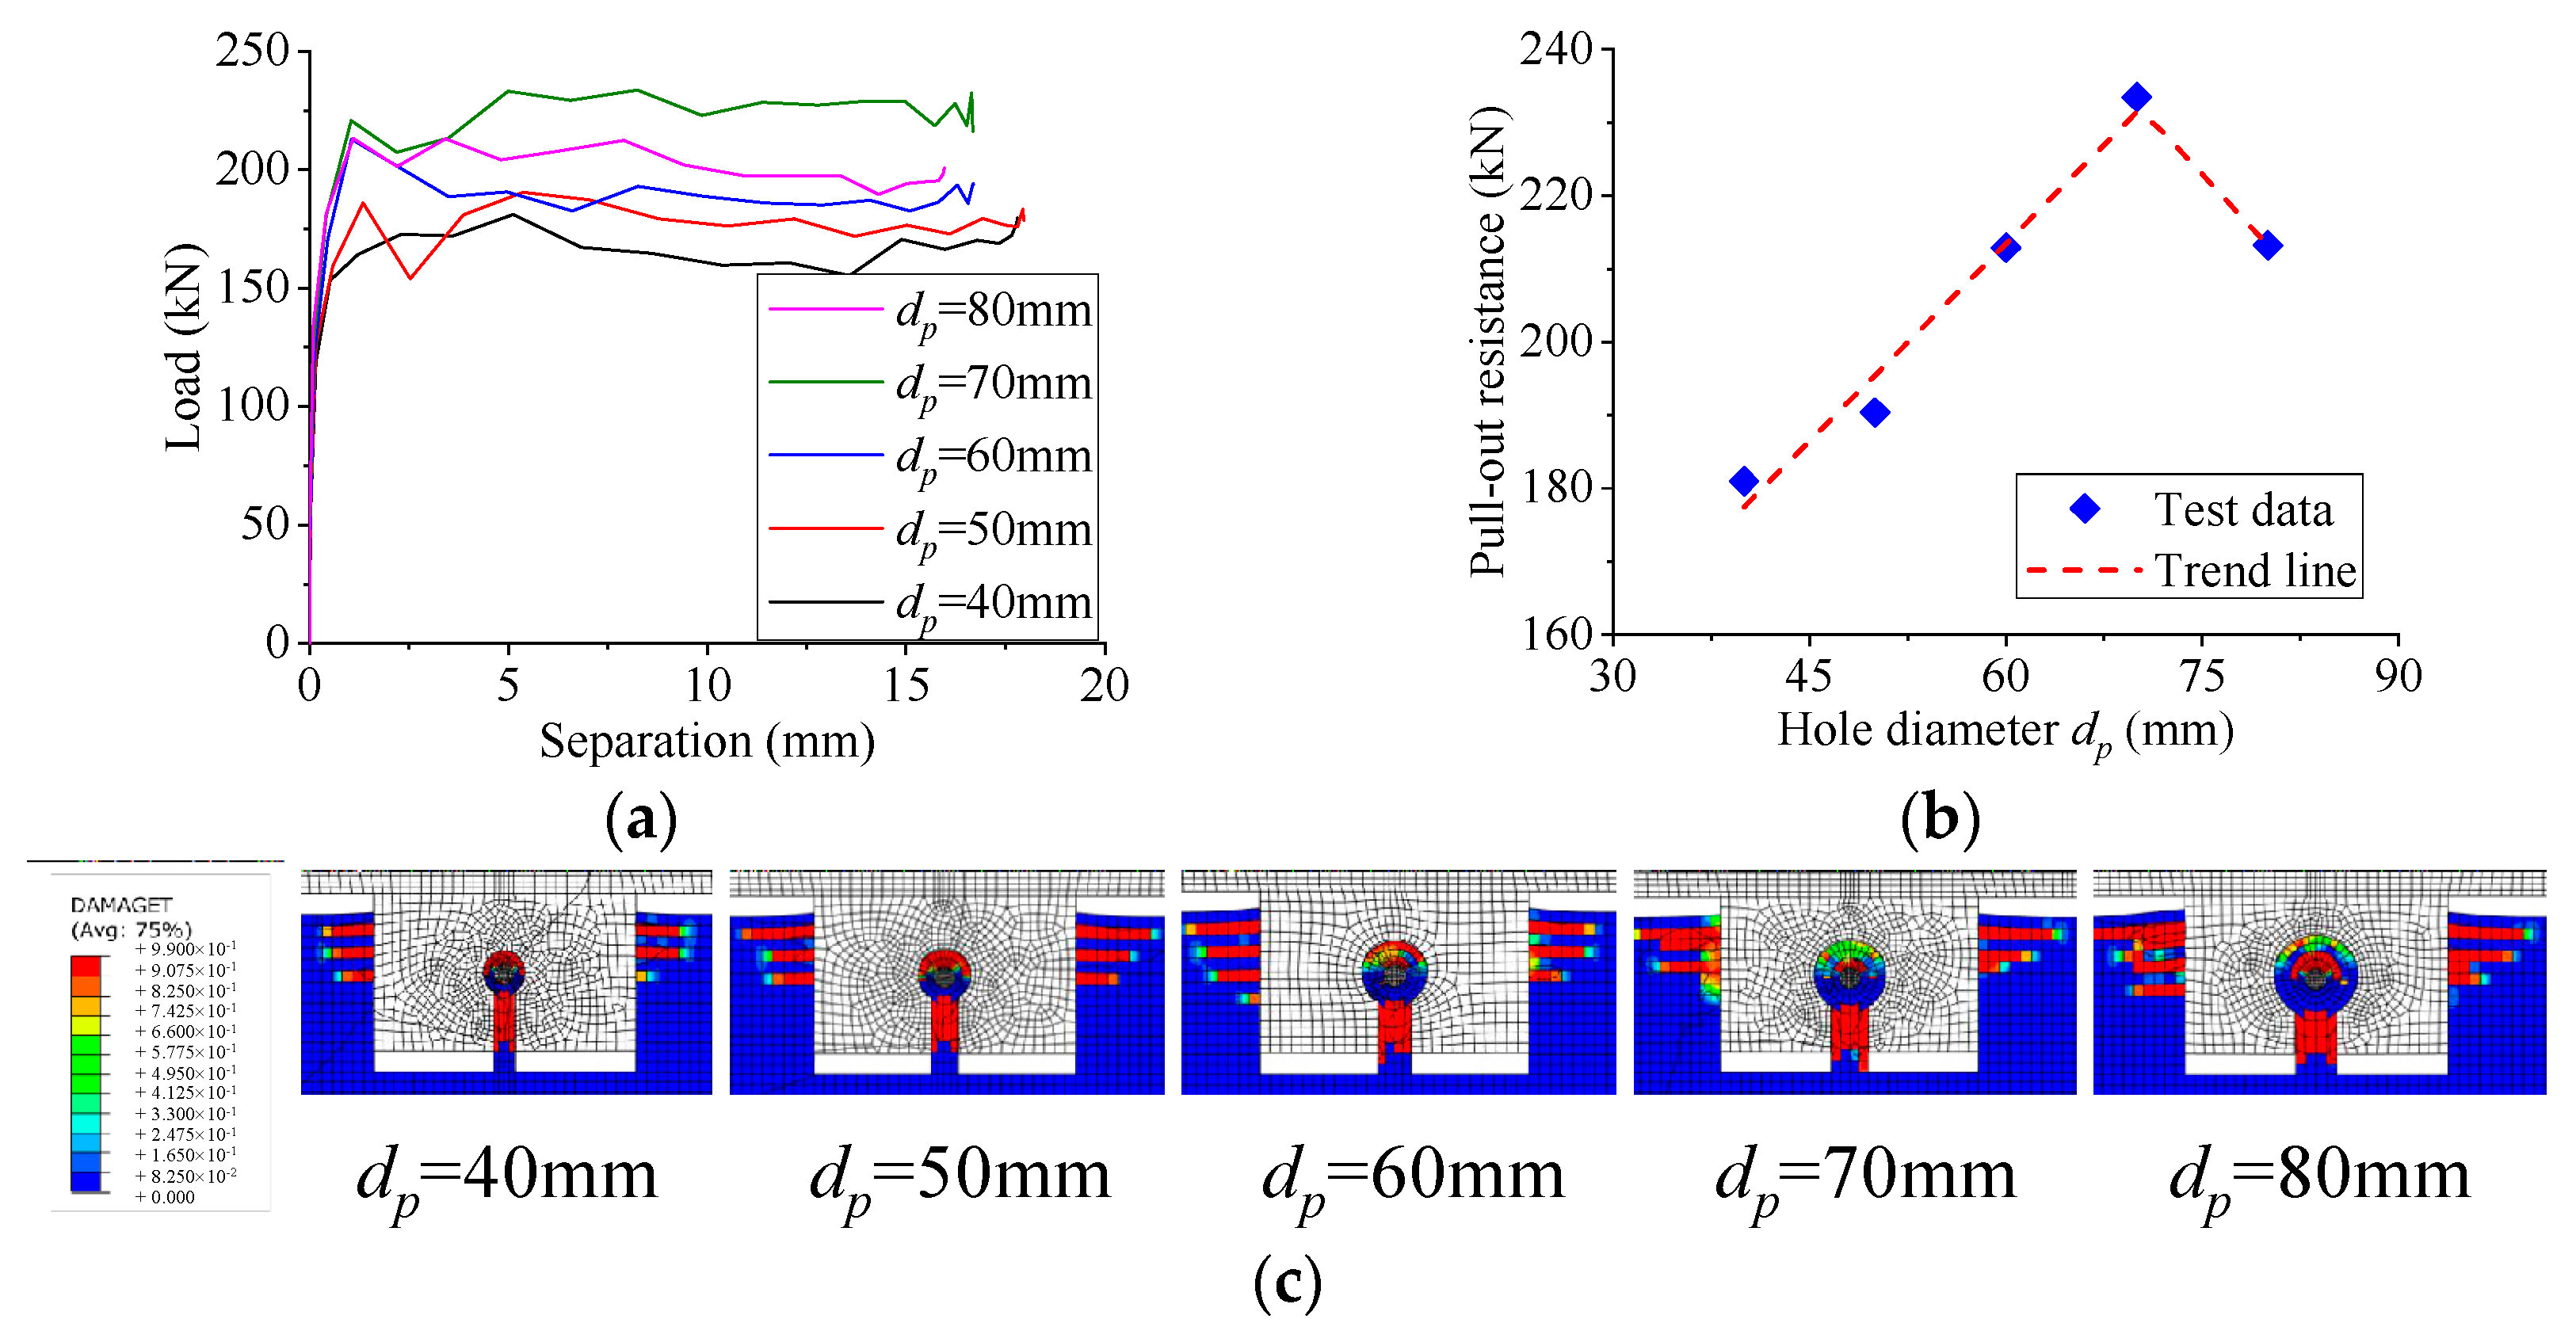
The influence of the hole diameter on the pull-out behavior of notched perfobond shear connectors is shown in Figure 14. In this group of specimens, the cut ratio cw/dp was kept as 0.5. When the hole diameter was increased from 40 mm to 50 mm, 60 mm, 70 mm, and 80 mm, the pull-out resistance of the notched perfobond shear connector was increased by 5%, 18%, 29%, and 18%, respectively. It was revealed that the increase of the hole diameter between 40 mm and 70 mm led to an increase in the pull-out behavior of the notched perfobond shear connector. The main reason was that the pull-out failure mode was directly related to the shear of the concrete dowel in the hole, whose resistance was increased by increasing the hole diameter. When the hole diameter was greater than 70 mm, the pull-out resistance tended to increase more slowly. This was possibly because the restraint effect of the perforating rebar reduced with a large concrete dowel in the hole of notched perfobond shear connectors.
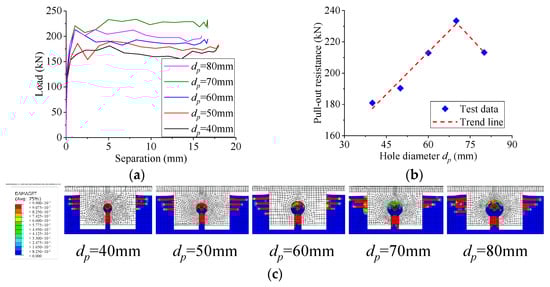
Figure 14.
Influence of hole diameter. (a) Load–separation curves; (b) influence analysis; (c) failure mode.
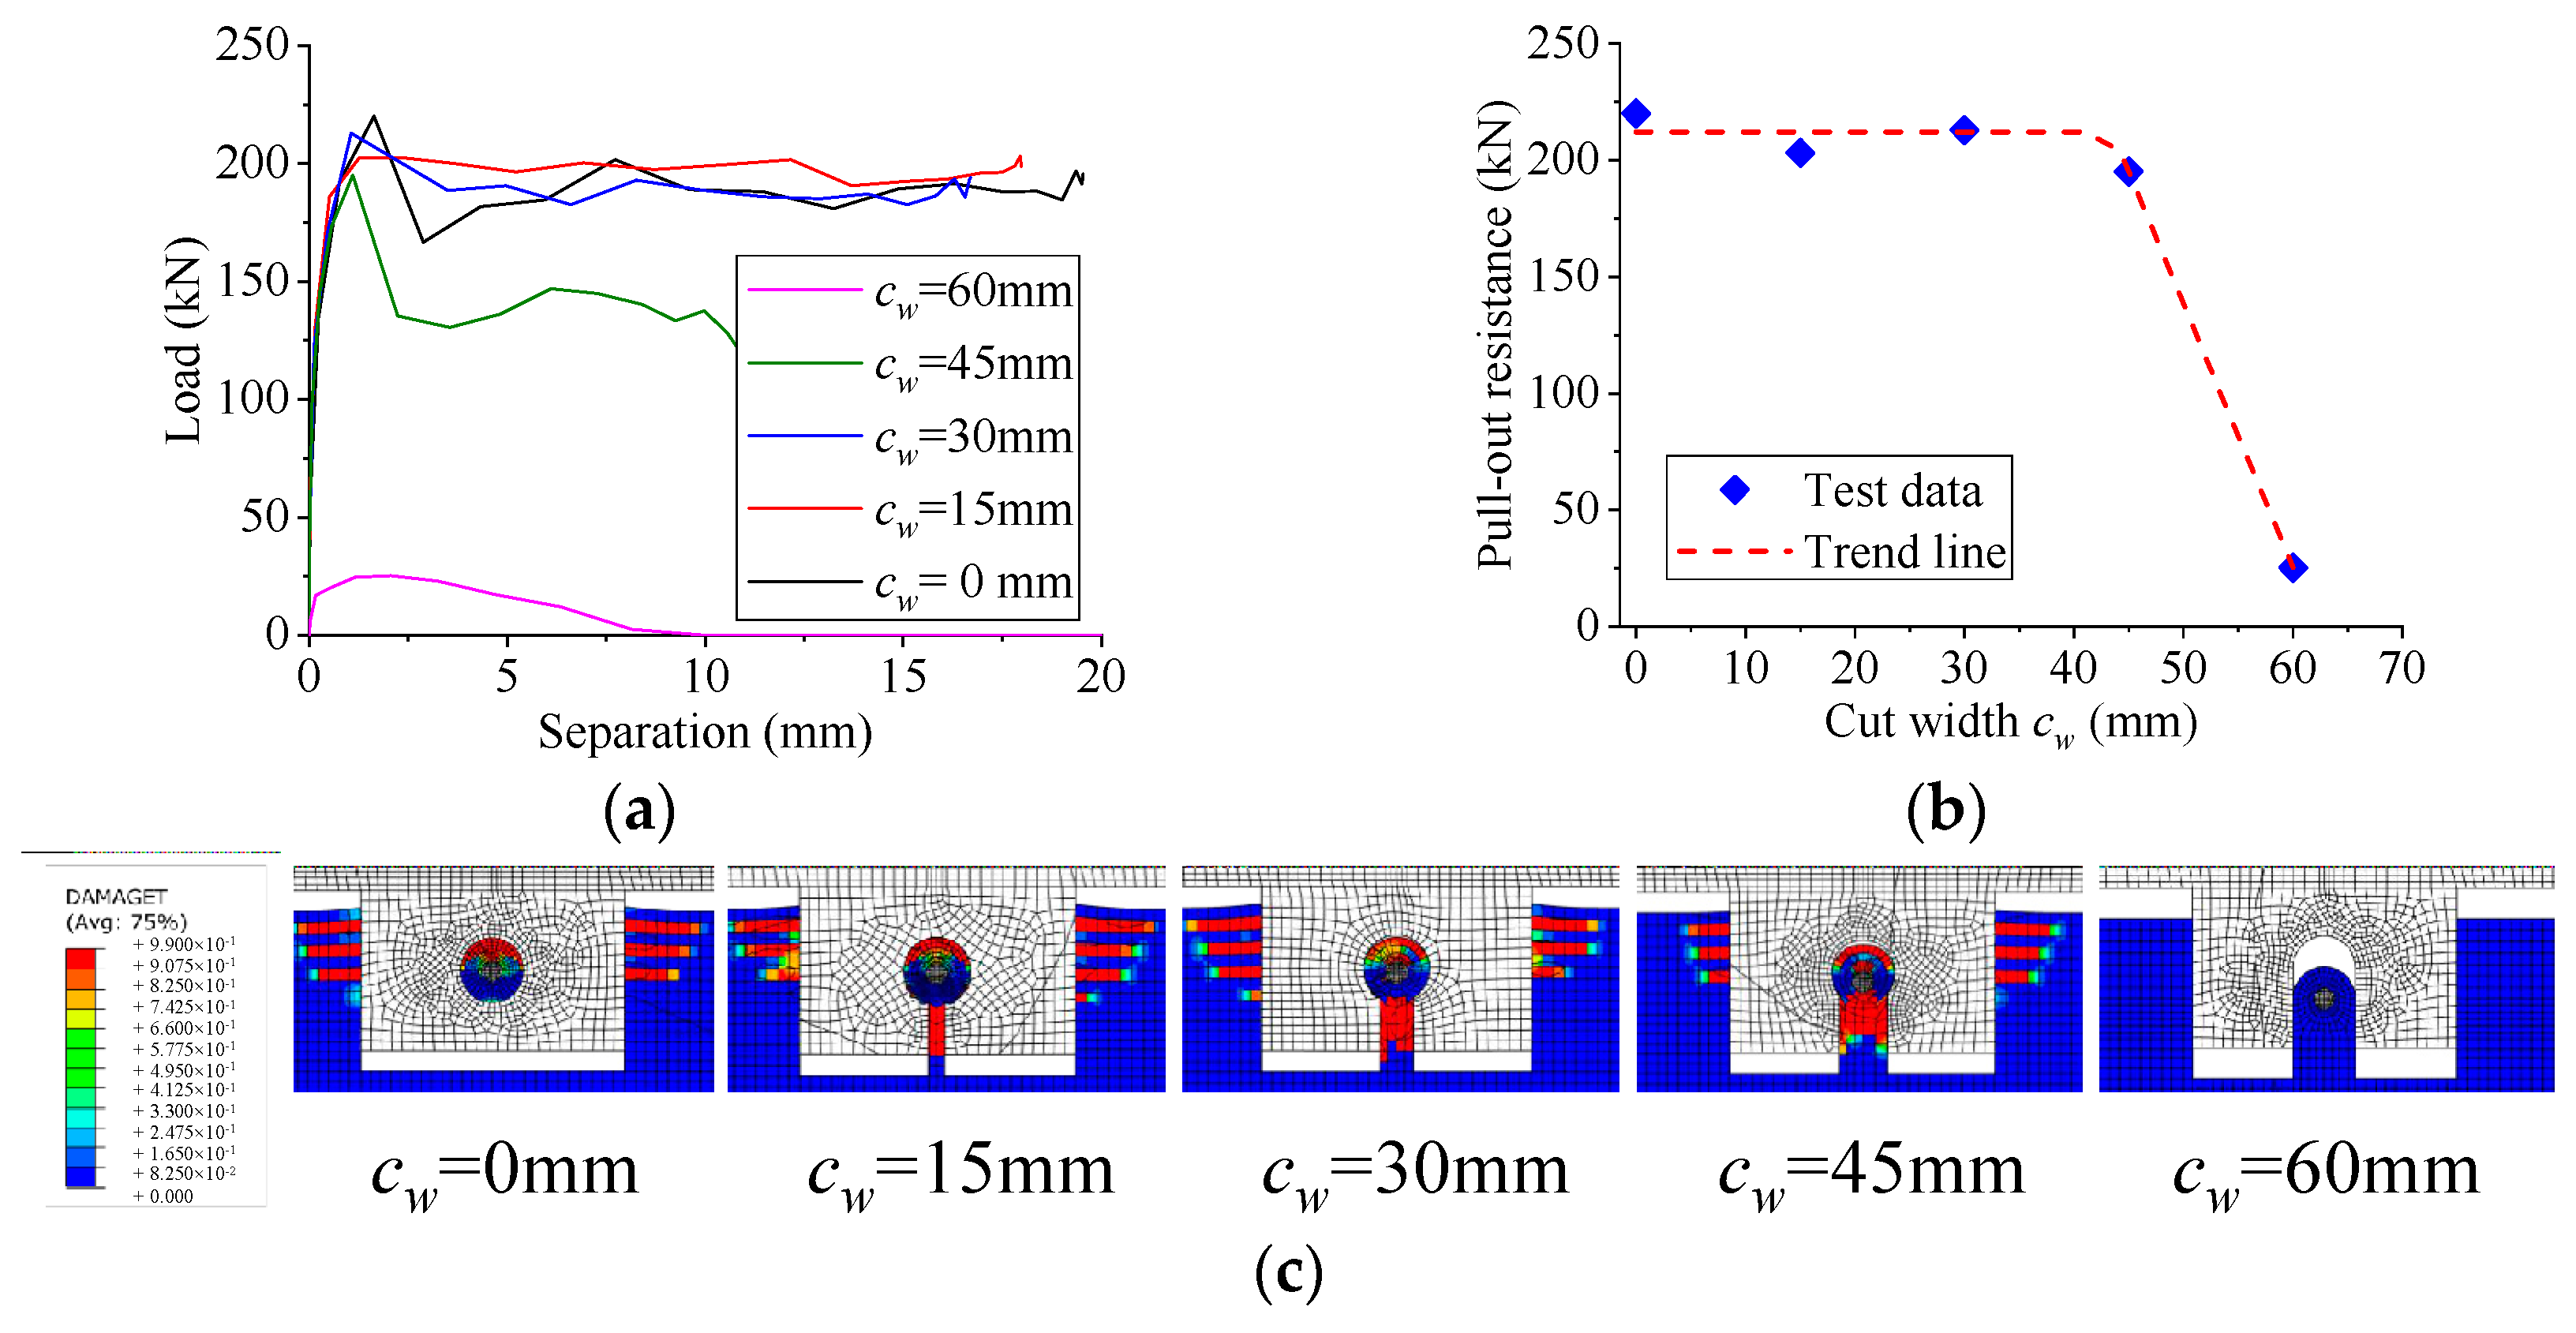
5.2. Influence of Cut Width
Figure 15 shows the influence of the cut width on the pull-out behavior of notched perfobond shear connectors. The cut ratio cw/dp in this group of specimens changed between 0 and 1. The conventional perfobond shear connector had a cut width of 0 mm and a cut ratio as 0. The notched perfobond shear connector had cut widths of 15 mm, 30 mm, 45 mm, and 60 mm, with the corresponding cut ratios as 0.25, 0.50, 0.75, and 1.00. It was shown that the increase of the cut width had a significant influence on the pull-out resistance of the notched perfobond shear connector. When the cut width was smaller than 45 mm, the corresponding cut ratio was smaller than 0.75, and the variations in the pull-out resistance of the notched perfobond shear connector were no greater than 11%. However, the notched perfobond shear connector with a cut width of 60 mm and a cut ratio of 0 had only 11% of the pull-out resistance in comparison with other specimens in this group. The reason for this might be that the U-shaped hole could hardly bear the dowel forces of the concrete and the perforating rebar in the hole.

Figure 15.
Influence of cut width. (a) Load–separation curves; (b) influence analysis; (c) failure mode.
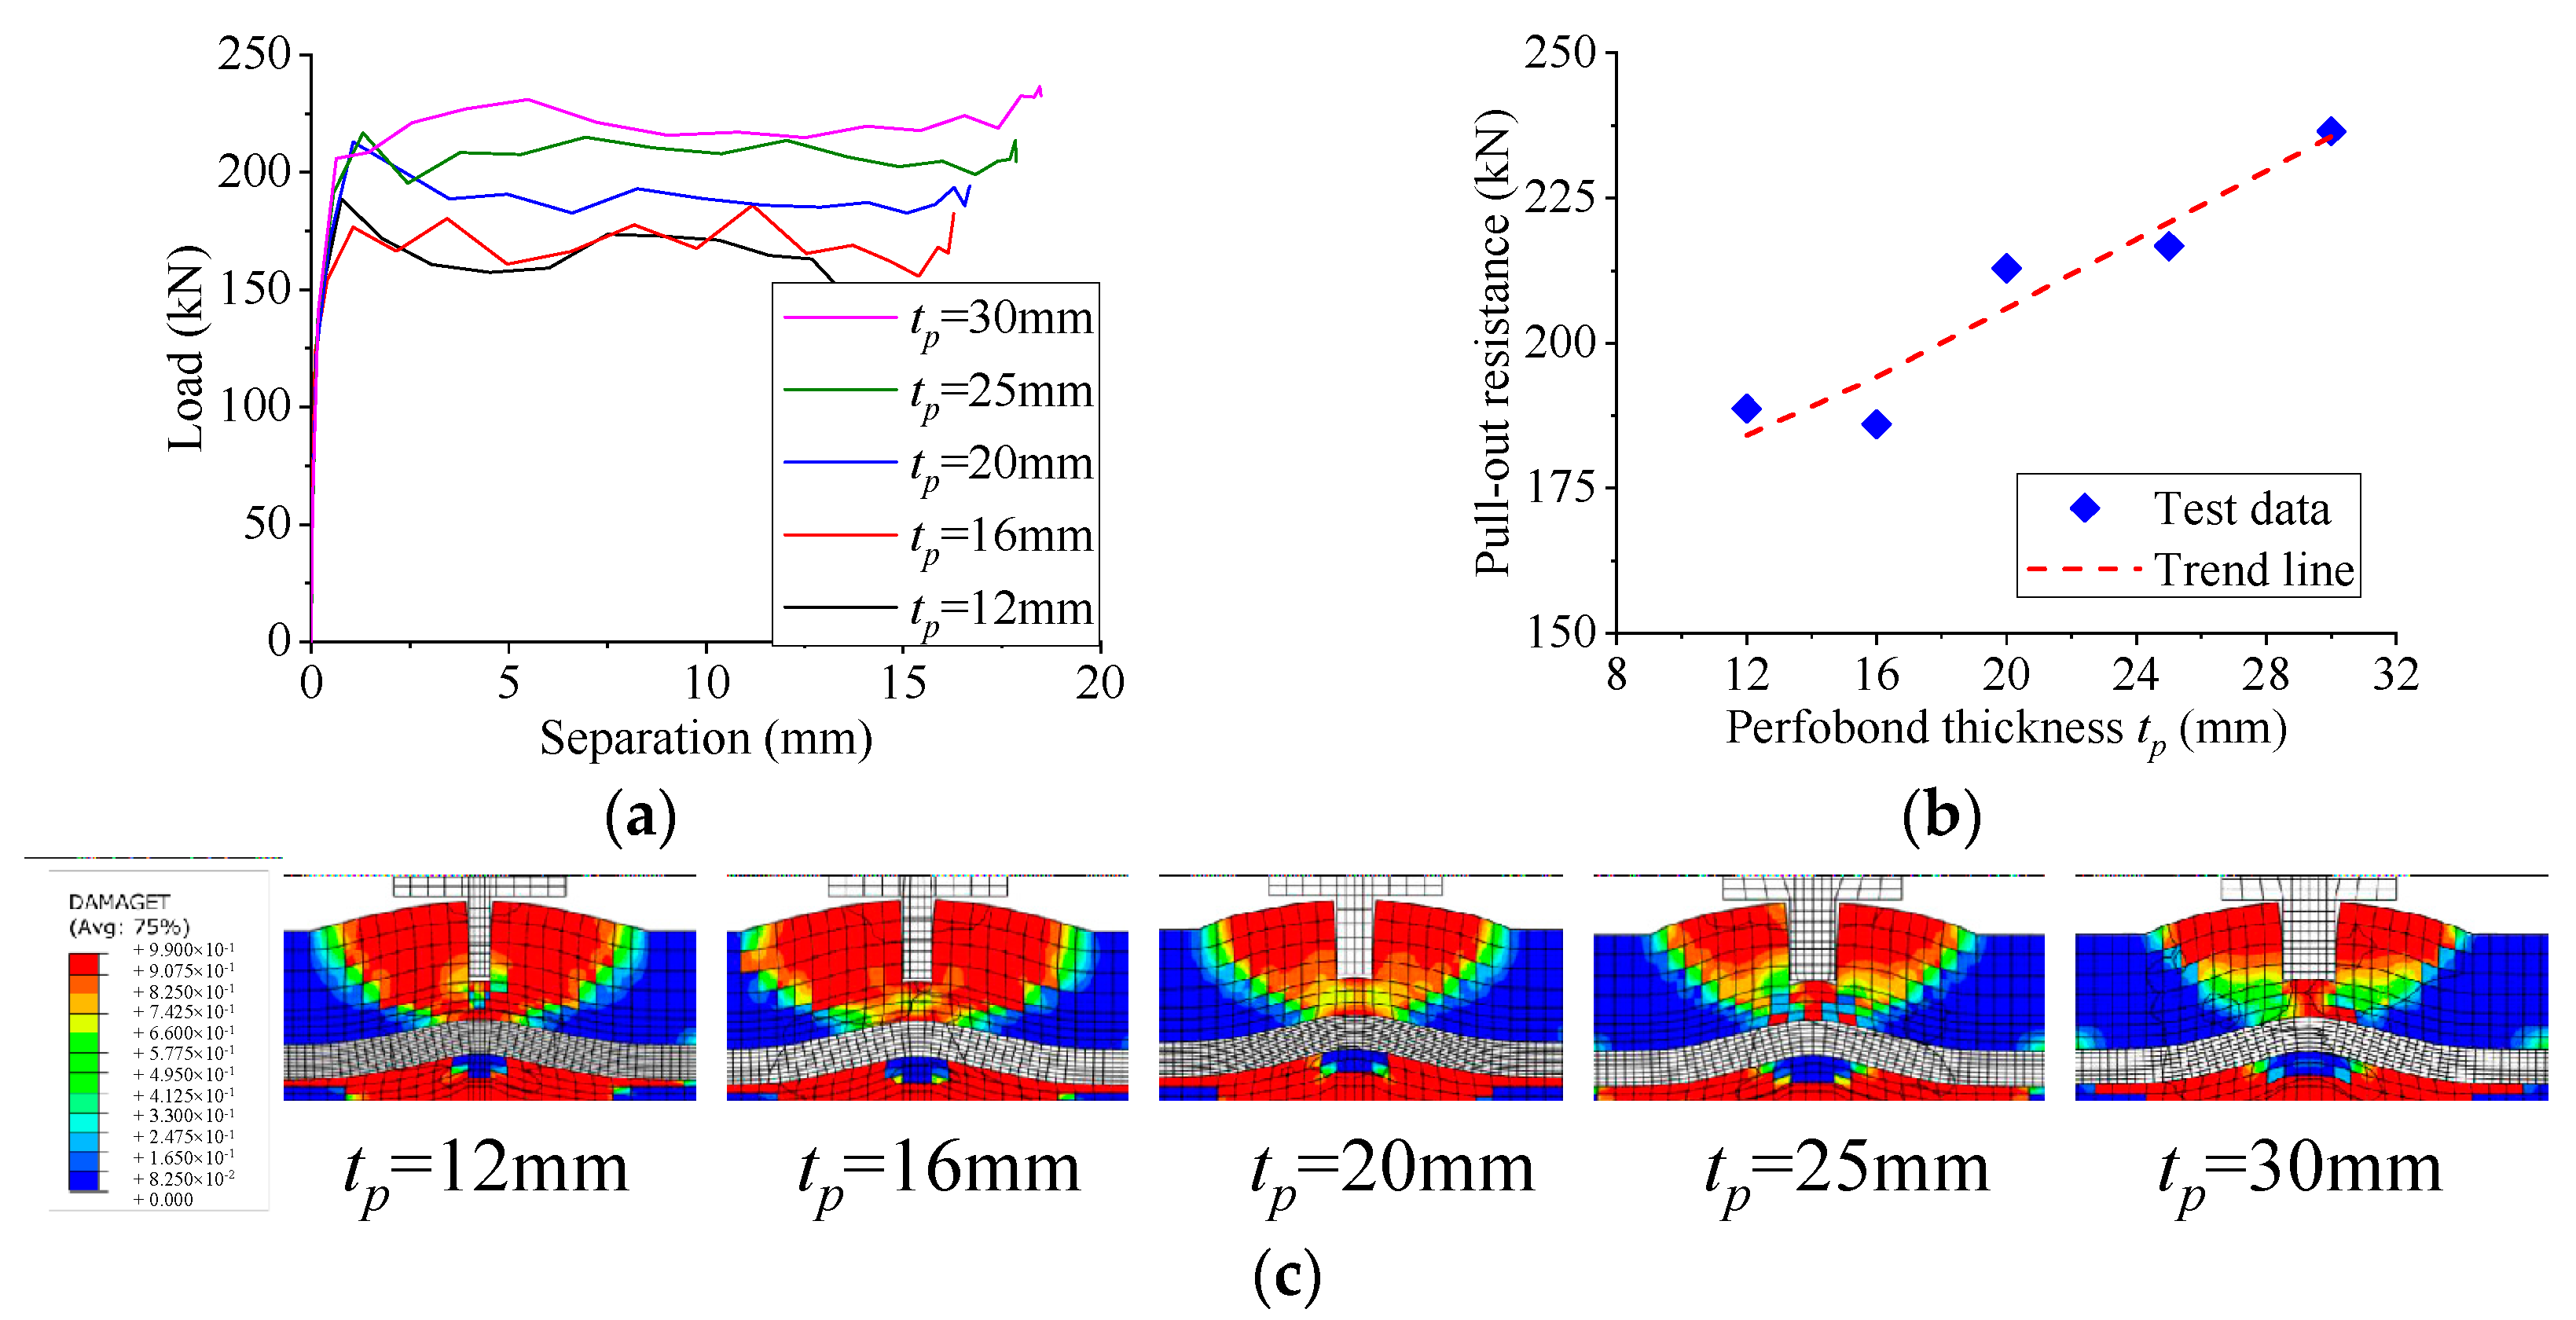
5.3. Influence of Perfobond Thickness
As shown in Figure 16, the perfobond thickness had a great influence on the pull-out behavior of notched perfobond shear connectors. When the thickness of the perfobond rib was increased from 12 mm to 16 mm, 20 mm, 25 mm, and 30 mm, the pull-out resistance of notched perfobond shear connectors varied by −1%, 13%, 17%, and 24%, respectively. It was revealed that the increase of the perfobond thickness would lead to an increase in the pull-out resistance of the notched perfobond shear connector. The main reason for this was that increasing the thickness of the perfobond rib increased the contact area of the hole edge, which reduced the contact stress between the perfobond rib and the concrete dowel in the hole. As a result, the pull-out resistance of the notched perfobond shear connector could be increased by using a thicker perfobond rib.
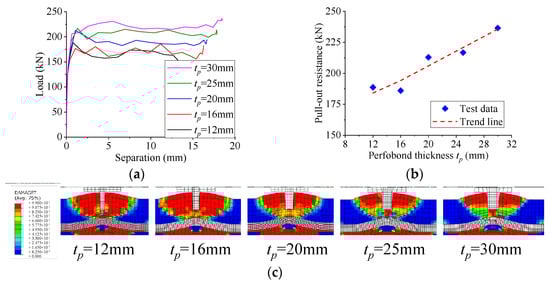
Figure 16.
Influence of perfobond thickness. (a) Load–separation curves; (b) influence analysis; (c) failure mode.
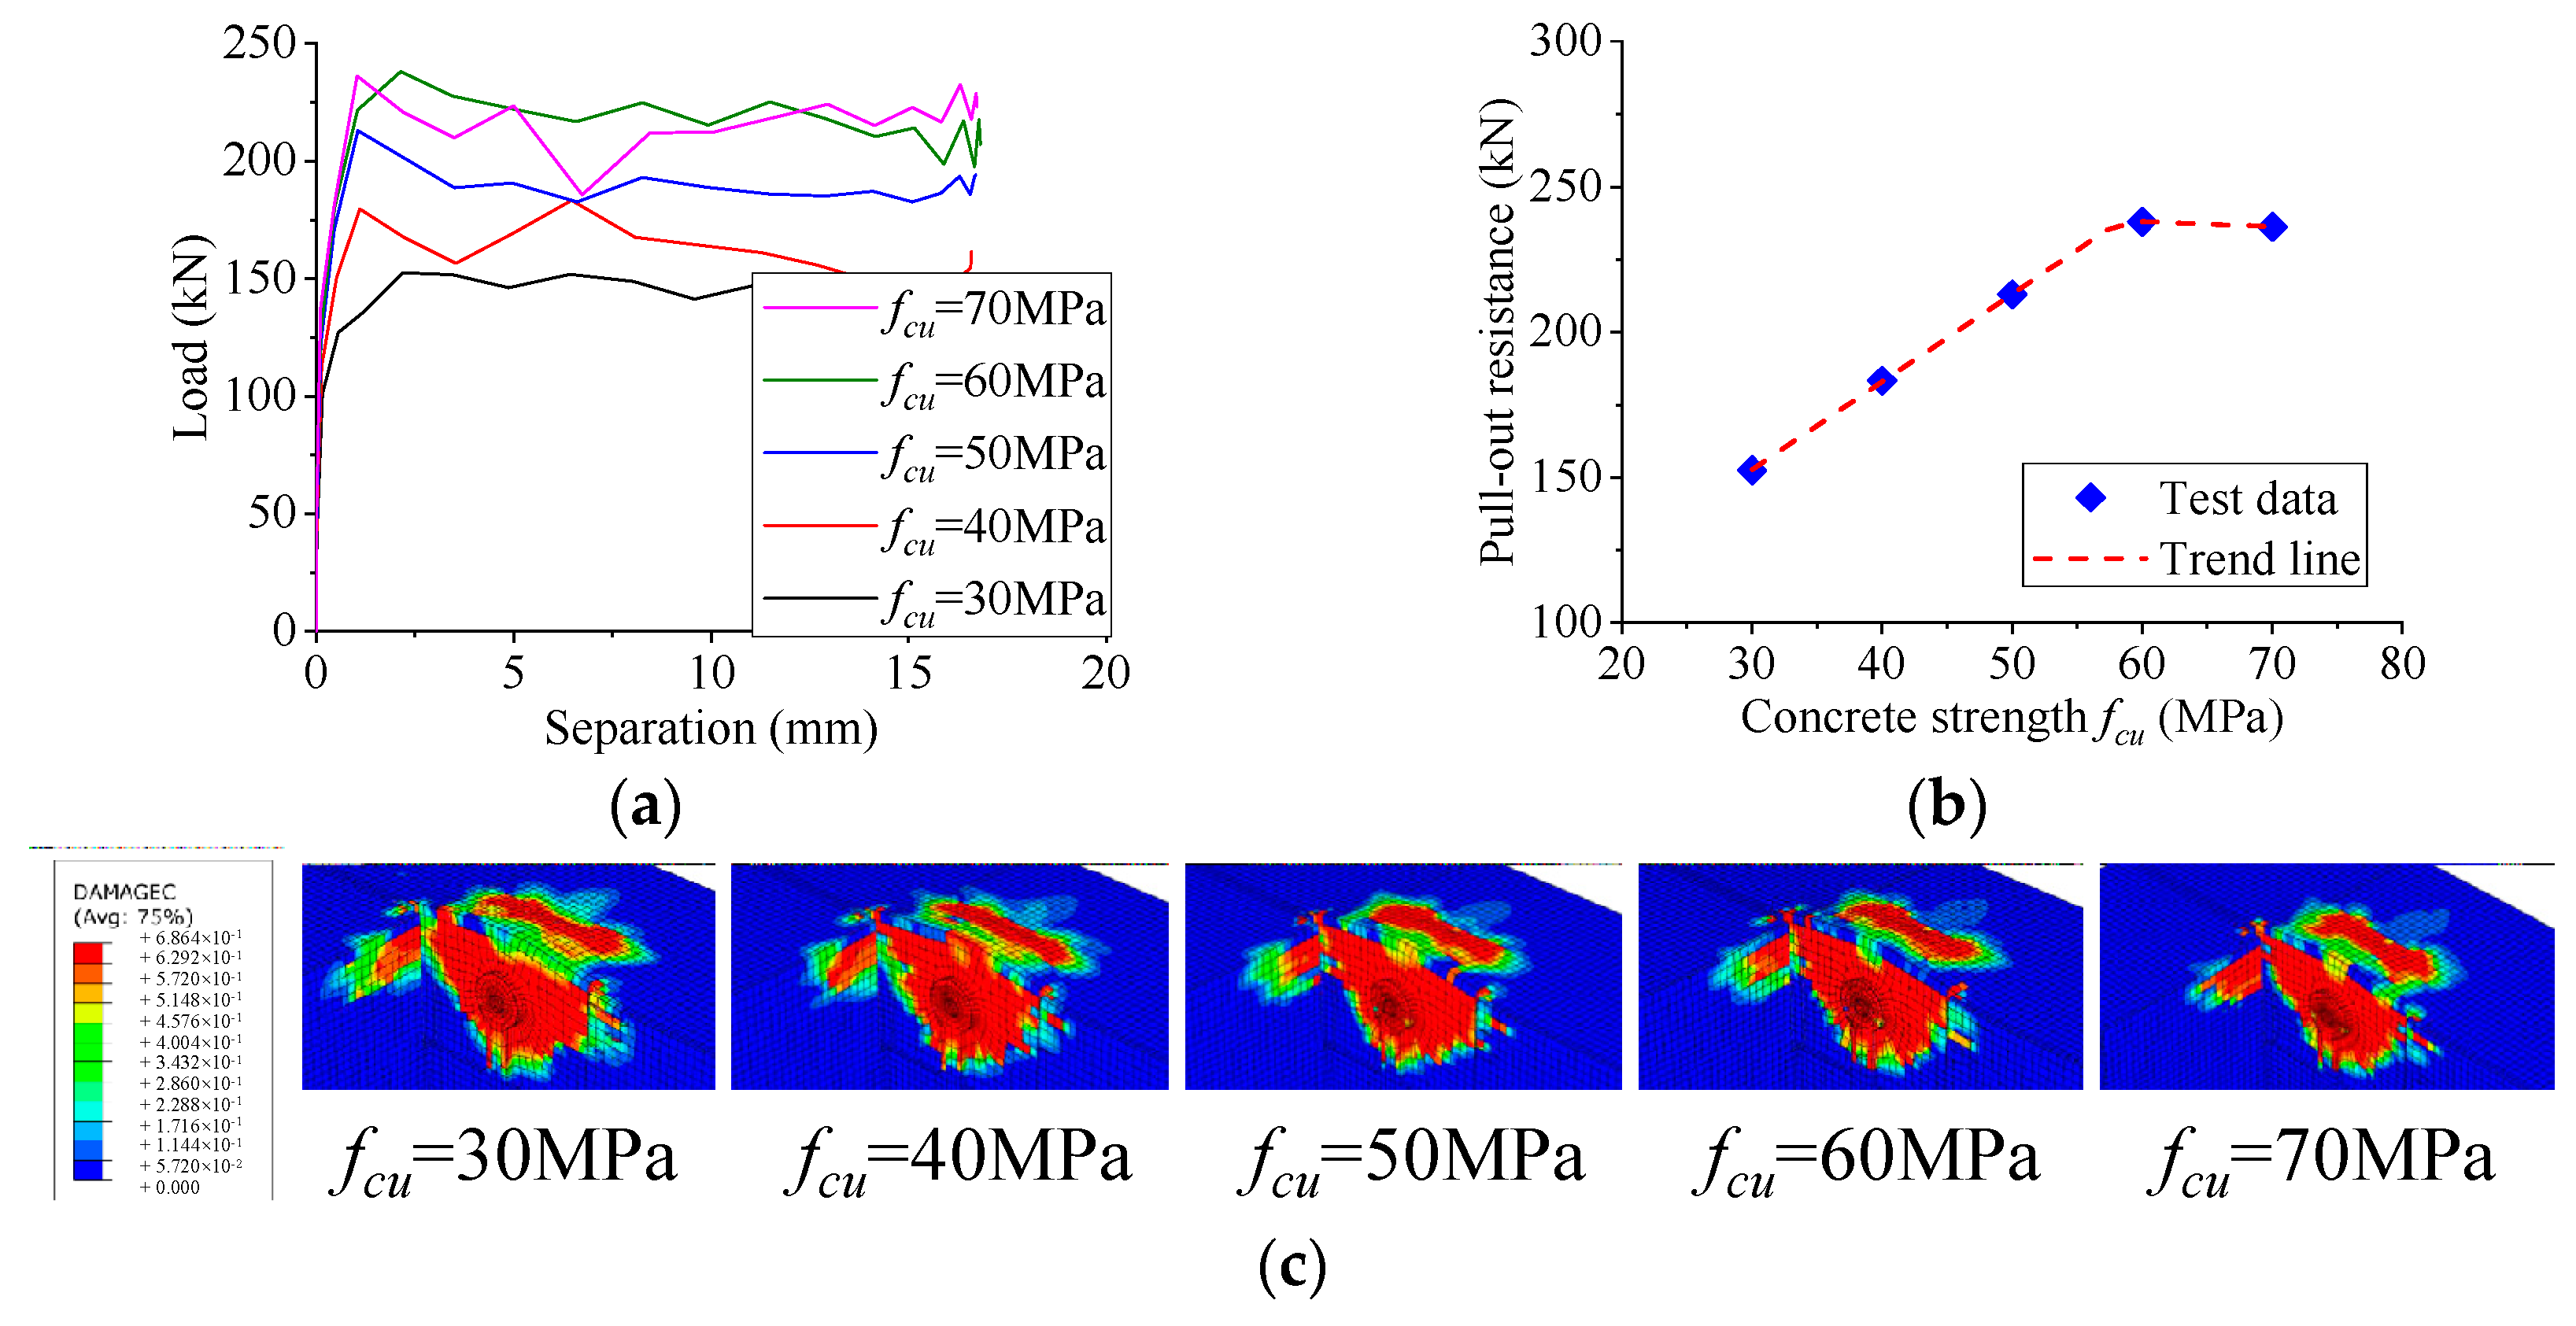
5.4. Influence of Concrete Strength
Figure 17 shows the influence of the concrete strength on the pull-out behavior of notched perfobond shear connectors. When the concrete strength was increased from 30 MPa to 40 MPa, 50 MPa, 60 MPa, and 70 MPa, the pull-out resistance increased by 20%, 40%, 56%, and 55%, respectively. It was indicated that the increase of the concrete strength would lead to a great increase in the pull-out resistance of the notched perfobond shear connector. It was possibly because higher strength concrete resulted in a smaller damaged region of concrete dowels at the pull-out failure. Therefore, the pull-out resistance of the notched perfobond shear connector could be increased by using higher strength concrete. However, when the concrete strength was greater than 60 MPa, the pull-out resistance tended to stop increasing. The reason for this might be that higher strength rebar that matched the higher strength concrete was required to achieve full resistance of the concrete dowel in the hole.
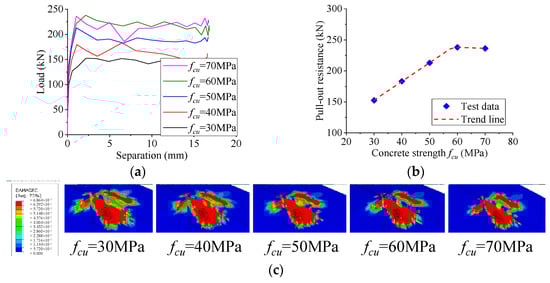
Figure 17.
Influence of concrete strength. (a) Load–separation curves; (b) influence analysis; (c) failure mode.
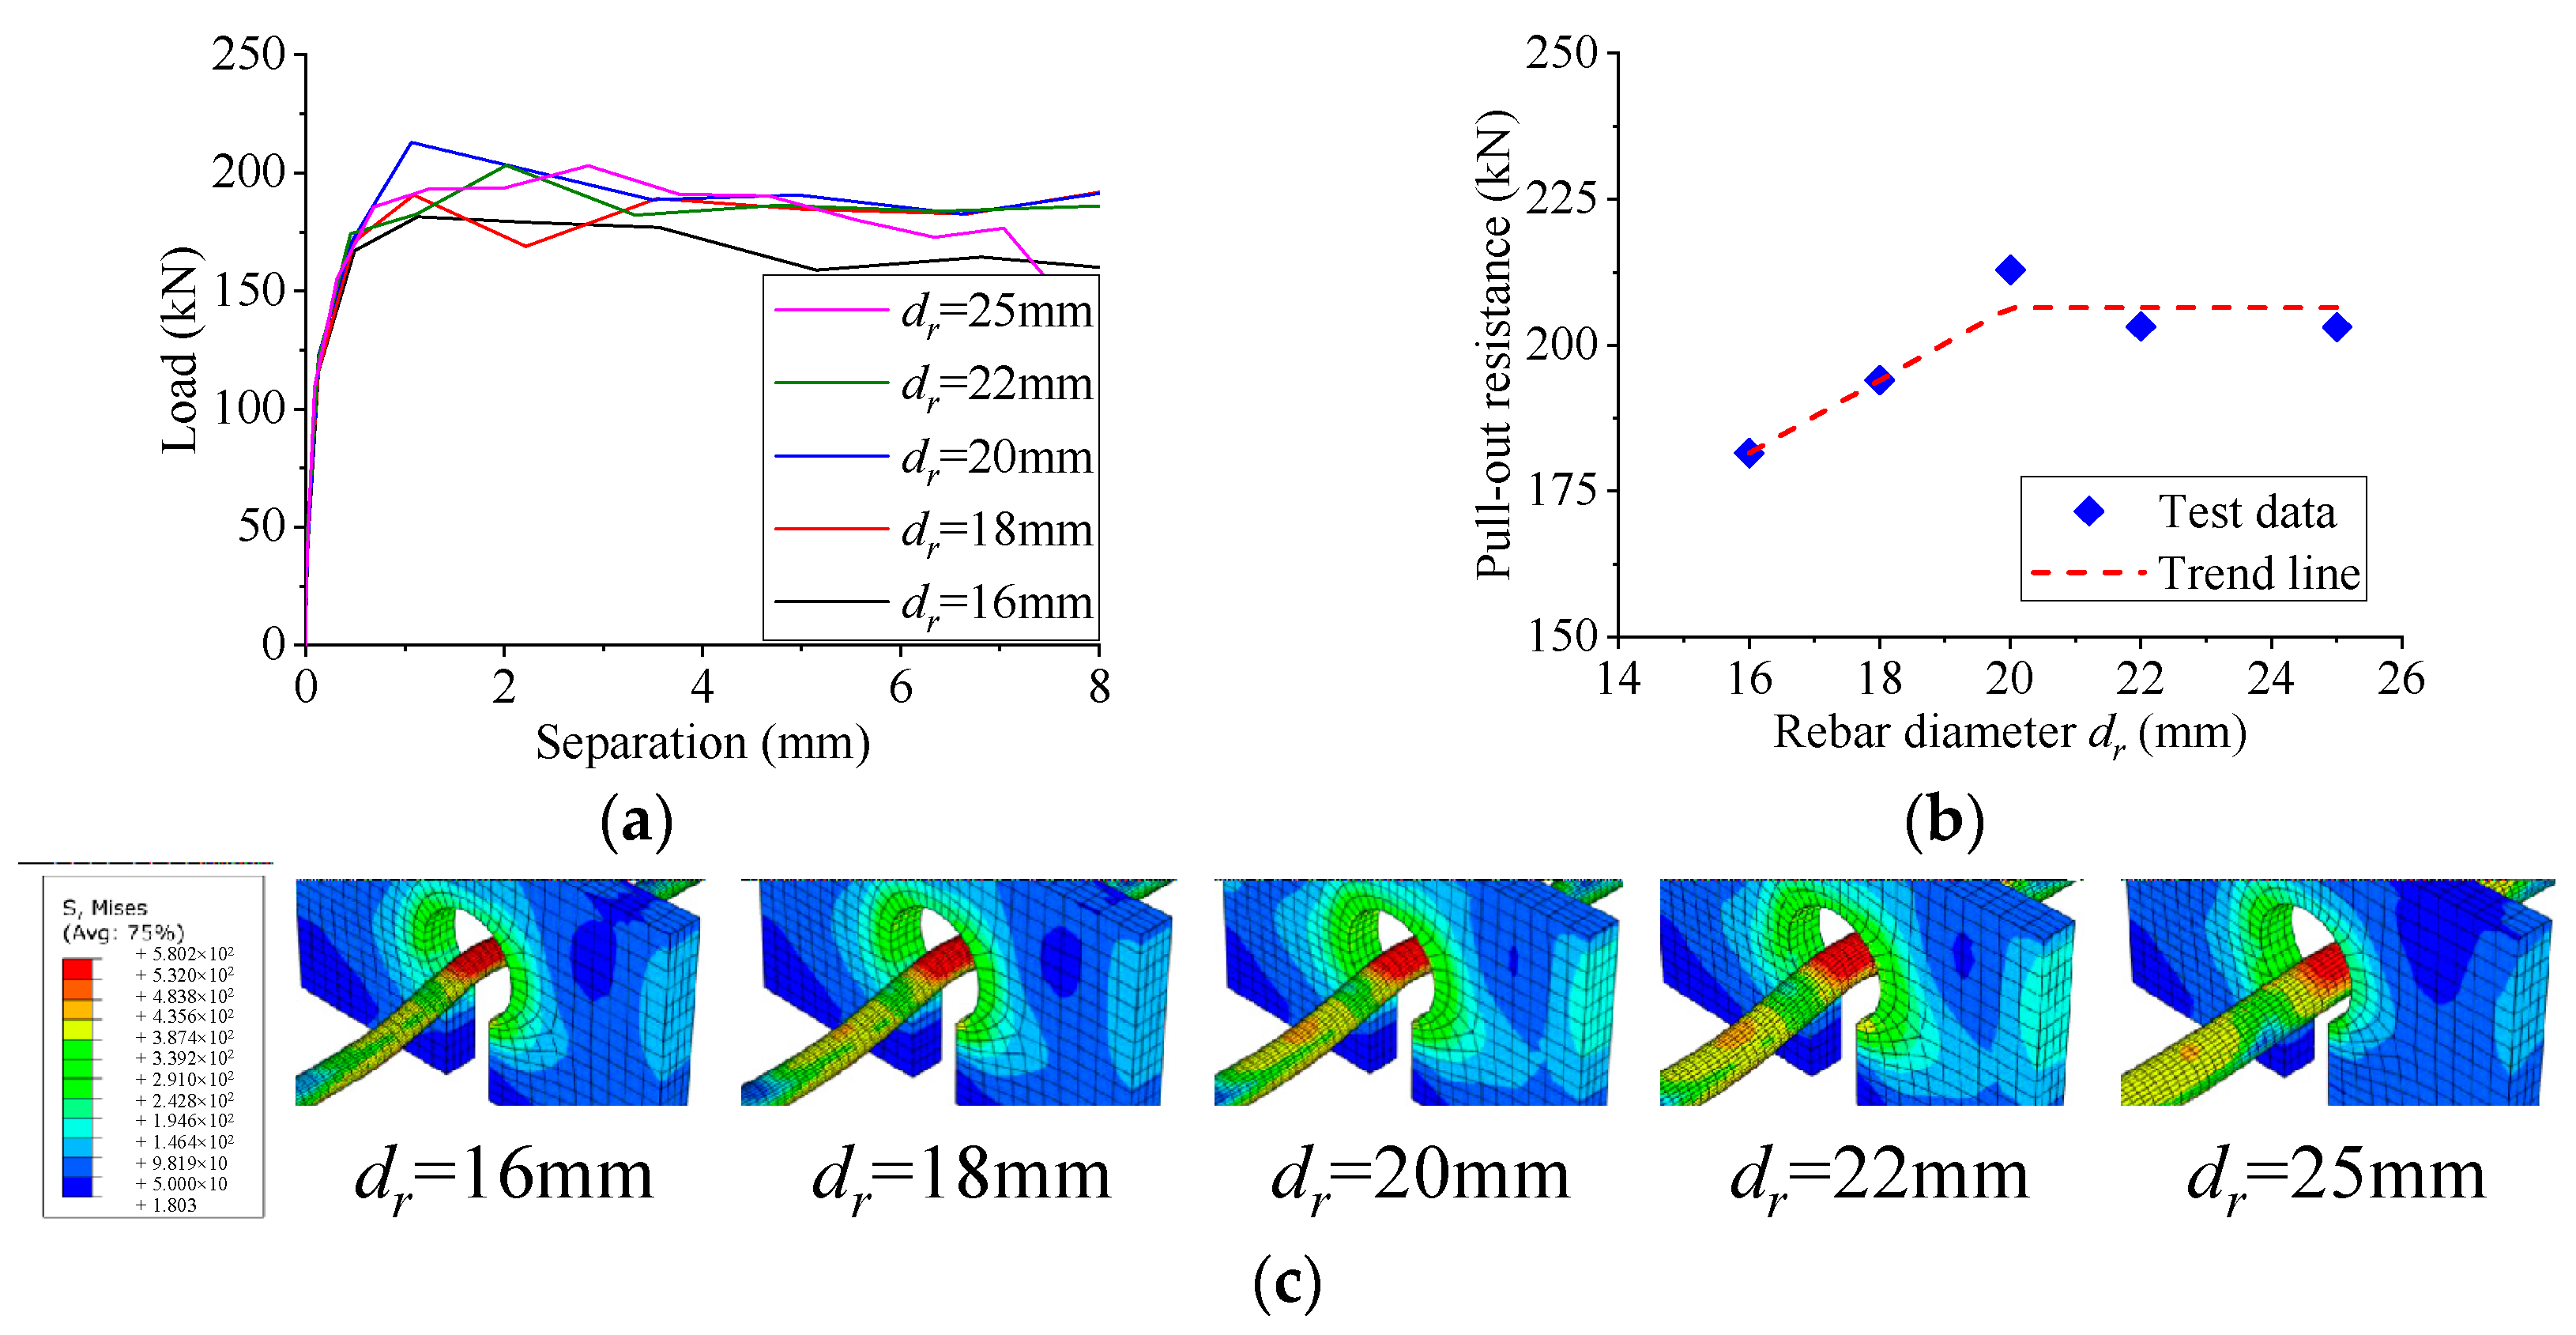
5.5. Influence of Rebar Diameter
The influence of the rebar diameter on the pull-out behavior of notched perfobond shear connectors is illustrated in Figure 18. When the rebar diameter was increased from 16 mm to 18 mm, 20 mm, 22 mm, and 25 mm, the pull-out resistance increased by 7%, 17%, 12%, and 12%, respectively. It was indicated that the increase of the rebar diameter between 16 mm and 20 mm would lead to an increase in the pull-out resistance of the notched perfobond shear connector. The reason for this might be that increasing the rebar diameter increased the cross-sectional area of the rebar, which was directly related to the contributions of the rebar to the pull-out resistance of the notched perfobond shear connector. When the rebar diameter was greater than 20 mm, the cross-sectional area of the concrete dowel around the rebar was decreased to a certain extent, which stopped the pull-out resistance from increasing.
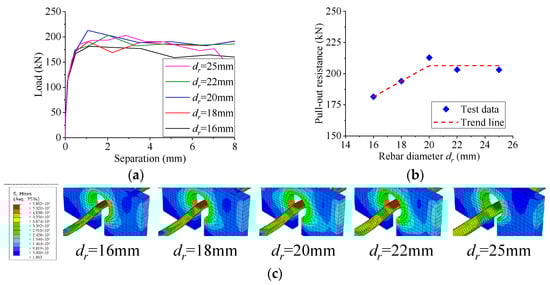
Figure 18.
Influence of rebar diameter. (a) Load–separation curves; (b) influence analysis; (c) failure mode.
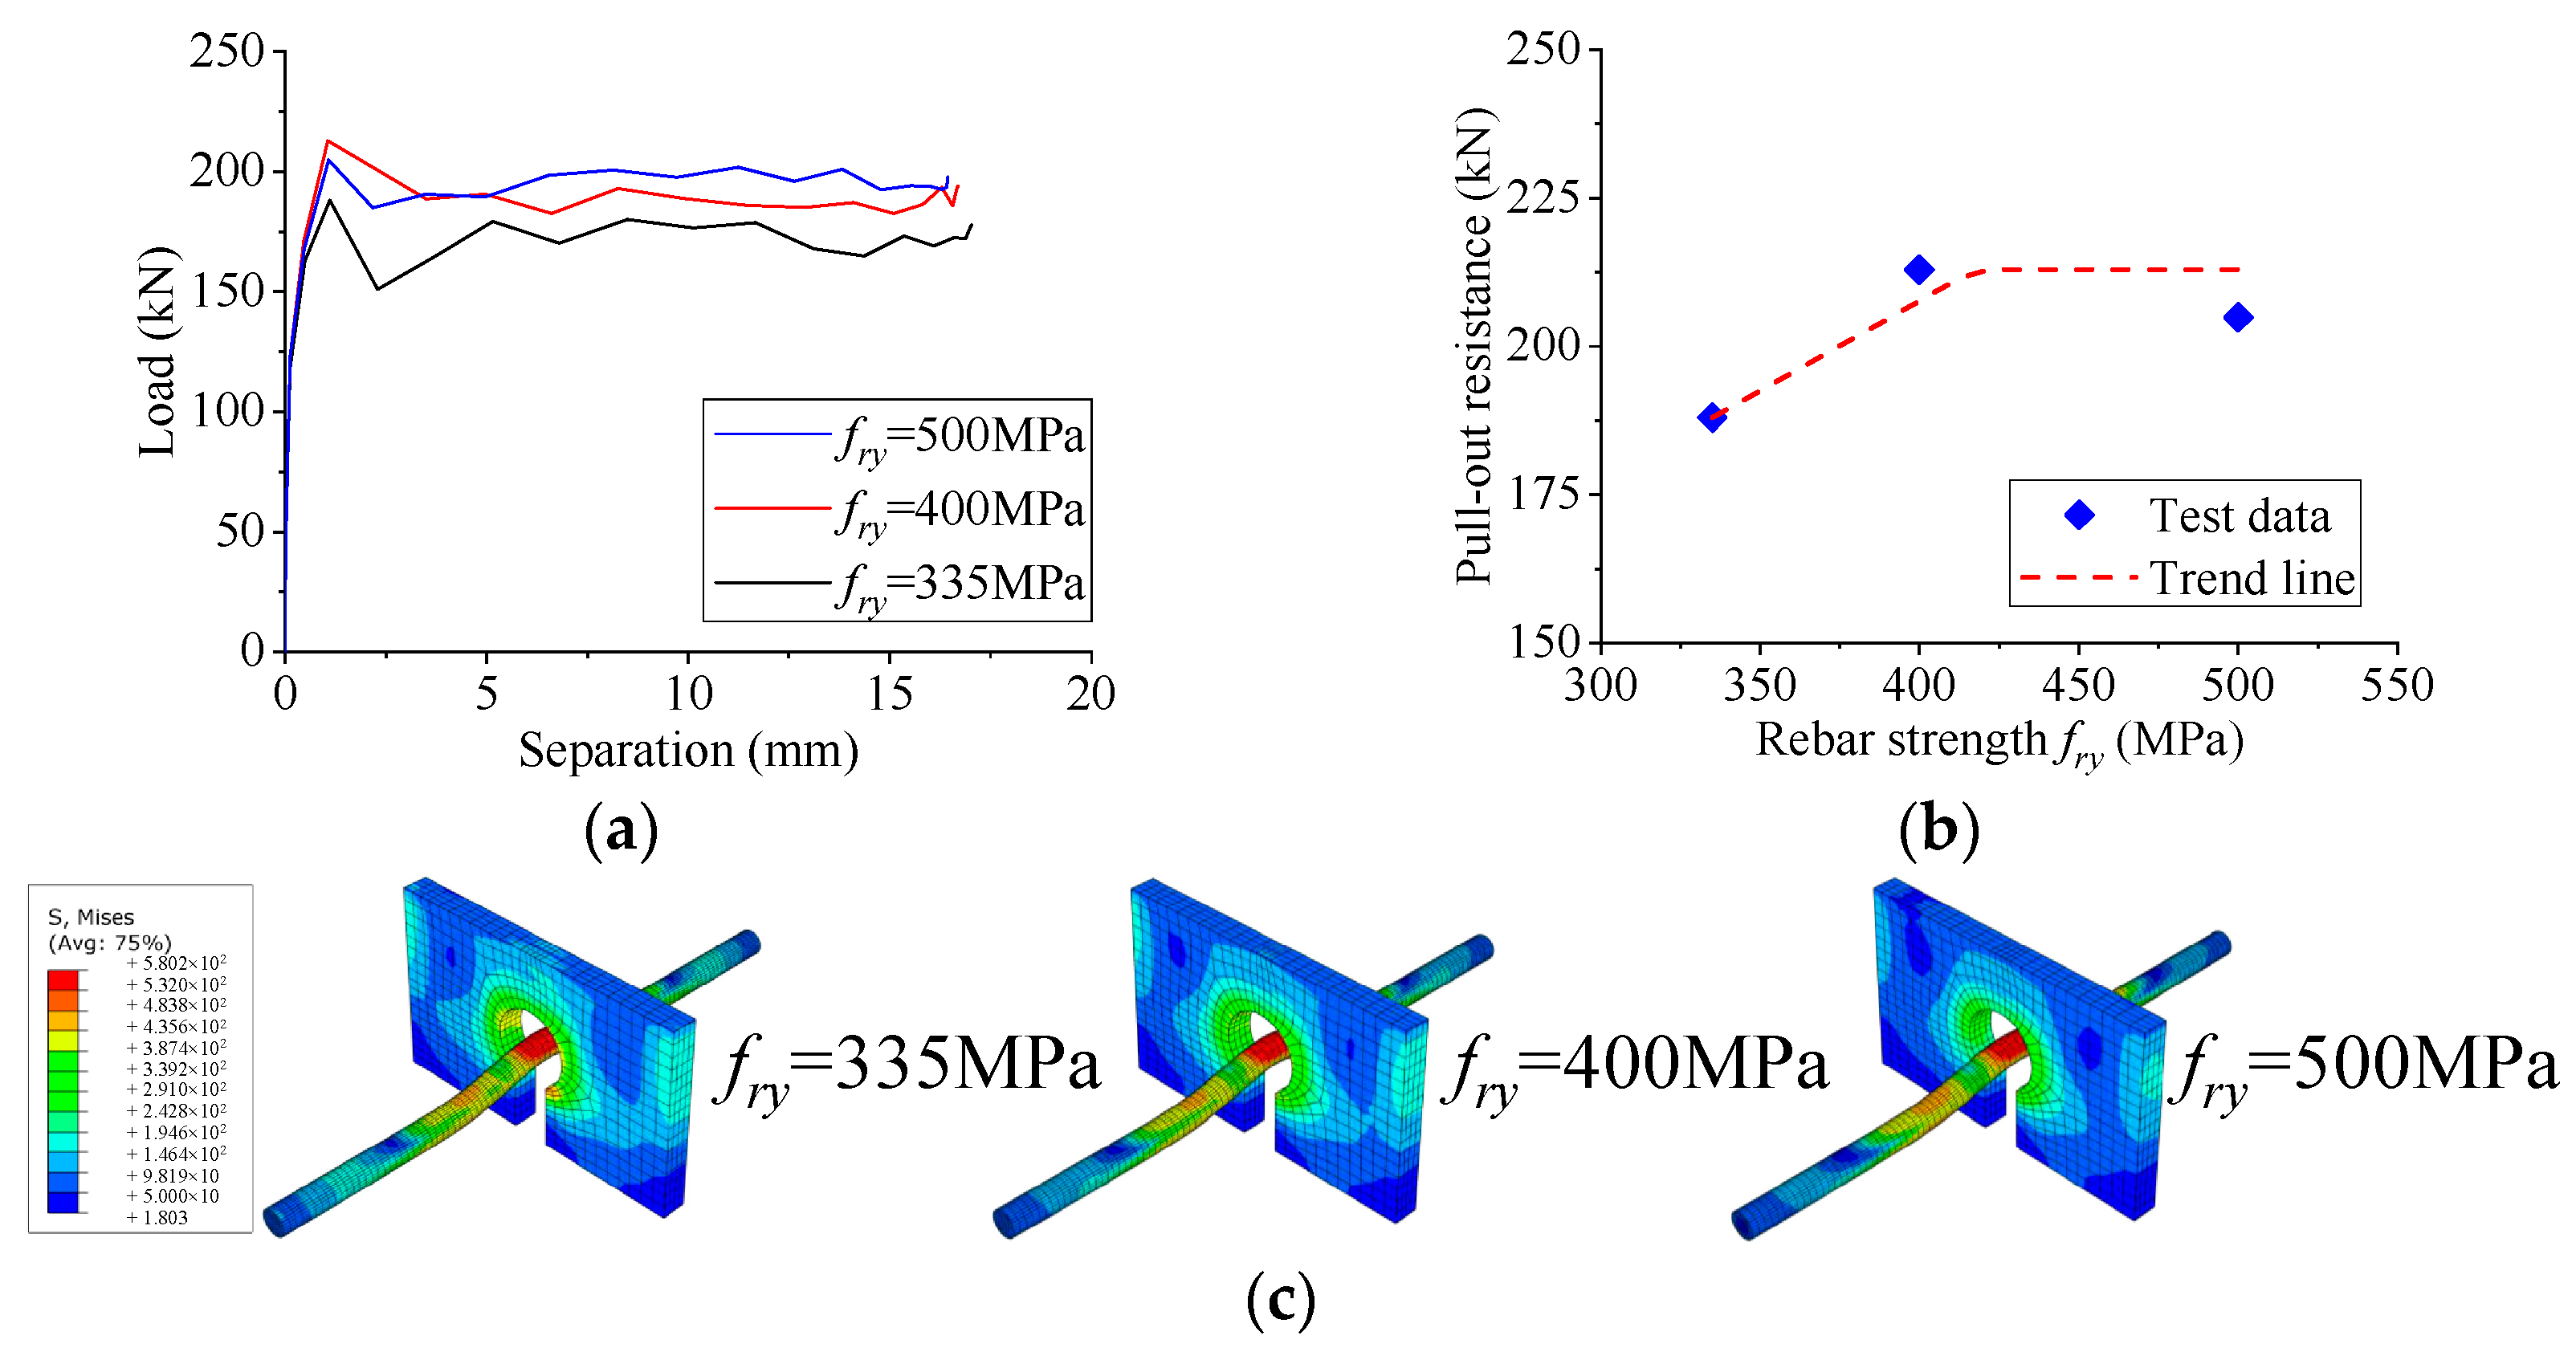
5.6. Influence of Rebar Strength
Figure 19 shows the influence of the rebar strength on the pull-out behavior of notched perfobond shear connectors with the other parameters kept constant. When the yield strength of the rebar was increased from 335 MPa to 400 MPa and to 500 MPa, the pull-out resistance of notched perfobond shear connectors increased by 13% and 9%, respectively. It was revealed that the increase of the rebar strength would lead to an increase in the pull-out resistance of the notched perfobond shear connector. This was possibly because when a higher strength rebar was used in the hole, the dowel effects of the rebar and the concrete in the hole were both increased. However, when the yield strength of the rebar was greater than 400 MPa, the pull-out resistance tended to stop increasing. The reason for this might be that higher strength concrete that matched the higher strength rebar was required to achieve full resistance of the perforating rebar in the hole.
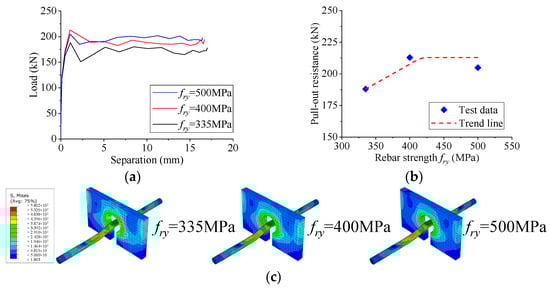
Figure 19.
Influence of rebar strength. (a) Load–separation curves; (b) influence analysis; (c) failure mode.
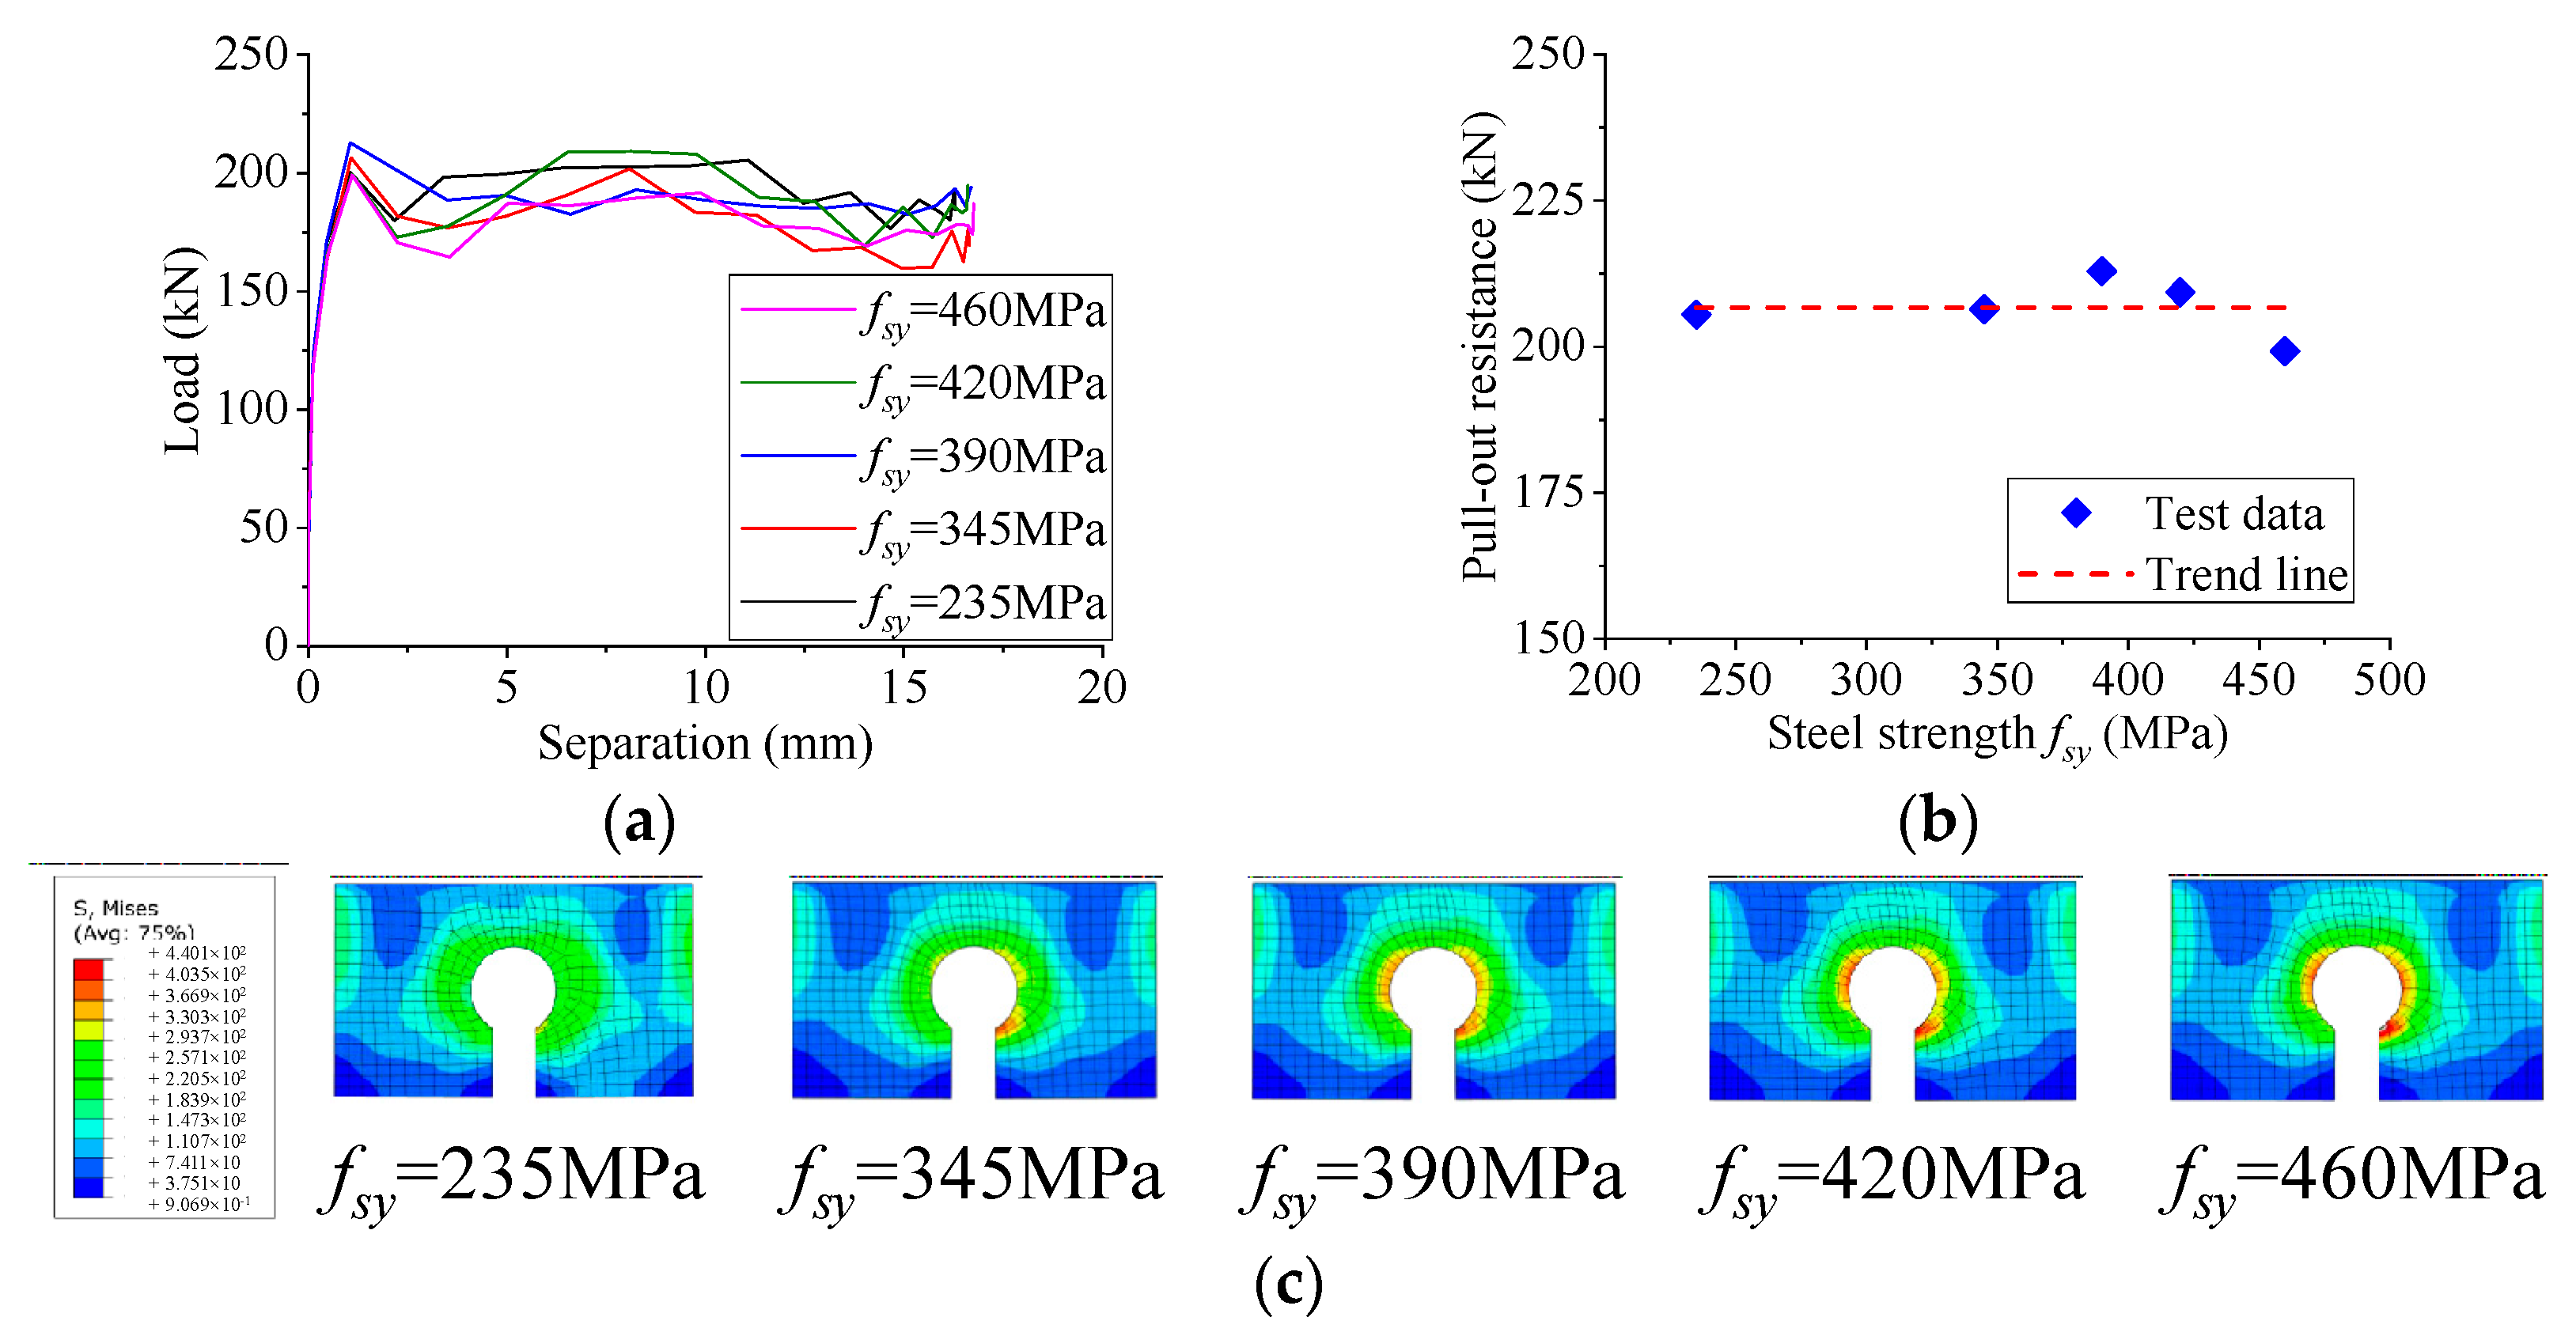
5.7. Influence of Steel Strength
As shown in Figure 20, the steel strength had little influence on the pull-out behavior of notched perfobond shear connectors. When the yield strength of the perfobond rib was increased from 235 MPa to 345 MPa, 390 MPa, 420 MPa, and 460 MPa, the variation of the pull-out resistance of the notched perfobond shear connector was no greater than 4%. The possible reason for this was that the pull-out failure of the notched perfobond shear connector was characterized by the shear of the concrete dowel and the perforating rebar in the hole. No obvious deformation of the notched perfobond rib was observed at the specimen failure. The shear failure of the concrete dowel and the perforating rebar in the hole occurred before the yield of the perfobond rib could happen. As a result, the pull-out resistance of the notched perfobond shear connector was hardly influenced by changing the strength of the structural steel.
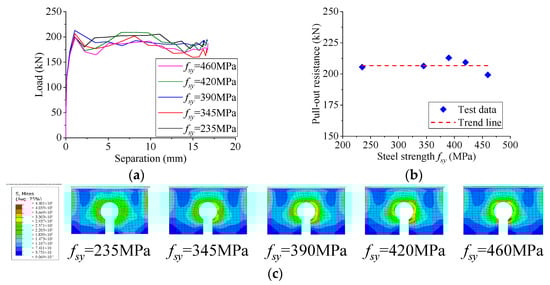
Figure 20.
Influence of steel strength. (a) Load–separation curves; (b) influence analysis; (c) failure mode.
6. Analytical Work
6.1. Equations for Shear Resistance
The pull-out and shear failure of perfobond shear connectors were both related to the shear of the concrete dowel, shear of the perforating rebar, and yield of the perfobond rib, but with different sequences and contributions. Since no existing equations have been reported in the literature for estimating the pull-out resistance of perfobond shear connectors, the available shear resistance equations were introduced to evaluate the tested and analyzed pull-out resistance of notched perfobond shear connectors in this study.
Leonhardt et al. [13] suggested Equation (5) to predict the shear resistance of conventional perfobond shear connectors with circular holes. This equation was developed based on push-out test results without considering the contribution of the rebar in the hole.
where Vu is the shear resistance per hole (N); dp is the hole diameter (mm); and fcu is the concrete cube strength (MPa).
Hosaka et al. [15] proposed Equation (6) to evaluate the shear resistance of circular-hole perfobond shear connectors. The influence of the perforating rebar in the hole was considered by using two formulas with different variables.
where tp is the thickness of the perfobond rib; fc is the concrete compressive strength (MPa); dr is the diameter of the rebar in the hole (mm); and fru is the ultimate tensile strength of rebar (MPa).
6.2. Proposal for Pull-Out Resistance
According to the experimental and numerical results, the pull-out resistance of the notched perfobond shear connector was contributed by shear of the concrete dowel, shear of the perforating rebar, and yield of the perfobond rib. Therefore, an alternative equation, Equation (7), was proposed for estimating the pull-out resistance of the notched perfobond shear connector by combining these contributions.
where Tu is the pull-out resistance per hole (N); dp is the hole diameter (mm); dr is the diameter of the rebar in the hole (mm); fc is the concrete compressive strength (MPa); fry is the yield strength of the rebar (MPa); tp is the thickness of the perfobond rib (mm); fsy is the yield strength of the structural steel (MPa); γw is the influence factor of the notch; and C1, C2, and C3 are fitting coefficients.
Nonlinear regression analysis was performed on a total of 39 experimental and numerical results. The best fittings of the coefficients in Equation (7) were derived as C1 = 0.95, C2 = 0.45, and C3 = 0.18. Therefore, the pull-out resistance of notched perfobond shear connectors could be evaluated by using the final proposal as Equation (8).
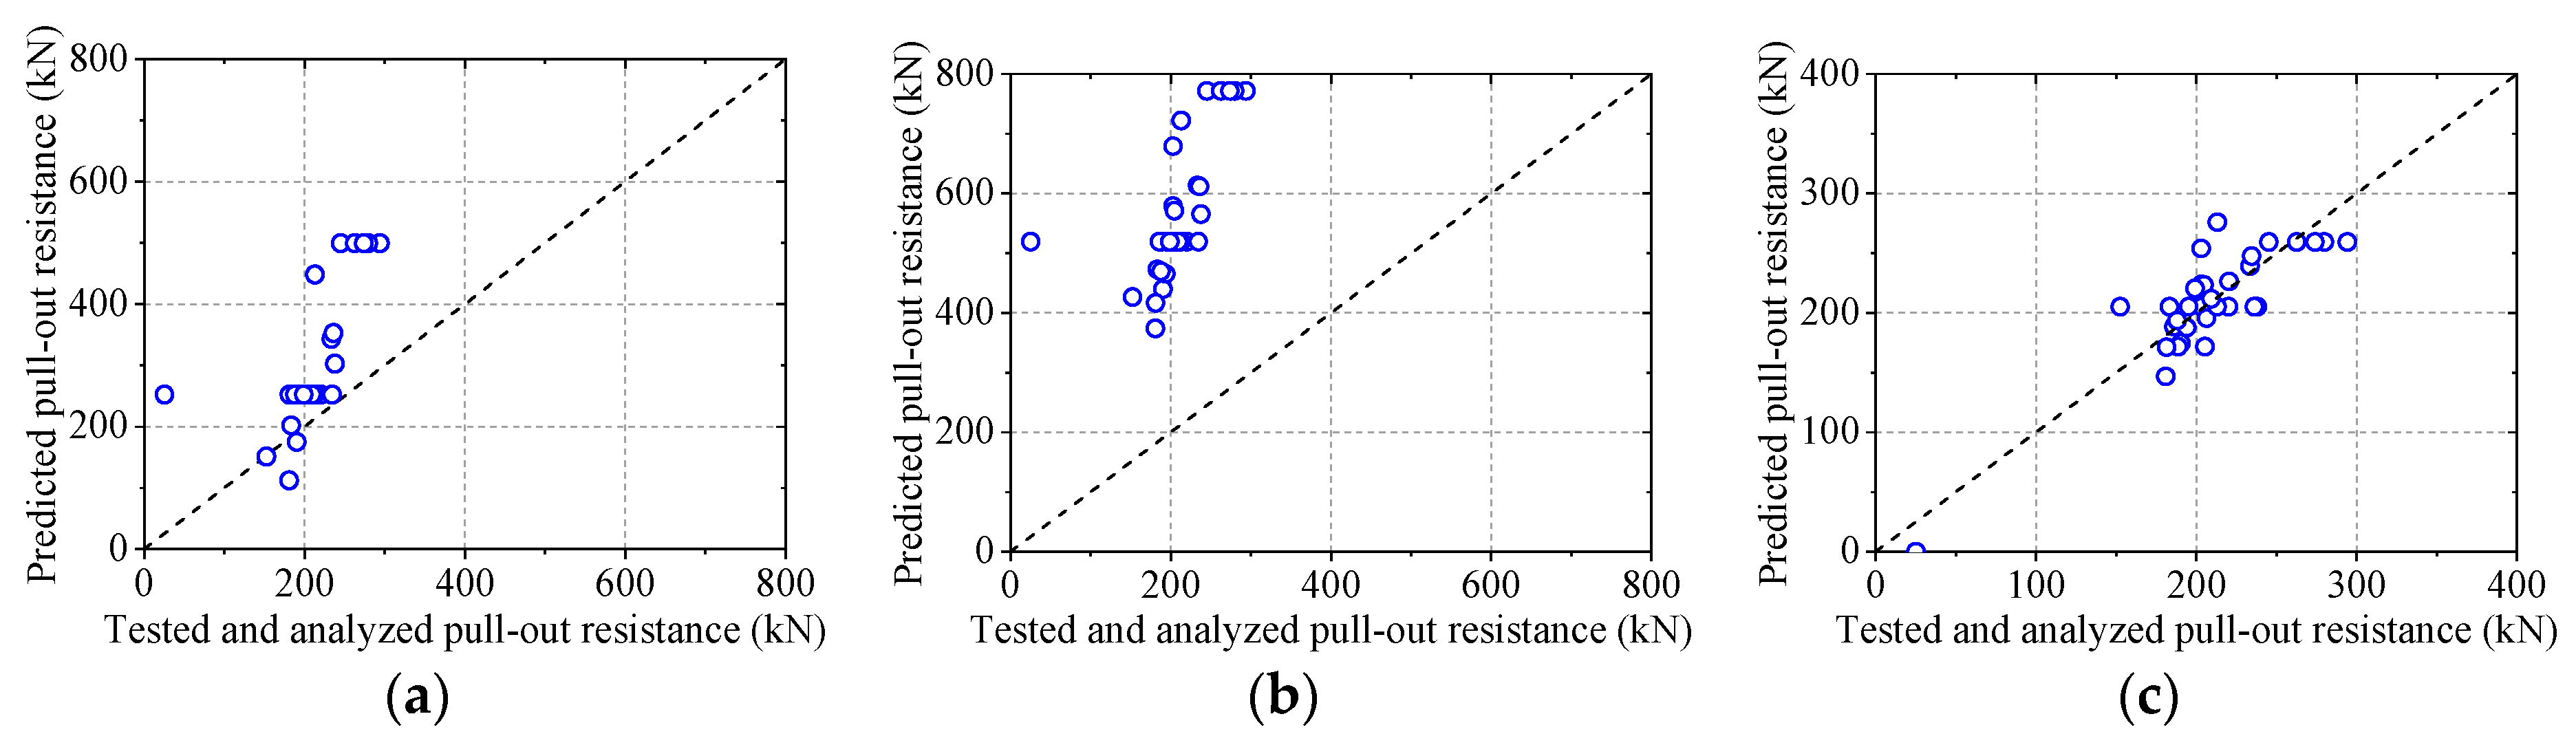
6.3. Comparison and Validation
As shown in Figure 21, the calculated pull-out resistances were compared to the push-out tests and parametric results to validate the previous and proposed equations. The equations suggested by Leonhardt et al. [13] and Hosaka et al. [15] both overestimated the pull-out resistance of notched perfobond shear connectors. This was possibly because the contributions of the concrete dowel and the perforating rebar were overestimated, while the influence of the perfobond rib was neglected in Equations (6),(7). The calculated pull-out resistances from the proposed equation agreed reasonably well with the experimental and numerical results. Therefore, Equation (8) could be used to estimate the pull-out resistance of notched perfobond shear connectors in steel and concrete composite structures.
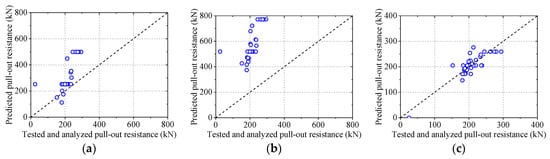
Figure 21.
Evaluation of pull-out resistance equations. (a) Leonhardt et al.; (b) Hosaka et al.; (c) proposal.
7. Conclusions
Based on the pull-out tests, numerical analysis, parametric study, and analytical works on the notched perfobond shear connectors, the following conclusions can be drawn:
- (1)
- The pull-out failure modes of notched perfobond shear connectors are characterized by cracks in the concrete slab, shear of the concrete dowel, and deformation of the perforating rebar. At specimen failure, the perfobond ribs are pulled out from concrete and induce great tension forces in the concrete slab. The concrete dowels in the hole fail in shear. The rebars in the notched hole are not pulled out, while those in the circular hole yield with large deformation. There was no obvious deformation in the perfobond ribs.
- (2)
- The proposed finite element method is validated by comparison with pull-out test results. The numerical results resemble the pull-out failures of perfobond shear connectors quite well. The analyzed pull-out resistances account for 105% and 97% of the mean test results of perfobond shear connectors with circular holes and notched holes, respectively. It is indicated that the proposed finite element model can be used to generate reasonable parametric results for pull-out tests of notched perfobond shear connectors.
- (3)
- A total of 33 parametric simulations further indicate that the pull-out resistance of notched perfobond shear connectors could be greatly increased by increasing the hole diameter, the thickness of the perfobond rib, the concrete strength, and the diameter and strength of the rebar in the hole. The strength of the structural steel has little influence on the pull-out resistance of notched perfobond shear connectors. When the cut ratio cw/dp is greater than 0.75, the pull-out resistance of the notched perfobond shear connector reduces sharply.
- (4)
- An analytical model is proposed to estimate the pull-out resistance of notched perfobond shear connectors. Compared with the existing equations for shear resistance, the calculated pull-out resistance from the proposal in this study agrees reasonably well with the experimental and numerical results. Therefore, the proposed equation may be used to evaluate the pull-out resistance of notched perfobond shear connectors.
Further pull-out tests are still required to extend the scope of the proposed equation for notched perfobond shear connectors in steel and concrete composite structures.
Author Contributions
Y.L. (Yuqing Liu) proposed the topic of this study; S.Z. designed the process and wrote the paper; Y.L. (Yangqing Liu) performed the finite element analysis; C.Z. designed the pull-out tests.
Funding
The research described in this paper was financially supported by Grants from Natural Science Foundation of China (51808235), Fujian Provincial Natural Science Foundation of China (2018J05083), and Huaqiao University Scientific Research Funding (16BS804).
Conflicts of Interest
The authors declare no conflict of interest.
Nomenclature
| dp | hole diameter | cw | cut width |
| cw/dp | cut ratio | dr | diameter of the rebar |
| lp | perfobond rib length | hp | perfobond rib height |
| tp | perfobond rib thickness | fcu | concrete cube strength |
| fc | uniaxial compressive strength | fry | yield strength of the reinforcing bar |
| fru | tensile strength of the reinforcing bar | fsy | yield strength of the structural steel |
| fsu | tensile strength of the structural steel | Tu | pull-out resistance |
| kt | pull-out stiffness | sp | peak separation |
| Tu,i | tested pull-out resistance (i = 1,2,3) | Tu,avg | averaged pull-out resistance |
| kt,i | tested pull-out stiffness (i = 1,2,3) | kt,avg | averaged pull-out stiffness |
| sp,i | tested peak separation (i = 1,2,3) | sp,avg | averaged peak separation |
| σc | compressive stress of concrete | εc | compressive strain of concrete |
| Ec | Young’s modulus of concrete | fc | compressive strength of concrete |
| k | plasticity number of concrete | η | ratio of strain to peak strain |
| εcp | peak strain of concrete | εcu | ultimate strain of concrete |
| σt | tensile stress of concrete | ft | tensile strength of concrete |
| w | crack width of concrete | wc | crack width at the complete release of stress |
| GF | fracture energy required to create a unit area of stress-free crack | ci | constants (i = 1,2) |
| dc | uniaxial damage variables of concrete due to compressive crushing | dt | uniaxial damage variables of concrete due to tensile cracking |
| εcpl | plastic strain of concrete | εcin | inelastic strain of concrete |
| bc | constant factor for concrete damage in compression | wpl | “plastic” crack width of concrete |
| bt | constant factor for concrete damage in tension | l0 | unit length |
| Es | Young’s modulus of steel | Vu | shear resistance |
| γw | influence factor of the notch | Ci | fitting coefficients (i = 1,2,3) |
References
- Mirza, O.; Uy, B. Effects of the combination of axial and shear loading on the behaviour of headed stud steel anchors. Eng. Struct. 2010, 32, 93–105. [Google Scholar] [CrossRef]
- Hassanieh, A.; Valipour, H.R.; Bradford, M.A. Bolt shear connectors in grout pockets: Finite element modelling and parametric study. Constr. Build Mater. 2018, 176, 179–192. [Google Scholar] [CrossRef]
- Zheng, S.; Zhao, C.; Liu, Y. Analytical model for load–slip relationship of perfobond shear connector based on push-out test. Materials 2019, 12, 29. [Google Scholar] [CrossRef]
- Allahyari, H.; Nikbin, I.M.; Rahimi, R.S.; Heidarpour, A. A new approach to determine strength of perfobond rib shear connector in steel-concrete composite structures by employing neural network. Eng. Struct. 2018, 157, 235–249. [Google Scholar] [CrossRef]
- Kim, S.H.; Kim, K.S.; Lee, D.H.; Park, J.S.; Han, O. Analysis of the shear behavior of stubby Y-type perfobond rib shear connectors for a composite frame structure. Materials 2017, 10, 1340. [Google Scholar] [CrossRef] [PubMed]
- Alves, A.R.; Isabel, B.V.; Washintgon, B.V.; Gustavo, S.V. Prospective study on the behaviour of composite beams with an indented shear connector. J. Constr. Steel Res. 2018, 148, 508–524. [Google Scholar] [CrossRef]
- Classen, M.; Herbrand, M.; Kueres, D.; Hegger, J. Derivation of design rules for innovative shear connectors in steel-concrete composites through the systematic use of non-linear finite element analysis (FEA). Struct. Concrete 2016, 17, 646–655. [Google Scholar] [CrossRef]
- Ataei, A.; Bradford, M.A.; Liu, X. Experimental study of composite beams having a precast geopolymer concrete slab and deconstructable bolted shear connectors. Eng. Struct. 2016, 114, 1–13. [Google Scholar] [CrossRef]
- Zheng, S.; Liu, Y.; Yoda, T.; Lin, W. Parametric study on shear capacity of circular-hole and long-hole perfobond shear connector. J. Constr. Steel Res. 2016, 117, 64–80. [Google Scholar] [CrossRef]
- Zheng, S.; Zhao, C.; Liu, Y. Experimental shear strength evaluation of perfobond shear connector with various hole shapes. Struct. Eng. Mech. 2018, 67, 131–142. [Google Scholar] [CrossRef]
- Kim, Y.H.; Kang, J.Y.; Kim, S.H.; Kim, D.J. Structural performance of steel pile caps strengthened with perfobond shear connectors under lateral loading. Appl. Sci. 2016, 6, 317. [Google Scholar] [CrossRef]
- Xue, D.; Liu, Y.; He, J.; Ma, B. Experimental study and numerical analysis of a composite truss joint. J. Constr. Steel Res. 2011, 67, 957–964. [Google Scholar] [CrossRef]
- Leonhardt, F.; Andrä, W.; Andrä, H.P.; Harre, W. New advantageous shear connection for composite structures with high fatigue strength. Beton Stahlbetonbau 1987, 82, 325–331. [Google Scholar] [CrossRef]
- Oguejiofor, E.C.; Hosain, M.U. Numerical analysis of push-out specimens with perfobond rib connectors. Comput. Struct. 1997, 62, 617–624. [Google Scholar] [CrossRef]
- Hosaka, T.; Mitsuki, K.; Hiragi, H.; Ushijima, Y.; Tachibana, Y.; Watanabe, H. An experimental study on shear characteristics of perfobond strip and its rational strength equations. J. Struct. Eng. JSCE 2000, 46A, 1593–1604. [Google Scholar]
- Ahn, J.H.; Lee, C.G.; Won, J.H.; Kim, S.H. Shear resistance of the perfobond-rib shear connector depending on concrete strength and rib arrangement. J. Constr. Steel Res. 2010, 66, 1295–1307. [Google Scholar] [CrossRef]
- Zheng, S.; Liu, Y.; Yoda, T.; Lin, W. Shear behavior and analytical model of perfobond connectors. Steel Compos. Struct. 2016, 20, 71–89. [Google Scholar] [CrossRef]
- Kraus, D.; Wurzer, O. Nonlinear finite-element analysis of concrete dowels. Comput. Struct. 1997, 64, 1271–1279. [Google Scholar] [CrossRef]
- Lin, Z.; Liu, Y.; Roeder, C.W. Behavior of stud connections between concrete slabs and steel girders under transverse bending moment. Eng. Struct. 2016, 117, 130–144. [Google Scholar] [CrossRef]
- Kim, Y.H.; Kang, J.Y.; Koo, H.B.; Kim, D.J. Pull-out resistance capacity of a new perfobond shear connector for steel pile cap strengthening. Adv. Mater. Sci. Eng. 2016, 2016, 1374689. [Google Scholar] [CrossRef]
- Cho, J.R.; Park, S.Y.; Cho, K.; Kim, S.T.; Kim, B.S. Pull-out test and discrete spring model of fibre-reinforced polymer perfobond rib shear connector. Can. J. Civ. Eng. 2012, 39, 1311–1320. [Google Scholar] [CrossRef]
- EN 1994–1–1:2004. Eurocode 4: Design of Composite Steel and Concrete Structures, Part 1–1: General Rules and Rules for Buildings; European Committee for Standardization (CEN): Brussels, Belgium, 2004. [Google Scholar]
- Ghazijahani, T.G.; Jiao, H.; Holloway, D. Influence of a cutout on circular steel hollow sections under cyclic loading. J. Constr. Steel Res. 2014, 100, 12–20. [Google Scholar] [CrossRef]
- Ghazijahani, T.G.; Jiao, H.; Holloway, D. Fatigue experiments on circular hollow sections with CFRP reinforced cutouts. J. Constr. Steel Res. 2015, 106, 322–328. [Google Scholar] [CrossRef]
- ABAQUS Documentation, Version 6.10; Dassault System: Waltham, WA, USA, 2010.
- FIB. Model Code 2010—Final Draft, Vol. 1; FIB: Lausanne, Switzerland, 2010. [Google Scholar]
- Nguyen, H.T.; Kim, S.E. Finite element modeling of push-out tests for large stud shear connectors. J. Constr. Steel Res. 2009, 65, 1909–1920. [Google Scholar] [CrossRef]
- Hordijk, D.A. Tensile and tensile fatigue behaviour of concrete; experiments, modelling and analyses. Heron 1992, 37, 3–79. [Google Scholar]
- Birtel, V.; Mark, P. Parameterised finite element modelling of RC beam shear failure. In Proceedings of the 19th Annual International ABAQUS Users’ Conference, Cambridge, MA, USA, 23–25 May 2006; ABAQUS Inc.: Boston, MA, USA, 2006; pp. 95–108. [Google Scholar]


© 2019 by the authors. Licensee MDPI, Basel, Switzerland. This article is an open access article distributed under the terms and conditions of the Creative Commons Attribution (CC BY) license (http://creativecommons.org/licenses/by/4.0/).