1. Introduction
The growth of the use of electronic documents propelled the development of solutions aiming at automatic organization of those documents in appropriate categories. The related task of automatic classification of text documents become an important tool for the relevant applications of news filtering, information retrieval, opinion mining, spam filtering and e-mail classification [
1].
The classical, text-mining approach to document classification employs machine learning to automatically infer a classification model from a given collection of text documents labeled with the classes they belong to [
2]. In order to use machine learning on text documents, one has to define a set of features that allow representing a document as a tuple of feature values. To this end, we employ document representation models. The early text-mining approaches to document classification have been using the bag-of-words document representation model [
3]. Following the bag-of-words model, each feature corresponds to a dictionary word and its value is related to the frequency of the word in the given document. Despite its simplicity, the bag-of-words model has been widely considered as the de-facto standard model for text classification and categorization [
1,
4]. Since the model leads to a large number of features, it is typically used in combination with feature selection and other dimensionality reduction methods [
5].
More recent document representation models have been focusing on the semantic relations among words, which have been ignored by the bag-of-words model; the latter considers similar words and synonyms as atomic, independent features. In particular, continuous-space models for document representation, referred to as word2vec (doc2vec), embed the words (documents) in a vector space, where the closeness of vectors correspond to the semantic similarity of words (documents) [
6,
7]. To compute the embedding, continuous-space models use shallow, two-layered neural networks. To perform document classification, they are usually combined with deep neural networks into complex deep neural network structures. The deep learning approaches require computationally expensive trial-and-error experiments for finding optimal network structures and learning parameter settings for approaching the document classification and other text mining tasks, they are often combined with (deep) neural networks that serve as classification models [
8,
9]. Only in rare cases, continuous space models are considered as an alternative document representation model that is apt for combining with other, computationally less demanding methods for machine learning [
10].
Another limitation of the bag-of-words model is that it ignores the ordering of the words in a given document. Network-based document representation models build upon on features that represent the structural properties of the document network, which represents a document as a graph with vertices corresponding to words and edges denoting the co-occurrence of words in sentences. Thus, the network’s edges correspond to the ordering of the words. While the network-based model and its variants have been applied in the context of document classification [
11,
12,
13,
14,
15,
16], it is rarely considered in the comparison to other document representation models.
In this paper, we address the issue of selecting a proper document representation model for text document classification with machine learning methods. We consider the combination of different document representation models with a computationally efficient and robust method for machine learning, random forest [
17]. The motivation for resolving this central issue is twofold. First, to the best of our knowledge, no other comparative study analyzes the impact of the selection of document representation model on the performance of text document classification. While the performance of different variants of the bag-of-words model is well studied, the systematic comparative study of the performance of the other two document representation models is still missing. Secondly, in contrast with deep learning approaches, we aim at using a simple and robust machine learning method that does not require elaborate structure and parameter settings necessary for learning deep models, is much more computationally efficient and performs well, and is in many cases superior to deep neural networks [
18].
To resolve this issue, we perform a systematic comparative analysis that involves 16 variants of the three document representation models introduced above, seven text classification tasks stemming from four standard text classification benchmarks [
19,
20,
21,
22] and five commonly used measures of document classification performance: classification accuracy, precision, recall, F1-score and the area under the receiver-operating characteristic curve.
The rest of the paper is organized as follows. In
Section 2, we introduce the three document representation models and their variants as well as provide an overview of related studies for each of them. In addition,
Section 2 introduces the random forest method for learning classification models, methods for dimensionality reduction, and the measures of the performance of document classification.
Section 3 introduces the setup used to conduct the empirical comparison of the performance of the document representation models for document classification.
Section 4 presents and discusses the experimental results. Finally,
Section 5 summarizes the contributions of the paper and outlines directions for further research.
2. Background
The task of a single-label document classification can be formally defined as follows [
2]: let
D be a set of documents, and
C a set of class labels. Given a learning set of training pairs
, we seek to construct a classification model
such that the set of misclassified documents is minimized as much as possible. In turn, the classification model
f can be used for predicting the class label of any given document.
In order to employ a machine learning method to the task of document classification, we have to represent documents as fixed-length tuples or vectors of feature values [
2]. To this end, we employ document representation models. Formally, a document representation model is a function
, where
n corresponds to the number of features for representing the text documents. Model
m transforms a given document
d to a
n-dimensional vector of real-valued features
. By doing this, the task of document classification can be formulated as a task of supervised machine learning of classification models, where the learning data set consists of training pairs
. The learning method then results in a classification model
that can be used for predicting the class label of any given document
d that is being transformed with the document representation model into
, before being submitted to the classification model
g. We are going to review three document representation models and the machine learning method for training classification models used in this study in the first two subsections below.
Due to the fact that the standard document representation models with features based on individual words in documents lead to a vast number of features
n, we employ methods for dimensionality reduction, before learning the classification model
g [
2]. In this paper, we apply a principal component analysis (PCA) as a dimensionality reduction method [
23] as explained further in
Section 2.3. Finally, in the last subsection, we introduce the five measures for the evaluation of the performance of document classification.
2.1. Document Representation Models
Document representation models transform a document into numeric-valued features that can be clustered into two categories. The features in the first category correspond to words (often referred to as terms), while the second category includes features that correspond to documents. The bag-of-word model only include features of the first category: the values of its features correspond to the presence/absence or the frequency of a word/term in a given document [
3]. Furthermore, the word2vec model also includes features from the first category that correspond to the embedding of words in semantic space [
6]. In contrast, the doc2vec model is based on features that correspond to vector-space embeddings of whole documents instead of individual words [
7]. Finally, the network-based model includes features from both groups: features quantifying the properties of the individual network nodes belong to the first category, while the features quantifying the properties of the entire network belong to the second category. In the continuation of this section, we are going to provide a detailed introduction of the three document representation models compared in this study.
2.1.1. Bag-of-Words Model
The bag-of-words (BOW) model represents each document as an unordered set (bag) of features that correspond to the terms in a vocabulary for a given document collection. The vocabulary can include words, a sequence of words (token n-grams) or sequences of letters of length
n (character n-grams) [
16,
24,
25]. Each vocabulary term is represented with one numerical value in a feature vector of a document. The feature value can be calculated in different ways. The simplest is to observe the occurrence of a term in a document, leading to a Boolean feature value. More commonly used feature values measure the frequency of a term in a given document. Another commonly used measure is “term frequency, inverse document frequency” (TFIDF), where the term frequency (TF) is multiplied by the reciprocal frequency of the term in the entire document collection (idf). In this way, TFIDF reduces the importance of the terms that appear in many documents and increases the importance of rare terms.
Traditionally, the BOW model is used as the state-of-the-art document representation model in many natural language processing applications. Its success emerges from the simplicity of implementation and the fact that it often leads to high accuracy document representation. Still, it is well known that BOW is characterized by many drawbacks such as high dimensionality, sparsity, and the inability to capture semantics or simple dependencies between words, such as word ordering in the document [
4,
5]. Therefore new representation models in the forms of distributed word embeddings (word2vec and doc2vec) and graph-of-words (GOW) have been proposed and tested to challenge the open issues in document classification.
2.1.2. Continuous-Space Models
Continuous-space word representations (word2vec) capture syntactic and semantic regularities in language from observing the patterns of words co-occurrence in the same context of neighboring words [
26]. More specifically, word2vec employs neural networks to model the relation between a given word and its context of neighboring words in the given collection of documents. The continuous bag-of-word model (CBOW) predicts the context (neighboring words) for a given word, while the continuous skip-gram model predicts a word given the context. Both lead to a vector-space embedding (representation) of individual words. The neural network prediction model uses a hierarchical softmax function whose structure is a binary Huffman tree and is trained using stochastic gradient descent and back propagation algorithms. To improve the computational efficiency of model training, negative sampling is used to reduce the number of distributed context vectors considered. This type of model is also referred to as a neural language model [
27]. Recently, word2vec has been shown to be successful in many natural language processing tasks ranging from sentiment analysis [
8,
28,
29,
30], topic modeling [
31], through document classification [
32,
33] and name entity recognition [
34] to machine translation [
35,
36].
High dimensional vectors also proved to be efficient on larger linguistic units, such as pieces of text of variable lengths (sentences, paragraphs or documents) resulting in paragraph2vec and doc2vec models [
7,
37]. The doc2vec models are able to predict word occurrence in the context of paragraphs or documents. Hence, doc2vec has been shown to be efficient in sentiment analysis [
7,
38,
39], information retrieval [
7], document classification [
9,
10], summarization [
40] and question answering [
41]. In our study, we use the variants of the word2vec and doc2vec models that correspond to different sizes of the feature vectors extracted from the continuous space transformation.
Recent studies of the continuous space models for document classification have been primarily focused on the exploration of one isolated aspect of the system, usually comparing different classifiers and contrasting different representation models of documents against bag-of-words as a baseline model and word2vec (doc2vec as well, although rarely) as the suggested improvement. For example, Djuric et al. [
38] compare the TF and TFIDF variants of the bag-of-words model with a doc2vec model in the task of hate-speech detection. They show that doc2vec model outperforms both bag-of-words variants in terms of the area under the receiver-operating characteristic curve obtained with a classifier based on linear regression. Similarly, Sanguansat [
39] shows that the doc2vec model outperforms TF and TFIDF variants of the bag-of-words model in the sentiment analysis tasks in Thai and English languages, regardless of the used classifier (logistic regression, naïve Bayes or support vector machines). Jiang et al. [
42] show the combination of the bag-of-words and the continuous space models lead to a marginal performance improvement over the alternatives in the sentiment analysis task. Kim et al. [
10] show that multi-co-training of TFIDF, latent Dirichlet allocation and doc2vec achieves more robust results in document classification tasks especially with very low dimensions of features’ vectors. Ren and Deng [
43] propose the fusing of different streams of features in a multi-stream neural model, while Zheng et al. [
44] introduce the self-interaction attention mechanism for aggregating the integration strategies into a hierarchical structure for the document classification.
2.1.3. Network-Based Models
The recent decade has witnessed the rise of interest in the modeling and analyzing of human language with complex networks [
45,
46]. Following this paradigm, linguistic units (words, sentences or documents) can be represented as vertices, while their relations (co-occurrence, syntax dependencies, semantic relations) as edges in a graph [
46] forming a complex language network. Often, the terms of graphs and networks are interchanged depending on the field (mathematics, computer science or physics); the authors also interchangeably refer to nodes or vertices and to links or edges. A language (linguistic) network is formalized by a pair of sets
where
V is the set of nodes representing the linguistic units and
E the set of links representing the interactions between them. The network formalization captures the structural (topological) properties of a text, which is quantified through the computation of various network properties at a different scale. On the micro scale of individual nodes we observe the role of individual nodes in the network topology, on the mezzo scale of subnetworks we examine the structure of communities of network nodes, and on the macro scale, the properties summarize the structural characteristics of the entire network. For the network-based models, we employ a variety of network properties to all three levels simultaneously. We also aggregate the properties on the micro (node or word) level into document-level (macro) features using three different aggregation methods of average, histogram and quantiles.
When the linguistic units in the language network correspond to words, we refer to them as a graph-of-words (GOW) model for document representation. There are several advantages of using GOW, grounded in the graph and complex networks theory. Firstly, the model is known to be robust to input noise. Additionally, GOW significantly reduces the dimensionality of the representation space, when properties on the mezzo and macro levels are being considered. Note however, that this comes at the cost of the high computation complexity of the procedures for calculating the properties. The GOW model, in its diverse variants has been applied to many natural language processing tasks, including text summarization [
47], keyword extraction [
48,
49], text genre detection [
50,
51] and document classification [
11,
12,
13,
14,
15,
16].
Note that the GOW model does not come with a standardized language network representation or a set of features (network properties). The diversity of the network based models is related to the variety of networks, ranging from directed and undirected through to unweighted and weighted and bipartite graphs. Moreover, it seems that there is no unique strategy in utilizing micro, mezzo and macro level structural properties, which contribute even more to the diversification of the reported models. Similarly, Malliaros and Skianis [
15] substitute TF with micro measures of node centrality (degree, in- and out-degree, closeness) is obtained from the language network. Jiang et al. [
52] model documents as graphs and use weighted frequencies to extract frequent subgraphs on the mezzo level, the counts of which are used as features. Rousseau et al. [
14] also exploit frequent subgraphs extracted from the networks as features. In addition, they examine the main-core of the language network as a technique for the reduction of the dimensionality of feature vectors.
Hassan et al. [
11] use an algorithm for a random walk through the language network to measure term properties that replace the TF metric of the bag-of-words model, which leads to a significant improvement of the performance in document classification tasks regardless of the classifier. They perform an analysis on the two benchmarks also used in our study. Blanco and Lioma [
12] propose a representation of documents with page ranks of nodes in a network constructed from text. Additionally, they employ macro and mezzo level measures of average page length and clustering coefficients. Besides co-occurrences they also incorporate grammatical relations (part-of-speech tags) as directed or undirected network links.
Rossi et al. [
13] and in [
53] represent documents and classes as bipartite networks, and induce the weights on the links using the least mean square method. Induced weights are used as class models for the classification of unseen documents. Similarly, Papadakis et al. [
16] employ per-class networks constructed from character or word n-grams in a document. Classification is based on the network similarity measures quantified as a Jaccard overlap of links or weighted overlap between the network of the new document and class baseline network.
2.2. Random Forest
Random forest is a machine learning method for the automatic inference of classification (or regression) models from training data [
17]. The second part of its name is related to the fact that the inferred model is an ensemble of decision trees. The randomization (first part of the method’s name) comes from two sources. First, each decision tree in the ensemble is trained on a random selection of training data; in particular, random samples with replacement are taken from the training data set. Second, at each step the tree induction algorithm selects the best possible split of the current data set. The split is selected from a random sample of
m features, following an idea that was borrowed from another method for learning ensembles, random subspaces [
54].
Learning an ensemble of models is a standard machine learning technique for reducing the variance of learning methods, which often leads to the reduction of the predictive error and overfitting of the model to training data. Random forest represents one of the most powerful and robust ensemble methods in machine learning; it is reported to perform well in a variety of contexts, domains, learning tasks and data sets [
10,
55,
56,
57].
Another advantage of random forest and the reason why we opted for it in our work is its robustness to the learning method’s parameter settings. The performance of random forests is sensitive to the value of a single parameter
m, i.e., the size of the random sample of features considered at each step of the tree induction algorithm (see above). This is in contrast with other contemporary machine learning methods, especially deep neural networks, the performance of which is very sensitive to the selection of neural network structure (number of the layers and neurons in each layer), activation functions, and settings of the parameters of the learning method [
58]. The proper setting of these parameters requires computationally expensive trial-and-error experiments with learning different models, each being learned following a computationally expensive learning algorithm. On the other hand, in comparison with deep neural networks, learning random forest is computationally much more efficient [
18].
2.3. Dimensionality Reduction
The major characteristic of the document representation models that include features corresponding to words/terms is the high dimensionality of the feature space: the size of the vocabulary can be tens or hundreds of thousands of terms for an average-sized document collection. In such situations, to reduce the vocabulary size, the documents are first preprocessed by removing non-informative terms (stop words). Also, document frequency thresholding [
5] and dimensionality reduction methods are used to further reduce the number of features obtained with the document representation models relying on features stemming from words.
Document frequency thresholding [
5] observes the number of documents in which a term occurs, i.e., the document frequency of a term. In turn, it removes terms with document frequency below some predetermined threshold. The method is based on the assumption that rare terms are not informative for document classification and are often an artefact of noise (misspelling) in the text data.
Dimensionality reduction is also used to cope with the vast number of features produced by document representation models [
2]. Howland et al. [
23] propose the use of principal component analysis (PCA) and the variants thereof for document classification. PCA methods transform the set of numerical features in the original training data space into a set of orthogonal, linearly uncorrelated features, referred to as principal components. The latter are computed in such a manner that the first principal component explains as much variance in the training data set as possible, the second explains as much of the remaining variance as possible, etc. When using PCA as a dimensionality reduction method, one will opt for the first
p principal components of the training data, reducing the original dimensionality of the feature space to
p. There are different heuristics for selecting the value of
p. We have used a commonly used heuristic that selects the value of
p in such a way that the first
p principal components explain 80% of the variance of the training data set [
59].
2.4. Performance of Document Classification
The commonly used measure of classification performance is a classification accuracy, i.e., the ratio of data correctly classified by a given model. Note however, that in document classification, we often encounter tasks where the distribution of class labels is highly imbalanced. In such cases, accuracy does not provide sufficient insight into classification performance and therefore, alternative measures of classification performance are being employed [
60]. In our comparative study, we employ four performance measures, introduced below.
The alternative measures observe the number of correctly classified and misclassified examples for each class label
c. There are two types of correctly classified examples: true positives (TP), i.e., correctly classified examples from class
c, and true negatives (TN), i.e., correctly classified examples that are labeled with a class label other than
c. Similarly, we observe two types of misclassified examples: false positives (FP), i.e., examples labeled with a class label other than
c and misclassified into class
c, and false negatives (FN), i.e., examples from class
c and misclassified into a class other than
c. Given these four numbers, we can calculate precision, recall and F1-score for a given class label
c as [
60]:
Furthermore, the area under the receiver-operating curve (AUROC) [
61] is another commonly used measure of the performance of document classification models. The receiver-operating curve explores the trade-off between the true-positive rate, i.e.,
, and false-positive rate, i.e.,
, when changing the value of the decision boundary. The latter is the probability threshold that decides what what the minimal value of the estimated probability is for an example to belong to class
c for which the classifier decides to predict class
c. In turn, the area under the curve measures the potential of a given classification model to discriminate class
c from the other classes.
Finally, in cases where the classification task involves more than two class labels, we aggregate the per-class measures into a single performance measure using the macro-average scheme [
62]:
where
C is the set of class labels in the data set of interest, while
is any of
,
,
or AUROC.
3. Materials and Methods
In this section, we present details of the setup for the empirical comparison of the different document representation models for document classification. First, we describe the data sets used in the experiments and the data preprocessing steps. Furthermore, we elaborate upon the used implementations and peculiar values of parameters of the document representation and classification models. Finally, we introduce the methods employed for comparative analysis.
3.1. Text Data and Preprocessing
Table 1 provides an overview of the properties of the four document corpora used in the experiments. They represent a standard set of benchmarks for various natural language processing and text mining tasks and have been used in numerous studies [
10,
11,
14,
15,
16,
32,
43,
53,
63].
The Brown corpus consists of 500 documents of over 2000 tokens each, which are written in a wide range of styles and a variety of prose [
19]. There are 15 document classes structured in a taxonomy consisting of four levels with two, four, 10, and 15 class labels, respectively. Therefore, in the experiments, we considered four different document classification tasks related to the Brown corpus, referred to as Brown
n, where
n represents the number of class labels (two, four, 10 or 15). We used the version of the Brown corpus included in the Python natural language toolkit [
64].
Reuters8 is a subset of the Reuters-21578 collection of news articles that includes the articles from the eight most frequent classes (acq, crude, earn, grain, interest, money-fx, ship, trade) [
22].
WebKB is a corpus of Web pages collected from computer science departments of four universities in January 1997. The class labels are faculty, staff, department, course, project, student and other. The Web pages are included in the corpus as HTML documents, so we have employed the Python library Beautiful Soup to extract the text from the HTML pages.
Twenty Newsgroups or 20News corpus [
20] is a set of almost 19 thousand newsgroup posts on twenty topics. In the experiments, we consider each topic to represent a document class label. The corpus was taken from the Python scikit-learn library for machine learning [
65].
Before performing natural language processing, as well as document classification, we had to pre-process the documents. The preprocessing typically includes document tokenization, the removal of stop words and normalization. During tokenization, the document is broken down into lexical tokens. Here, we opted for words.
The second phase included removing stop words, i.e., the process of removing frequently used words that were the most common, short function words without strong semantic properties that were needed for the syntax of language (as, e.g., pronouns, prepositions, conjunctions, abbreviations and interjections). The list of English stop words was taken from the Python Natural Language Toolkit (NLTK).
In the last pre-processing phase, we performed the reduction of different inflectional word forms into a single base word form. More specifically, stemming is a simple heuristic process of shortening the different word forms to a common root referred to as a stem. To this end, we employed the implementation of Porter stemming heuristics [
66] from NLTK.
3.2. Document Representation Models and Dimensionality Reduction
In the experiments, we considered 16 variants of the three document representation models introduced in
Section 2.1, clustered in the following four groups:
two variants of the BOW model, one considering features based on term frequency (bow-TF) and the other on term frequency, inverse document frequency (bow-TFIDF);
four variants of the word2vec model with embedding dimensionality of 25, 50, 75 and 100 (word2vec-n, where n denotes the embedding dimensionality);
seven variants of the doc2vec model with embedding dimensionality of 25, 50, 75, 100, 200, 500 and 1000 (doc2vec-n); and
three variants of the GOW model, each considering a different method for aggregating the values of the micro-level network properties.
Table 2 shows the number of features for the 16 variants of the document representation models. The models word2vec, doc2vec and GOW retained the same number of features across the four benchmarks. For both variants of the BOW model, the number of features after the dimensionality reduction using PCA (see
Section 2.3) varied across the benchmarks, e.g., the dimensionality of the 20News feature space was about ten times higher than the one in Brown. The variants of the GOW model were always constructed from the same set of network measures. The dimensionality of the feature space in the word2vec and doc2vec models equaled the dimensionality of the embedding vector space.
3.2.1. Bag-of-Words Model
Bag-of-words features were calculated with the scikit-learn library in Python [
65] using the TFIDFVectorizer function. For a bag-of-words representation of a given document
d, we used two weighting schemas; TF and TFIDF [
24]:
TF: the value of the feature for the term t in document d equals the number of occurrences of t in d;
TFIDF: the value of the feature for the term t in document d equals . The term is an inverse document frequency defined as , where is the number of documents in the data set that contain t, and n denotes the number of all documents.
When constructing the features, we employed document frequency thresholding (see
Section 2.3) to remove terms with a document frequency less than five [
67]. We also applied the principal component analysis (PCA, see
Section 2.3) on the obtained feature vectors as implemented in the scikit-learn library. Recall that the final dimensionality of features’ vectors was reported in TF+PCA and TFIDF+PCA rows in
Table 2.
3.2.2. Continuous-Space Models
For the continuous space document representation models we utilized the word2vec and doc2vec methods as implemented in the gensim library [
68]. The implementation of word2vec at input took a list of documents, each of them represented as a list of words, to train a neural network model, which can be used to calculate a vector representation for each word. We used the following parameter settings. The parameter min_count set a lower bound of a word frequency; since we preprocessed the data set, we set this threshold to 1. The parameter size denotes the dimensionality of the feature vectors, to this end, we selected four values of 25, 50, 75 and 100 (hence, four variants of the model). To obtain the representation of the whole document, we calculated the average of feature vectors for the words occurring in the document [
42]. For the other parameters, we retained the default settings.
The implementation of doc2vec at input took a list of documents, their unique identifiers, and a list of words in each document. The trained neural network can be used to calculate a vector representation for a given document. Since the doc2vec implementation extended the word2vec class, we applied the same settings of the shared parameters. Following the recommendation of the gensim library manual [
68], we set the number of iterations over the training documents to 20, where in each iteration a random sequence of training documents was fed into the neural network. Again, we varied the dimensionality of the resulting embedding vectors in the interval between 25 to 1000, leading to seven variants of the doc2vec model.
3.2.3. Network-Based Models
Lastly, we constructed language networks with nodes representing words and links connecting adjacent words within the same sentence. The links were directed and weighted, where the weight of a link between two nodes represents the overall co-occurrence frequency of the corresponding words, while the directions represent the ordering of linguistic units in a co-occurrence pair [
46]. Although language networks are very often constructed from raw (not preprocessed text), here network construction methods were applied after tokenization, the removal of stop words and stemming, in order to assure consistency with the setup for the construction of previous data representation models. Network construction and analysis was implemented using the Python NetworkX software package developed for the creation, manipulation, and study of the structure, dynamics, and functions of complex networks [
69].
The following macro-level properties of the language network were selected as features: the number of links, the number of nodes, the average degree, the average shortest path and the global and local efficiency. Next, we calculated local measures on the micro level of individual nodes: in-degree and out-degree, in-strength and out-strength, in-selectivity and out-selectivity, inverse participation ratio, betweenness, closeness, and page rank. Finally, two mezzo-level properties of transitivity and clustering coefficient were also used as features. The definitions and explanations of all the used network properties are in
Appendix A.
Since the micro- and mezzo-level properties are measured for individual nodes, we used three different aggregation methods to construct features’ vectors for the whole document. First, we took the average value of the property measured at individual nodes. Second, we took the minimal, maximal value, and the three quartiles of the distribution of the values of the network property. Third, we put the values in a histogram with ten equidistant intervals, and we measured the frequency of values in each interval. The three aggregation methods lead to three variants of the network-based document representation model: gow-avg, gow-qrt and gow-hist.
3.3. Learning and Evaluating Classification Models
To obtain an unbiased, out-of-sample estimate of the classification performance, we applied a single split of the training data set into the train and test data using createDataPartition from the caret package in R [
70]. Two of the experimental data sets (20News, Reuters8) already clustered their documents into training and test sets, while for the other two, we took a random, stratified, 80% samples of the documents without repetition as a training set and the remaining 20% of documents as a test set as presented in
Table 3. Note that the samples were stratified with respect to the distribution of the class labels.
Recall from
Section 2.2 that one of the reasons for selecting the random forest classifier is its robustness to the different parameter settings, where only the size of the random sample of features considered for selecting an optimal split in each iteration of the tree building procedure has a considerable impact on the classification performance [
71]. The value of the mtry parameter was tuned on the training set only using the tuneRF function from the R package RandomForest [
72] also providing the implementation of the random forest classifier, which is used in the experiments.
3.4. Ranking Classification Models
The comparative analysis and ranking of different model variants with regard to a single performance measure, such as accuracy and macro-averaged AUROC, precision, recall and F1-score is trivial: the larger the performance metrics, the better the classification model is.
We assess the statistical significance of the differences between the performance of variants using the framework for comparison of classification methods over multiple data sets proposed by Demšar [
73]. Following that framework, the comparison of methods is performed in two steps. In the first step, the Friedman test, a non-parametric alternative to the repeated measure ANOVA (analysis of variance), was used to validate the null hypothesis that the methods perform equally well. When the null hypothesis was rejected, the Nemenyi post-hoc test was used to calculate the critical distance (CD). The average ranks of two methods (averaged over the data sets) significantly differed if their difference was at least CD. The results of the comparison are visualized using an average-rank diagram (see Figure 2). The horizontal axis of the diagram corresponds to the rank score, and the top-ranked method is on the rightmost position on the axis. The groups of methods with average ranks that were not significantly different are connected with thick lines below the axis; the line above the axis depicts the critical distance. For calculating the critical distance, we used the significance level of 0.05.
On the other hand, when we ranked models with regard to a per-class performance measure (recall, precision, F1-score or AUROC), we had to compare their performance along multiple dimensions corresponding to class labels. To obtain a joint ranking with respect to the performance measured on all class labels, we employed the non-dominated sorting algorithm used in multi-objective decision theory [
74]. We first embedded the model variants into a
-dimensional space (recall that
denotes the number of class labels), where each dimension corresponds to a ranking of the variants with respect to one of the class labels. Each variant can then be depicted as a single point in that space, where each coordinate value was the rank of the method according to its performance on the particular class label.
Figure 1 depicts the projection of the four-dimensional space for the Brown4 data set and AUROC in two dimensions, obtained by using multidimensional scaling [
75]. The red, green, and blue labels in the graph correspond to the 16 variants of the document representation models.
To identify the top-ranked variants, we searched for a set of non-dominated points in the
-dimensional space, i.e., we identified the Pareto front of the non-dominated points in the space. The points in the Pareto front corresponded to the methods that are the best performers on at least one class label. After we assigned the top rank to these variants, we removed the corresponding points from the multi-dimensional space and iteratively continued to identify Pareto fronts in the reduced sets of points until all the methods were ranked. The lines in
Figure 1 depict the three Pareto fronts in the two-dimensional projection of the original three-dimensional space. The two variants of doc2vec-50 and doc2vec-75 in the first (red) Pareto-front are top-ranked (obtaining the rank of
, see the Brown4 column in Table 5), followed by five variants in the second (green; the assigned rank of
) and the remaining nine in the third (blue) Pareto front.
4. Results
In this section, we report upon the results of the document classification experiments with the 16 variants of the three document representation models, the seven data sets stemming from the four standard benchmark data sets and the five measures of performance of document classification.
In the first three subsections, we compare the model variants with respect to the three performance measure of AUROC, accuracy and F1-score. For the per-class measures of AUROC and F1-score we analyze both the rankings obtained with the multi-criteria and the macro-averaged AUROC. Note that the rankings with respect to the remaining two performance measures of precision and recall are reported in
Appendix B. Finally,
Supplementary Materials reports upon all the obtained results and absolute (not ranked) performance measures per task, class label and document representation model. The last subsection in this section provides brief summary of the experimental results.
Note that, in addition to the analysis of the overall rankings, we are going to analyze the rankings of model variants in groups of tasks, clustered according to three criteria of average document size, vocabulary size and number of class labels. The average document size was considered to be long for all four Brown tasks, medium for 20News and WebKD, and short for Reuters8. The vocabulary size was small for Brown and Reuters8 (cca. 30 K) and large for 20News and WebKD (more than 100 K). Finally, we considered three groups of tasks with small (2–4 for Brown2 and Brown4), moderate (7–10 for Brown10, WebKD and Reuters8) and large (15–20 for Brown15 and 20News) number of class labels.
4.1. AUROC Performance and Rankings
Table 4 summarizes the macro-averaged AUROC performance of the document representation models. The results, especially the distribution of the top-ranked models in the table, suggest that classification models based on the GOW model were inferior to the ones built upon BOW and continuous-space models. Furthermore, the results provide a hint towards top-performing models within individual groups; in the bag-of-words group of models, the TFIDF variant showed superior performance; word2vec-50 and doc2vec-25 were top-ranked in the two groups of continuous-space models, while gow-avg was the top-ranked graph-of-words model.
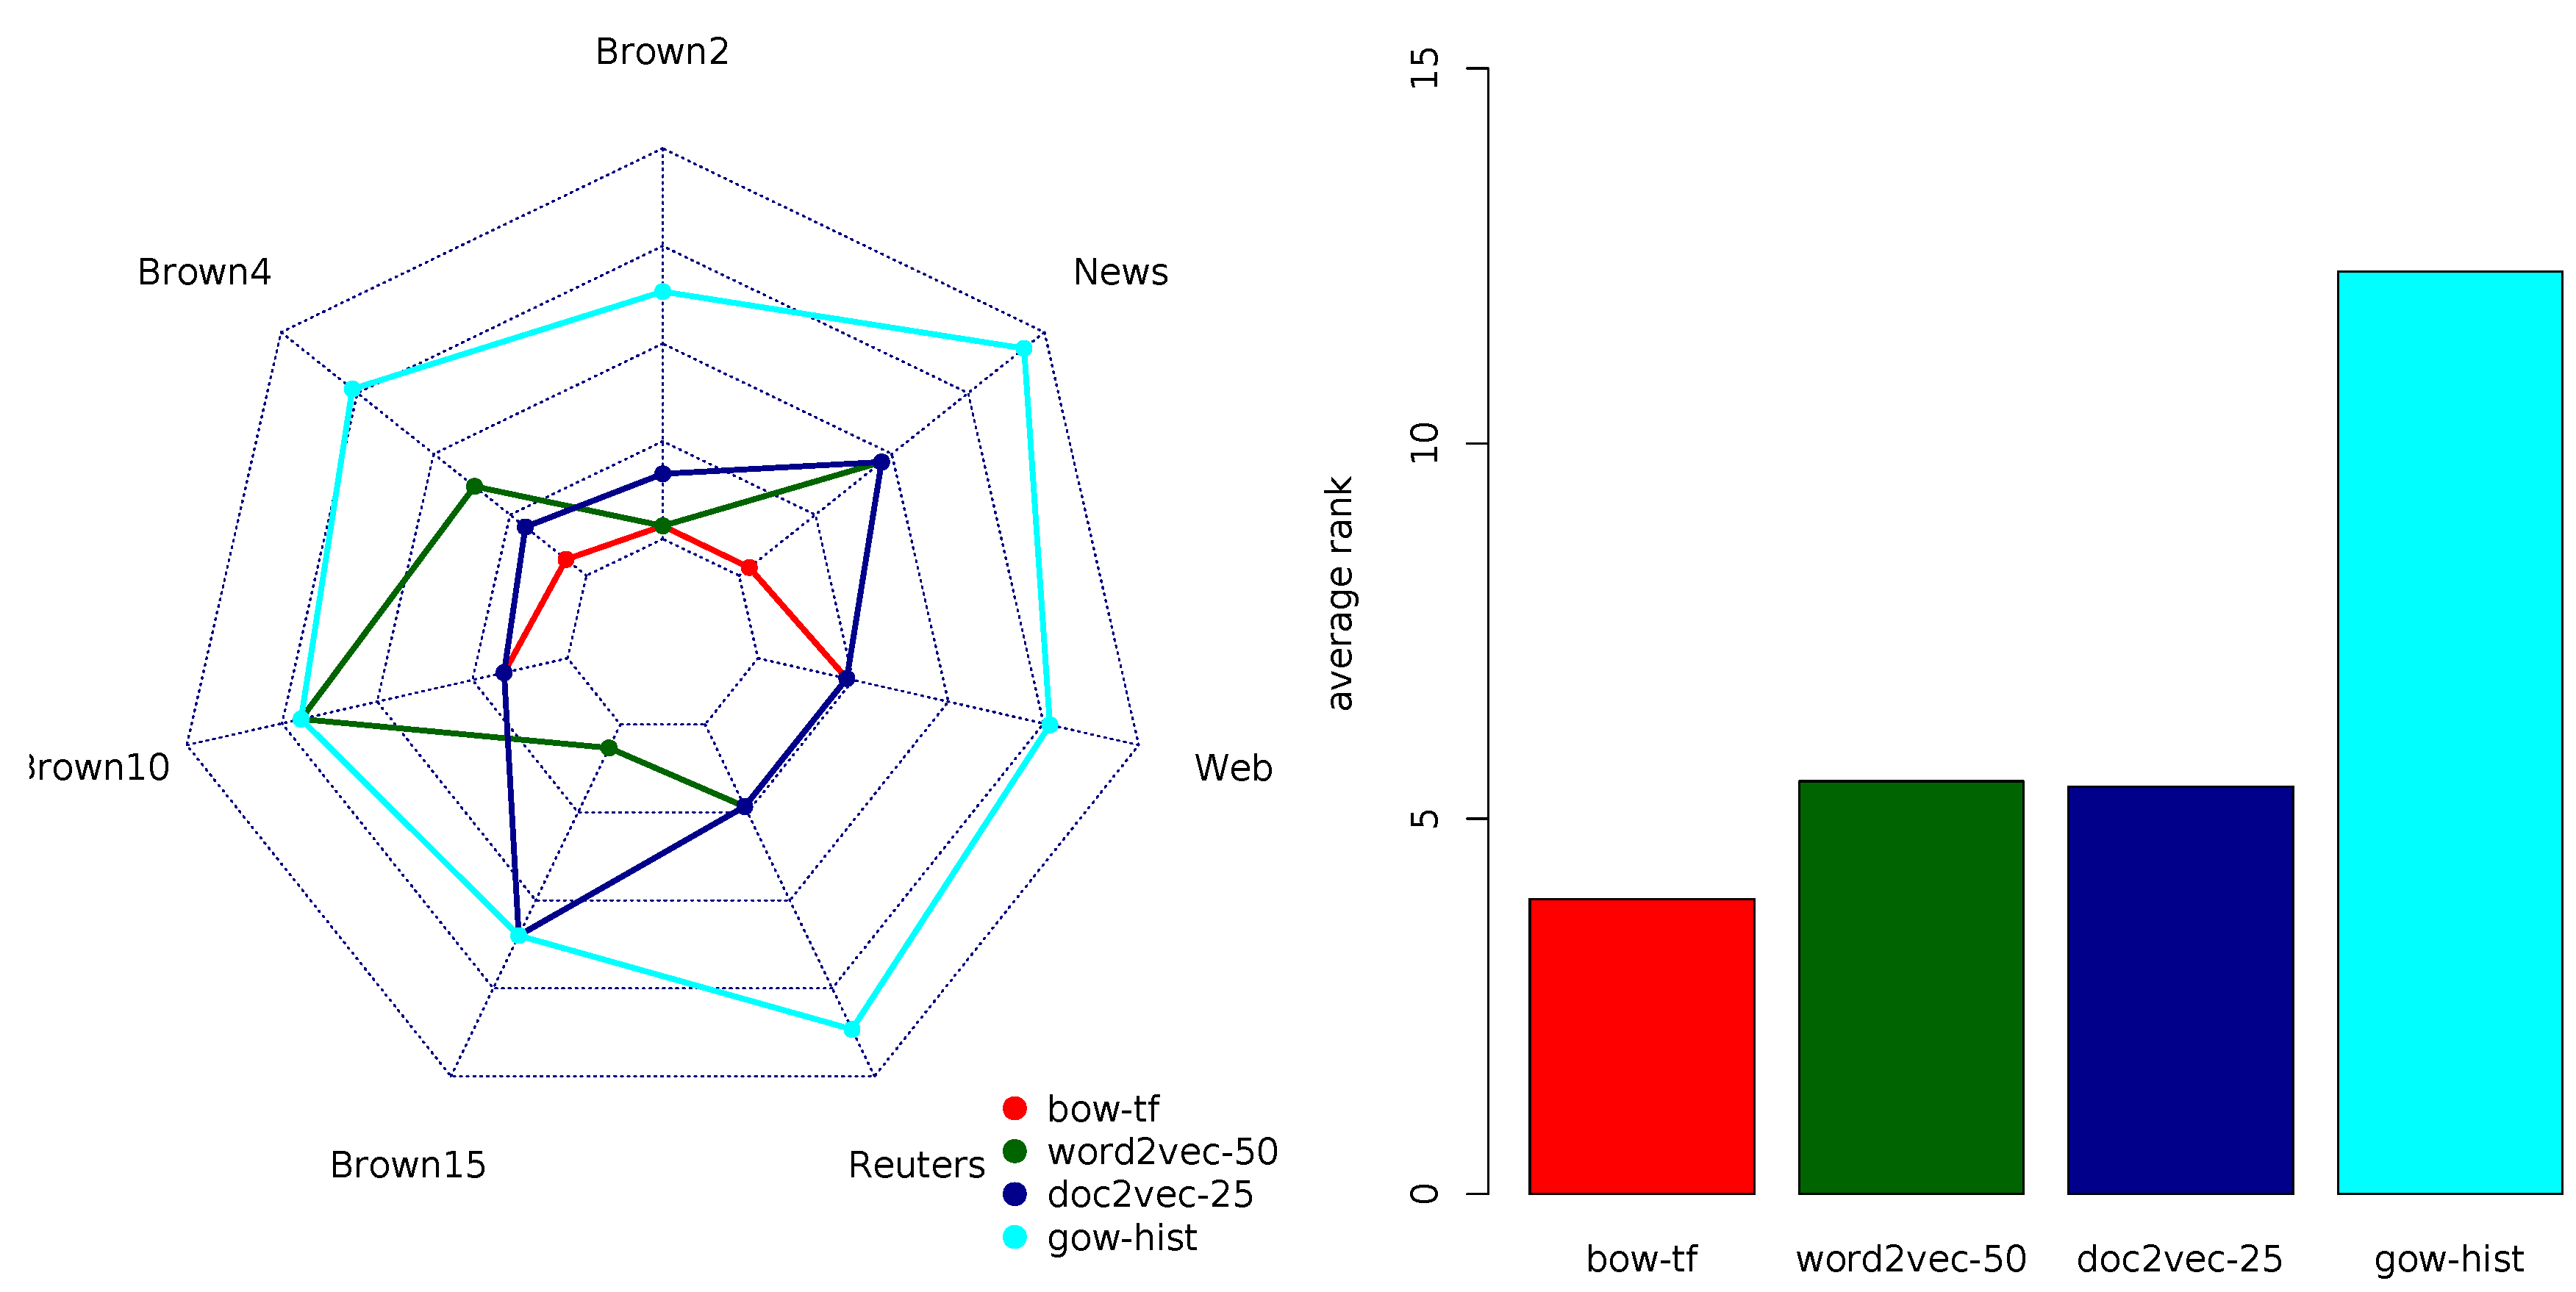
Furthermore,
Figure 2 presents the average ranks of the four top-ranked models in each group. The average-rank diagram shows that bow-TFIDF and the doc2vec-25 model variants lead to a comparable performance (average ranks of 1.57 and 1.71, respectively), which was quite different from the overall performance of the other two models. The critical distance (CD) analysis, depicted in the diagram, also shows that the differences between the bag-of-words and continuous-space model variants were not statistically significant; the graph-based model was the only model with a statistically significant inferior performance. Note that we have repeated this analysis for the ranking according to the other performance measures considered in the paper (accuracy, F1-score, precision and recall). The average rank diagrams in all four cases were almost identical to the one reported in
Figure 2, hence we omit them.
Table 5 summarizes the multi-objective rankings of the 16 document representation models according to the AUROC performance measure. The average ranks suggest that doc2vec had a performance superior to all the other representation model variants. Again, this was only true for the variants of doc2vec corresponding to low-dimensional feature vectors (50 and 75). The other models were ranked as follows: BOW variants closely followed the top-ranked doc2vec variants, word2vec variants followed them, while GOW variants were the worst performers. Just as in the case of macro-averaged AUROC, gov-avg was the top-ranked variant of the GOW representation model. The overall results of the multi-objective ranking closely resembled the results obtained using the macro-averaged AUROC.
Figure 3 depicts the comparison of the four top-ranked variants in each of the four groups of models according to the multi-objective AUROC ranking. It reconfirms previous observations about the superior performance of the (blue colored) doc2vec document representation model, both in terms of ranks on individual data sets and averaged ranks. Note also that the average rankings were consistent with the rankings on the majority of the document classification tasks. Two notable exceptions were Reuters8 and 20News, where the TFIDF variant of the BOW model outperformed the equally ranked doc2vec and word2vec models. Two other exceptions included WebKD, where BOW, word2vec and the low-dimensional variants of doc2vec were top-ranked, and Brown10, where bow-TF was among the top-ranked models. Note that three out of four exceptions corresponded to the tasks with a moderate number of class labels. Other data set properties did not seem to be related to the AUROC performance.
In sum, according to AUROC, the doc2vec variants with low-dimensional embedding vectors (≤75) outperformed other document representation models. For tasks with a moderate number of class labels, one can also consider the bag-of-word model, although the decision for BOW calls for the careful selection of one of its two variants.
4.2. Accuracy Rankings
Table 6 summarizes the rankings of the document representation models according to accuracy. The average ranks according to accuracy suggest that bow-TF is the top-ranking model followed by doc2vec-25 and bow-TFIDF. The variants of doc2vec corresponding to low-dimensional embedding dimensionality (≤75) outperform all the word2vec variants, while the GOW model variants (together with high-dimensional variants of doc2vec) are the worse performers. Note again that
gov-avg is the top-ranked GOW model variant, which is consistent with the results obtained on AUROC.
For the classification tasks including longer documents, BOW and doc2vec lead to the maximal accuracy; for medium sized documents, the best accuracy is obtained using BOW and word2vec variants, while for the tasks including short documents BOW variants are clearly outperforming all the other representation models. The same descendant ordering of ranked representation models BOW, doc2vec, word2vec, GOW is preserved regardless of the size of vocabulary or the number of class labels. The only slight deviation (in which word2vec and doc2vec exchange the ranking positions) is noticed for the large-vocabulary data sets and the moderate number of class labels.
In summary, following the graphical representation of the accuracy rankings in
Figure 4, when interested in classification accuracy, the two variants of the BOW model were the most advisable choices regardless of the vocabulary size or the number of class labels; for tasks involving long documents, doc2vec could also be a recommended option.
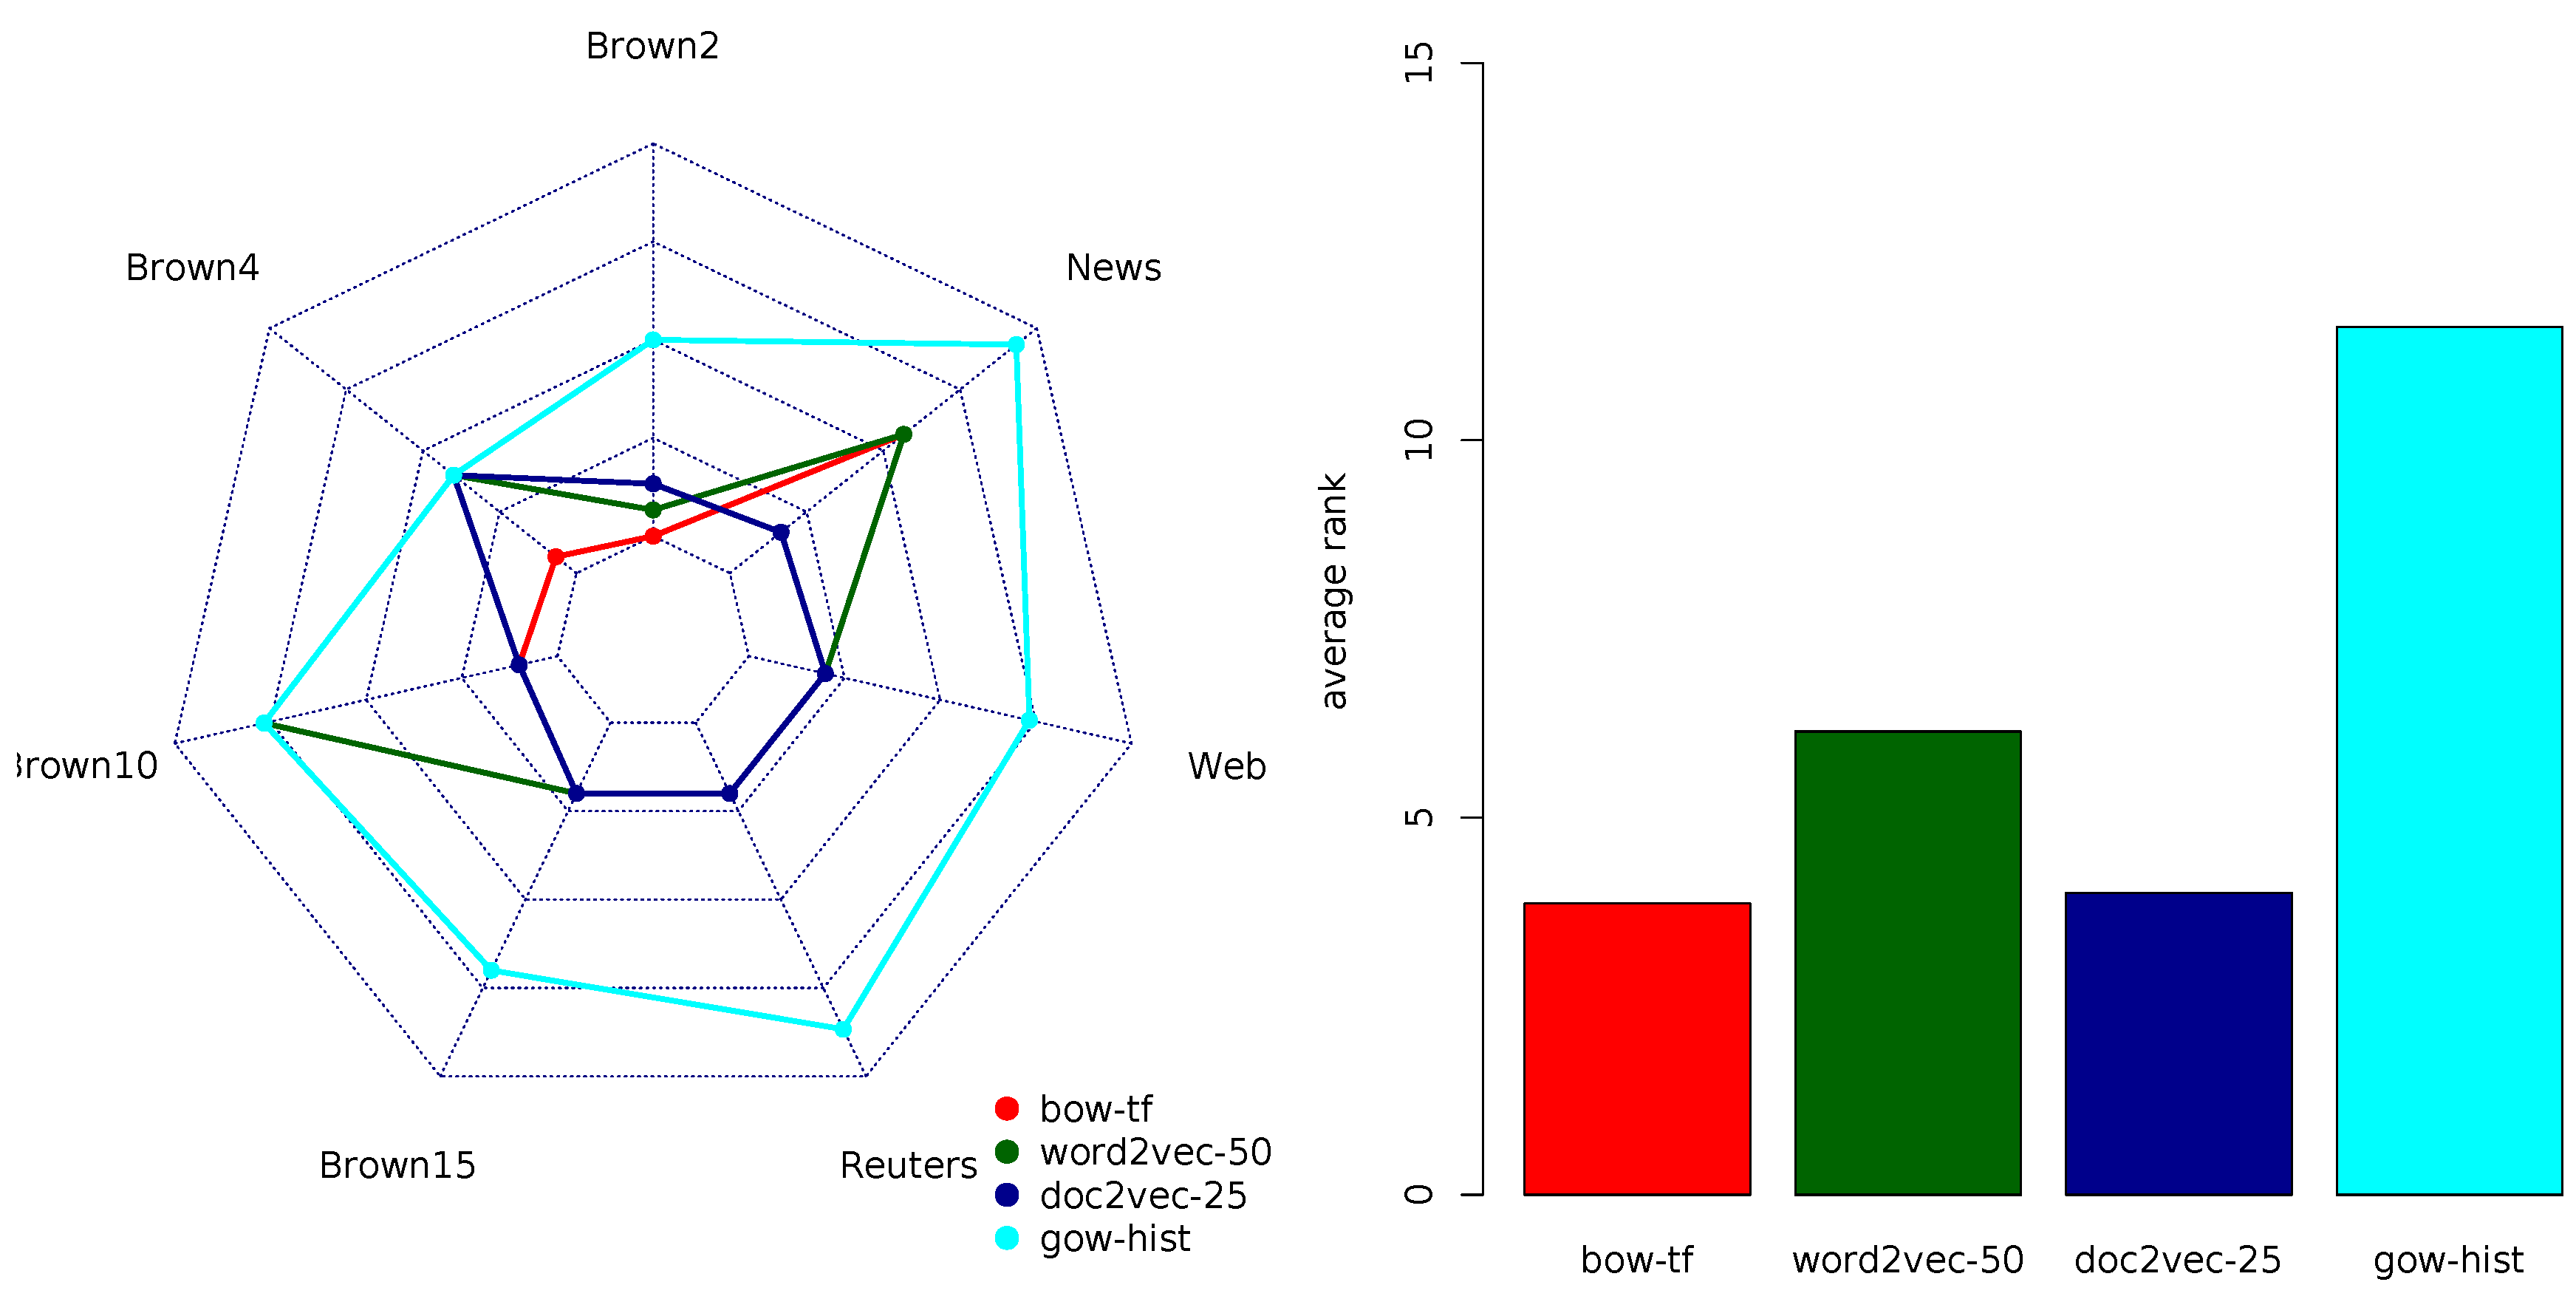
4.3. F1-Score Rankings
Table 7 summarizes the rankings of the document representation models according to the F1-score. The average ranks suggest that bow-TF and doc2vec-25 variants outperformed the other representation models. The TFIDF variant of BOW and word2vec exhibited lower ranks, while the high-dimensional variants of doc2vec and all GOW-model variants were (again) the worst performers. This time, gow-host was the top-ranked variant among the GOW models.
The graphical representation of the top-ranked variants in each group in
Figure 5 reveals that for longer documents, the top-performing doc2vec and BOW variants exhibited comparable rankings. For medium and small sized documents, the TFIDF variant of BOW (and word2vec in the case of WebKB) had a slight edge over doc2vec, although the differences were negligible. Furthermore, the same descendant ordering of ranked representation models BOW and doc2vec on top, word2vec in the middle, and GOW at the bottom, was preserved regardless of the size of the vocabulary or the number of class labels. Note that, for the small number of class labels, the GOW variants’ performance became comparable to some of the lower-ranked variants of doc2vec and word2vec.
In summary, according to the F1-score, doc2vec variants with low-dimensional embedding spaces and bow-TF outperformed other document representation models. For data sets involving small-sized documents, one should select the TFIDF variant of the BOW model, while for the others, low-dimensional variants of doc2vec are to be preferred. The precision and recall rankings, reported in
Table A1 and
Table A2, mostly confirmed the regularities observed here, providing a single novel insight; the word2vec model leads to high-precision classification models.
4.4. Discussion
Taken together, the presented results identify two top-performing document representation models; the traditionally and commonly used bag-of-words, and the more recent doc2vec model. The findings are consistent regardless of the performance evaluation metrics. The standard variant of the bag-of-words model often used in the text mining studies [
2,
62] is bow-TFIDF. However, our results show that the TF variant is often better or comparable to bow-TFIDF. The only performance metrics where the latter outperforms TF is the recall. When it comes to the variants of doc2vec, we have an important result, not reported in related studies. Namely, the low-dimensional variants of doc2vec are better performers than the high-dimensional ones. In our results, the phase switch is observed at 75 features. While this might be an artifact of the data sets and tasks selected in this study, it is a general pattern that consistently appears among all of them.
The word2vec model is mostly ranked in the middle of the list. The top-ranked variants of word2vec correspond to the feature vector dimensionality of 50 and 75, the other two settings of 25 and 100 underperform in almost all the experiments. Early on in the experiments, we noticed that the higher-dimensional variants (>100) of word2vec (just as the ones for doc2vec) have a deteriorated performance. Note that the lower performance of the word2vec document representation model (when compared to doc2vec) might be due to the averaging method used [
42]. On the other hand, (an extension of) doc2vec has already been shown to perform well in the document classification task [
9].
The network-based model is systematically underperforming regardless of the selected task or evaluation measure. Still, some additional remarks should be noted. The number of features used in all three network-based model variants with averaging, quartiles and histograms are 19, 68 and 128, respectively, which is lower than in other models (see
Table 2 for details). Although GOW is lagging behind in all the rankings, in some (rare) occasions, it can still be the representation of choice, especially if we look for a low-dimensional document representation model robust to noise. Namely, note that the network-based model requires no extensive text pre-processing, which can be useful when aiming at efficient implementations of document classification procedures, especially for low-resources languages, which lack elaborate text preprocessing tools.
Finally, the analysis of the results with respect to the criteria of the document, vocabulary and class label set size does not reveal clear results with several notable exceptions, addressed next. Regarding the document size, bag-of-words is the preferred model for smaller documents regardless of the evaluation metrics, while for larger documents doc2vec has a slight advantage. Additionally, when it comes to choosing between word2vec and doc2vec, the latter seems to be consistently the better choice, except when observing accuracy on data sets with larger vocabularies and tasks with a moderate number of class labels.
5. Conclusions
In this study, we conduct a comparative analysis of the performance of document representation models when coupled with classification models learned with the computationally efficient method of random forest. In particular, we consider the most frequently used family of bag-of-words models, more recently proposed continuous space models word2vec and doc2vec, and the model based on the representation of text documents as language networks (graph-of-words). While the bag-of-words models have been extensively used for the document classification task, the performance of the other two models in the same task, especially the network-based model, have not been well understood. In this study, we measure the performance of the document classifiers trained using the random forest method on features generated from the three representation models and their derivatives. The document representation models are tested on four benchmarks and seven tasks enabling insights into the performance of document classification for different document and vocabulary sizes and a different number of class labels. The comparative analysis is conducted using the standard frameworks of average-rank diagrams and multi-objective optimization for various performance measures.
To conclude, the results promote the use of both standard bag-of-words and more recent doc2vec document representation models on new document classification tasks. Moreover, we suggest comparing their performance with multiple evaluation metrics simultaneously. In general, bag-of-words is more demanding for implementation and requires the representation vectors of higher dimensionality, which are consequently reduced with some dimensionality reduction technique (a principle component analysis in this study), which are computationally expensive. The reduced dimensionality of the features’ vectors space is still higher than the one in doc2vec, which deteriorates the efficiency of the classifier during construction as well as during the classification stage. On the other hand, doc2vec is in general faster, generates lower-dimensional feature vectors (up to 75), while achieving the performance comparable to that of the bag-of-words model. Additionally, doc2vec enables the fast training of the classification model and requires no further dimensionality reduction. Taking into account all the desirable characteristics of doc2vec, one would prefer to use it for the document classification task. Still, some drawbacks should be considered as well. Feature vectors in doc2vec carry no meaning unless projected to a low-dimensional embedding space. Thus, the doc2vec model is lacking understandability, which in turn complicates the eventual manual inspection or the revision or fine tuning of the classification model.
This study sheds some light onto possible document representation models, providing an objective and systematic evaluation and comparison in the carefully designed experimental environment. The study confirms many benefits of the state-of-the-art approaches and clarifies the behavior of newly proposed models. Although we aimed at the complete study of the open issues of document representation models for the document classification task we have to set some limitations. In order to keep the experimental setup as steady as possible, we limited our focus to well-known data sets, at the price of the relatively small document collections. Being aware of it, in the next step we plan to extend this comparison to large document collections which better mimic the real-life magnitude of the problem. Likewise, in future we are planing to experiment with different dimensionality reduction techniques. Next, we are planing to use PCA and other dimensionality reduction techniques instead of aggregations in the graph-of-words model and to experiment with different classification models. Principally, our future research plans include studying the potential of meta-level combinations of the features obtained with different document representation models.
Supplementary Materials
The following are available online at
https://www.mdpi.com/2076-3417/9/4/743/s1. Detailed results for each class of the four data sets and document representation models with different evaluation metrics (accuracy, precision, recall, F1-score and area under ROC curve) are provided in an online supplementary file.
Author Contributions
Conceptualization and methodology: S.M.-I., L.T.; software and validation: T.M., L.T.; investigation, resources and data curation: S.M.-I., T.M., L.T.; writing, review and editing: S.M.-I., T.M., L.T.
Funding
This research has been in part funded by the University of Rijeka under the LangNet project (13.13.2.2.07).
Acknowledgments
The authors acknowledge the financial support from the Slovenian Research Agency (research core funding No. P5-0093).
Conflicts of Interest
The authors declare no conflict of interest. The funders had no role in the design of the study; in the collection, analyses, or interpretation of data; in the writing of the manuscript, or in the decision to publish the results.
Abbreviations
The following abbreviations (in alphabetical order) are used in this manuscript:
| AUROC | Area under the receiver-operating characteristic curve |
| BOW | Bag of words |
| CBOW | Continuous bag of words |
| GOW | Graph of words |
| NLTK | Natural language toolkit |
| PCA | Principal component analysis |
| TF | Term frequency |
| TFIDF | Term frequency, inverse document frequency |
Appendix A. Complex Network Measures
In this section, we define all the network measures used for the construction of the features in the document representation model based on language networks. A language network is a pair of sets , where V is the set of nodes (vertices) representing the linguistic units and E is the set of edges (links) links representing the interactions between linguistic units.
The average shortest path is defined as
where
is a shortest path between nodes
i and
j, and
N is the number of nodes.
An efficiency measure was first defined in [
76,
77] as a property quantifying the efficiency of information exchange over the network
Local efficiency is defined as the average efficiency of the local subgraphs:
where
is the subgraph of the neighbors of
i.
Next we calculate local measures: in-degree and out-degree of node
i, denoted by
which are the number of its ingoing and outgoing nearest neighbours, in-strength and out-strength
of the node
i which are the sum of its ingoing and outgoing edge weights, average strength or selectivity as:
Inverse participation ratio
where
indicate the sum of the weights of the edges incident upon node
i and
is weight of the edge between node
i and
j [
78].
Transitivity is defined as
where triads are two edges with a shared node.
The clustering coefficient is a measure which defines the presence of loops of the order three and is defined as:
where
represents the number of pairs of neighbours of
i that are connected.
Betweeness centrality (
) and closeness centrality (
) [
79] are
where
denotes the number of shortest paths from
to
, and
denotes the number of shortest paths from
s to
t that some
lies on, and
is the distance between nodes
s and
t.
Page rank [
80] of the node is based on the eigenvector centrality measure and implements the concept of ’voting’. The Page rank score of a node
v is initialized to a default value and computed iteratively until convergence using the following equation:
where
d is the dumping factor set between 0 and 1 (usually 0.85).
Appendix B. Rankings According to Precision and Recall
Appendix B.1. Precision Rankings
Table A1 and
Figure A1 summarize the rankings of the document representation models according to the precision performance measure.
Table A1.
Multi-objective ranking of the 16 variants of the three document representation models by document classification task with respect to precision. The last column reports the average rankings over the seven tasks. The top-ranked models in each column are shown in bold.
Table A1.
Multi-objective ranking of the 16 variants of the three document representation models by document classification task with respect to precision. The last column reports the average rankings over the seven tasks. The top-ranked models in each column are shown in bold.
| | Brown2 | Brown4 | Brown10 | Brown15 | Reuters8 | WebKB | 20News | Avg. Rank |
|---|
| bow-TF | 1.5 | 2 | 3.5 | 10 | 4.5 | 4.5 | 1.5 | 3.93 |
| bow-TFIDF | 6.5 | 12.5 | 3.5 | 10 | 1 | 4.5 | 1.5 | 5.64 |
| word2vec-25 | 10.5 | 12.5 | 11.5 | 10 | 4.5 | 4.5 | 8 | 8.79 |
| word2vec-50 | 1.5 | 6.5 | 11.5 | 2 | 4.5 | 4.5 | 8 | 5.50 |
| word2vec-75 | 6.5 | 12.5 | 3.5 | 2 | 4.5 | 4.5 | 8 | 5.93 |
| word2vec-100 | 6.5 | 6.5 | 11.5 | 10 | 4.5 | 4.5 | 8 | 7.36 |
| doc2vec-25 | 3.5 | 4 | 3.5 | 10 | 4.5 | 4.5 | 8 | 5.43 |
| doc2vec-50 | 6.5 | 2 | 11.5 | 2 | 8.5 | 4.5 | 8 | 6.14 |
| doc2vec-75 | 3.5 | 2 | 3.5 | 10 | 8.5 | 12.5 | 8 | 6.86 |
| doc2vec-100 | 14.5 | 6.5 | 11.5 | 10 | 10.5 | 12.5 | 8 | 10.50 |
| doc2vec-200 | 10.5 | 6.5 | 11.5 | 10 | 14 | 12.5 | 8 | 10.43 |
| doc2vec-500 | 14.5 | 12.5 | 3.5 | 10 | 14 | 12.5 | 8 | 10.71 |
| doc2vec-1000 | 10.5 | 12.5 | 11.5 | 10 | 10.5 | 12.5 | 8 | 10.79 |
| gow-avg | 14.5 | 12.5 | 11.5 | 10 | 14 | 12.5 | 15 | 12.86 |
| gow-qrt | 14.5 | 12.5 | 11.5 | 10 | 14 | 12.5 | 15 | 12.86 |
| gow-hist | 10.5 | 12.5 | 11.5 | 10 | 14 | 12.5 | 15 | 12.29 |
Figure A1.
Radar-chart comparison of the multi-objective rankings by task (left) and their averages (right) for the four top-performing variants of the document representation models in each of the four groups with respect to precision.
Figure A1.
Radar-chart comparison of the multi-objective rankings by task (left) and their averages (right) for the four top-performing variants of the document representation models in each of the four groups with respect to precision.
Appendix B.2. Recall Rankings
Table A2 and
Figure A2 summarize the rankings of the document representation models according to the recall performance measure.
Table A2.
Multi-objective ranking of the 16 variants of the three document representation models by document classification task with respect to recall. The last column reports the average rankings over the seven tasks. The top-ranked models in each column are shown in bold.
Table A2.
Multi-objective ranking of the 16 variants of the three document representation models by document classification task with respect to recall. The last column reports the average rankings over the seven tasks. The top-ranked models in each column are shown in bold.
| | Brown2 | Brown4 | Brown10 | Brown15 | Reuters8 | WebKB | 20News | Avg. Rank |
|---|
| bow-TF | 1.5 | 6.5 | 7 | 3.5 | 5.5 | 3 | 8 | 5.00 |
| bow-TFIDF | 6.5 | 2.5 | 3 | 3.5 | 5.5 | 3 | 1.5 | 3.64 |
| word2vec-25 | 10.5 | 13 | 12.5 | 11 | 5.5 | 11 | 8 | 10.21 |
| word2vec-50 | 1.5 | 2.5 | 12.5 | 11 | 5.5 | 11 | 8 | 7.43 |
| word2vec-75 | 6.5 | 13 | 12.5 | 11 | 5.5 | 11 | 8 | 9.64 |
| word2vec-100 | 6.5 | 6.5 | 12.5 | 11 | 5.5 | 11 | 8 | 8.71 |
| doc2vec-25 | 3.5 | 13 | 3 | 3.5 | 5.5 | 11 | 8 | 6.79 |
| doc2vec-50 | 6.5 | 6.5 | 3 | 11 | 5.5 | 3 | 8 | 6.21 |
| doc2vec-75 | 3.5 | 6.5 | 3 | 1 | 5.5 | 3 | 8 | 4.36 |
| doc2vec-100 | 14.5 | 6.5 | 3 | 3.5 | 5.5 | 3 | 1.5 | 5.36 |
| doc2vec-200 | 10.5 | 1 | 12.5 | 11 | 13.5 | 11 | 8 | 9.64 |
| doc2vec-500 | 14.5 | 6.5 | 7 | 11 | 13.5 | 11 | 8 | 10.21 |
| doc2vec-1000 | 10.5 | 13 | 12.5 | 11 | 13.5 | 11 | 8 | 11.36 |
| gow-avg | 14.5 | 13 | 7 | 11 | 13.5 | 11 | 15 | 12.14 |
| gow-qrt | 14.5 | 13 | 12.5 | 11 | 13.5 | 11 | 15 | 12.93 |
| gow-hist | 10.5 | 13 | 12.5 | 11 | 13.5 | 11 | 15 | 12.36 |
Figure A2.
Radar-chart comparison of the multi-objective rankings by task (left) and their averages (right) for the four top-performing variants of the document representation models in each of the four groups with respect to recall.
Figure A2.
Radar-chart comparison of the multi-objective rankings by task (left) and their averages (right) for the four top-performing variants of the document representation models in each of the four groups with respect to recall.
References
- Aggarwal, C.C.; Zhai, C. A Survey of Text Classification Algorithms. In Mining Text Data; Springer US: Boston, MA, USA, 2012; pp. 163–222. [Google Scholar] [CrossRef]
- Sebastiani, F. Machine Learning in Automated Text Categorization. ACM Comput. Surv. 2002, 34, 1–47. [Google Scholar] [CrossRef]
- Salton, G.; Buckley, C. Term-weighting approaches in automatic text retrieval. Inf. Proc. Manag. 1988, 24, 513–523. [Google Scholar] [CrossRef]
- Kosala, R.; Blockeel, H. Web Mining Research: A Survey. SIGKDD Explor. Newsl. 2000, 2, 1–15. [Google Scholar] [CrossRef]
- Yang, Y.; Pedersen, J.O. A comparative study on feature selection in text categorization. In Proceedings of the Fourteenth International Conference on Machine Learning, Nashville, TN, USA, July 8–12 1997; pp. 412–420. [Google Scholar]
- Mikolov, T.; Chen, K.; Corrado, G.; Dean, J. Efficient estimation of word representations in vector space. arXiv, 2013; arXiv:1301.3781. [Google Scholar]
- Le, Q.V.; Mikolov, T. Distributed Representations of Sentences and Documents. In Proceedings of the ICML’14 Proceedings of the 31st International Conference on International Conference on Machine Learning, Beijing, China, 21–26 June 2014; Volume 14, pp. 1188–1196. [Google Scholar]
- Severyn, A.; Moschitti, A. Twitter Sentiment Analysis with Deep Convolutional Neural Networks. In Proceedings of the 38th International ACM SIGIR Conference on Research and Development in Information Retrieval, Santiago, Chile, 9–13 August 2015; ACM: New York, NY, USA, 2015; pp. 959–962. [Google Scholar] [CrossRef]
- Jawahar, G.; Manish, G.; Vasudeva, V. Doc2Sent2Vec: A Novel Two-Phase Approach for Learning Document Representation. In Proceedings of the SIGIR ’16 39th International ACM SIGIR Conference on Research and Development in Information Retrieval, Pisa, Italy, 17–21 July 2016; ACM: New York, NY, USA, 2016; pp. 809–812. [Google Scholar] [CrossRef]
- Kim, D.; Seo, D.; Cho, S.; Kang, P. Multi-co-training for document classification using various document representations: TF-IDF, LDA, and Doc2Vec. Inf. Sci. 2019, 477, 15–29. [Google Scholar] [CrossRef]
- Hassan, S.; Mihalcea, R.; Banea, C. Random walk term weighting for improved text classification. Int. J. Semant. Comput. 2007, 1, 421–439. [Google Scholar] [CrossRef]
- Blanco, R.; Lioma, C. Graph-based Term Weighting for Information Retrieval. Inf. Retr. 2012, 15, 54–92. [Google Scholar] [CrossRef]
- Rossi, R.G.; de Paulo Faleiros, T.; de Andrade Lopes, A.; Rezende, S.O. Inductive Model Generation for Text Categorization Using a Bipartite Heterogeneous Network. In Proceedings of the 2012 IEEE 12th International Conference on Data Mining, Brussels, Belgium, 10–13 December 2012; pp. 1086–1091. [Google Scholar] [CrossRef]
- Rousseau, F.; Kiagias, E.; Vazirgiannis, M. Text categorization as a graph classification problem. In Proceedings of the ACL 53rd Annual Meeting of the Association for Computational Linguistics and the 7th International Joint Conference on Natural Language Processing, Beijing, China, 26–31 July 2015; Volume 15, p. 107. [Google Scholar]
- Malliaros, F.D.; Skianis, K. Graph-based term weighting for text categorization. In Proceedings of the 2015 IEEE/ACM International Conference on Advances in Social Networks Analysis and Mining, Paris, France, 25–28 August 2015; pp. 1473–1479. [Google Scholar] [CrossRef]
- Papadakis, G.; Giannakopoulos, G.; Paliouras, G. Graph vs. bag representation models for the topic classification of web documents. World Wide Web 2016, 19, 887–920. [Google Scholar] [CrossRef]
- Breiman, L. Random Forests. Mach. Learn. 2001, 45, 5–32. [Google Scholar] [CrossRef]
- Zhou, Z.H.; Feng, J. Deep forest: Towards an alternative to deep neural networks. arXiv, 2017; arXiv:1702.08835. [Google Scholar]
- Francis, N.W.; Kucera, H. The Brown Corpus: A Standard Corpus of Present-Day Edited American English; Department of Linguistics, Brown University: Providence, RI, USA, 1979. [Google Scholar]
- Lang, K. Newsweeder: Learning to filter netnews. In Proceedings of the 12th International Conference on Machine Learning, Tahoe City, CA, USA, 9–12 July 1995; pp. 331–339. [Google Scholar]
- Craven, M.; DiPasquo, D.; Freitag, D.; McCallum, A.; Mitchell, T.; Nigam, K.; Slattery, S. Learning to Extract Symbolic Knowledge from the World Wide Web. In Proceedings of the Fifteenth National Conference on Artificial Intelligence (AAAI-98), Madison, WI, USA, 26–30 July 1998; The AAAI Press: Menlo Park, CA, USA, 1998. [Google Scholar]
- Lewis, D.D.; Yang, Y.; Rose, T.G.; Li, F. Rcv1: A new benchmark collection for text categorization research. J. Mach. Learn. Res. 2004, 5, 361–397. [Google Scholar]
- Howland, P.; Jeon, M.; Park, H. Structure preserving dimension reduction for clustered text data based on the generalized singular value decomposition. SIAM J. Matrix Anal. Appl. 2003, 25, 165–179. [Google Scholar] [CrossRef]
- Manning, C.D.; Raghavan, P.; Schütze, H. Introduction to Information Retrieval; Cambridge University Press: New York, NY, USA, 2008. [Google Scholar]
- Zhang, X.; Zhao, J.; LeCun, Y. Character-level Convolutional Networks for Text Classification. In Advances in Neural Information Processing Systems 28, Proceedings of the 28th International Conference on Neural Information Processing Systems (NIPS’15), Montreal, QC, Canada, 7–12 December 2015; Cortes, C., Lawrence, N.D., Lee, D.D., Sugiyama, M., Garnett, R., Eds.; Curran Associates, Inc.: Red Hook, NY, USA, 2015; Volume 1, pp. 649–657. [Google Scholar]
- Mikolov, T.; Yih, W.T.; Zweig, G. Linguistic Regularities in Continuous Space Word Representations. In Proceedings of the 2013 Conference of the North American Chapter of the Association for Computational Linguistics: Human Language Technologies, Atlanta, GA, USA, 9–14 June; Association for Computational Linguistics: Atlanta, GA, USA, 2013; pp. 746–751. [Google Scholar]
- Bengio, Y.; Ducharme, R.; Vincent, P.; Jauvin, C. A neural probabilistic language model. J. Mach. Learn. Res. 2003, 3, 1137–1155. [Google Scholar]
- Ren, Y.; Wang, R.; Ji, D. A topic-enhanced word embedding for Twitter sentiment classification. Inf. Sci. 2016, 369, 188–198. [Google Scholar] [CrossRef]
- Rexha, A.; Kröll, M.; Dragoni, M.; Kern, R. Polarity Classification for Target Phrases in Tweets: A Word2Vec Approach. In The Semantic Web: ESWC 2016 Satellite Events; Springer International Publishing: Cham, Switzerland, 2016; pp. 217–223. [Google Scholar] [CrossRef]
- Liang, H.; Fothergill, R.; Baldwin, T. RoseMerry: A Baseline Message-level Sentiment Classification System. In Proceedings of the 9th International Workshop on Semantic Evaluation (SemEval 2015), Denver, CO, USA, 4–5 June 2015; Association for Computational Linguistics: Denver, CO, USA, 2015; pp. 551–555. [Google Scholar]
- Bicalho, P.; Pita, M.; Pedrosa, G.; Lacerda, A.; Pappa, G.L. A general framework to expand short text for topic modeling. Inf. Sci. 2017, 393, 66–81. [Google Scholar] [CrossRef]
- Yoshikawa, Y.; Iwata, T.; Sawada, H. Latent Support Measure Machines for Bag-of-Words Data Classification. In Advances in Neural Information Processing Systems 27; Ghahramani, Z., Welling, M., Cortes, C., Lawrence, N.D., Weinberger, K.Q., Eds.; Curran Associates, Inc.: Red Hook, NY, USA, 2014; pp. 1961–1969. [Google Scholar]
- Lilleberg, J.; Zhu, Y.; Zhang, Y. Support vector machines and Word2vec for text classification with semantic features. In Proceedings of the 2015 IEEE 14th International Conference on Cognitive Informatics Cognitive Computing, Beijing, China, 6–8 July 2015; pp. 136–140. [Google Scholar] [CrossRef]
- Tang, B.; Cao, H.; Wang, X.; Chen, Q.; Xu, H. Evaluating word representation features in biomedical named entity recognition tasks. BioMed Res. Int. 2014, 2014, 1–6. [Google Scholar] [CrossRef] [PubMed]
- Zou, W.Y.; Socher, R.; Cer, D.M.; Manning, C.D. Bilingual Word Embeddings for Phrase-Based Machine Translation. In Proceedings of the 2013 Conference on Empirical Methods in Natural Language Processing (EMNLP), Seattle, WA, USA, 18–21 October 2013; pp. 1393–1398. [Google Scholar]
- Freitas, A.; Barzegar, S.; Sales, J.E.; Handschuh, S.; Davis, B. Semantic Relatedness for All (Languages): A Comparative Analysis of Multilingual Semantic Relatedness Using Machine Translation. In Proceedings of the Knowledge Engineering and Knowledge Management: 20th International Conference, EKAW 2016, Bologna, Italy, 19–23 November 2016; Springer International Publishing: Cham, Switzerland, 2016; pp. 212–222. [Google Scholar] [CrossRef]
- Mikolov, T.; Sutskever, I.; Chen, K.; Corrado, G.S.; Dean, J. Distributed Representations of Words and Phrases and their Compositionality. In Advances in Neural Information Processing Systems 26; Burges, C.J.C., Bottou, L., Welling, M., Ghahramani, Z., Weinberger, K.Q., Eds.; Curran Associates, Inc.: Red Hook, NY, USA, 2013; pp. 3111–3119. [Google Scholar]
- Djuric, N.; Zhou, J.; Morris, R.; Grbovic, M.; Radosavljevic, V.; Bhamidipati, N. Hate Speech Detection with Comment Embeddings. In Proceedings of the 24th International Conference on World Wide Web, Florence, Italy, 18–22 May 2015; ACM: New York, NY, USA, 2015; pp. 29–30. [Google Scholar] [CrossRef]
- Sanguansat, P. Paragraph2Vec-based sentiment analysis on social media for business in Thailand. In Proceedings of the 2016 8th International Conference on Knowledge and Smart Technology (KST), Chiangmai, Thailand, 3–6 February 2016; pp. 175–178. [Google Scholar] [CrossRef]
- Campr, M.; Ježek, K. Comparing Semantic Models for Evaluating Automatic Document Summarization. In Proceedings of the Text, Speech, and Dialogue: 18th International Conference, TSD 2015, Pilsen, Czech Republic, 14–17 September 2015; Springer International Publishing: Cham, Switzerland, 2015; pp. 252–260. [Google Scholar] [CrossRef]
- Belinkov, Y.; Mohtarami, M.; Cyphers, S.; Glass, J. VectorSLU: A Continuous Word Vector Approach to Answer Selection in Community Question Answering Systems. In Proceedings of the 9th International Workshop on Semantic Evaluation (SemEval 2015), Denver, CO, USA, 4–5 June 2015; Association for Computational Linguistics: Denver, CO, USA, 2015; pp. 282–287. [Google Scholar]
- Jiang, S.; Lewris, J.; Voltmer, M.; Wang, H. Integrating rich document representations for text classification. In Proceedings of the 2016 IEEE Systems and Information Engineering Design Symposium (SIEDS), Charlottesville, VA, USA, 29 April 2016; pp. 303–308. [Google Scholar] [CrossRef]
- Ren, F.; Deng, J. Background Knowledge Based Multi-Stream Neural Network for Text Classification. Appl. Sci. 2018, 8, 2472. [Google Scholar] [CrossRef]
- Zheng, J.; Cai, F.; Shao, T.; Chen, H. Self-Interaction Attention Mechanism-Based Text Representation for Document Classification. Appl. Sci. 2018, 8, 613. [Google Scholar] [CrossRef]
- Cong, J.; Liu, H. Approaching human language with complex networks. Phys. Life Rev. 2014, 11, 598–618. [Google Scholar] [CrossRef]
- Martinčić-Ipšić, S.; Margan, D.; Meštrović, A. Multilayer network of language: A unified framework for structural analysis of linguistic subsystems. Phys. A Stat. Mech. Its Appl. 2016, 457, 117–128. [Google Scholar] [CrossRef]
- Antiqueira, L.; Oliveira, O.N., Jr.; da Fontoura Costa, L.; Nunes, M.D.G.V. A complex network approach to text summarization. Inf. Sci. 2009, 179, 584–599. [Google Scholar] [CrossRef]
- Beliga, S.; Meštrović, A.; Martinčić-Ipšić, S. An overview of graph-based keyword extraction methods and approaches. J. Inf. Organ. Sci. 2015, 39, 1–20. [Google Scholar]
- Beliga, S.; Meštrović, A.; Martinčić-Ipšić, S. Selectivity-Based Keyword Extraction Method. Int. J. Semant. Web Inf. Syst. 2016, 12, 1–26. [Google Scholar] [CrossRef]
- Grabska-Gradzińska, I.; Kulig, A.; Kwapień, J.; Drożdż, S. Complex network analysis of literary and scientific texts. Int. J. Mod. Phys. C 2012, 23, 1250051. [Google Scholar] [CrossRef]
- Martinčić-Ipšić, S.; Miličić, T.; Meštrović, A. Text Type Differentiation Based on the Structural Properties of Language Networks. In Proceedings of the Information and Software Technologies: 22nd International Conference, ICIST 2016, Druskininkai, Lithuania, 13–15 October 2016; Springer International Publishing: Cham, Switzerland, 2016; pp. 536–548. [Google Scholar] [CrossRef]
- Jiang, C.; Coenen, F.; Sanderson, R.; Zito, M. Text classification using graph mining-based feature extraction. Knowl.-Based Syst. 2010, 23, 302–308. [Google Scholar] [CrossRef]
- Rossi, R.G.; de Andrade Lopes, A.; Rezende, S.O. Optimization and label propagation in bipartite heterogeneous networks to improve transductive classification of texts. Inf. Process. Manag. 2016, 52, 217–257. [Google Scholar] [CrossRef]
- Ho, T.K. The random subspace method for constructing decision forests. IEEE Trans. Pattern Anal. Mach. Intell. 1998, 20, 832–844. [Google Scholar] [CrossRef]
- Bosch, A.; Zisserman, A.; Munoz, X. Image classification using random forests and ferns. In Proceedings of the IEEE 11th International Conference on Computer Vision, Rio de Janeiro, Brazil, 14–21 October 2007; pp. 1–8. [Google Scholar]
- Ellis, K.; Kerr, J.; Godbole, S.; Lanckriet, G.; Wing, D.; Marshall, S. A random forest classifier for the prediction of energy expenditure and type of physical activity from wrist and hip accelerometers. Physiol. Meas. 2014, 35, 2191. [Google Scholar] [CrossRef]
- Onan, A.; Korukoğlu, S.; Bulut, H. Ensemble of keyword extraction methods and classifiers in text classification. Expert Syst. Appl. 2016, 57, 232–247. [Google Scholar] [CrossRef]
- Goodfellow, I.; Bengio, Y.; Courville, A.; Bengio, Y. Deep Learning; MIT Press: Cambridge, UK, 2016; Volume 1. [Google Scholar]
- Hastie, T.; Tibshirani, R.; Friedman, J.H. The Elements of Statistical Learning: Data Mining, Inference, and Prediction, 2nd ed.; Springer: New York, NY, USA, 2009. [Google Scholar]
- Chawla, N.V. Data mining for imbalanced datasets: An overview. In Data Mining and Knowledge Discovery Handbook; Springer: Boston, MA, USA, 2009; pp. 875–886. [Google Scholar]
- Fawcett, T. An introduction to ROC analysis. Pattern Recognit. Lett. 2006, 27, 861–874. [Google Scholar] [CrossRef]
- Yang, Y. An Evaluation of Statistical Approaches to Text Categorization. Inf. Retr. 1999, 1, 69–90. [Google Scholar] [CrossRef]
- Uysal, A.K. An improved global feature selection scheme for text classification. Expert Syst. Appl. 2016, 43, 82–92. [Google Scholar] [CrossRef]
- Bird, S.; Klein, E.; Loper, E. Natural Language Processing with Python; O’Reilly Media, Inc.: Sebastopol, CA, USA, 2009. [Google Scholar]
- Buitinck, L.; Louppe, G.; Blondel, M.; Pedregosa, F.; Mueller, A.; Grisel, O.; Niculae, V.; Prettenhofer, P.; Gramfort, A.; Grobler, J.; et al. API design for machine learning software: Experiences from the scikit-learn project. In Proceedings of the ECML PKDD Workshop: Languages for Data Mining and Machine Learning, Prague, Czech Republic, 23–27 September 2013; pp. 108–122. [Google Scholar]
- Porter, M.F. An algorithm for suffix stripping. Program 1980, 14, 130–137. [Google Scholar] [CrossRef]
- Lee, J.; Yi, J.S. Predicting Project’s Uncertainty Risk in the Bidding Process by Integrating Unstructured Text Data and Structured Numerical Data Using Text Mining. Appl. Sci. 2017, 7, 1141. [Google Scholar] [CrossRef]
- Řehůřek, R.; Sojka, P. Software Framework for Topic Modelling with Large Corpora. In Proceedings of the LREC 2010 Workshop on New Challenges for NLP Frameworks; ELRA: Valletta, Malta, 2010; pp. 45–50. [Google Scholar]
- Schult, D.A.; Swart, P.J. Exploring network structure, dynamics, and function using NetworkX. In Proceedings of the 7th Python in Science Conferences (SciPy 2008), Pasadena, CA, USA, 19–24 August 2008; Volume 2008, pp. 11–16. [Google Scholar]
- Kuhn, M. Caret: Classification and Regression Training; R Package Version 5.15-044; Astrophysics Source Code Library: College Park, MD, USA, 2015. [Google Scholar]
- James, G.; Witten, D.; Hastie, T.; Tibshirani, R. An Introduction to Statistical Learning: With Applications in R; Springer Publishing Company, Inc.: New York, NY, USA, 2014. [Google Scholar]
- Liaw, A.; Wiener, M. Classification and Regression by randomForest. R News 2002, 2, 18–22. [Google Scholar]
- Demšar, J. Statistical Comparisons of Classifiers over Multiple Data Sets. J. Mach. Learn. Res. 2006, 7, 1–30. [Google Scholar]
- Kuzmanovski, V.; Todorovski, L.; Džeroski, S. Extensive evaluation of the generalized relevance network approach to inferring gene regulatory networks. GigaScience 2018, 7, giy118. [Google Scholar] [CrossRef] [PubMed]
- Cox, T.F.; Cox, M. Multidimensional Scaling, 2nd ed.; Chapman and Hall, CRC Press: Boca Raton, FL, USA, 2000. [Google Scholar]
- Latora, V.; Marchiori, M. Efficient behavior of small-world networks. Phys. Rev. Lett. 2001, 87, 198701. [Google Scholar] [CrossRef]
- Latora, V.; Marchiori, M. Economic small-world behavior in weighted networks. Eur. Phys. J. B Condensed Matter Complex Syst. 2003, 32, 249–263. [Google Scholar] [CrossRef]
- Menichetti, G.; Remondini, D.; Panzarasa, P.; Mondragón, R.J.; Bianconi, G. Weighted multiplex networks. PLoS ONE 2014, 9, e97857. [Google Scholar] [CrossRef]
- Brandes, U. A faster algorithm for betweenness centrality. J. Math. Sociol. 2001, 25, 163–177. [Google Scholar] [CrossRef]
- Page, L.; Brin, S.; Motwani, R.; Winograd, T. The PageRank citation ranking: Bringing order to the Web. In Proceedings of the Seventh International World Wide Web Conference, Brisbane, Australia, 14–17 April 1998; pp. 161–172. [Google Scholar]
Figure 1.
The four-dimensional space of the per-class area under the receiver-operating curve (AUROC) performance of the 16 variants of the document representation models measured for each of the four class labels of the Brown4 data set (projected into two dimensions). The two-dimensional projection of the four-dimensional space was obtained using multidimensional scaling (MDS).
Figure 2.
Average ranks of the four top-performing variants of the document representation models in each of the four groups with respect to the macro-averaged AUROC.
Figure 2.
Average ranks of the four top-performing variants of the document representation models in each of the four groups with respect to the macro-averaged AUROC.
Figure 3.
Radar-chart comparison of the multi-objective rankings by task (left) and their averages (right) for the four top-performing variants of the document representation models in each of the four groups with respect to AUROC.
Figure 3.
Radar-chart comparison of the multi-objective rankings by task (left) and their averages (right) for the four top-performing variants of the document representation models in each of the four groups with respect to AUROC.
Figure 4.
Radar-chart comparison of the rankings by task (left) and their averages (right) for the four top-performing variants of the document representation models in each of the four groups with respect to classification accuracy.
Figure 4.
Radar-chart comparison of the rankings by task (left) and their averages (right) for the four top-performing variants of the document representation models in each of the four groups with respect to classification accuracy.
Figure 5.
Radar-chart comparison of the multi-objective rankings by task (left) and their averages (right) for the four top-performing variants of the document representation models in each of the four groups with respect to F1-score.
Figure 5.
Radar-chart comparison of the multi-objective rankings by task (left) and their averages (right) for the four top-performing variants of the document representation models in each of the four groups with respect to F1-score.
Table 1.
Properties of the four document classification benchmarks measured on preprocessed documents, that is after the tokenization, removal of stop words and stemming. Document length (minimum, maximum, and average) is measured in number of word stems.
Table 1.
Properties of the four document classification benchmarks measured on preprocessed documents, that is after the tokenization, removal of stop words and stemming. Document length (minimum, maximum, and average) is measured in number of word stems.
| Property/Data Set | Brown | Reuters8 | WebKB | 20News |
|---|
| # of documents | 500 | 9460 | 8274 | 18,468 |
| # of different word stems | 32,174 | 37,074 | 103,847 | 173,296 |
| # of words (document length) | 541,073 | 851,635 | 1,894,406 | 3,114,002 |
| minimum document length | 188 | 6 | 1 | 10 |
| maximum document length | 957 | 484 | 9294 | 8407 |
| average document length | 593 | 58 | 119 | 111 |
| # of class labels | 2, 4, 10, 15 | 8 | 7 | 20 |
| labels type | Genre/Topic | Topic | Topic | Topic |
| labels hierarchy | Yes | No | No | No |
Table 2.
Feature-space dimensionality for the 16 variants of the three document representation models and the four benchmark data sets.
Table 2.
Feature-space dimensionality for the 16 variants of the three document representation models and the four benchmark data sets.
| Features/Data Set | Brown | Reuters8 | WebKB | 20News |
|---|
| bow-TF+PCA | 267 | 487 | 996 | 1960 |
| bow-TFIDF+PCA | 310 | 1184 | 2074 | 3565 |
| word2vec-25–100 | 25–100 | 25–100 | 25–100 | 25–100 |
| doc2vec-25–1000 | 25–1000 | 25–1000 | 25–1000 | 25–1000 |
| gow-avg | 19 | 19 | 19 | 19 |
| gow-qrt | 68 | 68 | 68 | 68 |
| gow-hist | 128 | 128 | 128 | 128 |
Table 3.
The number of train and test documents for each benchmark; note that, 20News and Reuters8 are already split into two sets of training and test documents, for the other two, we used stratified random sampling to split the corpora into training and test data sets.
Table 3.
The number of train and test documents for each benchmark; note that, 20News and Reuters8 are already split into two sets of training and test documents, for the other two, we used stratified random sampling to split the corpora into training and test data sets.
| | Number of Train Documents | Number of Test Documents | Total |
|---|
| Brown | 401 (80%) | 99 (20%) | 500 |
| Reuters8 | 6800 (72%) | 2660 (28%) | 9460 |
| WebKB | 6623 (80%) | 1651 (20%) | 8274 |
| 20News | 11,314 (60%) | 7532 (40%) | 18,846 |
Table 4.
Macro-averaged area under the receiver-operating curve (AUROC) of the 16 variants of the document representation models on the seven classification tasks. The top-performing models for each task are shown in bold.
Table 4.
Macro-averaged area under the receiver-operating curve (AUROC) of the 16 variants of the document representation models on the seven classification tasks. The top-performing models for each task are shown in bold.
| | Brown2 | Brown4 | Brown10 | Brown15 | Reuters8 | WebKB | 20News |
|---|
| bow-TF | 0.99 | 0.94 | 0.91 | 0.88 | 0.99 | 0.91 | 0.93 |
| bow-TFIDF | 0.99 | 0.92 | 0.89 | 0.90 | 0.99 | 0.91 | 0.97 |
| word2vec-25 | 0.99 | 0.87 | 0.82 | 0.79 | 0.98 | 0.91 | 0.94 |
| word2vec-50 | 0.99 | 0.89 | 0.83 | 0.81 | 0.98 | 0.92 | 0.95 |
| word2vec-75 | 0.99 | 0.88 | 0.82 | 0.80 | 0.99 | 0.92 | 0.95 |
| word2vec-100 | 0.99 | 0.89 | 0.82 | 0.82 | 0.99 | 0.92 | 0.95 |
| doc2vec-25 | 0.99 | 0.94 | 0.92 | 0.89 | 0.99 | 0.90 | 0.96 |
| doc2vec-50 | 1.00 | 0.95 | 0.92 | 0.91 | 0.98 | 0.88 | 0.96 |
| doc2vec-75 | 1.00 | 0.95 | 0.91 | 0.87 | 0.98 | 0.88 | 0.95 |
| doc2vec-100 | 0.99 | 0.93 | 0.91 | 0.88 | 0.96 | 0.85 | 0.95 |
| doc2vec-200 | 0.99 | 0.93 | 0.90 | 0.86 | 0.96 | 0.84 | 0.92 |
| doc2vec-500 | 0.98 | 0.91 | 0.84 | 0.84 | 0.96 | 0.82 | 0.91 |
| doc2vec-1000 | 0.99 | 0.90 | 0.85 | 0.83 | 0.97 | 0.84 | 0.92 |
| gow-avg | 0.98 | 0.90 | 0.76 | 0.80 | 0.78 | 0.70 | 0.61 |
| gow-qrt | 0.96 | 0.87 | 0.78 | 0.81 | 0.79 | 0.70 | 0.62 |
| gow-hist | 0.95 | 0.88 | 0.76 | 0.81 | 0.79 | 0.71 | 0.62 |
Table 5.
Multi-objective ranking of the 16 variants of the three document representation models by the document classification task with respect to AUROC. The last column reports the average rankings over the seven tasks. The top-ranked models in each column are shown in bold.
Table 5.
Multi-objective ranking of the 16 variants of the three document representation models by the document classification task with respect to AUROC. The last column reports the average rankings over the seven tasks. The top-ranked models in each column are shown in bold.
| | Brown2 | Brown4 | Brown10 | Brown15 | Reuters8 | WebKB | 20News | Avg. Rank |
|---|
| bow-TF | 8 | 5 | 3.5 | 9 | 4 | 5 | 11.5 | 6.57 |
| bow-TFIDF | 5 | 12 | 11.5 | 9 | 1 | 5 | 1 | 6.36 |
| word2vec-25 | 12 | 12 | 11.5 | 9 | 8 | 5 | 8 | 9.36 |
| word2vec-50 | 7 | 12 | 11.5 | 9 | 4 | 5 | 4 | 7.50 |
| word2vec-75 | 6 | 12 | 11.5 | 9 | 4 | 5 | 4 | 7.36 |
| word2vec-100 | 10.5 | 12 | 11.5 | 9 | 4 | 5 | 4 | 8.00 |
| doc2vec-25 | 4 | 5 | 3.5 | 9 | 4 | 5 | 4 | 4.93 |
| doc2vec-50 | 1 | 1.5 | 3.5 | 1 | 8 | 5 | 4 | 3.43 |
| doc2vec-75 | 2 | 1.5 | 3.5 | 9 | 4 | 5 | 8 | 4.71 |
| doc2vec-100 | 9 | 5 | 3.5 | 9 | 11.5 | 10.5 | 8 | 8.07 |
| doc2vec-200 | 4 | 5 | 3.5 | 9 | 11.5 | 12.5 | 11.5 | 8.14 |
| doc2vec-500 | 14 | 12 | 11.5 | 9 | 11.5 | 12.5 | 11.5 | 11.71 |
| doc2vec-1000 | 10.5 | 12 | 11.5 | 9 | 8 | 10.5 | 11.5 | 10.43 |
| gow-avg | 13 | 5 | 11.5 | 9 | 16 | 15 | 15 | 12.07 |
| gow-qrt | 15 | 12 | 11.5 | 9 | 14.5 | 15 | 15 | 13.14 |
| gow-hist | 16 | 12 | 11.5 | 9 | 14.5 | 15 | 15 | 13.29 |
Table 6.
Ranking of the 16 variants of the three document representation models by the document classification task with respect to classification accuracy. The last column reports the average rankings over the seven tasks. The top-ranked models in each column are shown in bold.
Table 6.
Ranking of the 16 variants of the three document representation models by the document classification task with respect to classification accuracy. The last column reports the average rankings over the seven tasks. The top-ranked models in each column are shown in bold.
| | Brown2 | Brown4 | Brown10 | Brown15 | Reuters8 | WebKB | 20News | Avg. Rank |
|---|
| bow-TF | 1 | 2 | 1 | 3 | 2 | 6 | 1 | 2.29 |
| bow-TFIDF | 5 | 6.5 | 5 | 6 | 1 | 5 | 6 | 4.93 |
| word2vec-25 | 8.5 | 10 | 11 | 9.5 | 6 | 4 | 13 | 8.86 |
| word2vec-50 | 2 | 8 | 8.5 | 7.5 | 5 | 2 | 10 | 6.14 |
| word2vec-75 | 5 | 15 | 10 | 12 | 3 | 1 | 9 | 7.86 |
| word2vec-100 | 5 | 10 | 12.5 | 9.5 | 4 | 3 | 8 | 7.43 |
| doc2vec-25 | 3 | 6.5 | 2.5 | 5 | 7 | 7 | 3 | 4.86 |
| doc2vec-50 | 11.5 | 3 | 2.5 | 3 | 8 | 8 | 2 | 5.43 |
| doc2vec-75 | 8.5 | 1 | 4 | 1 | 9 | 9 | 4 | 5.21 |
| doc2vec-100 | 13 | 4 | 6 | 3 | 10 | 10 | 5 | 7.29 |
| doc2vec-200 | 14.5 | 5 | 7 | 7.5 | 12 | 11 | 7 | 9.14 |
| doc2vec-500 | 16 | 10 | 8.5 | 13 | 13 | 15 | 12 | 12.50 |
| doc2vec-1000 | 14.5 | 16 | 14 | 14 | 11 | 16 | 11 | 13.79 |
| gow-avg | 8.5 | 12.5 | 12.5 | 11 | 16 | 14 | 16 | 12.93 |
| gow-qrt | 11.5 | 14 | 15 | 15.5 | 15 | 13 | 14 | 14.00 |
| gow-hist | 8.5 | 12.5 | 16 | 15.5 | 14 | 12 | 15 | 13.36 |
Table 7.
Multi-objective ranking of the 16 variants of the three document representation models by document classification task with respect to the F1-score. The last column reports the average rankings over the seven tasks. The top-ranked models in each column are shown in bold.
Table 7.
Multi-objective ranking of the 16 variants of the three document representation models by document classification task with respect to the F1-score. The last column reports the average rankings over the seven tasks. The top-ranked models in each column are shown in bold.
| | Brown2 | Brown4 | Brown10 | Brown15 | Reuters8 | WebKB | 20News | Avg. Rank |
|---|
| bow-TF | 1 | 2 | 2.5 | 4 | 4 | 4 | 9.5 | 3.86 |
| bow-TFIDF | 5 | 13.5 | 6.5 | 11.5 | 1 | 4 | 1 | 6.07 |
| word2vec-25 | 8.5 | 7 | 12.5 | 11.5 | 7.5 | 4 | 9.5 | 8.64 |
| word2vec-50 | 2 | 7 | 12.5 | 4 | 4 | 4 | 9.5 | 6.14 |
| word2vec-75 | 5 | 13.5 | 12.5 | 11.5 | 4 | 4 | 9.5 | 8.57 |
| word2vec-100 | 5 | 7 | 12.5 | 11.5 | 4 | 4 | 9.5 | 7.64 |
| doc2vec-25 | 3 | 7 | 2.5 | 4 | 4 | 4 | 3.5 | 4.00 |
| doc2vec-50 | 11.5 | 2 | 2.5 | 4 | 7.5 | 8 | 3.5 | 5.57 |
| doc2vec-75 | 8.5 | 2 | 2.5 | 1 | 9 | 9.5 | 3.5 | 5.14 |
| doc2vec-100 | 13 | 7 | 6.5 | 4 | 10 | 9.5 | 3.5 | 7.64 |
| doc2vec-200 | 14.5 | 7 | 6.5 | 11.5 | 14 | 12 | 9.5 | 10.71 |
| doc2vec-500 | 16 | 13.5 | 6.5 | 11.5 | 14 | 15 | 9.5 | 12.29 |
| doc2vec-1000 | 14.5 | 13.5 | 12.5 | 11.5 | 11 | 15 | 9.5 | 12.50 |
| gow-avg | 8.5 | 13.5 | 12.5 | 11.5 | 14 | 12 | 15 | 12.43 |
| gow-qrt | 11.5 | 13.5 | 12.5 | 11.5 | 14 | 15 | 15 | 13.29 |
| gow-hist | 8.5 | 7 | 12.5 | 11.5 | 14 | 12 | 15 | 11.50 |
© 2019 by the authors. Licensee MDPI, Basel, Switzerland. This article is an open access article distributed under the terms and conditions of the Creative Commons Attribution (CC BY) license (http://creativecommons.org/licenses/by/4.0/).


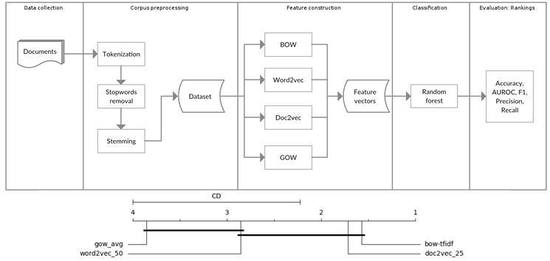

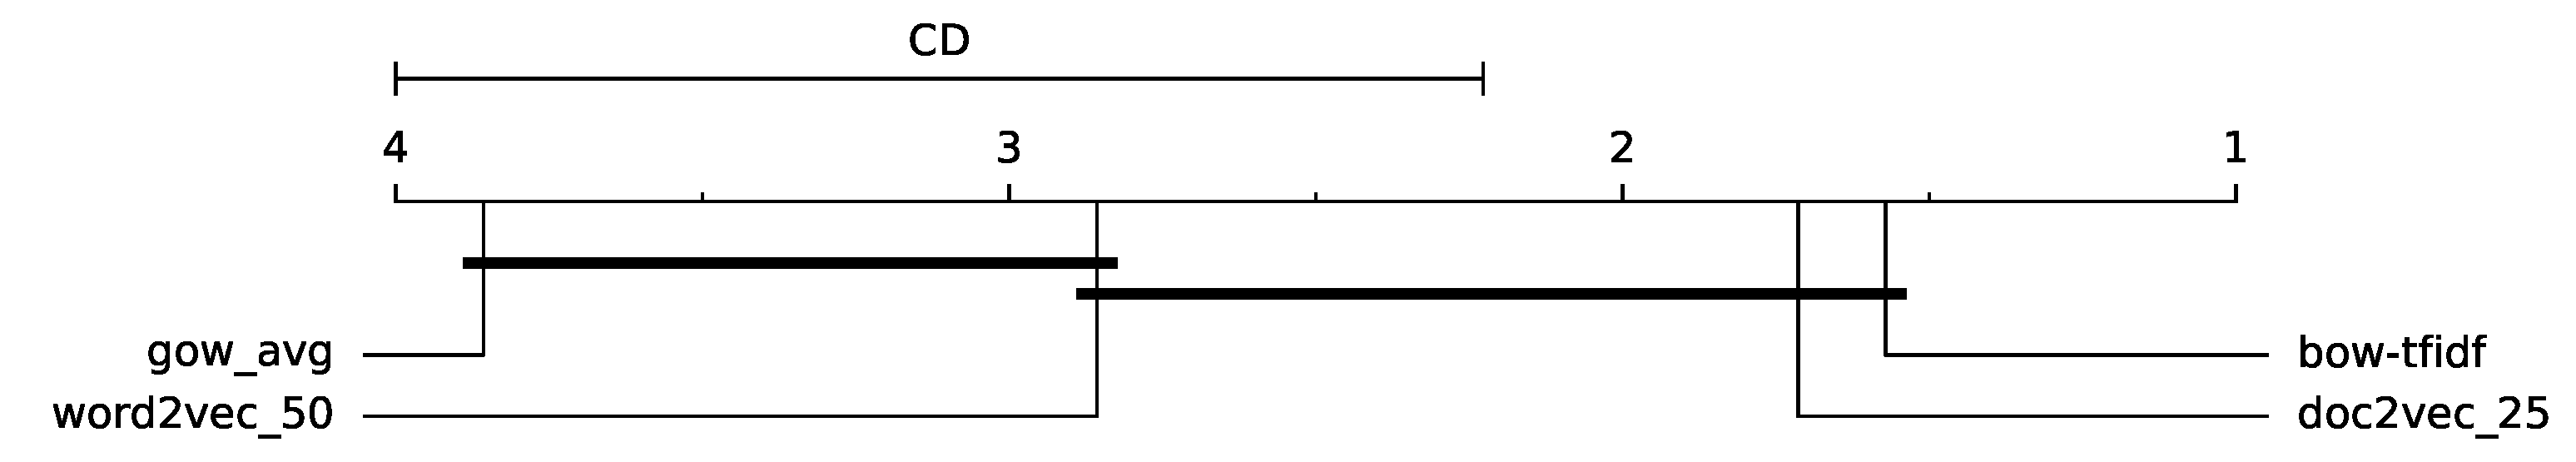
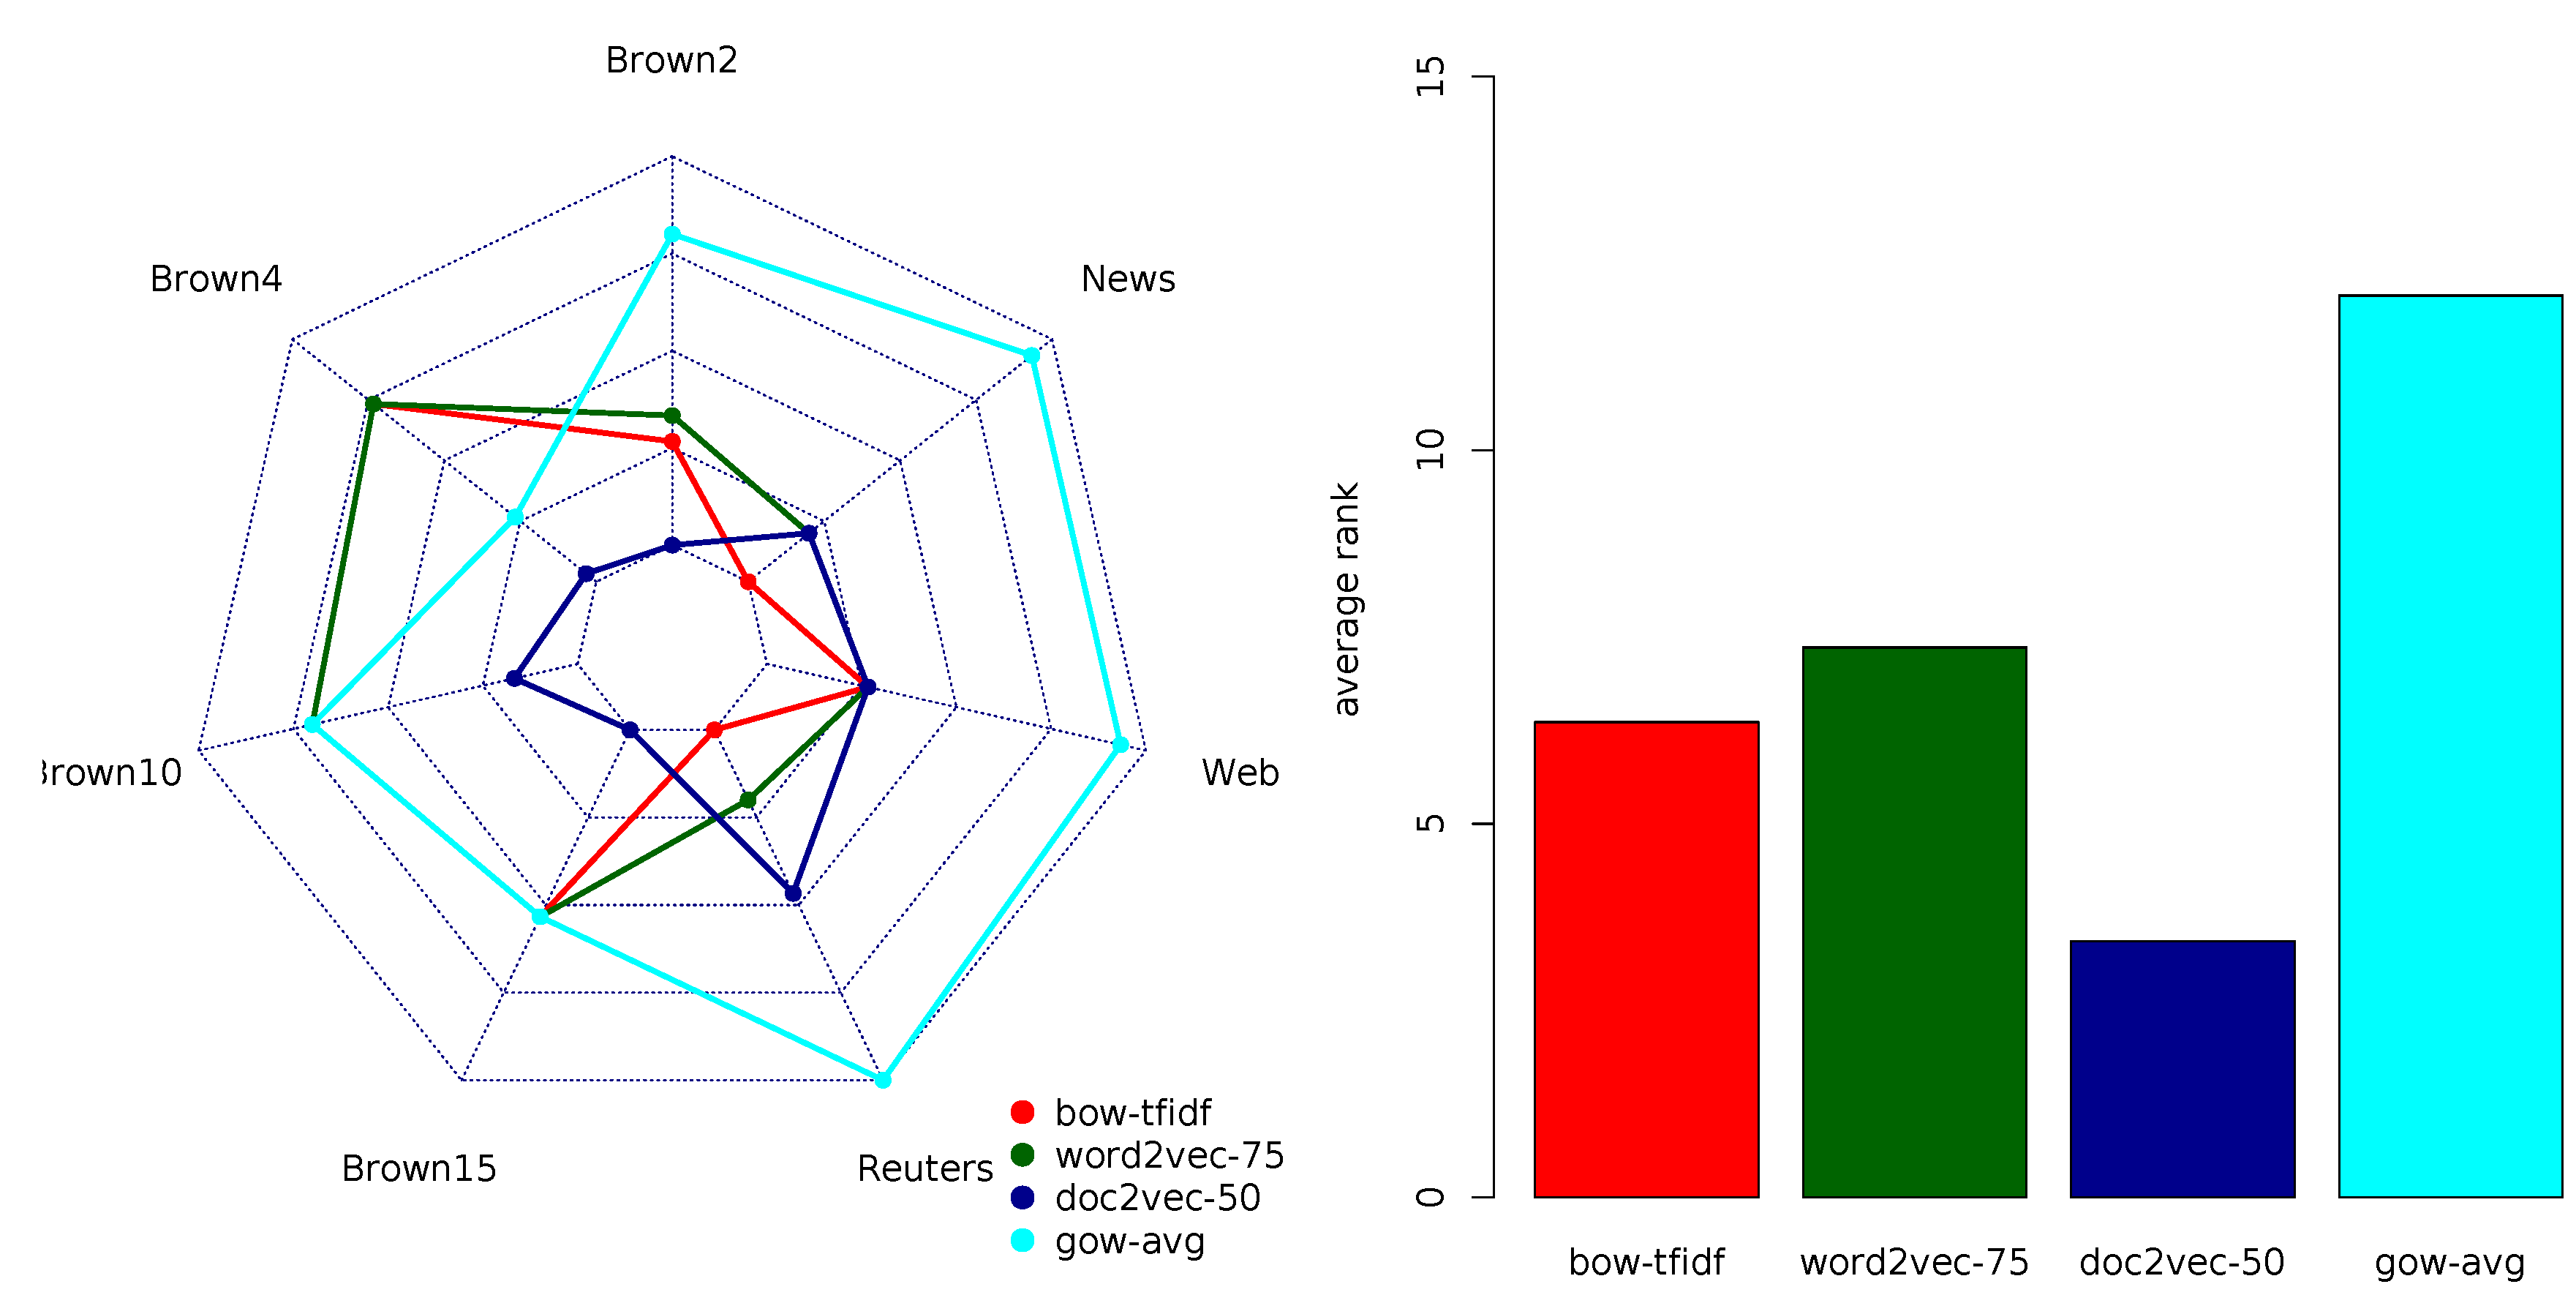
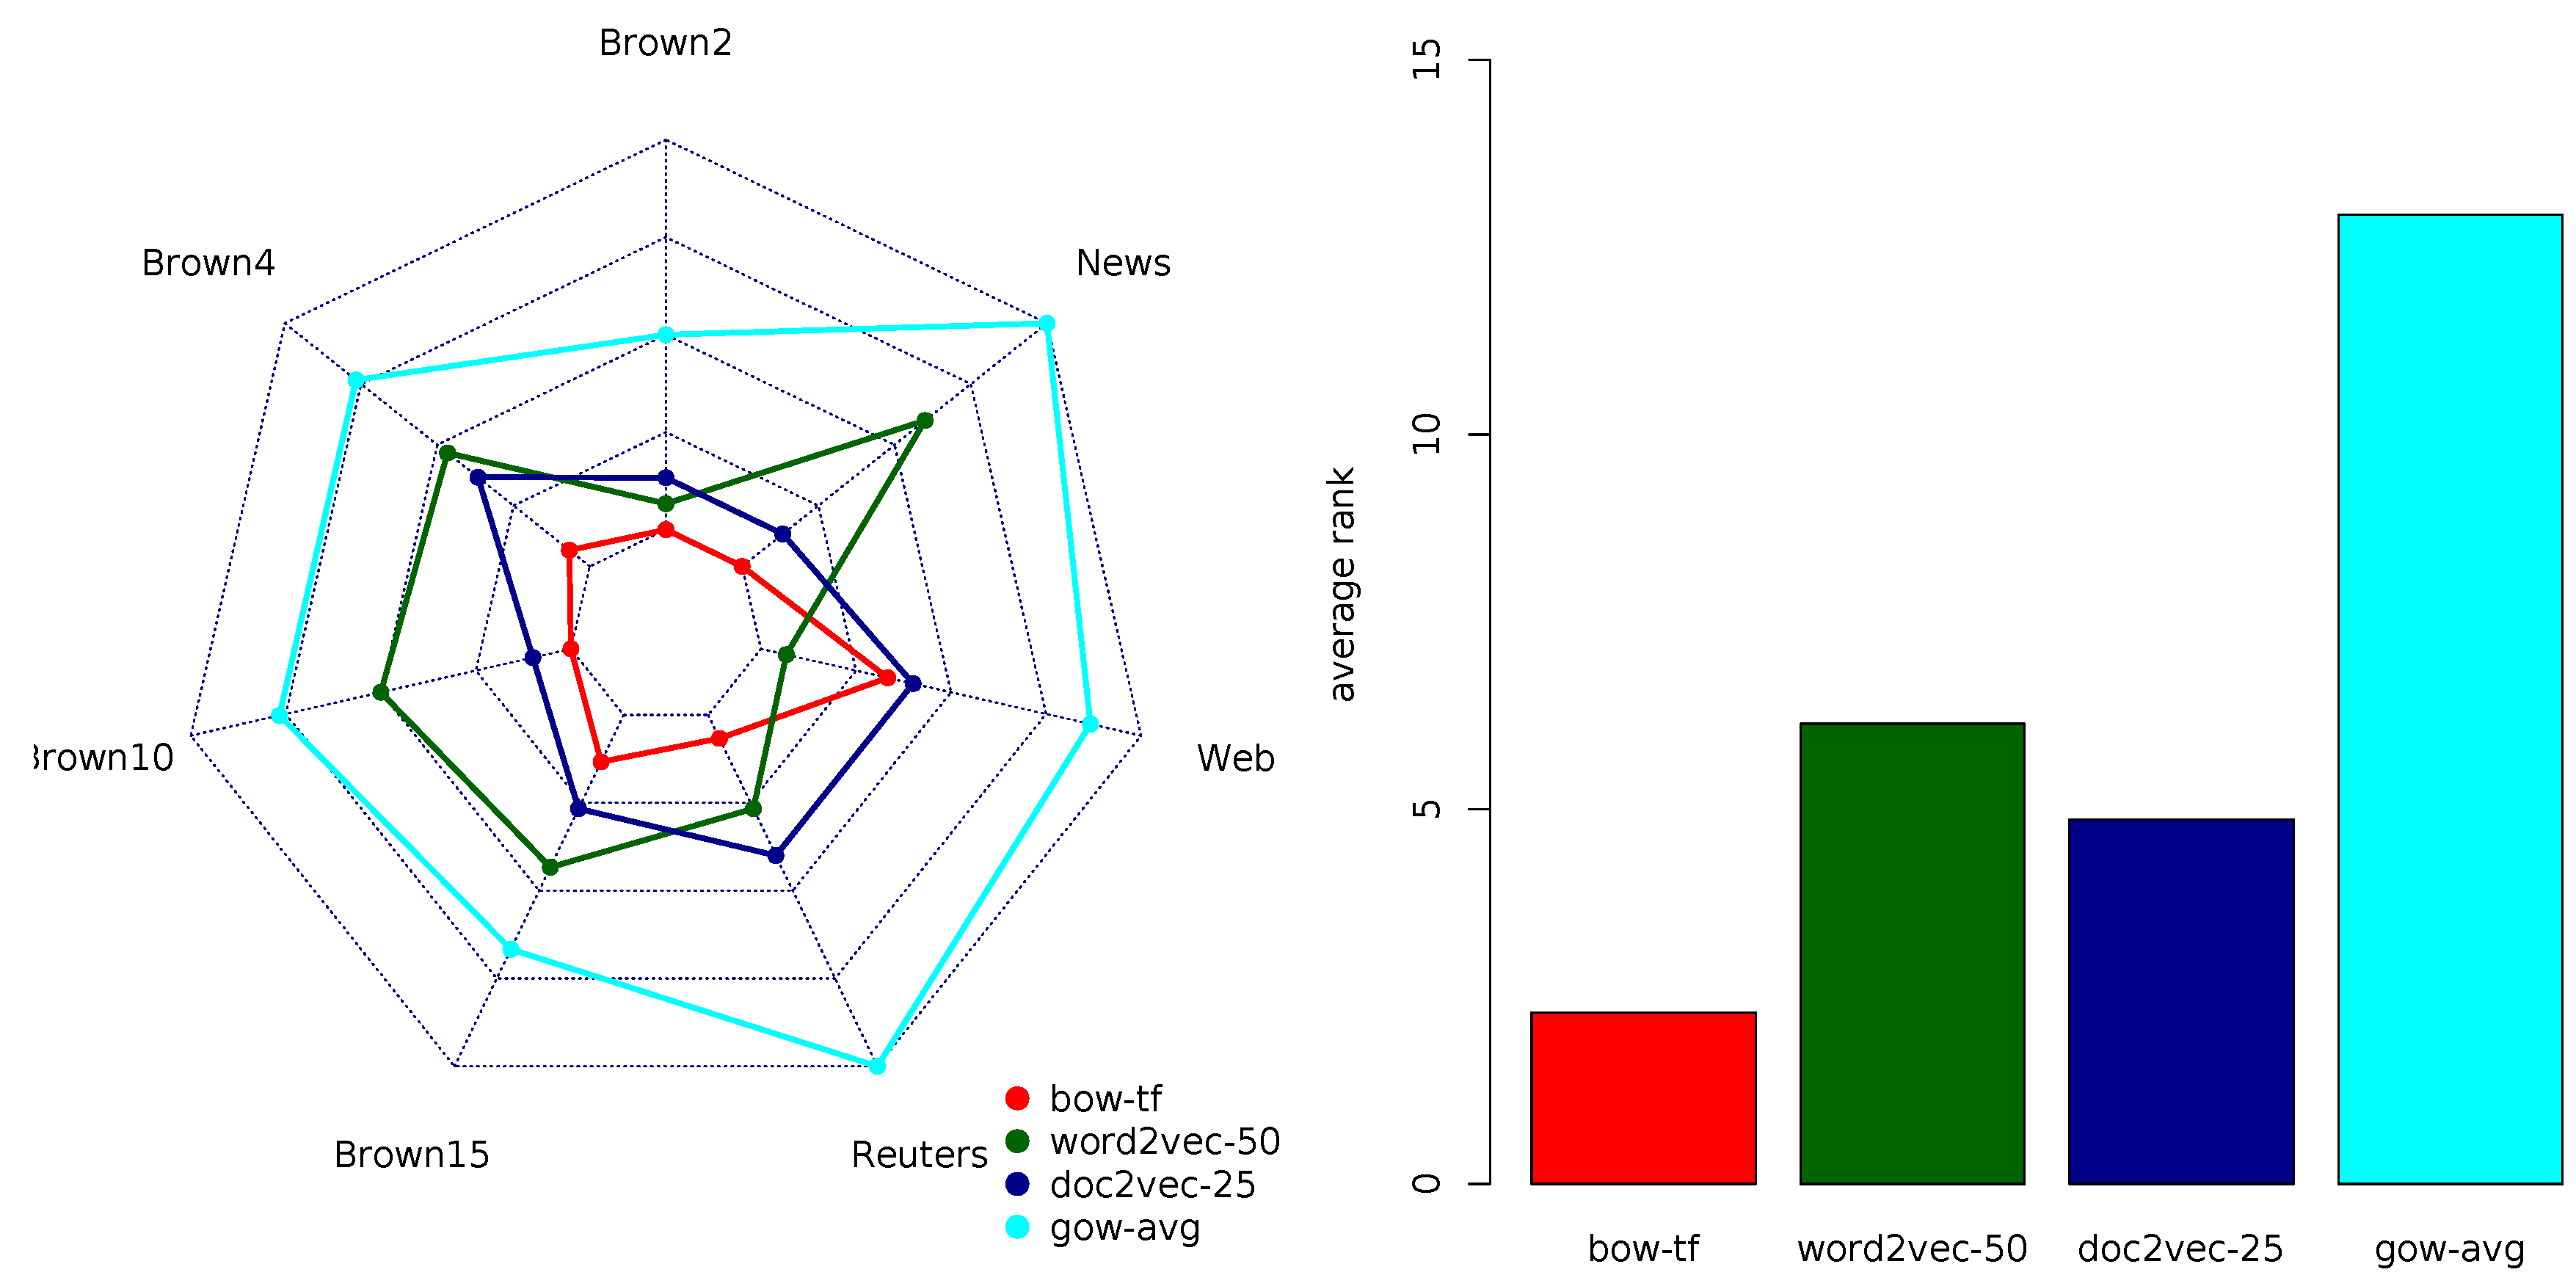
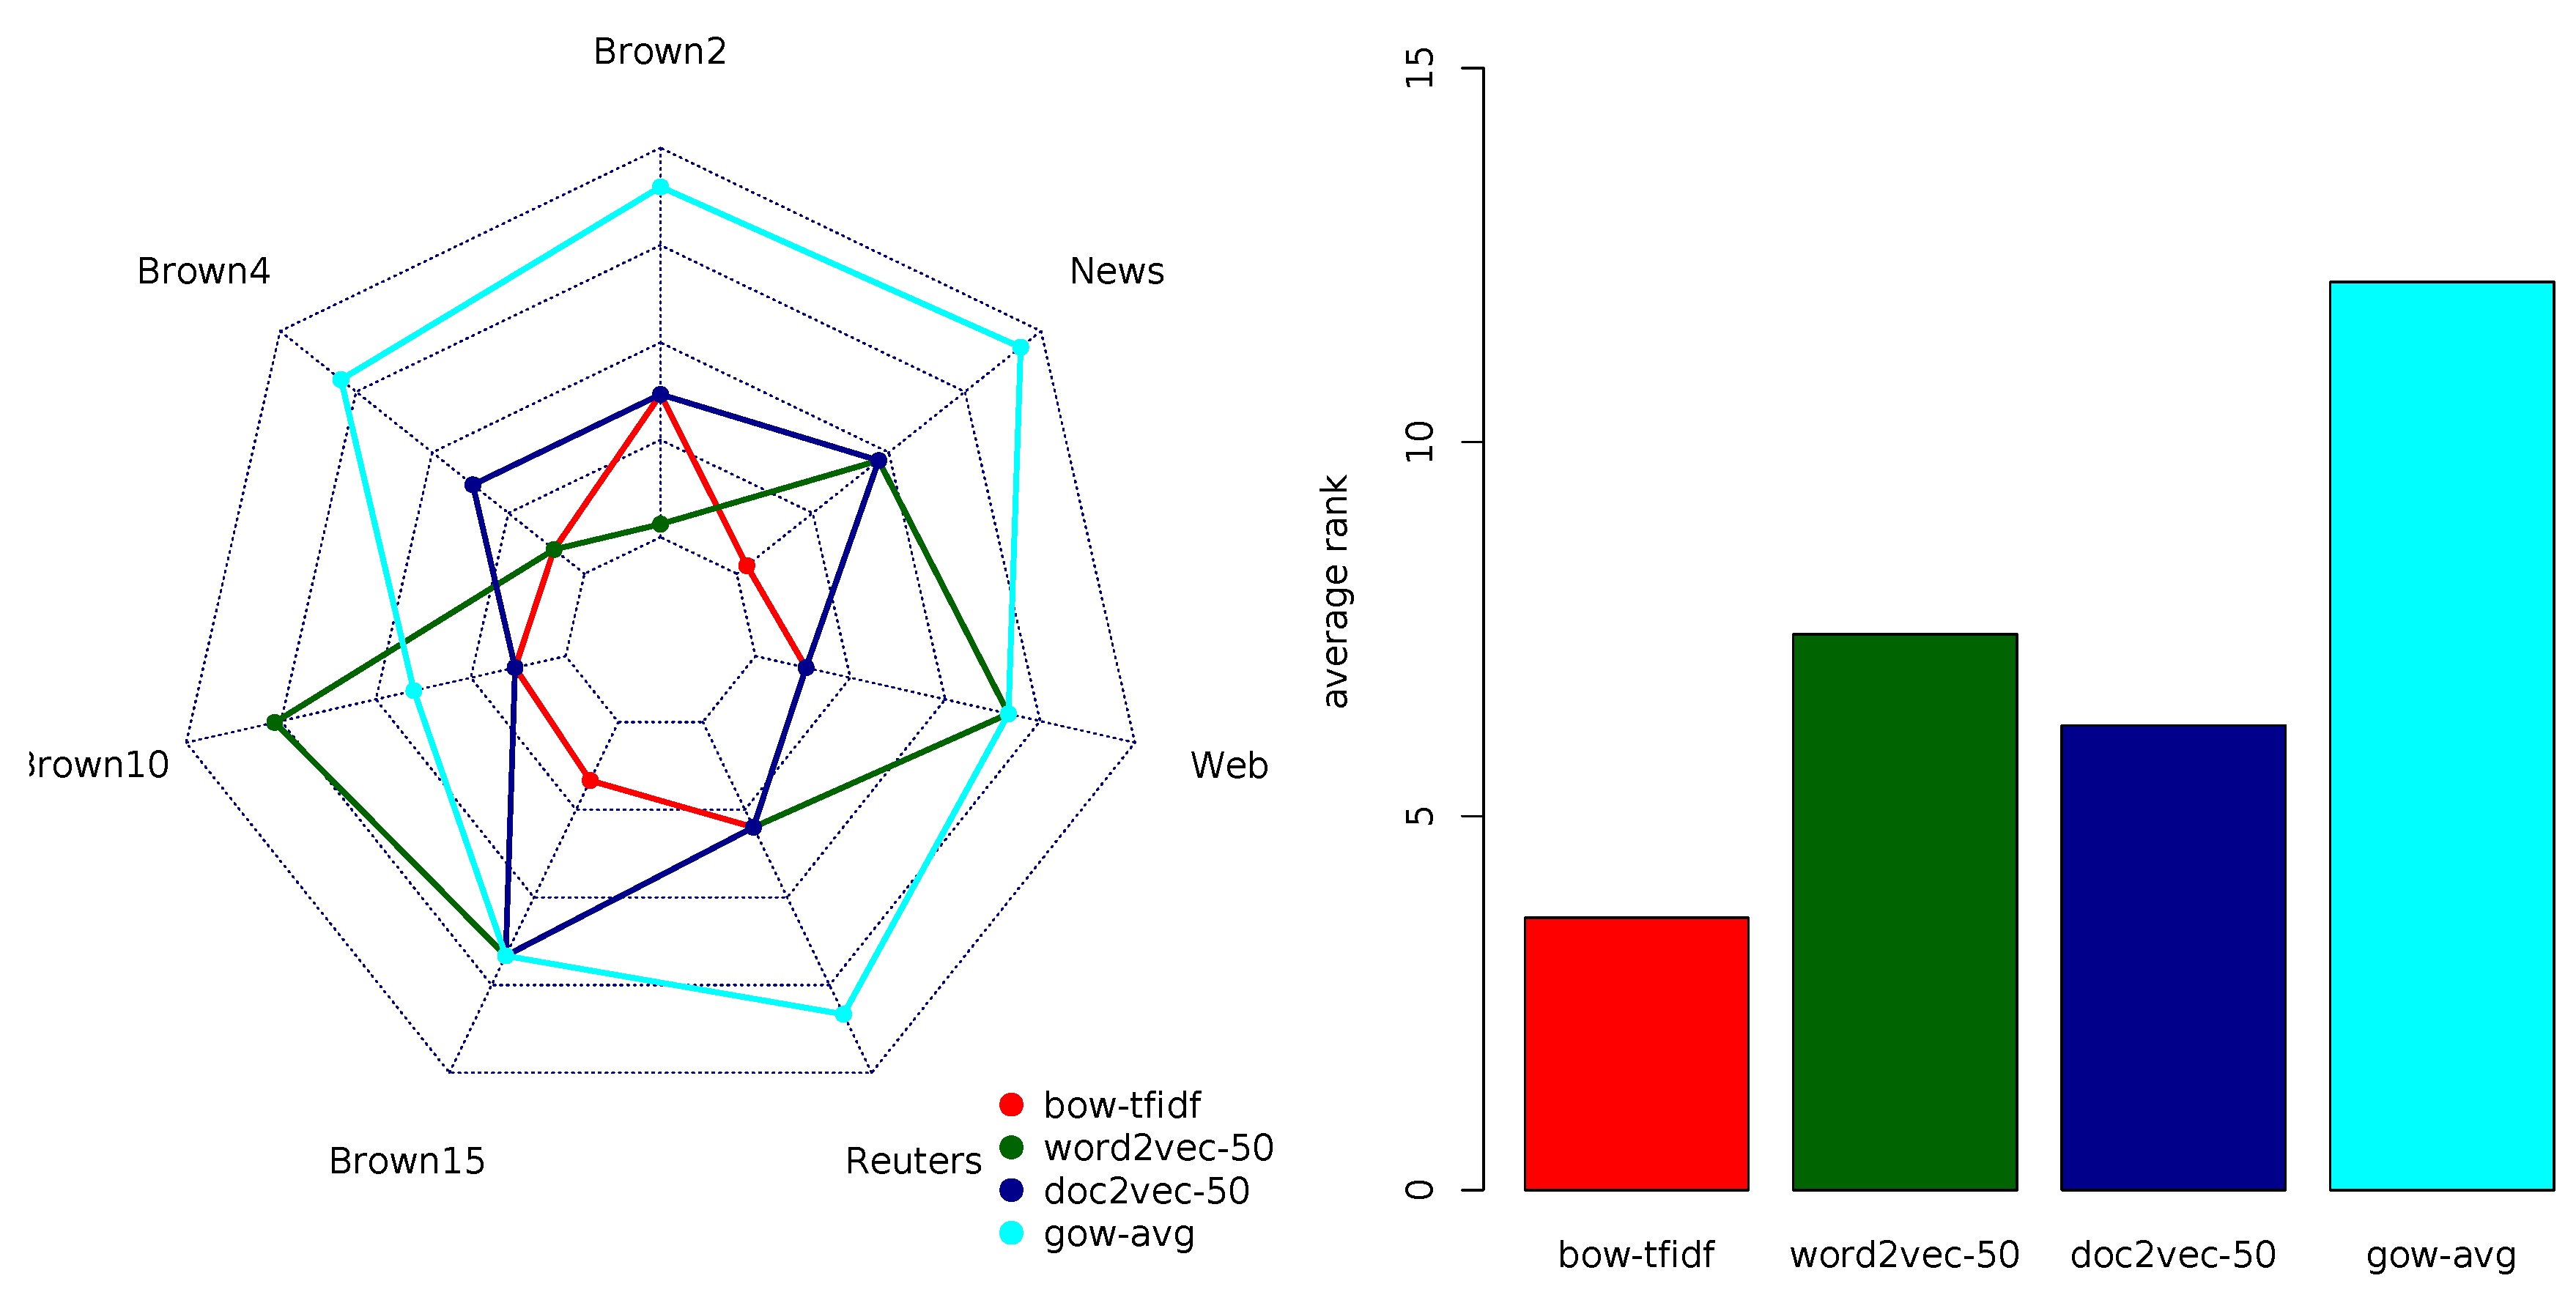