Article

Evaluation of the Structural Phase Transition in Multiferroic (Bi1−x Prx)(Fe0.95 Mn0.05)O3 Thin Films by A Multi-Technique Approach Including Picosecond Laser Ultrasonics

1
Laboratoire d’Acoustique de l’Université du Mans, LAUM - UMR 6613 CNRS, Le Mans Université, Avenue Olivier Messiaen, 72085 Le Mans CEDEX 9, France
2
Prokhorov General Physics Institute, Russian Academy of Sciences, 119991 Moscow, Russia
3
Department of Life and Physical Sciences, Fisk University, Nashville, TN 37208, USA
4
Institut des Molécules et Matériaux du Mans (IMMM), UMR 6283 CNRS, Le Mans Université, Avenue Olivier Messiaen, 72085 Le Mans CEDEX 9, France
5
College of Physics and National Demonstration Center for Experimental Applied Physics Education, Qingdao University, Qingdao 266071, China
6
National Laboratory of Solid State Microstructures and Department of Materials Science and Engineering, Nanjing University, Nanjing 210093, China
*
Author to whom correspondence should be addressed.
Appl. Sci. 2019, 9(4), 736; https://doi.org/10.3390/app9040736
Submission received: 22 December 2018 / Revised: 23 January 2019 / Accepted: 9 February 2019 / Published: 20 February 2019
(This article belongs to the Special Issue Laser Ultrasonics)

Abstract

:

Featured Application

Evaluation of the elastic and optical parameters of any sub-micrometer-thick transparent inhomogeneous films. In the case of doped multiferroic materials, the proposed multi-technique approach is envisioned to help in designing promising films for multifunctional applications in the frame of the future information and communication technologies.

Abstract

Picosecond laser ultrasonics is an experimental technique for the generation and detection of ultrashort acoustic pulses using ultrafast lasers. In transparent media, it is often referred to as time-domain Brillouin scattering (TDBS). It provides the opportunity to monitor the propagation of nanometers-length acoustic pulses and to determine acoustical, optical, and acousto-optical parameters of the materials. We report on the application of TDBS for evaluating the effect of Praseodymium (Pr) substitution on the elasticity of multiferroic (Bi1−xPrx)(Fe0.95Mn0.05)O3 (BPFMO) thin films. The films were deposited on Si and LaAlO3 (LAO) substrates by a sol-gel method. X-ray diffraction and Raman spectra revealed earlier that a phase transition from rhombohedral to tetragonal structure occurs at about 15% Pr substitution and is accompanied by the maxima of remnant magnetization and polarization. Combining TDBS with optical spectral reflectometry, scanning electron microscopy, and topographic measurements by atomic force microscopy, we found that the structural transition is also characterized by the maximum optical dielectric constant and the minimum longitudinal sound velocity. Our results, together with earlier ones, suggest that BiFeO3-based films and ceramics with compositions near phase boundaries might be promising materials for multifunctional applications.

1. Introduction

1.1. Structural Phase Transition in Films of Multiferroic Bismuth Ferrite

Multiferroic materials, where different ferroic orders coexist, are of paramount importance for the next generation of multifunctional devices for spintronics and memory technologies, since the material state in one of the ferroic orders could be controlled by the others. Bismuth ferrite BiFeO3 (symbolized as BFO) is the most paradigmatic member of the multiferroics family [1]. This lead-free piezoelectric is the most famous due to the coexistence of the ferroelectricity and magnetism at room temperature [1,2]. However, in recent years the high sensitivity of BFO state to strain and light is attracting increasing attention [2,3,4,5,6,7,8,9,10]. In particular, not only the unit cell parameters but BFO crystal structure can be controlled by strain in the epitaxial growth of thin BFO films on the substrates: the morphotropic rhombohedral–tetragonal phase transition can be induced [2,3,4]. Since piezoelectric, ferroelectric, optical, and elastic properties of materials are expected to exhibit anomalies near morphotropic phase boundaries, the control of the BFO by epitaxial strain could engineer thin films with enhanced interactions between different ferroic orders, which is highly sought for future information and communication technologies.
Besides the strain-controlled epitaxial growth technique, and among other possible methods, a possible way to approach the morphotropic boundary between the rhombohedral and the tetragonal phases of the material can be the modification of its composition via doping [4,11,12,13]. In particular, the effects of Praseodymium (Pr) substitution on the structure, magnetism, and electrical properties of mixed compounds (Bi1−xPrx)(Fe0.95Mn0.05)O3 (symbolized as BPFMO) thin films were systematically investigated [12,13]. X-ray diffraction and Raman spectra results confirmed that a phase transition from rhombohedral to tetragonal structure occurs at about 15% Pr substitution. These results demonstrate that doped BFO films with compositions near a phase boundary may be promising candidates for multifunctional applications due to the simultaneous possession of the maxima in ferromagnetic and ferroelectric properties. The other signatures of the phase transition in condensed matter could be elastic anomalies [14]. In nanometers-thick BFO films, the softening of elastic modulus at sub-MHz frequencies by over 30% in the vicinity of the electrically induced rhombohedral–tetragonal phase transition has been reported [15]. The elastic anomaly has been accompanied by two- to three-fold enhancement of local piezoresponse, suggesting potential applications of BiFeO3 in next-generation frequency-agile electroacoustic devices based on the utilization of the soft modes underlying successive ferroelectric phase transitions [15]. The combination of the experimental results [12,13,15] of high applicative significance motivates the studies of the elastic, piezoelectric, optical, and other, yet unmeasured, properties of BFO films across the structural phase transition induced by doping. The objective of our research reported in the following Section 2, Section 3 and Section 4 was to employ a picosecond laser ultrasonics technique, namely the time-domain Brillouin scattering (TDBS) technique, in combination with optical methods, atomic force microscopy, and scanning electron microscopy, to reveal the anomalies in the acoustical and optical parameters of the BPFMO films at GHz frequencies induced by approaching the morphological phase boundary via Pr substitution.

1.2. Applications of the Time-Domain Brillouin Scattering for Evaluation of Bismuth Ferrite Thin Films

TDBS is a picosecond acoustic experimental technique for the generation and detection of ultrashort acoustic pulses in transparent-to-the-probe-wavelength materials using ultrafast lasers, and was originally referred to as picosecond interferometry [16,17,18,19]. In this technique, a pump laser pulse generates a picosecond coherent acoustic pulse (CAP) of nanometers-length in the material, while a time-delayed probe laser pulse exhibits additional scattering by this photo-generated CAP. Detecting this additionally scattered light via heterodyning [16,17,18,19] provides information on the acoustical (sound velocity), optical (refractive index), and acousto-optical (photoelastic constant) parameters of the material in the current position of the CAP [18,20,21]. In materials that are transparent for probe light and are spatially homogeneous, the detected signal of the CAP-induced probe reflectivity variation has a sinusoidal form with respect to the increasing time-delay of the probe laser pulse relative to the pump laser pulse. This sinusoid is commonly called the Brillouin oscillation (BO), while its frequency is called the Brillouin frequency (BF). The period T of this sinusoid ( 1 T   =   f   =   2 n v S λ 0 cos ϕ ) contains information on both the velocity of the CAP propagation, ν S , and the index of refraction, n , at the probe wavelength λ0, and depends on the angle between the directions of the propagation of the CAP and the probe light, ϕ. If the experiments are conducted at a single angle ϕ, then to disentangle ν S and n , the independent measurements of n are required. These are commonly achieved by ellipsometry [22,23,24,25]. However, both ν S and n can be measured by the TDBS technique simultaneously if the experiments are conducted at two or several angles ϕ [26,27].
The TDBS technique has been previously applied for the evaluation of BFO bulk single crystals [28,29,30] and thin films [31,32,33,34]. In Ref. [31], the sound velocity in the 360 nm rhombohedral BFO film grown on SrTiO3 (STO) (110) single-crystal substrates by pulsed laser deposition was estimated as ν S 4760 4880 m/s. In Ref. [32], the coherent longitudinal acoustic phonons in La and Nb co-doped polycrystalline BFO (Bi0.8La0.2Fe0.99Nb0.01O3 (BLFNO)) films were monitored by TDBS. BLFNO thin films were deposited on p-type (001)-Si, on yttrium stabilized (001)-ZrO2 (YSZ), and on (001)-STO at 550 °C, then cooled down to room temperature following rapid thermal processing. The BLFNO film on (001)-STO was epitaxially grown with tetragonal structure, which was evidenced by X-ray diffraction. The film thickness was about 200 nm. It was revealed that the measured BF importantly depends on the substrate and, in particular, in the tetragonal BFO film on STO it was nearly 30% lower than in the films on Si and YSZ substrates. However, the refractive indices of the grown films were not measured. Thus, in the evaluation of sound velocities and the elastic modulus, the possible inequality in refractive indices of different films was not taken into account. In Ref. [33], thin films of rhombohedral-like BFO, tetragonal BFO, rare-earth-doped Bi0.7Dy0.3FeO3, and Bi0.6La0.1Dy0.3FeO3 were grown on (001)-oriented LaAlO3 (LAO) and MgO substrates by pulsed laser deposition. The elastic moduli of rhombohedral, tetragonal, and rare-earth-doped BFO were determined from the measured Brillouin frequencies in conjunction with variable-angle spectroscopic ellipsometry for the determination of the complex refractive index of thin films. Film thicknesses measured by ellipsometry were determined to be in the range from 290 to 450 nm. A surface roughness of less than 20 nm was revealed by the atomic force microscope (AFM). The refractive index of tetragonal film was up to 10% less than the rhombohedral, demonstrating the importance of its measurement for the reliable determination of sound velocities and elastic moduli. In particular, the sound velocities of rhombohedral and tetragonal BFO films on the LAO substrates can be estimated as ν S 3430 m/s and ν S 4050 m/s, respectively.
TDBS was applied for the first time for the characterization of the doping-induced structural transition from the rhombohedral to the orthorhombic phase of BFO in Ref. [34]. Bi1−xDyxFeO3 (BDFO) epitaxial films with x = 0 to 0.125 were grown on single crystal STO substrates by pulsed laser ablation of stoichiometric ceramic targets. The orientation of the STO substrates were 4° off the (001) plane along the <110> direction to ensure a ferroelectric single-domain state in the BDFO films. All films had a thickness of about 120 nm. The measured BFs at x = 0%, 5%, 10%, and 12.5% were approximately 53, 64, 60, and 49 GHz, respectively, clearly indicating the maximum for the Dy substitution of around 5–10%. This maximum correlates with the maxima of the piezoelectric coefficient and dielectric constant reported at these doping concentrations earlier [11] and is thus a direct indication of the phase transition revealed by TDBS. Unfortunately, measurements of the refractive indices were not performed and the anomalies of the sound velocity and of the refractive index across the phase transition were not disentangled [34].

1.3. Multi-Technique Approach for Evaluation of BFO Thin Films

Here we report, for the first time, the anomalies in acoustic and optic parameters across the rhombohedral–tetragonal phase transition in BPFMO films induced by the substitution of Bi by Pr in Bi(Fe0.95Mn0.05)O3. These anomalies are revealed through a multi-technique approach with TDBS measurements of the Brillouin frequency and independent measurements of the refractive index by combining optical methods, atomic force microscopy, and scanning electron microscopy. In the films deposited on (001)-oriented Si, we measured an increase in the optical refractive index (at 808 nm optical wavelength) and a reduction in the velocity of longitudinal phonons of more than ≈20% in the vicinity of the morphotropic phase transition at GHz frequencies. A similarly strong reduction in the sound speed was also revealed in the BPFMO films deposited on LAO substrate.

2. Thin Film Deposition and Characterization by X-ray Diffraction

The (Bi1−xPrx)(Fe0.95Mn0.05)O3 thin films with (x = 0.05, 0.10, 0.15, 0.20) and (x = 0.05, 0.10, 0.125, 0.15, 0.175, 0.20) were deposited onto Si (100) and LAO (100) single-crystalline substrates, respectively, using chemical solution deposition by spin coating, as was described in detail earlier [12,13] and in Appendix A. The nominal final thicknesses of BPFMO films were expected to be about 600 nm and 500 nm, respectively. The structures of BPFMO films were characterized by X-ray diffraction (XRD). Earlier, XRD was used to demonstrate the transition in the BPFMO films from rhombohedral to tetragonal structure (from R3c to P4mm) for Pr concentrations above 15% [13]. In Appendix B, we present the XRD data demonstrating the difference between the films deposited on Si and on LAO substrates. The films on both substrates are polycrystalline, however the films on the LAO substrate exhibit preferential orientation of the crystallites, i.e., texturing.

3. Time-Domain Brillouin Scattering Experiments and Characterization of Multiferroic (Bi1−xPrx)(Fe0.95Mn0.05)O3 Films on Si Substrates

3.1. TDBS Experiments at Two Angles of Probe Incidence and Depth Profiling

The TDBS experiments were conducted with a Ti:Sapphire laser providing ps laser pulses. A detailed description of the experimental setup is given in Ref. [35]. Here, as is common for experiments with BFO [28,29,30,31,32,33,34], the fundamental radiation at λ 0 =   808 nm wavelength was applied for probing the sample, while the frequency-doubled light at 404 nm wavelength was applied for the generation of CAPs via its interband absorption in BFO [28,29,30,35,36]. The experiments were conducted at different angles of probe incidence on the sample surface (ψ = 0° and ψ = 52°) with the goal of disentangling the acoustic and optical anomalies in BPFMO films via the TDBS measurements only. The powers of the pump and probe laser radiations were 1.1 mW and 0.6 mW, respectively. Both pump and probe lasers were focused onto the free surface of the BPFMO films using 50X objective lenses. By scanning the pump beam focus relatively to the probe beam focus and measuring the amplitude of the transient thermoreflectance signal as a function of the position, the spatial correlation function of the pump and probe beams was evaluated. Its width of ≈2.5 µm at full width at half maximum (FWHM) is a measure of the lateral spatial resolution which is achievable in the TDBS experiments reported here.
All the raw measurements of the transient probe reflectivity in the BPFMO films deposited on Si are presented in Figure 1: (a) for probe incidence at ψ = 0° and (b) for probe incidence at ψ = 52°. Each percentage denotes the Pr substitution concentration associated with the curves just above it, and each curve at a given substitution concentration corresponds to a different probed location on the sample. The measured signals are typical for TDBS experiments. At time t = 0 ns, the reflectivity changes abruptly due to the pump photon inter-band absorption in the BFO thin films, which causes photo-excitation of charge carriers and subsequent temperature rise near the film/air interface. Note that the penetration depth of the 404 nm pump optical radiation in BFO is about 35–40 nm [28,29,30,35,36]. These abrupt changes in the probe reflectivity are followed by a long-time relaxation due to motion and recombination of photo-excited carriers and also due to heat diffusion. On top of the relaxation, the reflectivity signals oscillate, which represents the BOs due to the probe photon–CAP interaction.
In Figure 2, we present the BOs revealed after the subtraction of the slowly varying contribution to reflectivity of non-acoustic origins: (a) for TDBS measurements at normal incidence (0°) and (b) for those at oblique incidence (52°) (set with ± 7° accuracy). Note that each percentage number denotes the Pr substitution concentration associated with the curve with the same ordinate and that the total duration of the BOs corresponds approximately to the time of the CAP arrival on the interface between the film and the substrate.
From the data presented in Figure 2, it is evident without any spectral analysis that the frequencies of the BOs, i.e., BFs, at 10% and 15% Pr substitutions are lower than at 5% and 20% substitutions for both probe angles of incidence. This is a signature of the structural phase transition.
For quantitative analysis of the change of the BFs as a function of the Pr substitution concentration and of the probe angle of incidence, it is proposed to perform a time–frequency analysis of the acoustic part of each signal. To do so, the synchronous detection technique is used to extract the BF as a function of the time delay between pump and probe pulses. The BF images presented in Figure 3 were obtained by this signal processing technique, which had previously been successful in TDBS imaging of polycrystalline aggregates at high pressure [35]. Signals are here processed with a Hann moving window of 62 ps duration at FWHM, limiting the depth resolution at the structural phase transition to about 140 nm. At each temporal position of the moving window, the BF is obtained by means of maximizing the modulus of a complex integral (the integral over the time window of the product between the complex exponential whose time-dependent phase corresponds to that of the measured signals and the complex exponential exp(−2jπfBt), where fB stands for the BF). The signal-to-noise ratio (SNR) within the window, as well as the normalized root-mean-square error (NRMSE), is also calculated at each time position of the moving window, to serve as goodness criteria.
In Figure 3, the time–frequency analysis of all signals is shown: (a) for TDBS measurements at normal incidence (0°) and (b) for those at oblique incidence (52°). The color scale is common and depicts the value of the BF. The goodness criteria were here chosen as: (i) SNR should be greater than 3 dB and (ii) NRMSE should be lower than 15%. The white regions in Figure 3 correspond to the regions where at least one of these criteria is not fulfilled. The signals measured at different lateral positions on a sample with given Pr substitution concentration are packed together (signals from each sample are separated by black horizontal lines). This representation allows the conclusion that all samples are relatively laterally homogeneous, as can also be seen in Figure 2, where all signals at a given Pr substitution concentration and probe angle of incidence are superimposed. From the BF images in Figure 3, it is additionally important to notice that the BF appears to vary as a function of time for a given lateral position. Indeed, TDBS is a known modality for depth-profiling and imaging [20,21,37,38,39,40]. The distribution of the BFs as a function of the time delay between the probe and pump pulses can be transformed in the depth distributions of the BF. The BF images in Figure 3 reveal variations of the BFs with depth up to 30%, which demonstrates the depth inhomogeneity of the films. This could be caused by inhomogeneity of the texturing of the films, which influences the detected frequencies via the orientation of the elastically anisotropic grains. Note that at normal incidence of the probe, the BF is directly proportional to the product of the acoustic velocity υ S and of the refractive index n . It also follows from the comparison of the two parts of Figure 3 that the quality of the signals detected with 52° probe incidence is generally worse than that at normal incidence of the probe, as could have been expected. In fact, we attempted but failed to accumulate additional reliable data at ψ = 60°.
The reliable extracted BFs are used to calculate the weighted average value of the BF in each sample for the two different probe angles of incidence, ψ = 0° and ψ = 52°. The weight of each BF in the average is the reliability weight RW, given by RW = 1−NMRSE, which is applied in order to allow for the most reliable BF values to contribute more than others to the average BF value. To evaluate the uncertainty of the reported BF values, the distributions of the reliably extracted BFs are plotted in Figure 4 for the two probe angles of incidence, ψ = 0° (blue points) and ψ = 52° (orange triangles), and for the different Pr substitution concentrations: (a) 5%, (b) 10%, (c) 15%, and (d) 20%. These distributions are fitted by Gaussian distributions with the positions of their maxima fixed at the average BF values (see Figure 4). The uncertainty is chosen for each Pr substitution concentration to be the FWHM of the Gaussian distribution, as depicted by the horizontal lines in Figure 4. Note that the Gaussian fit is not intended to be accurate, but rather here is merely used to quantify the uncertainty, which increases where the distribution deviates strongly from a Gaussian (due to in-depth inhomogeneity). The calculated average BF values are reported in Figure 5 as a function of the Pr substitution concentration for TDBS measurements at normal incidence (ψ = 0°) with filled blue points and for those at oblique incidence (ψ = 52°) with filled red triangles. The error bars in all cases are associated with the FWHM of the distributions shown in Figure 4. Despite this uncertainty, it can be clearly seen that the frequencies of the BOs at 10% and 15% Pr substitution are substantially lower than at 5% and 20% substitutions for both probe angles of incidence.
Unfortunately, the measurements conducted at ψ = 0° and ψ = 52° only appeared to be insufficient for the reliable disentanglement of n and ν S . The data summarized in Table 1 demonstrate that, although the BFs measured at normal and oblique incidence are distinct, their bare values are too close, leading to high uncertainty in the evaluation of the refractive index n TDBS and of the acoustic velocity ν TDBS . We note that optical anisotropy of the films is assumed to be negligible. Due to the expected absence of any strong texture in the orientations of BPFMO grains when the films were deposited on the Si substrate, the films can be characterized by one refractive index. The absence of strong texture is confirmed by the XRD measurements in the same films reported in Ref. [13] and in Appendix B.
Uncertainties in the refractive index and sound velocity are too high to consider the values, extracted via TDBS measurements only, to be reliable. Diminishing this uncertainty would require the deposition of highly homogeneous films of greater thickness, which is currently technically challenging/impossible. That is why, for the evaluation of the CAP velocities in our films, the independent measurement of the optical refractive index is necessary.

3.2. Characterization of Films by Optical Methods and Atomic Force Microscopy

In the range where absorption in the film can be neglected, typically above 700 nm for BFO [41,42,43,44], the modulation of reflectance is accurately defined. On each film deposited on Si, a fairly clear interference modulation is observed in spectral reflectance measurements, and the periodicity allows a reliable estimation of the optical thickness ( n H ) opt (refractive index, n , times the geometrical thickness, H ) to be obtained. However, very poor agreements are obtained between the experimental reflectance ratios (« intensities ») and the fitted ones in the framework of theoretical models. Additionally, the reflectograms of the BPFMO samples collected at different places of the sample were very different. Since the refractive index is related to the periodicity, there are no chances to measure them reliably. Only the optical thickness that depends on the pseudo-periodicity of the diagrams can be deduced. This situation could be attributed to the fact that a part of the light is scattered instead of being specularly reflected. Such a scattering is presumably due to the inhomogeneities of the film surfaces observed under optical microscope and bulk inhomogeneities revealed by the TDBS technique (Figure 3). The birefringent character of the polycrystalline films could be an additional reason for strong diffusive scattering. This prevented separate measurements of the refractive indices and the geometrical thicknesses of the films, requiring different approaches for the measurements of the refractive index. At the same time, the measurements of the optical thickness at 830 nm optical wavelength were highly precise and reliable (see the fifth column in Table 2).
In order to obtain the required values of the refractive indices from these measurements, the thickness of the films should be measured independently. We scratched the BPFMO films with an AFM tip down to the Si substrate by applying a controlled force [45]. Since it had previously been checked that the applied force was not sufficient to scratch the harder silicon substrate, the measurement of the resulting step height gives access to the BPFMO film thickness. Unfortunately, the film with 5% Pr substitution was too hard for scratching with this method. The results for the measured thicknesses H AFM are presented in the fourth column in Table 2. Combining this data with those presented in the fifth column in the same Table provides refractive indices presented in the sixth column in Table 2. Finally, using the obtained refractive indices and BFs measured at normal incidence (reported in the third column in Table 2), we reveal the values of the longitudinal acoustic velocities in these films, υ S   =   f 0 λ 0 / 2 n , presented in the last column of Table 2.

3.3. Optical and Acoustic Anomalies Accompanying Structural Transformation of BPFMO Films Deposited on Si

According to our measurements (Table 2), the refractive index exhibits strong maximum at x = 0.15 Pr substitution, which correlates well with the expected position of the structural transition. The maximum measured value of n is larger by 25% and 20% than the values for the measured neighbor Pr substitutions of x = 0.10 and 0.20, respectively (Figure 6). Correspondingly, the dielectric constant, under the assumption of the magnetic constant (permeability) independent of Pr substitution, is larger in the phase transition point by 57% and 44% than for the neighbor measured Pr substitutions x = 0.10 and x = 0.20, respectively. The sharpness of the revealed anomaly in the dielectric constant is comparable to those measured earlier in these films for remnant magnetization and polarization (see Figure 5(b) in Ref. [13]). Thus, our measurements provide for the first time information on the optical anomaly in BPFMO thin films deposited on Si substrate. Additionally, the measured large values of the optical refractive index in BPFMO films (Table 2) provide an additional complexity/challenge in disentangling the refractive index and the sound velocity by only using the TDBS technique. For example, the magnitude of the refractive index at the structural transition, i.e., for 15% Pr substitution, is very large: n   =   3.22. Thus the angle ϕ between the directions of the propagations of the CAP and of the probe light inside the material, which controls the BF, even for ψ = 52° angle of probe incidence, is rather small ( ϕ   =   a r c s i n [ ( sin ψ ) / n ] 14°).
The measured acoustic velocities in the films with different Pr substitution concentrations (Table 2) demonstrate the highly non-monotonic velocity variation in the vicinity of the rhombohedral–tetragonal structural phase transition expected around the Pr substitution concentration of x = 0.15. Although there are no published data for the direct comparison with our measurements, our observations in BPFMO films (Figure 6) follow the tendency revealed for BFO films in Ref. [33], i.e., substantial increase in the sound velocity in the transition from rhombohedral to tetragonal phase (see Introduction). More importantly and originally, the measurements in Table 2 reveal a very sharp minimum in the longitudinal sound velocity at the structural phase transition for x = 0.15. The minimum measured value of υ S is smaller by 17% and 41% than the values for the measured neighbor Pr substitution concentrations of x = 0.10 and x = 0.20, respectively (Figure 6). Correspondingly, the longitudinal elastic modulus, under the assumption of the film density independent of Pr substitution, could be softer in the phase transition point by 31% and 65% than for the neighbor measured Pr substitution concentrations of x = 0.10 and x = 0.20, respectively. If the variations of density caused by Pr substitution are estimated via the linear extrapolation between the density of BiFeO3 (8.01 × 10³ kg/m3 [46]) and PrFeO3 (6.52 × 10³ kg/m3 [46]), then the predicted longitudinal elastic modulus in the phase transition point (x = 0.15) is estimated to be softer than for the neighbor measured Pr substitution of x = 0.10 and x = 0.20 by the same 31% and 65%, respectively. Thus, the density variations caused by the ±5% changes in Pr substitution near the phase transitions have negligible influence on the estimates of the relative anomaly in the longitudinal elastic modulus.

4. Time-Domain Brillouin Scattering Experiments and Characterization of Multiferroic (Bi1−xPrx)(Fe0.95Mn0.05)O3 Films on LaAlO3 (LAO) Substrate

4.1. TDBS Experiments at Two Angles of Probe Incidence

The TDBS experiments were then conducted with the same experimental setup on the BPFMO thin films deposited on LAO substrate, at two angles of probe incidence on the sample surface (ψ = 0° and ψ = 52°), with the same goal of disentangling the acoustic and optical anomalies in the films via the TDBS measurements only. The obtained results at the two angles were again too close to allow the disentanglement. On top of that, due to the smaller thickness (500 nm) and the inhomogeneity of the BPFMO films, the uncertainties in the extracted refractive indices and sound velocities were too high to consider their values to be reliable. For the evaluation of the CAP velocities in our films, it was therefore decided to use the independent measurement of the optical refractive index (see Section 4.2) together with the Brillouin frequency extracted from the results collected at the normal incidence of the probe beam. The raw measurements of the transient probe reflectivity in the BPFMO films deposited on LAO at normal incidence are shown in Figure 7a. The results after the subtraction of the slowly varying contribution to reflectivity of non-acoustic origins are shown in Figure 7b.
Due to the difficulty in completely removing the non-acoustic contributions without losing the few BOs available on each signal, it was chosen in this part of the study not to use the synchronous detection technique for performing a time–frequency analysis of the signals. For the synchronous detection technique to give confident results, it is mandatory for the treated signal to be a pure sine function. In place of the synchronous detection technique, the segment of the experimental background-free reflectivity signal with the BOs was manually selected on each signal, its envelope removed using Hilbert transform and the resulting normalized oscillating signal fitted with a sine function assuming a constant frequency. For each Pr substitution concentration, the average value of the BFs obtained by the previously described processing of signals registered in different lateral positions was calculated and reported in the third column of Table 3. The uncertainty was chosen to be the maximal difference between the average value and the BFs used in its calculation. Since at 10% and 20% Pr substitution only one signal was treatable, the uncertainties were chosen in this case to be the confidence interval of the used estimator. The proposed uncertainty in the latter case is the only quantitative estimate we have access to, yet it may be undervalued due to the lateral inhomogeneity of the samples.

4.2. Characterization of Films by Optical Methods, Atomic Force Microscopy, and Scanning Electron Microscopy

Similar to the case of the BPFMO films deposited on Si substrate, we failed to reliably measure the optical refractive index of the films by purely optical measurements. The reason for this could be partially tentatively attributed to inhomogeneities of the film surfaces revealed by standard and Differential Interference Contrast (DIC) microscopy (Appendix C), optical profilometry (Appendix C), and AFM topography (Appendix D). Some of these inhomogeneities could be consequences of the domain structure of LAO substrate surface [47,48,49] (Appendix C). However, the samples observed by spectral reflectance unambiguously show pronounced fringes that ensure homogeneous average thicknesses over large areas, at least with centimeter size. In the optical range of probe light, the absorption can be neglected and the modulation of reflectance is accurately defined similar to the case of the films deposited on Si substrate. The corresponding optical thicknesses ( n H ) opt at 830 nm wavelength are given in the fifth column in Table 3.
On the other hand, the absolute reflectance and the contrast of fringes change a lot with the position of the analysis. This is attributed to the fact that, as shown by the optical microscopy results (Appendix C), the light is strongly scattered instead of being fully specularly reflected, as a consequence of the roughness over large scales and/or the fluctuation of refractive index associated with the random orientation of microcrystallites. This prevents the separate measurement of the geometrical thickness ( H ) and the refractive index ( n ). Then, for the determination of the refractive index, the geometrical thickness of the film should be measured independently.
Unfortunately, the films deposited on LAO substrate were too hard for scratching and it was impossible to apply the AFM scratch method for the thickness measurements. Because of this, we had to cleave the samples along the direction normal to the surface and the thickness of the films was measured by scanning electron microscope (SEM) side imaging (Appendix E). According to the measurement by SEM presented in the fourth column in Table 3, the thickness of the film is 500 ± 20 nm whatever the Pr substitution concentration. Then, with these data and with the earlier measured optical thickness, it is possible to deduce the refractive indices of the films; these are reported in the sixth column in Table 3. It appears that the average refractive indices, although with a similar magnitude as those published for pure BFO [41,42,43,44], are slightly weaker than the lowest reported one (extraordinary refractive index n e   =   2.66 at 830 nm [44]). Finally, using the obtained refractive indices and BFs measured at normal incidence (see the third column in Table 3), we revealed the values of the longitudinal acoustic velocities in these films: υ S   =   f 0 λ 0 / 2 n , presented in the last column of Table 3.

4.3. Optical and Acoustic Anomalies Accompanying Structural Transformation of BPFMO Films Deposited on LAO Substrate

According to our measurements (Table 3), the refractive index of BPFMO films deposited on LAO substrate exhibits a weak maximum at Pr substitution concentration of x = 0.125 correlated with the expected position of the structural transition. However, the maximum measured value of n is larger only by about 1.5% and 0.8% than the values for the measured neighbor Pr substitution concentrations of x = 0.10 and 0.15, respectively (Figure 8). Thus, our measurements do not provide any evidence of strong optical anomaly in BPFMO thin films deposited on LAO substrate.
The measured acoustic velocity in the BPFMO films with different concentrations of Pr substitution deposited on LAO substrate (Table 3) demonstrates highly non-monotonic variation in the vicinity of the rhombohedral–tetragonal structural phase transition at around 12.5% of Pr substitution (Figure 8), similar to the one revealed earlier in films deposited on Si substrate. Although there are no published data for the direct comparison with our measurement, our observations in BPFMO films (Figure 8) follow the tendency revealed for BFO films in Ref. [33], i.e., increase in the sound velocity in the transition from rhombohedral to tetragonal phase (see Introduction). More importantly, the measurements in Table 3 reveal a very sharp minimum in the longitudinal sound velocity at the structural phase transition for x = 0.125 Pr substitution concentration. The minimum measured value of υ S is smaller by 19%, 14%, and 21% than the values for the measured neighbor Pr substitution concentrations of x = 0.10, x = 0.15, and x = 0.20, respectively (Figure 8). Correspondingly, the longitudinal elastic modulus could be softer in the phase transition point by 34%, 26%, and 37% than for the neighbor measured Pr substitution concentrations of x = 0.10, x = 0.15, and x = 0.20, respectively.

5. Discussion

Figure 6 and Figure 8 report the first ever measurements by the TDBS technique in combination with optical reflectometry, AFM topography, and SEM of the variation in the longitudinal acoustic velocity and the longitudinal modulus across the rhombohedral–tetragonal structural transitions induced by the element substitution. It is worth mentioning here that, in Ref. [34], an attempt was reported to access this information in BDFO films even thinner than ours, by extracting from the TDBS signals the information on the transmission of the CAPs at the interface of the film with STO substrate. The transmission of CAPs across the interfaces are known to be accompanied by the detected BO amplitude changes [21], which are related to the conversion of the acoustic waves incident on the interface into reflected and transmitted waves of different amplitudes. So, via the acoustic reflection and transmission coefficients, the BO amplitudes contain information on the ratio of the acoustic impedances of the film and the substrate, potentially allowing the determination of the sound velocity in the films. Assuming that the amplitudes of the TDBS oscillations before and after the CAP incidence on the interface are proportional to the amplitudes of the incident and transmitted coherent phonons at BFs, the authors of Ref. [34] found that the acoustic transmission coefficient monotonically grows with increasing Dy substitution. They concluded on the monotonic variation of the BDFO elasticity across the structural phase transition. However, they did not take into account that the amplitude of the BOs is proportional not only to the amplitude of the coherent phonon but also to the photoelastic constant. The photoelastic constant for the BDFO films is unknown and, similar to other parameters, also depends on the doping concentration of the film. Thus, even the conclusion of monotonous growth across the structural phase transition of the acoustic transmission coefficient (see Figure 4 in Ref. [34]) could be hardly considered as a reliable one, as it was obtained without disentanglement of the dependencies of the BO amplitudes on the amplitudes of the CAPs and on the magnitudes of the photoelastic constants. The consequent conclusion derived in Ref. [34] on the softening of the BDFO in the structural transition from rhombohedral to tetragonal is twice doubtful in view of the opposite tendency revealed by us and the results reported in Ref. [33]. It is worth mentioning here that the general tendency of the rigidity growth with increasing Pr substitution, i.e., aside from the abovementioned anomaly, correlates with the observation that the sound velocities measured by us in BPFMO films on LAO substrate (column 7 in Table 3) are larger than in pure BFO films deposited on the same substrate [33].
An additional argument in favor of the reliability of the results reported by us in Section 3.3 and Section 4.3 is the fact that the sharpness of the revealed anomaly in the elastic modulus is comparable to those measured earlier in these films for remnant magnetization and polarization (see Figure 5(b) in Ref. [13]). Moreover, the softening of the elastic modulus by more than ≈30% in the vicinity of the structural phase transition at ≈20 GHz frequency (see Table 1) initiated in our samples by Pr substitution is comparable in magnitude to one reported earlier at MHz frequencies near electrically induced rhombohedral–tetragonal phase transition [15]. Acoustic anomalies that are comparable in magnitude were also reported in heating-induced structural phase transitions [14].
If we compare the experimental results for BPFMO films with Pr substitutions of 10%, 15%, and 20% available both for Si and LAO substrates, they demonstrate higher acoustic velocities and expected higher rigidities for the films deposited on LAO substrate. This observation is in qualitative intuitive agreement with the fact that it was possible to scratch by the AFM tip apex the films deposited on Si but not on LAO. The measured higher sound velocities in the BPFMO films deposited on LAO substrates correlate with our initial expectations since the small lattice mismatch between BFO and LAO should potentially lead to the deposition of more compact films with preferential orientations of grains, i.e., substantially textured. The latter has been confirmed by XRD measurements (Appendix B). However, our expectations, that texturing of the BPFMO films deposited on LAO substrate could lead to the reliable determination via optical reflectivity measurements of the refractive index separately from the geometrical film thickness, have not been met. The quality of the film surfaces and, tentatively, imperfect texturing in the bulk of these films, could cause non-specular light scattering, impeding the measurements of the refractive index by this technique (Appendix C). Additionally, some of our TDBS experiments which have not been reported above are also in favor of the imperfect texturing. We conducted experiments with a fixed linear polarization of probe light (both at 0° and 52° angles of incidence) and detected separately similarly polarized and depolarized scattered light when the sample was rotated by discrete angles relative to its surface normal, i.e., relative to the [100] direction of LAO. We were not able to find any reliable signatures of the TDBS signal dependence on the sample rotation/orientation. Our failure to detect by TDBS any optical or acousto-optical anisotropy that could have been caused by film texturing indicates that texturing could be imperfect or weak, in correlation with the hypotheses put forward by our purely optical measurements.

6. Conclusions and Perspectives

The first measurements of the variation in the longitudinal acoustic velocity and the optical refractive index in thin films deposited on different substrates across the rhombohedral to tetragonal structural phase transition induced by element substitution are reported thanks to a multi-technique approach. They reveal a strong elastic anomaly, i.e., pronounced minimum of longitudinal sound velocity, in the vicinity of the structural transition. The strength of the related optical anomaly, i.e., of the maximum in the refractive index, was found to be significantly dependent on the particular substrate influencing the parameters of the thin films. Our results (together with earlier ones [12,13] demonstrating that BPFMO films at the structure transition composition show the strongest ferromagnetism and superior ferroelectric properties) indicate that BFO-based films with compositions near phase boundaries might exhibit maxima in piezoelectric and piezomagnetic properties and are promising materials for multifunctional applications. The challenging perspective for the TDBS technique in combination with the other techniques would be their application for the diagnostics of the variations of the acousto-optical interaction efficiency (controlled by the photoelastic parameter) across the structural transitions in thin films. Research in this direction could potentially reveal films with superior efficiency in the acousto-optical modulation of light for the future information and communication technologies.

Author Contributions

Conceptualization, V.G., D.W., S.R., and P.R.; methodology, V.G. and S.R.; software, S.R.; validation, N.C., E.d.L.S., A.B., and N.D.; formal analysis, S.R., N.C., E.d.L.S., A.B., N.D., A.R., Z.W., and Q.J.; investigation, A.L., S.A., N.C., E.d.L.S., A.B., N.D., Z.W., Q.J., M.K., A.R., and G.V.; resources, D.W. and Z.W.; writing—original draft preparation, V.G., S.R., A.B., N.D., and Z.W.; writing—review and editing, V.G., S.R., A.B., N.D., Z.W., D.W., and P.R.; visualization, S.R., N.C., A.B., N.D., Z.W., and A.R.; supervision, D.W., V.G., and P.R.; project administration, V.G. and D.W.; funding acquisition, P.R., V.G., and D.W.

Funding

This research was funded by LE MANS ACOUSTIQUE, in the frame of the project “Optically controlled ferroelectric transducers”.

Conflicts of Interest

The authors declare no conflict of interest. The funders had no role in the design of the study; in the collection, analyses, or interpretation of data; in the writing of the manuscript; or in the decision to publish the results.

Appendix A. Procedure of the (Bi1−xPrx)(Fe0.95Mn0.05)O3 (BPFMO) Film Deposition

The (Bi1−xPrx)(Fe0.95Mn0.05)O3 thin films were deposited on Si and single-crystalline LaAlO3 (100) substrates using chemical solution deposition. The precursor solutions were prepared by dissolving Bi(NO3)3·5H2O (99.99%), Fe(NO3)3·9H2O (99.9%), Mn(CH3COO)2·2H2O (99.99%), and Pr(NO3)3·6H2O (99.99%) in acetic acid (99.8%) and ethylene glycol (99%). Citric acid (99.5%), twice the amount of the total metallic ions in solutions, was added as a chelating agent. The final concentrations were adjusted to 0.2 mol/l. Films with various Pr concentrations were obtained by varying the amounts of Pr(NO3)3·6H2O in the solutions. The BPFMO films were deposited onto substrates by spin coating at 4000 rpm for 30 s. The wet films were baked at 300 °C, pyrolyzed at 400 °C for 10 min in flowing O2, and then annealed at 525 °C for 3 min in flowing N2. These steps were repeated for 12 times to reach the designed film thickness. The final annealing was performed at 525 °C for 30 min in N2 to achieve better crystallinity.

Appendix B. Characterization by X-ray Diffraction of BPFMO Films Deposited on Si and LaAlO3 (LAO) Substrates

The structure of BPFMO films was characterized by X-ray diffraction (XRD) using a with Cu Kα radiation (Rigaku SmartLab, Rigaku Corporation, Japan). The diffraction data were collected with a 2θ step size of 0.01° and a ramp rate of 1°/min. The BPFMO films are polycrystalline and all the diffraction peaks can be indexed using a rhombohedral structure. Earlier, the XRD demonstrated the transition in the BPFMO films from a rhombohedral to tetragonal structure (from R3c to P4mm) for Pr concentrations above 15% [10]. Here we present in Figure A1a and Figure A1b the XRD data demonstrating the difference between the films deposited on Si and on LAO substrates, respectively. The BPFMO thin films on LAO substrate exhibit a preferential (012) orientation.
Figure A1. (a) X-ray diffraction (XRD) patterns of (Bi1−xPrx)(Fe0.95Mn0.05)O3 (BPFMO) thin films deposited on Si substrates, in which the Bragg diffractions of BPFMO are indexed using a rhombohedral structure. There is no secondary phase observed in the BPFMO thin films with Pr substitution concentrations from x = 0.05 to x = 0.20. (b) XRD patterns of (Bi1−xPrx)(Fe0.95Mn0.05)O3 thin films deposited on LaAlO3 (100) single-crystalline substrates. The BPFMO thin films exhibit a preferential (012) orientation.
Applsci 09 00736 g0a1
The films on both substrates are polycrystalline, however the film on LAO substrate exhibits preferential orientation of the crystallites, i.e., texturing. There are additional diffraction peaks, as indicated by “*” in Figure A1b, at 2θ = 26° observed in the compositions of x = 5% and 15%. However, these peaks do not appear in the films deposited on Si. In Bismuth Ferrite films, the secondary phase peaks from bismuth oxides are always observed at about 28°. Additionally, we have also observed similar peaks at 2θ = 26° in other oxide films epitaxially grown on LAO substrates. Thus, these strange peaks are perhaps from the substrate, rather than from the thin films. The differences in the orientations of the films on Si and LAO substrates can be much more easily appreciated from the XRD patterns presented, not in semi-log, as in Figure A1a,b, but in linear scale for the intensity (see Figure A2a,b). The BPFMO films on Si substrate exhibit weakly preferred Bragg diffraction in the (110) direction, while the BPFMO films on LAO substrate exhibit strongly preferred Bragg diffraction in the (100) direction.
Figure A2. (a) XRD pattern of (Bi0.95Pr0.05)(Fe0.95Mn0.05)O3/Si sample indexed by a R3m (pseudocubic) structure. The BPFMO film exhibits weakly preferred Bragg diffraction in the (110) direction. (b) XRD pattern of (Bi0.95Pr0.05)(Fe0.95Mn0.05)O3/LaAlO3 sample. The BPFMO film exhibits strongly preferred Bragg diffraction in the (100) direction.
Applsci 09 00736 g0a2

Appendix C. Characterization by Optical Methods of BMFPO Films Deposited on LAO Substrate

Appendix C.1. Optical Characteristics of Surfaces

Figure A3. BPFMO film surfaces as observed by optical microscopy with X50 (left) and X100 (middle and right) objectives, both in dark field (left and middle) and in bright field (right), with evidence of inhomogeneities at micrometric scale, for the different Pr substitution concentrations in line: (a,b) 5%, (ce) 10%, (fh) 12.5%, (ik) 15%, (ln) 17.5%, and (oq) 20%.
Applsci 09 00736 g0a3
Optical characteristics of the BPFMO films deposited on LAO substrates were deduced from standard and Differential Interference Contrast (DIC) microscopy (BX41 microscope, Olympus, Tokyo, Japan), and by spectral reflectivity on a Filmetrics instrument (F20, San Diego, CA, USA).
The surfaces of the samples observed under bright field and dark field with high magnification (X50, X100 magnification objectives) are shown in Figure A3. These surfaces do not appear to be fully reflective, and the scattered light shows inhomogeneities whatever the magnification and whatever the Pr substitution concentration, although significantly weaker for the lowest Pr substitution concentration (5%). Such optical inhomogeneities with granular aspect, typically at micrometric scale, can be reasonably attributed to texture consisting of crystallites. Indeed, if the crystallites are not fully oriented, they exhibit a high visibility (contrast), which is even more pronounced thanks to the birefringence character of the material, which could be as large as n o =   2.80 (ordinary refractive index) and n e =   2.66 (extraordinary refractive index) for undoped BiFeO3 at 830 nm [44]. It seems that, although the films deposited on LAO substrate exhibit preferential orientation (see Appendix B), the contribution from randomly oriented grains still has a substantial destructive influence on some optical measurements.
In addition to these aspects at high magnification, the surfaces observed at low magnification (X10 objective) by DIC clearly show domain structures with specific orientations and even intricated orientations (Figure A4). As is illustrated in Figure A4 by a particular example of the film with 12.5% Pr substitution, these domains could even be perpendicularly oriented on the surface of the film. Their sizes typically range from about 20 to 200 µm in width and are hundreds of µm in length. As already reported [47,48,49], these observations could be attributed to the domain structure of LaAlO3 substrate resulting from its phase transition on cooling to room temperature after crystal growth [47]. The surfaces are therefore not fully flat, and subsequently thickness variations may also occur at these scales. Such intricated structures of LAO may explain why the cleaved samples seen by SEM (see Appendix E) for high Pr substitution concentration do not show sections with sharp edges.
Figure A4. Surfaces of BPFMO films as observed by optical microscopy with X10 objective using Differential Interference Contrast (DIC) for (a) 5% Pr substitution and (b,c) 12.5% substitution.
Applsci 09 00736 g0a4

Appendix C.2. Optical Evaluation of Surface Topography

The topography of the BPFMO films deposited on LAO substrate was characterized by optical profilometry (SNeox, Sensofar, Barcelona) on a 300 × 300 µm2 region (Figure A5).
Over a 300 × 300 µm2 range, all the samples have smooth surfaces with root-mean-square (RMS) surface roughness of less than 14 nm. For all the samples except 5% and 15% Pr substitution, some terraces can be seen. These originate from the terraces at the surface of the LAO substrate [47,48,49]. The measured roughness reflects the presence of the terraces. Note that the terraces on the surfaces of the films with 5% substitution of Pr, which are invisible in Figure A5, are visible in Figure A4. Similarly, the terraces on the films with 15% Pr substitution, which are invisible with optical profilometry, are visible with optical microscopy with DIC (Figure A4). This demonstrates the complementarity of the optical techniques applied by us for the characterization of BPFMO films.
Figure A5. Topography of the BPFMO films deposited on LAO substrate revealed by optical profilometry for the different Pr substitution concentrations: (a) 5%, (b) 10%, (c) 12.5%, (d) 15%, (e) 17.5%, and (f) 20%. The color bar stands for the surface topography and the associated root-mean-square (RMS) surface roughness is given in each case.
Applsci 09 00736 g0a5

Appendix D. Characterization of BPFMO Films on LAO Substrate by Atomic Force Microscope (AFM) Topography

The morphology of the films at the nanoscale was investigated by tapping-mode AFM in air (Agilent 5500 AFM, Agilent Technologies, CA, USA). As shown in Figure A6, the morphology is granular for all the compositions. It can be seen that for Pr substitution concentrations higher than 15%, some polydispersity can be seen in the grain size distribution.
Figure A6. Atomic force microscope (AFM) topography image revealing the morphology of the thin film of (Bi1−xPrx)(Fe0.95Mn0.05)O3 deposited on LAO substrate for the different Pr substitution concentrations: (a) 5%, (b) 10%, (c) 12.5%, (d) 15%, (e) 17.5%, and (f) 20%.
Applsci 09 00736 g0a6

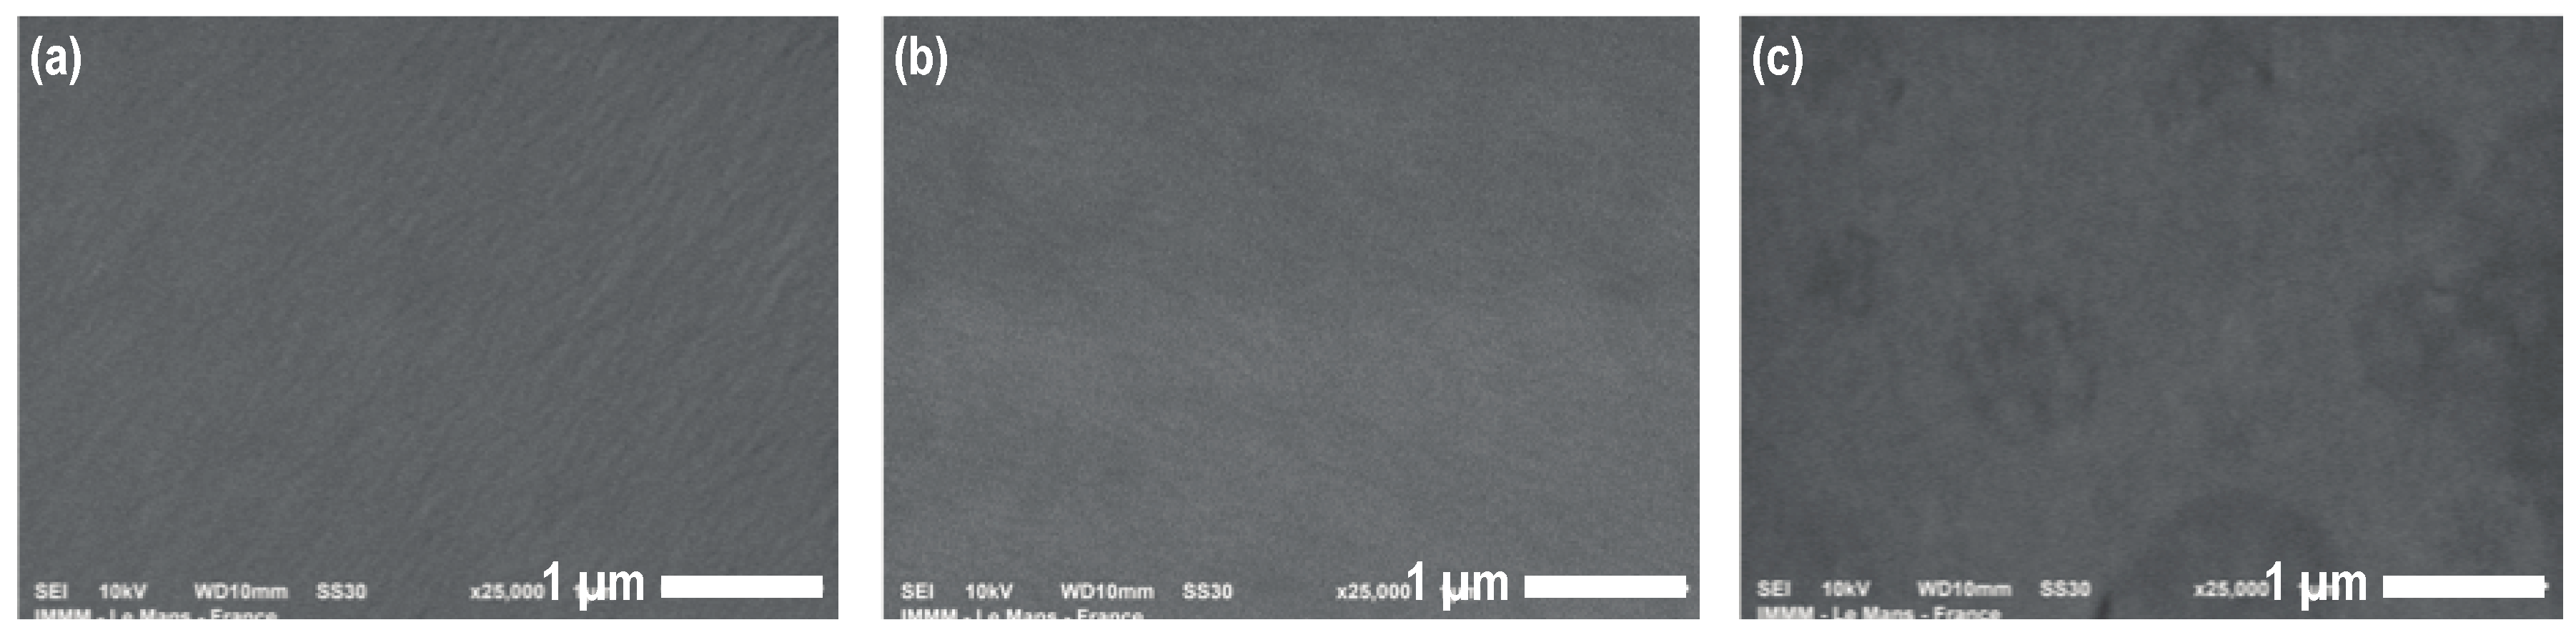
Appendix E. Thickness Measurement and Surface Imaging of BPFMO Films Deposited on LAO Substrate by Scanning Electron Microscopy

The samples were studied by scanning electron microscope (SEM) using a JEOL JSM-6510LV instrument (JEOL Ltd., Tokyo, Japan).
The BPFMO films deposited on LAO substrate had been cleaved along the direction normal to the surface to be imaged with SEM. Examples of side images obtained, up to X50,000 magnification, are presented in Figure A7.
Figure A7. Side scanning electron microscope (SEM) images of the (Bi1−xPrx)(Fe0.95Mn0.05)O3 films deposited on LAO substrate for selected Pr substitution concentrations: (ac) 5%, (df) 10%, (gi) 12.5%, and (jl) 20%.
Applsci 09 00736 g0a7
These measurements demonstrate that the surfaces of some of the samples are not perfectly flat. In addition to possible damages and contamination caused by the cleavage process, the surfaces also unambiguously have an intrinsic roughness, as also seen from direct SEM images (Figure A8). This is at least partly due to the existence of large tilted and intricated domains, as optically observed (see Appendix C) and as already reported [47,49]. The apparent degradation of the quality of the layers observed by SEM for increasing Pr doping concentration may be due to such an effect and/or the evolution of the mismatch with the lattice parameters of the LaAlO3 substrate. However, a homogeneous layer of approximately equal thickness can be distinguished in all the images: the SEM images quantitatively show that the thickness of all the deposited films is 500 nm with a typical error of ± 20 nm independently of Pr doping concentration.
Figure A8. SEM evidence of the roughness of the (Bi1−xPrx)(Fe0.95Mn0.05)O3 surface deposited on LAO substrate for selected Pr substitution concentrations: (a) 10%, (b) 12.5%, and (c) 20%.
Applsci 09 00736 g0a8

References

  1. Fiebig, M.; Lottermoser, T.; Meier, D.; Trassin, M. The evolution of multiferroics. Nat. Rev. Mater. 2016, 1, 16046. [Google Scholar] [CrossRef]
  2. Sando, D.; Barthélémy, A.; Bibes, M. BiFeO3 epitaxial thin films and devices: Past, present and future. J. Phys. Condens. Matter 2014, 26, 473201. [Google Scholar] [CrossRef]
  3. Zeches, R.J.; Rossell, M.D.; Zhang, J.X.; Hatt, A.J.; He, Q.; Yang, C.-H.; Kumar, A.; Wang, C.H.; Melville, A.; Adamo, C.; et al. A Strain-Driven Morphotropic Phase Boundary in BiFeO3. Science 2009, 326, 977–980. [Google Scholar] [CrossRef]
  4. Christen, H.M.; Nam, J.H.; Kim, H.S.; Hatt, A.J.; Spaldin, N.A. Stress-induced R-MA-MC-T symmetry changes in BiFeO3 films. Phys. Rev. B 2011, 83, 144107. [Google Scholar] [CrossRef]
  5. Balke, N.; Choudhury, S.; Jesse, S.; Huijben, M.; Chu, Y.H.; Baddorf, A.P.; Chen, L.Q.; Ramesh, R.; Kalinin, S.V. Deterministic control of ferroelastic switching in multiferroic materials. Nat. Nanotechnol. 2009, 4, 868–875. [Google Scholar] [CrossRef] [PubMed]
  6. Yang, V.C.; Seidel, J.; Byrnes, S.J.; Shafer, P.; Yang, C.-H.; Rossel, M.D.; Yu, Y.-H.; Chu, P.; Scott, J.F.; Ager, J.W.; et al. Above-bandgap voltages from ferroelectric photovoltaic devices. Nat. Nanotechnol. 2010, 5, 143–147. [Google Scholar] [CrossRef] [PubMed] [Green Version]
  7. Bhatnagar, A.; Chaudhuri, A.R.; Kim, Y.H.; Hesse, D.; Alexe, M. Role of domain walls in the abnormal photovoltaic effect in BiFeO3. Nat. Commun. 2013, 4, 2835. [Google Scholar] [CrossRef]
  8. Kundys, B. Photostrictive materials. Appl. Phys. Rev. 2015, 2, 011301. [Google Scholar] [CrossRef] [Green Version]
  9. Mai, H.; Lu, T.; Li, Q.; Liu, Z.; Li, Y.; Kremer, F.; Li, L.; Withers, R.L.; Wen, H.; Liu, Y. Above-Band Gap Photoinduced Stabilization of Engineered Ferroelectric Domains. ACS Appl. Mater. Interfaces 2018, 10, 12781–12789. [Google Scholar] [CrossRef] [PubMed]
  10. Sando, D.; Yang, Y.; Paillard, C.; Dkhil, B.; Bellaiche, L.; Nagarajan, V. Epitaxial ferroelectric oxide thin films for optical applications. Appl. Phys. Rev. 2018, 5, 041108. [Google Scholar] [CrossRef]
  11. Kan, D.; Pálová, L.; Anbusathaiah, V.; Cheng, C.J.; Fujino, S.; Nagarajan, V.; Rabe, K.M.; Takeuchi, I. Universal Behavior and Electric-Field-Induced Structural Transition in Rare-Earth-Substituted BiFeO3. Adv. Funct. Mater. 2010, 20, 1108–1115. [Google Scholar] [CrossRef]
  12. Wen, Z.; Shen, X.; Wu, D.; Xu, Q.; Wang, J.; Li, A. Enhanced ferromagnetism at the rhombohedral–tetragonal phase boundary in Pr and Mn co-substituted BiFeO3 powders. Solid State Commun. 2010, 150, 2081–2084. [Google Scholar] [CrossRef]
  13. Wen, Z.; You, L.; Shen, X.; Li, X.; Wu, D.; Wang, J.; Li, A. Multiferroic properties of (Bi1−xPrx)(Fe0.95Mn0.05)O3 thin films. Mater. Sci. Eng. B 2011, 176, 990–995. [Google Scholar] [CrossRef]
  14. Charnaya, E.V. Acoustic studies of phase transitions in crystals and nanocomposites. Acoust. Phys. 2008, 54, 802–813. [Google Scholar] [CrossRef]
  15. Li, Q.; Cao, Y.; Yu, P.; Vasudevan, R.K.; Laanait, N.; Tselev, A.; Xue, F.; Chen, L.Q.; Maksymovych, P.; Kalinin, S.V.; et al. Giant elastic tunability in strained BiFeO3 near an electrically induced phase transition. Nat. Commun. 2015, 6, 8985. [Google Scholar] [CrossRef] [PubMed]
  16. Thomsen, C.; Grahn, H.T.; Maris, H.J.; Tauc, J. Surface generation and detection of phonons by picosecond light pulses. Phys. Rev. B 1986, 34, 4129–4138. [Google Scholar] [CrossRef]
  17. Thomsen, C.; Grahn, H.T.; Maris, H.J.; Tauc, J. Picosecond interferometric technique for study of phonons in the brillouin frequency range. Opt. Commun. 1986, 60, 55–58. [Google Scholar] [CrossRef]
  18. Grahn, H.T.; Maris, H.J.; Tauc, J. Picosecond ultrasonics. IEEE J. Quantum Electron. 1989, 25, 2562–2569. [Google Scholar] [CrossRef]
  19. Lin, H.-N.; Stoner, R.J.; Maris, H.J.; Tauc, J. Phonon attenuation and velocity measurements in transparent materials by picosecond acoustic interferometry. J. Appl. Phys. 1991, 69, 3816–3822. [Google Scholar] [CrossRef]
  20. Mechri, C.; Ruello, P.; Breteau, J.M.; Baklanov, M.R.; Verdonck, P.; Gusev, V. Depth-profiling of elastic inhomogeneities in transparent nanoporous low-k materials by picosecond ultrasonic interferometry. Appl. Phys. Lett. 2009, 95, 091907. [Google Scholar] [CrossRef]
  21. Gusev, V.E.; Ruello, P. Advances in applications of time-domain Brillouin scattering for nanoscale imaging. Appl. Phys. Rev. 2018, 5, 031101. [Google Scholar] [CrossRef]
  22. Wright, O.B.; Hyoguchi, T. Ultrafast vibration and laser acoustics in thin transparent films. Opt. Lett. 1991, 16, 1529–1531. [Google Scholar] [CrossRef] [PubMed]
  23. Wright, O.B. Thickness and sound velocity measurement in thin transparent films with laser picosecond acoustics. J. Appl. Phys. 1992, 71, 1617–1629. [Google Scholar] [CrossRef]
  24. Rossignol, C.; Perrin, B.; Laborde, S.; Vandenbulcke, L.; De Barros, M.I.; Djemia, P. Nondestructive evaluation of micrometric diamond films with an interferometric picosecond ultrasonics technique. J. Appl. Phys. 2004, 95, 4157–4162. [Google Scholar] [CrossRef]
  25. Devos, A.; Côte, R.; Caruyer, G.; Lefèvre, A. A different way of performing picosecond ultrasonic measurements in thin transparent films based on laser-wavelength effects. Appl. Phys. Lett. 2005, 86, 211903. [Google Scholar] [CrossRef]
  26. Côte, R.; Devos, A. Refractive index, sound velocity and thickness of thin transparent films from multiple angles picosecond ultrasonics. Rev. Sci. Instrum. 2005, 76, 053906. [Google Scholar] [CrossRef]
  27. Lomonosov, A.M.; Ayouch, A.; Ruello, P.; Vaudel, G.; Baklanov, M.R.; Verdonck, P.; Zhao, L.; Gusev, V.E. Nanoscale Noncontact Subsurface Investigations of Mechanical and Optical Properties of Nanoporous Low-k Material Thin Film. ACS Nano 2012, 6, 1410–1415. [Google Scholar] [CrossRef]
  28. Ruello, P.; Pezeril, T.; Avanesyan, S.; Vaudel, G.; Gusev, V.; Infante, I.C.; Dkhil, B. Photoexcitation of gigahertz longitudinal and shear acoustic waves in BiFeO3 multiferroic single crystal. Appl. Phys. Lett. 2012, 100, 212906. [Google Scholar] [CrossRef] [Green Version]
  29. Lejman, M.; Vaudel, G.; Infante, I.C.; Chaban, I.; Pezeril, T.; Edely, M.; Nataf, G.F.; Guennou, M.; Kreisel, J.; Gusev, V.E.; et al. Ultrafast acousto-optic mode conversion in optically birefringent ferroelectrics. Nat. Commun. 2016, 7, 12345. [Google Scholar] [CrossRef] [Green Version]
  30. Lejman, M.; Vaudel, G.; Infante, I.C.; Gemeiner, P.; Gusev, V.E.; Dkhil, B.; Ruello, P. Giant ultrafast photo-induced shear strain in ferroelectric BiFeO3. Nat. Commun. 2014, 5, 4301. [Google Scholar] [CrossRef]
  31. Chen, L.Y.; Yang, J.C.; Luo, C.W.; Laing, C.W.; Wu, K.H.; Lin, J.-Y.; Uen, T.M.; Juang, J.Y.; Chu, Y.H.; Kobayashi, T. Ultrafast photoinduced mechanical strain in epitaxial BiFeO3 thin films. Appl. Phys. Lett. 2012, 101, 041902. [Google Scholar] [CrossRef]
  32. Jin, Z.; Xu, Y.; Zhang, Z.; Lin, X.; Ma, G.; Cheng, Z.; Wang, X. Strain modulated transient photostriction in La and Nb codoped multiferroic BiFeO3 thin films. Appl. Phys. Lett. 2012, 101, 242902. [Google Scholar] [CrossRef]
  33. Doig, K.I.; Aguesse, F.; Axelsson, A.K.; Alford, N.M.; Nawaz, S.; Palkar, V.R.; Jones, S.P.P.; Johnson, R.D.; Synowicki, R.A.; Lloyd-Hughes, J. Coherent magnon and acoustic phonon dynamics in tetragonal and rare-earth-doped BiFeO3 multiferroic thin films. Phys. Rev. B 2013, 88, 094425. [Google Scholar] [CrossRef]
  34. Zhang, Z.; You, L.; Du, J.; Wang, J.; Jin, Z.; Ma, G.; Leng, Y. Ultrafast electron-phonon coupling and photo-induced strain in the morphotropic phase boundary of BixDy1−xFeO3 films. Sci. Rep. 2018, 8, 3258. [Google Scholar] [CrossRef] [PubMed]
  35. Wen, H.; Chen, P.; Cosgriff, M.P.; Walko, D.A.; Lee, J.H.; Adamo, C.; Schaller, R.D.; Ihlefeld, J.F.; Dufresne, E.M.; Schlom, D.G.; et al. Electronic Origin of Ultrafast Photoinduced Strain in BiFeO3. Phys. Rev. Lett. 2013, 110, 037601. [Google Scholar] [CrossRef] [PubMed]
  36. Schick, D.; Herzog, M.; Wen, H.; Chen, P.; Adamo, C.; Gaal, P.; Schlom, D.G.; Evans, P.G.; Li, Y.; Bargheer, M. Localized Excited Charge Carriers Generate Ultrafast Inhomogeneous Strain in the Multiferroic BiFeO3. Phys. Rev. Lett. 2014, 112, 097602. [Google Scholar] [CrossRef] [PubMed]
  37. Kuriakose, M.; Raetz, S.; Hu, Q.M.; Nikitin, S.M.; Chigarev, N.; Tournat, V.; Bulou, A.; Lomonosov, A.; Djemia, P.; Gusev, V.E.; et al. Longitudinal sound velocities, elastic anisotropy, and phase transition of high-pressure cubic H2O ice to 82 GPa. Phys. Rev. B 2017, 96, 134122. [Google Scholar] [CrossRef]
  38. Steigerwald, A.; Xu, Y.; Qi, J.; Gregory, J.; Liu, X.; Furdyna, J.K.; Varga, K.; Hmelo, A.B.; Lüpke, G.; Feldman, L.C.; et al. Semiconductor point defect concentration profiles measured using coherent acoustic phonon waves. Appl. Phys. Lett. 2009, 94, 111910. [Google Scholar] [CrossRef]
  39. Nikitin, S.M.; Chigarev, N.; Tournat, V.; Bulou, A.; Gasteau, D.; Castagnede, B.; Zerr, A.; Gusev, V.E. Revealing sub-μm and μm-scale textures in H2O ice at megabar pressures by time-domain Brillouin scattering. Sci. Rep. 2015, 5, 9352. [Google Scholar] [CrossRef]
  40. Kuriakose, M.; Chigarev, N.; Raetz, S.; Bulou, A.; Tournat, V.; Zerr, A.; Gusev, V.E. In situ imaging of the dynamics of photo-induced structural phase transition at high pressures by picosecond acoustic interferometry. New J. Phys. 2017, 19, 053026. [Google Scholar] [CrossRef]
  41. Xu, Y.; Shen, M. Structure and optical properties of nanocrystalline BiFeO3 films prepared by chemical solution deposition. Mater. Lett. 2008, 62, 3600–3602. [Google Scholar] [CrossRef]
  42. Pisarev, R.V.; Moskvin, A.S.; Kalashnikova, A.M.; Rasing, T. Charge transfer transitions in multiferroic BiFeO3 and related ferrite insulators. Phys. Rev. B 2009, 79, 235128. [Google Scholar] [CrossRef]
  43. Železný, V.; Chvostová, D.; Pajasová, L.; Vrejoiu, I.; Alexe, M. Optical properties of epitaxial BiFeO3 thin films. Appl. Phys. A 2010, 100, 1217–1220. [Google Scholar] [CrossRef]
  44. Choi, S.G.; Yi, H.T.; Cheong, S.-W.; Hilfiker, J.N.; France, R.; Norman, A.G. Optical anisotropy and charge-transfer transition energies in BiFeO3 from 1.0 to 5.5 eV. Phys. Rev. B 2011, 83, 100101. [Google Scholar] [CrossRef]
  45. Esnault, C.; Chénais, B.; Casse, N.; Delorme, N.; Louarn, G.; Pilard, J.-F. Electrochemically Modified Carbon and Chromium Surfaces for AFM Imaging of Double-Strand DNA Interaction with Transposase Protein. ChemPhysChem 2013, 14, 338–345. [Google Scholar] [CrossRef]
  46. Jain, A.; Ong, S.P.; Hautier, G.; Chen, W.; Richards, W.D.; Dacek, S.; Cholia, S.; Gunter, D.; Skinner, D.; Ceder, G.; et al. Commentary: The Materials Project: A materials genome approach to accelerating materials innovation. APL Mater. 2013, 1, 011002. [Google Scholar] [CrossRef] [Green Version]
  47. Bueble, S.; Knorr, K.; Brecht, E.; Schmahl, W.W. Influence of the ferroelastic twin domain structure on the 100 surface morphology of LaAlO3 HTSC substrates. Surf. Sci. 1998, 400, 345–355. [Google Scholar] [CrossRef]
  48. Zheng, S.; Fisher, C.A.J.; Kato, T.; Nagao, Y.; Ohta, H.; Ikuhara, Y. Domain formation in anatase TiO2 thin films on LaAlO3 substrates. Appl. Phys. Lett. 2012, 101, 191602. [Google Scholar] [CrossRef]
  49. Rousseau, A. Couches Minces D’oxydes Ferroélectriques Pour les Dispositifs Agiles en Hyperfréquences: Croissance par Ablation Laser et Caractérisations. Ph.D. Thesis, University of Rennes, Rennes, France, 2005. (In French). [Google Scholar]
Figure 1. Raw measurements of the transient probe reflectivity in the (Bi1−xPrx)(Fe0.95Mn0.05)O3 films deposited on Si: (a) for probe incidence at ψ = 0° and (b) for probe incidence at ψ = 52°. Each percentage number denotes the Pr substitution concentration associated with the curves just above it, and each curve at a given substitution concentration corresponds to a different probed location on the sample.
Applsci 09 00736 g001
Figure 2. Acoustic part of the signals obtained in the (Bi1−xPrx)(Fe0.95Mn0.05)O3 films deposited on Si after the subtraction of the low-frequency contribution of non-acoustic origins to reflectivity: (a) for time-domain Brillouin scattering (TDBS) measurements at normal incidence (0°) and (b) for those at oblique incidence (52°). Each percentage number denotes the Pr substitution concentration (x) associated with all curves with the same ordinate, and each curve at a given substitution concentration corresponds to a different probed location on the sample.
Applsci 09 00736 g002
Figure 3. Brillouin frequency (BF) images as a function of the time delay between pump and probe pulses and of the Pr substitution concentration from TDBS measurements conducted (a) at normal incidence (0°) and (b) at oblique incidence (52°).
Applsci 09 00736 g003
Figure 4. Distributions of the reliably extracted BFs for the two probe angles of incidence, ψ = 0° (blue) and ψ = 52° (orange), and for the different Pr substitution concentrations: (a) 5%, (b) 10%, (c) 15%, and (d) 20%. Gaussian fits of the distributions are also shown.
Applsci 09 00736 g004
Figure 5. Average BF values as a function of the Pr substitution concentration for TDBS measurements at normal incidence (ψ = 0°) with filled blue points and for those at oblique incidence (ψ = 52°) with filled red triangles. The error bars in all cases are associated with the full width at half maximum (FWHM) of the distributions shown in Figure 4.
Applsci 09 00736 g005
Figure 6. Dependencies of the optical refractive index and of the longitudinal sound velocity on the Praseodymium substitution concentration in (Bi1−xPrx)(Fe0.95Mn0.05)O3 films deposited on Si substrate.
Applsci 09 00736 g006
Figure 7. (a) Raw measurements of the transient probe reflectivity in the (Bi1−xPrx)(Fe0.95Mn0.05)O3 films deposited on LaAlO3 (LAO) for probe incidence at ψ = 0°. (b) The acoustic part of the signals obtained in the (Bi1−xPrx)(Fe0.95Mn0.05)O3 films deposited on LAO after the subtraction of the low-frequency contribution of non-acoustic origins to reflectivity. Each percentage denotes the Pr substitution concentration associated with the curves just below it, and each curve at a given substitution concentration corresponds to a different probed location on the sample.
Applsci 09 00736 g007
Figure 8. Dependencies of the optical refractive index and the longitudinal sound velocity on the Praseodymium substitution concentration in (Bi1−xPrx)(Fe0.95Mn0.05)O3 films deposited on LAO substrate.
Applsci 09 00736 g008
Table 1. Average Brillouin frequency (BF) values measured for two angles of incidence, ψ = 0° and ψ = 52° for the different concentration of Pr substitution in the (Bi1−xPrx)(Fe0.95Mn0.05)O3 thin films deposited on Si. The calculated optical indices ( n TDBS ) and acoustic velocity ( ν TDBS ) using the measured BFs are also reported.
Pr Substitution ConcentrationAverage BFs for Two Angles of Incidence ψ [GHz] n TDBS   =   f 0 sin ψ f 0 2 f ψ 2 υ TDBS   =   λ 0 f 0 2 f ψ 2 2 sin ψ [m/s]
0 °   ( f 0 ) 52 °   ( f 52 )
5%24.9 ± 1.624.8 ± 0.38.80 ± 84.01143 ± 10980
10%17.0 ± 0.716.9 ± 0.97.27 ± 58.6944 ± 7639
15%17.7 ± 0.716.7 ± 0.42.38 ± 1.453007 ± 1954
20%25.1 ± 0.324.1 ± 2.72.82 ± 4.403596 ± 5650
Table 2. Evaluation of the parameters of (Bi1−xPrx)(Fe0.95Mn0.05)O3 films deposited on Si by combining time-domain Brillouin scattering (TDBS), optical reflectivity, and atomic force microscope (AFM) measurements.
1234567
Pr substitution concentration H [nm]
nominal
f 0 [GHz]
(ψ = 0°)
H AFM [nm] ( n H ) opt [nm] n   =   ( n H ) opt H AFM υ S   =   f 0 λ 0 2 n [m/s]
10%60017.0 ± 0.7679 ± 181746 ± 82.57 ± 0.082672 ± 193
15%60017.7 ± 0.7529 ± 111702 ± 103.22 ± 0.092227 ± 151
20%60025.1 ± 0.3649 ± 181737 ± 102.68 ± 0.093784 ± 172
Table 3. Evaluation of the parameters of (Bi1−xPrx)(Fe0.95Mn0.05)O3 films deposited on LaAlO3 (LAO) by combining TDBS, optical reflectivity, and scanning electron microscope (SEM) measurements.
1234567
Pr substitution concentration H [nm]
nominal
f 0 [GHz]
(ψ = 0°)
H SEM [nm] ( n H ) opt [nm] n   =   ( n H ) opt H SEM υ S   =   f 0 λ 0 2 n [m/s]
5%50025.4 ± 1.0500 ± 201310 ± 102.62 ± 0.123917 ± 334
10%50025.8 ± 0.7500 ± 201300 ± 102.60 ± 0.124009 ± 294
12.5%50021.3 ± 2500 ± 201320 ± 102.64 ± 0.133260 ± 467
15%50024.5 ± 1.5500 ± 201310 ± 102.62 ± 0.123778 ± 404
20%50026.5 ± 0.7500 ± 201290 ± 102.58 ± 0.124102 ± 300

