Article

Optical Design for Novel Glasses-Type 3D Wearable Ophthalmoscope

1
Department of Applied Physics, National Pingtung University, Taichung 402, Taiwan
2
Graduate Institute of Precision Engineering, National Chung Hsing University, Pingtung County 900, Taiwan
3
Department of Mechanical and Automation Engineering, National Kaohsiung First Univ. of Science and Technology, Kaohsiung 824, Taiwan
*
Author to whom correspondence should be addressed.
Appl. Sci. 2019, 9(4), 717; https://doi.org/10.3390/app9040717
Submission received: 24 November 2018 / Revised: 29 January 2019 / Accepted: 31 January 2019 / Published: 19 February 2019
(This article belongs to the Special Issue Holography, 3D Imaging and 3D Display)

Abstract

:

Featured Application

This proposed miniature glasses-type 3D wearable ophthalmoscope presents a novel optical design, which is aimed to functionally improve the current glasses-type ophthalmoscope in the market by cooperating with 3D image technology, infrared spectrum technology, future medical diagnostics, the cloud and big data analysis.

Abstract

This paper proposes a new optical design that will cooperate with 3D image technology, infrared spectrum technology, future medical diagnostics, the cloud, and big data analysis. We first conducted image recognition experiments to compare the pros and cons of 2D and 3D frameworks in order to make sure that the optical and mechanical framework of a glasses-type 3D ophthalmoscope would be a better choice. The experimental results showed that a 3D image recognition rate (90%) was higher than a 2D image recognition rate (84%), and hence the 3D mechanism design was selected. The glasses-type 3D ophthalmoscope design is primarily based on the specification of indirect ophthalmoscope requirements and two working spectrums: a near infrared and a visible spectrum. The design is a 2.5x magnification fixed focal telecentric relay system with a right-angle prism, which uses a large aperture to increase the amount of incident light (F/# = 2.0). As the infrared spectrums that have better transmittance towards human eye tissue are 965 nm and 985 nm, so that we took account of the visible spectrum and the near-infrared spectrum simultaneously to increase the basis of the physician’s diagnosis. In this research, we conclude that a wearable ophthalmoscope can be designed optically and mechanically with 3D technology, an infrared and a visible working spectrum and further, possibly in cooperation with the cloud and big data analysis.

1. Introduction

Owing to the rapid increase in the ageing population, more ophthalmic diseases than ever require regular diagnosis and early prevention; thus, the demand for ophthalmic medicals has increased. As technology has progressed, ophthalmic diagnostic equipment technology has been enhanced [1,2]; from the early stages, when doctors diagnosed using eye observation, it has evolved into the current indirect tomography scans. An ophthalmoscope is one of the most important pieces of equipment in ophthalmology clinics. To enhance the convenience of a diagnosis, the ophthalmoscope has evolved from a handheld instrument into an indirect ophthalmoscope and a headset ophthalmoscope. Since the requirements for optical system specifications have increased, system module expansions requiring complicated operation are necessary to obtain good imaging quality [3,4]. However, so far there has been no breakthrough that obviates the need for the traditional ophthalmoscope. Therefore, the new generation of optical design requires more innovative breakthrough ideas for ophthalmic medical applications. At the same time, current electronic equipment is gradually raising the system requirements and moving toward creating business opportunities for wearable electronics, which allow users to take advantage of science and technology. This goal is a shared vision for academics and manufacturers to study and hopefully make breakthroughs. Ophthalmoscope equipment is mostly stored in hospitals for use by doctors; thus, patients need to go to a hospital for diagnosis and treatment. However, the development of the cloud and big data technology has made it technically feasible for today’s patients to receive medical care at home. If it were possible to use an ophthalmoscope at home, patients could operate the equipment themselves and transfer the data to the hospital using the cloud. This would improve the convenience of being diagnosed by an ophthalmologist. Starting with the demand for a home-use ophthalmoscope, this paper proposes a novel glasses-type 3D ophthalmoscope design. The glasses-type 3D ophthalmoscope design is primarily based on the specifications of indirect ophthalmoscope requirements and two working spectrums: one near infrared and the other the visible spectrum. The ophthalmoscope is based on right angle prism to design a 2.5x magnification telecentric relay system with fixed focal length and F/# = 2.0. As a result, the infrared spectrums at 965 nm and 985 nm have better transmittance towards human eye tissue. The visible and the near-infrared spectra are applied to assist increasing the basis of a physician’s diagnosis. In this research, we conclude that a wearable ophthalmoscope can be designed optically and mechanically with 3D technology, infrared and visible working spectrum and further, possibly in cooperation with the cloud and big data analysis.

2. Image Recognition Experiment

We first conducted a human eye image recognition experiment by comparing the pros and cons of 2D and 3D image recognition. Twenty people, randomly chosen, aged between 20 and 25 years, participated in this experiment. According to professional ophthalmologists, students aged around 20 are at the peak of human vision. In addition, their visual acuity is statistically consistent. Compared with many subjects, the elderly are more vulnerable to psychological factors, working environment, or imminent death. For example, the U.S. military conducted large-scale visual testing experiments in the 1950s; all subjects were young soldiers. Their visual acuities after correction were greater than 0.8 and none of the participants had any form of eye disease. The display monitor was a 55-inch 3D liquid-crystal display (LCD) television, adopting shutter 3D display technology with a resolution of 1920 × 1080 pixels and a fixed brightness (display brightness was 34 cd/m2). The distance from the human eye to the screen was 250 cm. The experimental images were circular figures with a diameter of 50 cm on the screen. Experimental conditions are listed in Table 1.

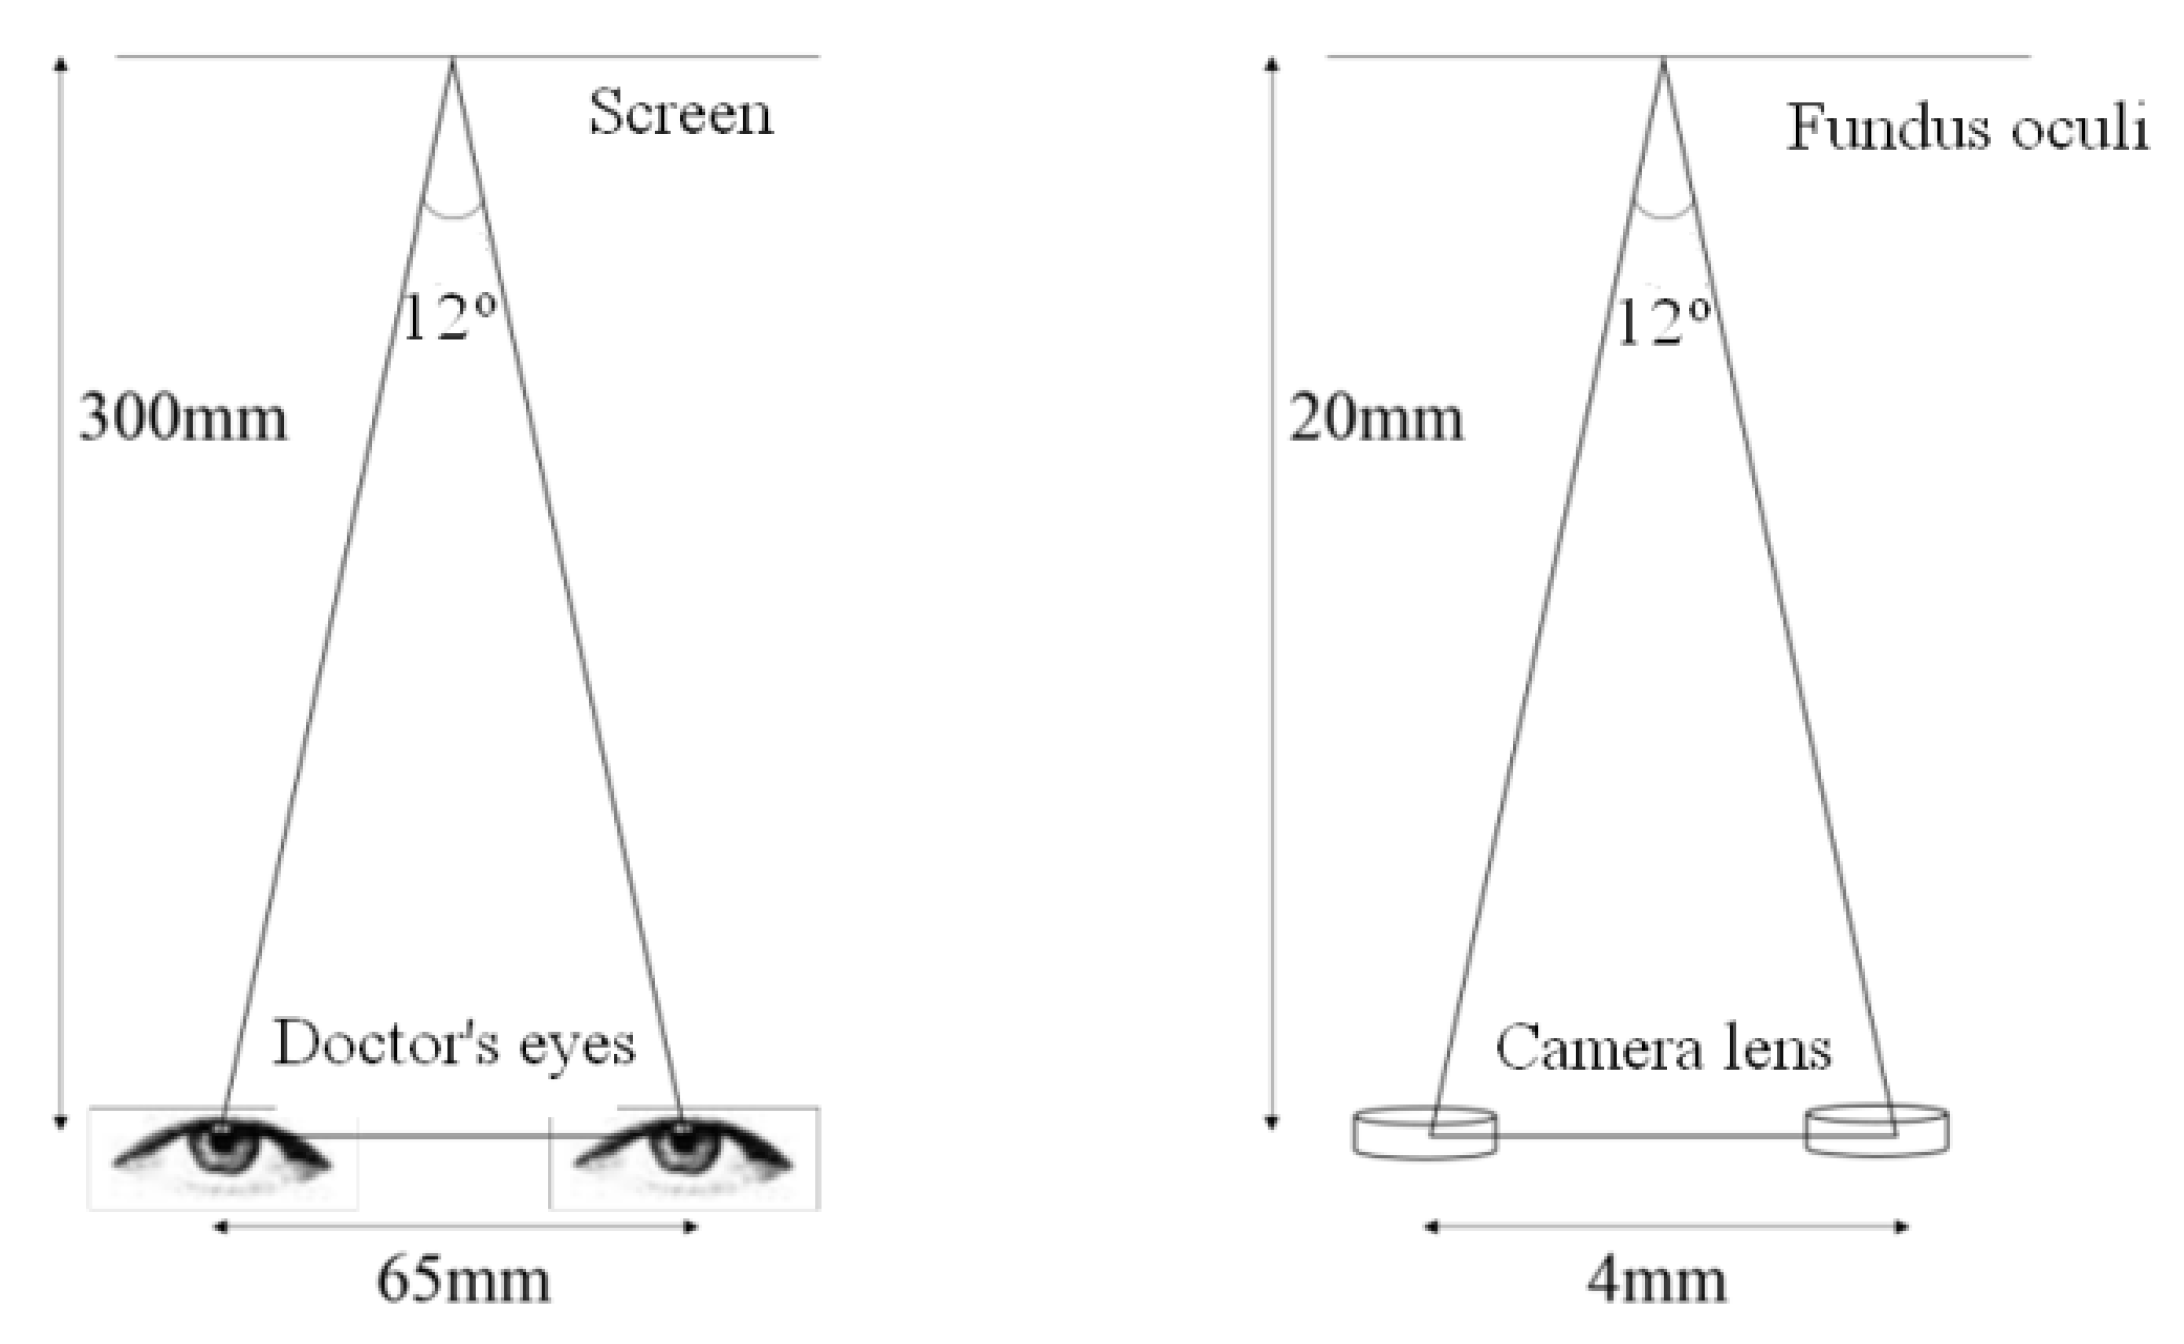
2.1. Experimental Imaging Setting

Fairhurst and Lettington proposed using geometric figures to replace complex images in image recognition experiments in 1998 and 2000 [5,6]. The images used in this experiment, as shown in Table 2, Table 3 and Table 4, were circles with diameters of 50 cm, formed by geometric figures. In this experiment, the control variables were (1) two types of 2D and 3D images; (2) shapes divided into variations of seven types, namely, round, vertical rectangle, horizontal rectangle, triangle, square, pentagon, and hexagon, as shown in Table 2; (3) low contrasts divided into variations of six types, namely 20%, 10%, 8%, 6%, 4%, and 2%, as shown in Table 3; and (4) spatial frequency, which is the amount of frequency variation contained within a unit space [7,8]. In this study, spatial frequency is defined as the figure changes in periodic numbers on the circumference of the rings on the screen, being seen from a position of 30 cm in front of the human eye within a width of 2 cm. In this study, spatial frequencies of eight types were used: 0.9, 1.1, 1.2, 1.5, 1.8, 2.5, 3.7, and 5.4, as shown in Table 4. There were 7 × 6 × 8 = 336 types of image in total for every participant in 2D or 3D test.

2.2. Image Recognition Results

The results of image recognition are shown in Table 5, where N is the number of participants, M is the average of correctly recognized images. “T” is the parameter of t-test. The “p” is the significance, obviously distinguishable when p < 0.05. The η is semi-partial correlation. The SD is standard deviation, which is a measure to quantify the amount of variation or dispersion of a set of data values. Compared to 3D experiment and 2D ones, the SD of 3D experiment is obviously smaller, which indicates that the 3D vision is more accurate than 2D. The results show that the 3D image recognition rate (302.05/336 ≈ 90%) is higher than the 2D image (281.85/336 ≈ 84%). Using an independent sample test, the difference between the two groups achieved a statistical significance (p < 0.01), and the strength of association measures (2 > 0.14) in large effect size [9].

3. Glasses-Type 3D Ophthalmoscope Design

In this experiment, an optical system was simulated and optimized by two different spectra, visible and near-infrared (close to 950 nm). It is because near infrared spectrum around 950 nm have less absorption for water so that we might derive some near infrared pictures from human eyes. Part of the near infrared light can penetrate the eye so the optical system may be able to see through the internal structure of human eye. Therefore, this optical system can replicate the 3D surface of the eye, including part of the internal structure. Therefore, the data can be uploaded anytime by cloud technology to provide long-term analysis and tracking of personal eye health via medical center big data analysis system.
The glasses-type 3D ophthalmoscope design allows patients to use the equipment at home, obtain timely images of the fundus of the eyes, and reduce the complexity of medical diagnosis by transferring big data to the hospital through the cloud technology. In the design, the position of the ophthalmoscope’s lens inside the glasses frame is aligned with the human eye. Figure 1 is a product schematic, plotted using Solid Work. This design utilizes four lenses in total; every two-lens structure comes with a single 3D image-taking module.
The glasses-type ophthalmoscope lens mechanism is designed to be rotatable. This means that, when required to take images of the fundus of the eyes, the 3D image-taking modules are rotated to the front of the eyes for shooting, to ensure that the lens can accurately capture clear images of the fundus of the eyes. When the 3D image-taking modules are rotated, so that they are enclosed within the frames, they can be used as ordinary glasses, as shown in Figure 2.

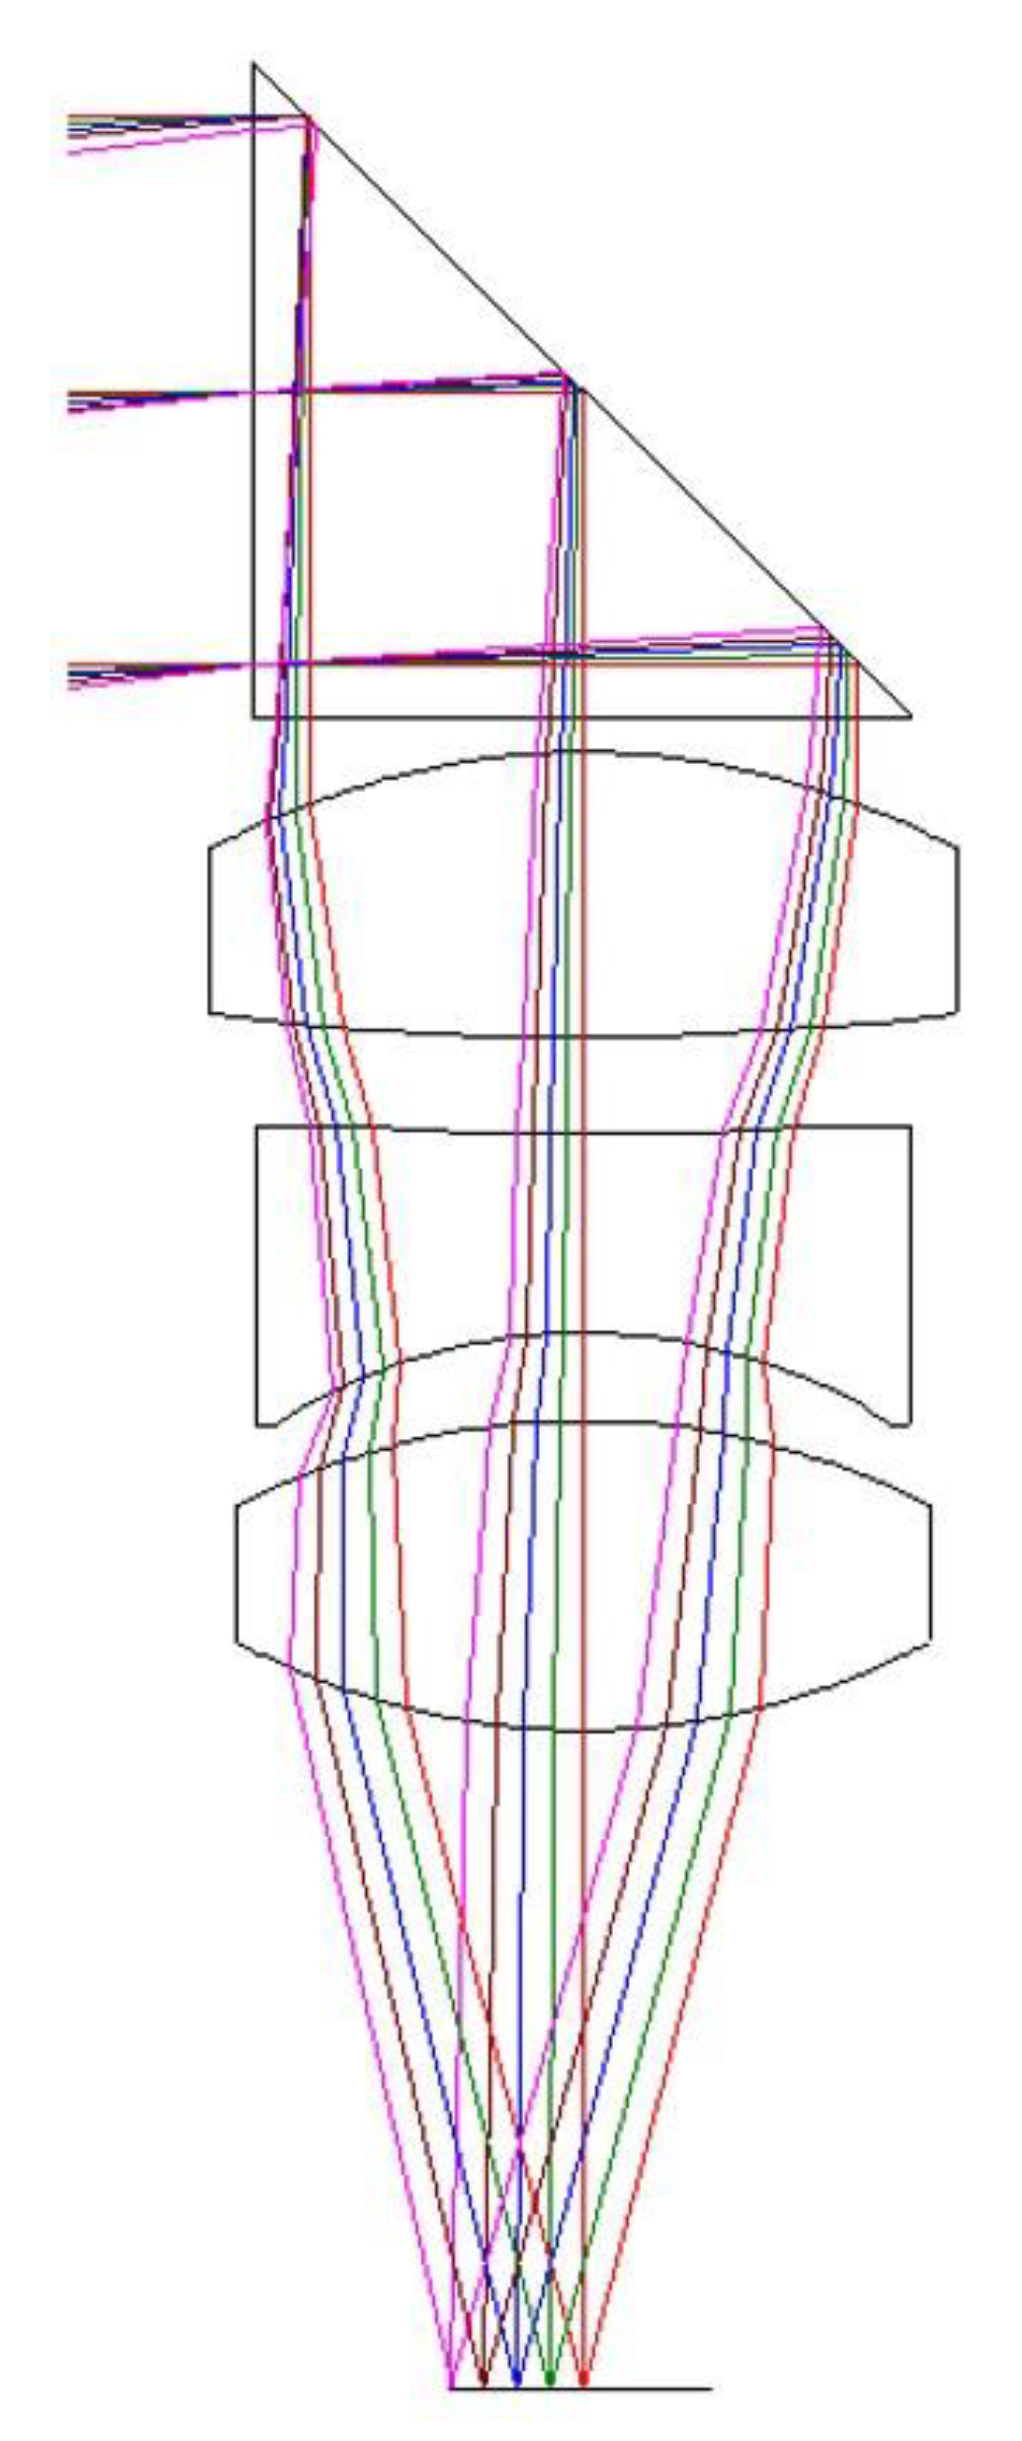
3.1. Optical Design for Glasses-Type 3D Ophthalmoscope Lens

In accordance with the glasses-type 3D ophthalmoscope framework, this study analyzed the specifications of the lens design, in which visible lights and near-infrared lights (985 nm and 965 nm) were used for optimization with the simulation design. These two segments of near-infrared light wavelength spectrum have good transmission through the crystal body and the organ in the human eye of the retina, effectively increasing the macular image of the retina and enabling the symptoms to be observed via the infrared wavelength penetration [10]. This design uses a large aperture to increase the amount of incident light. Figure 3 shows a right-angle prism inverted fixed focal design for visible light and the near-infrared wavelengths. Its specifications are listed in Table 6.

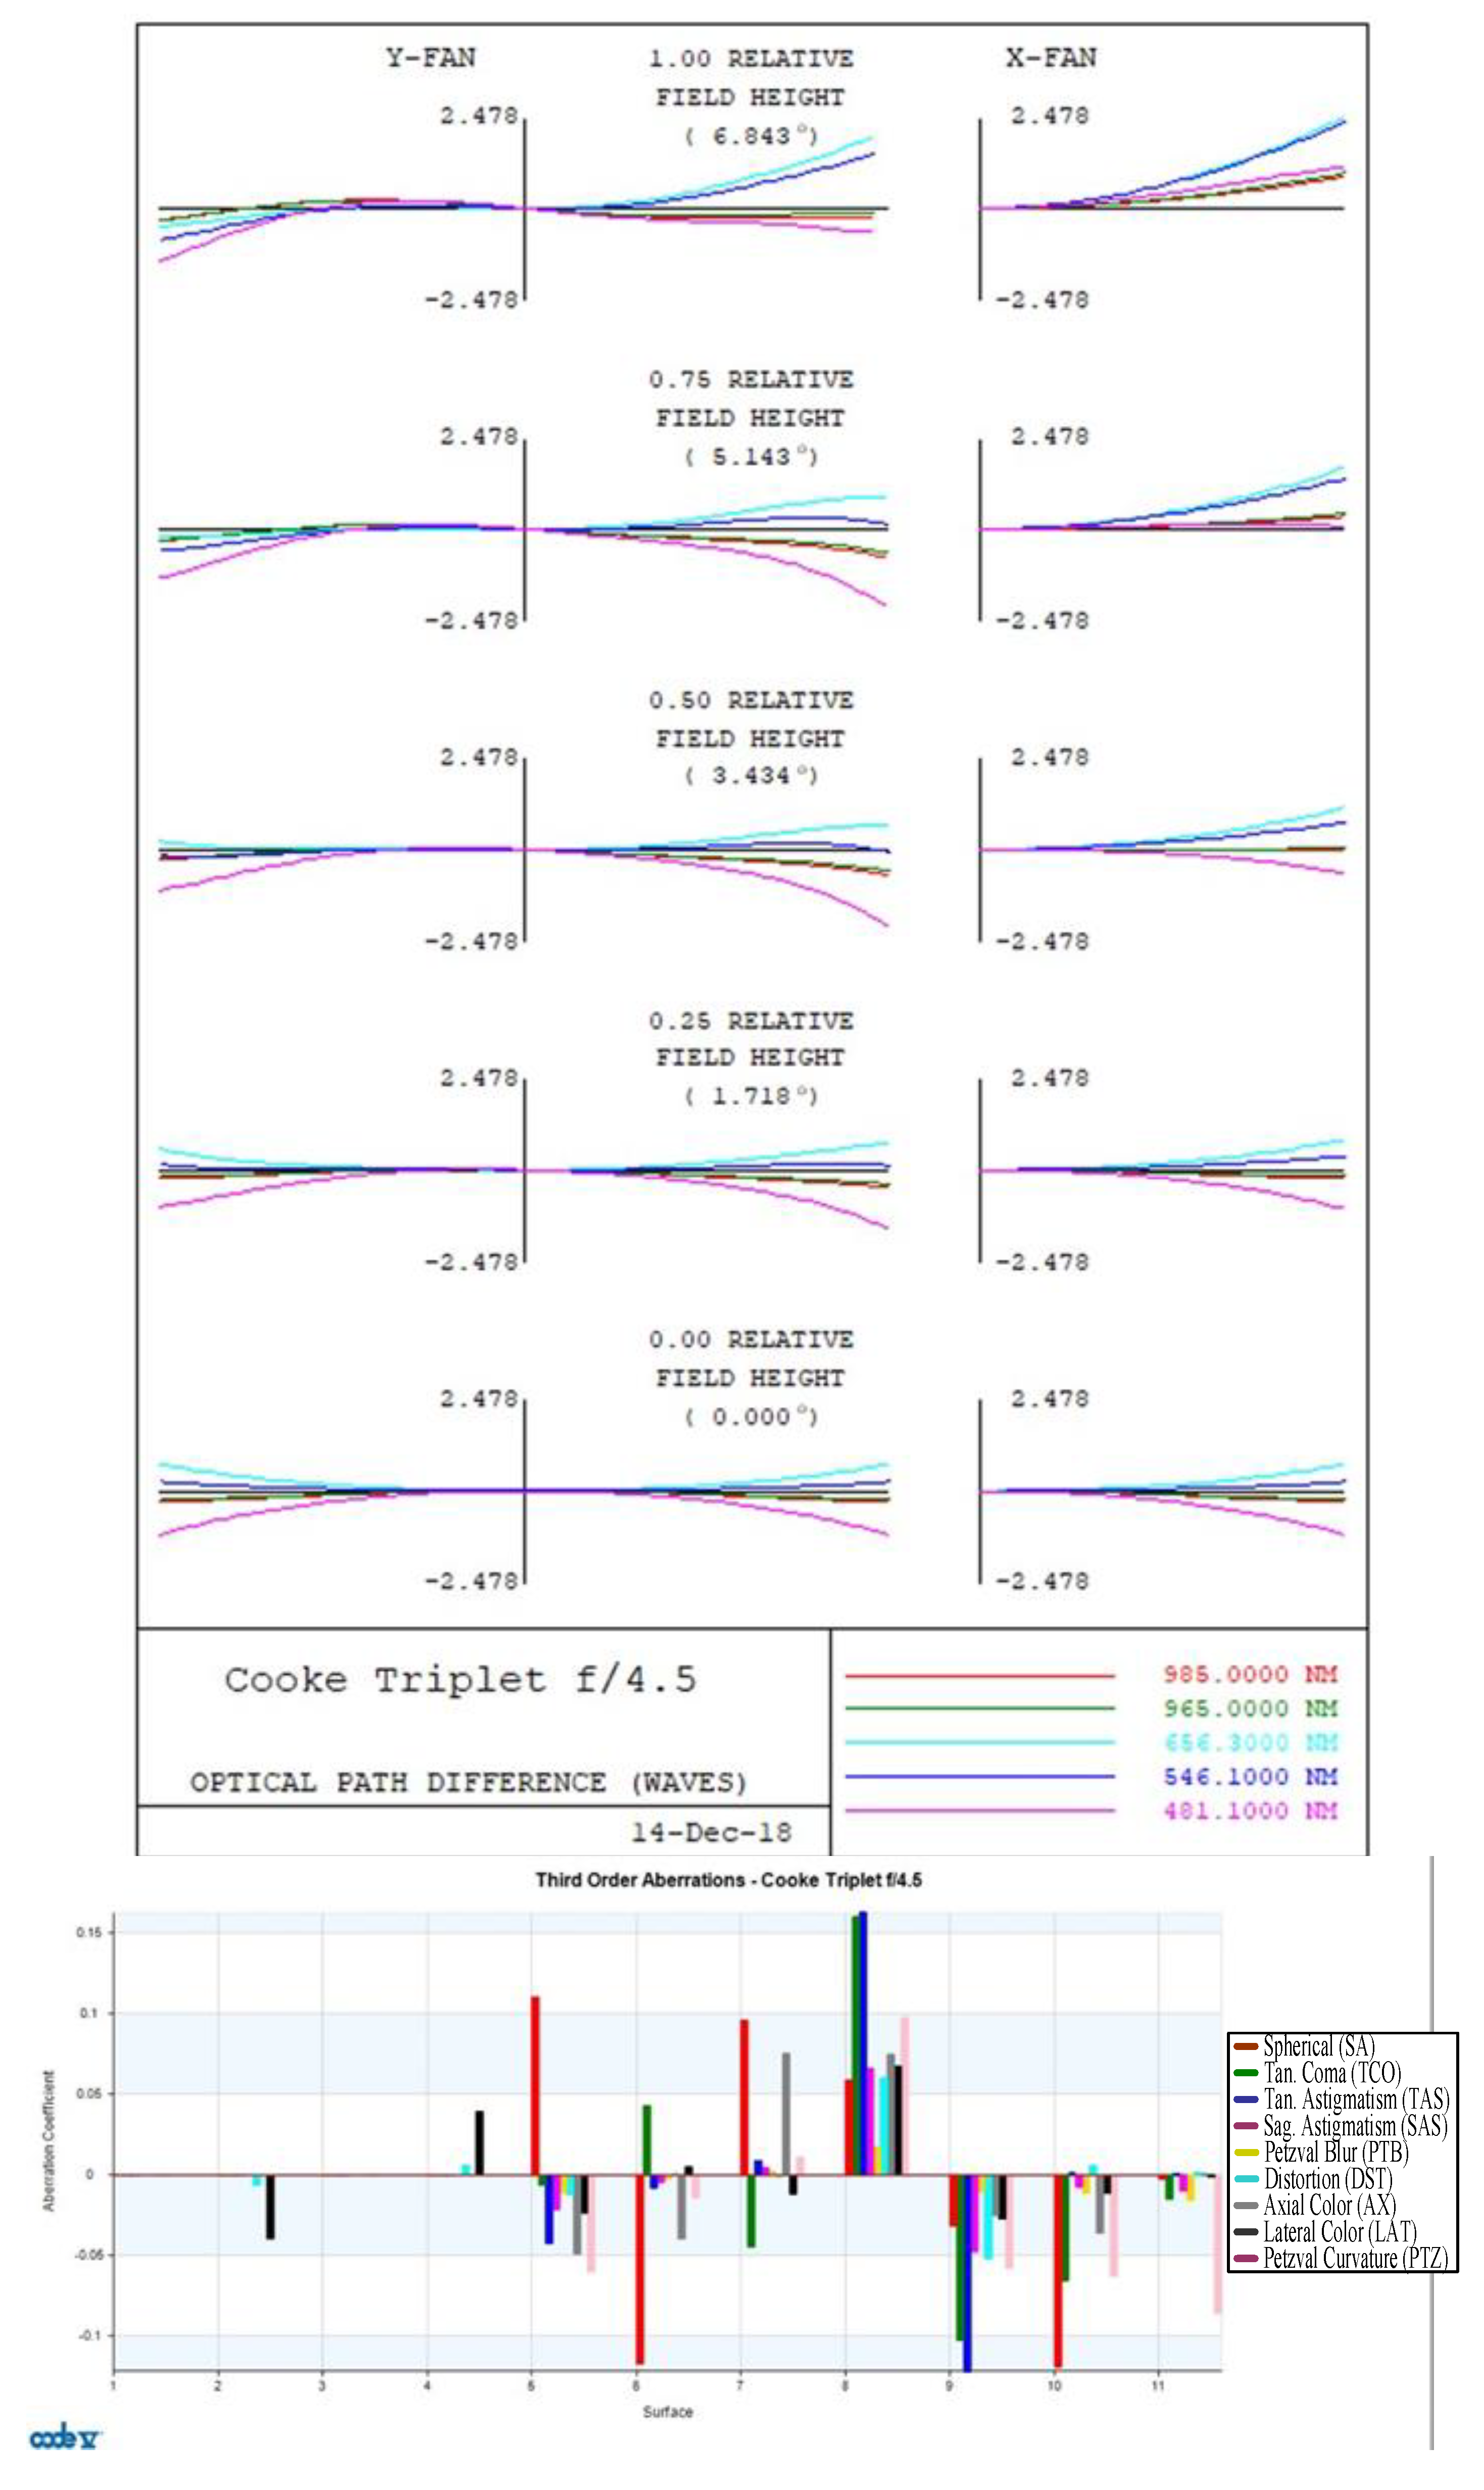
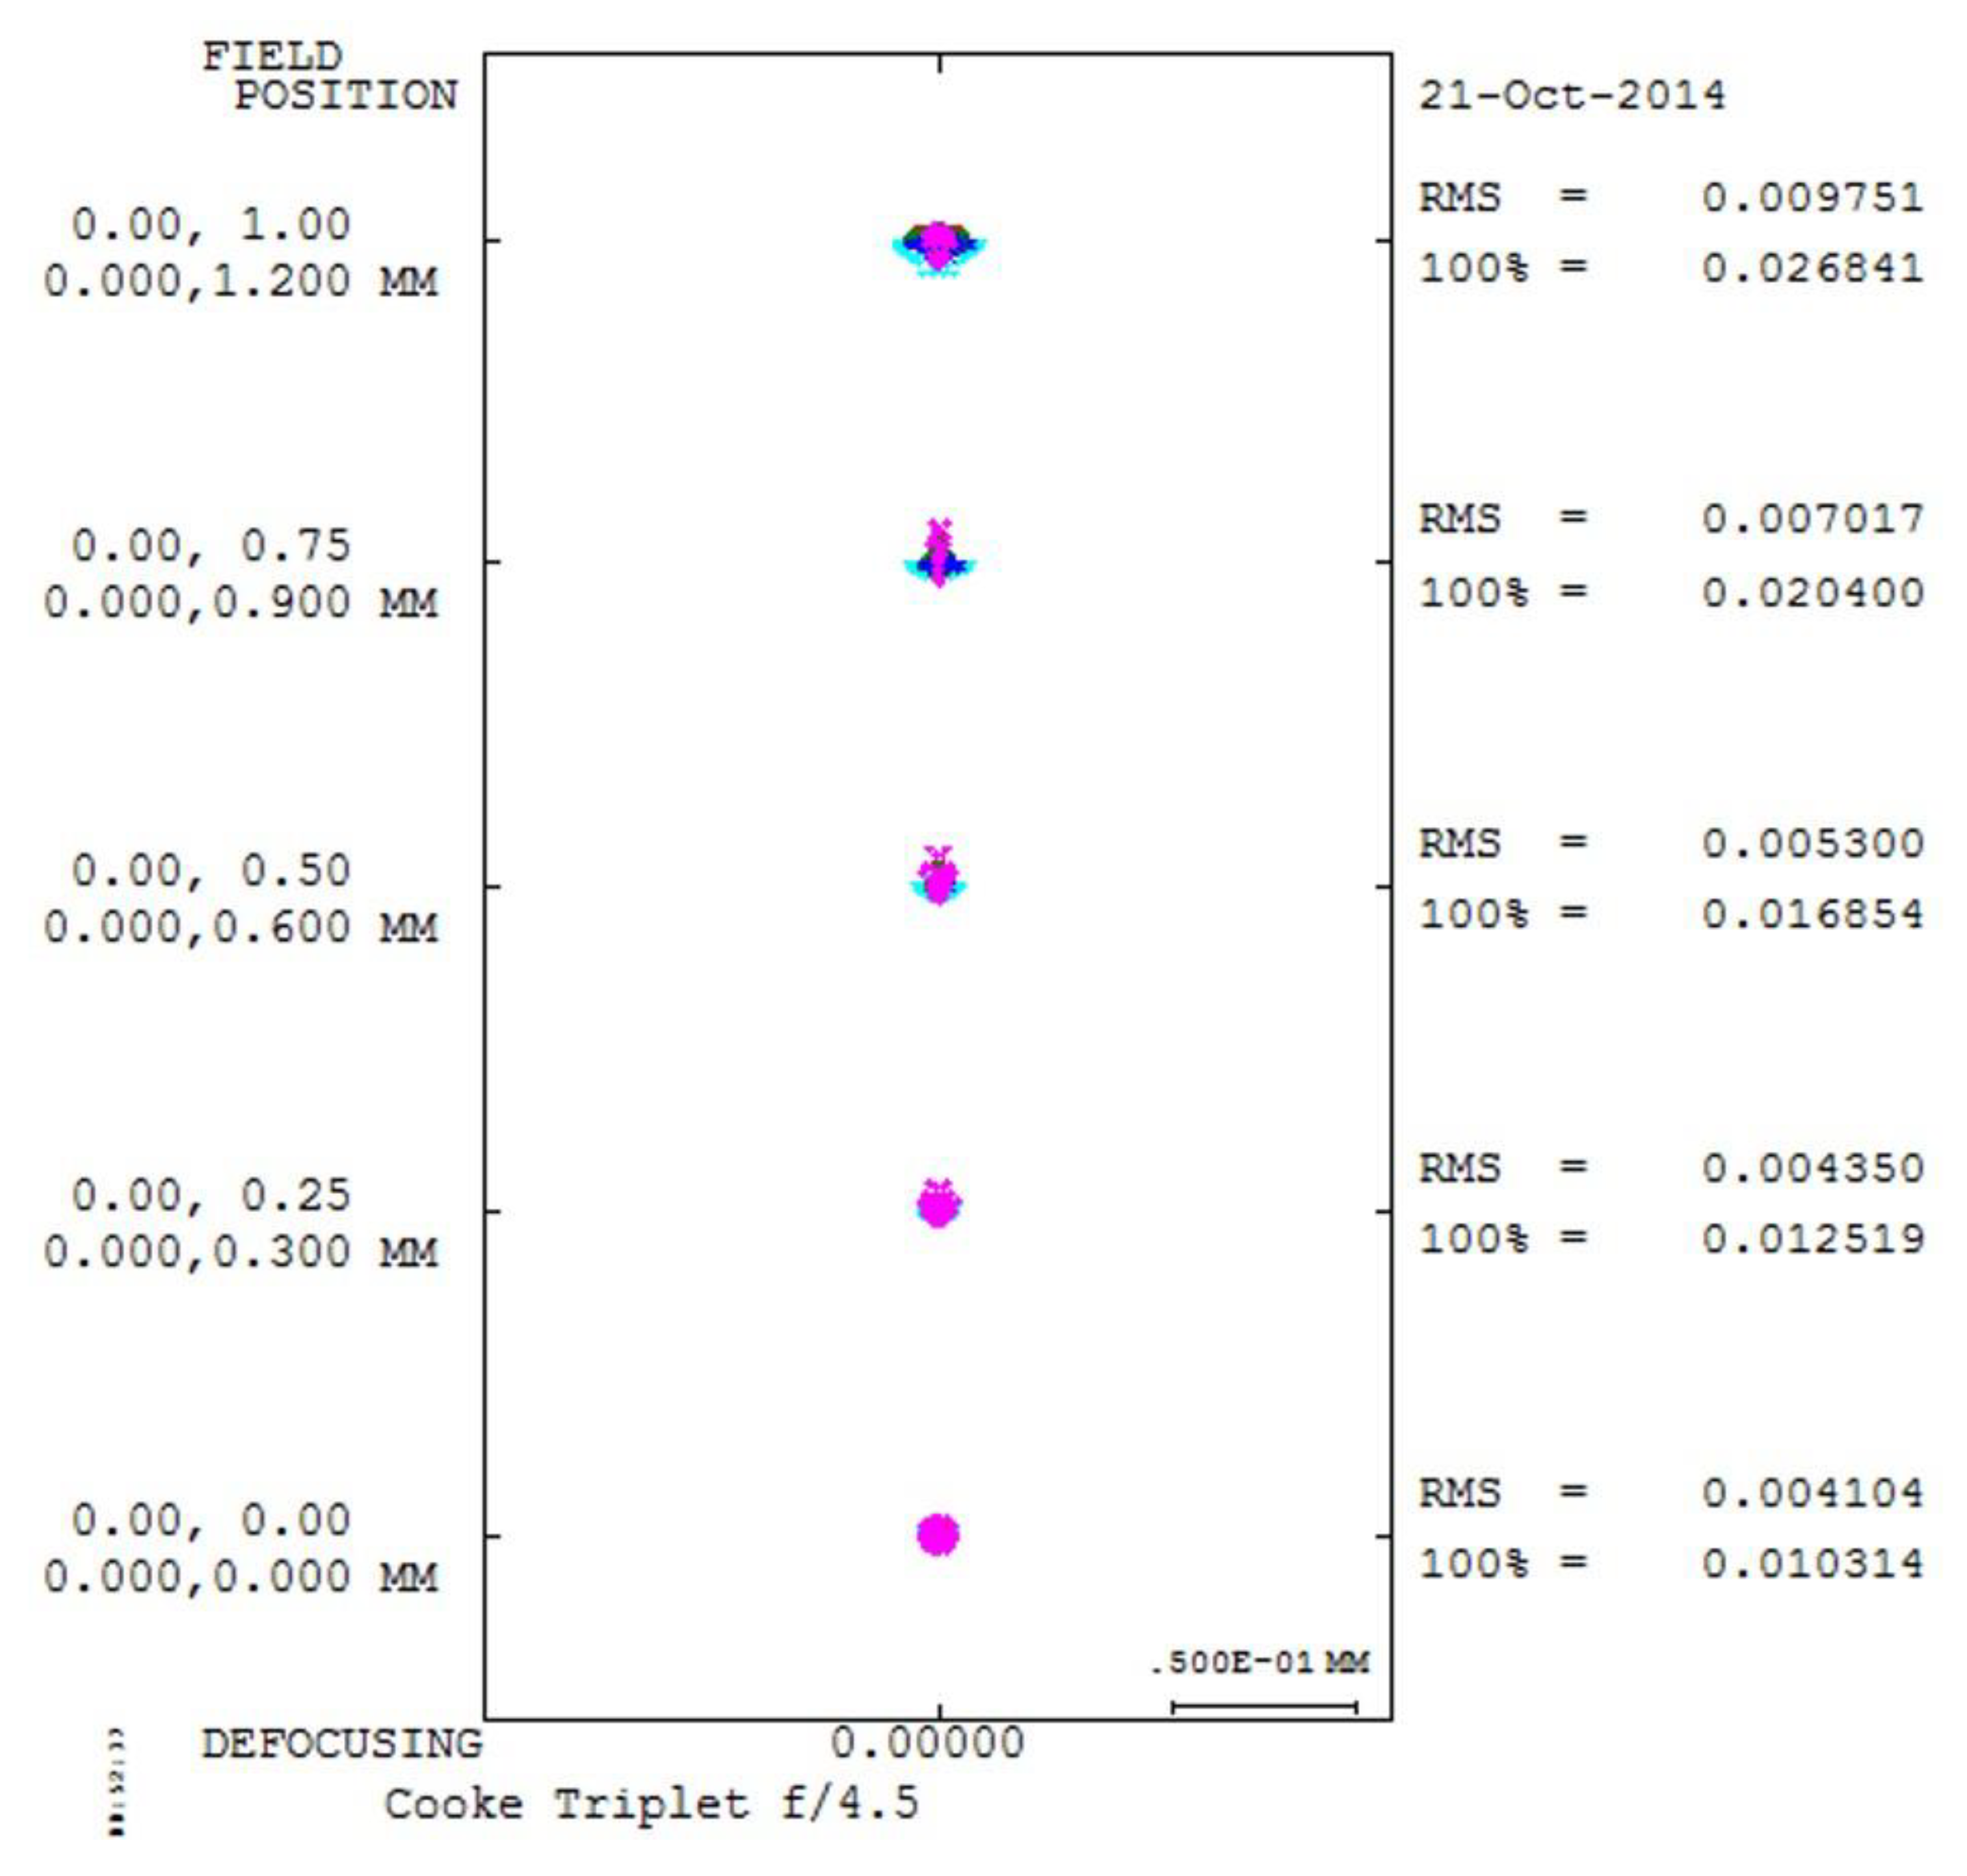
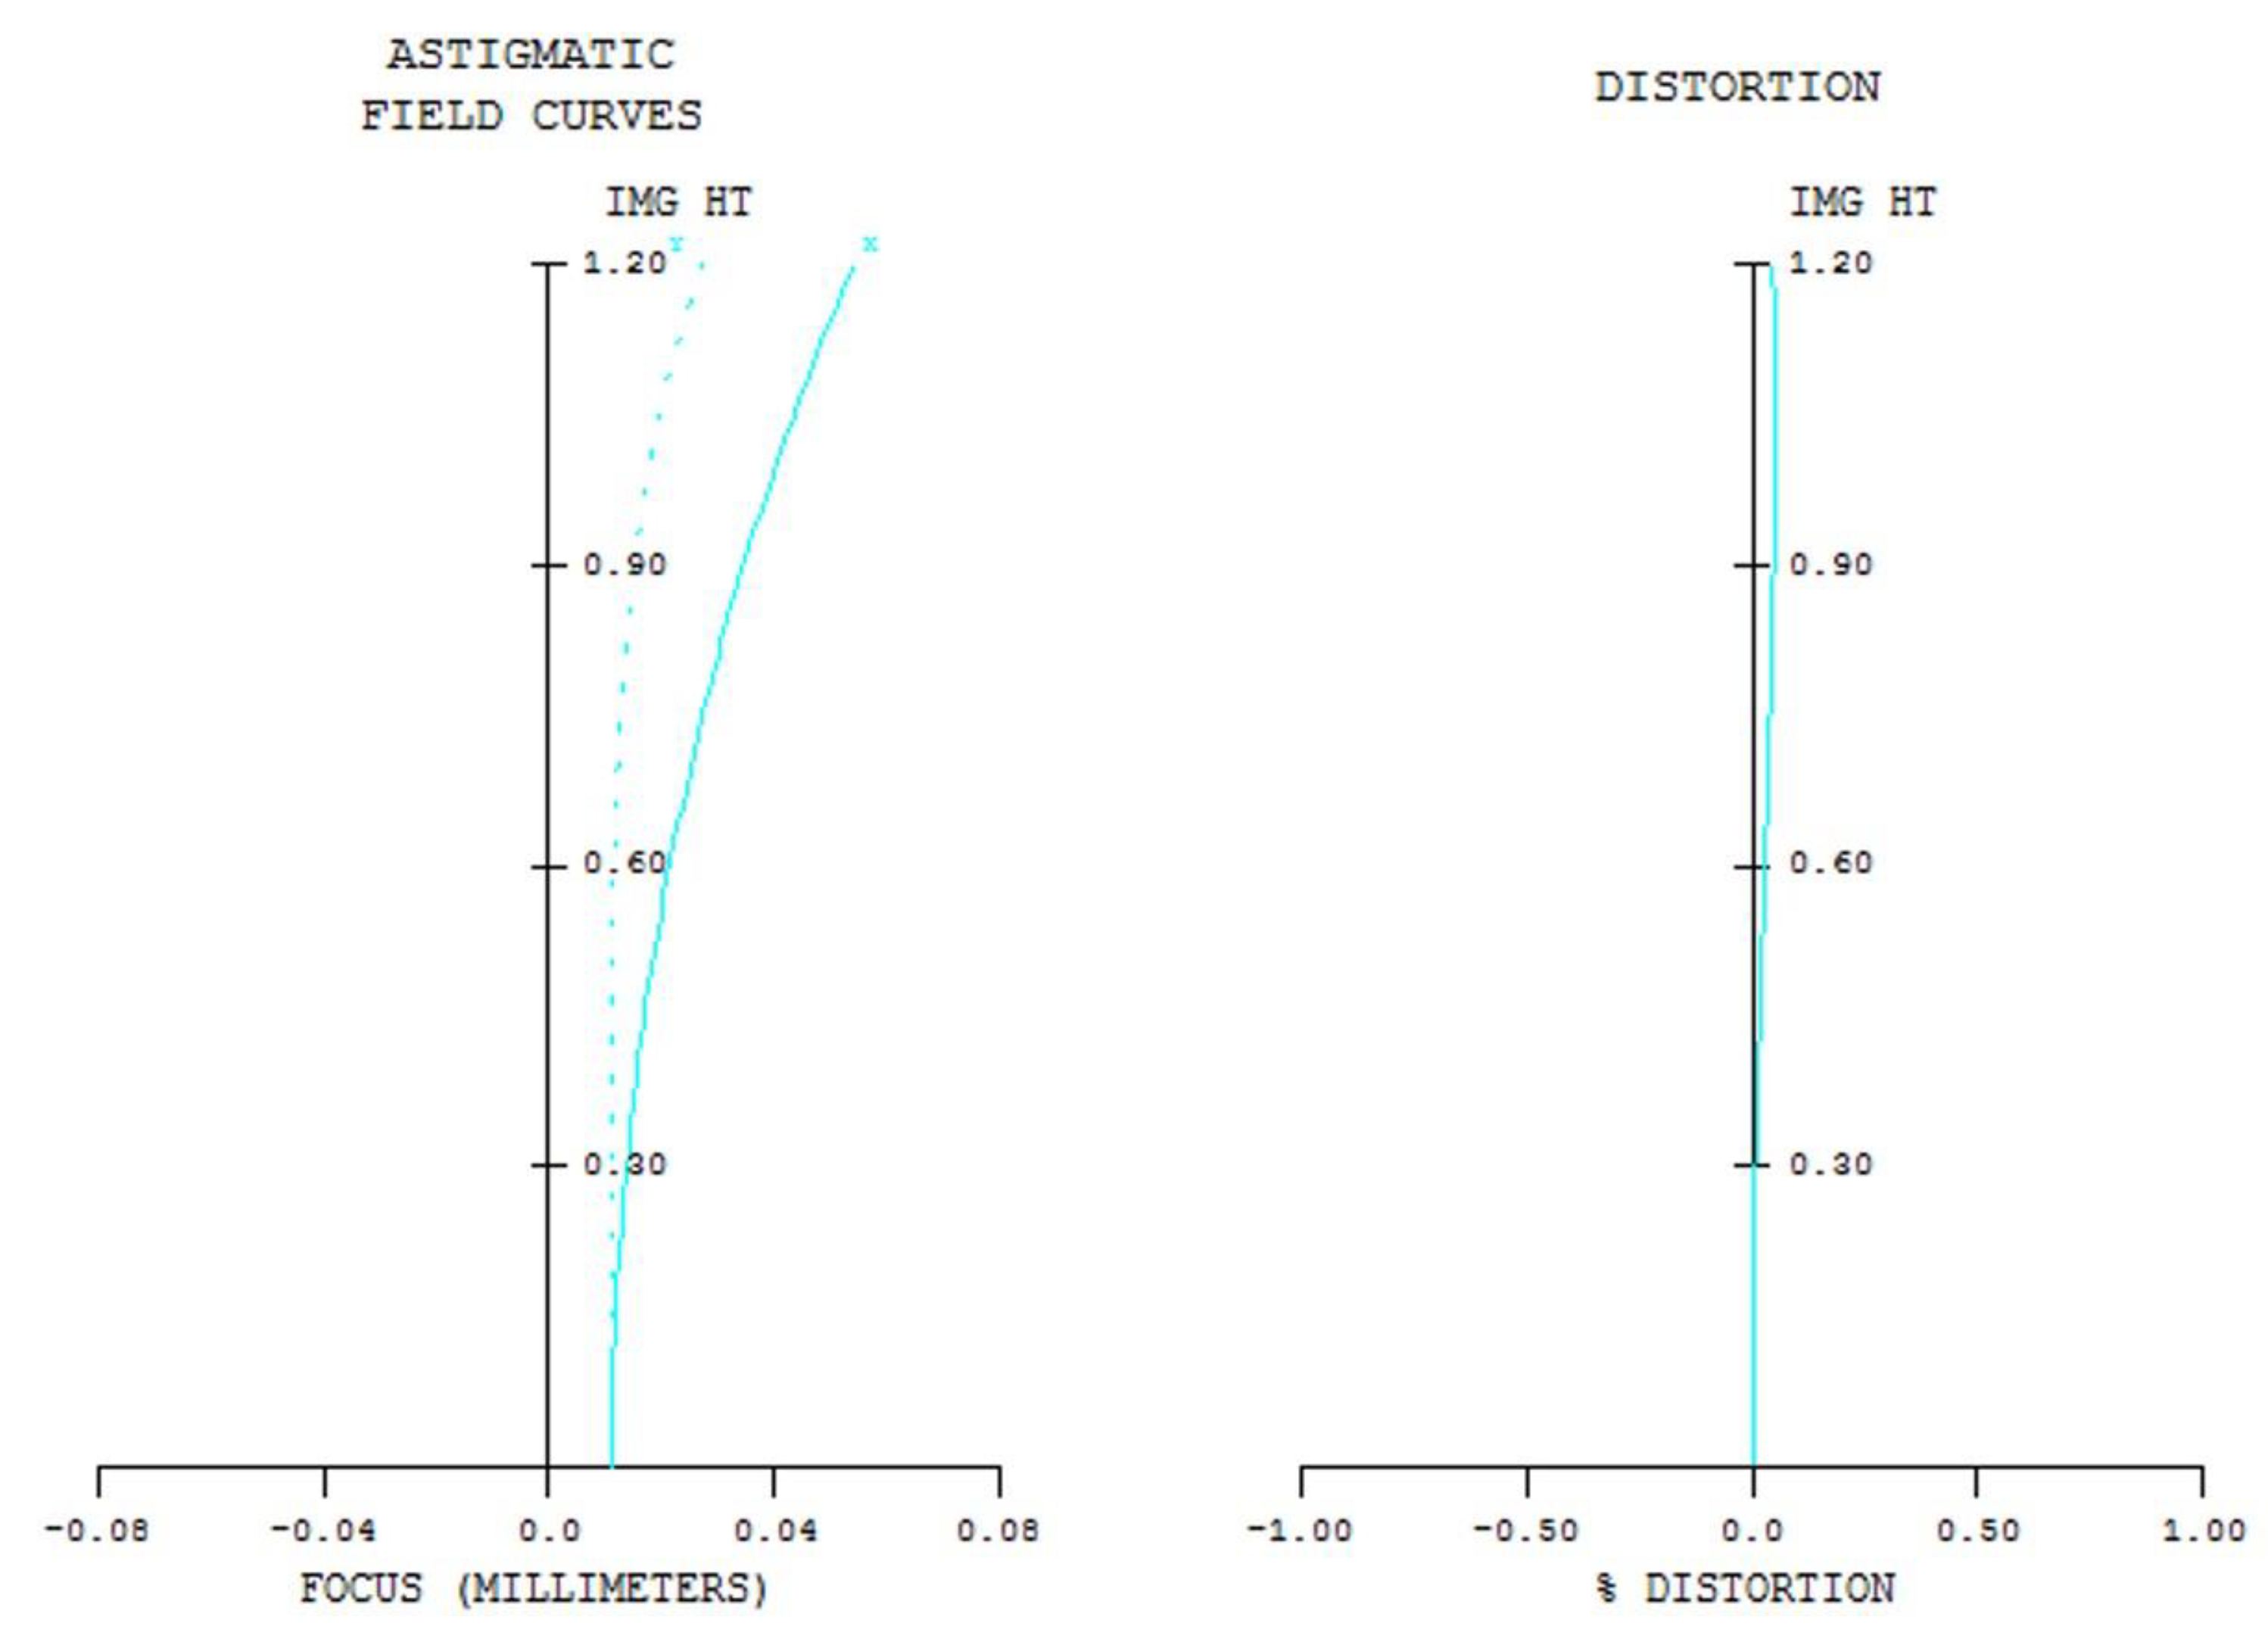
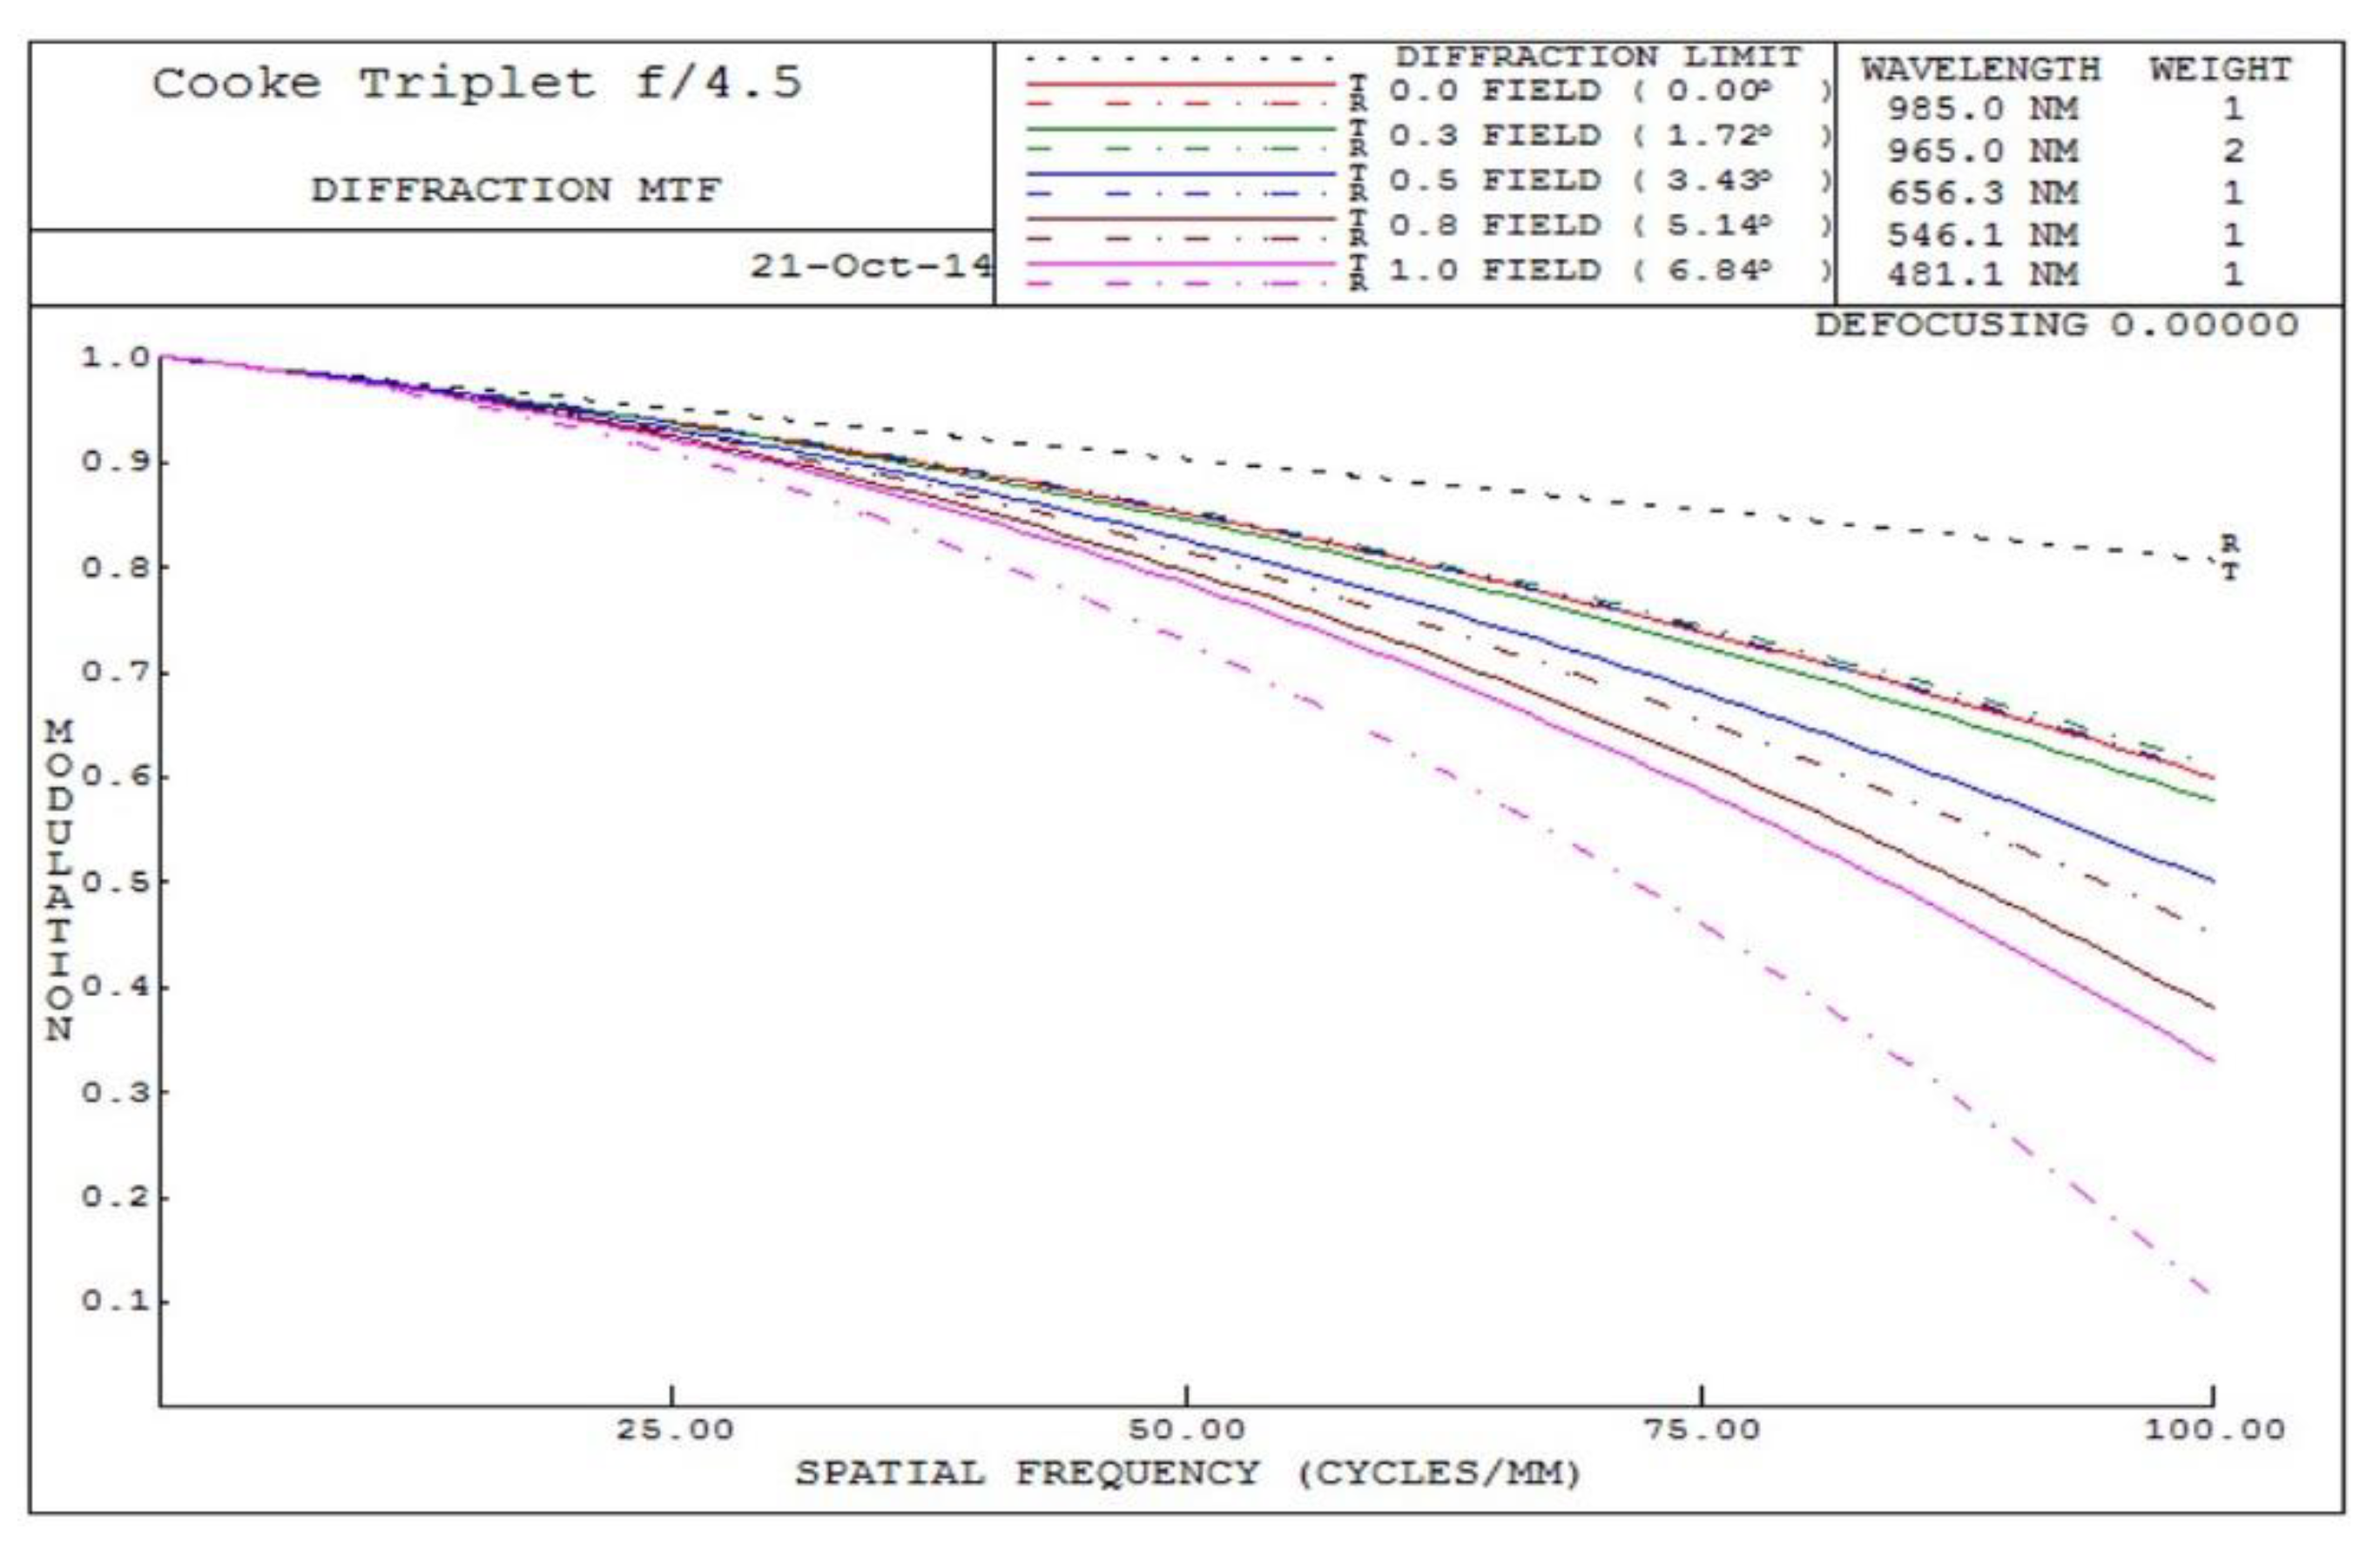
3.2. Imaging Performance Assessment (Spots, Visual Field Diagrams, Aberrations, Modulation Transfer Function)

We employ the optical software CODE V, a professional optical design software from the 1980s, to design the lens and implement the simulation. The CODE V is well-known for its accuracy of pupil grid function so that CODE V is able to predict pupil curve so precisely compared to other software. The important is that pupil curve directly reflect the aberrations of whole system except chromatic aberrations. Other software without precise description of CODE V might provide higher MTF because its pupil is close to perfect circle, which is simply a placebo. Besides, CODE V is very powerful with regard to optimization and extended optimization. LightTool is a non-image optimization software based on CODE V’s optimization engine, which started from 2000. LightTool is different from traditional non-image optical software ASAP. LightTool is great for optimization but ASAP takes advantage of light tracking analysis.
The imaging qualities of a right angle prism fixed focal optical design system are as shown in Figure 4, Figure 5, Figure 6 and Figure 7. Images with Modulation Transfer Function (MTF) less than 20% at specific spatial frequencies will be no longer visible to the human eye if there is no electric noise available such as film camera. Image system with Complementary Metal-Oxide-Semiconductor (CMOS) or other electric sensor might require up to MTF 40% in order to guarantee that target at that specific spatial frequency is visible due to inherent electric noise. That’s the reason why the 20% to 40% MTF is suggested, which depends on noise level of electric detector. Human eyes might detect higher frequencies in some cases. However, this kind of miniature lens employed in this case has its limitation up to 20% to 40% at 100 lp/mm according to some experiments. Their performance is limited due to chromatic aberrations, total length restriction, and actual front and rear size. The reason given is that very few plastic optical materials could be selected for this kind of optical design so that its MTF performance might be limited.
In Figure 4, we see that lateral color aberration, coma aberration, and astigmatism aberration play a role at the full field, although the diameter of spot diagram has been reduced to the minimum. The reason why the performance of the edge field image is not as good as the central image is given: first, the aperture stop of this lens is at the front of prism in order to get the telecentric effect, which is critical for digitalized image system. This kind of optical design might complicate the aberrations so that it is very difficult to minimize the three aberrations mentioned above. More elements have to be added if aberrations are to be further eliminated. However, the overall length of this lens is limited so that there is no room for more elements.
Distortion has been well controlled, as shown in Figure 5. Generally speaking, 2% of distortion is maximum for human vision. In this case, the distortion is under 0.20%. With regard to field curvature, it will be balanced with astigmatism so that both have to be evaluated by modulation transfer function (MTF) in Figure 6. The minimum MTF requirement of this lens will be 40% at 40 lp/mm and the ideal performance will be 20% at 100 lp/mm. According to simulated diffraction MTF, it is concluded that our MTF surpasses the minimum requirements of this kind optical design so all MTF pass the ideal MTF requirement except full field. At full field, astigmatism combined with field curvature appears, which reflects that this optical element for this design is not sufficient to reach ideal performance. Three reasons are given: firstly, the restricted overall length of the optics. Secondly, there is a very wide range of spectrum, from 481 nm to 985 nm. The wider the optical spectrum is, the more difficult optical design will be. Thirdly, according to the wavelength weight in Figure 6, most credit of optical element has been assigned to eliminate chromatic aberration. Without a sufficient optical element, it is not possible to obtain perfect optics. In conclusion, this optical design is close to ideal performance (roughly equivalent to diffraction limitation of optics).
From Figure 7, we can conclude that this lens suffers severe lateral color aberration and astigmatism, which might be inherent in such optical designs with prism and location of aperture stop at first place and whose working spectrum is from 483 nm to 985 nm. We believe that the optical design in this paper is close to ideal performance. Further improvement will be dependent on the discovery of new optical materials and power optimization software.

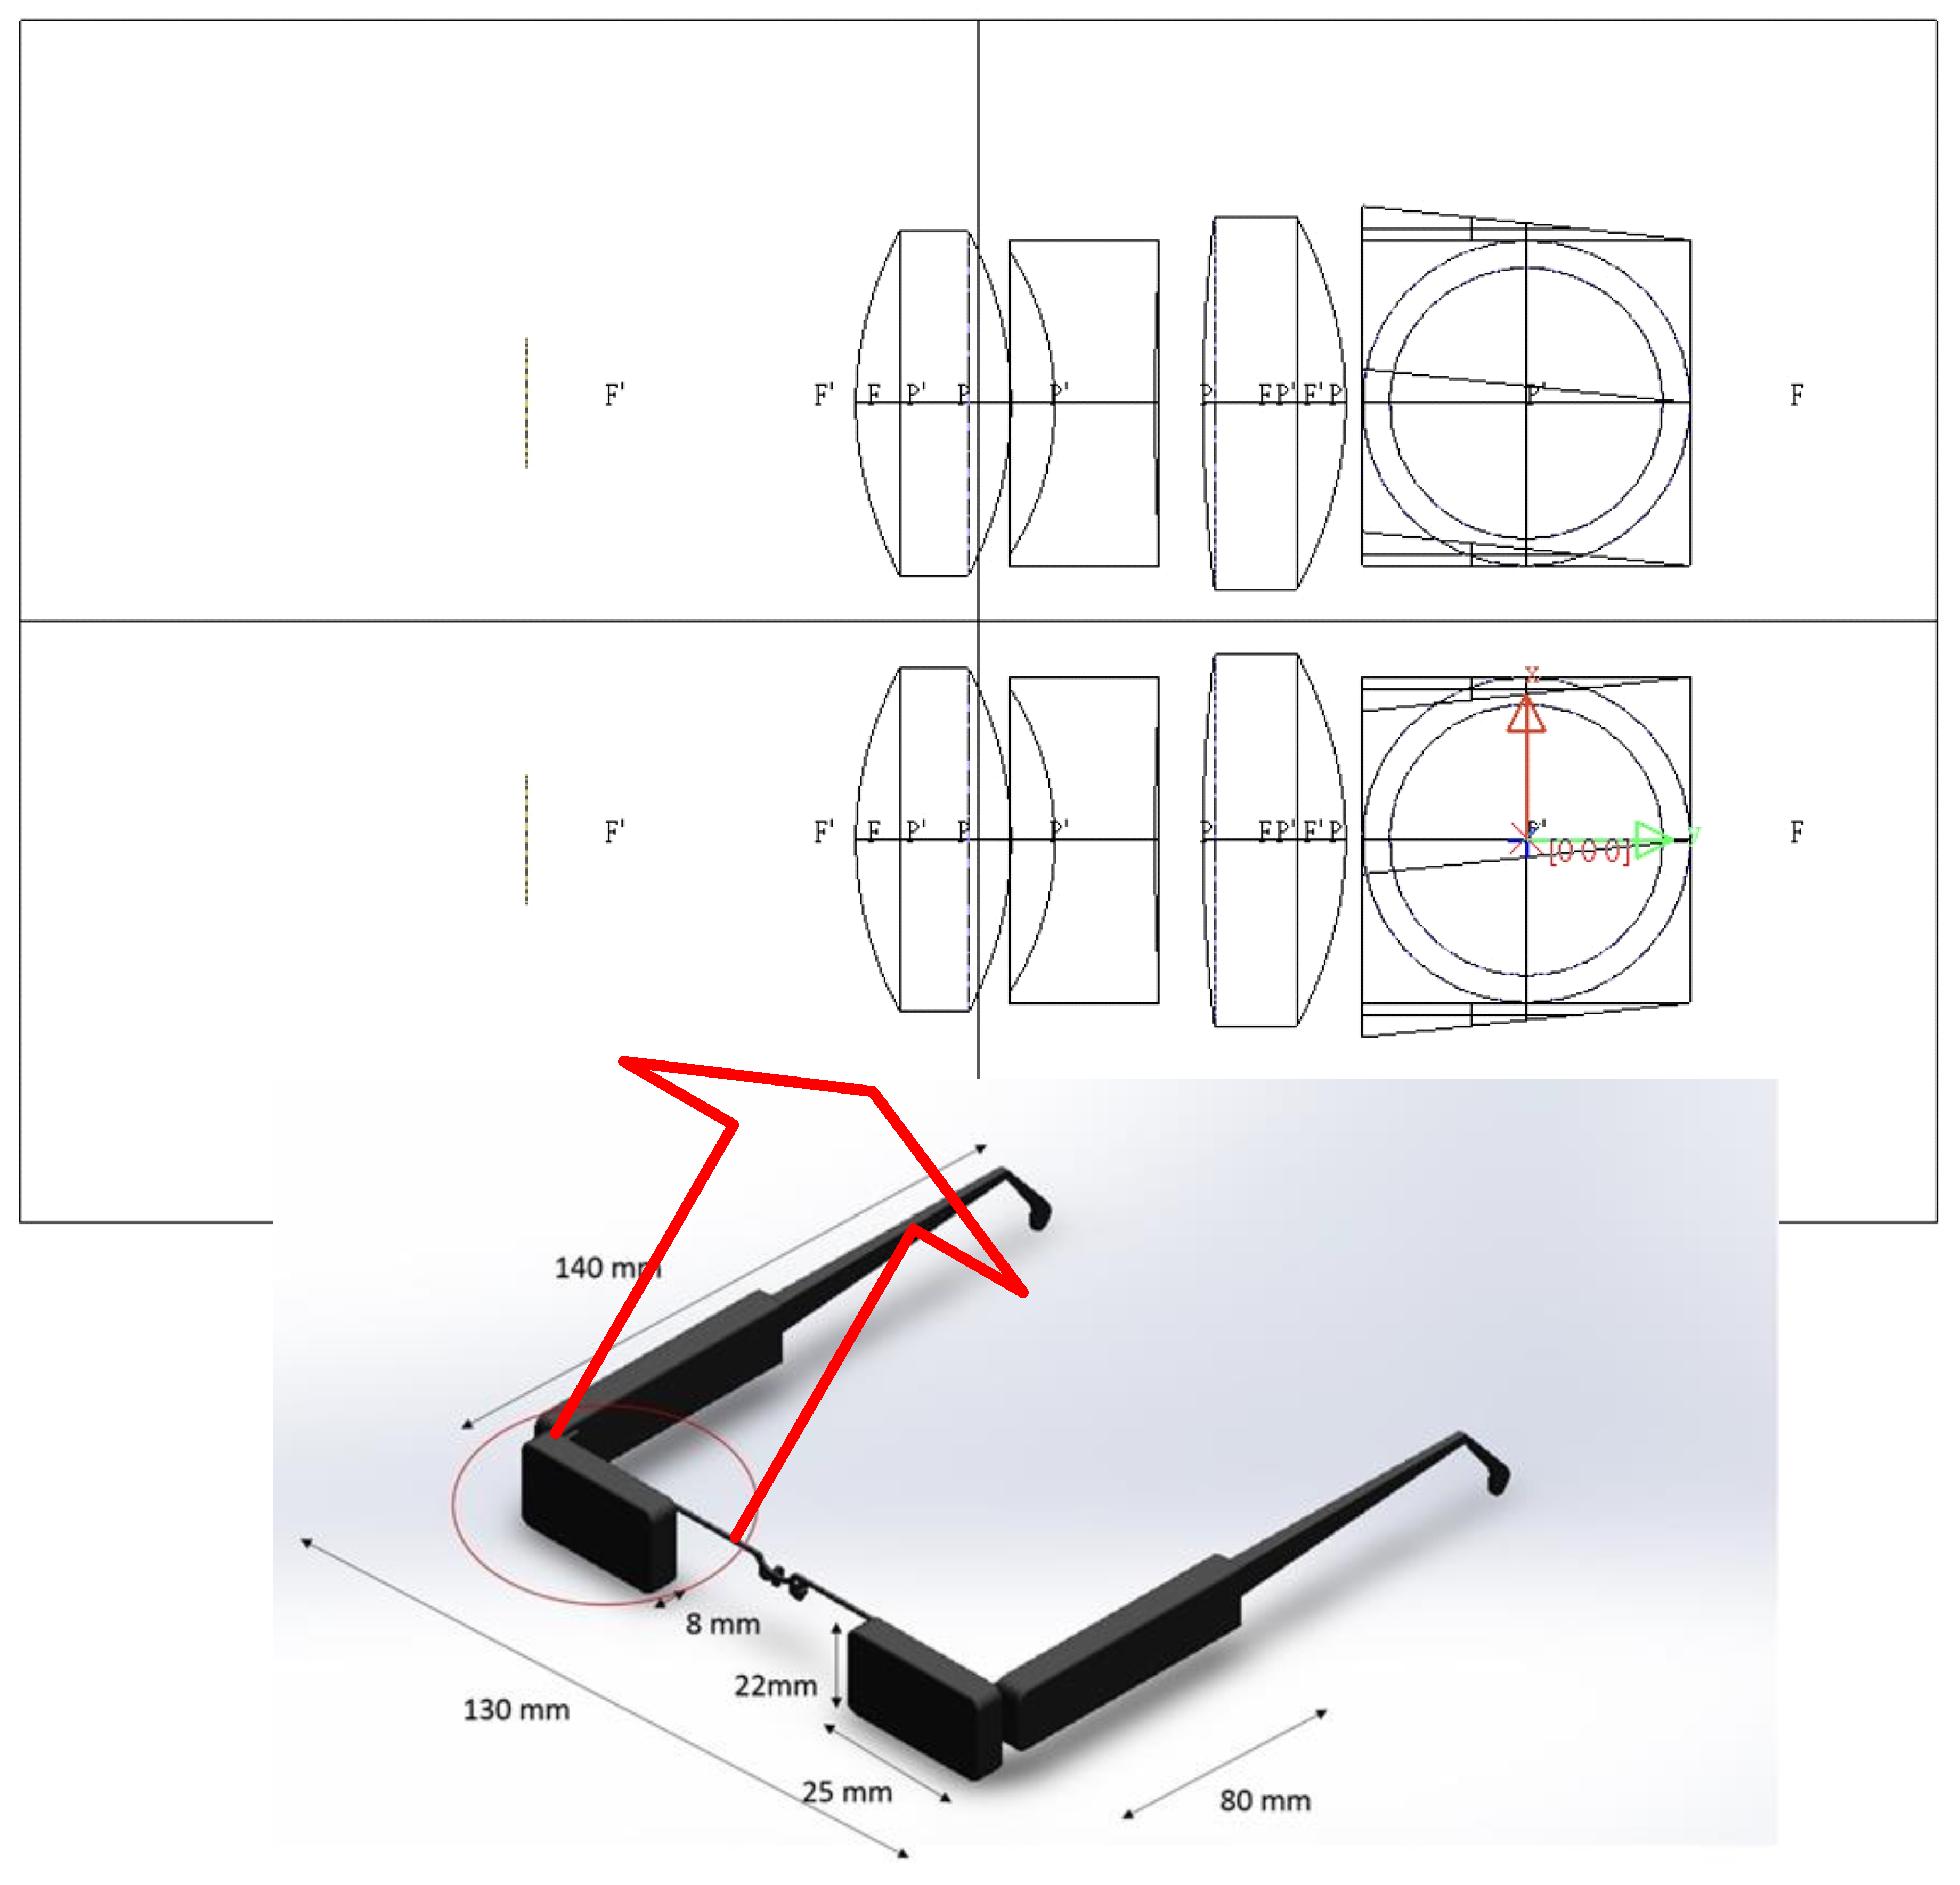
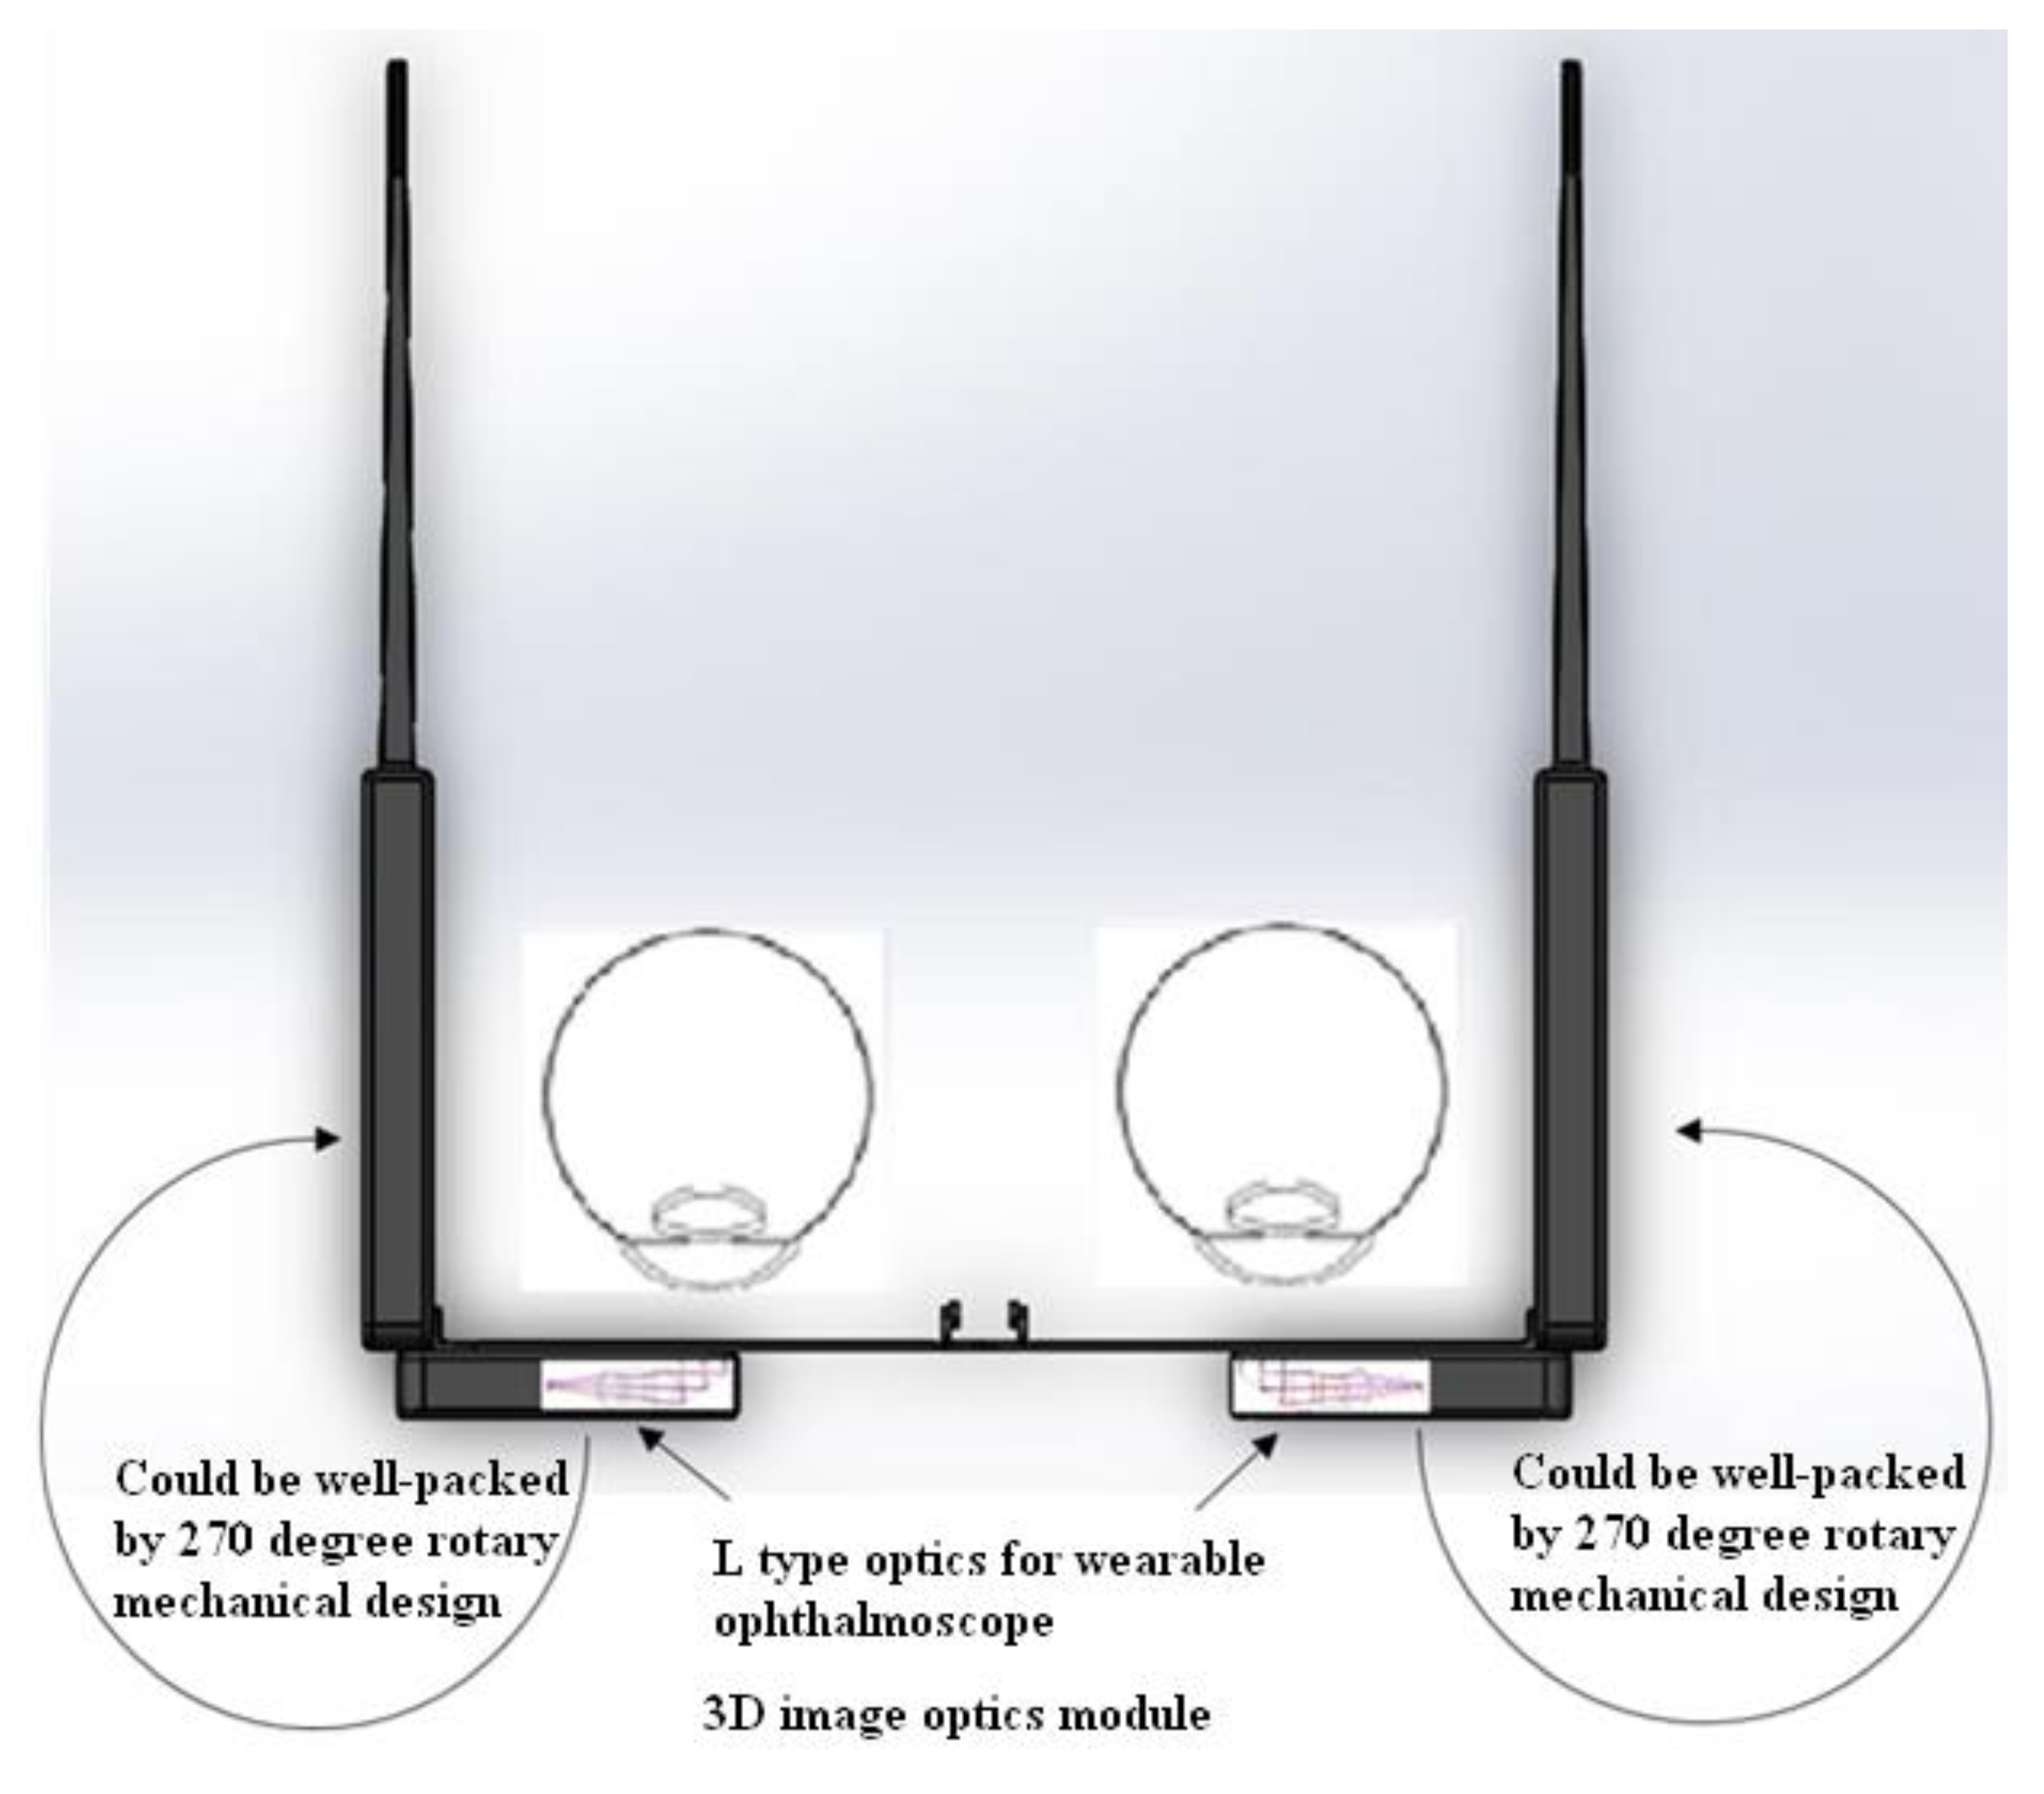
3.3. 3D Image-Taking Structure Design

In order to create 3D stereoscopic effects when the doctor views the images of the eye fundus through an 8K computer screen, the positional relationship of the fundus image screen presented to the doctor’s eyes has to be consistent with the positional relationship of the patient’s eye fundus when using the 3D image-taking lenses, as shown in Figure 8. The normal distance between the doctor’s eyes and the computer is 300 mm, resulting in an image depth of 0.5 mm. According to the “Stereo-image design for flat-screen” proposed by Liu [11] in 2001, the angles of 3D image-taking are presented. After shrinking the scale of the human eye computer-viewing distance, usage and other things, the simulation of the lenses shooting the image of the eye fundus would compute the structural relationship of “the human eye toward the computer” and the “lenses toward the eye fundus.”
The imaging optics software Code V was used to complete the lens group design, and the non-imaging simulation optics software of Light Tools was inserted to simulate the two groups of lens modes, the angle, and the distance of the 3D structure. Figure 9 shows a schematic of the established 3D optical mechanism.

4. Conclusions and Recommendations

This study establishes an ophthalmoscope system that integrates the cloud and big data with a wearable-type ophthalmoscope, double working spectrum, and 3D image-taking technology in the same hardware design. This design allows patients to transfer the captured images to their ophthalmic hospital via the cloud method using big data, thus shortening the diagnosis time and increasing doctors’ basis for diagnosis. Currently, the main research outcomes are as follows:
(1)
Image recognition experiment: The 3D image recognition rate (90%) was higher than the 2D image recognition rate (84%); this reached obvious significance and, thus, the 3D mechanism design was selected.
(2)
A glasses-type 3D ophthalmoscope lens mechanism design: A wearable ophthalmoscope with 3D image-taking features and visible-infrared working spectrum was developed. These features are suitable for the diagnostic tracking of eye fundus’ imaging using a rotatable mechanism via a 3D optical structure design.
(3)
Ophthalmoscope lens design: Using imaging simulation technology, a set of ophthalmoscope lenses was designed to fit a glasses-type 3D ophthalmoscope; then, with the mechanism design, the specifications of wearable ophthalmoscope glasses were significantly reduced.
(4)
This proposed design and its mechanism can be connected with wireless networks, Bluetooth, or a cloud processing system in order to transfer the diagnostic images to the hospital and assist in the doctors’ diagnosis via cloud technology and big data statistics.
Optical zoom employed in wearable glasses will be in even higher demand in the future. The relay lens can be adapted to invert the images in the position of the glasses frame and will provide sufficient space to accommodate zoom optics, which may be three times larger than fixed focal optics.

Author Contributions

C.-M.T. and Y.C.F. conceived and designed the experiments; N.-W.H. and C.-W.L. performed the experiments. T.-C.K. analyzed the data. Y.C.F. contributed reagents/materials/analysis tools. Y.C.F., C.-M.T., N.-W.H. and C.-W.L. wrote the paper.

Acknowledgments

The authors wish to thank the anonymous reviewers for their valuable suggestions. This study was supported by the Ministry of Science and Technology (MOST) of Taiwan under Contract No.: MOST 107-2221-E-005-050.

Conflicts of Interest

The authors declare no conflict of interest.

References

  1. Meadway, A.; Girkin, C.A.; Zhang, Y.H. A dual-modal retinal imaging system with adaptive optics. Opt. Express 2013, 24, 29792–29807. [Google Scholar] [CrossRef] [PubMed]
  2. Felberer, F.; Kroisamer, J.S.; Hitzenberger, C.K.; Pircher, M. Lens based adaptive optics scanning laser ophthalmoscope. Opt. Express 2012, 16, 17297–17310. [Google Scholar] [CrossRef] [PubMed]
  3. Wu, B.W. Optical computing for application to reducing the thickness of high-power-composite lenses. Appl. Opt. 2014, 53, H7–H13. [Google Scholar] [CrossRef] [PubMed]
  4. Sun, J.H. Tolerance reallocation of an optical zoom lens to meet multiperformance criteria. Appl. Opt. 2014, 53, 233–238. [Google Scholar] [CrossRef] [PubMed]
  5. Fairhurst, A.M.; Lettington, A.H. The effect of visual perception on the required performance of imaging systems. J. Mod. Opt. 2000, 8, 1435–1446. [Google Scholar] [CrossRef]
  6. Fairhurst, A.M.; Lettington, A.H. Method of predicting the probability of human observers recognizing targets in simulated thermal images. Opt. Eng. 1998, 3, 744–751. [Google Scholar] [CrossRef]
  7. Wu, B.W.; Fang, Y.C.; Chang, L.S. Studies of Human Vision Recognition: Some Improvements. J. Mod. Opt. 2009, 57, 107–114. [Google Scholar] [CrossRef]
  8. Fang, Y.C.; Wu, B.W. Prediction of the Thermal Imaging Minimum Resolvable (Circle) Temperature Difference with Neural Network Application. IEEE Trans. Pattern Anal. Mach. Intell. 2008, 30, 2218–2228. [Google Scholar] [CrossRef] [PubMed]
  9. Yust, B.G.; Mimun, L.C.; Sardar, D.K. Optical absorption and scattering of bovine cornea, lens, and retina in the near-infrared region. Lasers Med. Sci. 2011, 2, 413–422. [Google Scholar] [CrossRef] [PubMed]
  10. Cohen, J. Statistical Power Analysis for the Behavioral Science; Academic Press: New York, NY, USA, 1977. [Google Scholar]
  11. Liu, R.Z. Stereo-Imaging Design for Flat-Screen. Master’s Thesis, Institute of Optical Sciences, National Central University, Taoyuan, Taiwan, 2001. [Google Scholar]
Figure 1. A conceptual design: the left diagram illustrates the detailed structure inside a single-glass frame of the right diagram; that is, a single 3D image-taking module.
Applsci 09 00717 g001
Figure 2. Enclosed concept for the ophthalmoscope lens groups; 3D image-taking modules are rotated 270 degrees and enclosed in the sides of the glasses for use as ordinary glasses.
Applsci 09 00717 g002
Figure 3. Right angle prism inverted fixed focal lens simulation design.
Applsci 09 00717 g003
Figure 4. Spots diagram.
Applsci 09 00717 g004
Figure 5. Visual field diagrams.
Applsci 09 00717 g005
Figure 6. MTF curves of proposed optics.
Applsci 09 00717 g006
Figure 7. Aberration diagrams of proposed optics.
Applsci 09 00717 g007
Figure 8. Structural relationship between human eyes and 3D ophthalmoscope glasses.
Applsci 09 00717 g008
Figure 9. Schematic of the 3D optical mechanism.
Applsci 09 00717 g009
Table 1. Experimental conditions.
Display Monitor3D Television
Image type2D3D
Participant number20 people
Display duration5 s per image
Background illuminance10 cd
Distance between eyes and screen250 cm
Circular figure diameter50 cm
Table 2. Geometric figures.
roundvertical rectangle (1:3)horizontal rectangle (3:1)
Applsci 09 00717 i001 Applsci 09 00717 i002 Applsci 09 00717 i003
triangleSquarepentagon
Applsci 09 00717 i004 Applsci 09 00717 i005 Applsci 09 00717 i006
hexagon
Applsci 09 00717 i007
Table 3. Low contrast variations.
2%4%6%
Applsci 09 00717 i008 Applsci 09 00717 i009 Applsci 09 00717 i010
8%10%20%
Applsci 09 00717 i011 Applsci 09 00717 i012 Applsci 09 00717 i013
Table 4. Spatial frequency variations.
0.91.11.2
Applsci 09 00717 i014 Applsci 09 00717 i015 Applsci 09 00717 i016
1.51.82.5
Applsci 09 00717 i017 Applsci 09 00717 i018 Applsci 09 00717 i019
3.75.4
Applsci 09 00717 i020 Applsci 09 00717 i021
Table 5. Test of effects.
Image TypeNMSDT (s)pη2
3D20302.05011.5872.7510.0090.166
2D20281.85030.720
Table 6. Right angle prism inverted fixed focal system specifications.
Initial Conditions of Design
Image Height2.4 mm
Source wavelengthPhotonic 5 with 481, 546, 656, 965, 985 nm
Focal Length10 mm
Magnification 2.5x
F/#2.0
Overall Length 20 mm
Optical Distortion <3%
MTF>20–40% (100 lp/mm)

