Article

Reservoir Computing Based Echo State Networks for Ventricular Heart Beat Classification

Faculty of Computer Science and Information Technology University of Malaya, Kuala Lumpur 50603, Malaysia
*
Author to whom correspondence should be addressed.
Appl. Sci. 2019, 9(4), 702; https://doi.org/10.3390/app9040702
Submission received: 15 January 2019 / Revised: 1 February 2019 / Accepted: 1 February 2019 / Published: 18 February 2019
(This article belongs to the Special Issue Wearable Wireless Devices)

Abstract

:
The abnormal conduction of cardiac activity in the lower chamber of the heart (ventricular) can cause cardiac diseases and sometimes leads to sudden death. In this paper, the author proposed the Reservoir Computing (RC) based Echo State Networks (ESNs) for ventricular heartbeat classification based on a single Electrocardiogram (ECG) lead. The Association for the Advancement of Medical Instrumentation (AAMI) standards were used to preprocesses the standardized diagnostic tool (ECG signals) based on the interpatient scheme. Despite the extensive efforts and notable experiments that have been done on machine learning techniques for heartbeat classification, ESNs are yet to be considered for heartbeat classification as a is fast, scalable, and reliable approach for real-time scenarios. Our proposed method was especially designed for Medical Internet of Things (MIoT) devices, for instance wearable wireless devices for ECG monitoring or ventricular heart beat detection systems and so on. The experiments were conducted on two public datasets, namely AHA and MIT-BIH-SVDM. The performance of the proposed model was evaluated using the MIT-BIH-AR dataset and it achieved remarkable results. The positive predictive value and sensitivity are 98.98% and 98.98%, respectively for the modified lead II (MLII) and 98.96% and 97.95 for the V1 lead, respectively. However, the experimental results of the state-of-the-art approaches, namely the patient-adaptable method, improved generalization, and the multiview learning approach obtained 92.8%, 87.0%, and 98.0% positive predictive values, respectively. These obtained results of the existing studies exemplify that the performance of this method achieved higher accuracy. We believe that the improved classification accuracy opens up the possibility for implementation of this methodology in Medical Internet of Things (MIoT) devices in order to bring improvements in e-health systems.

1. Introduction

According to the American Heart Association [1] and the World Health Organization [2], the mortality ratio due to heart diseases is growing rapidly in the world. It is estimated that around 17.7 million people were affected due to cardiovascular disease (CVD) in 2015. The documentation report from China in 2011 [3] disclosed the information of CVD patients, which showed the statistics that around 230 million people were suffering from CVD and that 3 million death cases were due to the CVD. Electrocardiogram (ECG) signals are a major tool which have been widely used for the analysis of heart disorders in many applications [4,5,6]. The collection of these ECG signals are based on contemporary devices which are being used to communicate with the body surface using sensors or nodes [7]. The ECG signals refers to the physical activity of the heart; either the heart has disease or an abnormal rhythm. Irregular rhythm or abnormal rhythm is also known as arrhythmia, which is the leading source of any heart disease. It is not stated that all arrhythmias are dangerous, however it requires therapy to avoid the severe heart diseases [8]. In recent years, many computer-assisted techniques have been proposed to classify heartbeats for arrhythmia prediction [8,9,10]. The two main aspects were considered in previous studies (1) feature extraction techniques were used to extract the morphological changes from the ECG signals and, (2) learning algorithms for the classification of heart beats. Based on the feature extraction aspect, the studies used time domain analysis [8,11,12], frequency domain analysis [13,14,15], and feature analysis based on wavelet transforms [16,17,18,19]. The most common selection of learning algorithms includes Support Vector Machines [11,12,14,20], K-nearest Neighbors [21,22], Neural Networks [19,23,24,25,26], decision trees [15,27], and deep learning [28,29,30].
With the increasing trend of contemporary ECG monitoring devices, the demands of efficient computer-assisted diagnostic methods are also increasing. These types of devices demand fully automated methods for real-time classification which requires less computational cost and can easily be adaptable for hardware. Nowadays, the concept of the Medical Internet of Things is improving the e-health systems. All of these systems require less computational cost and time-saving algorithms for classification. However, despite the extensive efforts that have been made in the previous techniques for heartbeat classification with the real-time scenarios, they often deal with a limited number of leads which are often contaminated and some of the studies are lead specific which do not perform efficiently in terms of cost and time [12].
Furthermore, inter-patient variability is the major problem in ECG signals because heart beats with the same class behave differently in patients. In the literature, most of the studies were majorly focused on simple heartbeat classification based on the single lead ECG signal. Therefore, we observed that the analysis of ECG signals are not sufficient to classify the proper heartbeats; to bridge this gap, the author proposed the patient adaptable approach template matching [31] which allows a learning algorithm to classify the heartbeat lead-specific and this method also enhances the efficiency of the algorithm to classify heartbeats from non-standard leads.
In this work, this paper proposed the Reservoir computing based echo state-network for ventricular heartbeat classification. The design of the Reservoir computing is based on a large recurrent neural network (RNN), and the main advantage of this proposed ring network is to handle real-world problems efficiently with high processing speed. This study used ESN (Echo State Networks) with non-random cyclic technique to classify the ventricular heartbeats from the physiological signals. The main advantage of this technique is that the output connections are fitted by using the simple regression technique [32] and only the network outputs are being trained [33]. The other main reason to apply Reservoir Computing Based ESNs is that it is easy to handle large real-time data and it is also adjustable to implement in medical devices, for instance, Medical IoT gadgets.

2. Materials and Methods

The workflow of our proposed methodology is illustrated in Figure 1. The signal pre-processing stage comprises of several steps, which include denoising of the ECG signals, peak detection, heartbeat segmentation, and morphological, temporal feature extraction. Finally, the model is evaluated based on the input materials (processed feature sets) by training and testing the classifier.

2.1. ECG Data Sources

The experiment was conducted based on two different databases named the American Heart Association Ventricular Arrhythmia ECG database (AHA) [34] and Massachusetts Institute of Technology-Beth Israel Hospital Supraventricular Arrhythmia database (MIT-BIH SVDB) [35]. These databases are used to train the study’s proposed classifier. On the other side, the paper used MIT-BIH arrhythmia to evaluate the performance of our proposed classifier. The list of all acronyms which are used in this study is present in Table 1 and the overall description of these above-mentioned datasets is defined in Table 2. According to the American National Standards Institute/Association for the Advancement of Medical Instrumentation (ANSI/AAMI) standards, the ECG signal recordings have annotated beats in five groups [36]: Ventricular ectopic beat (VEB), Supraventricular ectopic beat (SVEB), Fusion beat (F), Unclassified and paced beat (Q), and Non-ectopic beat (N).
However, paced beat recordings were omitted from the datasets. These annotated signal-based ECG recordings have a 30 min long duration, whereas the MIT-BIH-SVDM dataset has two types of lead recordings: the modified lead II (MLII) and V1; a few patients also have V5 and V2 instead of V1. The AHA dataset has no information about the lead recordings. Hence, this study’s methodology is based on the classification of a ventricular heartbeat. Therefore, in this paper we consider two classes of AAM/ANSI standards for our binary class models to determine the normal and abnormal beats: Supraventricular beats as normal morphology and has a label 0, whereas the ventricular beats as abnormal morphology and has a label 1.

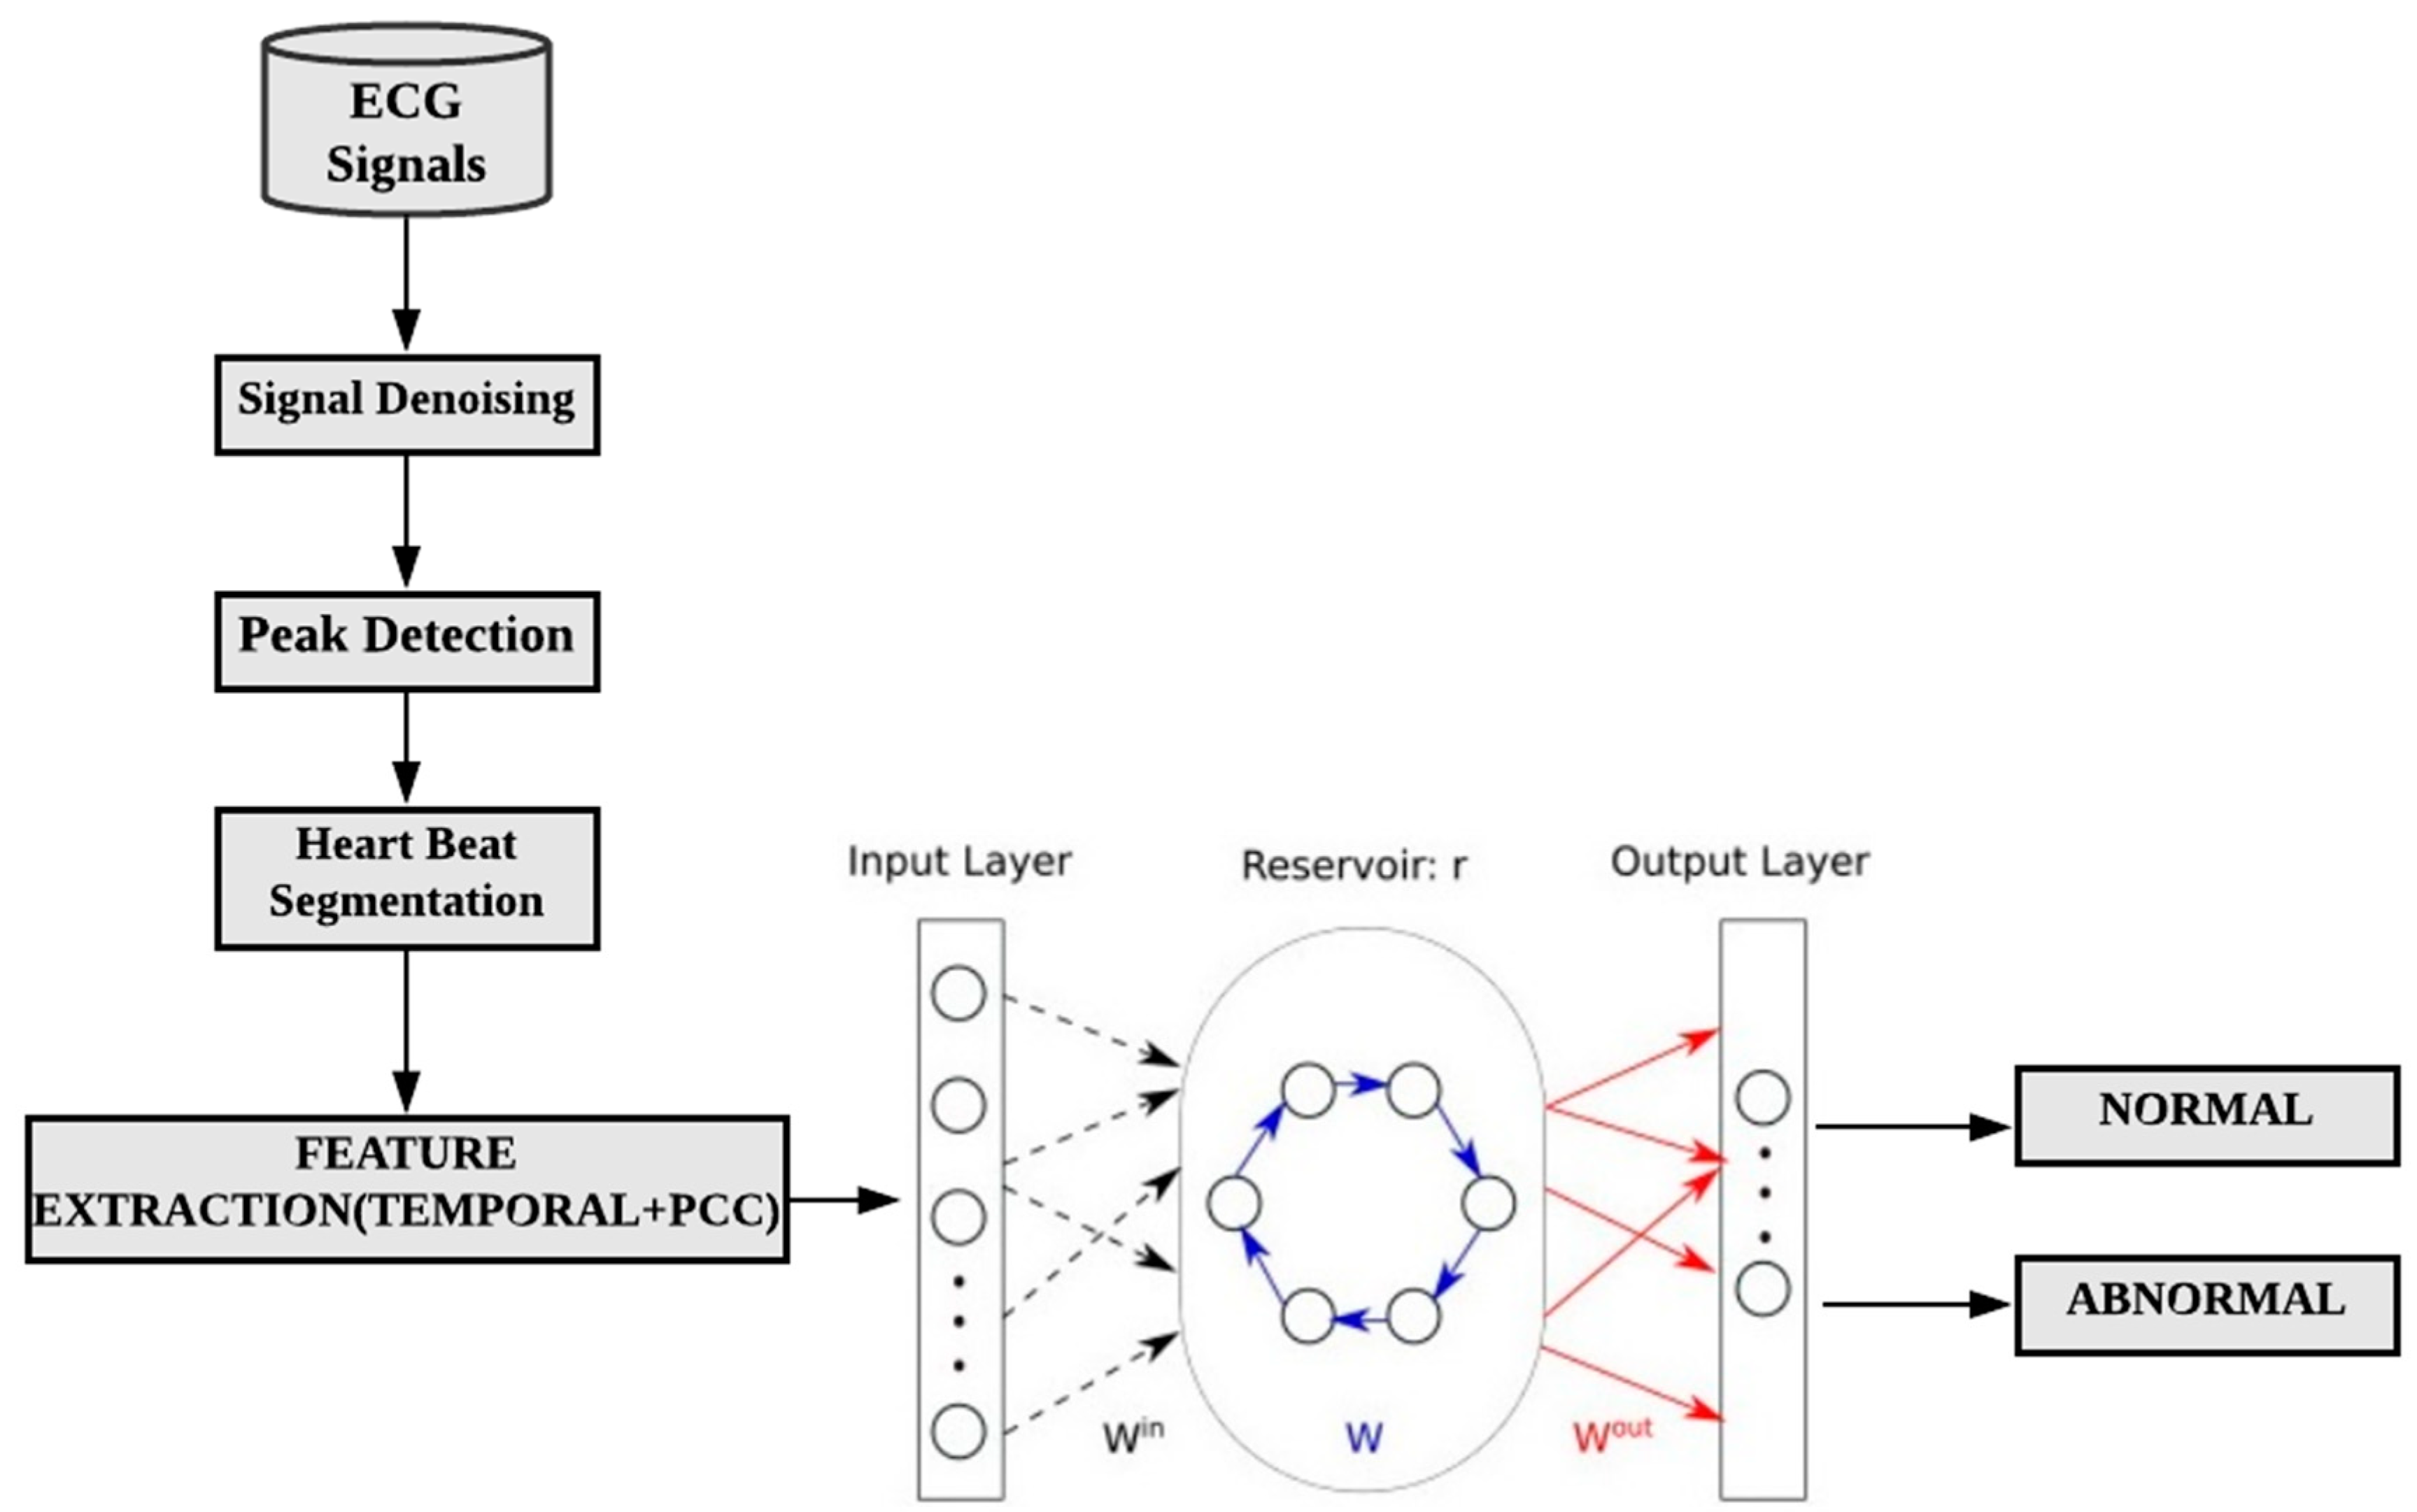
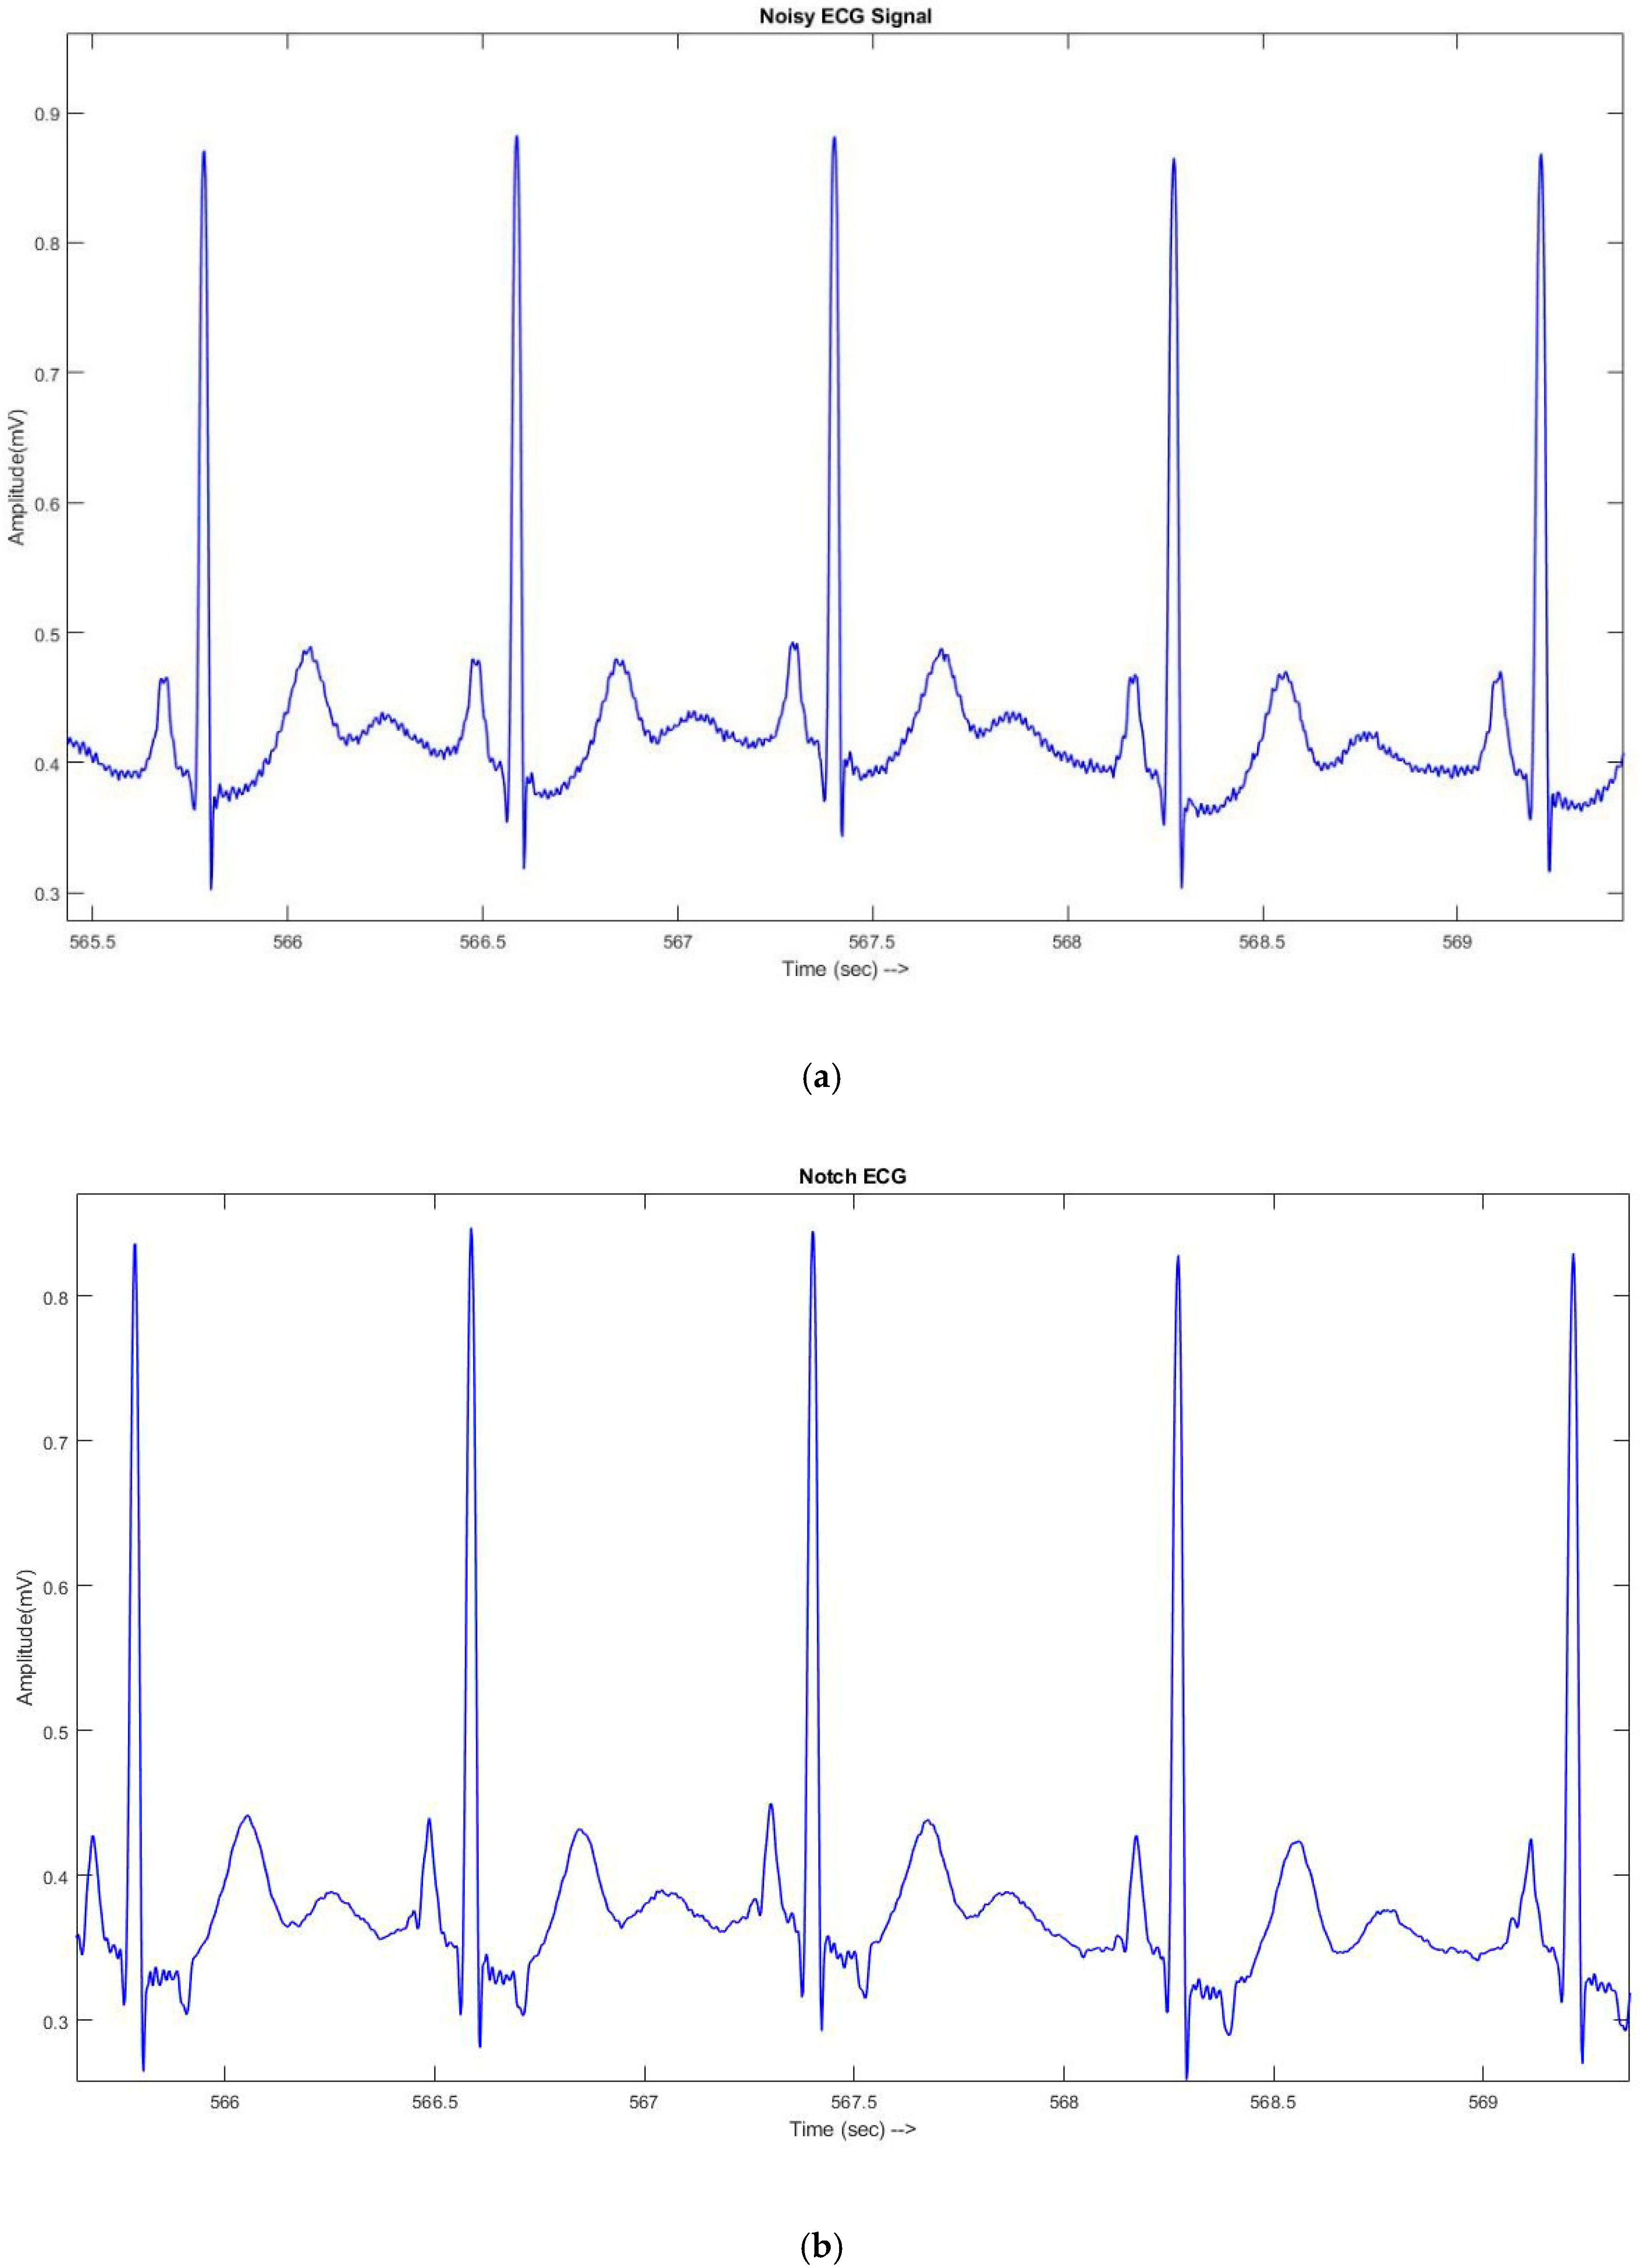
2.2. ECG Signal Preprocessing

In this study, ECG signals-based recordings are used, and these are discussed in the previous Section 2.1. The signals are collected based on the common sampling frequency rate of 360 Hz. In order to create a new feature set for input of the classifier, by using the ECG signal dataset, the following steps were conducted and summarized in Figure 1.

2.2.1. ECG Signal Denoising

The contaminated signals contain numerous kinds of noises and artifacts, for instance, baseline wanderings and power line interference. There are several reasons for contamination; sometimes it occurs due to respiration or it also occurs when the patient moves while recording the physiological signals. There are two noises that are frequently highlighted in ECG signals baseline wandering and Power line interference [37] which are caused by respiration and the variation of 50% amplitude in peak to peak due to the 50 Hz, respectively. These noises and artifacts can create a problem in the extraction of information of interest (hidden features) from the raw ECG signal. Furthermore, a corrupt ECG signal can lead to the wrong diagnosis and it also has a major effect on the performance of algorithms during classification [37,38,39].
In the literature, there are many studies that are dedicated to innovating the algorithm for the filtering of noisy physiological signals for the highest performance of proposed models, for instance [39,40], this study applies the same filtering technique as used in [8,41], and these studies also addressed the similar aim of classification. The author believes that this is the major decision that helps to evaluate the performance of the current study with the existing methods. Therefore, to bridge this gap, we used a median filter on the ECG signal (x) which had nth length. The sliding window is created for the preprocessing of signals, so the length of the ECG signal n will be represented as the length of the sliding window. For every step, the median value will be calculated by using this equation:
{ x ( i n 1 2 ) : x ( i + n 1 2 )   i f   t h e   v a l u e   o f   n   i s   o d d x ( i n 2 ) , x ( i ( n 2 ) + 1 , . , x ( i + ( n 2 ) 1 )   i f   t h e   v a l u e   o f   n   i s   e v e n  
This study used two median filters, one is for length n = 600 ms and the second one is for n = 200 ms. This study used the medfilt1 function of the Matlab [42] which implemented the one-dimensional filtering on the ECG signal. The main benefit of applying the medfilt1 function was that it eliminates the unwanted distortion from the signal.
After the application of median filters for the baseline wandering outlier’s removal, this study applied 12th order finite impulse response (low pass filter) with the given cut-off frequency k = 35 Hz for removing the outliers which are related to power line interference by using the fir1 Matlab function [43]. The clear picture based on the results of these filters is reported in Figure 2a,b.

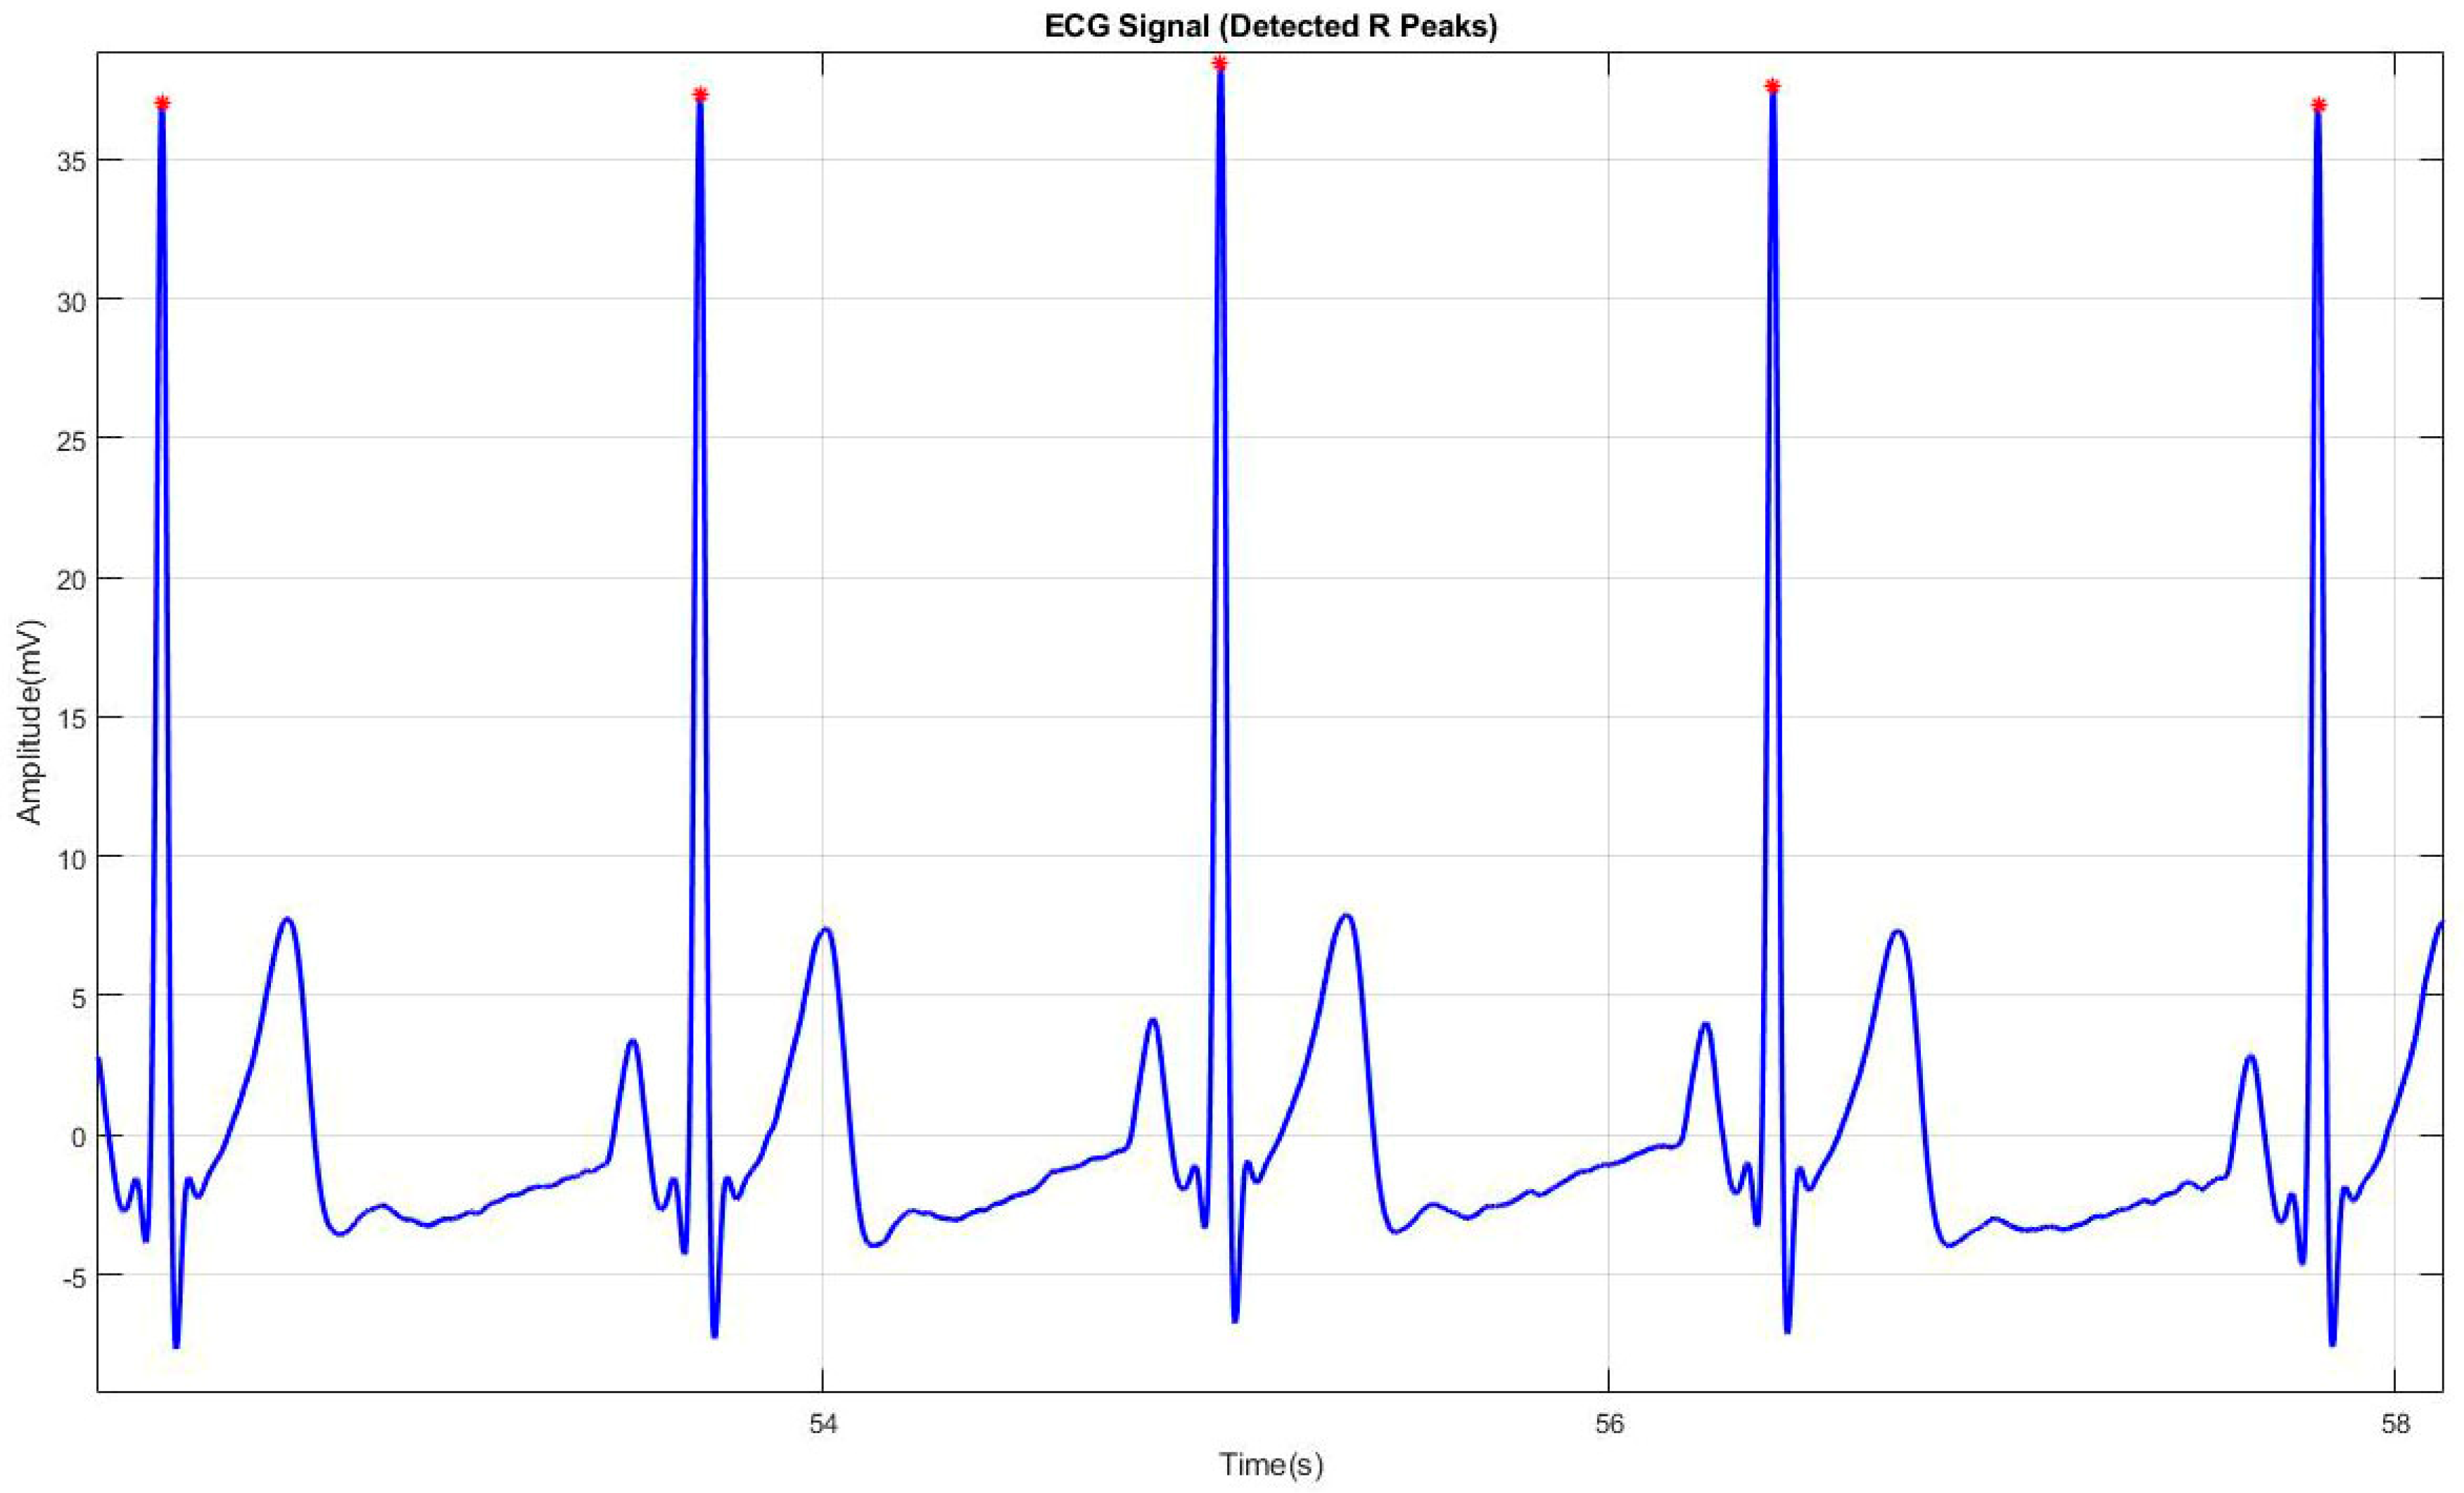
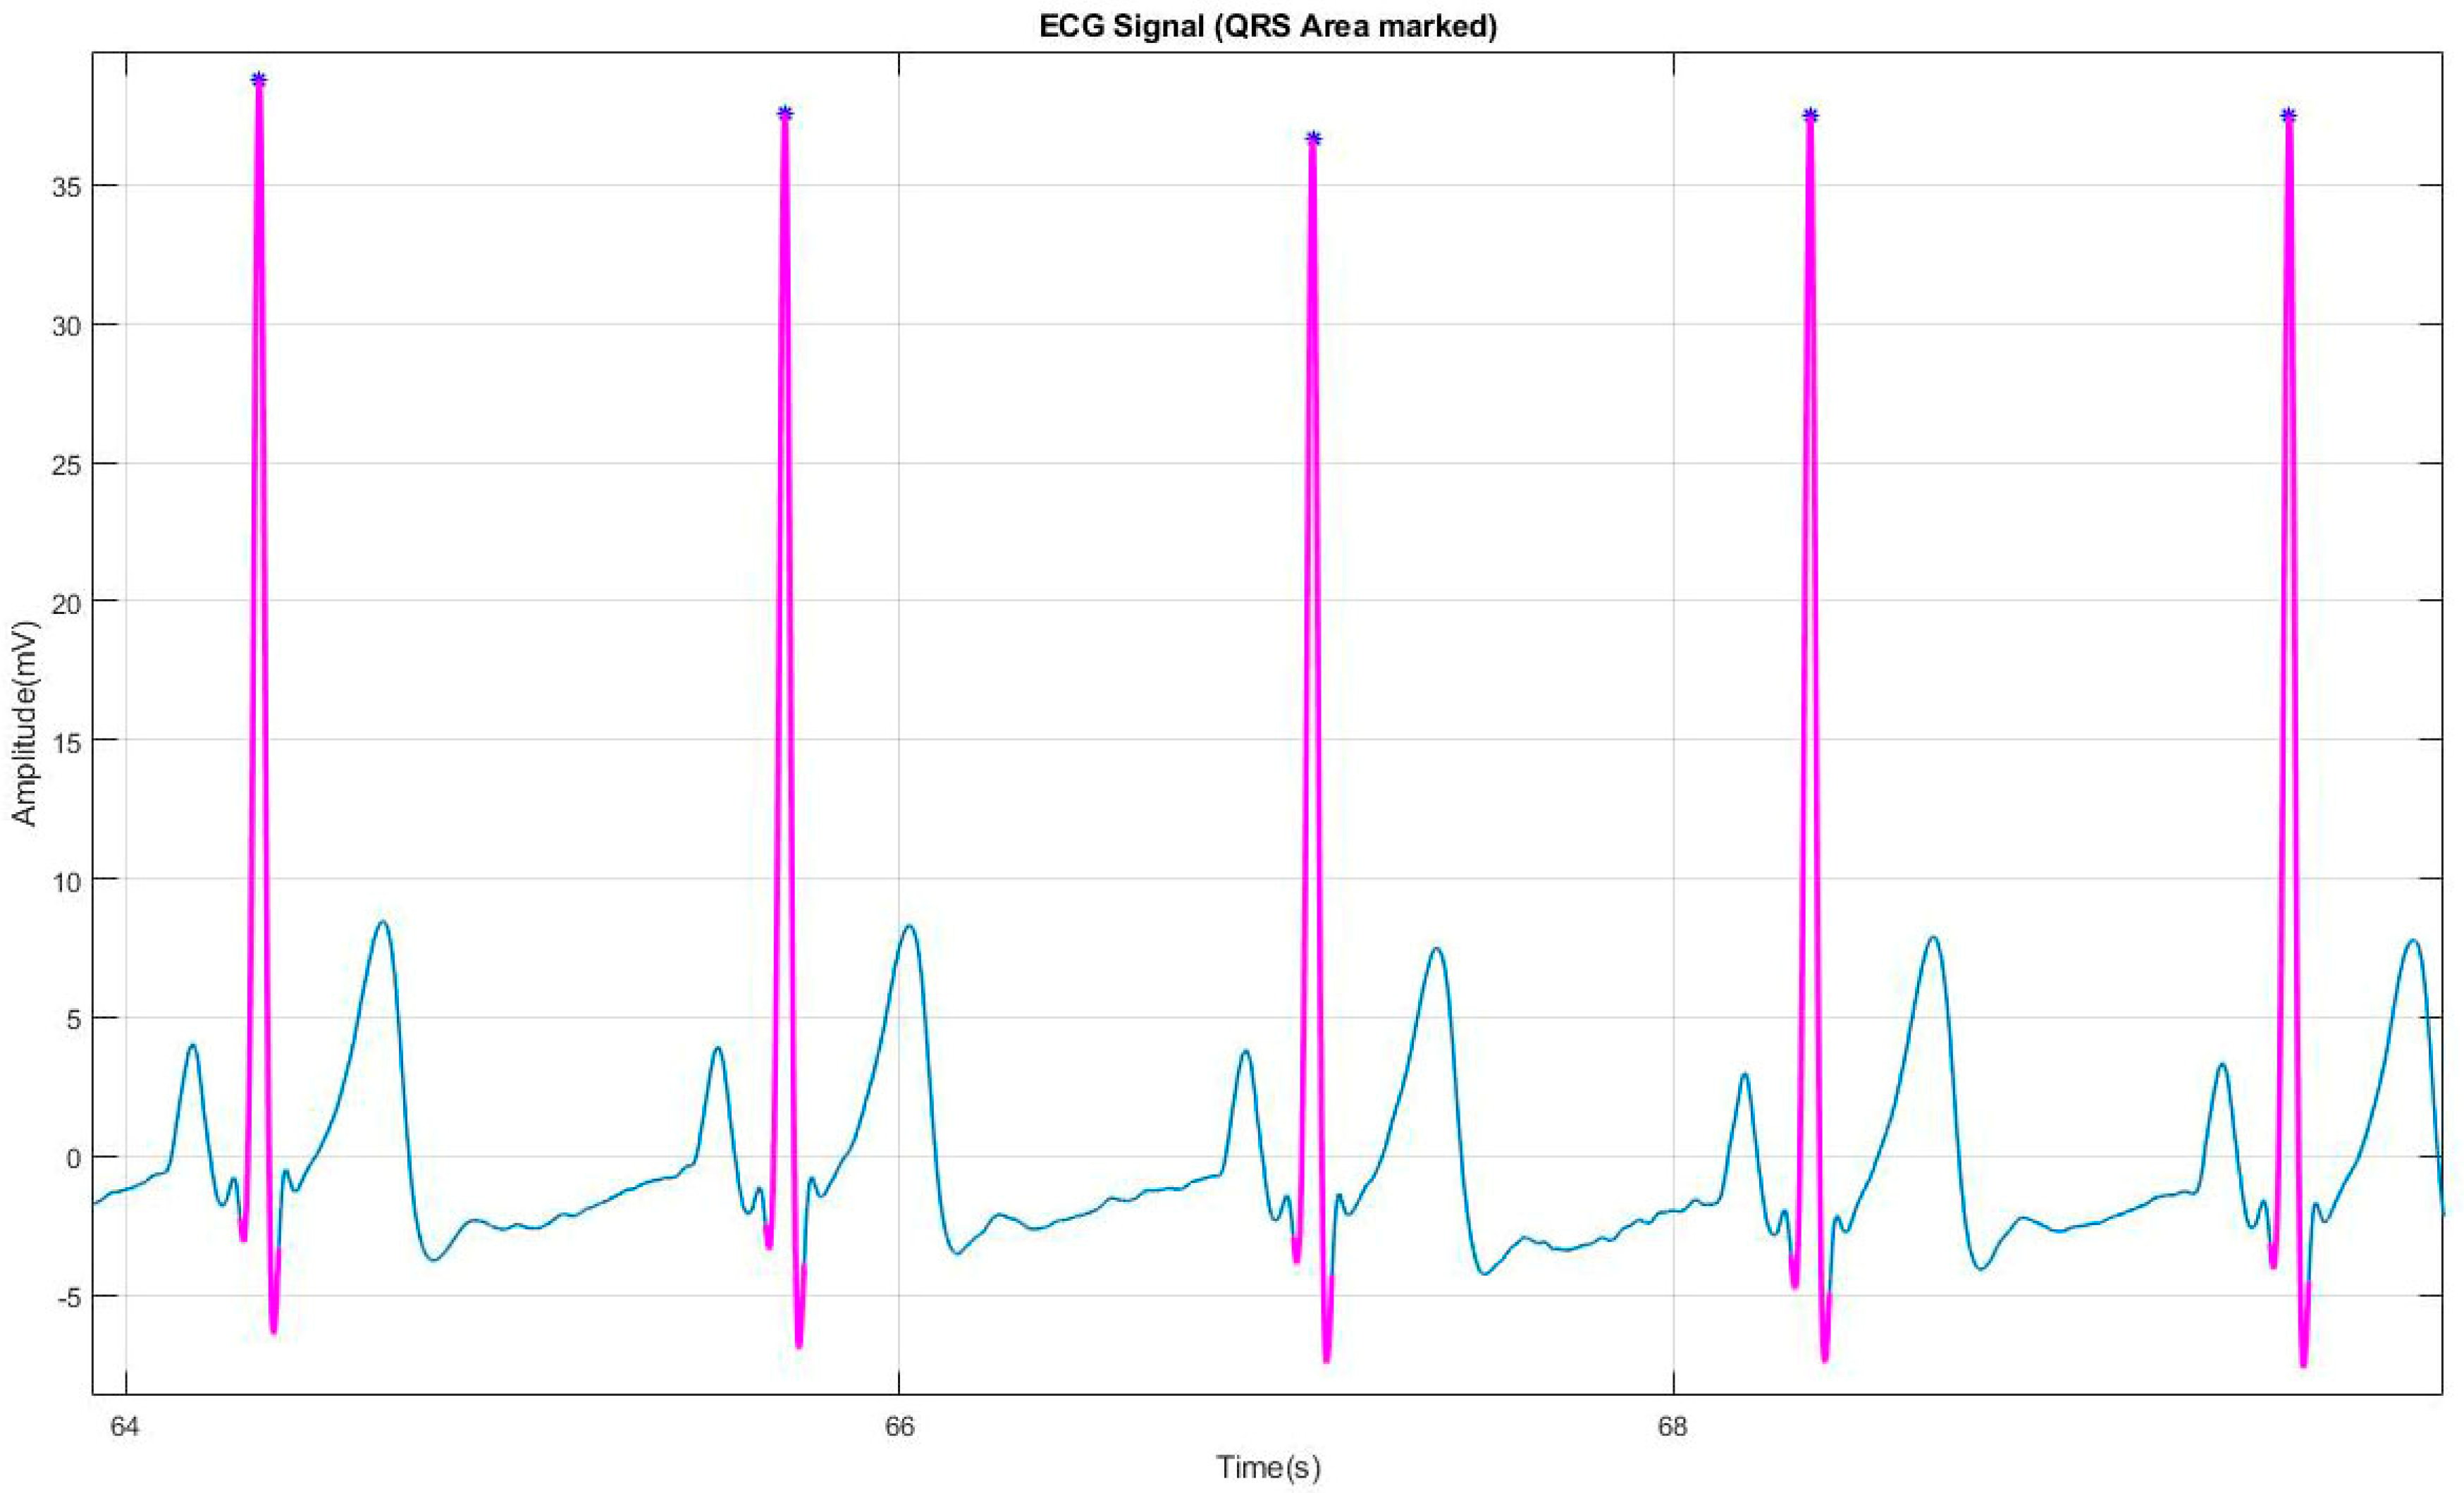
2.2.2. High Frequency component (Peak) Detection

This study carried out the second step peak detection which was very useful for further steps.
The High-frequency components are detected by applying the modified Pan Tompkins algorithm [44]. The algorithm consists of the following steps:
In the first step, this study used a block of the differentiation equation to obtain the high slope values; secondly, the output values of the signals were squared to extract the R-peaks; in the last step, this study applied the summation on all values of R-wave slope. The values related to the R-wave, for instance, R-location and amplitudes of R-wave were stored in the RnXm matrix. Figure 3 represents the example of detecting the R-peaks based on the Pan Tompkins algorithm. The reason for applying this modified Pan Tompkins algorithm is that it can easily adapt the variation of signal changes and extract the high-frequency component in an efficient manner.

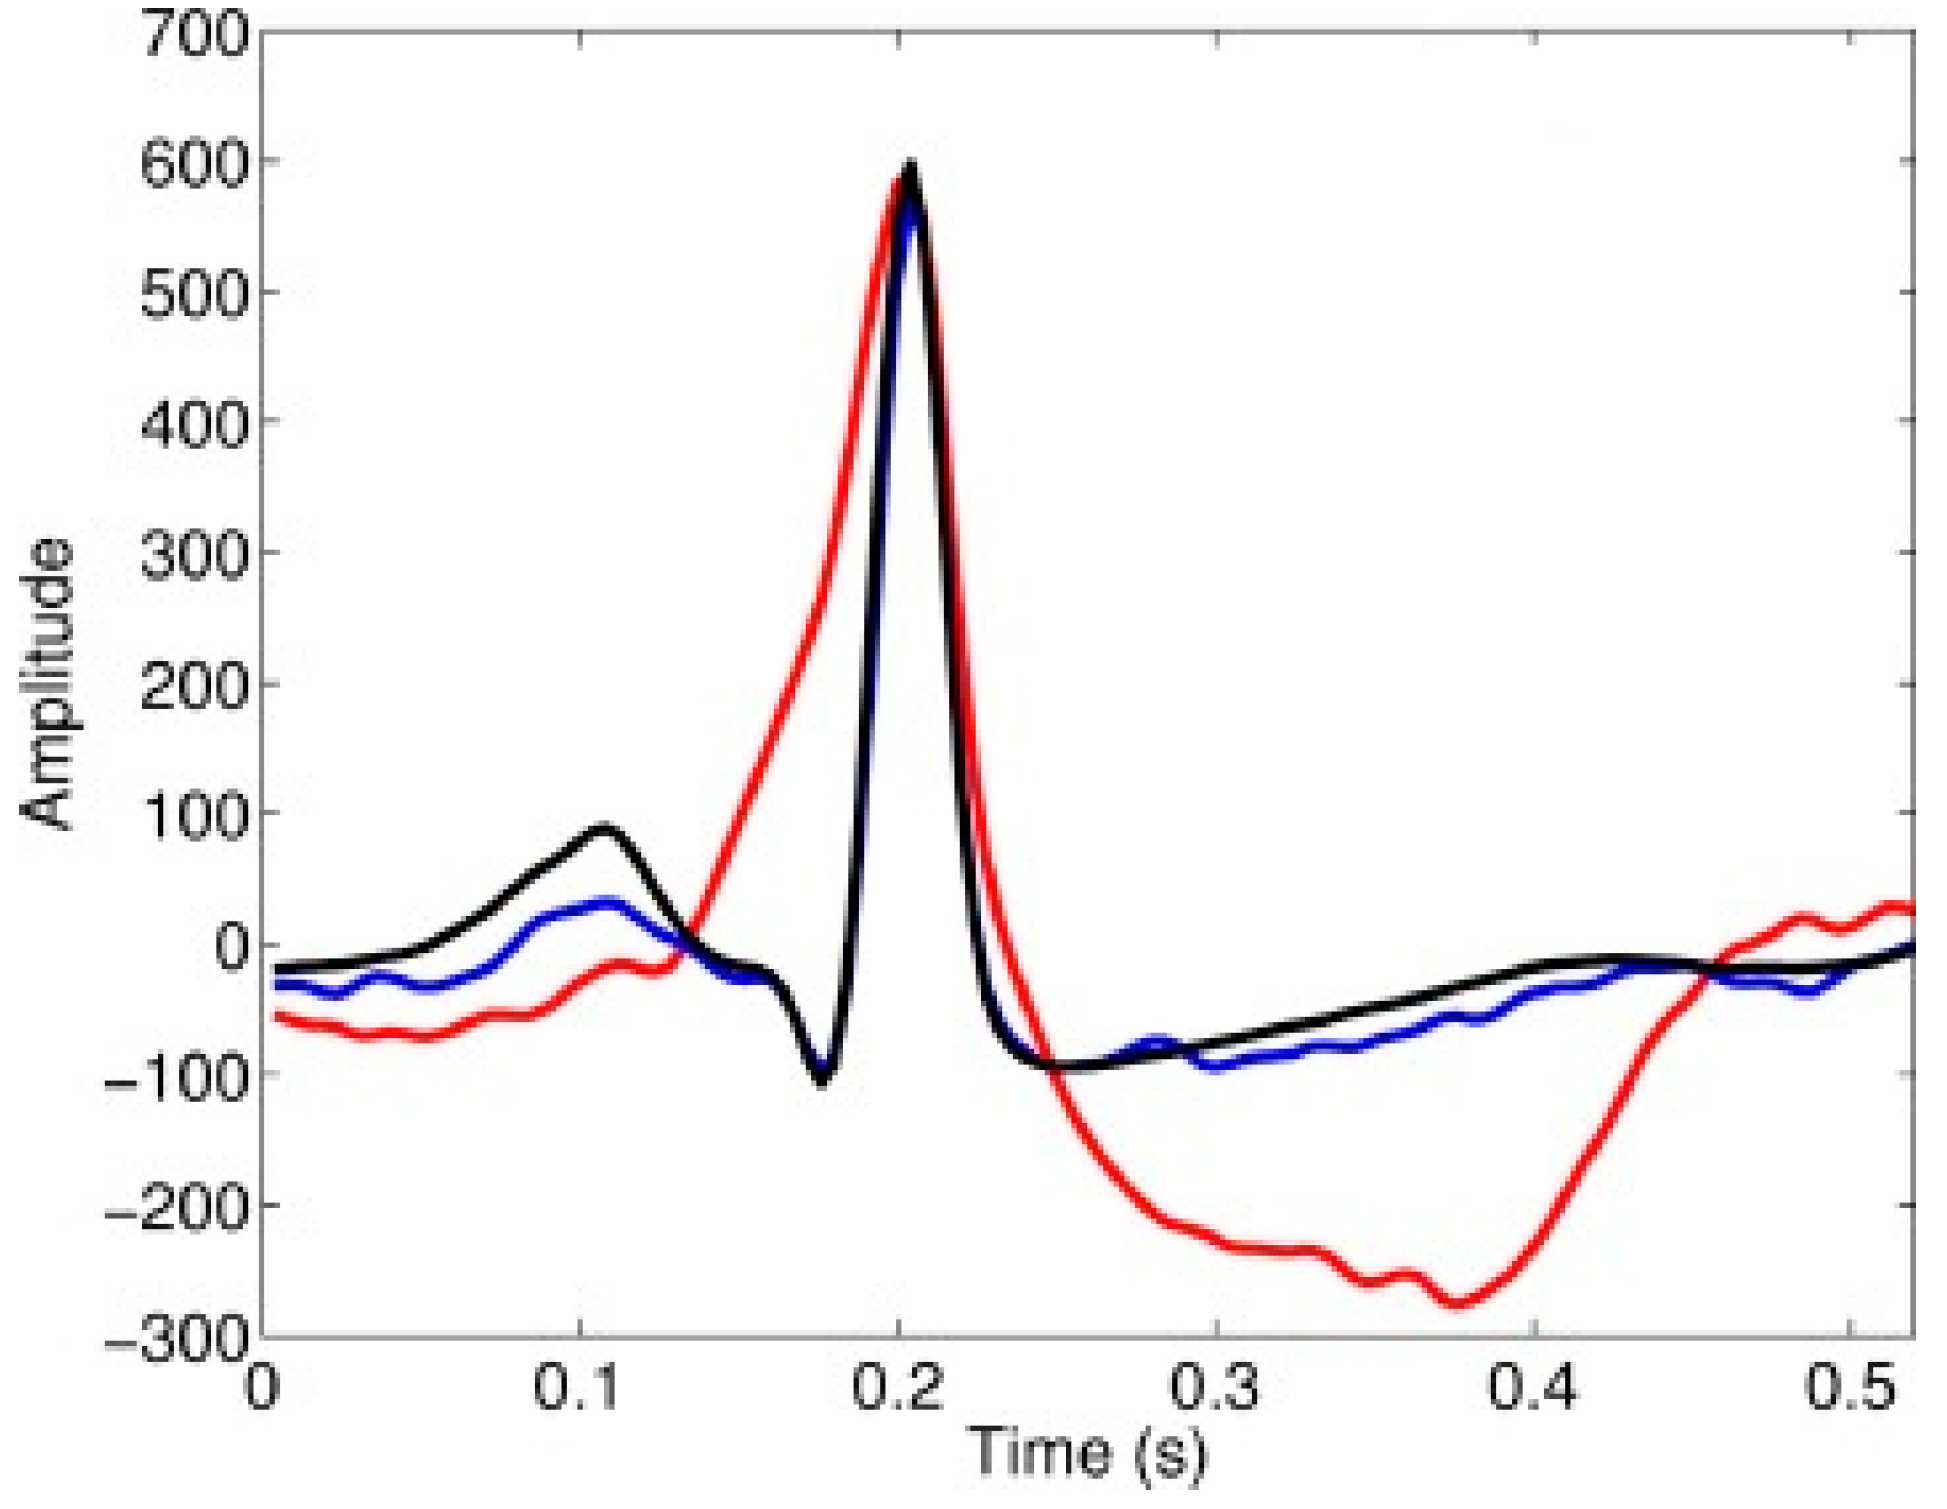
2.2.3. Heart Beat Segmentation

The aim of this subsection is to segment the heartbeat; after the detection of peaks, this study used the Rnxm matrix for selecting the R-location as a reference point. After determining the position of R-peak, 200 samples or around 0.52 s points were separated in the window, which is considered a single heartbeat. The segmented area based on the QRS complex is described in Figure 4.The start point and end point of the highlighted beat represented as Q wave and S wave respectively, whereas the peak area is defined as R wave. The combination of Q, R and S wave represents ventricular depolarization of the heart.
However, for the extraction of P and T waves, this study divided the 200 samples in two part (the division of points was based on 75 and 125 points which were taken from the left side and right side of the R-peak, respectively). To avoid the misleading of extraction, all samples were collected from 0.2 s to 0.32 s. In this way, using the temporal location and samples, the study extracted the Q, S, P, and T waves from each heartbeat.

2.3. Temporal Feature Extraction

The aim of this study is to design a reliable and optimal classifier for ventricular heartbeat classification which can be useful for Medical IoT based on a single ECG lead. The other main focus of this study is to extract those features which should not contain more computational cost and should be easy to implement in the real time environment. Therefore, this study does not consider those signals for the feature extraction phase which has contamination in their parts.
The characterization of normal heart beats (N + SVB) and abnormal heartbeats (A + VB) are well known and are also suggested by the medical specialists in the literature [45,46]. (N + SVB) were distinguished by regular RR intervals, the presence of P-wave, and has a narrow QRS complex, whereas (A + VB) has shorter RR interval, the p-wave is not present, and it also has a wider QRS complex.
Moreover, in this part of feature extraction, this study follows two types of methods; one is based on temporal feature extraction which is less expensive and easy to implement, however these features are lead independent yet useful for real-time implementation, therefore to overcome this inter-patient variability issue, this study used a second method by the name template matching. It is a patient adaptable and simple approach which measures the similarity between the input signal beat and template beat [47].
In the first method, the author computed the relevant attributes for the study’s classifier; the six temporal features were computed from each segmented beat.
1. 
The Previous R-R interval is defined as the time duration between the current beat and previous beat.
2. 
The Subsequent R-R Interval is explained as the time duration between the current beat and subsequent beat.
3. 
The Standard deviation of Successive Difference (SDSD) is defined as the standard feature of physiological signals for arrhythmia classification. It is the difference between 10 consequent RR intervals [48].
4. 
The Average of RR-Interval | B e a t ¯ | is defined as the average ratio of 10 consecutive RR intervals.
5. 
The Average Derivate of RR interval | B e a t ¯ | is defined as the average ratio of the derivate of the RR interval, where the derivation of the segmented beat is calculated by using this central difference Equation (2).
( f ( z ) f ( z + h ) f ( z h ) 2 h )
Based on clinical specialist advice, ventricular abnormal beat has a wider area of QRS complex and it also tends to rise and fall more than a normal beat. Therefore, the derivative area should have the lowest value.
In contrast, in the second method, template matching was used to avoid the lead independency and inter-patient variability issues. The approach was quite simple and patient adaptable; the study used this approach to compare the ECG signal heart beats with the same class specific template in order to define the Pearson’s correlation coefficients (PCC) between the input ECG signal and template beat. However, template beat was calculated by taking an average ratio of at least 50% beats in which 25% belongs to the normal beat and 25% belongs to the abnormal beats. After calculating the specific template beats for normal and abnormal, this method compared the current heartbeat with the template beat example which is shown in Figure 5.
To this end, for the comparison of heartbeats in real time scenarios, we updated and calculated the template based on a real-time adaptation of the system. Assuming that doctors are using 10 s ECG strips which have around 15 heartbeats in every 10 s ECG strips, the new template is estimated and updated and also replaces the old beats from the template. To evaluate the similarity measurement between the template beat and ECG signal heartbeat (PCC), features are extracted for our classifier as follows:
6. 
PCC ( T e m p l a t e   b e a t , h e a r t   b e a t ) is defined as the Pearson’s correlation coefficients between the template beat and ECG signal heartbeat.
7. 
PCC ( T e m p l a t e   b e a t , h e a r t   b e a t ) is defined as the Pearson’s correlation coefficients between the derivatives value of the template beat and ECG signal segmented beat.
8. 
PCC ( T e m p l a t e   b e a t 2 , h e a r t   b e a t 2 ) is defined as the Pearson’s correlation coefficients between the squares ratio of the template beat and ECG signal segmented beat.
9. 
PCC ( ( T e m p l a t e   b e a t ) 2 , ( h e a r t   b e a t ) 2 ) is defined as the Pearson’s correlation coefficients between the squares of the derivatives of the template beat and ECG signal segmented beat.
10. 
The Average of Template beat | T e m p l a t e   b e a t ¯ | is defined as the average of the template beat.
11. 
The Average Derivate of Template beat | T e m p l a t e   b e a t ¯ | is defined as the average derivatives of the template beat.
To this end, the total 11 features are selected for the study proposed classifier in which five were based on temporal features of ECG morphology and the rest of the features were based on (PCC) by using the template matching approach. All these features are stored in the matrix denoted as F ( n ) .

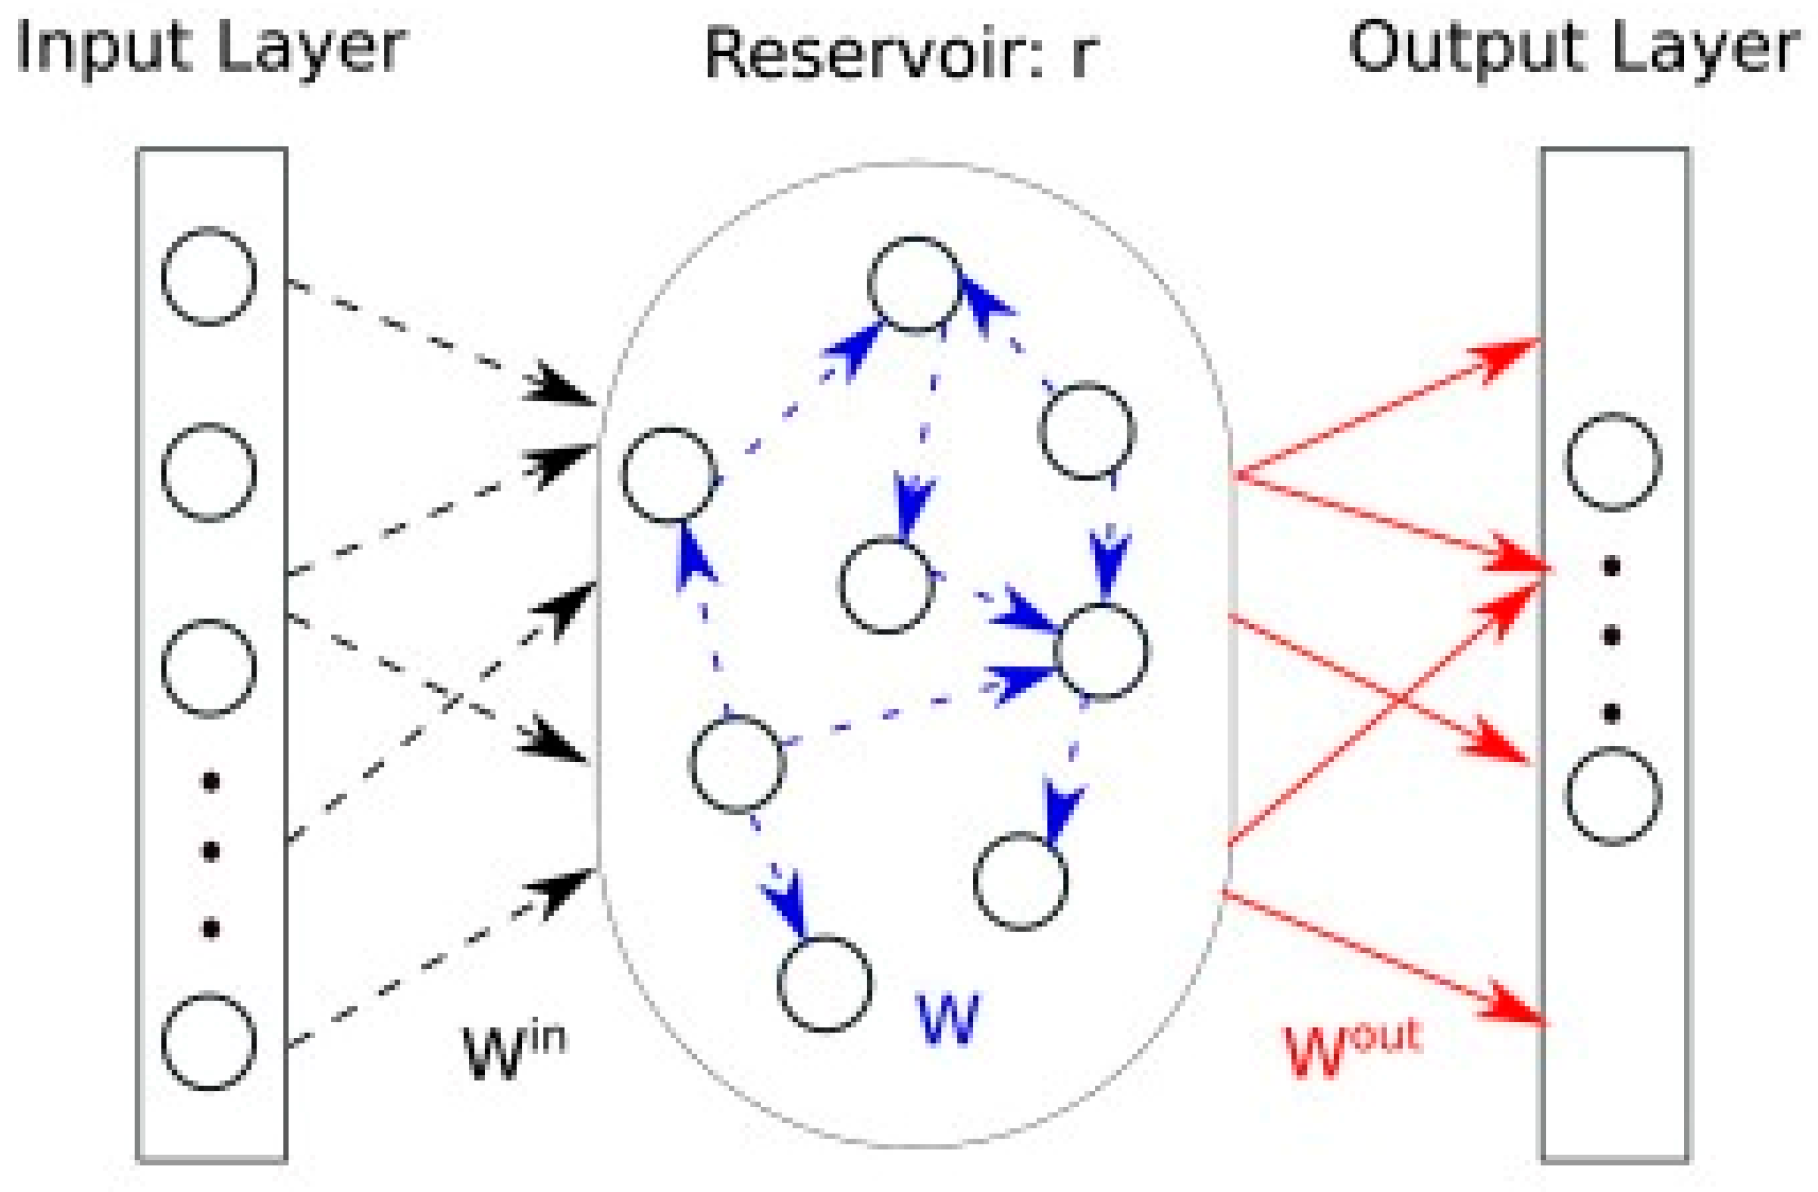
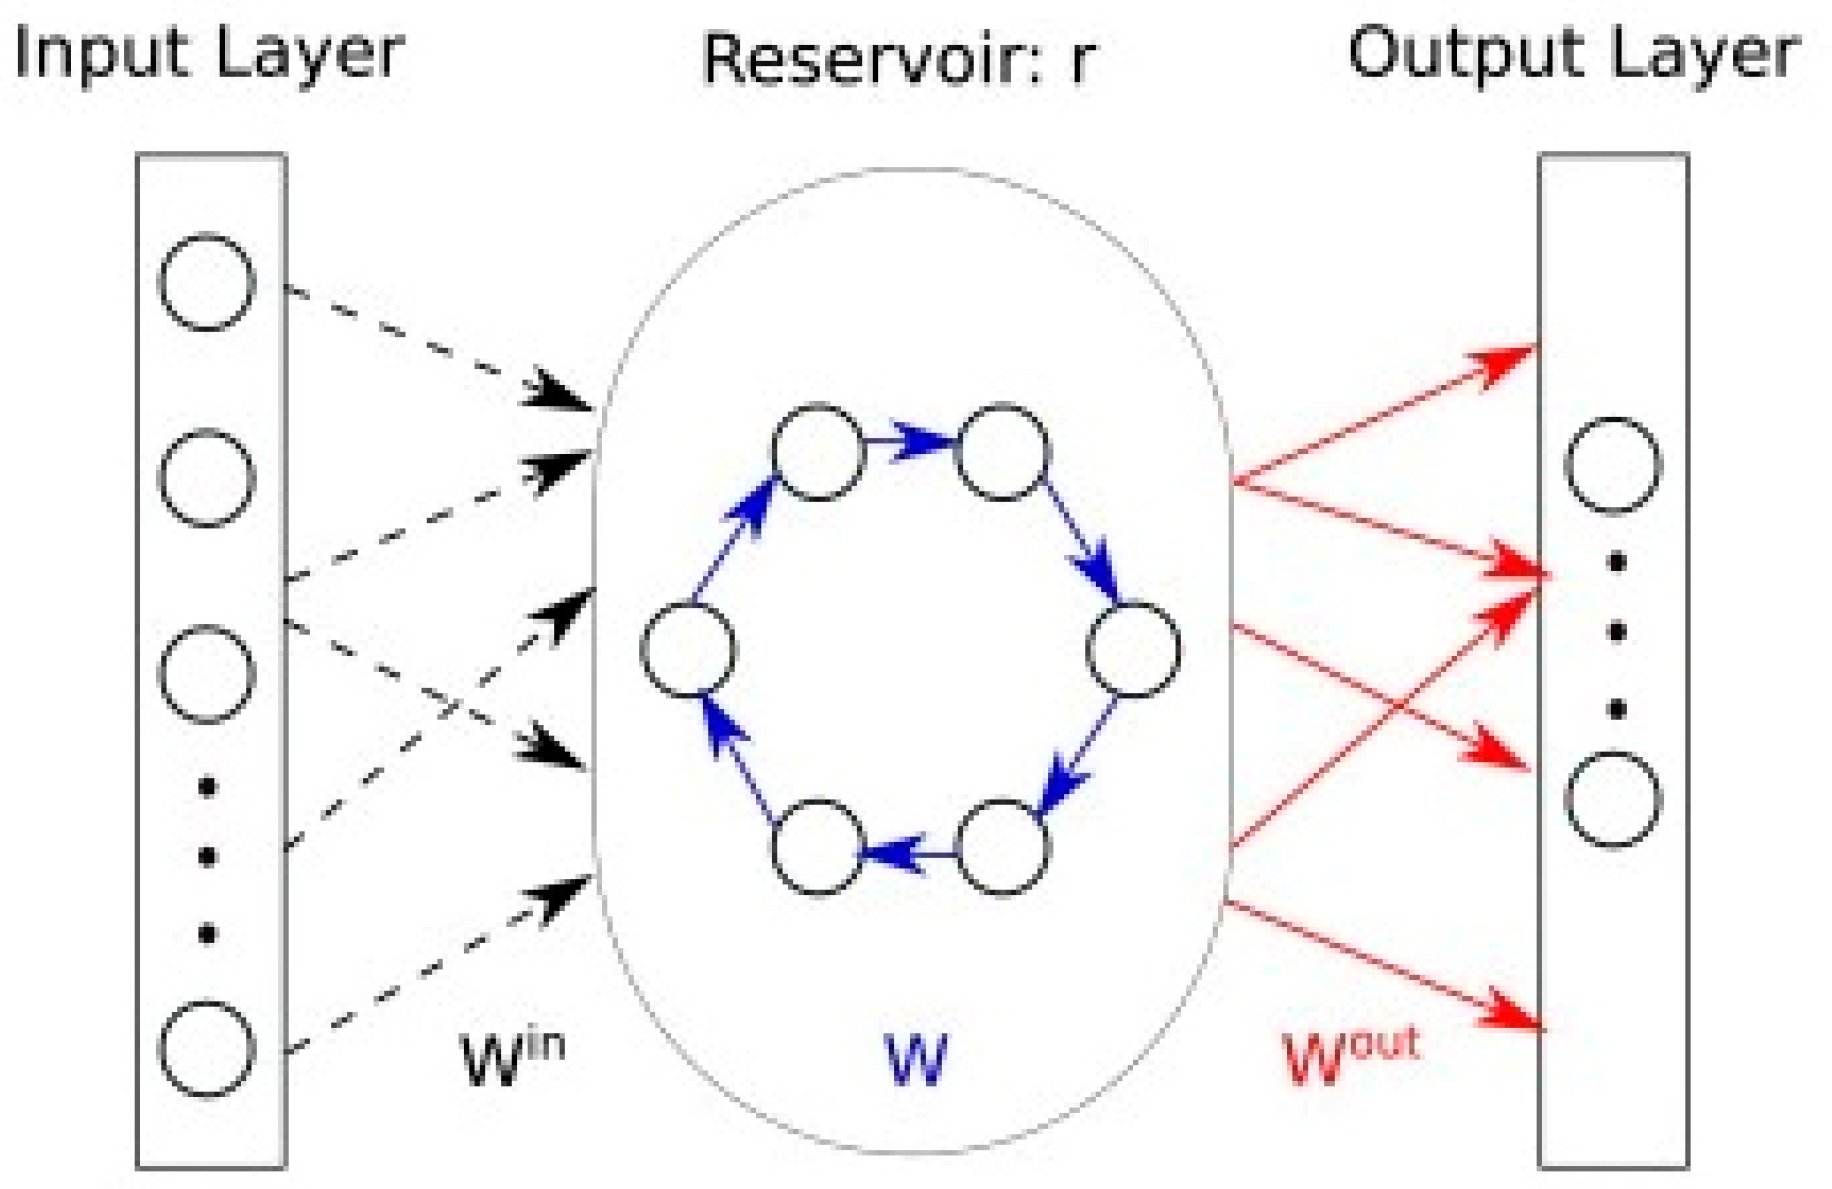
2.4. The Configuration of the Echo State Network Based Reservoir Computing for Classification

The main idea of reservoir computing (RC) is based on artificial neural network (ANN) because the nature of functional elements in RC is based on the input weights, biases, and connection weights among the neurons that are similar to ANN. The RC is further divided into two common methods (1) Echo State Networks (ESNs) [32] and (2) liquid state machine (LSMs) [49]. ESNs tend to use sparsely connected sigmoid nodes, whereas LSMs are a network which is made up by spiking neurons in the reservoir model [50]. In this study, the author considered the main type of RC echo state networks (ESNs) to construct an efficient model; for implementation in real-time scenarios, see Figure 6. In our methodology, the author used a cycle-based ESN architecture where the neurons of the reservoirs were connected in a ring form, which is also called non-random links between neurons (see Figure 7).
The reason behind using the non-random topology was that an ESNs model could easily be implemented in hardware and it also allows low power consumption with efficient processing speed [51]. These advantages encouraged the author to use the ESNs model for ventricular heart beat classification. The activation vector of the echo state network is defined by Equation (3).
s ( n ) = g ( ϑ W i n F ( n ) + α W s ( n 1 )
where S ( n ) ϵ N d , is the activation vector or state in which N x represents the number of neurons in the connection weights and W i n ϵ N x X   N d is a random matrix which was typically drawn uniformly from [−1, 1] in which N d represents the dimension of the input vector. In the end, the connection weight matrix was computed based on the connection between neurons in the network and it is represented as W ϵ N x X   N x , whereas ϑ and α are the input parameters of connection scaling, F ( n ) represent the input feature vector of heart beats which has dimensionality = 11. The activation function of ESN is also called classic sigmoid function which is shifted to become symmetric near to 0. In general, the ESN state initialized with null state. The linear combination of the N x activation s ( n ) or response of the ESN model was calculated according to:
y ( n ) = g ( W o u t S ( n ) )
where W o u t ϵ   N o u t X   N x   represent the weight matrix of the connections between ESN neurons and output nodes, N o u t represents the number of readouts. We extend our ESN model to know the bias weight and feedback between the y ( n )   and the reservoirs is defined as:
S ( n ) = g ( W i n   F ( n ) + W s ( n 1 ) + W y ( n 1 ) O R + W b i a s )

2.4.1. Learning Phase of The ESN Model

In the learning phase of this study, the author split our dataset based on a 10-fold cross-validation technique. The substantial amount of data around 80% was used to train the classifier, whereas 20% of data was used for testing. In this training phase, the ESN model tries to find the weight matrix which minimizes the error rate between the output and target values. The representation of the training input and output sequence is defined as:
C = ( W i n ( 1 ) , W o u t   ( 1 ) ) , .. , ( W i n ( n ) m a x ) , W o u t   ( n m a x ) )
Hence, the output matrix W o u t ϵ   N o u t   X   N x and the reservoir states in the training phase are represented as A   ϵ N x   X   T . The corresponding output weight matrix is defined as B   ϵ N x   X   T , where T denotes the time of training phase. The training is defined as follows:
W o u t   A = B
It can be rewritten as
W o u t   A A T = B A T
The solution of this equation is computed as in inverse matrix in order to find out that W o u t is defined as:
W o u t = ( B A T ) ( A A T ) 1
We used Moore Penrose pseudoinverse [52] for numerical stability which is defined as:
W o u t = B A T ( A A T ) +
To mitigate the overfitting of the model, we used Ridge Regression [53] which minimized the amplitude of W o u t which is according to:
W o u t = B A T ( A A T + I ) 1
where is the regularization factor of each reservoir which has no absolute meaning and I represents the identity matrix ( I     N x   X   N x ) .
The ratio of normal and abnormal values is estimated here in this point based on scaling parameters, the maximum threshold value of the study set is 0.4, and by using this value, the study scales our parameters to get the accurate prediction. In the end of the training phase, the regression technique helps to minimize the quadratic error between the output values and desired output values. The performance of our proposed classifier achieved outer perform results which are discussed in the following section.

3. Results and Discussion

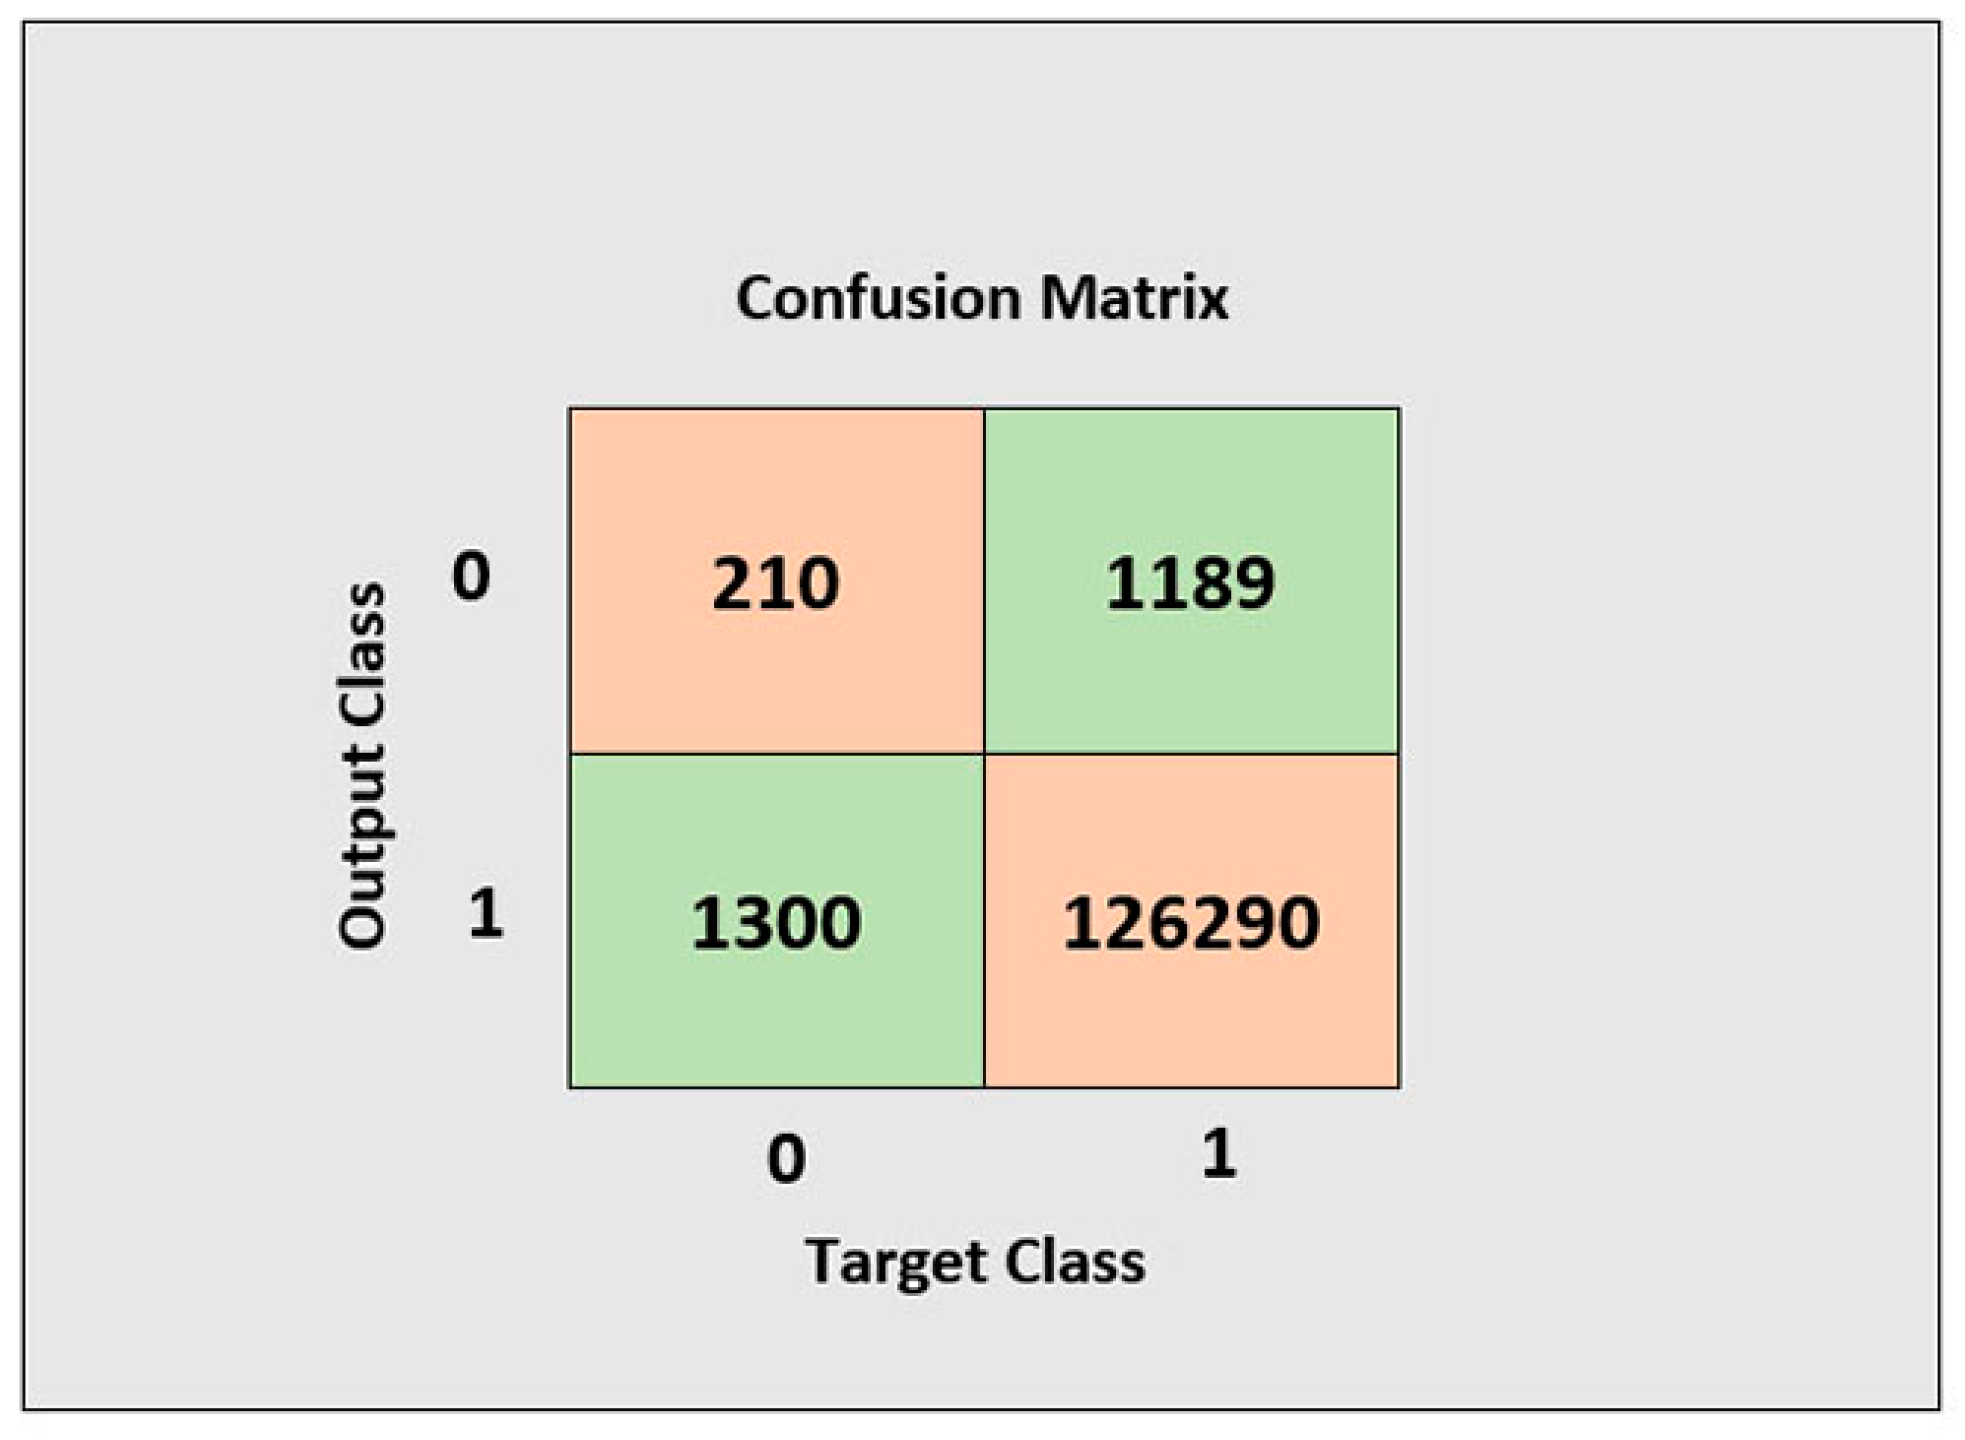
3.1. Performance Evaluation Parameters
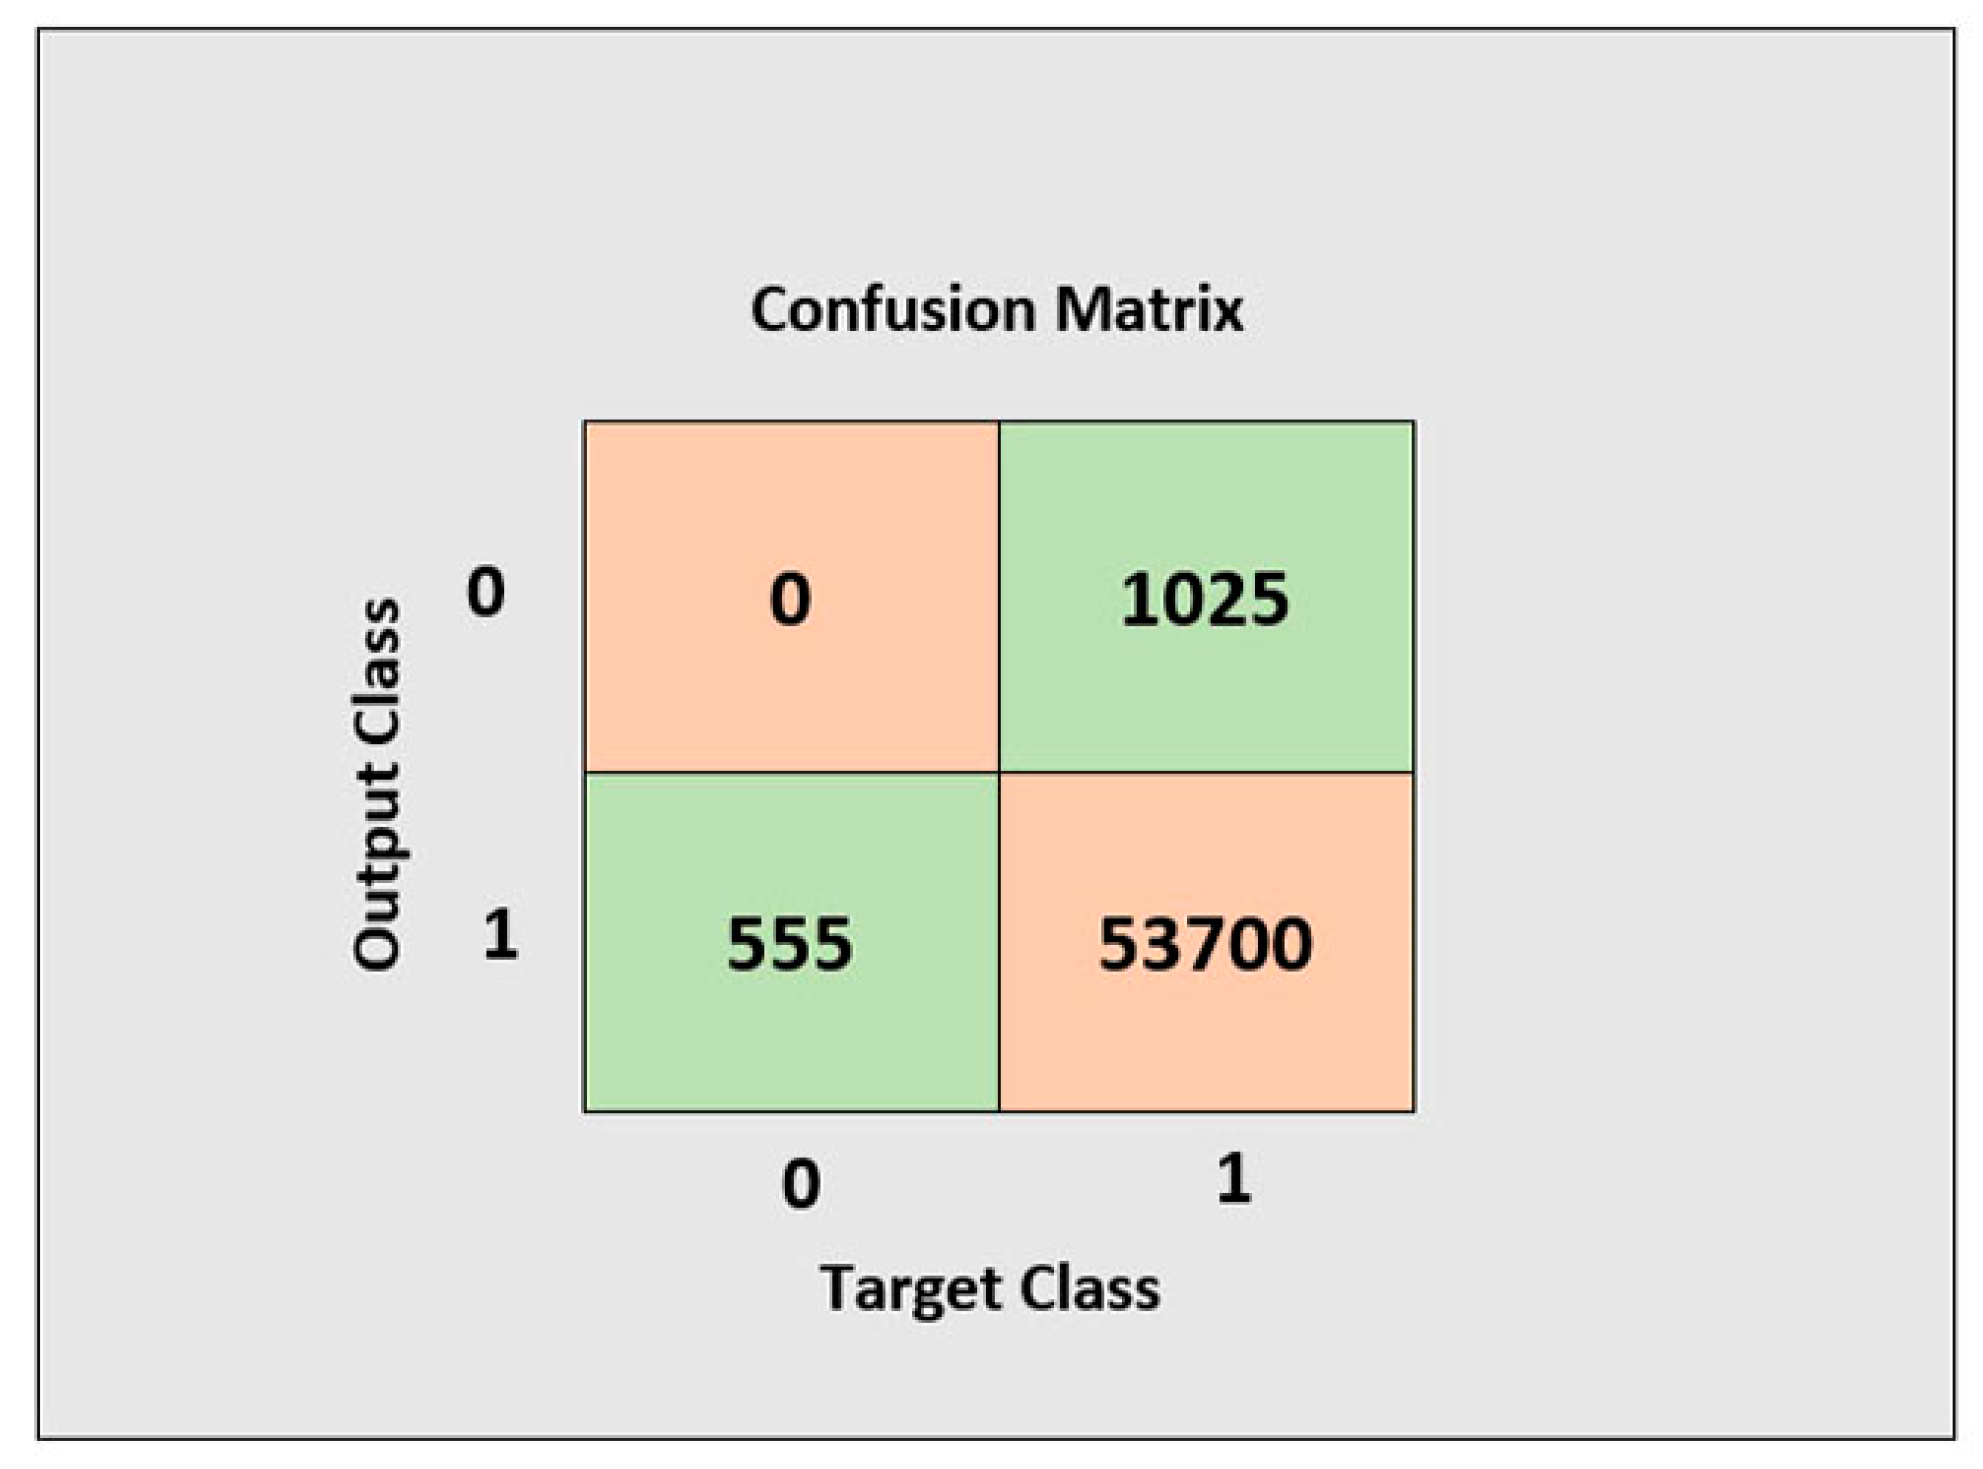
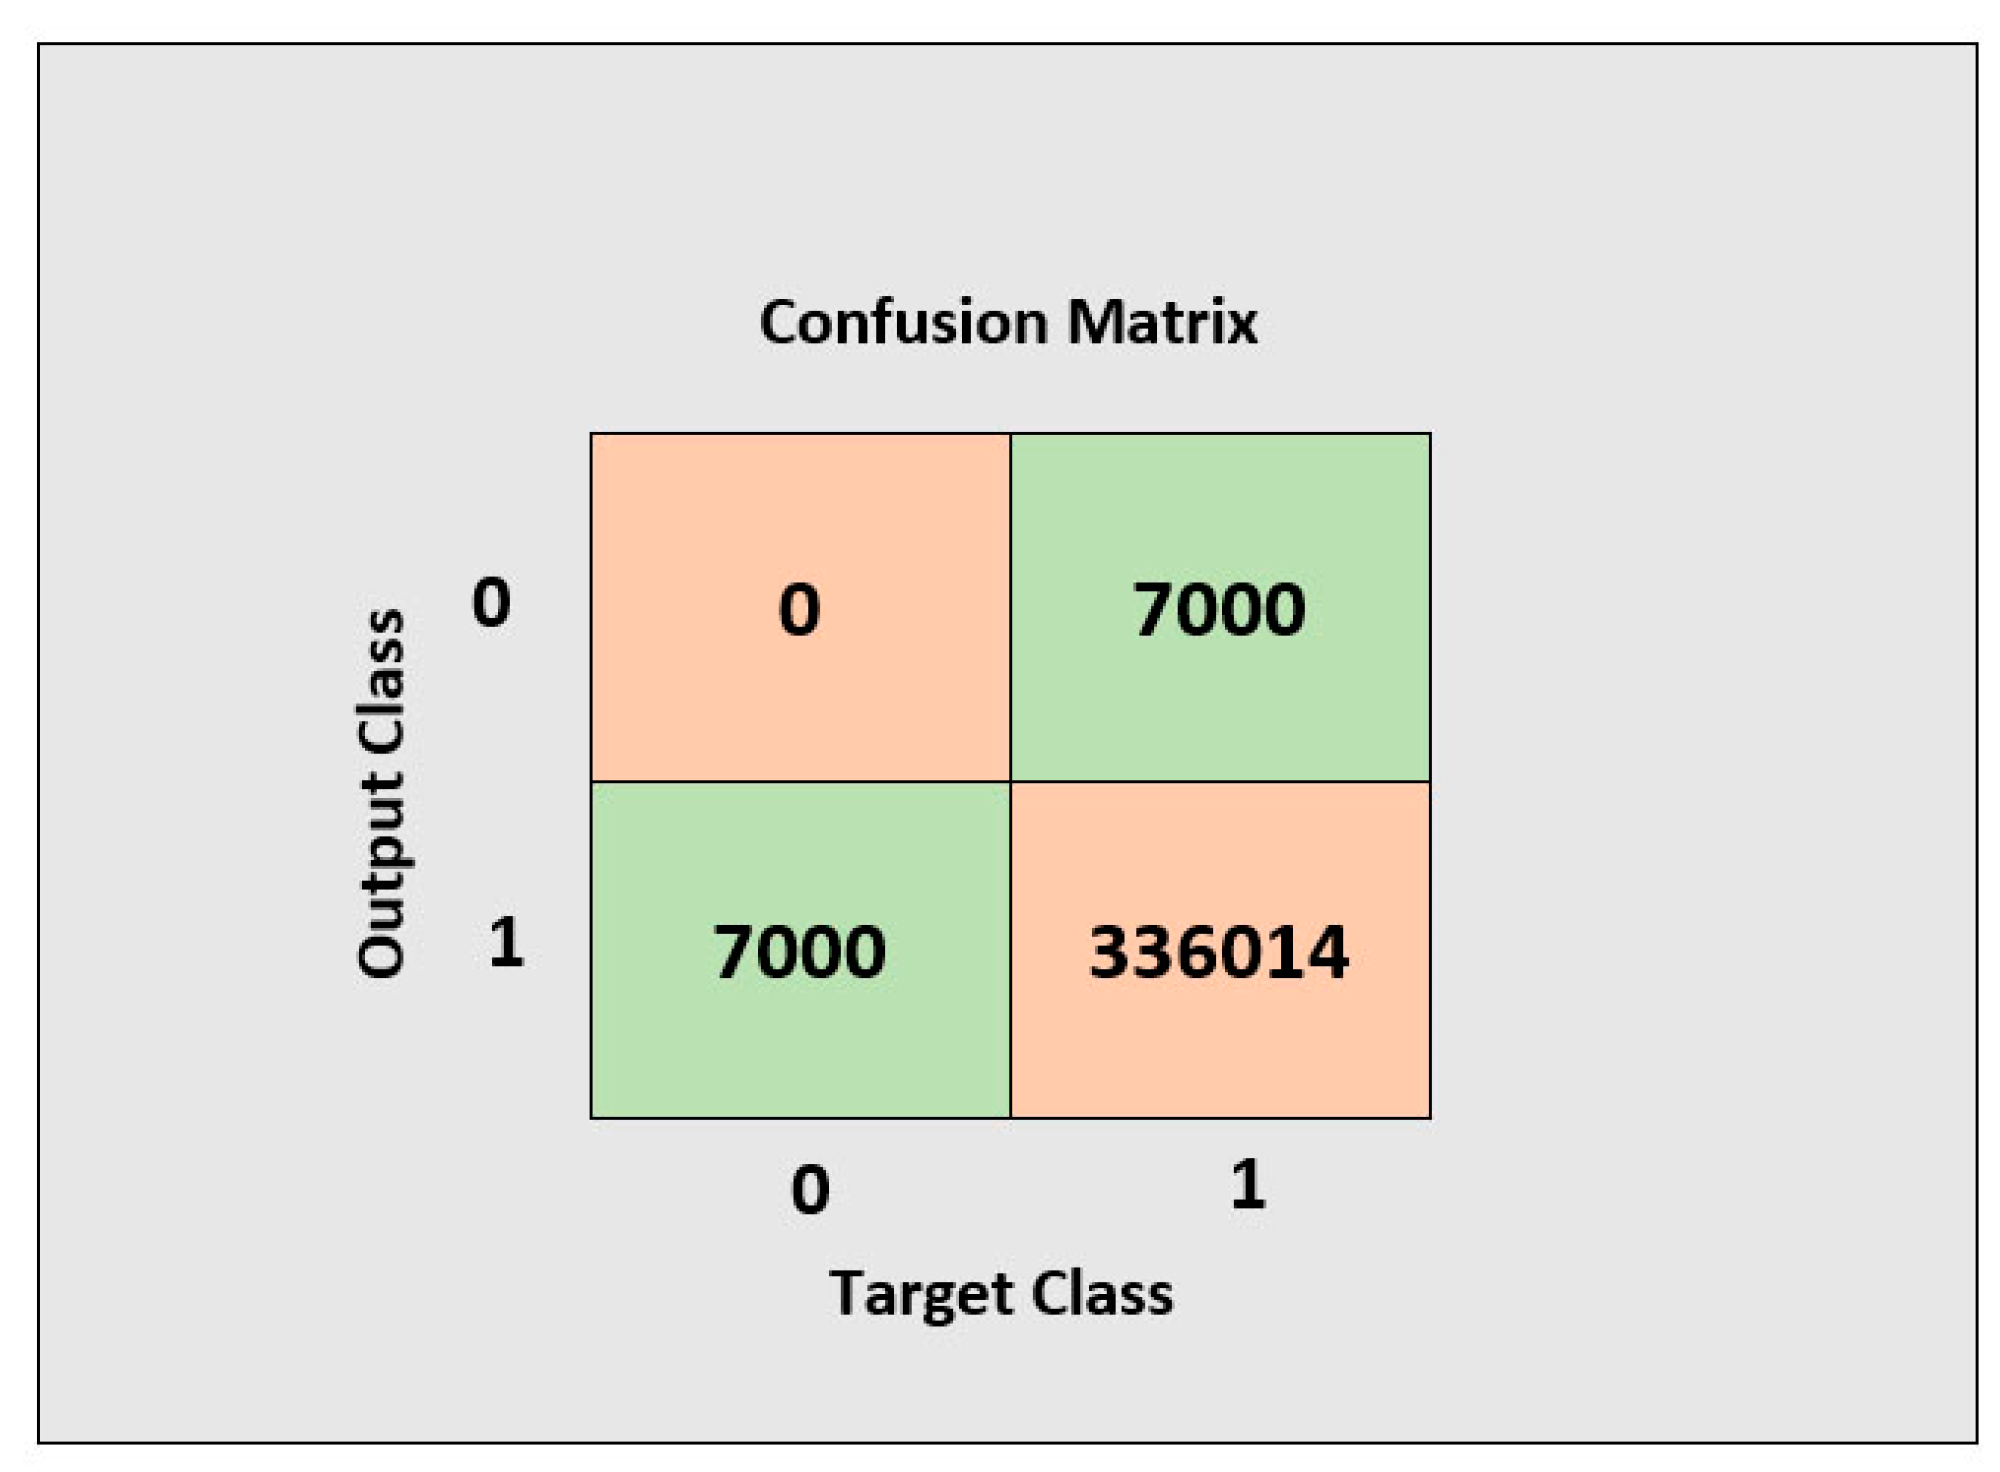
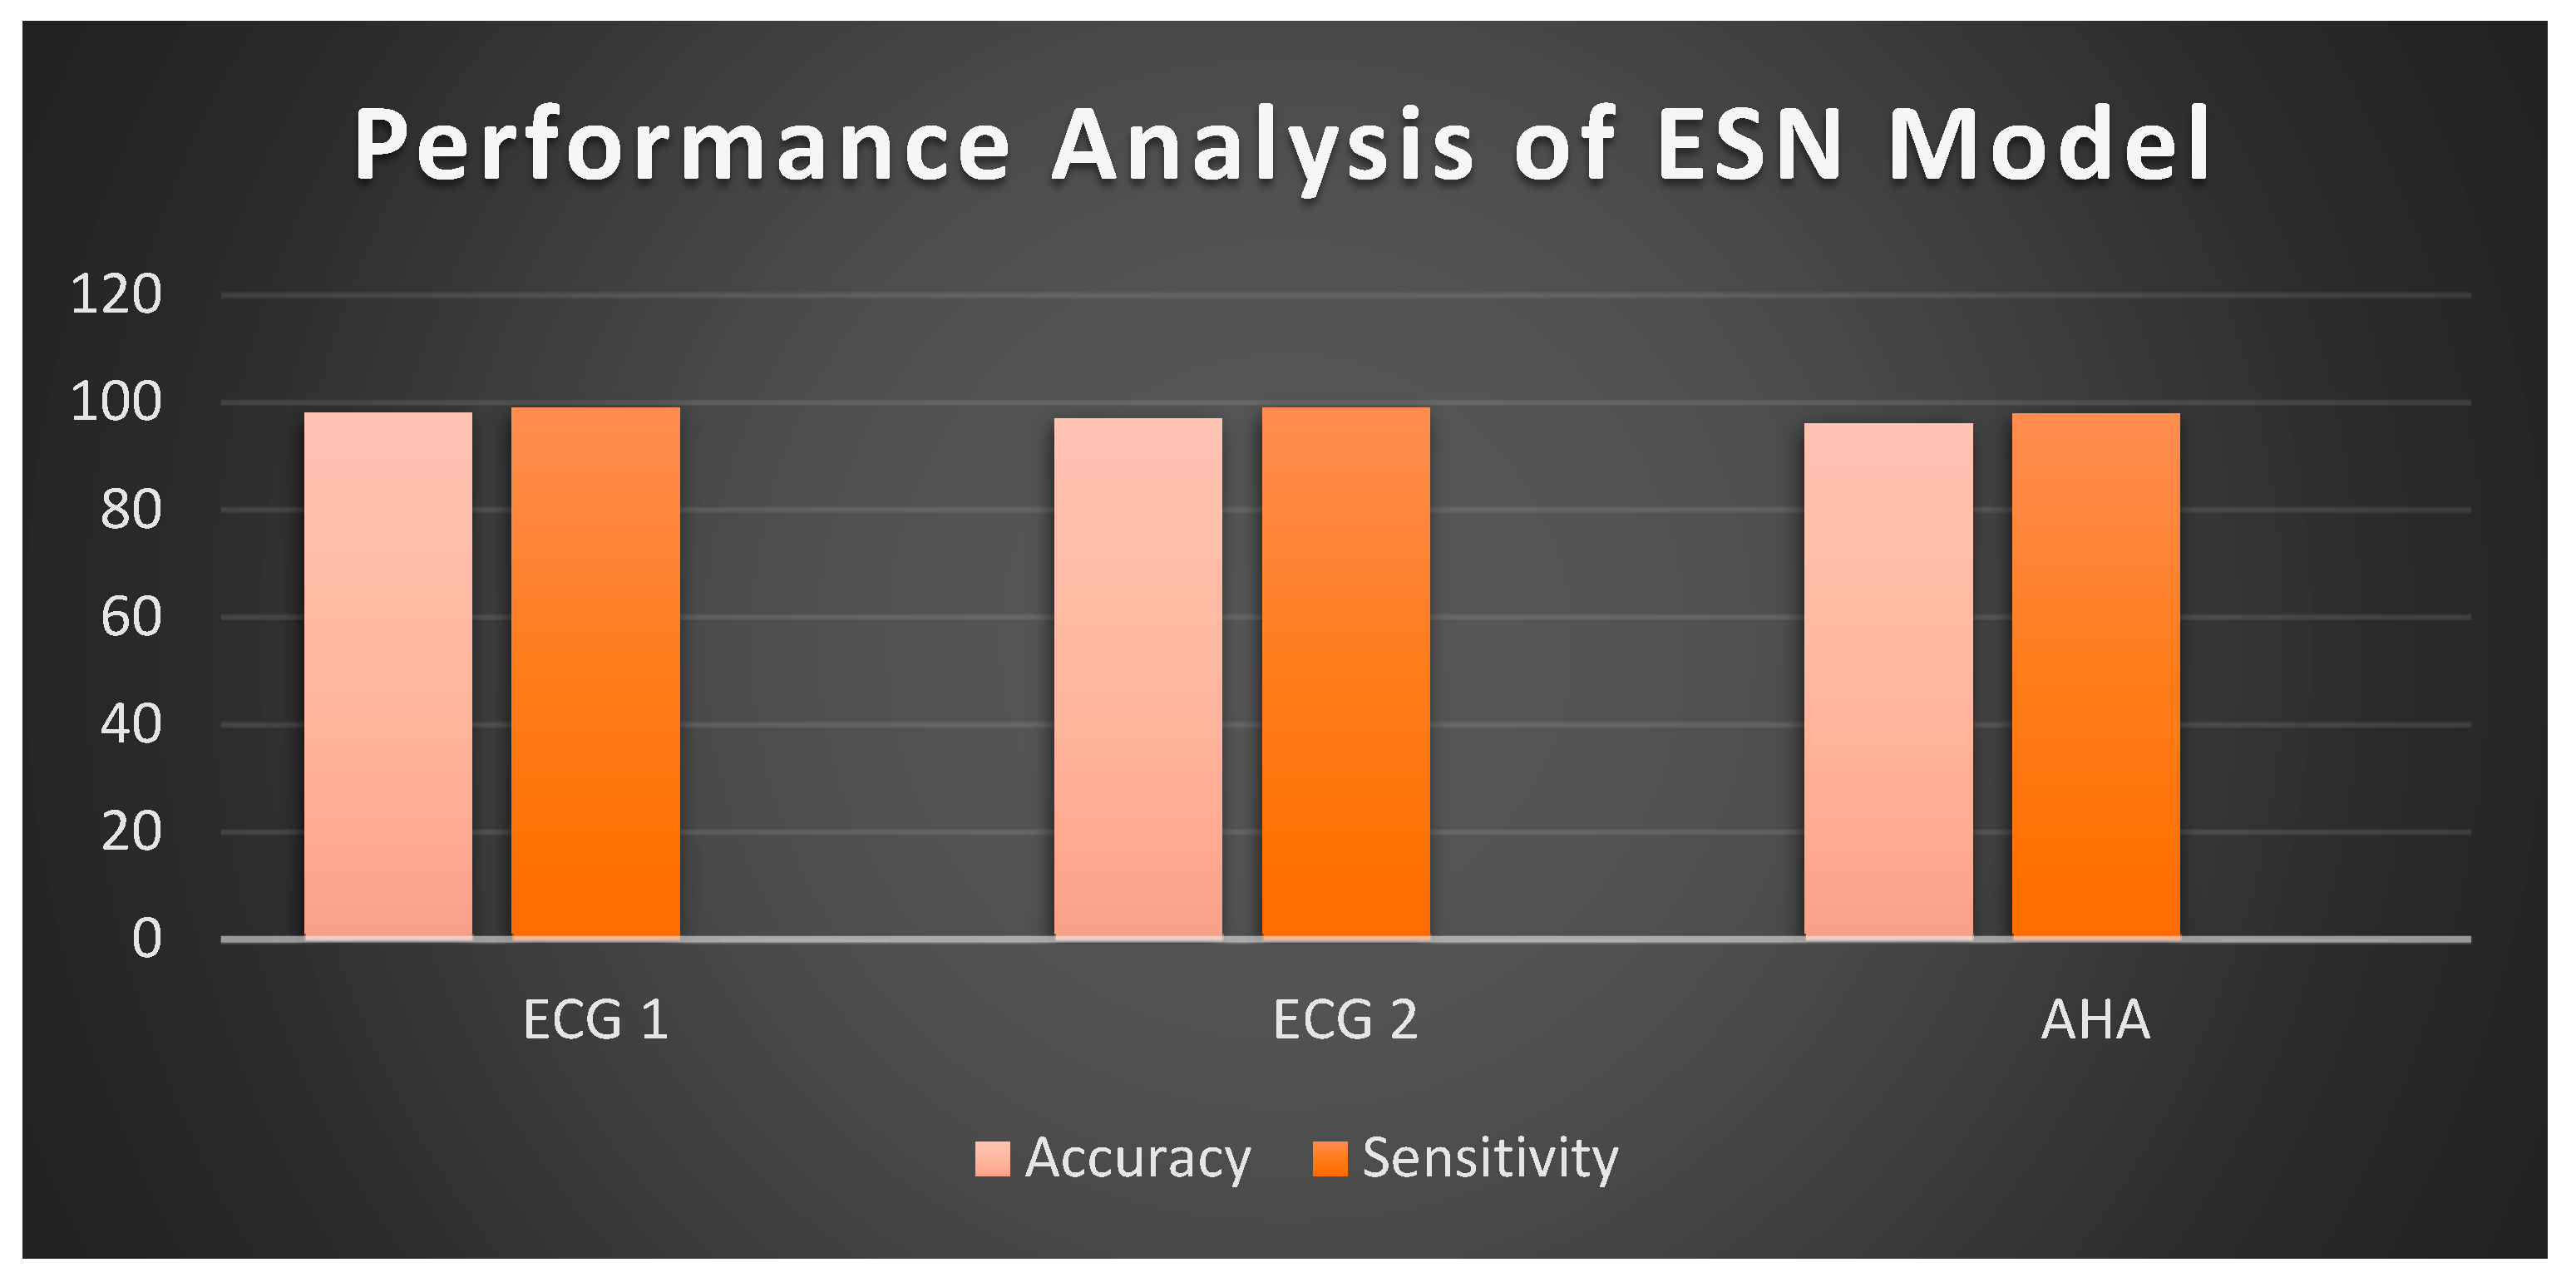
To evaluate the performance of our ESN model, the study used three performance parameters which are recommended by AAMI standards for evaluating the performance of learning algorithm, which includes sensitivity (Se), classification accuracy (Acc), and error rate (Er)
S e = T P T P + F N 100
A c c = T P + T N T P + T N + F P + F N 100
E r = F N + F P N
where True negative (TN) is defined as the number of normal records, which is correctly classified as normal, True positive (TP) is defined as the number of abnormal records, which is correctly classified as abnormal, False positive (FP) is defined as the number of normal records that are classified as an abnormal record of the dataset, and False Negative (FN) is defined as the number of abnormal records that are classified as normal.

3.2. Evaluation

In this section, the performance of the proposed classifier is evaluated in terms of accuracy, sensitivity, and error rate. This study can also indicate that this evaluation part is the final classifier performance as the study already trained the model before. Table 3 shows that ECG 1 and ECG 2 from (MIT-BIH SVDB) and AHA recordings obtained remarkable performance. The ECG 1 lead achieved 98% accuracy, whereas ECG 1 and AHA recordings obtained 97% and 96% accuracy, respectively. ECG 1 achieved the highest result because this lead is modified which is good enough to distinguish the beats very efficiently. The detailed performance of our proposed model is described in Figure 8, Figure 9, Figure 10 and Figure 11 where the confusion matrix shows the total number of classified beats and the graph represents the performance statistics based on percentage in terms of accuracy and sensitivity.
It is noticed that the complexity of RC is higher in random connections, whereas the cycle-based ESN model has low computational cost and it is suitable for implementation in real time scenarios. In the learning phase, this study used Ridge regression to optimize the desired output weights and avoid overfitting, whereas in the testing phase, it only involves sparse connectivity which helps to reduce the number of heavy multiplications and additions. In this study, all experimental work was conducted using MATLAB (2018a) on a desktop computer running with 128 GB RAM and 16 cores. Once all scaling parameters were adjusted in the model, the system only required eight minutes in training with a 30 min duration ECG dataset. However, the testing runtime was observed that it takes 1.5 s for feature extraction or selection from ECG beats and the model takes 5 s to classify the heartbeat either as (N + SVB) or (A + VB). The total approximation time is estimated as 2.0 s and total time complexity is observed O ( F ( n ) 2 E ) where E denotes the training examples and F(n) is the number of features.
In contrast, this study examined the limitation of our proposed ESN in implementation and the finding is that the classifier needs to wait until the reference beat is computed. Once the template beat is computed, the system is ready to implement the real-time beats for classification. The system is able to compute the new template beat when more than 10 beats were classified properly and the model starts retraining by using the new template beat and it only consumes 2.0 s for the training model.

3.3. Comparison with State-of-the-art Methods

In the literature [12,16,54,55], the author noticed that many studies used the MIT-BIH arrhythmia dataset for the heartbeat classification, whereas this study used different datasets. Therefore, it is obvious that this study cannot present a fair comparison between the current study and state-of-the-art methods. To support a fair comparison analysis, this study used the MIT-BIH arrhythmia dataset for heartbeat classification using our proposed non-random ESN model. This method is focused on a single lead and ventricular heartbeat classification. Therefore, this technique considered only two classes: (N + SVB) or (A + VB). For MLII and V1, both leads were taken individually to classify the ventricular heartbeats from the ECG signals. This methodology outperforms the rest of the other studies that were discussed in Table 4. Moreover, some studies in the literature only focused on one lead classification and the computational cost of the proposed algorithm was not suitable for real-time application [9,56]. However, this study used both leads for classification and the technique computational cost and performance of our technique is noteworthy for real-time implementation. Thus, the author compared this study with those state-of-the-art methods that used both leads for learning the algorithm and the results were extracted from their confusion matrix which is only related to ventricular heartbeats.

4. Conclusions

The proposed algorithm is especially designed for implementation in medical wearable wireless gadgets as it is fast with less power consumption. The study’s proposed methodology used single ECG lead signals to classify the ventricular heartbeats. Hence, the performance of the proposed classifier is compared to other existing methodologies. The system provides a significant contribution in the field of MIoT (Medical Internet of Things) and also provides the ability to train the new dataset for the enhancement of system performance. The quality of the system is capable enough to be implemented in wearable wireless devices or MIoT gadgets. In future work, there will be the need to modify this algorithm for other annotated heartbeat classification.

Author Contributions

All authors contributed equally to this work.

Funding

This work was supported by the University of Malaya Research BKP Special Grant BKS006-2018.

Acknowledgments

The authors would like to thank anonymous reviewers for their valuable comments and support.

Conflicts of Interest

The authors declare no conflict of interests.

References

  1. Writing Group Members; Thom, T.; Haase, N.; Rosamond, W.; Howard, V.J.; Rumsfeld, J.; Manolio, T.; Zheng, Z.J.; Flegal, K.; O’Donnell, C.; et al. Heart disease and stroke statistics—2006 update: A report from the American Heart Association Statistics Committee and Stroke Statistics Subcommittee. Circulation 2006, 113, e85–e151. [Google Scholar] [PubMed]
  2. Stevens, G.; Mascarenhas, M.; Mathers, C. WHO brochure». Bull. World Health Organ. 2009, 87, 646. [Google Scholar] [CrossRef] [PubMed]
  3. Li, H.; Ge, J. Cardiovascular diseases in China: Current status and future perspectives. IJC Heart Vasc. 2015, 6, 25–31. [Google Scholar] [CrossRef] [PubMed] [Green Version]
  4. Carnevale, L.; Celesti, A.; Fazio, M.; Bramanti, P.; Villari, M. Heart disorder detection with menard algorithm on apache spark. In European Conference on Service-Oriented and Cloud Computing; Springer: Berlin/Heidelberg, Germany, 2017; pp. 229–237. [Google Scholar]
  5. Melillo, P.; Castaldo, R.; Sannino, G.; Orrico, A.; de Pietro, G.; Pecchia, L. Wearable technology and ECG processing for fall risk assessment, prevention and detection. In Proceedings of the 2015 37th Annual International Conference of the IEEE, Engineering in Medicine and Biology Society (EMBC), Milan, Italy, 25–29 August 2015; pp. 7740–7743. [Google Scholar]
  6. Sannino, G.; de Pietro, G. An evolved ehealth monitoring system for a nuclear medicine department. In Proceedings of the Developments in E-Systems Engineering (DeSE), Dubai, United Arab Emirates, 6–8 December 2011; pp. 3–6. [Google Scholar]
  7. Abbasi, Q.H.; Rehman, M.U.; Qaraqe, K.; Alomainy, A. Advances in body-centric wireless communication: Applications and state-of-the-art. Institution of Engineering and Technology 2016. [Google Scholar]
  8. De Chazal, P.; O’Dwyer, M.; Reilly, R.B.R. Automatic classification of heartbeats using ECG morphology and heartbeat interval features. IEEE Trans. Biomed. Eng. 2004, 51, 1196–1206. [Google Scholar] [CrossRef] [PubMed]
  9. Tsipouras, M.G.; Fotiadis, D.I. Automatic arrhythmia detection based on time and time–frequency analysis of heart rate variability. Comput. Methods Progr. Biomed. 2004, 74, 95–108. [Google Scholar] [CrossRef]
  10. Alonso-Atienza, F.; Morgado, E.; Fernandez-Martinez, L.; Garcia-Alberola, A.; Rojo-Alvarez, J.L. Detection of life-threatening arrhythmias using feature selection and support vector machines. IEEE Trans. Biomed. Eng. 2014, 61, 832–840. [Google Scholar] [CrossRef]
  11. Zhang, Z.; Dong, J.; Luo, X.; Choi, K.S.; Wu, X. Heartbeat classification using disease-specific feature selection. Comput. Biol. Med. 2014, 46, 79–89. [Google Scholar] [CrossRef]
  12. Huang, H.; Liu, J.; Zhu, Q.; Wang, R.; Hu, G. A new hierarchical method for inter-patient heartbeat classification using random projections and RR intervals. Biomed. Eng. Online 2014, 13, 90. [Google Scholar] [CrossRef] [Green Version]
  13. Zidelmal, Z.; Amirou, A.; Ould-Abdeslam, D.; Merckle, J. ECG beat classification using a cost sensitive classifier. Comput. Methods Progr. Biomed. 2013, 111, 570–577. [Google Scholar] [CrossRef]
  14. Garcia, G.; Moreira, G.; Menotti, D.; Luz, E.J.S.R. Inter-Patient ECG Heartbeat Classification with Temporal VCG Optimized by PSO. Sci. Rep. 2017, 7, 10543. [Google Scholar] [CrossRef] [PubMed]
  15. Qurraie, S.S.; Afkhami, R.G.J.B.E.L. ECG arrhythmia classification using time frequency distribution techniques. International journal of Intelligent Engineering and Systems 2017, 7, 325–332. [Google Scholar]
  16. Ye, C.; Kumar, B.V.; Coimbra, M.T. Heartbeat classification using morphological and dynamic features of ECG signals. IEEE Trans. Biomed. Eng. 2012, 59, 2930–2941. [Google Scholar] [PubMed]
  17. Ye, C.; Kumar, B.V.; Coimbra, M.T. An Automatic Subject-Adaptable Heartbeat Classifier Based on Multiview Learning. IEEE J. Biomed. Health Inform. 2016, 20, 1485–1492. [Google Scholar] [CrossRef] [PubMed]
  18. Mar, T.; Zaunseder, S.; Martínez, J.P.; Llamedo, M.; Poll, R. Optimization of ECG classification by means of feature selection. IEEE Trans. Biomed. Eng. 2011, 58, 2168–2177. [Google Scholar] [CrossRef] [PubMed]
  19. Elhaj, F.A.; Salim, N.; Harris, A.R.; Swee, T.T.; Ahmed, T. Arrhythmia recognition and classification using combined linear and nonlinear features of ECG signals. Comput. Methods Progr. Biomed. 2016, 127, 52–63. [Google Scholar] [CrossRef] [PubMed]
  20. Raj, S.; Ray, K.C.; Shankar, O. Cardiac arrhythmia beat classification using DOST and PSO tuned SVM. Comput. Methods Progr. Biomed. 2016, 136, 163–177. [Google Scholar] [CrossRef]
  21. Castillo, O.; Melin, P.; Ramírez, E.; Soria, J. Hybrid intelligent system for cardiac arrhythmia classification with Fuzzy K-Nearest Neighbors and neural networks combined with a fuzzy system. Expert Syst. Appl. 2012, 39, 2947–2955. [Google Scholar] [CrossRef]
  22. Saini, I.; Singh, D.; Khosla, A. QRS detection using K-Nearest Neighbor algorithm (KNN) and evaluation on standard ECG databases. J. Adv. Res. 2013, 4, 331–344. [Google Scholar] [CrossRef] [Green Version]
  23. Dokur, Z.; Ölmez, T. ECG beat classification by a novel hybrid neural network. Comput. Methods Progr. Biomed. 2001, 66, 167–181. [Google Scholar] [CrossRef]
  24. Martis, R.J.; Acharya, U.R.; Min, L.C. ECG beat classification using PCA, LDA, ICA and discrete wavelet transform. Biomed. Signal Process. Control 2013, 8, 437–448. [Google Scholar] [CrossRef]
  25. Inan, O.T.; Giovangrandi, L.; Kovacs, G.T. Robust neural-network-based classification of premature ventricular contractions using wavelet transform and timing interval features. IEEE Trans. Biomed. Eng. 2006, 53, 2507–2515. [Google Scholar] [CrossRef] [PubMed]
  26. Javadi, M.; Ebrahimpour, R.; Sajedin, A.; Faridi, S.; Zakernejad, S. Improving ECG classification accuracy using an ensemble of neural network modules. PLoS ONE 2011, 6, e24386. [Google Scholar] [CrossRef] [PubMed]
  27. Afkhami, R.G.; Azarnia, G.; Tinati, M.A. Cardiac arrhythmia classification using statistical and mixture modeling features of ECG signals. Pattern Recognit. Lett. 2016, 70, 45–51. [Google Scholar] [CrossRef]
  28. Wu, Z.; Ding, X.; Zhang, G. A novel method for classification of ECG arrhythmias using deep belief networks. J. Comput. Intell. Appl. 2016, 15, 1650021. [Google Scholar] [CrossRef]
  29. Acharya, U.R.; Oh, S.L.; Hagiwara, Y.; Tan, J.H.; Adam, M.; Gertych, A.; San Tan, R. A deep convolutional neural network model to classify heartbeats. Comput. Biol. Med. 2017, 89, 389–396. [Google Scholar] [CrossRef] [PubMed]
  30. Kiranyaz, S.; Ince, T.; Gabbouj, M. Real-time patient-specific ECG classification by 1-D convolutional neural networks. IEEE Trans. Biomed. Eng. 2016, 63, 664–675. [Google Scholar] [CrossRef]
  31. Krasteva, V.; Jekova, I. QRS template matching for recognition of ventricular ectopic beats. Ann. Biomed. Eng. 2007, 35, 2065–2076. [Google Scholar] [CrossRef]
  32. Jaeger, H.J.B. The “Echo State” Approach to Analysing and Training Recurrent Neural Networks-with An Erratum Note; German National Research Center for Information Technology GMD Technical Report; German National Research Center: Bonn, Germany, 2001; Volume 148, p. 13. [Google Scholar]
  33. Lukoševičius, M.; Jaeger, H. Reservoir computing approaches to recurrent neural network training. Comput. Sci. Rev. 2009, 3, 127–149. [Google Scholar] [CrossRef]
  34. Greenwald, S.D.; Patil, R.S.; Mark, R.G. Improved detection and classification of arrhythmias in noise-corrupted electrocardiograms using contextual information. In Proceedings of the Proceedings Computers in Cardiology, Chicago, IL, USA, 23–26 September 1990; pp. 461–464. [Google Scholar]
  35. Goldberger, A.L.; Amaral, L.A.; Glass, L.; Hausdorff, J.M.; Ivanov, P.C.; Mark, R.G.; Mietus, J.E.; Moody, G.B.; Peng, C.-K.; Stanley, H.E.J.C. PhysioBank, PhysioToolkit, and PhysioNet: Components of a new research resource for complex physiologic signals. Circulation 2000, 101, e215–e220. [Google Scholar] [CrossRef]
  36. ANSI/AAMI EC57:1998. Testing and Reporting Performance Results of Cardiac Rhythm and ST Segment Measurement Algorithms; AAMI: Brisbane, Australia, 1998. [Google Scholar]
  37. Friesen, G.M.; Jannett, T.C.; Jadallah, M.A.; Yates, S.L.; Quint, S.R.; Nagle, H.T. A comparison of the noise sensitivity of nine QRS detection algorithms. IEEE Trans. Biomed. Eng. 1990, 37, 85–98. [Google Scholar] [CrossRef] [PubMed]
  38. Chandrakar, B.; Yadav, O.P.; Chandra, V.K. A survey of noise removal techniques for ECG signals. Int. J. Adv. Res. Comput. Commun. Eng. 2013, 2, 1354–1357. [Google Scholar]
  39. Cuomo, S.; De Pietro, G.; Farina, R.; Galletti, A.; Sannino, G. A revised scheme for real time ecg signal denoising based on recursive filtering. Biomed. Signal Process. Control 2016, 27, 134–144. [Google Scholar] [CrossRef]
  40. Farina, R.; Dobricic, S.; Storto, A.; Masina, S.; Cuomo, S. A revised scheme to compute horizontal covariances in an oceanographic 3D-VAR assimilation system. J. Comput. Phys. 2015, 284, 631–647. [Google Scholar] [CrossRef] [Green Version]
  41. De Chazal, P.; Reilly, R.B. A patient-adapting heartbeat classifier using ECG morphology and heartbeat interval features. IEEE Trans. Biomed. Eng. 2006, 53, 2535–2543. [Google Scholar] [CrossRef] [PubMed]
  42. Pratt, W.K. Digital Image Processing: PIKS Scientific Inside; Wiley-Interscience: Hoboken, NJ, USA, 2007. [Google Scholar]
  43. IEEE Acoustics, Speech, and Signal Processing Society. Digital Signal Processing Committee. In Programs for digital signal processing; IEEE: Piscataway, NJ, USA, 1979. [Google Scholar]
  44. Pan, J.; Tompkins, W.J. A real-time QRS detection algorithm. IEEE Trans. Biomed. Eng. 1985, 32, 230–236. [Google Scholar] [CrossRef] [PubMed]
  45. Acharya, U.R.; Fujita, H.; Oh, S.L.; Raghavendra, U.; Tan, J.H.; Adam, M.; Gertych, A.; Hagiwara, Y. Automated identification of shockable and non-shockable life-threatening ventricular arrhythmias using convolutional neural network. Future Gen. Comput. Syst. 2018, 79, 952–959. [Google Scholar] [CrossRef]
  46. Nong, W. A novel algorithm for ventricular arrhythmia classification using a fuzzy logic approach. Aust. Phys. Eng. Sci. Med. 2016, 39, 903–912. [Google Scholar]
  47. Jain, A.K.; Duin, R.P.; Mao, J. Statistical pattern recognition: A review. IEEE Trans.Pattern Anal. Mach. Intell. 2000, 22, 4–37. [Google Scholar] [CrossRef]
  48. Kim, Y.J.; Heo, J.; Park, K.S.; Kim, S. Proposition of novel classification approach and features for improved real-time arrhythmia monitoring. Comput. Biol. Med. 2016, 75, 190–202. [Google Scholar] [CrossRef]
  49. Maass, W.; Natschläger, T.; Markram, H. Real-time computing without stable states: A new framework for neural computation based on perturbations. Neural Comput. 2002, 14, 2531–2560. [Google Scholar] [CrossRef] [PubMed]
  50. Yamazaki, T.; Tanaka, S. The cerebellum as a liquid state machine. Neural Netw. 2007, 20, 290–297. [Google Scholar] [CrossRef] [PubMed]
  51. Brunner, D.; Soriano, M.C.; Mirasso, C.R.; Fischer, I. Parallel photonic information processing at gigabyte per second data rates using transient states. Nat. Commun. 2013, 4, 1364. [Google Scholar] [CrossRef] [PubMed] [Green Version]
  52. Albert, A. Regression and the Moore-Penrose Pseudoinverse; Elsevier: Amsterdam, The Netherlands, 1972. [Google Scholar]
  53. Tikhonov, A.; Goncharsky, A.; Stepanov, V.; Yagola, A.G. Numerical methods for the solution of ill-posed problems (Mathematics and its Applications). 1995. [Google Scholar]
  54. Kutlu, Y.; Kuntalp, D. Feature extraction for ECG heartbeats using higher order statistics of WPD coefficients. Comput. Methods Progr. Biomed. 2012, 105, 257–267. [Google Scholar] [CrossRef] [PubMed]
  55. Zhang, H. System for Cardiac Arrhythmia Detection and Characterization. U.S. Google Patent 8,233,972, 31 July 2012. [Google Scholar]
  56. Teijeiro, T.; Félix, P.; Presedo, J.; Castro, D. Heartbeat classification using abstract features from the abductive interpretation of the ECG. IEEE J. Biomed. Health Inform. 2018, 22, 409–420. [Google Scholar] [CrossRef]
  57. Llamedo, M.; Martínez, J.P. Heartbeat classification using feature selection driven by database generalization criteria. IEEE Trans. Biomed. Eng. 2011, 58, 616–625. [Google Scholar] [CrossRef]
  58. Llamedo, M.; Martínez, J.P. An automatic patient-adapted ECG heartbeat classifier allowing expert assistance. IEEE Trans. Biomed. Eng. 2012, 59, 2312–2320. [Google Scholar] [CrossRef]
Figure 1. Schematic representation of ventricular heartbeat classifier.
Applsci 09 00702 g001
Figure 2. (a) Representation of Noisy ECG signal; (b) Representation of Filtered ECG signal.
Applsci 09 00702 g002
Figure 3. Representation of detected R-peaks in the ECG signal.
Applsci 09 00702 g003
Figure 4. Representation of QRS segmented area in the ECG signal.
Applsci 09 00702 g004
Figure 5. Template matching of segmented heartbeat where red is the original abnormal beat and blue and black is the original normal beat and template beat, respectively.
Applsci 09 00702 g005
Figure 6. Representation of standard ESN (Echo State Networks) architecture.
Applsci 09 00702 g006
Figure 7. Representation of standard proposed cyclic or ring ESN architecture.
Applsci 09 00702 g007
Figure 8. Confusion matrix of the ECG1 classified beats.
Applsci 09 00702 g008
Figure 9. Confusion matrix of the ECG2 classified beats.
Applsci 09 00702 g009
Figure 10. Confusion matrix of the AHA classified beats.
Applsci 09 00702 g010
Figure 11. Graphical representation of the performance Analysis of the ESN model.
Applsci 09 00702 g011
Table 1. List of acronyms used in this study.
Acronyms
MIT-BIH-ARMassachusetts Institute of Technology-Beth Israel arrhythmia
MIT-BIH-SVDMMassachusetts Institute of Technology-Beth Israel Hospital Supraventricular Arrhythmia database
AHAAmerican Heart Association
ECGElectrocardiogram
RCReservoir computing
MIoTMedical Internet of Things
ANDSI/AAMIAmerican Nation Standards Institute/Association for the Advancement of Medical Instrumentation
SVBSupraventricular Beat
VBVentricular Beat
Table 2. The Description of Data sets used in this study.
DatasetECG RecPatientsLeadsSVBVB
AHA155-2317,61232,403
MIT-BIH-SVDB78-2174,3179953
MIT-BIH-AR4847292,7547803
Table 3. Performance Analysis of ESN model.
LeadsAcc (%)Se (%)Er
ECG 19898.980.02
ECG 29798.970.03
AHA9697.950.04
Where acc is accuracy, Se is sensitivity, Sp is specificity, and Er is the error rate.
Table 4. Comparison analysis of the proposed work with existing studies.
Existing StudiesLeads+P (%)Se (%)
[57]MLII (modified lead II) and V192.885.5
[58]MLII and V187.089.0
[17]MLII and V198.091.8
Proposed WorkMLII98.9898.98
V198.9697.95

