Experimental Study on Mechanical Properties, Energy Dissipation Characteristics and Acoustic Emission Parameters of Compression Failure of Sandstone Specimens Containing En Echelon Flaws


Abstract
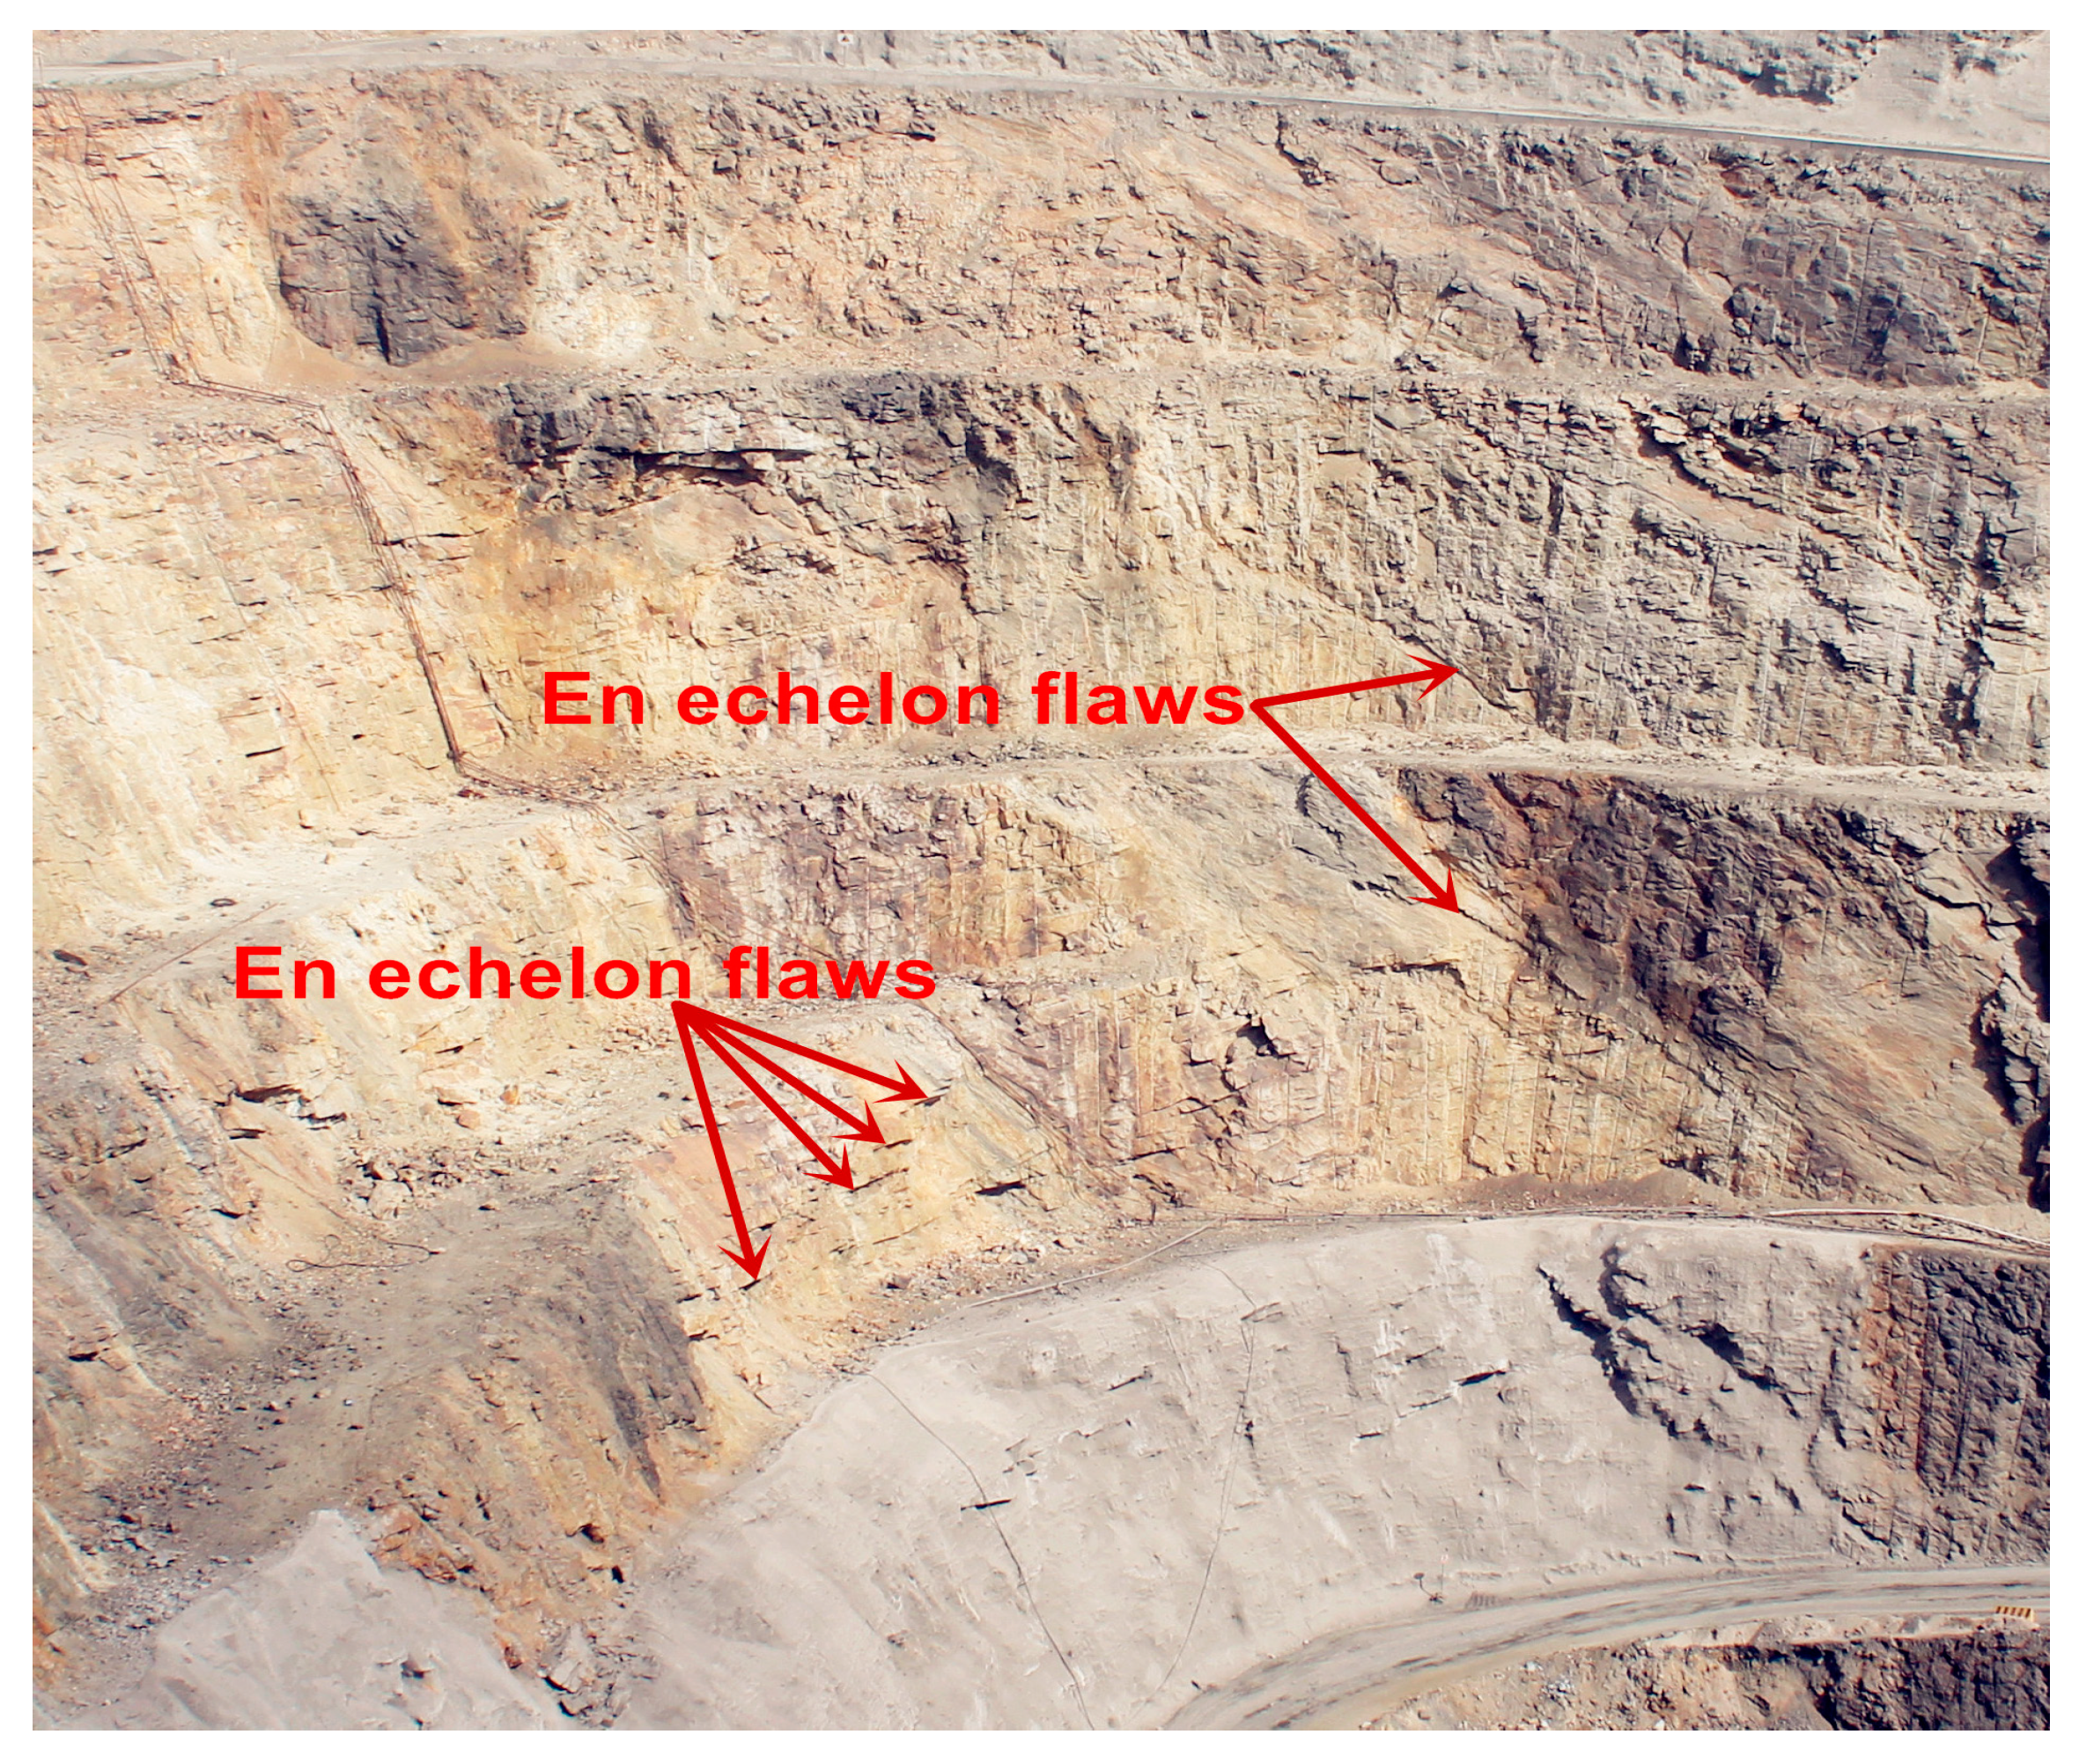
:1. Introduction
2. Specimen Preparation and Testing
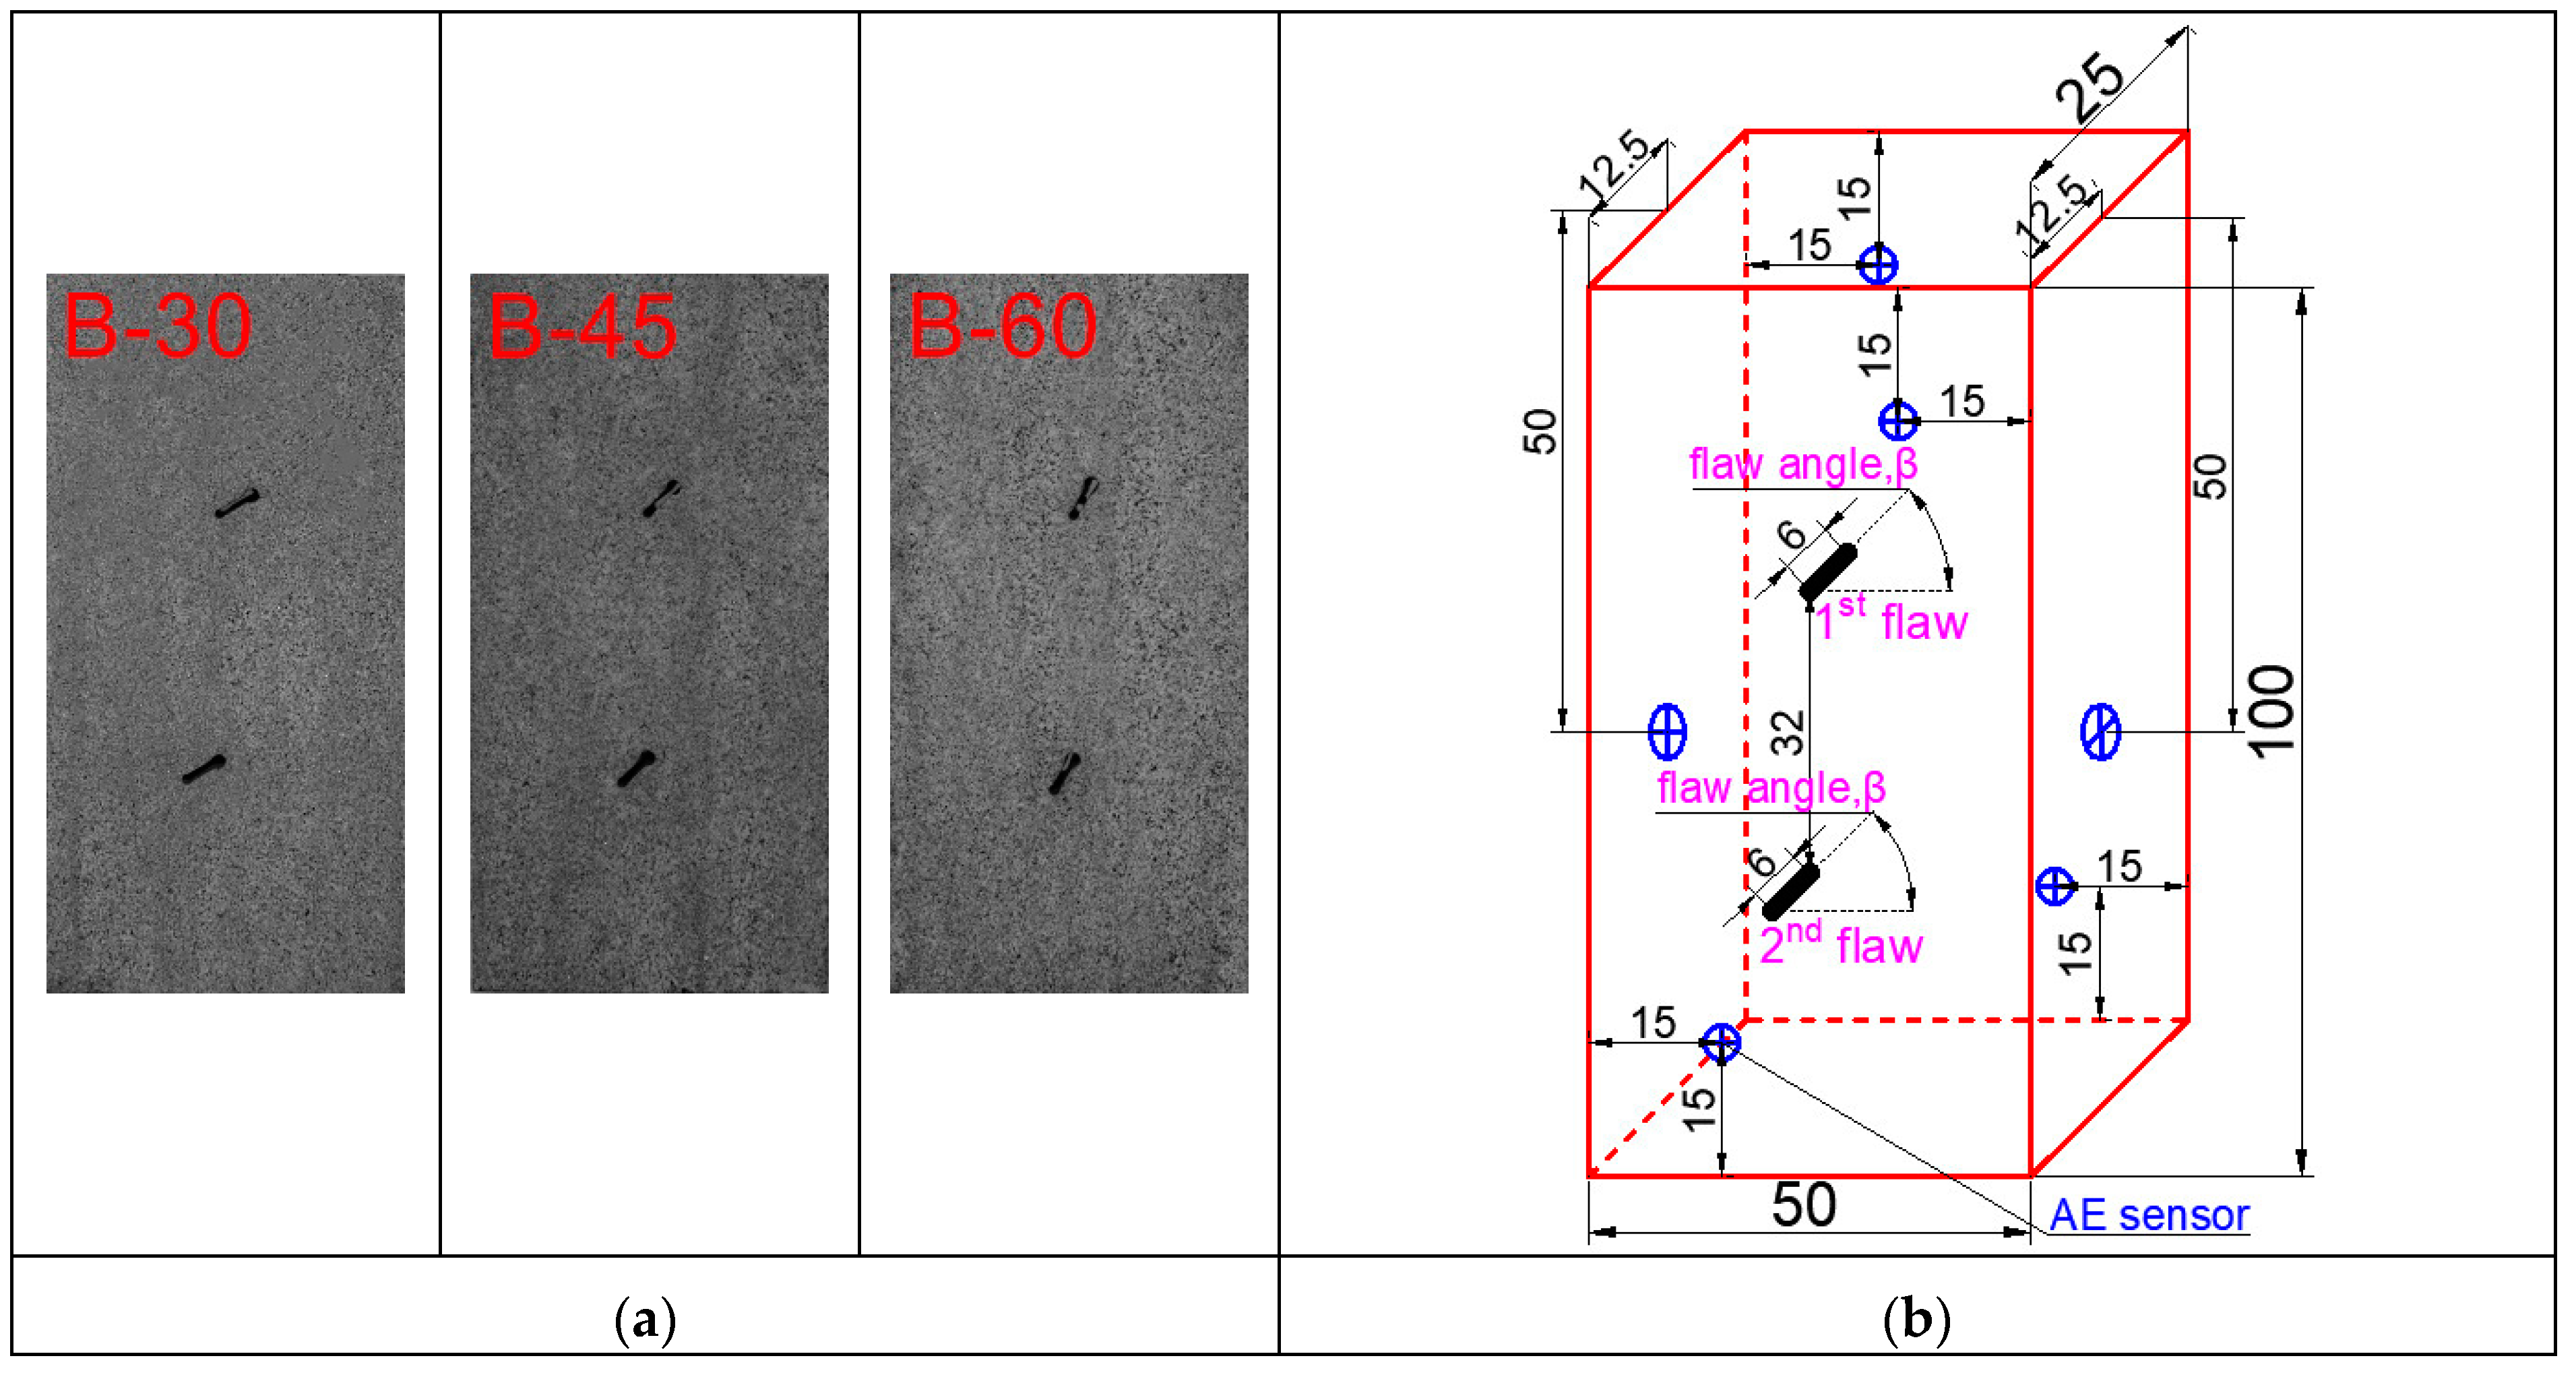
2.1. Specimen Preparation
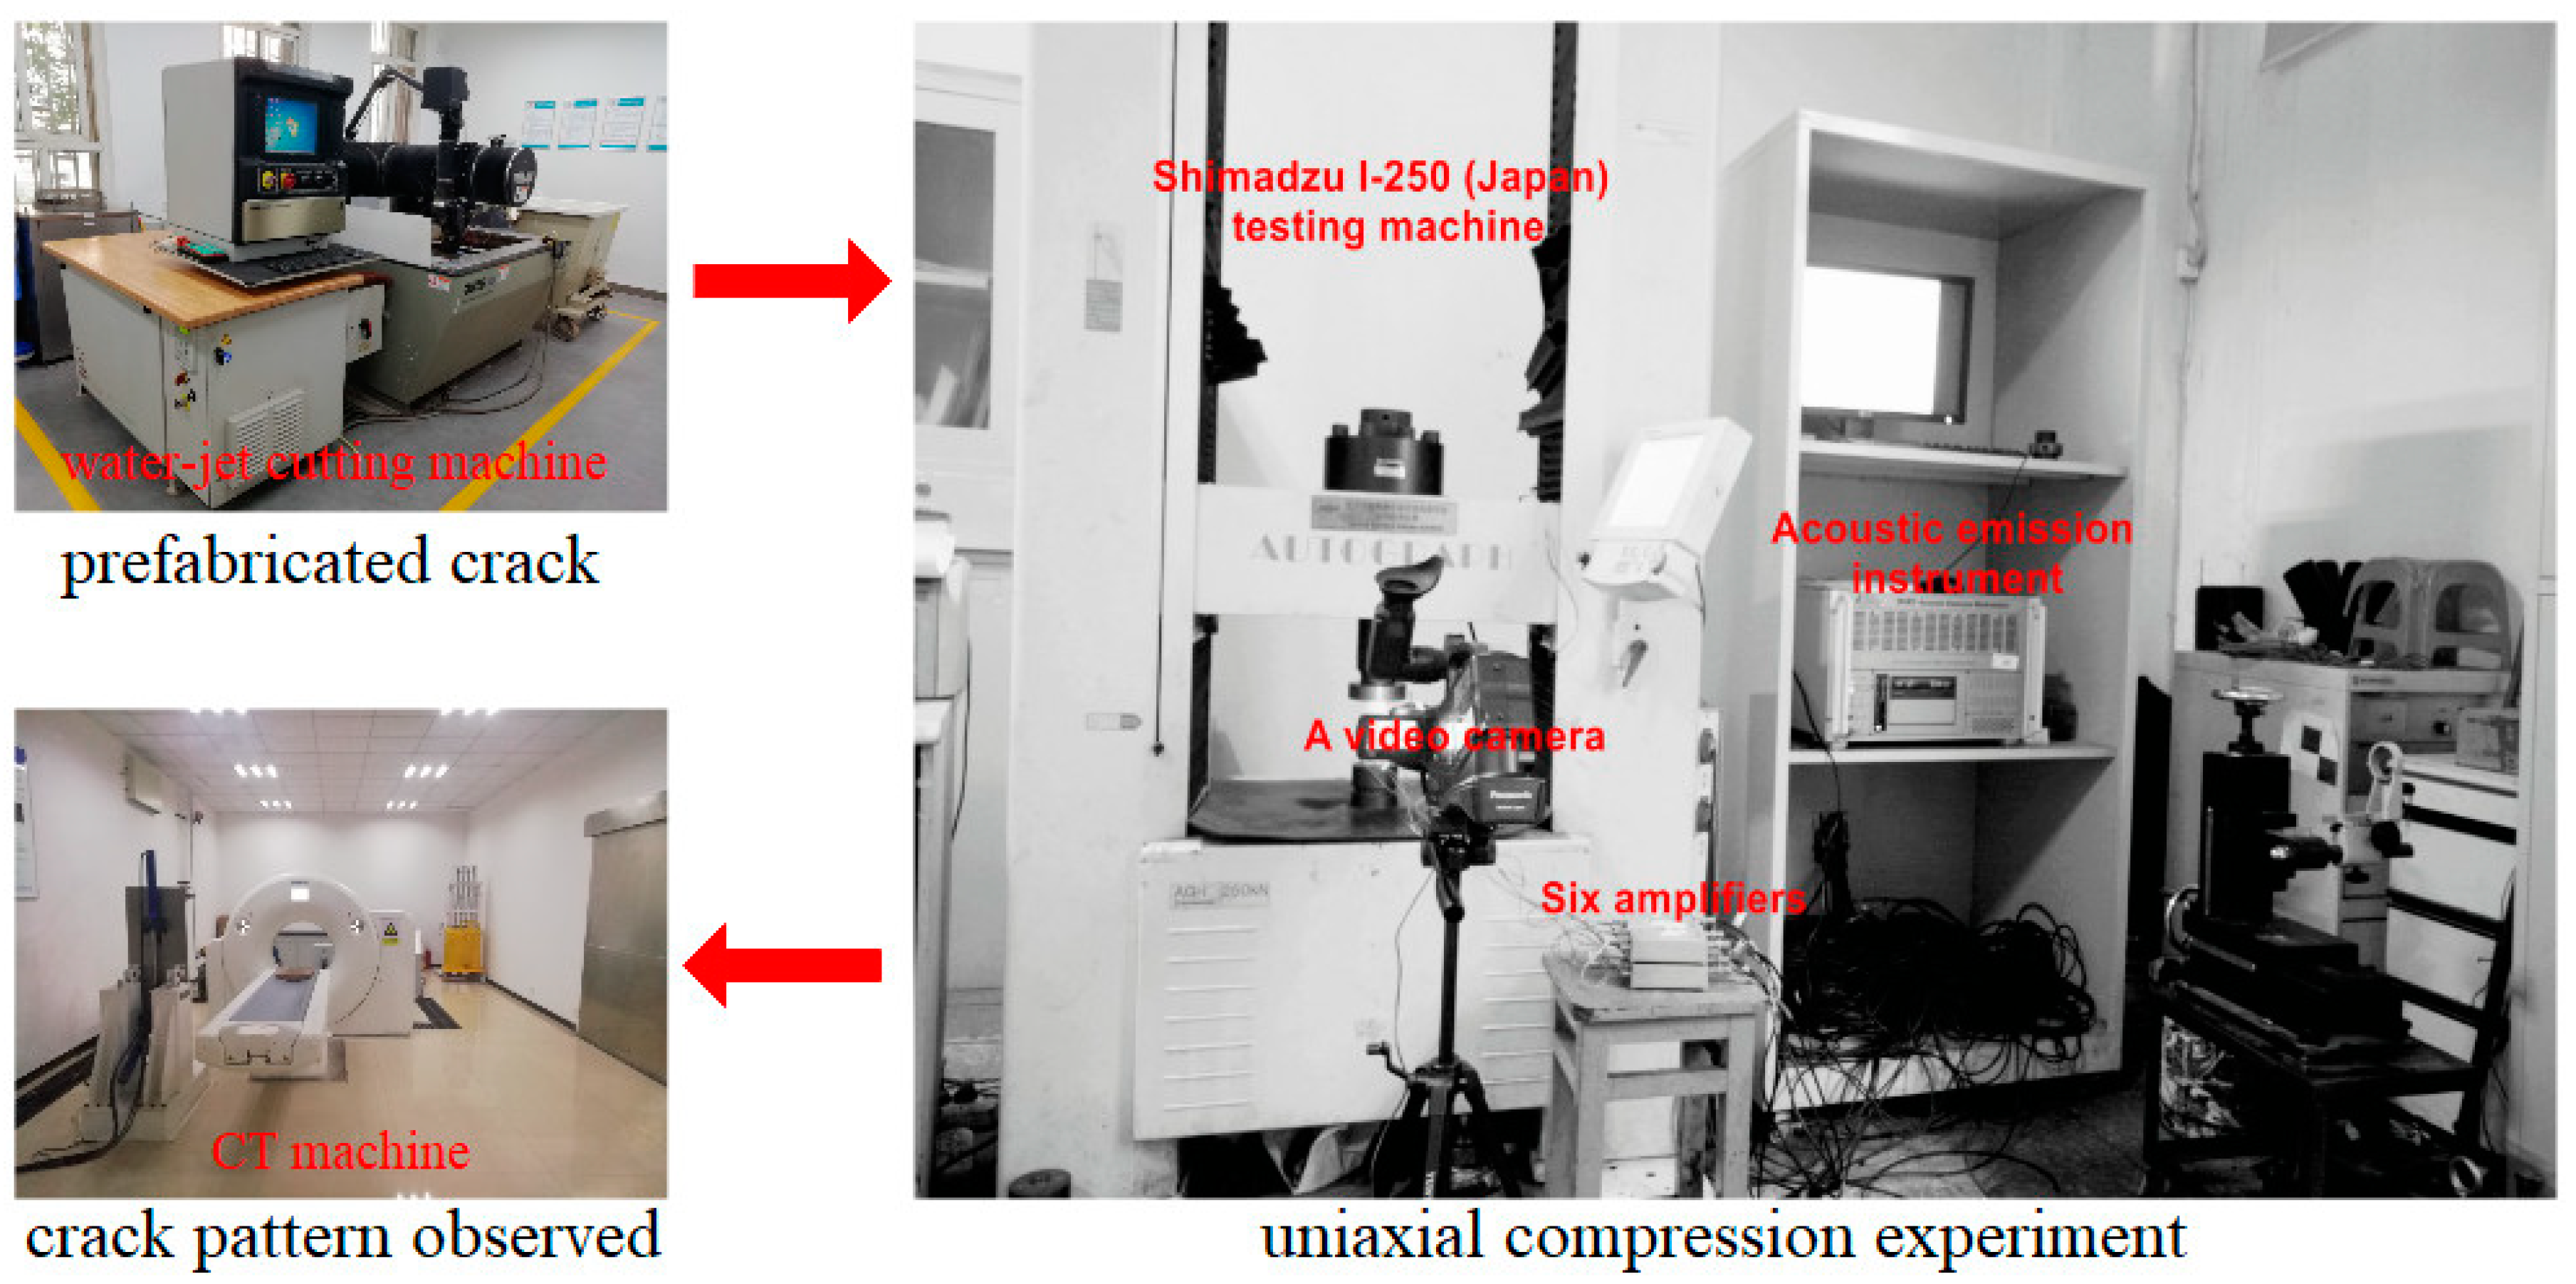
2.2. Testing System
3. Experimental Results and Theoretical Analysis
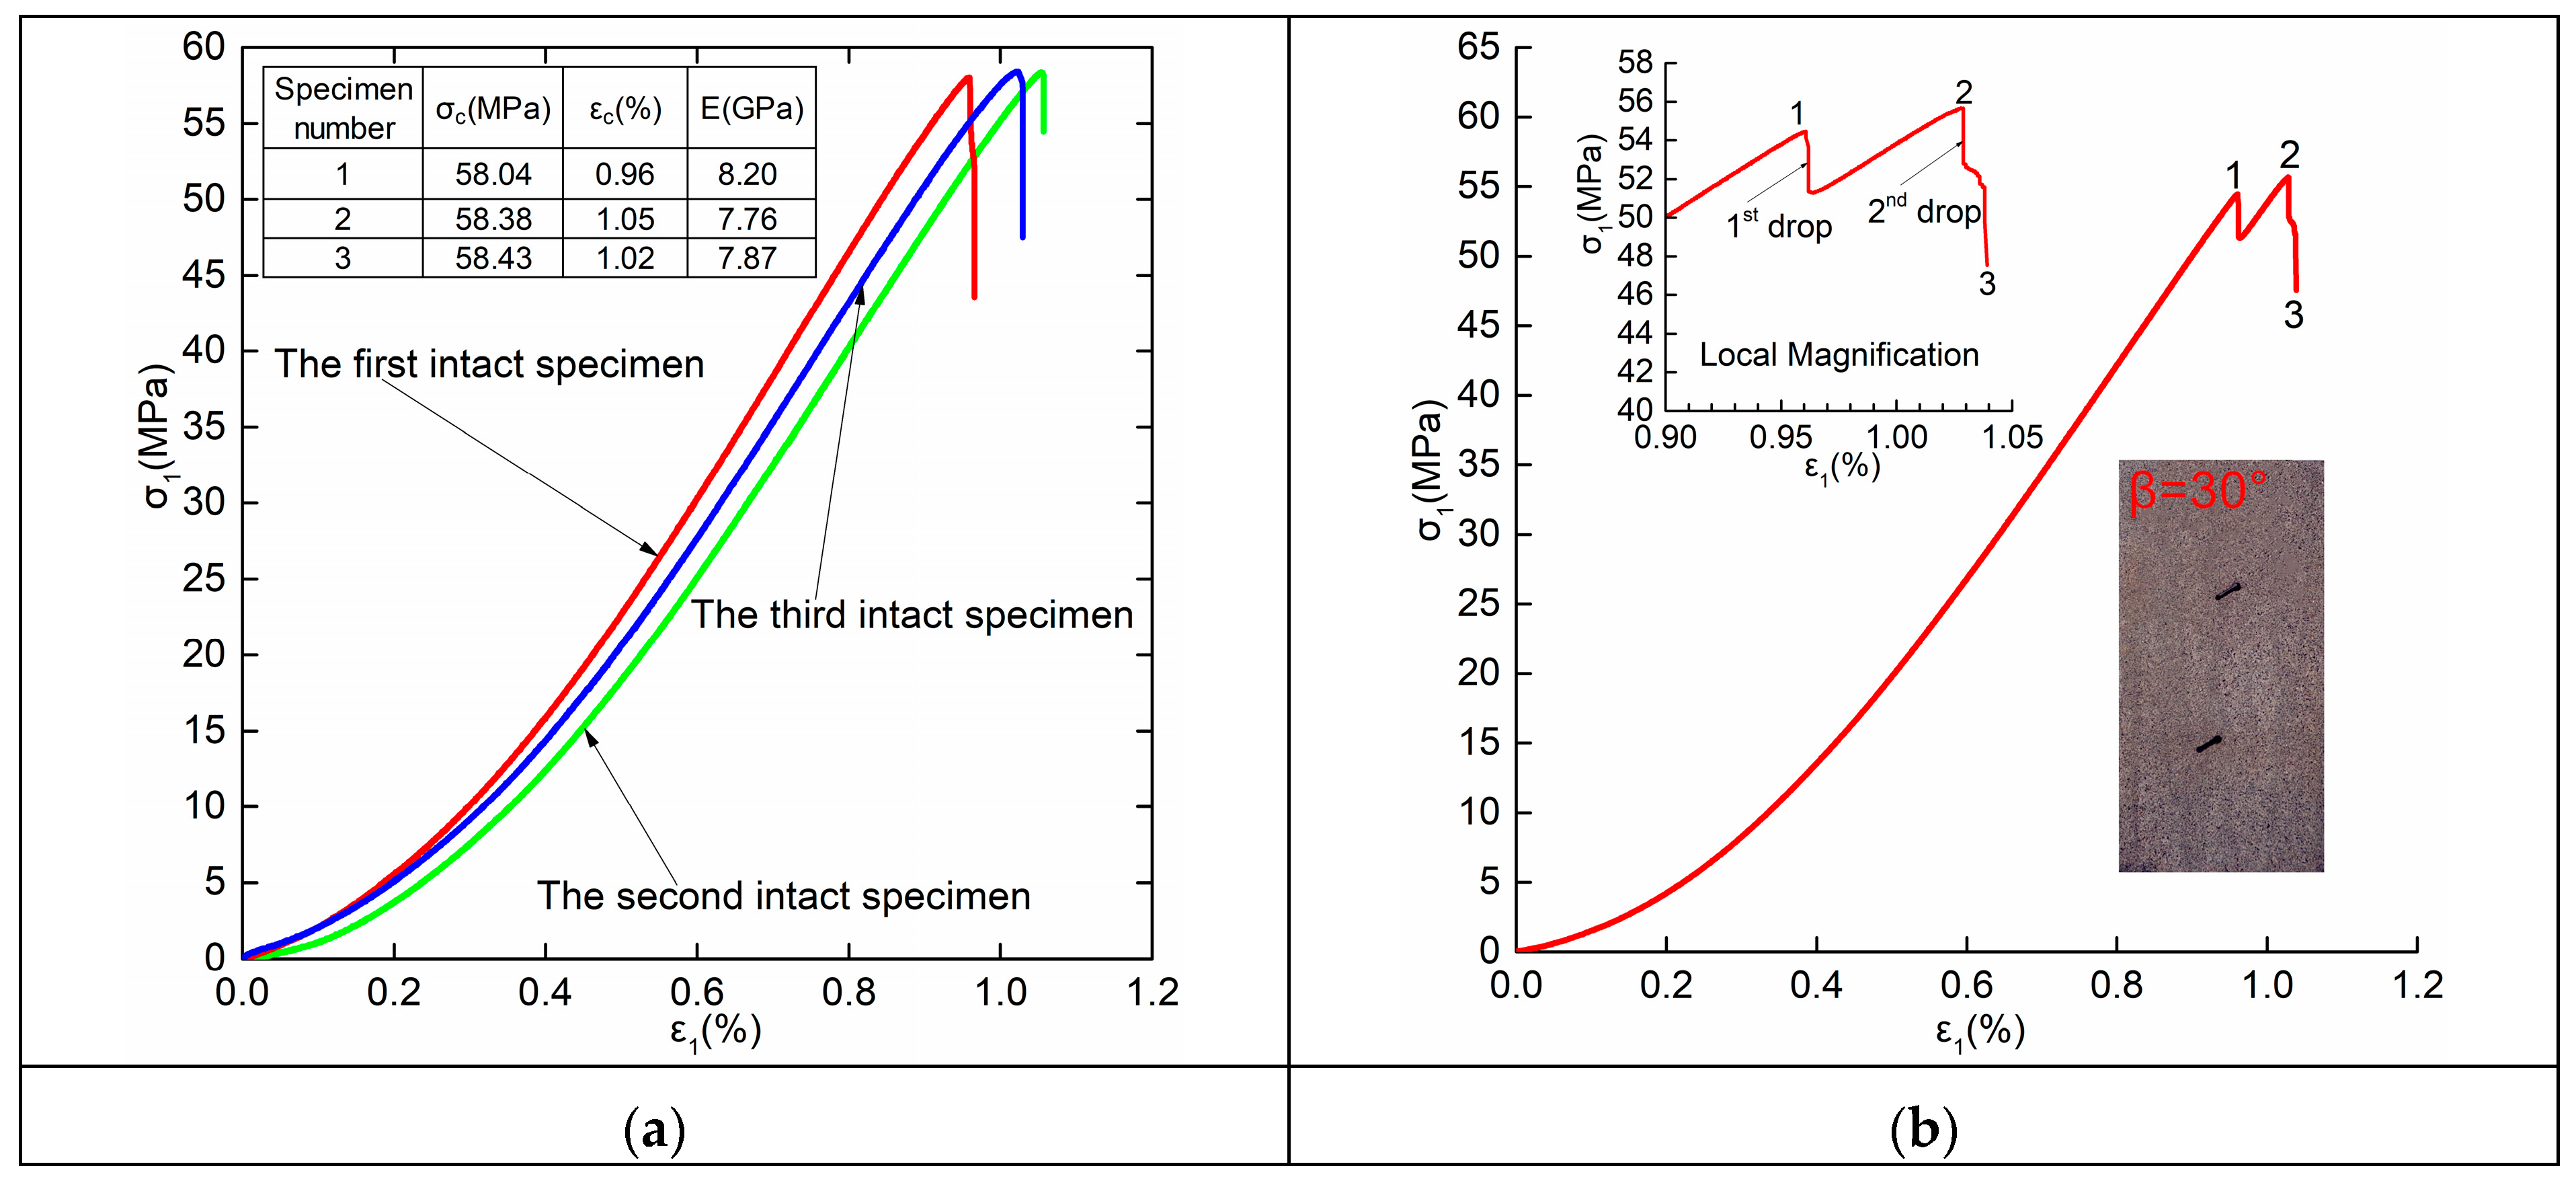
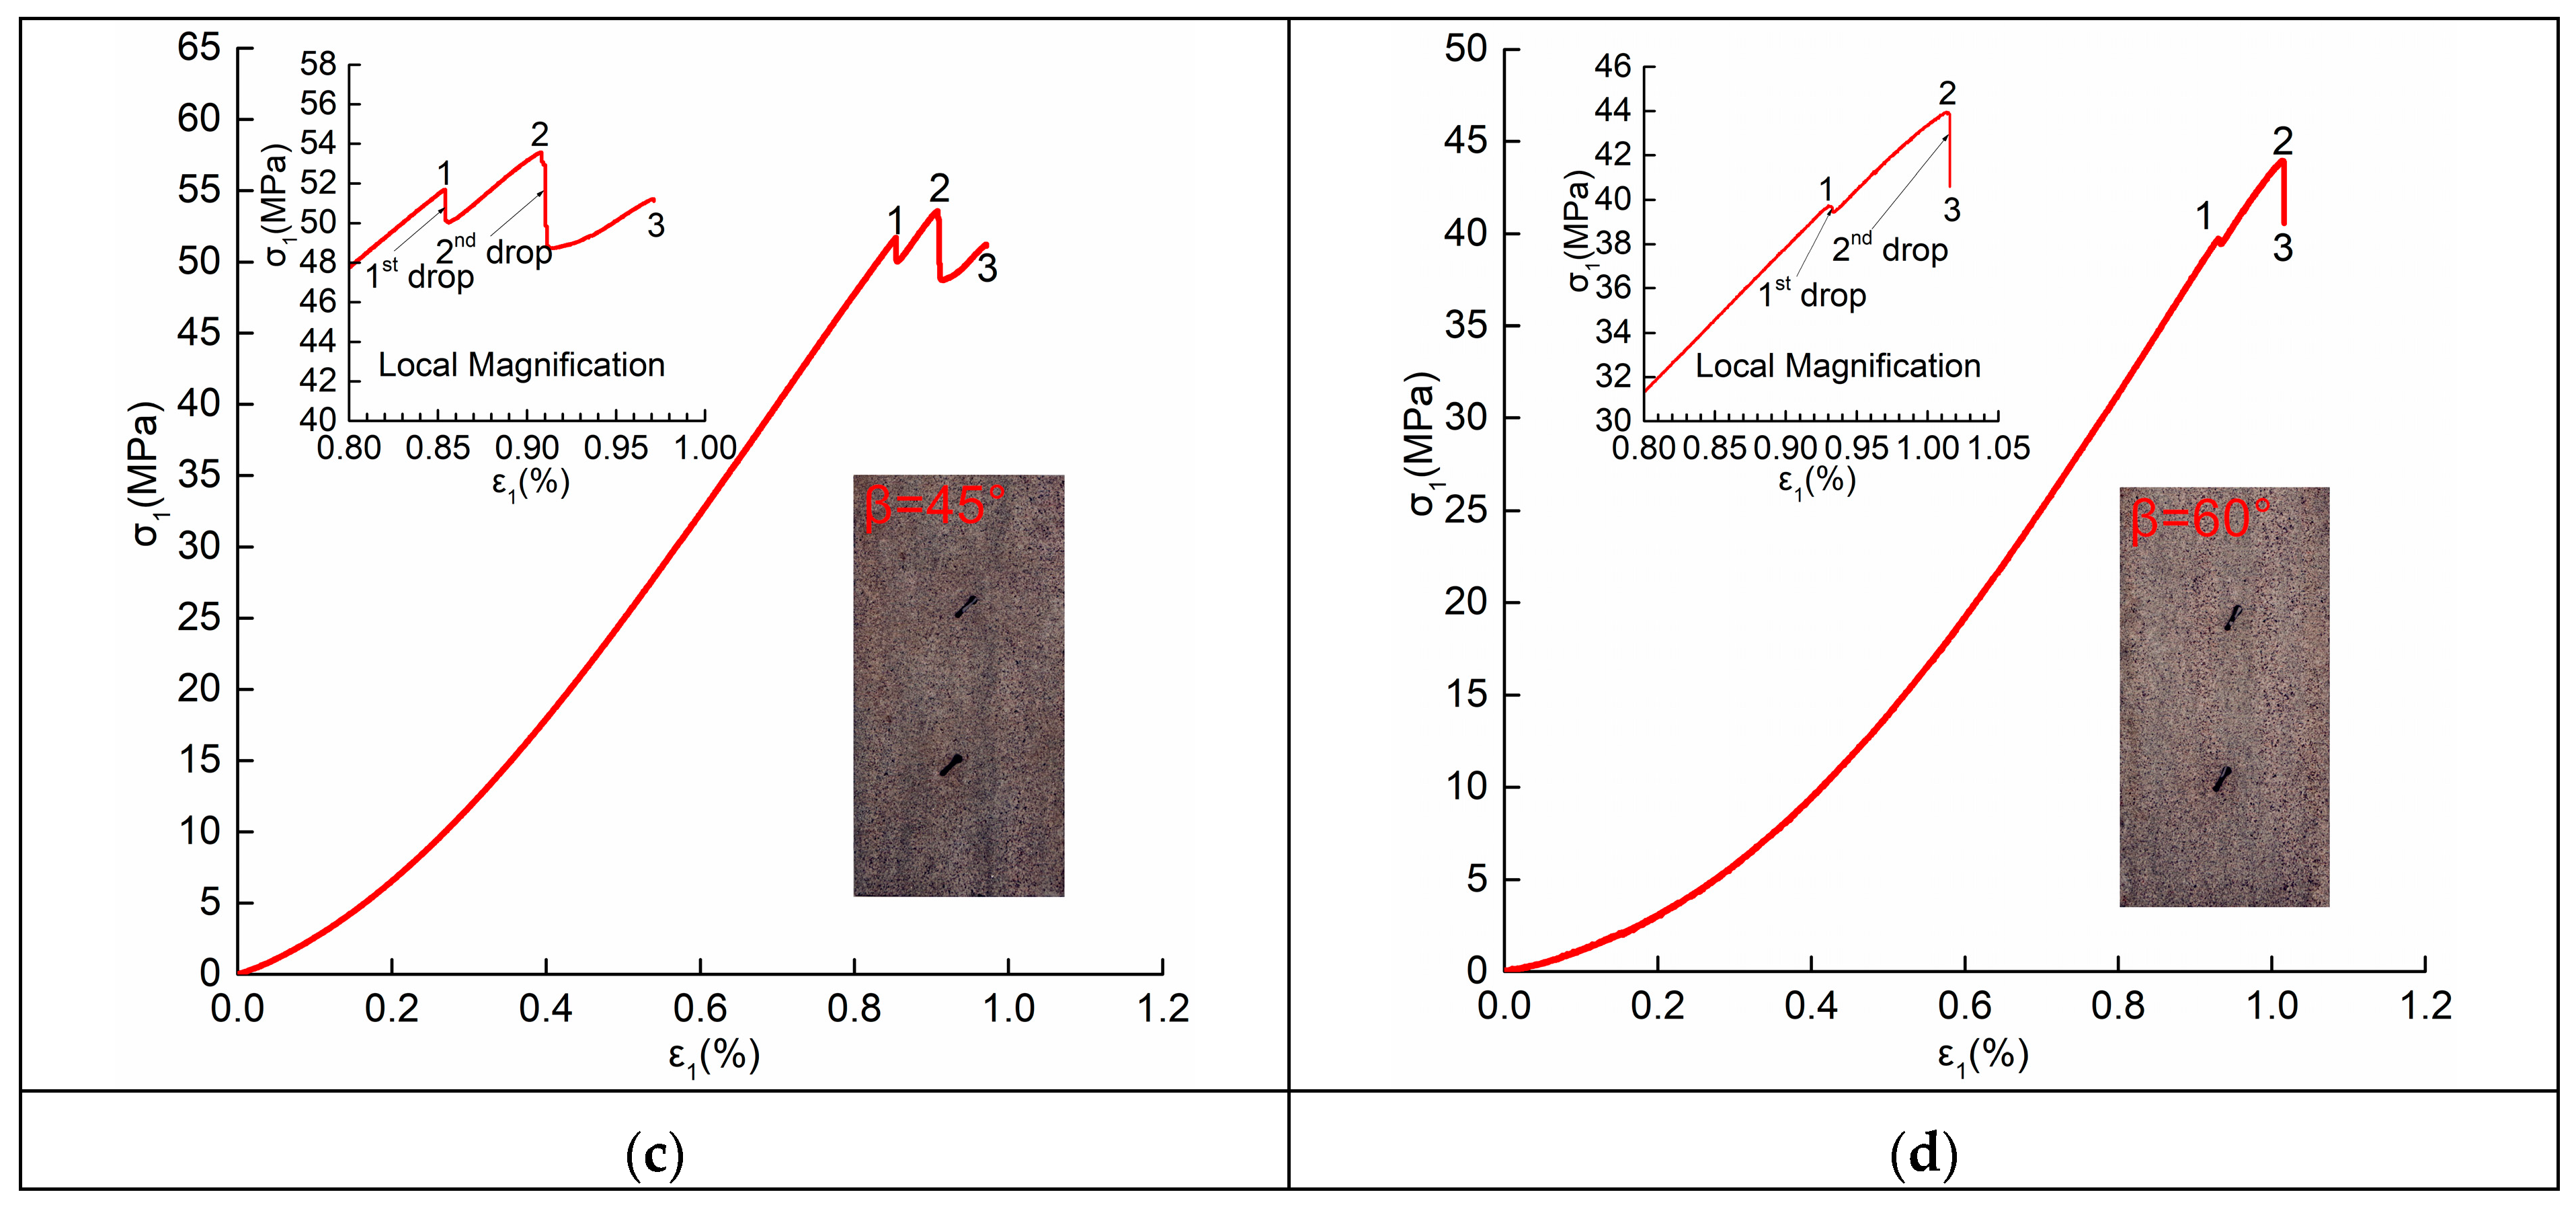
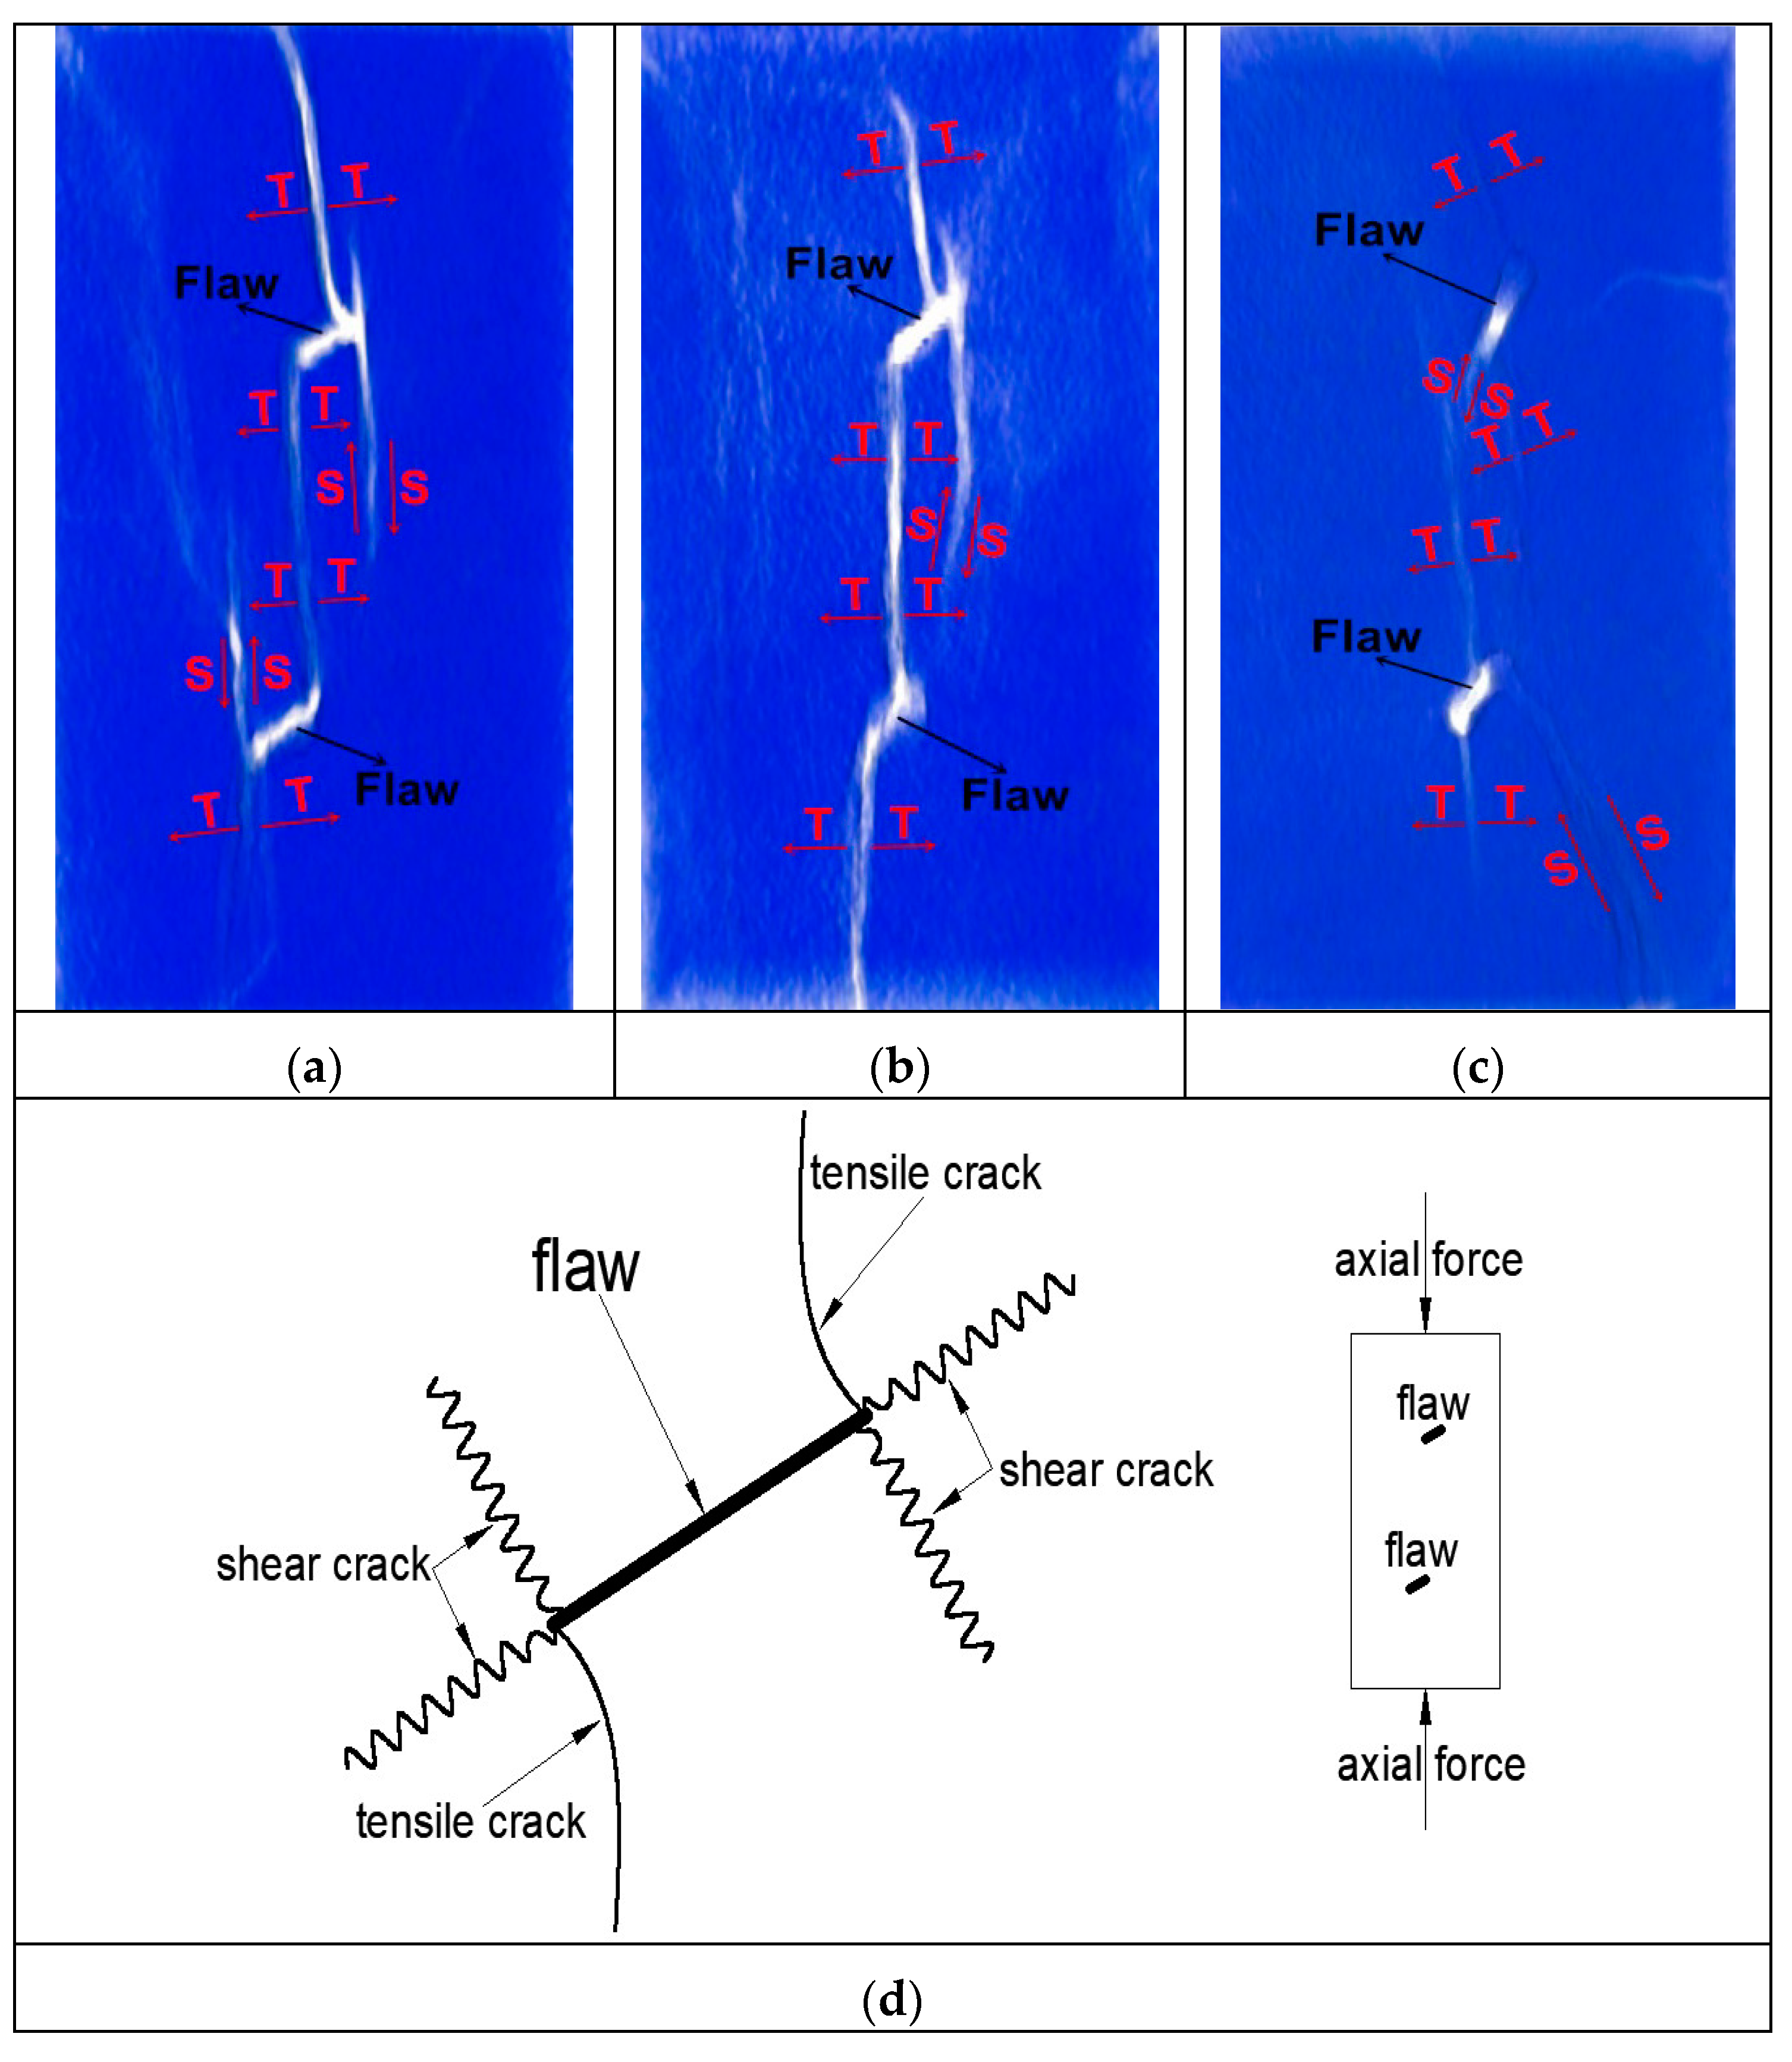
3.1. Mechanical Properties
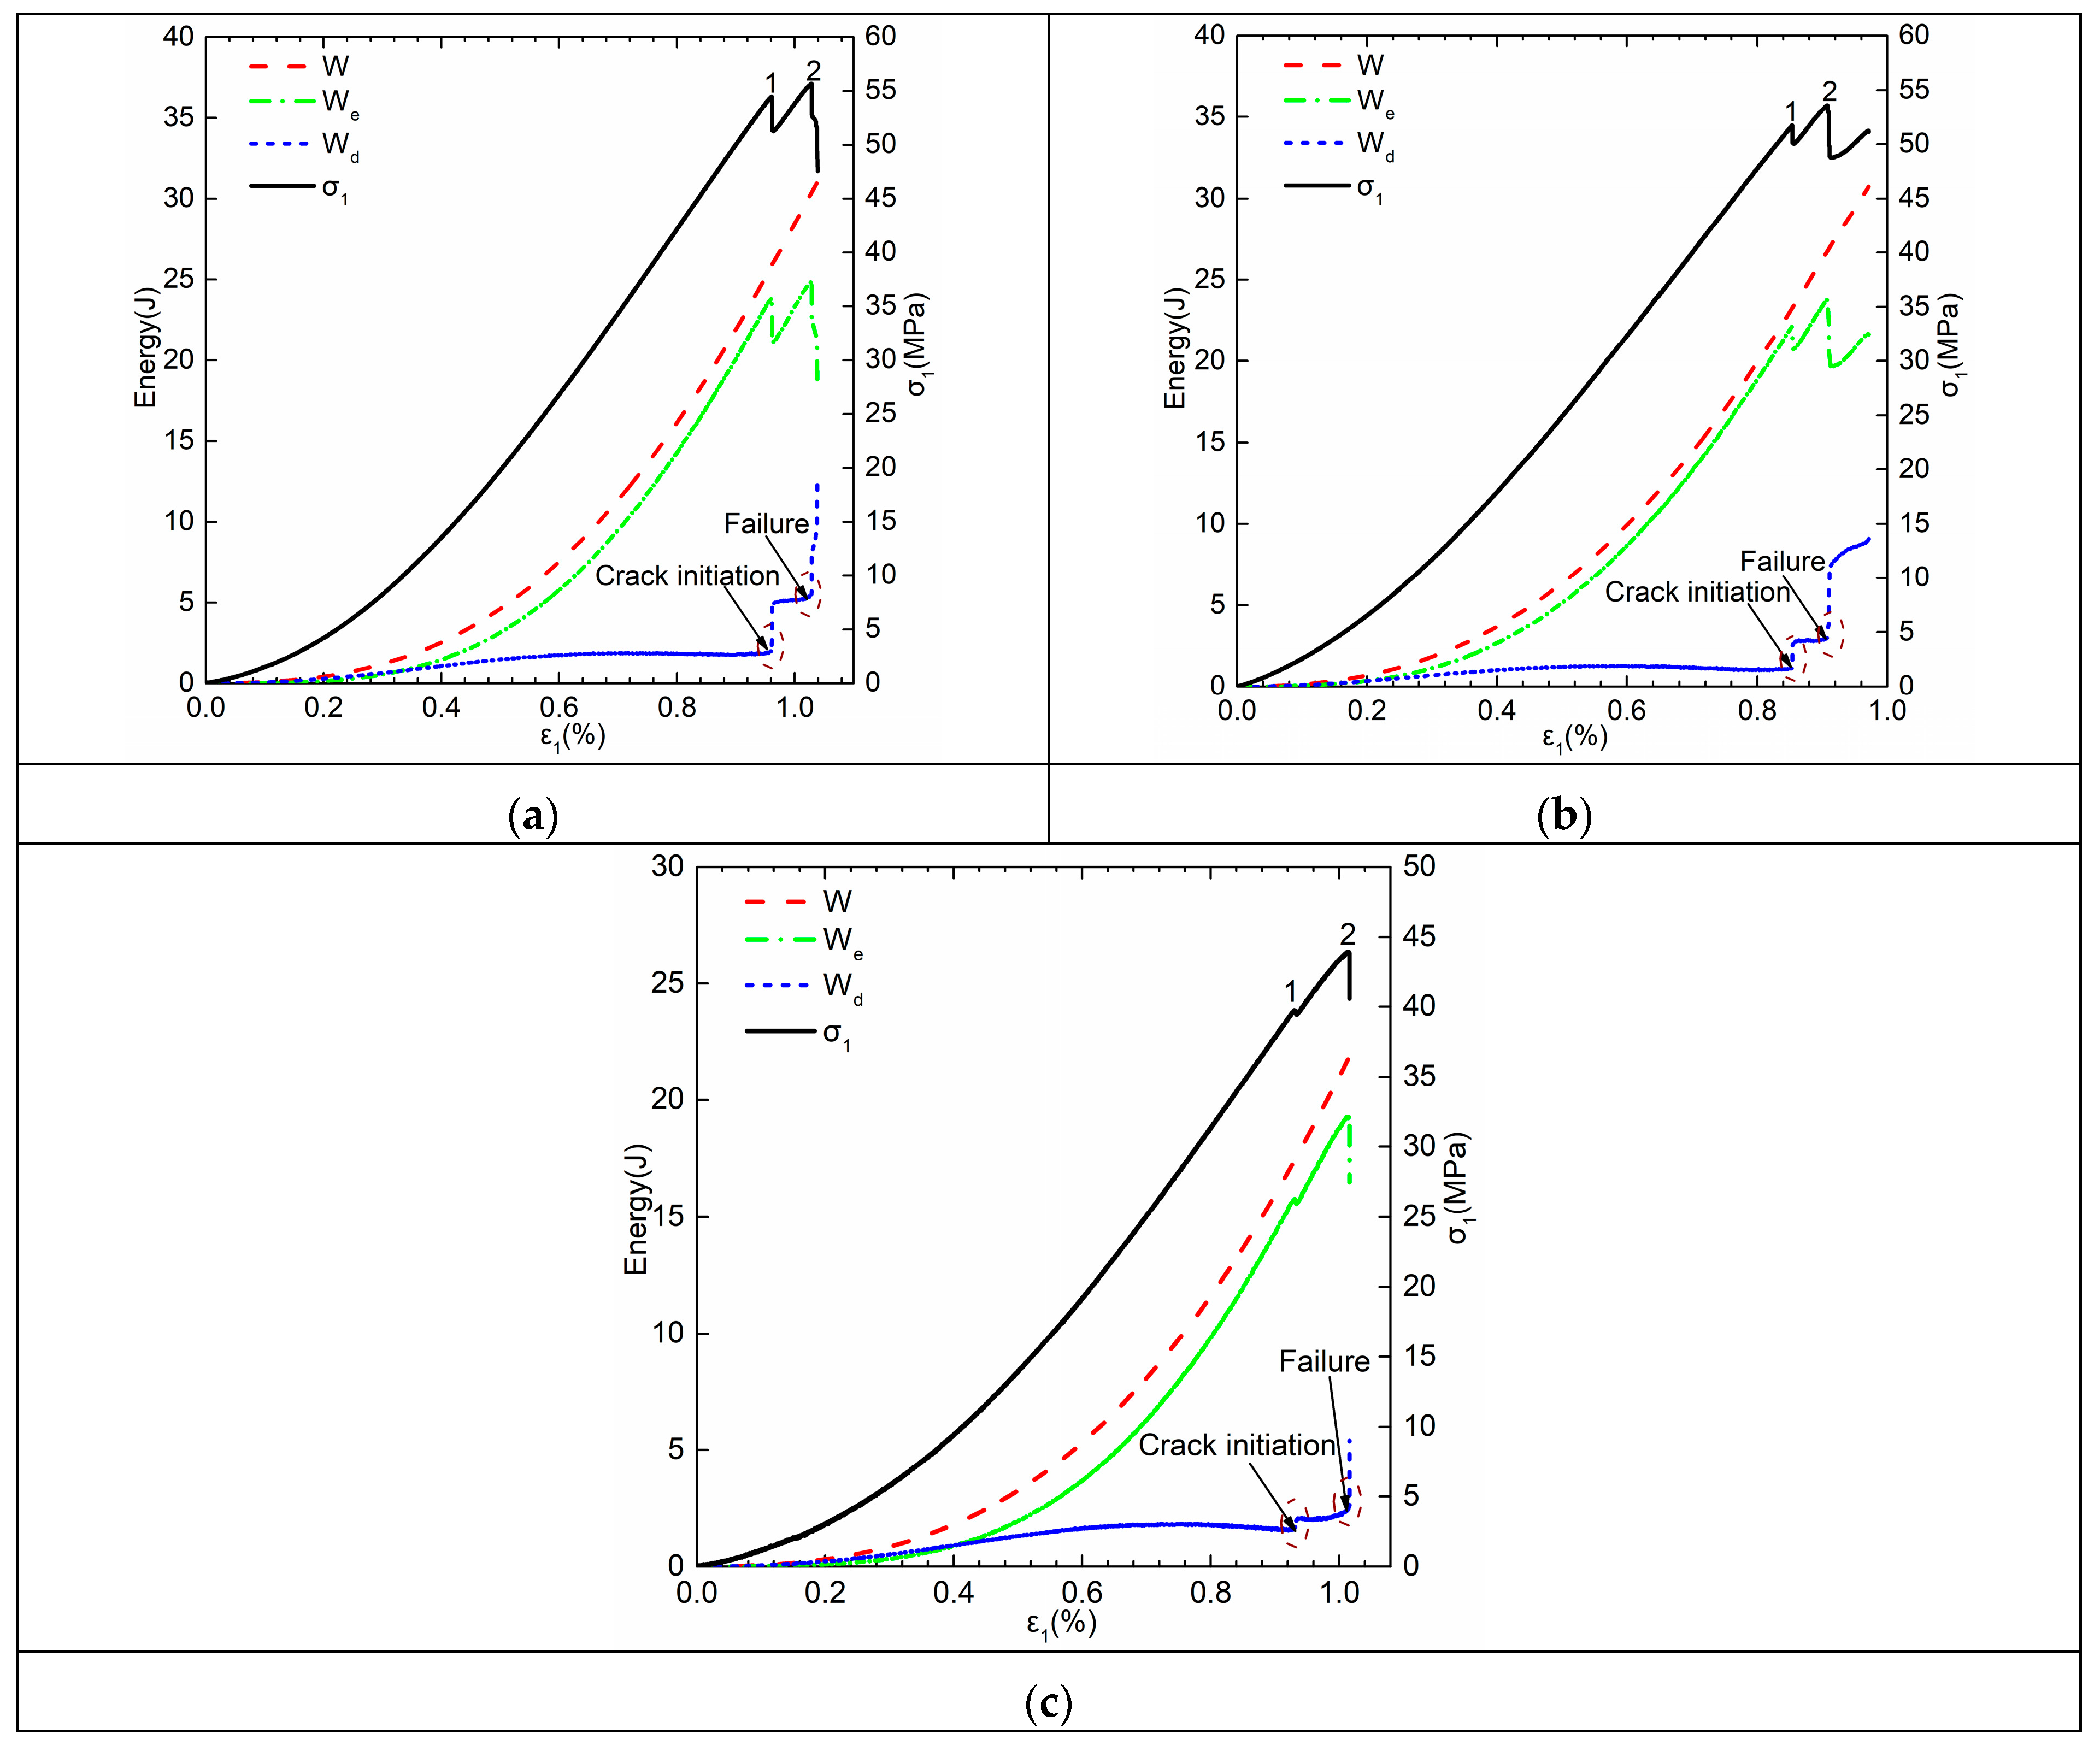
3.2. Energy Dissipation Characteristics
3.3. Acoustic Emission Parameters
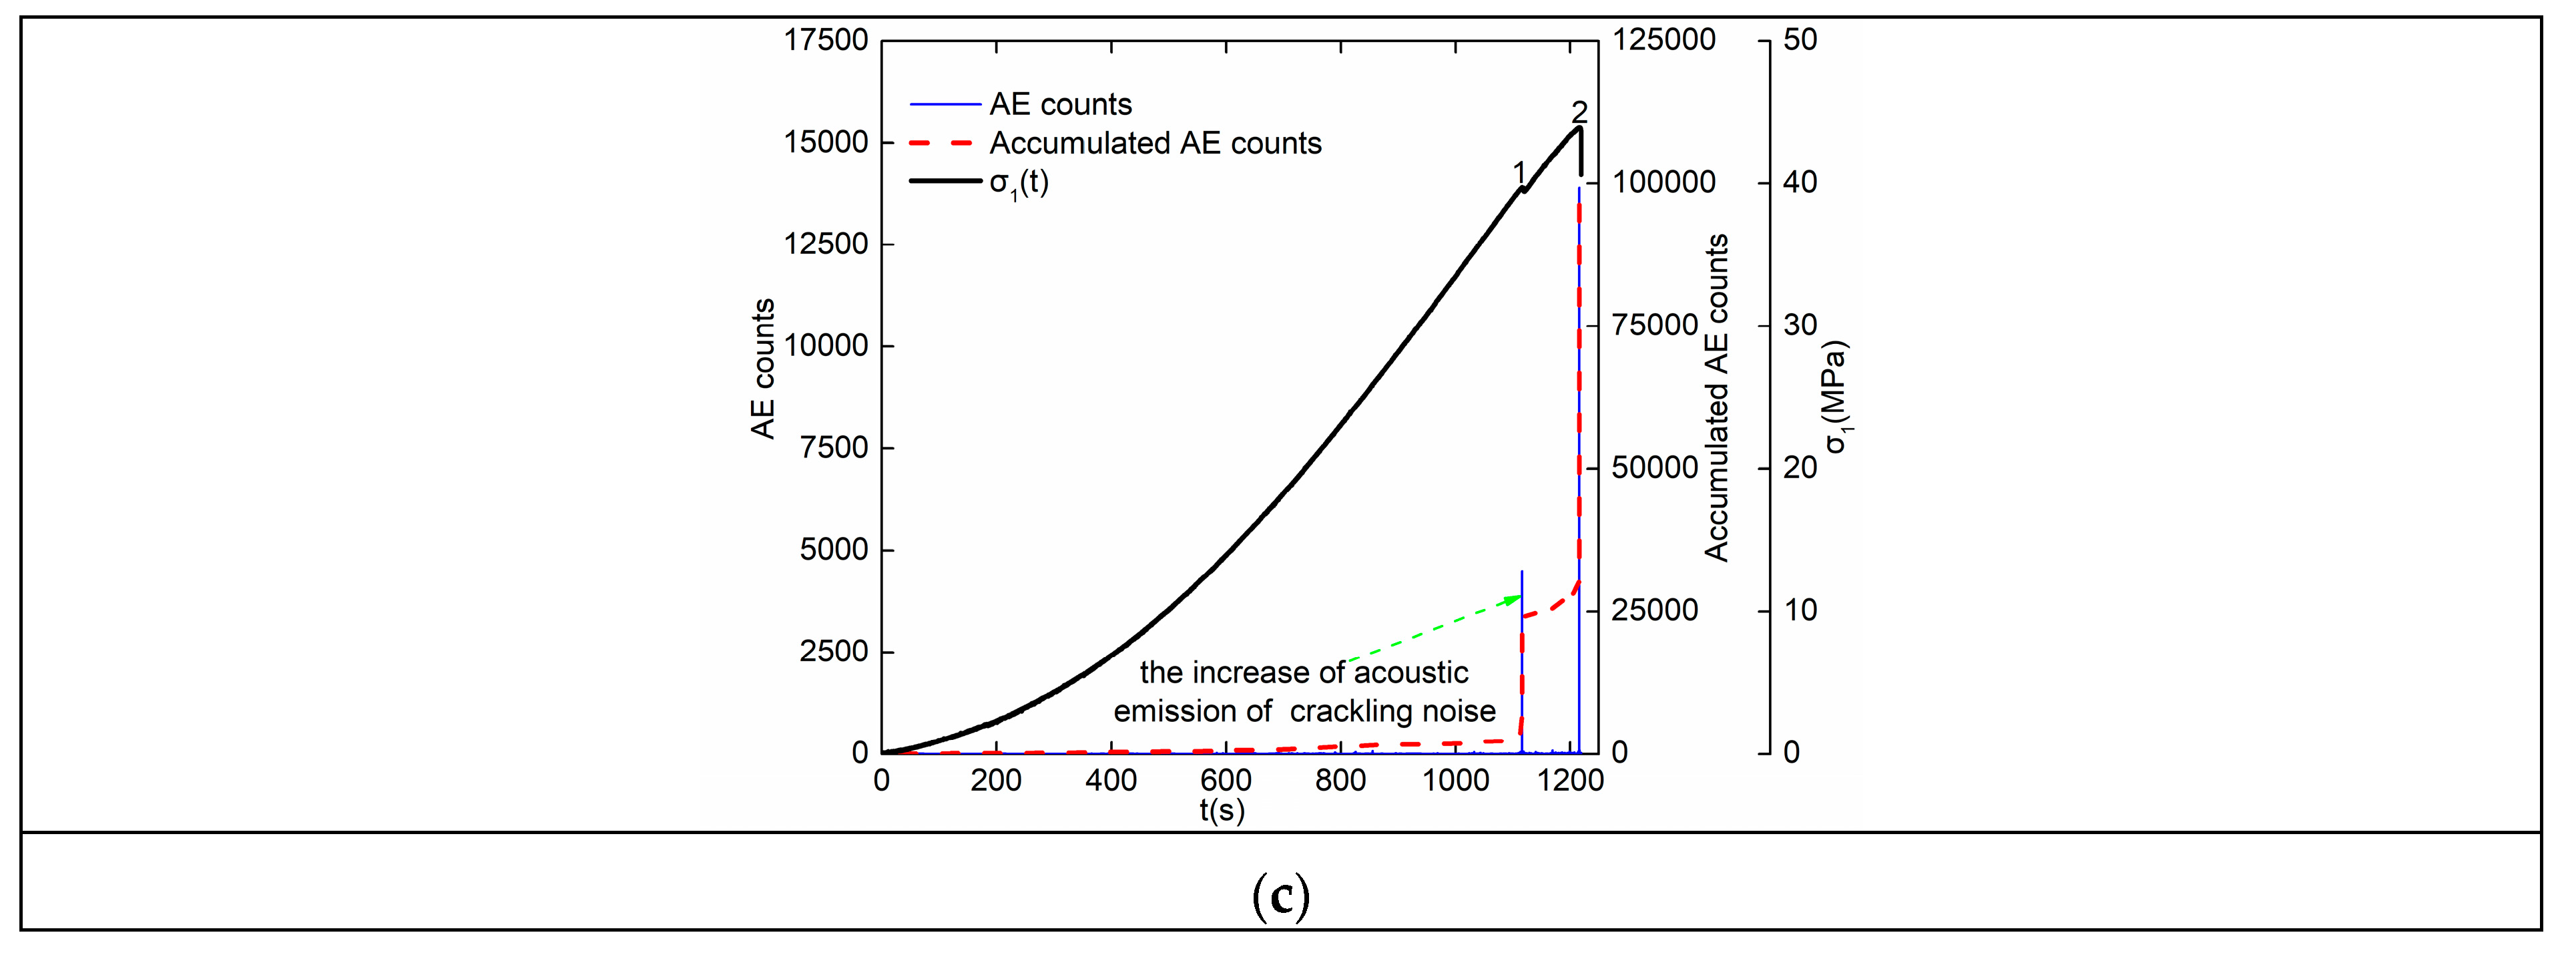
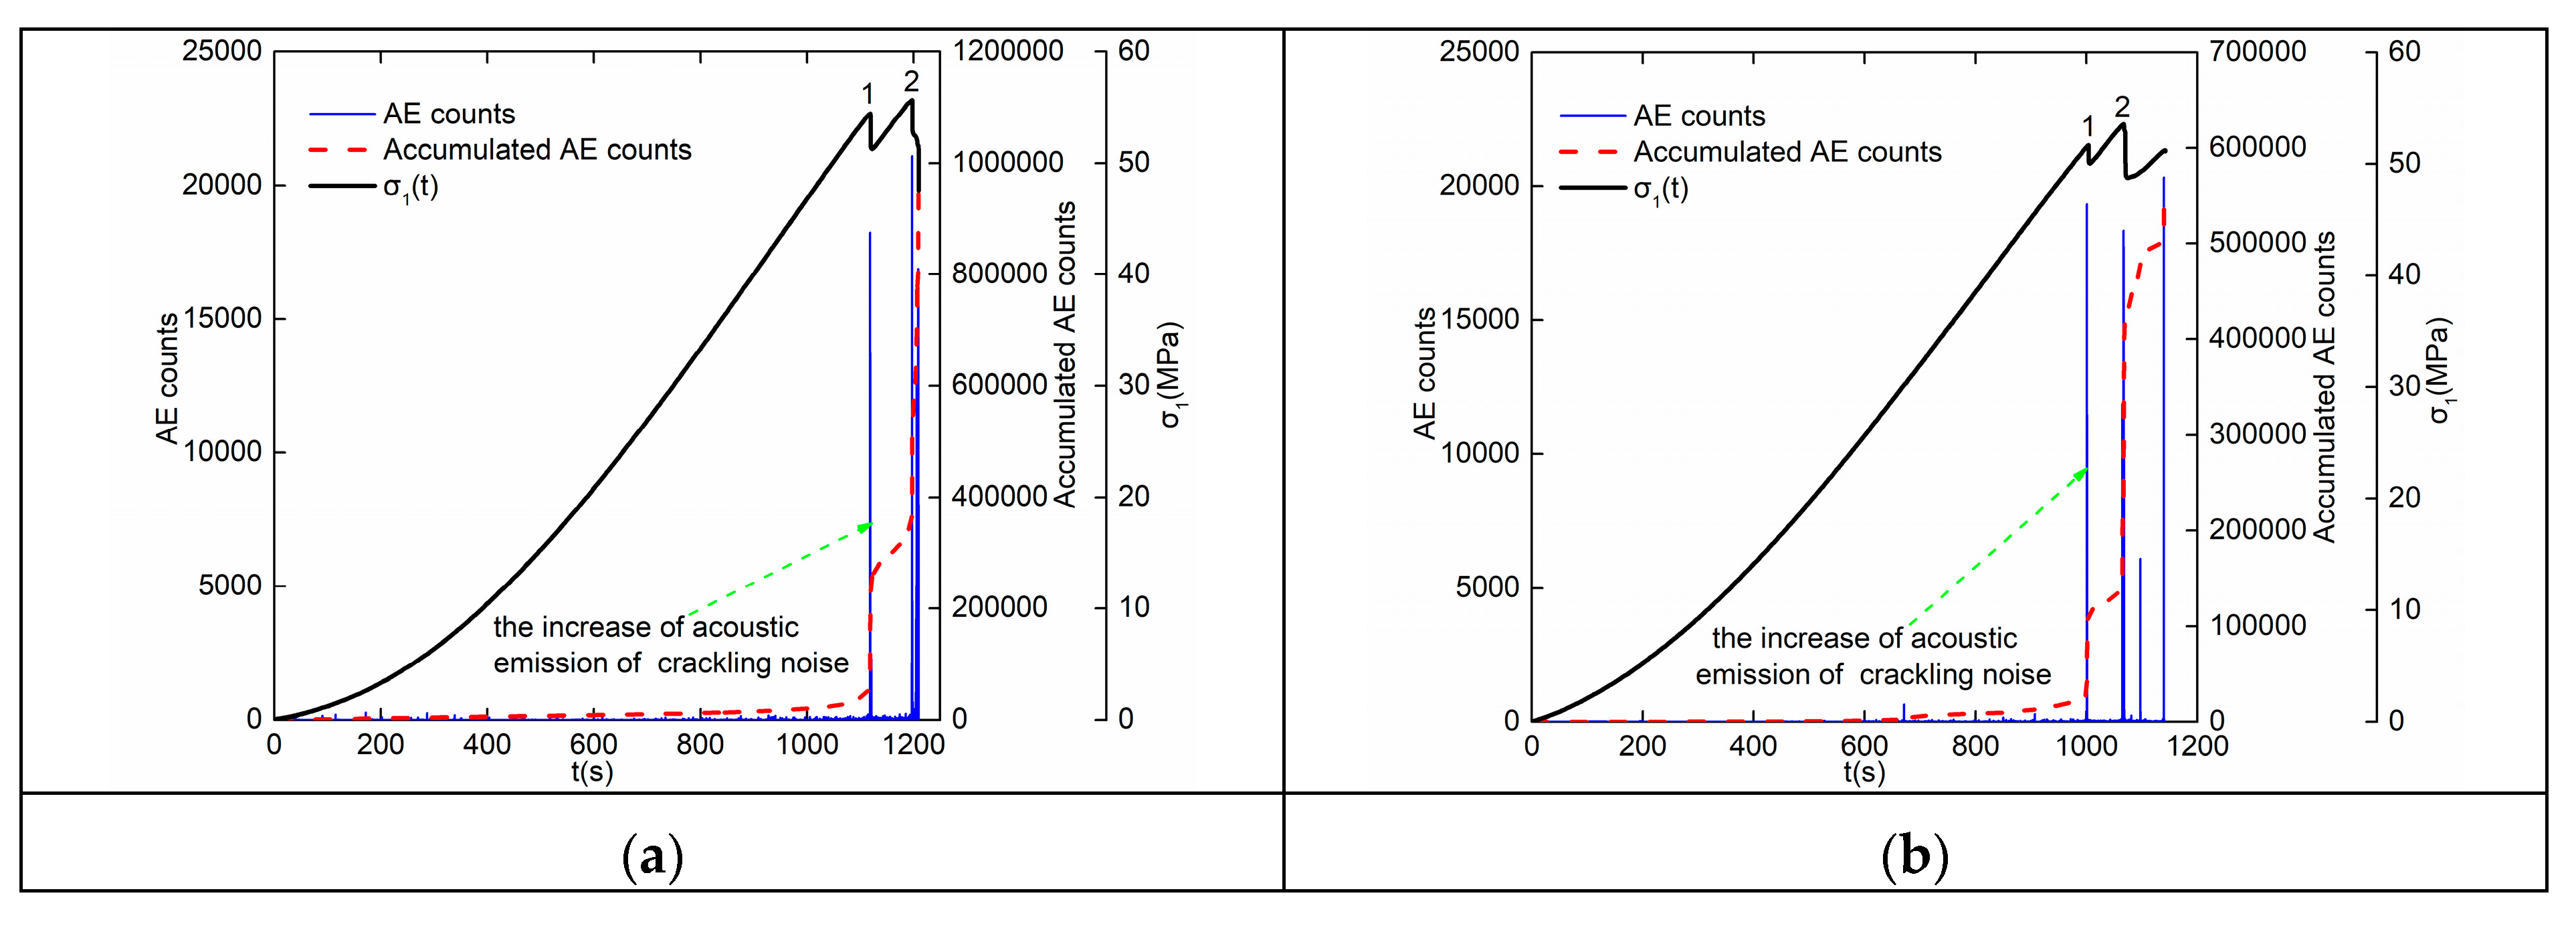
3.3.1. Acoustic Emission Counts
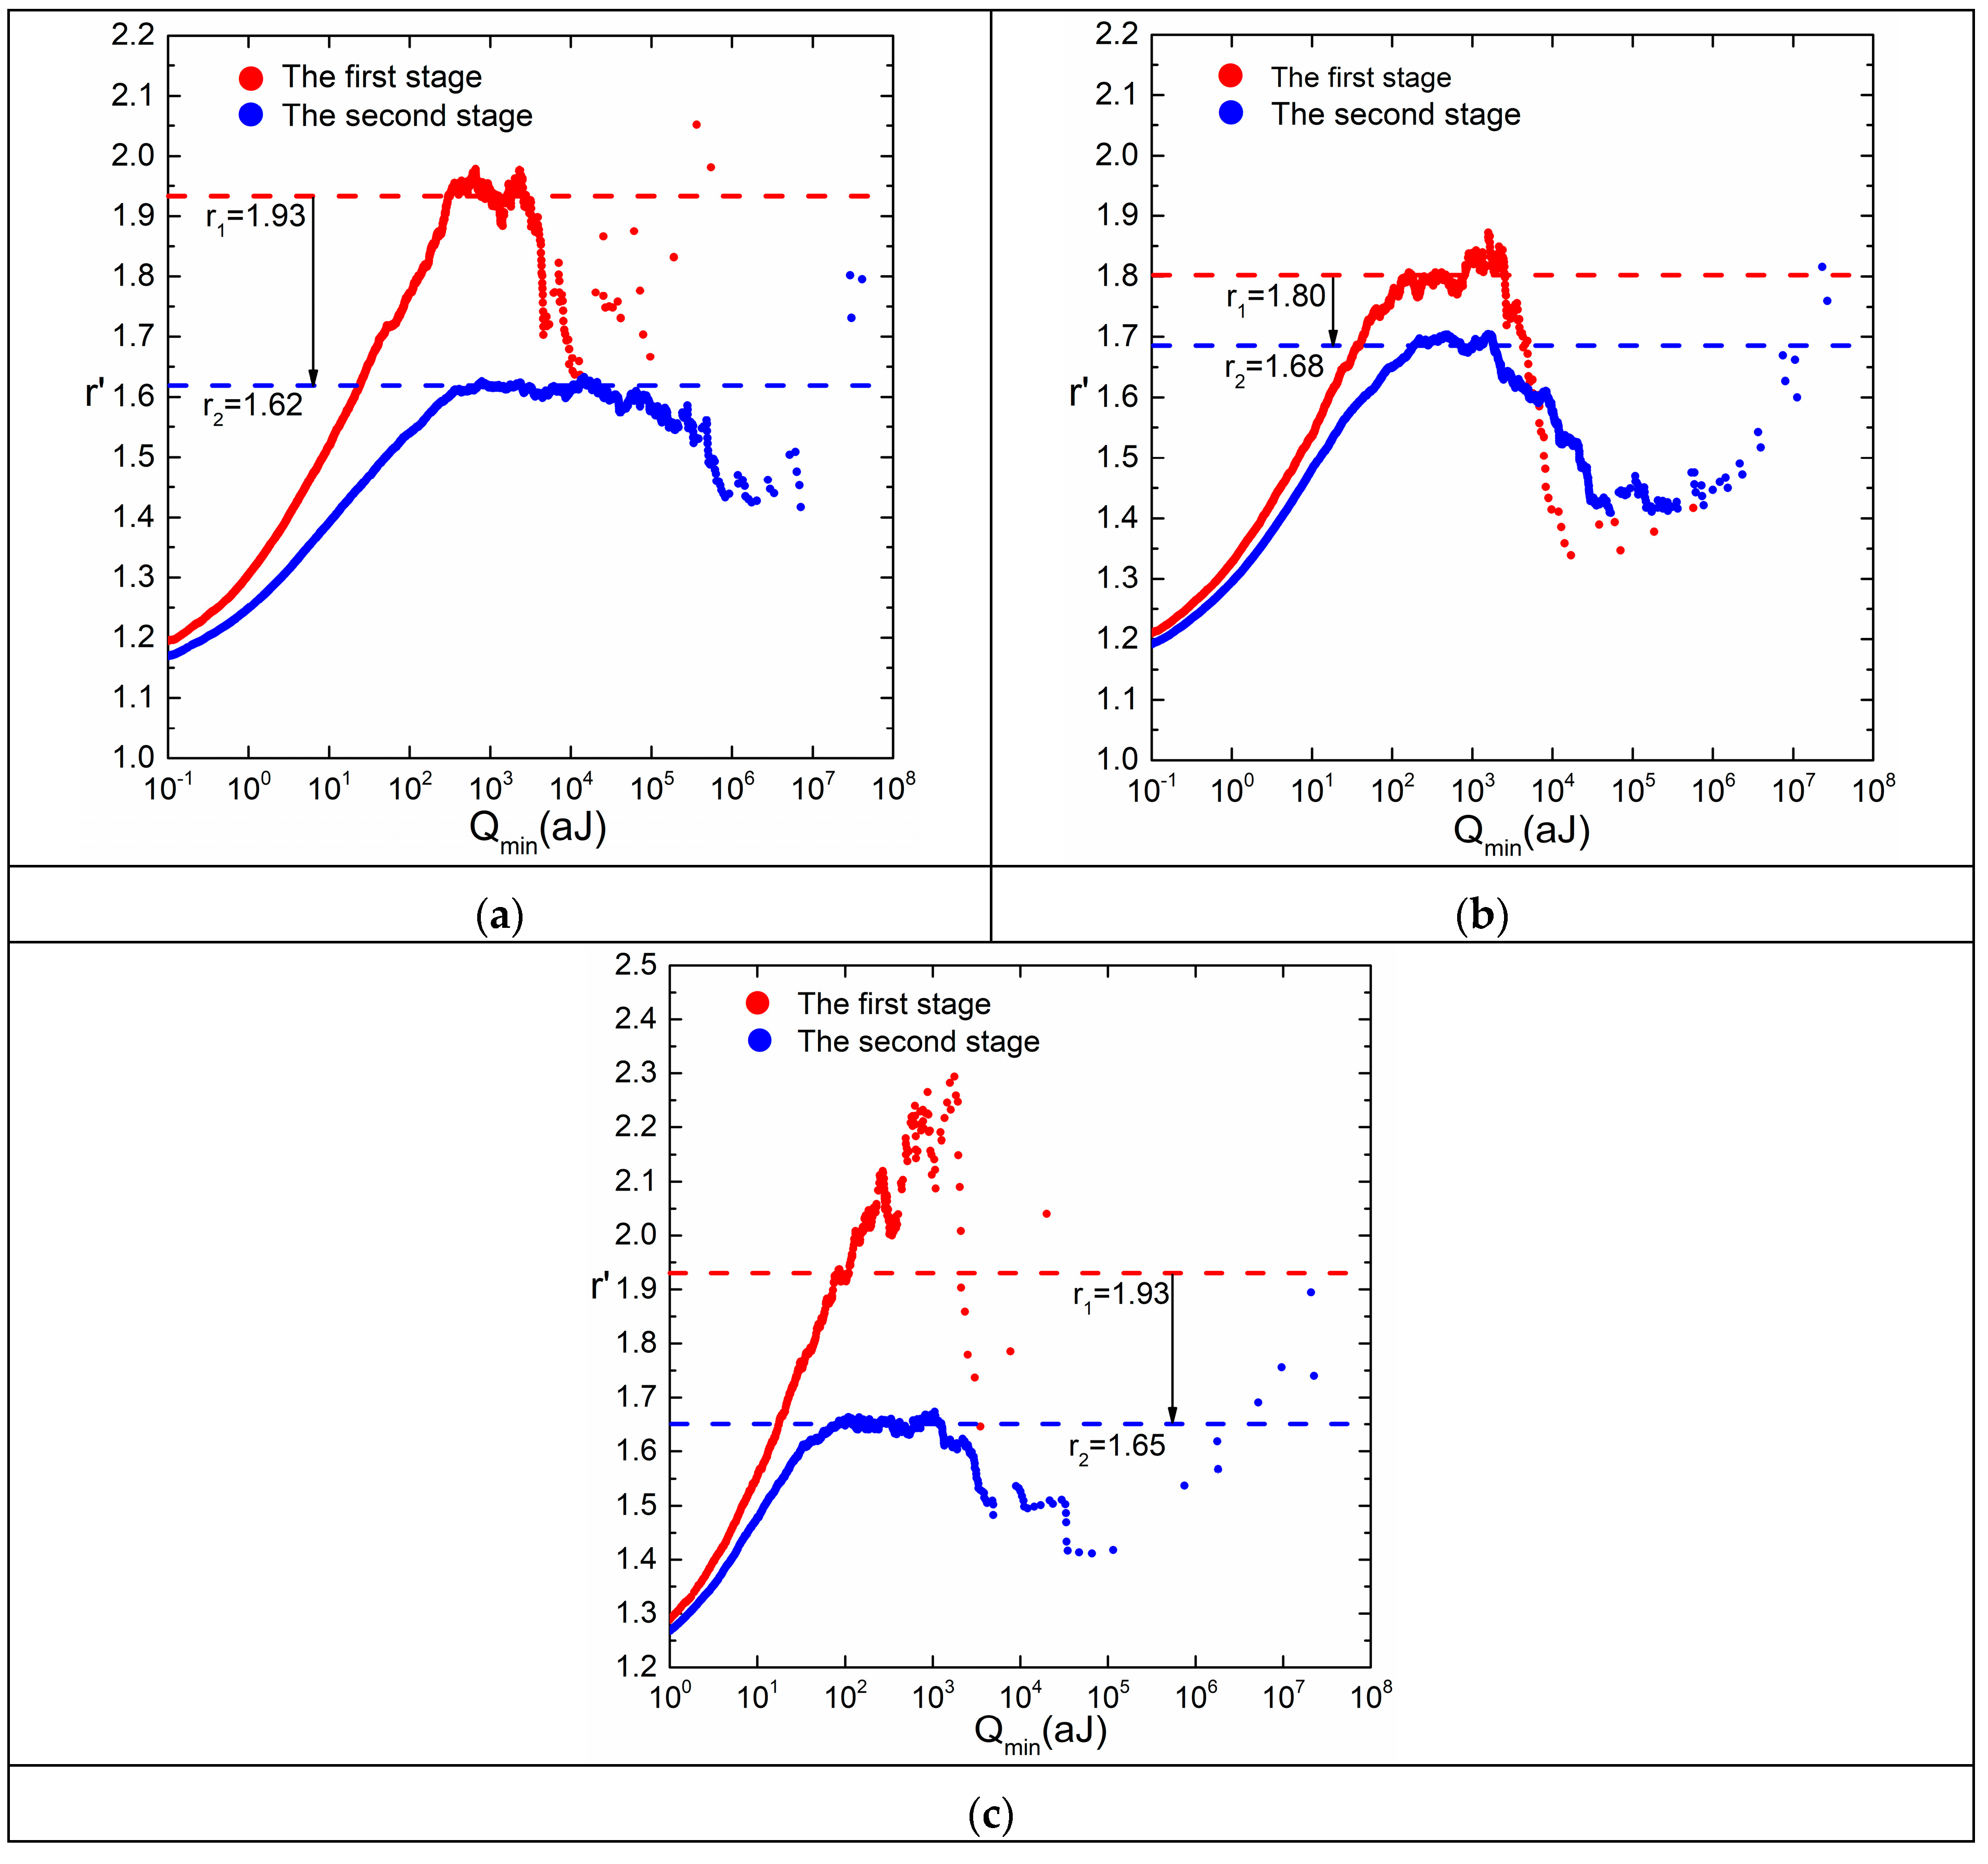
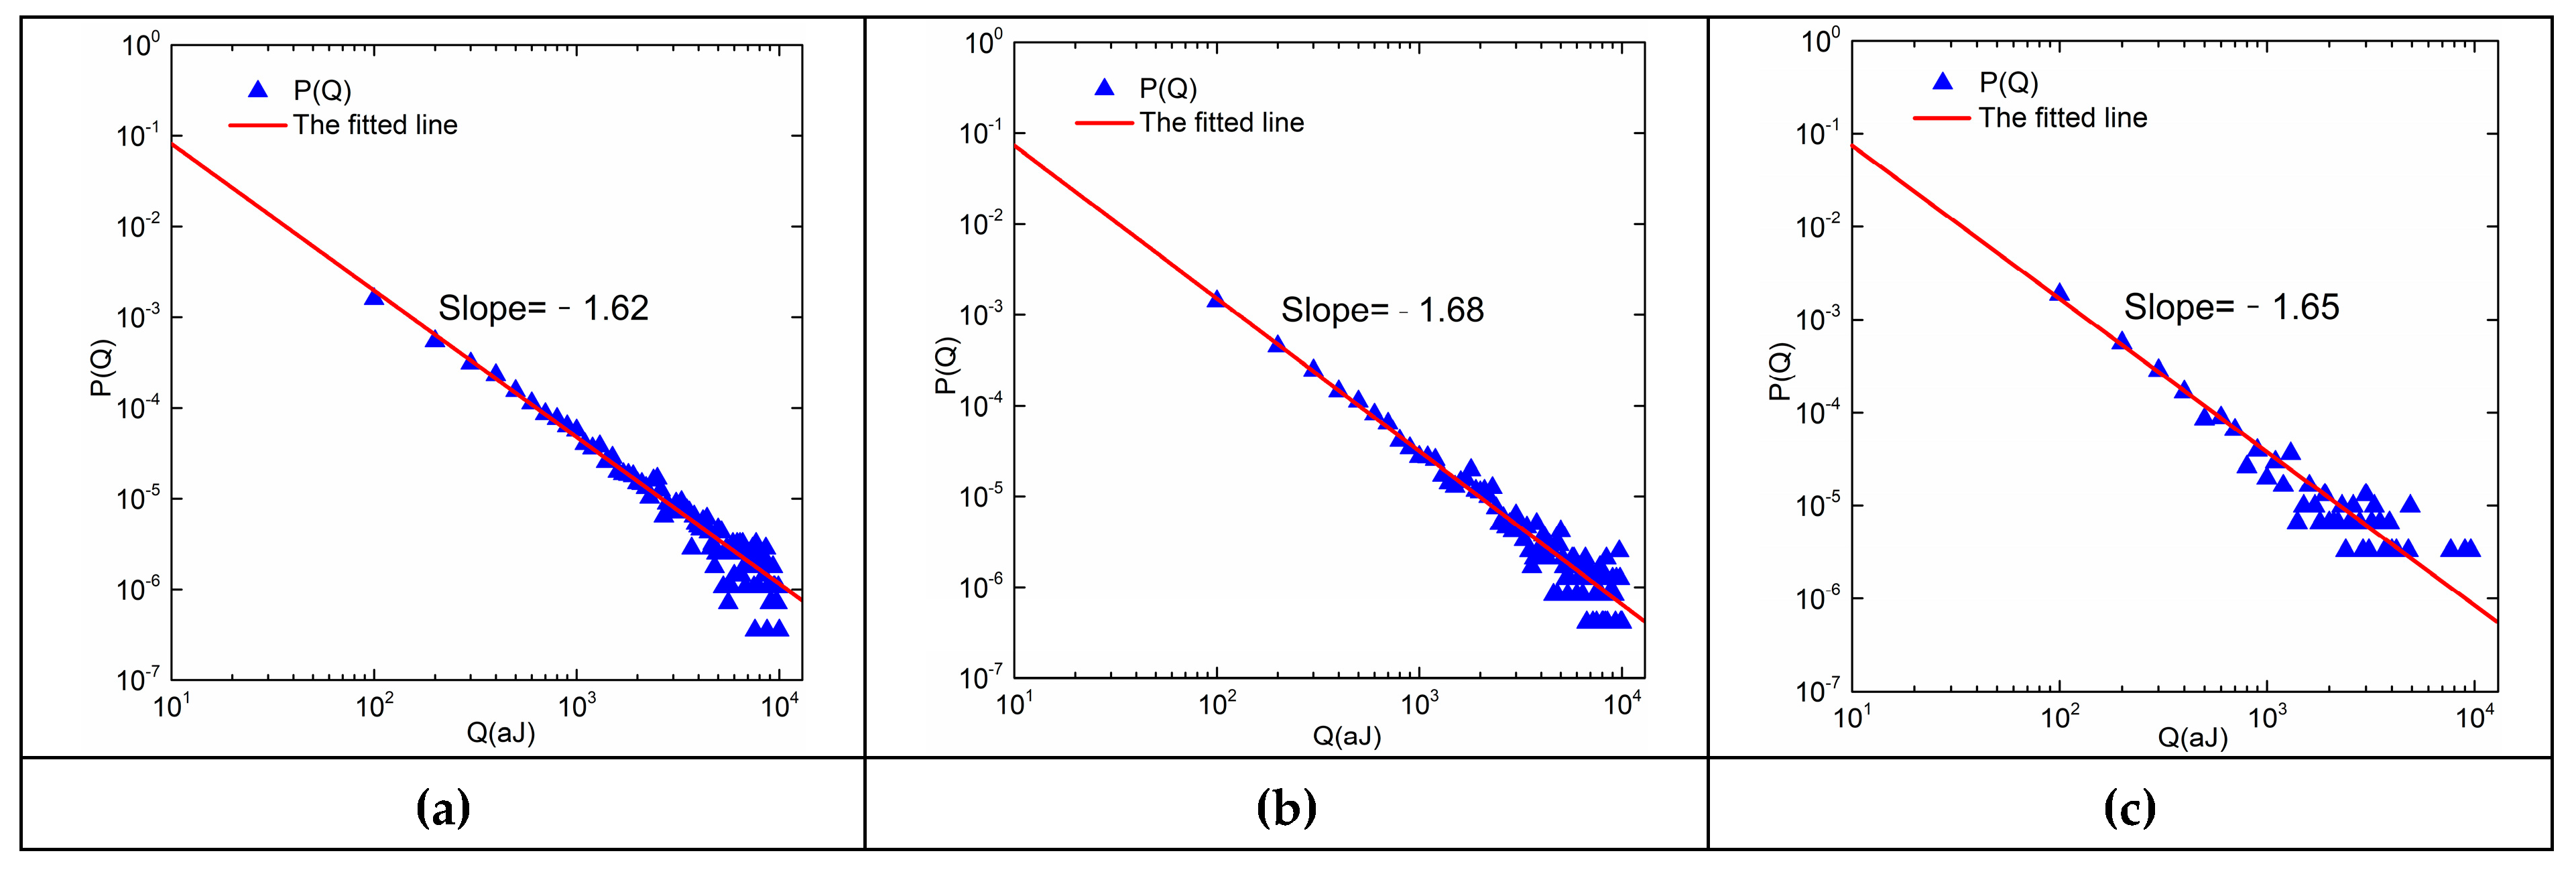
3.3.2. Distribution of Acoustic Emission Energies
4. Discussion
5. Conclusions
Author Contributions
Acknowledgments
Conflicts of Interest
References
- Scholtes, L.; Donze, F.V. A DEM analysis of step-path failure in jointed rock slopes. C. R. Mec. 2015, 343, 155–165. [Google Scholar] [CrossRef]
- Lajtai, E.Z.; Carter, B.J.; Duncan, E.J.S. En echelon crack-arrays in potash salt rock. Rock Mech. Rock Eng. 1994, 27, 89–111. [Google Scholar] [CrossRef]
- Einstein, H.H.; Veneziano, D.; Baecher, G.B.; Oreilly, K.J. The effect of discontinuity persistence on rock slope stability. Int. J. Rock Mech. Min. Sci. 1983, 20, 227–236. [Google Scholar] [CrossRef]
- Park, C.H.; Bobet, A. Crack initiation, propagation and coalescence from frictional flaws in uniaxial compression. Eng. Fract. Mech. 2010, 77, 2727–2748. [Google Scholar] [CrossRef]
- Yang, S.Q. Crack coalescence behavior of brittle sandstone samples containing two coplanar fissures in the process of deformation failure. Eng. Fract. Mech. 2011, 78, 3059–3081. [Google Scholar] [CrossRef]
- Sagong, M.; Bobet, A. Coalescence of multiple flaws in a rock-model material in uniaxial compression. Int. J. Rock Mech. Min. Sci. 2002, 39, 229–241. [Google Scholar] [CrossRef]
- Cao, P.; Liu, T.Y.; Pu, C.Z.; Lin, H. Crack propagation and coalescence of brittle rock-like specimens with pre-existing cracks in compression. Eng. Geol. 2015, 187, 113–121. [Google Scholar] [CrossRef]
- Prudencio, M.; Jan, M.V. Strength and failure modes of rock mass models with non-persistent joints. Int. J. Rock Mech. Min. Sci. 2007, 44, 890–902. [Google Scholar] [CrossRef]
- Cheng, Y.; Wong, L.N.Y.; Zou, C.J. Experimental study on the formation of faults from en-echelon fractures in Carrara Marble. Eng. Geol. 2015, 195, 312–326. [Google Scholar] [CrossRef]
- Yang, S.Q.; Yang, D.S.; Jing, H.W.; Li, Y.H.; Wang, S.Y. An Experimental Study of the Fracture Coalescence Behaviour of Brittle Sandstone Specimens Containing Three Fissures. Rock Mech. Rock Eng. 2012, 45, 563–582. [Google Scholar] [CrossRef]
- Zhou, Z.L.; Cai, X.; Ma, D.; Cao, W.Z.; Chen, L.; Zhou, J. Effects of water content on fracture and mechanical behavior of sandstone with a low clay mineral content. Eng. Fract. Mech. 2018, 193, 47–65. [Google Scholar] [CrossRef]
- Eberhardt, E.; Stead, D.; Stimpson, B.; Read, R.S. Identifying crack initiation and propagation thresholds in brittle rock. Can. Geotech. J. 1998, 35, 222–233. [Google Scholar] [CrossRef]
- Li, Y.H.; Liu, J.P.; Zhao, X.D.; Yang, Y.J. Experimental studies of the change of spatial correlation length of acoustic emission events during rock fracture process. Int. J. Rock Mech. Min. Sci. 2010, 47, 1254–1262. [Google Scholar] [CrossRef]
- Wasantha, P.L.P.; Ranjith, P.G.; Shao, S.S. Energy monitoring and analysis during deformation of bedded-sandstone: Use of acoustic emission. Ultrasonics 2014, 54, 217–226. [Google Scholar] [CrossRef] [PubMed]
- Wang, Z.L.; Ning, J.G.; Ren, H.L. Frequency characteristics of the released stress wave by propagating cracks in brittle materials. Theor. Appl. Fract. Mech. 2018, 96, 72–82. [Google Scholar] [CrossRef]
- Salje, E.K.H.; Lampronti, G.I.; Soto-Parra, D.E.; Baro, J.; Planes, A.; Vives, E. Noise of collapsing minerals: Predictability of the compressional failure in goethite mines. Am. Miner. 2013, 98, 609–615. [Google Scholar] [CrossRef]
- Nataf, G.F.; Castillo-Villa, P.O.; Baro, J.; Illa, X.; Vives, E.; Planes, A.; Salje, E.K.H. Avalanches in compressed porous SiO2-based materials. Phys. Rev. E 2014, 90, 9. [Google Scholar] [CrossRef]
- Salje, E.K.H.; Liu, H.L.; Jin, L.S.; Jiang, D.Y.; Xiao, Y.; Jiang, X. Intermittent flow under constant forcing: Acoustic emission from creep avalanches. Appl. Phys. Lett. 2018, 112, 5. [Google Scholar] [CrossRef]
- Salje, E.K.H.; Saxena, A.; Planes, A. Avalanches in Functional Materials and Geophysics; Springer International Publishing AG: Cham, Switzerland, 2017. [Google Scholar]
- Feng, J.J.; Wang, E.Y.; Chen, X.; Ding, H.C. Energy dissipation rate: An indicator of coal deformation and failure under static and dynamic compressive loads. Int. J. Min. Sci. Technol. 2018, 28, 397–406. [Google Scholar] [CrossRef]
- Meng, Q.B.; Zhang, M.W.; Han, L.J.; Pu, H.; Nie, T.Y. Effects of acoustic emission and energy evolution of rock specimens under the uniaxial cyclic loading and unloading compression. Rock Mech. Rock Eng. 2016, 49, 3873–3886. [Google Scholar] [CrossRef]
- Wang, X.B.; Ma, J.; Liu, L.Q. A comparison of mechanical behavior and frequency-energy relations for two kinds of echelon fault structures through numerical simulation. Pure Appl. Geophys. 2012, 169, 1927–1945. [Google Scholar] [CrossRef]
- Liu, X.F.; Wang, X.R.; Wang, E.Y.; Kong, X.G.; Zhang, C.; Liu, S.J.; Zhao, E.L. Effects of gas pressure on bursting liability of coal under uniaxial conditions. J. Nat. Gas Sci. Eng. 2017, 39, 90–100. [Google Scholar] [CrossRef]
- Clauset, A.; Shalizi, C.R.; Newman, M.E.J. Power-law distributions in empirical data. SIAM Rev. 2009, 51, 661–703. [Google Scholar] [CrossRef]
- Girard, L.; Weiss, J.; Amitrano, D. Damage-cluster distributions and size effect on strength in compressive failure. Phys. Rev. Lett. 2012, 108, 5. [Google Scholar] [CrossRef] [PubMed]
- Sornette, A.; Sornette, D. Self-organized criticality and earthquakes. Europhys. Lett. 1989, 9, 197–202. [Google Scholar] [CrossRef]
- Zhang, H.Q.; Shi, H.; Wu, Y.; Pu, H. Numerical statistical analysis on self-organizing behavior of microfracturing events in rock failure. Int. J. Distrib. Sens. Netw. 2018, 14, 10. [Google Scholar] [CrossRef]
- Kun, F.; Varga, I.; Lennartz-Sassinek, S.; Main, I.G. Approach to failure in porous granular materials under compression. Phys. Rev. E 2013, 88, 11. [Google Scholar] [CrossRef] [PubMed]
- Walker, R.T.; Bergman, E.A.; Szeliga, W.; Fielding, E.J. Insights into the 1968-1997 Dasht-e-Bayaz and Zirkuh earthquake sequences, eastern Iran, from calibrated relocations, InSAR and high-resolution satellite imagery. Geophys. J. Int. 2011, 187, 1577–1603. [Google Scholar] [CrossRef]
- Tchalenko, J.S.; Ambraseys, N.N. Structural analysis of Dasht-e Bayaz (Iran) earthquake fractures. Geol. Soc. Am. Bull. 1970, 81. [Google Scholar] [CrossRef]


| Sample | Point 1 | Point 2 | E (GPa) | ||
|---|---|---|---|---|---|
| σ1 (MPa) | ε1 (%) | σ1 (MPa) | ε1 (%) | ||
| B-30 | 54.47 | 0.96 | 55.68 | 1.03 | 7.78 |
| B-45 | 51.70 | 0.85 | 53.58 | 0.91 | 7.55 |
| B-60 | 39.76 | 0.94 | 43.96 | 1.01 | 6.25 |
| Sample | Point 1 | Point 2 | ||||
|---|---|---|---|---|---|---|
| W (J) | Wd (J) | ηd (%) | W (J) | Wd (J) | ηd (%) | |
| B-30 | 25.79 | 1.96 | 7.60 | 30.34 | 5.43 | 17.90 |
| B-45 | 23.29 | 1.16 | 4.98 | 26.79 | 3.02 | 11.27 |
| B-60 | 17.83 | 2.02 | 11.33 | 21.71 | 2.39 | 11.01 |
© 2019 by the authors. Licensee MDPI, Basel, Switzerland. This article is an open access article distributed under the terms and conditions of the Creative Commons Attribution (CC BY) license (http://creativecommons.org/licenses/by/4.0/).
Share and Cite
Zhang, D.; Li, S.; Bai, X.; Yang, Y.; Chu, Y. Experimental Study on Mechanical Properties, Energy Dissipation Characteristics and Acoustic Emission Parameters of Compression Failure of Sandstone Specimens Containing En Echelon Flaws. Appl. Sci. 2019, 9, 596. https://doi.org/10.3390/app9030596
Zhang D, Li S, Bai X, Yang Y, Chu Y. Experimental Study on Mechanical Properties, Energy Dissipation Characteristics and Acoustic Emission Parameters of Compression Failure of Sandstone Specimens Containing En Echelon Flaws. Applied Sciences. 2019; 9(3):596. https://doi.org/10.3390/app9030596
Chicago/Turabian StyleZhang, Dongming, Shujian Li, Xin Bai, Yushun Yang, and Yapei Chu. 2019. "Experimental Study on Mechanical Properties, Energy Dissipation Characteristics and Acoustic Emission Parameters of Compression Failure of Sandstone Specimens Containing En Echelon Flaws" Applied Sciences 9, no. 3: 596. https://doi.org/10.3390/app9030596
APA StyleZhang, D., Li, S., Bai, X., Yang, Y., & Chu, Y. (2019). Experimental Study on Mechanical Properties, Energy Dissipation Characteristics and Acoustic Emission Parameters of Compression Failure of Sandstone Specimens Containing En Echelon Flaws. Applied Sciences, 9(3), 596. https://doi.org/10.3390/app9030596