Article

Simulation Models for Offshore Port Service Concepts

1
School of Management and Economics, Handong Global University, Pohang 37554, Korea
2
Defense Modeling and Simulation Division, Korea Institute for Defense Analysis, Seoul 02455, Korea
*
Author to whom correspondence should be addressed.
Appl. Sci. 2019, 9(3), 584; https://doi.org/10.3390/app9030584
Submission received: 14 December 2018 / Revised: 31 January 2019 / Accepted: 1 February 2019 / Published: 11 February 2019
(This article belongs to the Special Issue New Solutions for Robotic Swarms in Sea Operations)

Abstract

:
Offshore port service concepts were developed to flexibly respond to the emergence of large container ships and the increase in port trade volume. As one such offshore service concept, a mobile harbor system has recently been proposed. Although it is possible to effectively increase the capacity of existing ports through these mobile harbor systems, the methodology for evaluating the performance of a traditional port is limited when applied to evaluating the performance of the mobile harbor system. In this study, we develop a simulation model to analyze the mobile harbor system. The simulation model reflects the operating characteristics of the mobile harbor, and the performance metric of the system can be derived from the model. The results can be applied to capacity planning of a port system with a method that reduces search space. We applied our method to the Surabaya port in Indonesia to derive the optimal mobile harbor design that satisfies the required service level.

1. Introduction

Due to the increase of container trade volume, new port construction is required [1]. In Tran and Haasis [2], it is stated that “the continual growth of transshipment operation has been noted. The average number of transfers between ship and shore was 2.0 in 1960, up to 2.9 in 1980, 3.2 in 2000 and 3.5 in 2012. The worldwide transshipment handling volume increased more than 40-fold between 1980 and 2012, from 4.2 to 174.6 m TEUs.” In addition, since the construction of a container port requires enormous cost [3], it is essential to make wise decisions regarding port architecture and capacity early in the design. However, the design of container ports is a challenge, because of the complexity of the interacting port systems and the many options available for each. As described by [4], the port planning problem initially focuses on the terminal design, which consists of determining the “multi-modal interfaces, terminal layout, equipment selection, berthing capacity, and IT systems and control software.” Our focus is on equipment selection, which is the number and capabilities of each of the pieces of equipment of the system.
An alternative concept to consider is the offshore port service concept that focuses on increasing container throughput instead of traditional port service expansion. Mid-stream operation and barge with crane has been employed to serve the Hong Kong port for decades [5]. The barge with a crane moves between container ships that are anchored offshore and at land berth by using a tow ship. Because it has its own crane, it is able to load and unload containers to and from the container ship at offshore. Mid-stream operation is economically viable since Hong Kong has very expensive land costs. Between 200 and 250 barges are currently used in Hong Kong. Capacity is up to 48 TEU and capable of handling 3500 TEU container vessel. Mid-Stream Operation is more than 50% cheaper than the land berth operation. Loading and unloading cargo speed is 16–24 TEU/hour. However, the mid-stream operation does not fit large container ships due to the slow speed of operation and low offshore stability.
In order to solve the problem of mid-stream operation, a mobile harbor (MH) was proposed in 2008 [6]. The mobile harbor has its own crane and propulsion system. The crane of the MH has a high speed and the stability required to operate at sea condition three. The system layout of the MH is depicted in Figure 1. MHs dock at the container ship, which is anchored offshore to load and unload containers. The MH moves to land berth to release/absorb containers by using a Roll-on–Roll-off (RORO) system instead of using the crane. The containers may be stored on wheeled palates on the barge and rolled off via self-propelled AGVs or rails. The RORO system of MH is able to reduce the required number of land berths due to the high operation speed when compared to the crane.
However, the system could have safety and quality problems due to the difficulty of maintaining good crane balance during operations because the MH processes containers in the open sea. To resolve the problems, various studies have been conducted. In [7], a dynamic model of a mobile harbor subject to the motions of ship itself imparted by random sea waves was developed. It considered both sea-wave-induced ship motion and ship-motion-induced container sway. Jang et al. [8] proposed a conceptual layout of the Mobile Harbor with considerations of the design-dependent loads such as self-weight, inertia loads, and wind forces. A topology optimization is conducted with the derived sensitivities of the design-dependent loads such as self-weight, inertia load, and wind force. For more information on these efforts, refer to [9,10,11]. As a result, a more efficient and safer system was developed, and open sea tests and economic studies were conducted to prove its feasibility and efficiency [12].
In addition to technical research, research on how to design, operate, and evaluate a mobile harbor system has also been conducted. Kim and Morrison [12] studied the condition that an MH is economically preferable compared to the traditional port service by using throughput-based evaluation. In [13,14,15], the method to generate an optimal schedule and crane movement of MH was developed using mathematical modeling for short-term which is up to 2 days port operation efficiency. Mathematical modeling such as mixed integer-programming is employed to optimize scheduling of periodic routing of special vessels in offshore oil industry [16]. In this study, we develop a method and simulation model to evaluate and design an MH system for the port system design phase.
There have been many studies on capacity planning. The goal of these studies is to determine the number or capacity of elements of the system to ensure a desired level of service. Typically, the service level guarantee is approximate and pursued by a safety factor constraint; cf., [17,18,19,20]. Next, we discuss some examples in the vehicle capacity planning context. In [21], a Petri net model was introduced for the capacity planning of a system consisting of unmanned aerial vehicles (UAVs) and ground stations providing logistics support for the UAVs. The Petri net model helps to determine the number of resources that guarantees a desired level of service. Ji and Xia [22] proposed an analytical approach to determine the minimum number of identical automated guided vehicles (AGVs) that are required to guarantee a required level of service. Godzdanker et al. [23] and Godzdanker et al. [24] determined the number and location of logistics support stations for UAVs that have limited flight time in various situations. The concept of service level and the detailed behavior of the transportation units are slightly different in their context, but the essence remains the same. For example, AGVs usually move on a fixed route, and battery life and charging issues are important in an AGV-based transportation system. However, the essence remains the same; MHs cannot move unless they are filled with fuel, and in a broad sense, they are all categorized as transportation systems. In [25], analytic models for the capacities of two types of automated container terminals in traditional ports were developed. These models focused on transport efficiency and stacking capacity and used discrete event simulation to verify the results.
In the context of a port or manufacturing system, queuing approximations are often used to set target utilization levels for the system resources as an approximation to service level; cf., [26,27,28]. Following the rough capacity analysis, a detailed simulation study may be used to refine the estimates of the resources that are required to achieve the target service level [29,30,31,32]. However, existing design such as queuing approximations, rough capacity analysis, and detailed simulation study for analyzing traditional ports cannot be applied to the MH system. While the economic feasibility of an MH-based port system design was studied through the throughput-based method by Kim and Morrison [12], the method is insufficient to determine a detailed MH system design such as the number of berth and the mobile harbor to satisfy target service level.
In this paper, we develop an MH simulation model that reveals the characteristics of MHs for evaluating and designing MH-based port systems. Discrete-event simulation is an effective tool to analyze the performance of complex system such as semiconductor wafer fabrication facilities [33]. In addition, we propose a procedure to generate an optimal design with the simulation model. The developed simulation model is applied to obtain the optimal design of the MH (number of MH, type of MH, and number of berth) with given information such as expected throughput, ship information, and cost of the equipment. The optimal design of an MH guarantees the required service level of the port such as waiting time/service time ratio with minimal cost. We adopt the model and procedure for the Surabaya port in Indonesia, which has a plan to enlarge its port capacity for large container ships. The Surabaya port is located via channel 40 km from the open sea. The port currently provides service to container ships with capacities less than 2500 TEU. To serve large container ships in future, the port must enlarge entrance channel and the depths of the port’s berths must also be increased. As an alternative, they may consider the mobile harbor concept.
The remainder of this paper is organized as follows. In Section 2, we describe the mobile harbor simulation developed in this paper. We introduce the mobile harbor simulation and how to optimize the mobile harbor system. In Section 3, a case study is presented. We apply the simulation model and methodology to the potential mobile harbor market to generate an optimal system design with actual data. Concluding remarks are presented in Section 4.

2. Simulation Based Resource Optimization

Using detailed simulation models, we search to obtain the minimal cost number of resources that would guarantee a desired mean service level. As simulation is very time consuming for searching over the space of resources, we exploited three structural properties of the problem to decrease the number of simulation cases that would be required and thereby accelerate the optimization procedure.

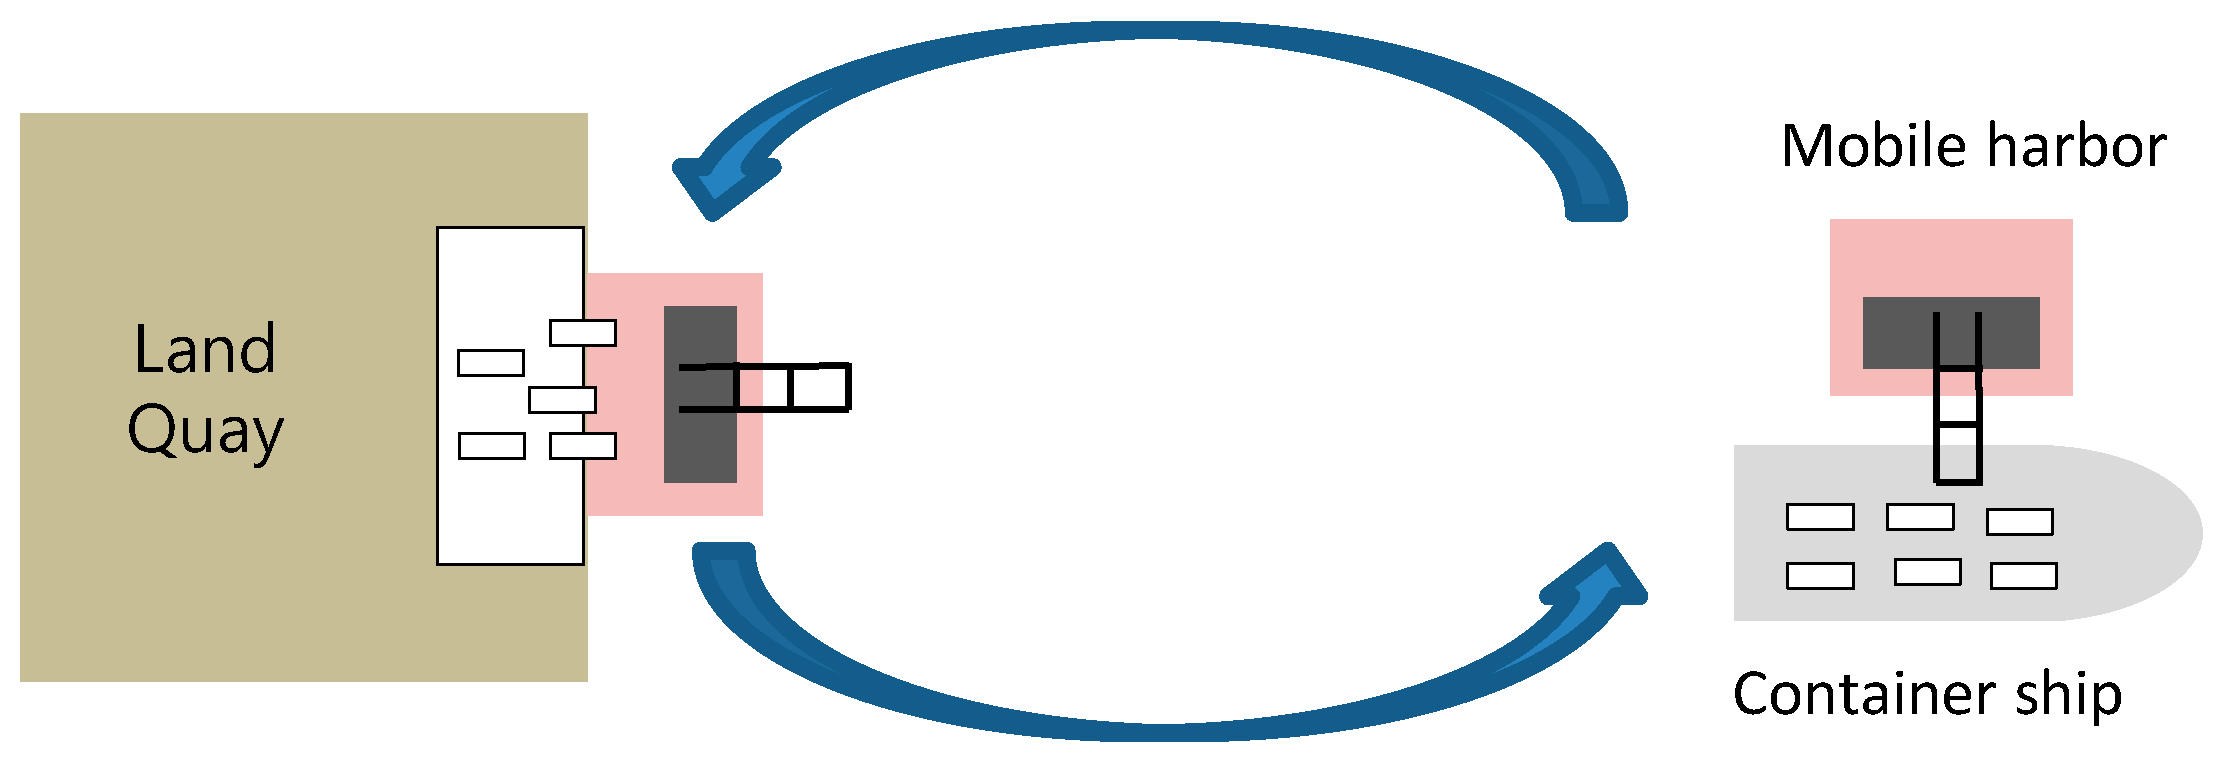
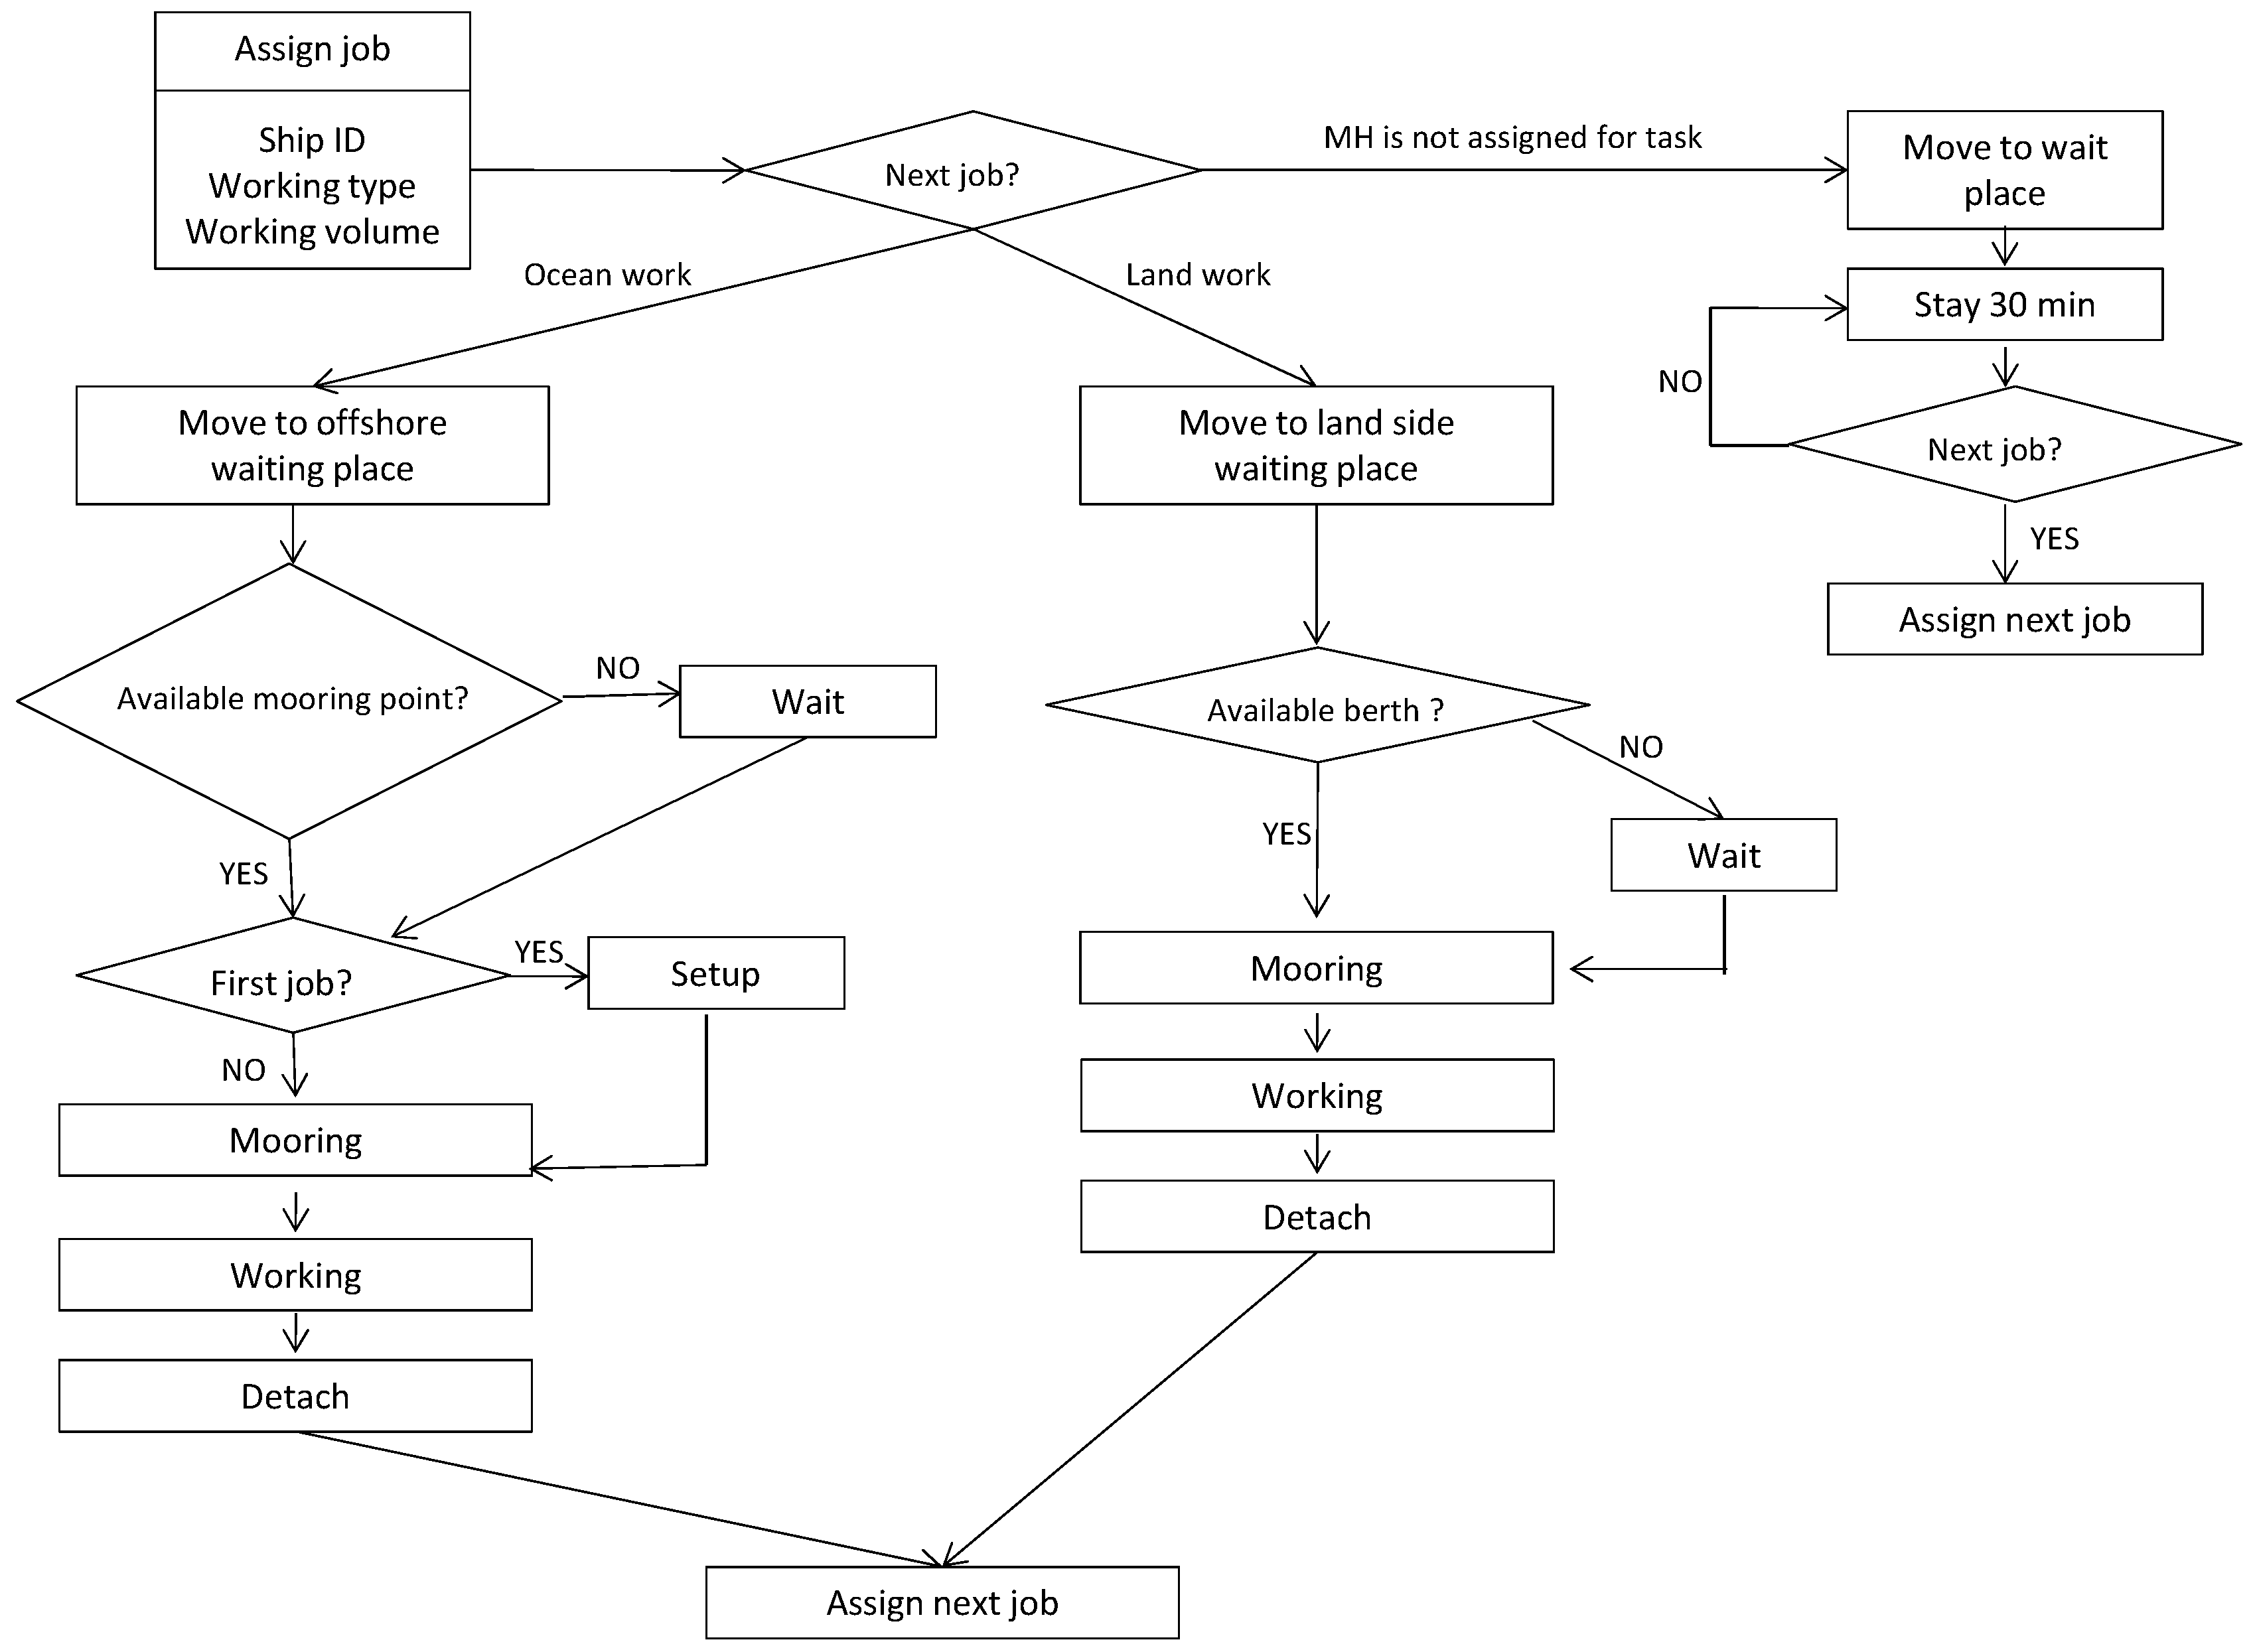
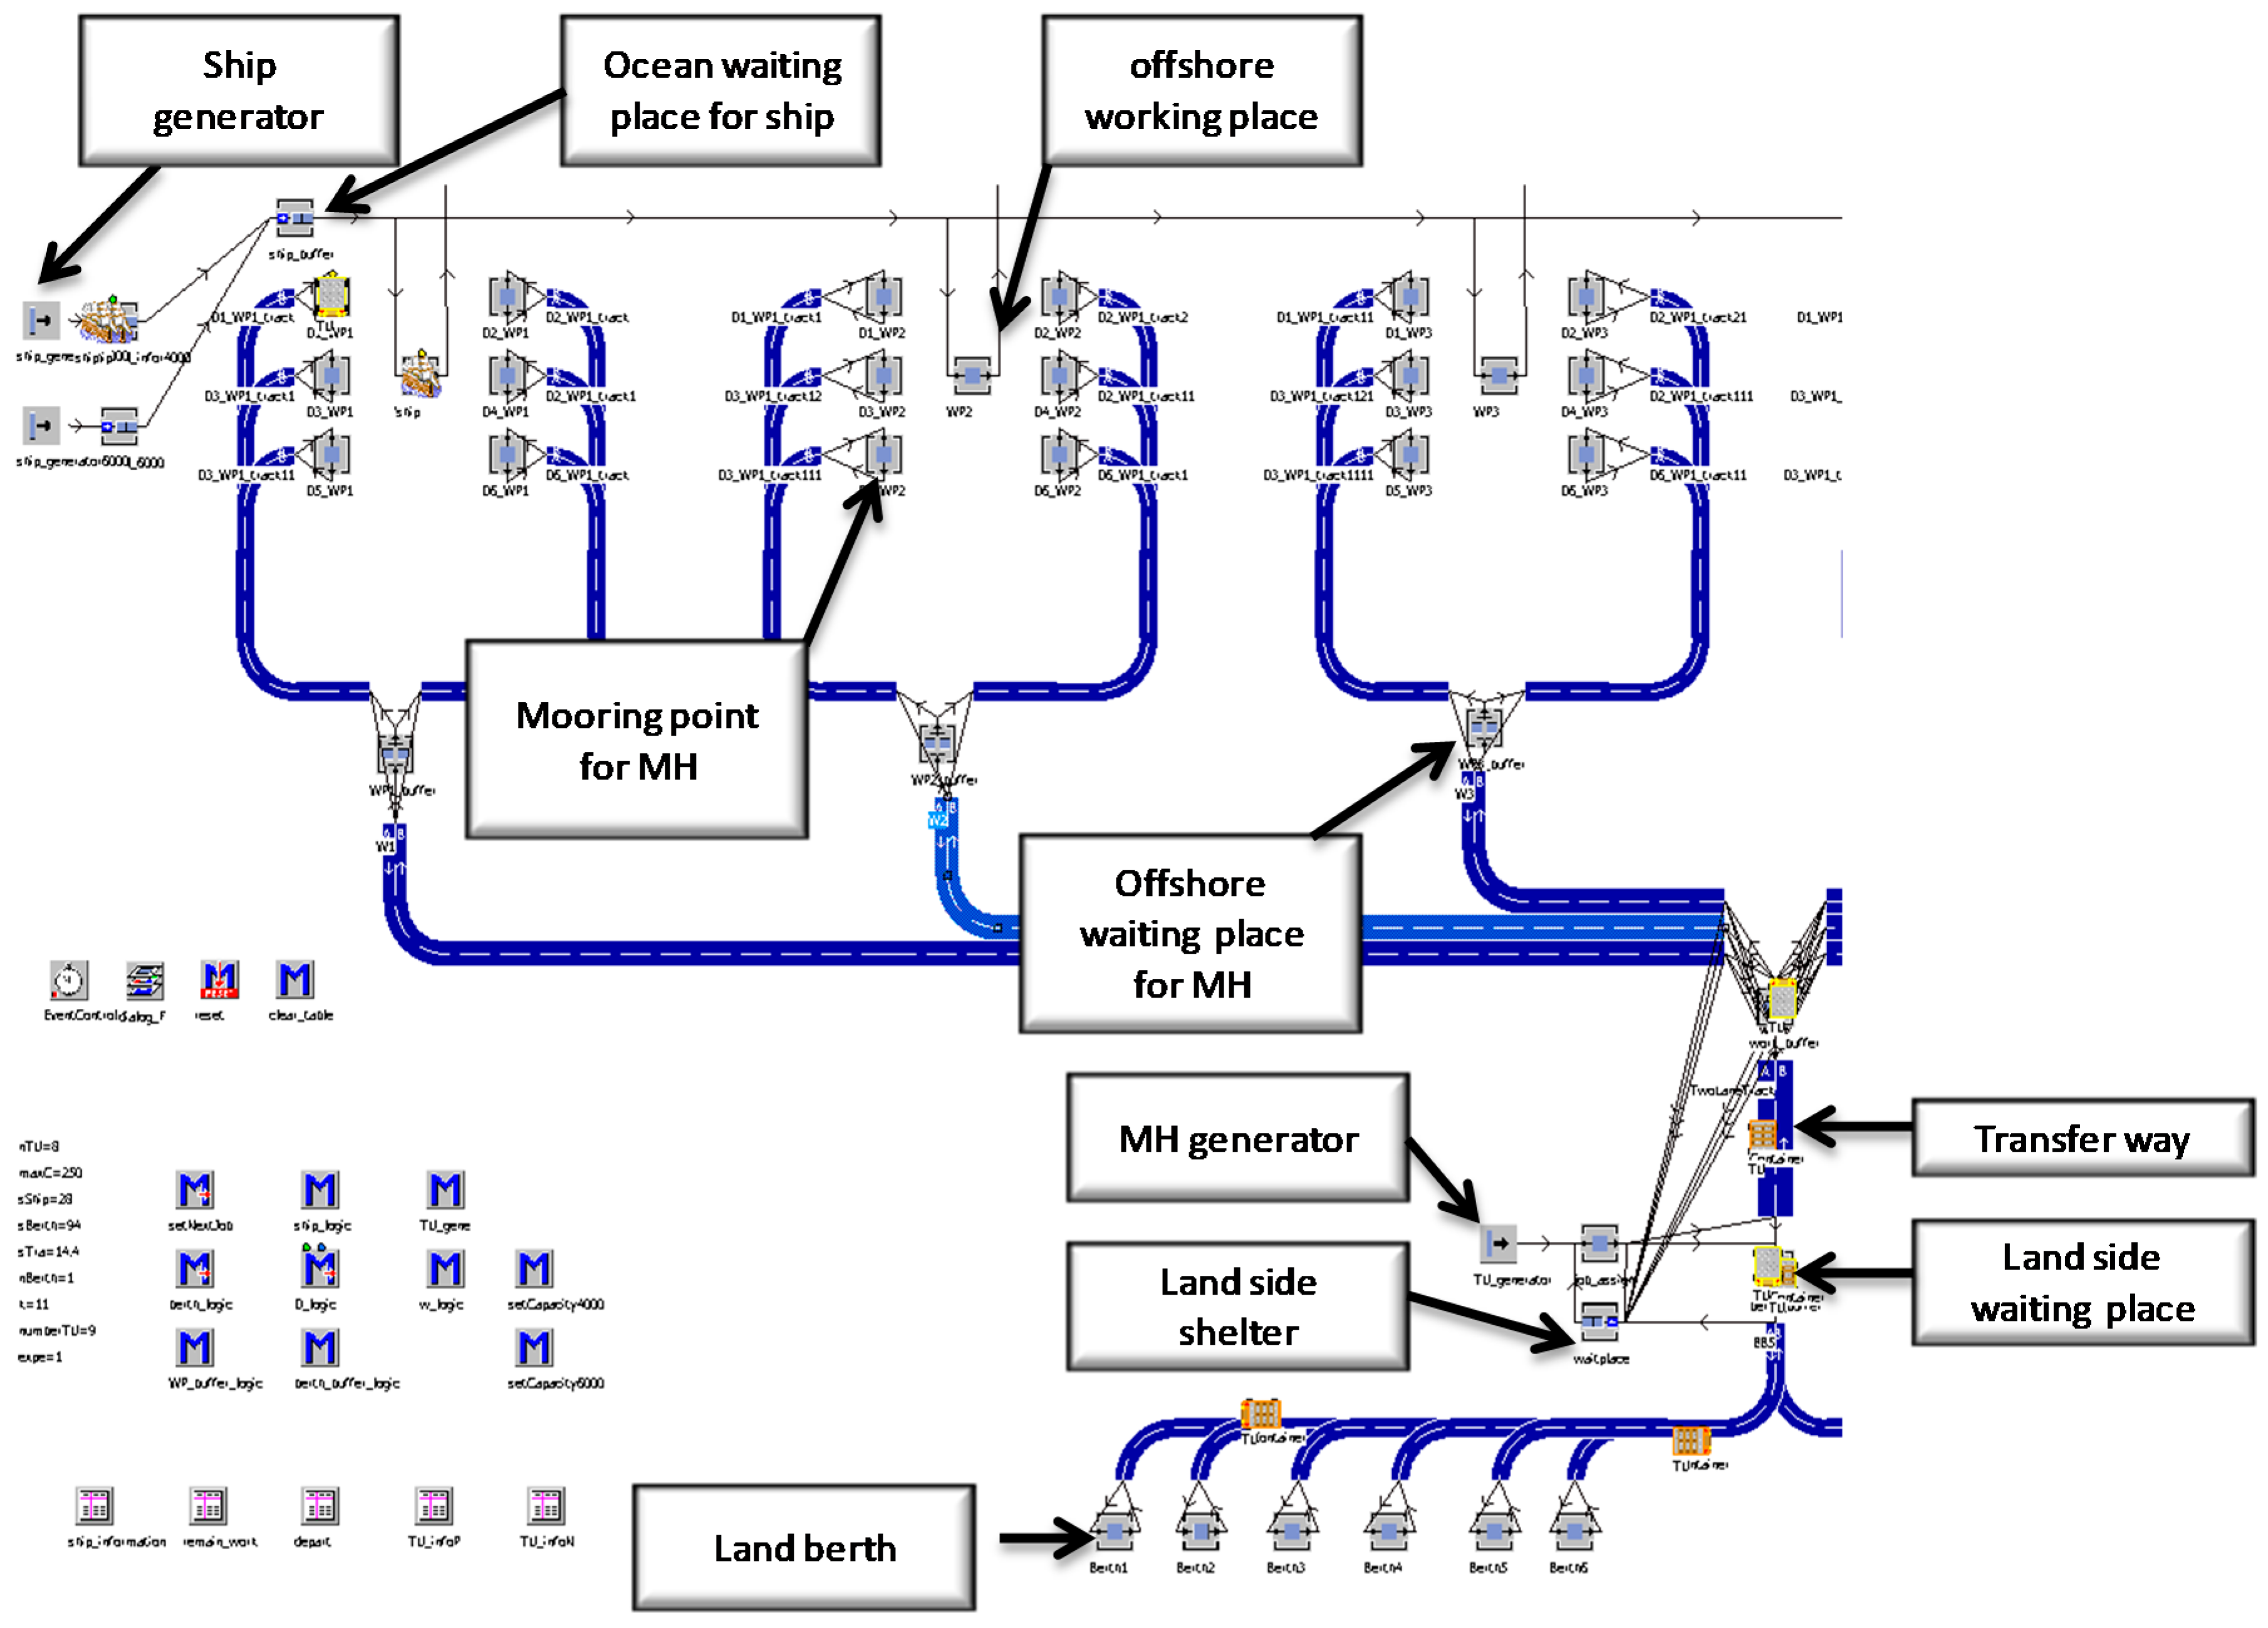
2.1. Description of Mobile Harbor Simulation

We employ the Technomatix Plant Simulation 9 software (SIMENS, Germany) which is a discrete event simulation to construct simulation models. To build operation logic for the offshore port service, we worked collaboratively with KLNET, which is a port operation system IT company. We assume that the port is aware of the anticipated arrival of a ship 24 h before it actually arrives. Arriving ships carry import containers and remain in an offshore waiting location until there is an available offshore mooring location. For this study, there are six mooring locations available and the mobile harbor will freely move around to the ships in these locations as needed. After all the import containers on the ship are unloaded, the container will be loaded with the export containers. After this operation, the ship departs the system. The ship’s waiting time is the difference between the ship’s service start time and its port arrival time. The ship service time is calculated as time of departure minus the service start time.
To build scheduling heuristics of MH to handle container ships, we implement two priority rules for container ships. Ships are served in a first come first serve (FCFS) manner by the mobile harbor. Import containers are given higher priority than export containers on a given ship. As each mobile harbor becomes available, it is assigned to its next job based on the ship information such as arrival time and import/export container volume. Each mobile harbor will remove a complete load of containers if the containers are available; otherwise, it will take as many as there are.
If a mobile harbor’s next job is to load or unload a containership, it immediately proceeds to the offshore service location. The mobile harbor waits for any mooring locations. As soon as possible, the mobile harbor will moor with the container ship and conduct its business. Upon completing service, it will unmoor and seek its next job.
The mobile harbor travels to the land side waiting location if it has no task assigned or all land berths are occupied. The number of berths at the land–sea interface is an input parameter that can be changed to guarantee the service level and minimize cost. If a land berth becomes available and there is work to do (unloading or loading at the land–sea interface), the mobile harbor proceeds to that location. Waiting mobile harbors are given priority at the land berths in an FCFS manner. There are fixed mooring and unmooring times at the land berths. Because ship arrival information is available 24 h before the ship arrives, mobile harbors can prepare for the next ship service activity in advance. If there are no jobs required for a mobile harbor when it completes a job, it will wait in the designated land waiting shelter. This land side shelter idea was inspired by the operation of mid-stream lighters in Hong Kong (personal communications with Captain Miu Sang Wong, CEO of the Hong Kong Mid-Stream Operators Association). When a mobile harbor idles at the land shelter, it checks for new tasks every 30 simulated minutes. The overall work process for the mobile harbor is depicted in Figure 2.
The simulation layout of the MH is depicted in Figure 3. The ship generator produces a ship object based on a pre-determined inter-arrival and cargo distribution function. The ship waits in an anchorage in an ocean waiting place if there is no empty offshore working place. After finishing all cargo transfers in a ship, it leaves the port and records its finishing time. The number of mooring points of each offshore working place can be up to six and it varies according to the size of the container ship and the MH. The MH generator produces an MH object based on a pre-determined specification such as travel speed, operation speed, and capacity. MHs move between the mooring point and land berth to transfer import and export cargo via a transfer way.
The simulation and optimization procedure use the following:
  • The system operates 24 h/day and 365 days/year;
  • We simulate for 3 years in each replication and discard data from the first 100 ships to assess when port is fully activated;
  • We conduct 20 replications per case;
  • The simulation model starts empty;
  • All speeds are constant;
  • The speed of all resources in the simulation is 0.75 of the ideal container handling speed of the resource (Yang el al. 2001). In the simulation study, no safety coefficient is used to account for queuing delay—we measure it.
The raw data of simulation is stored—the ship object generation time, ship arrival time, amount of import containers, amount of export containers, the maximum docking points of ship, ship ID, service start time, and ship depart time. The ship waiting time and service time is obtained by using the ship arrival time, service start time, and ship depart time.
The simulation can be used for various mobile harbor systems. The mobile harbor system is characterized by setting input parameters. Input parameters consist of the number of mobile harbors, maximum capacity of mobile harbors, operation speed at ship and berth, travel speed of mobile harbors, ship information, and the number of berths. The number of mobile harbor determines the number of MH objects. Operation speed at ship and at berth can be different since the MH may use RORO system at land berth. Average number of entering ship/day and average volume/ship influences inter-arrival times and cargo distribution function, respectively. The number of berth limits the number of MH berth at land side.

2.2. Identifying an Optimal Number of Resources

We will use the simulation templates to seek the number of resources that ensure a certain level of service with minimal cost. As there are an infinite number of resource levels that will satisfy the service requirement, the search space which is the combination of the number of MH and the number of berth is large. However, we can substantially reduce the search space if the performance criterion improves as the number of resources increases. For example, a port that possesses three mobile harbors and two berths provides better service than a port with two mobile harbors and one berth. We will consider performance criteria for which improvement means a decrease in value, e.g., waiting time. For the Port of Surabaya system, we will focus on the ratio of waiting time to service time (W/S ratio). We change the combination of the number of MH and the number of berth and iteratively execute model to find the optimum number of resources. Three properties are identified and seven steps to iteratively execute model are developed to find optimal harbor design.
Let n = (nMH, nberth) denote the number of units of resource present in each of the subsystem mobile harbors and land berth; nMH and nberth are the number of units of mobile harbors and berths, respectively. Let P(n) denote the performance of the system with a number of resources n. We will rely on the following assumption: For any binary vector b ∈ {0,1}2, P(n) ≥ P(n + b). Here, we consider that if no resource is required for a particular subsystem, then adding such a resource will only increase cost and not change the performance. When seeking to obtain a minimal cost solution that satisfies a target performance level Ptgt, this property can be exploited as follows:
  • Property 1: If P(n) ≤ Ptgt, there is no need to evaluate P(n + b), for any b ∈ {0,1}2, as it will cost more and also satisfy the performance constraint.
  • Property 2: If P(n) > Ptgt, then there is no need to evaluate P(n − b), for any b ∈ {0,1}2, with nk + bk ≥ 0, for all k = 1, …, K, as it will also not meet our service level requirement that is W/S ratio is less than 0.1.
  • Property 3: nberth should be less than nMH. Berths need not be used if there are enough to provide uninterrupted service to all land-sea interface berth locations.
We will use these features to speed up the optimization process. We seek a resource level that achieves minimal cost while guaranteeing a desired level of service as follows.
  • Step 1: Initialize n with an arbitrary value. Set S’ to the empty set; it will contain resource level vectors that we have already considered.
  • Step 2: Conduct numerous replications of the simulation to approximate P(n).
  • Step 3: If P(n) ≤ Ptgt, go to step 4; else, go to step 5.
  • Step 4: Calculate the resource cost with n resources and if it has the least cost so far, set that value as our current minimal cost. Include all resource vectors with greater resource cost according to Property 1 above in the set S’. Go to step 6.
  • Step 5: Include all resource vectors with performance dominated by n according to Property 2 in the set S’. Go to step 6.
  • Step 6: Employ Property 3 to add resource vectors to the set S’. Go to step 7.
  • Step 7: If there is no resource vector remaining that is not included in S’, terminate the search. The resource vector with minimal cost that is not in S’ is optimal (or there is no solution if all are in S’). If the previous statements in Step 7 do not apply, select a new resource vector not in S’ by randomly increasing or decreasing the resource levels by one for one of the resources; Call the new resource levels nα. Go to Step 2.
This procedure is used to obtain a cost optimal resource vector for the architecture so that its estimated performance satisfies the performance criteria.

3. Application to the Resource Allocation Problem in the Mobile Harbor System

In this section, we utilize simulation to evaluate and determine the optimized system design for the Surabaya port in Indonesia.

3.1. Market Conditions

The Port of Surabaya in Indonesia can be reached via channel 40 km from the open sea; Figure 4 depicts the layout of this port. As demands for the port’s services increases, the port plans to provide future service to container ships with capacities greater than 2500 TEU. In order to serve large container ships using the quay cranes on land, the port must enlarge and dredge the 40 km entrance channel so that the ships can approach the port. The depths of the port’s berths must also be increased. An alternative is to serve these large container ships offshore via a fleet of mobile harbors and build shallow 5 m berths for the mobile harbors to use in loading and unloading containers at the land–sea interface. This would be possible without expanding and dredging the current channel.
The anticipated yearly throughput at the Port of Surabaya was provided in [34]; see Table 1. There are five classes of ships anticipated. The class of a ship is based on its TEU capacity. The number of ships expected per year in each class is provided in Table 1. The total expected throughput per year, brought by ships in each category, is also listed.

3.2. Operation Specification and Cost

In this section, we discuss the scenario of the Surabaya port numerical experiment by using a queuing model and simulation. Based on the expected throughput pattern, we considered that a new port system will be constructed to serve container ships with capacities between 1000 and 5999 TEU. The remaining ships will be served by the existing terminal and thus will not be considered in our study. Two types of mobile harbors are experimented on. The operation speed and cost of the mobile harbor was calculated in the 2011 mobile harbor project report provided by the KAIST mobile harbor team. We will hereafter refer to this report as MH report 2010. The cost of the mobile harbor consists of initial construction cost and operation costs such as labor, maintenance, power, and insurance. Operational speed and cost information is specified in Table 2. We developed four MH designs characterized by capacity and operational speed at land berth. Travel time between two places was calculated by using the 40 km channel distance and the travel speed of the mobile harbor. The ratio of 20 feet containers to 40 feet containers is 1:1 for the loading or unloading speed. RORO resource cost accounts for the lower part of the overall cost. Also, RORO resource cost (AGV or train) belong to the MH cost. Berth is just infrastructure to utilize these RORO resources.

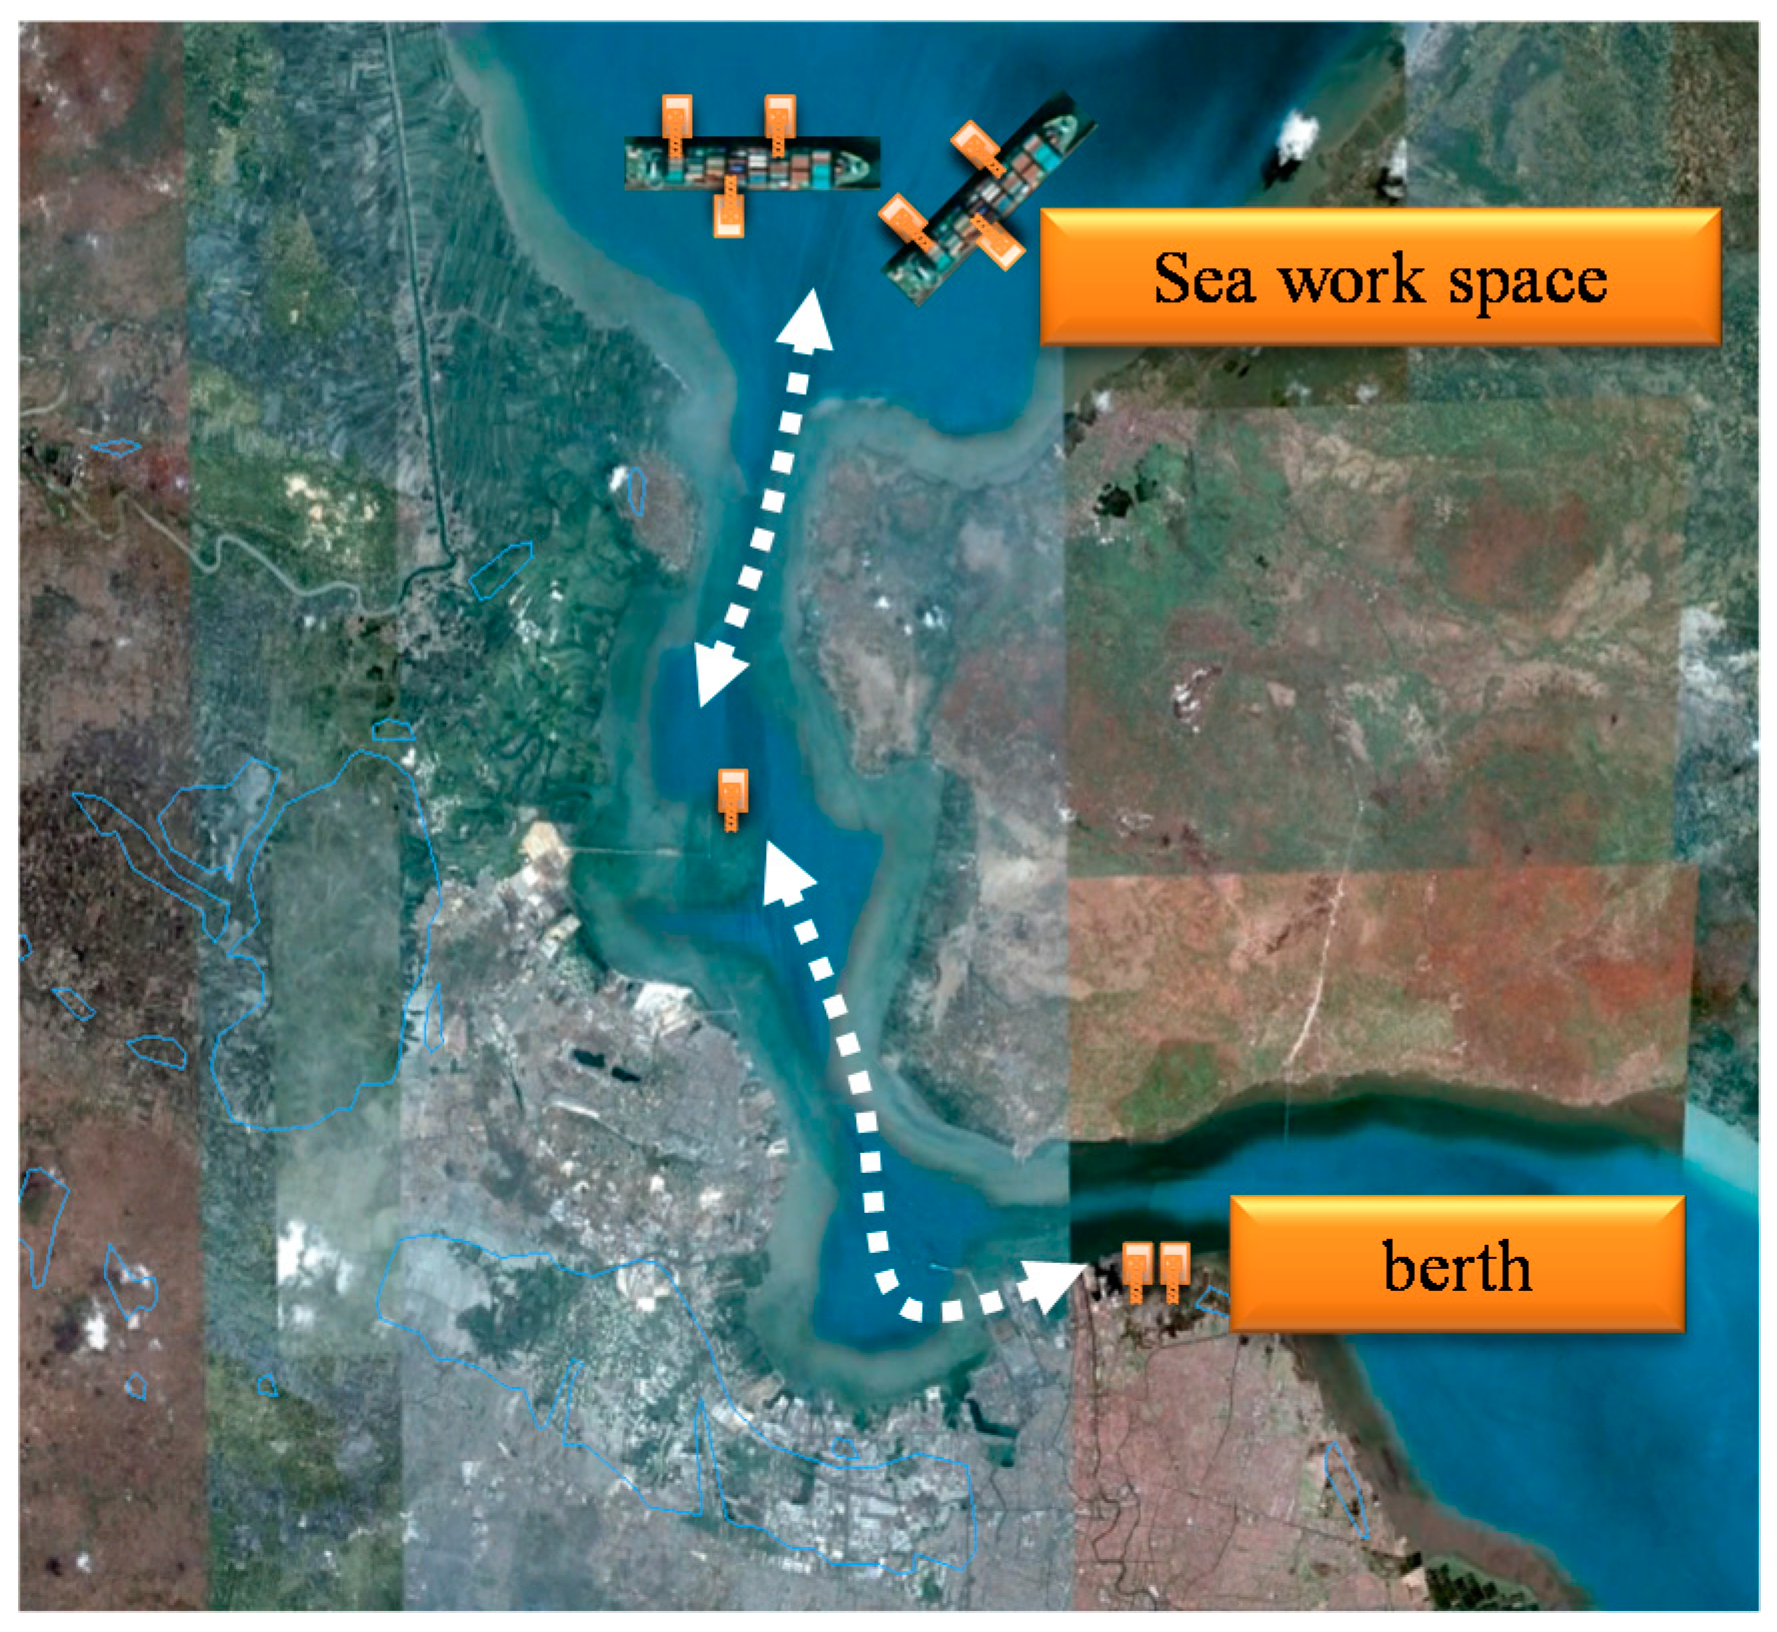
3.3. Simulation for the Port of Surabaya

The goal here is to use detailed simulation to obtain a more accurate minimal cost for the architecture for which the estimated performance satisfies our target.
We employed the following assumptions in our simulation model:
  • The inter-arrival times (IAT) to the port for container ships with 1000–3999 TEU and 4000–5999 TEU capacities are exponentially and uniformly distributed, respectively. Larger capacity ships have more tightly controlled schedules and thus, we give the associated inter-arrival times a distribution with a smaller standard deviation. Several container ships can arrive at the same time since we use probability distribution for ship inter-arrival times.
  • The number of mooring points on a 1000–2499 TEU capacity container ship for mobile harbors with capacity 250, 600, and 1200 TEU is 2, 1, and 1, respectively. For the small size container vessel, only 250 TEU MH is able to process both sides unloading due to the crane interference and safety issue which was determined when MH was conceptually designed by considering its physical and operational issues in 2011 (MH report 2010).
  • The number of mooring points on a 2500–5999 TEU capacity containership for mobile harbors with capacity 250, 600, and 1200 TEU is 3, 2, and 2, respectively.
  • Mooring time of MH at container ship is 30 min.
  • The mean inter-arrival time obtained is 365 * 24/# of visiting ships per year for the scenario.
  • The mean call size per ship is calculated as the yearly throughput/# of ships yearly.
  • There are six offshore service locations that can be used at one time by container ships.
  • The ratio of import cargo volume to export cargo volume is 1:1 based on the MH report 2011. These ratios each require a potentially different sequence of service events.
  • The service level metric is the average W/S ratio (waiting time/service time) and we require it to be less than 0.1 (as recommended by UNCTAD [28]);
The resulting input data of ships for the simulations is provided in Table 3.
The value of call size decrease as the ship size increases since the (un)loading rates of 1000–2499 TEU capacity container ship, 2500–3999 TEU capacity container ship and 4000–5999 TEU capacity container ship are anticipated as 0.8, 0.2 and 0.1 [34]. For example, 5000 TEU container ship, only 500 TEU cargo will unload/load at Surabaya port since it is a port of call for large size vessels. Small size container ships are a feeder vessel. Therefore, they have small number of port to visit.
We acquired results for the optimal system design by utilizing the simulation model and the simulation optimization process. The result of the simulation model is given in Table 4. The operation speed at land is a prime determinant of the number of berths. However, it does not affect the number of MHs as much as it does on berths. The yearly cost of building berths on land to handle 2 M TEU/year, enlarge and dredge the 40 km entrance channel was calculated in the MH report 2010 as 186.1 M USD/year by assuming 20 year projects life. MH is able to reduce 20.8–26.4 M USD per year.

4. Concluding Remarks

The mobile harbor’s reliable marine crane technology and container transport using RORO on land berths can be an alternative to handling large container ships. Existing port simulation and analytic methodology is limited in terms of the application to mobile harbors. In this study, we developed a simulation for mobile harbors. Mobile harbor operation logic was developed through cooperation with operators of mid-stream operations and the MH operation logic has a similar operating concept to mobile harbors and a port operation system IT company. Through simulation, various types of scenarios and mobile harbor types can be evaluated flexibly. We proposed a methodology to derive the minimal cost for a mobile harbor design that satisfies a given required service level by utilizing system characteristics. Varying the number of mobile harbors and land berths iteratively derives the optimal number of resources.
The port of Surabaya needs a large investment to handle large ships. The port needs to extend and dredge the 40 km channel from the open sea and a new berth needs to be constructed to meet the depth of the water. The use of a mobile harbor will replace these cost investments. Thus, in this study, we proposed a mobile harbor design suitable for Surabaya port by using simulation and a suitable methodology. We generated an optimal design that guarantees the appropriate level of service for four types of mobile harbors. MH is able to reduce 20.8–26.4 M USD/year for the Surabaya port.
Our work can be extended in several directions. In [35,36], it is stated that fuel consumption and emissions can be minimized by effectively maximizing berth productivity and reducing total service time and delayed departures. It is predicted that increasing container throughput by MHs can reduce the service time of a containership so that it could reduce the pollution as well, but further research is required to determine if this is really feasible. Designing MH systems to minimize pollution can be a subject for future research. It would be interesting to compare the pollution from traditional harbor systems with that of mobile harbor systems.
Also, we could apply this methodology to other intermodal transportation problems, such as those involving airplanes, trains, and trucks. A more detailed control algorithm for the mobile harbor could be developed instead of the FCFS that is used in the simulations. In addition, it would be interesting to study the general architecture and capacity planning problems to identify a unified framework into which all the problems will fit. Such a framework could be generalized to allow for a broader class of problems.

Reference

Author Contributions

J.K. designed the simulation of the proposed work and prepared the draft of the paper. W.-s.K. designed the formulation of the overall work and contributed to the writing of the paper.

Funding

This research was funded by Korean Ministry of Knowledge Economy Grants 10036222 and 10036229.

Acknowledgments

The work reported here has been supported in part by the Korean Ministry of Knowledge Economy Grants 10036222 and 10036229.

Conflicts of Interest

The authors declare no conflicts of interest.

References

  1. Drewry Shipping Consultants Ltd. Annual Container Market Review and Forecast; Drewry Shipping Consultants Publisher: London, UK, 2013. [Google Scholar]
  2. Tran, N.K.; Haasis, H.D. A research on operational patterns in container liner shipping. Transport 2018, 33, 619–632. [Google Scholar] [CrossRef]
  3. Osborne, A. Britain Makes Way for New £1.5bn Superport. 2012. Available online: http://www.telegraph.co.uk/finance/newsbysector/transport/9291583/Britain-makes-way-for-new-1.5bn-superport.html (accessed on 23 April 2017).
  4. Günther, H.-O.; Kim, K.-H. Container terminals and terminal operations. OR Spectr. 2006, 28, 437–445. [Google Scholar] [CrossRef]
  5. Fung, K.F. Competition between the ports of Hong Kong and Singapore: A structural vector error correction model to forecast the demand for container handling services. Marit. Policy Manag. 2001, 28, 3–22. [Google Scholar] [CrossRef]
  6. Suh, N.P. Mobile Harbor to Improve Ocean Transportation System and Transportation Method Using the Same. Korean Patent No. 100895604, 23 April 2008. [Google Scholar]
  7. Hong, K.S.; Ngo, Q.H. Dynamics of the container crane on a mobile harbor. Ocean Eng. 2012, 53, 16–24. [Google Scholar] [CrossRef]
  8. Jang, I.G.; Kim, K.S.; Kwak, B.M. Conceptual and basic designs of the Mobile Harbor crane based on topology and shape optimization. Struct. Multidiscip. Optim. 2014, 50, 505–515. [Google Scholar] [CrossRef]
  9. Kwak, B.M.; Oh, J.H. Balance Keeping Crane and Vessel with the Crane. South Korean Patent Application Filing Number 1020090070799, 31 July 2009. [Google Scholar]
  10. Kim, S.H.; Kim, U.H.; Hong, Y.S.; Ju, H.J.; Kim, J.; Kwak, Y.G.; Kwak, B.M. Auto Landing, Location, Locking Device for Spreader of Crane and Method Thereof. South Korean Patent Application 1020090074305, 12 August 2009. [Google Scholar]
  11. Shin, H.K.; Shin, J.W.; Kim, M.S.; Jung, W.J. Docking System of Ship. South Korean Patent Application 1020090093030, 30 September 2009. [Google Scholar]
  12. Kim, J.; Morrison, J.R. Offshore port service concepts: Classification and economic feasibility. Flex. Serv. Manuf. J. 2012, 24, 214–245. [Google Scholar] [CrossRef]
  13. Sung, I.; Nam, H.; Lee, T. Scheduling algorithms for mobile harbor: An extended m-parallel machine problem. Int. J. Ind. Eng. 2013, 20, 1–14. [Google Scholar]
  14. Shin, K.; Lee, T. Container loading and unloading scheduling for a Mobile Harbor system: A global and local search method. Flex. Serv. Manuf. J. 2013, 25, 557–575. [Google Scholar] [CrossRef]
  15. Nam, H.; Lee, T. A scheduling problem for a novel container transport system: A case of mobile harbor operation schedule. Flex. Serv. Manuf. J. 2013, 25, 576–608. [Google Scholar] [CrossRef]
  16. Jahromi, A.E.; Yazdeli, R.I. A mixed integer-programming model for periodic routing of special vessels in offshore oil industry. Int. J. Ind. Eng. 2015, 22, 524–528. [Google Scholar]
  17. Kim, W.S.; Kim, J.H.; Kim, H.; Kwon, H.; Morrison, J.R. Capacity and queueing evaluation of port systems with offshore container unloading. In Proceedings of the International Conference Logistics and Maritime Systems, Busan, Korea, 15–17 September 2010. [Google Scholar]
  18. Ministry of Maritime Affairs and Fisheries of Korea (MMAFK). Modified Port Development Plan. Title Translated from Korean; 2001. Available online: http://academic.naver.com/view.nhn?doc_id=18075302&dir_id=0&field=0&sort=0&query=%EC%88%98%EC%A0%95%20%ED%95%AD%EB%A7%8C%20%EA%B3%84%ED%9A%8D&page=1 (accessed on 23 April 2017).
  19. Yang, C.H.; Kim, C.G.; Bae, J.W. Research on the Method to Estimate Container Terminal Capacity. Korea Maritime Institute (KMI) Technical Report. Title Translated from the Korean. 2001. Available online: http://academic.naver.com/view.nhn?doc_id=38120844&dir_id=1&field=0&sort=0&query=%EC%8B%A0%EC%84%9D%EC%B2%98%EB%A6%AC&page=1 (accessed on 23 April 2017).
  20. Korea Container Terminal Authority (KCTA). Third Phase Berth Construction Report of Gwang Yang Terminal in Korea. Title Translated from Korean. 2008. Available online: http://academic.naver.com/view.nhn?doc_id=18287378&dir_id=1&field=0&sort=0&query=%EA%B4%91%EC%96%91%ED%95%AD%201%EC%B0%A8&page=1 (accessed on 23 April 2017).
  21. Suzuki, K.A.O.; Kemper Filho, P.; Morrison, J.R. Automatic battery replacement system for UAVs: Analysis and design. J. Intell. Robot. Syst. 2012, 65, 563–586. [Google Scholar] [CrossRef]
  22. Ji, M.; Xia, J. Analysis of vehicle requirements in a general automated guided vehicle system based transportation system. Comput. Ind. Eng. 2010, 59, 544–551. [Google Scholar] [CrossRef]
  23. Godzdanker, R.; Rutherford, M.J.; Valavanis, K.P. ISLANDS: A self-leveling landing platform for autonomous miniature UAVs. In Proceedings of the 2011 IEEE/ASME International Conference on Advanced Intelligent Mechatronics (AIM2011), Budapest, Hungary, 3–7 July 2011; pp. 170–175. [Google Scholar]
  24. Godzdanker, R.; Rutherford, M.J.; Valavanis, K.P. Improving endurance of autonomous aerial vehicles through intelligent service-station placement. In Proceedings of the 2012 IEEE International Conference on Robotics and Automation, RiverCentre, Saint Paul, MN, USA, 14–18 May 2012; pp. 3179–3184. [Google Scholar]
  25. Zhen, L.; Lee, L.H.; Chew, E.P.; Chang, D.F.; Xu, Z.X. A Comparative Study on Two Types of Automated Container Terminal Systems. IEEE Trans. Autom. Sci. Eng. 2012, 9, 56–69. [Google Scholar] [CrossRef]
  26. Bugaric, U.; Petrovic, D.; Petrovic, Z.; Pajcin, M.; Markovic-Petrovic, G. Determining the capacity of unloading bulk cargo terminal using queuing theory. Stroj. Vestn. J. Mech. Eng. 2011, 57, 405–416. [Google Scholar] [CrossRef]
  27. Shabayek, A.A.; Yeung, W.W. Effect of seasonal factors on performance of container terminals. J. Waterw. Port Coast. Ocean Eng. 2001, 127, 135–140. [Google Scholar] [CrossRef]
  28. United Nations Conference on Trade and Development (UNCTAD). Port Development: A Handbook for Planners in Developing Countries; United Nations: New York, NY, USA, 1985. [Google Scholar]
  29. Liu, C.I.; Jula, H.; Ioannou, P.A. Design, simulation.; evaluation of automated container terminals. IEEE Trans. Intell. Transp. Syst. 2002, 3, 12–26. [Google Scholar] [CrossRef]
  30. Koh, P.H.; Goh, J.L.; Ng, H.S.; Ng, H.C. Using simulation to preview plans of a container port operations. In Proceedings of the Winter Simulation Conference, Lake Buena Vista, FL, USA, 11–14 December 1994; pp. 1109–1115. [Google Scholar]
  31. Young, Y.W.; Seok, C.Y. A simulation model for container-terminal operation analysis using an object-oriented approach. Int. J. Prod. Econ. 1999, 59, 21–230. [Google Scholar]
  32. Demirci, E. Simulation modeling and analysis of a port investment. Simulation 2003, 79, 94–105. [Google Scholar] [CrossRef]
  33. Fowler, J.W.; Mönch, L.; Ponsignon, T. Discrete-Event Simulation for Semiconductor Wafer Fabrication Facilities: A Tutorial. Int. J. Ind. Eng. Theory Appl. Pract. 2015, 22, 661–682. [Google Scholar]
  34. Japan International Cooperation Agency (JICA). The Study for the Development of the Greater Surabaya Metropolitan Ports in the Republic of Indonesia; Technical Report; Japan International Cooperation Agency : ALMEC Corp. : Japan Port Consultants, Ltd.: Tokyo, Japan, 2007. [Google Scholar]
  35. Zis, T.; North, R.J.; Angeloudis, P.; Ochieng, W.Y.; Bell, M.G.H. Evaluation of cold ironing and speed reduction policies to reduce ship emissions near and at ports. Marit. Econ. Logist. 2014, 16, 371–398. [Google Scholar] [CrossRef]
  36. Golias, M.; Boile, M.; Theofanis, S.; Efstathiou, C. The berth-scheduling problem: Maximizing berth productivity and minimizing fuel consumption and emissions production. Transp. Res. Rec. J. Transp. Res. Board. 2010, 2166, 20–27. [Google Scholar] [CrossRef]
Figure 1. Mobile harbor (MH) system.
Applsci 09 00584 g001
Figure 2. Overall work process of the MH.
Applsci 09 00584 g002
Figure 3. Simulation layout.
Applsci 09 00584 g003
Figure 4. Layout of the Surabaya port.
Applsci 09 00584 g004
Table 1. Expected throughput pattern for the Port of Surabaya.
No.Ship Size (TEU)# of Visiting ShipsThroughput (TEU)
10–499399750
2500–99910881,000
31000–249910801,512,000
42500–3999589382,850
54000–599914773,500
Total19632,059,100
Table 2. Operation speed and cost of the MH.
Design #Capacity
(TEU)
Loading or Unloading Speed (TEU/h)Travel Time
(h)
Cost of MH
(M US$/year)
Cost of Berth
(M US$/year)
SeaLand Berth
125037.52502.704.301.63
225037.51252.703.901.62
31200755003.0711.302.40
41200752503.0710.602.10
Table 3. Input data for detailed simulations.
Ship SizeAverage IAT
(Hours)
IAT PatternCargo Pattern# of Docking Points
(250 TEU)
# of Docking Points
(1200 TEU)
1000–24998.11exp (8.11)uniform (1350;1450)21
2500–399914.87exp (14.87)uniform (600;700)32
4000–599959.59uniform (54.59,64.59)uniform (450;550)32
Table 4. Result of the simulation model.
Design# of MHs# of BerthsTotal Cost (M USD/year)
1363159.7
2396161.8
3142163
4153165.3

