Article

Smart Appliances for Efficient Integration of Solar Energy: A Dutch Case Study of a Residential Smart Grid Pilot

1
Department of Design, Production and Management, Faculty of Engineering Technology, University of Twente, P.O. Box 217, 7500 AE Enschede, The Netherlands
2
Energy Technology Group at Mechanical Engineering, Eindhoven University of Technology, P.O. Box 513, 5600 MB Eindhoven, The Netherlands
*
Author to whom correspondence should be addressed.
Appl. Sci. 2019, 9(3), 581; https://doi.org/10.3390/app9030581
Submission received: 7 December 2018 / Revised: 23 January 2019 / Accepted: 28 January 2019 / Published: 10 February 2019

Abstract

:
This paper analyzes the use patterns of a residential smart grid pilot in the Netherlands, called PowerMatching City. The analysis is based on detailed monitoring data measured at 5-min intervals for the year 2012, originating from this pilot which was realized in 2007 in Groningen, Netherlands. In this pilot, smart appliances, heat pumps, micro-combined heat and power (µ-CHP), and solar photovoltaic (PV) systems have been installed to evaluate their efficiency, their ability to reduce peak electricity purchase, and their effects on self-sufficiency and on the local use of solar electricity. As a result of the evaluation, diverse yearly and weekly indicators have been determined, such as electricity purchase and delivery, solar production, flexible generation, and load. Depending on the household configuration, up to 40% of self-sufficiency is achieved on an annual average basis, and 14.4% of the total consumption were flexible. In general, we can conclude that micro-CHP contributed to keep purchase from the grid relatively constant throughout the seasons. Adding to that, smart appliances significantly contributed to load shifting in peak times. It is recommended that similar evaluations will be conducted in other smart grid pilots to statistically enhance insights in the functioning of residential smart grids.

Graphical Abstract

1. Introduction

Residential photovoltaic (PV) installations are one of the promising options to locally generate and consume sustainable and cost-effective energy [1]. One of the major technical issues related to the integration of renewable energy systems into local electricity networks is balancing the mismatch between demand and supply of power [2]. Daily and seasonable meteorological conditions significantly affect renewable energy production [3] as well as demand patterns. 100% matching of the residential consumption with renewable energy can be achieved by PV systems in combination with residential storage systems such as batteries [4,5], vehicle to grid technologies [6], or by using community-based storage systems [7]. Although batteries may be required to maintain a high quality of the power fed into local electricity networks, alternative solutions for the realization of flexibility may need to be evaluated because of the high environmental impact of batteries [8]. For instance, one can think about other types of storage systems or optimizing the capacity of batteries.
Rather than self-consumption with flexible loads or temporary storage of the PV infeed to the grid, an efficient and sustainable integration of renewable energy is only possible if the network is flexible and resilient [9]. Electric flexibility can be defined as a power adjustment sustained at a given moment for a given duration from a specific location within the network [10,11]. Thus, a flexibility service is characterized by five attributes: its direction, its electrical composition in power, its temporal characteristics defined by its starting time and duration, and its base for location [10]. To enable all the potential flexibility, the organization and functioning of electricity grids will require more intelligence and complexity, for which reason they are called ‘smart grids’. Smart grids balance variations of the energy production in renewable energies with regards to energy demand and regulate the demand side via, for instance, shiftable loads with respect to time and quantity [12].
Firstly, sustainable supply flexibility might be offered by the network itself through storage systems (hydroelectricity, fuel cells, and hydrogen). Hydrogen technologies and fuel cell–powered electric vehicles may provide a balanced energy system [13]; however, such systems are still quite expensive [14]. Therefore, one of the most promising solutions to increase flexibility is the use of combined distributed energy resources (DER), such that they will jointly produce electricity on moments of demand. In this scope, micro-combined heat and power (µ-CHP) units could be complementary to residential PV systems by offering both electricity and heating, especially if the electricity prices are fairly high or natural gas prices are relatively low [15,16]. Therefore, we would like to evaluate the efficient integration of PV systems into a local network that comprises different configurations of DER.
Secondly, residential homes with various smart appliances may contribute to the load flexibility [17] together with home energy management systems and demand response [18,19]. In the literature [20], domestic cleaning practices by use of smart washing machines and smart dishwashers are described as the most favorable residential consumption practices for demand side response [21]. Heating and lighting practices have a medium flexibility potential, according to the same social study. Moreover, in terms of the price responsiveness of electricity users, dishwashers are qualified as significant drivers in time-of-use tariffs [22]. By means of these smart appliances, this study aims to evaluate the flexible load in a smart grid pilot, particularly its temporal characteristics and average electrical composition in power.
In this paper, flexibility in both supply and demand is analyzed by means of detailed monitoring data of PowerMatching City (PMC), which is a residential smart grid pilot which got realized in the year 2007 in the City of Groningen in the Netherlands [23]. This pilot includes 22 households (HH) with PV systems and different configurations of their energy systems with µ-CHP, smart hybrid heat pumps (SHHP), and also smart appliances, as illustrated in Figure 1a and detailed in Table 1 [24]. An energy management software, PowerMatcher, has been used to operate power flows on this pilot [25].
Our analysis will quantify the electricity consumption of households, purchase of power from the grid, and feed-in of electricity from households to the grid, as well as PV and µ-CHP energy production during 2012, in order to analyze self-sufficiency of residential electricity networks with PV systems in combination with other distributed energy systems. The shiftable load is also quantified to put this analysis in a more complete perspective. In recent EU reports, one of the most dense areas in terms of the investment in smart grids was the Netherlands, and the peak year of the investment was 2012 [26]. The investigated final phase (phase 2) of the pilot duration is January 2012 through January 2015, and the available data for our research was limited to January 2012 until January 2013.
This paper is structured as follows. The pilot configuration, energy tariffs, the data, the data processing methods, data quality, and equations applied to determine energy indicators are presented in Section 2. The results are presented in Section 3 and discussed in Section 4. The paper is completed by conclusions presented in Section 5.

2. Materials and Methods

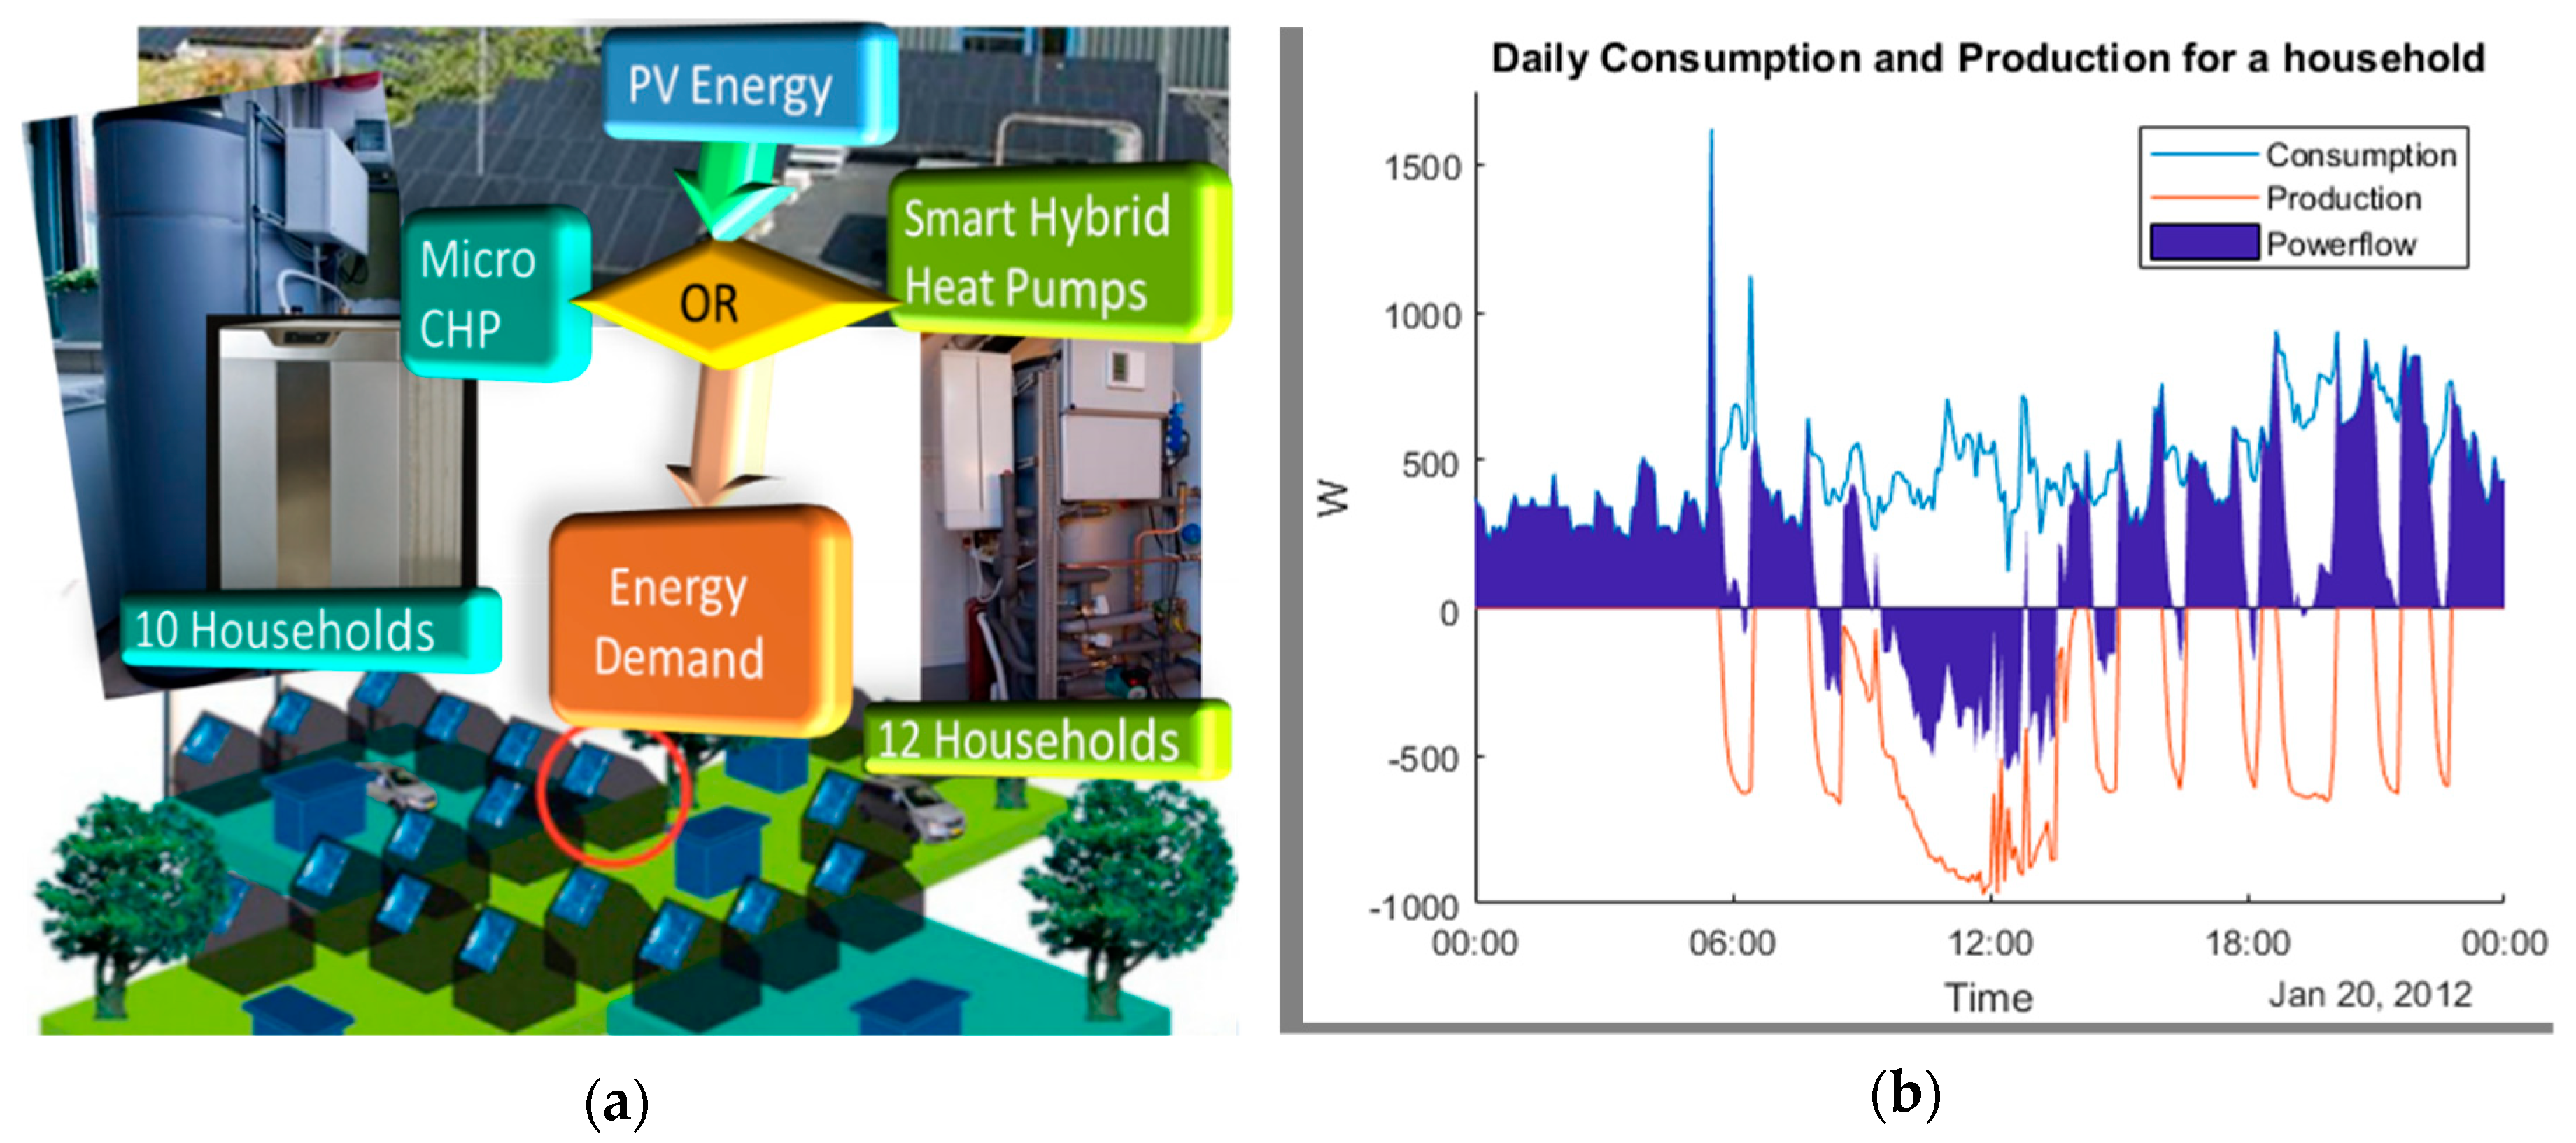
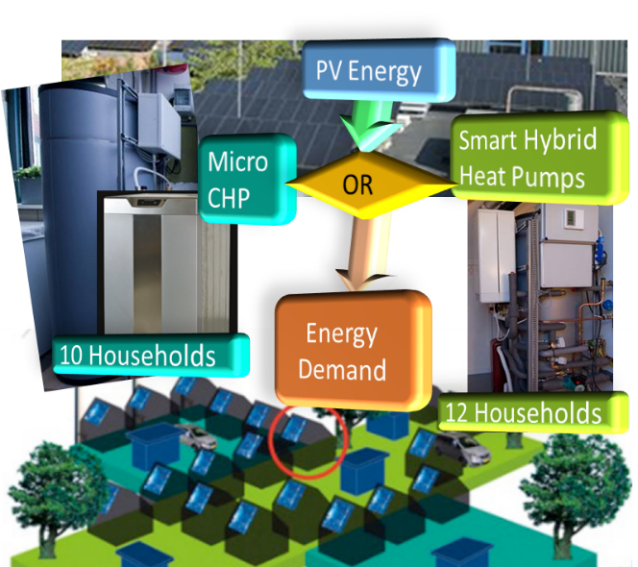
2.1. PMC Configuration

Main features of PMC households are summarized in Table 1 [24,27]. Ten out of twenty-two households owned a µ-CHP unit with a nominal power of 1 kW of electrical energy. Adding to that, a µ-CHP unit was able to produce 6 kW thermal energy to heat the house, using a hot water buffer of 210 L. Four of the households had rooftop PV installations with an area and nominal power given in Table 1. Through the local smart grid, 18 other households virtually shared a PV system on a farm located 2.3 km from Groningen, the actual location where this smart gird pilot is installed. Each household received a nominal power of 1590 Wp from this farm.
The smart appliances installed in this pilot were smart washing machines, smart dishwashers, and smart hybrid heat pumps (SHHP) with a condensing boiler. The SHHPs contained heat pump units with a thermal power output of 4.5 kW and a condensing boiler with a thermal power output of 20 kW. Additionally, a 210-L hot water buffer was used in these systems. In this pilot, the smart washing machines and smart dishwashers were programmable by time so that users could program it to their needs or comfort expectancies. Half of the households had been equipped with these two smart appliances. The expected outcome of experiments with PMC household smart energy systems matched the time of use of smart appliances with PV power production by a smart algorithm. Figure 1b shows the household consumption and production of a PMC household equipped with PV and µ-CHP in the winter, when irradiance levels are low. It gives an example of how PV and µ-CHP jointly produce electricity to meet the demand, aiming at minimizing the power flow from the grid.
The activation of µ-CHP was organized by PowerMatcher, which not only took into consideration the self-sufficiency of the households but also the neighbors’ demand, the dynamic price signal, and the heating requests. Moreover, we were able to see the help of µ-CHP in instantaneously counter-balancing high demands, especially visible in the evening, where usually peak hours occur in the Netherlands (example in Figure 1b is a weekday). The purchase from the grid was brought down to less than 500W by µ-CHP, and the electricity plus including PV production was either delivered to the grid or served for smart appliances, heating, neighbors, etc. Therefore, our aim was to analyze the overall system performance, including DER and smart appliances.

2.2. Household Characteristics

The socio-economic features of households participating in this pilot, such as the education degree and income, was above the average for households in the Netherlands. For instance, the number of residents per household in PowerMatching City (PMC) was 3.1 versus 2.2, which is the average number in the Netherlands [24]. Table 2 gives details about the household sizes. The different shares of single resident households cannot be neglected. Adding to that, the surfaces of the households of PMC were larger than the Dutch average, which may have had an effect on the homes’ energy consumption in terms of air conditioning, water heating, and lighting [28]. However, smart appliances and other efficient devices were expected to have a positive effect on the reduction of energy consumption [29].

2.3. Energy Tariffs

In the Netherlands, electricity prices for households vary according to the amount of consumption. In 2012, the costs of electricity were [30]:
  • 11.5 c€/kWh for 1000–2500 kWh
  • 18.7 c€/kWh for 2500–5000 kWh
  • 22.3 c€/kWh for 5000–15000 kWh
These numbers include VAT and taxes. Although dynamic prices were applied, we did not have access to real-time prices managed by PowerMatcher [31]. The data meters were also tracking the time-of-use price tariffs, defined as follows. The low-electricity tariff (low rate) was available weekdays from 23:00 to 7:00 and on weekends, beginning on Friday at 23:00 and finishing on Monday morning at 7:00. At other times, the normal electricity tariff (normal rate) applied. The natural gas price was 26 c€/m³ [32], where 10.6 m3/m2 (house surface) was the average Dutch household consumption in 2012.

2.4. Data Processing and Equations

PMC households were equipped with smart meters, which measured the electricity and gas consumption and the production of diverse appliances [33]. Data was stored on a server in the form of cumulative and instantaneous values. Before further processing, the data quality of ~80% of the data was assessed for most of the households for the instantaneous consumption, and values were cross-checked with cumulative values. For the missing 20%, derivatives of cumulative values were employed to fill subsequently missing instantaneous values of more than 15 min to boost the data quality. We excluded only one household with heat pump because of the significantly low data quality, around 50% overall across the year. The power data includes the losses. We processed the 29 variables that were measured for the whole year at a 5-min resolution, using MatLab (2017b). To summarize, these variables consisted of energy delivery and purchase according to two tariffs (shown above in Section 2.3), PV system power production and µ-CHP power production, the ambient temperature, the status of smart appliances, and several other variables. Table 3 summarizes the equations that have been used to determine energy indicators on the basis of this data set, in which E stands for energy, P for power, t for time, n for number of appliances, m for number of energy sources, n.r. for normal rate, and l.r. for low rate. In this Table 3, to analyze the load flexibility, equations for the status of smart appliances are mentioned in at last three columns, in which S is a logical array of activation time and F is a logical array of flexibility time.
In most of the cases, the consumption of the smart appliances varies significantly with the setting of the program which is used to run them, and their specific consumption curve over time. Hence, the most precise way to determine the power consumption is obviously to measure the consumption of the appliance directly. The power consumption data of the heat pumps helped us to directly obtain this information, processed as in the last row in Table 3.
High-potential flexible loads in this study were dishwashers and washing machines. The power consumption was not measured directly for these two appliances because only smart appliances’ activation times (S) were given in the data. To accurately predict the electricity consumption just by activation parameters, two parameters have to be known: the consumption profiles of all use modes that are possible for the specific model of the appliance and its various program (use) cycle times. Moreover, the cycle time of the different programs or combinations of programs of the appliances should not overlap in the time resolution given (here, 5 min). Otherwise, a running program has to be coded as well. Because we did not have information about the specifications of the activated program or the specific consumption profiles and cycle times, we chose to proceed with average values of power consumption within the data set and to consider average cycles. Moreover, the efficiency and energy consumption of the appliances in 2012 are not same as nowadays.
A medium-potential flexible load in this study were heat pumps, as the temperature inside the house had to be kept within the temperature range that users indicated. In fact, indoor temperature is highly dependent on many parameters, such as household orientation, surface, isolation, outside temperature, etc. Adding to that, surveys also indicate a medium potential on behavioral change regarding heating habits [21]. Nevertheless, we still indicate this medium potential of flexible load amount in the results section, including gas consumption in the case that temperatures were too low. This also includes the amount of electricity spent on heating and boiler functions, as the heat pumps provided both. For the performance analysis of the heat pumps and PowerMatcher supervision, please refer to [34].
For the two smart appliances that were analyzed, data from the selected 9 households covered 97.8% of the year on an average. The average cycle of washing machines and dishwashers (2 h and 2 h 15 min, respectively) and the energy consumption per cycle (0.88 kWh and 1.19 kWh respectively) are constants which have been found in the literature, which allowed to calculate the total amount of energy consumed by those two appliances [35,36].

3. Results

From our data analysis it can be seen that the average electricity consumption of the households in PMC in 2012 was 57% higher (5.2 MWh) than the average energy consumption of households in the Netherlands (3.3 MWh) [37]. The higher amount of consumption of PMC can be partially explained by the number of residents per household (40% higher than the Dutch average). PMC households purchased on average 4.3 MWh of electricity. 10 households were able to deliver 0.6MWh of electricity to the grid, while 12 households could not deliver any electricity at all because the configurations of their energy systems did not allow them to produce more than what was consumed at any given moment and because their PV panels were virtual.
On an average, 0.9 MWh of produced energy was self-consumed for households in PMC. Figure 2 illustrates the percentages of energy consumption and production, taking into account different tariffs.
In total, all households in PMC produced more than 17 MWh with their PV systems and 9.5 MWh with their µ-CHP units, and 7.2 MWh of electricity was sold, with 42% at a normal tariff. In total, for 21 households, 90 MWh electricity was purchased from the grid with 46% at a low tariff.

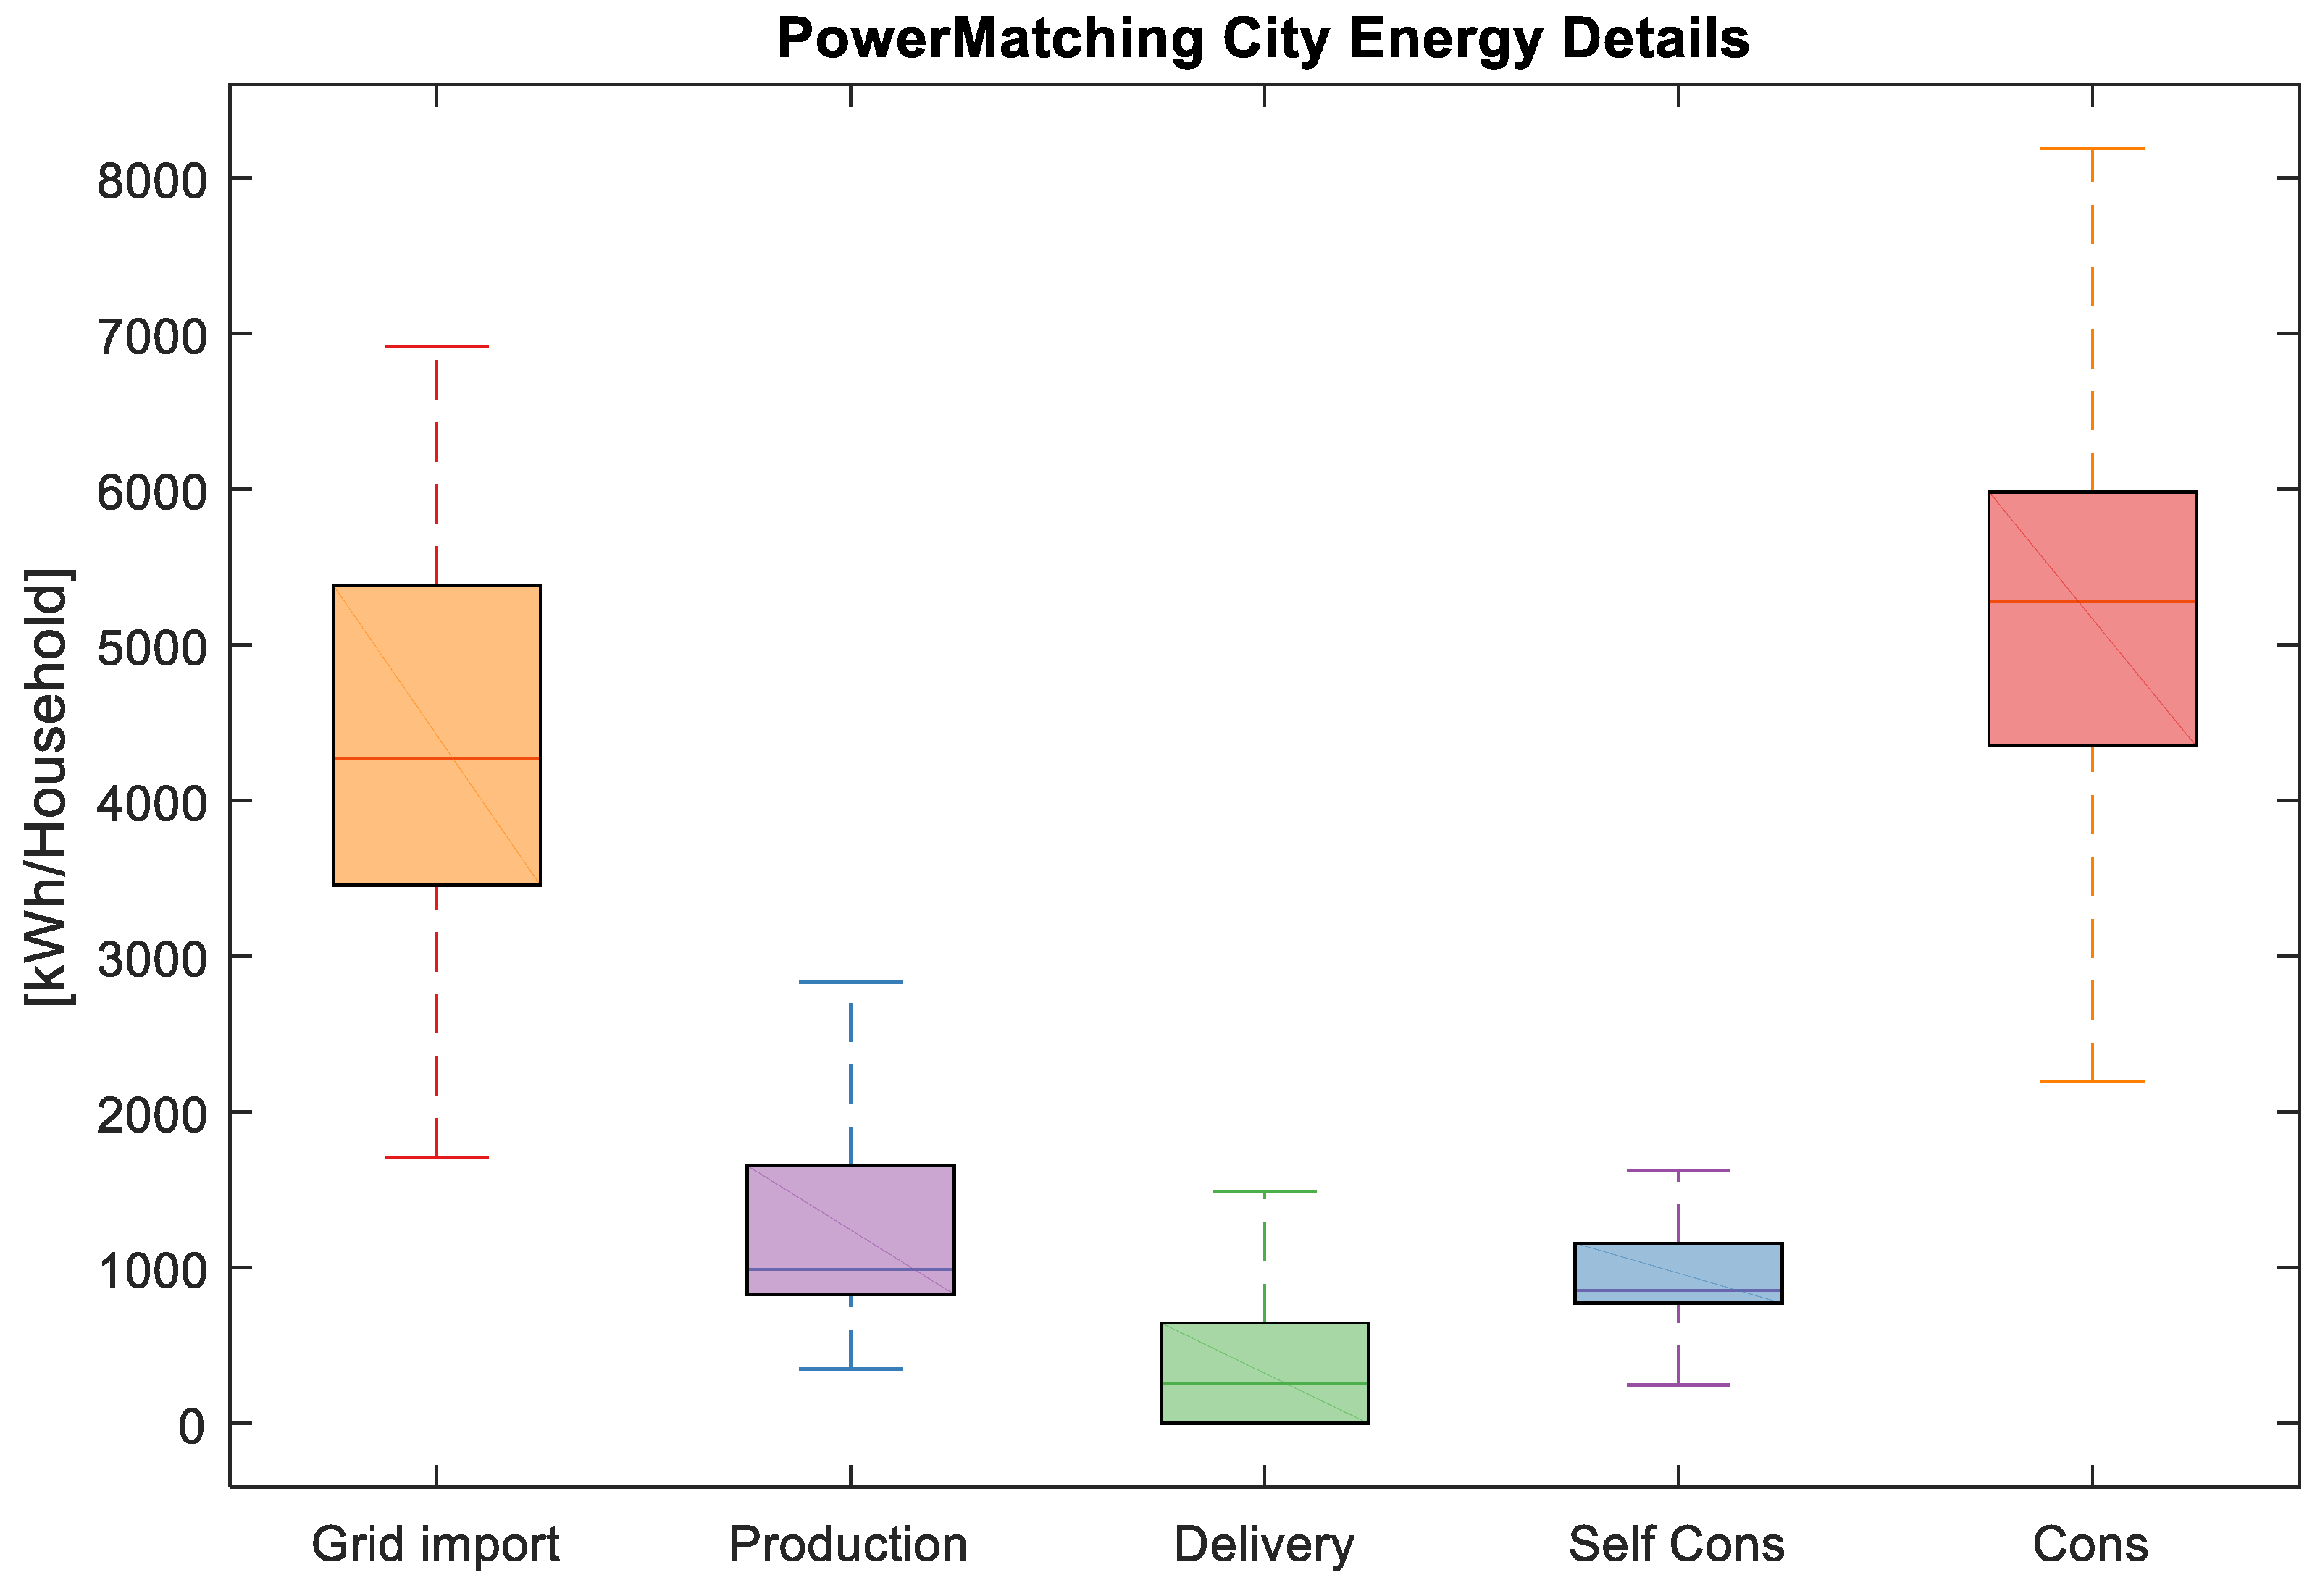
3.1. Electricity Consumption and Production Characteristics of PMC Households

Figure 3 and Table 4 provide an energy summary per household for the year 2012, for 5 different energy features mentioned: purchased electricity, electricity production, electricity delivery, self-consumption, and electricity consumption. They vary by up to 400% depending on household size and human behavioral changes from one household to other.
The values are expressed in Table 4, with supplementary values on PV output and µ-CHP. The large range of sample highlights the different groups included in the pilot, which gives more cases and scenarios; however, this might have an effect on average values as the sample is limited to 21 households.

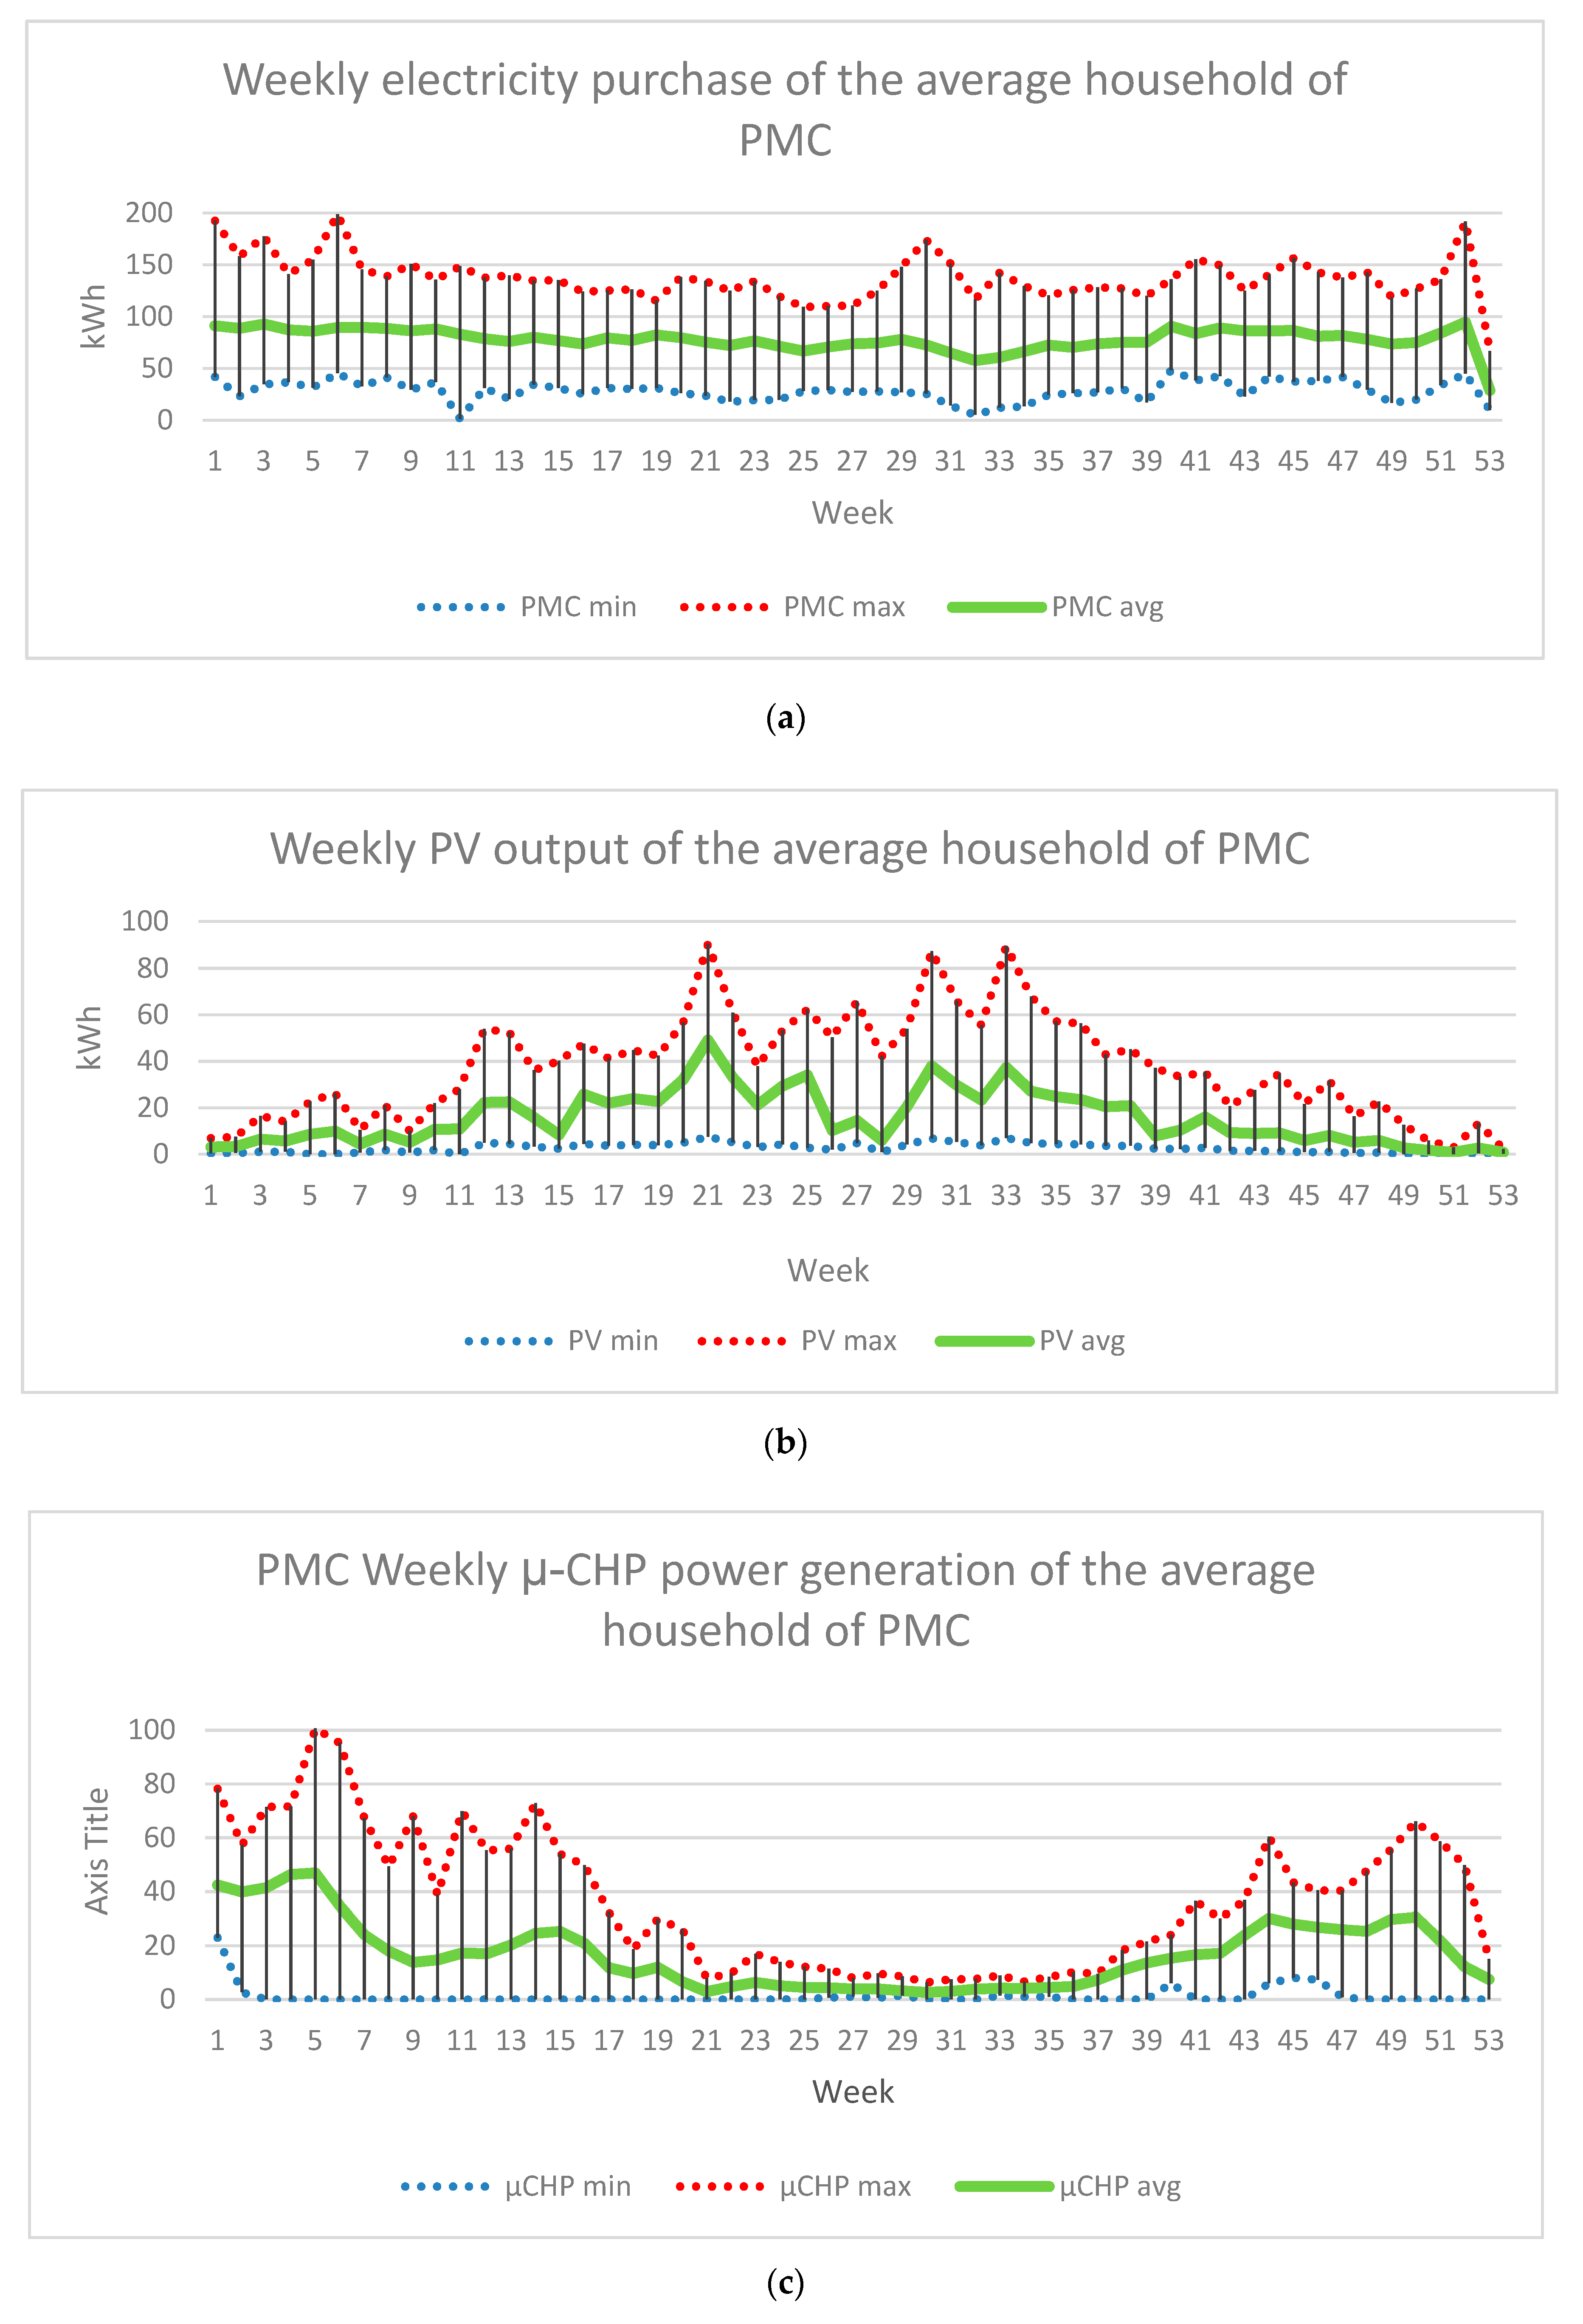
3.2. Monthly and Weekly Energy Balance of the Households

As heat pumps were employed in PMC, the electricity consumption obviously increased considerably in winter, and the PV production decreased, as shown in Table 5. In January, the production of μ-CHP was highest and decreased until September (except April). This highest peak seems to be the first trial of μ-CHP for the pilot, as afterwards the values settled between 85 and 105 kWh/household for the winter. Despite the fact that the highest PV production occurred in May, the lowest grid import happened in April, taking into account μ-CHP, otherwise in August for the group of households with only heat pumps.
To focus on the import from the grid, given as averages with higher resolution, Figure 4 shows the weekly variations of electricity purchase, PV, and μ-CHP output in Figure 4a–c, respectively. Figure 4a shows that the average weekly electricity purchase per household (households with HP and μ-CHP) varied slightly throughout the year, except for holiday weeks, as the last week of December and the beginning of the August, where the users were expected to be away. The average value of weekly electricity purchased is 78 kWh per household vs. 96 kWh consumed, which shows the amount of self-consumption. The PV output (Figure 4b) and µ-CHP (Figure 4c) succeeded relatively to keeping the electricity purchase from the grid relatively constant although the seasonal consumption varied a lot in PMC and in most western countries such as the Netherlands.

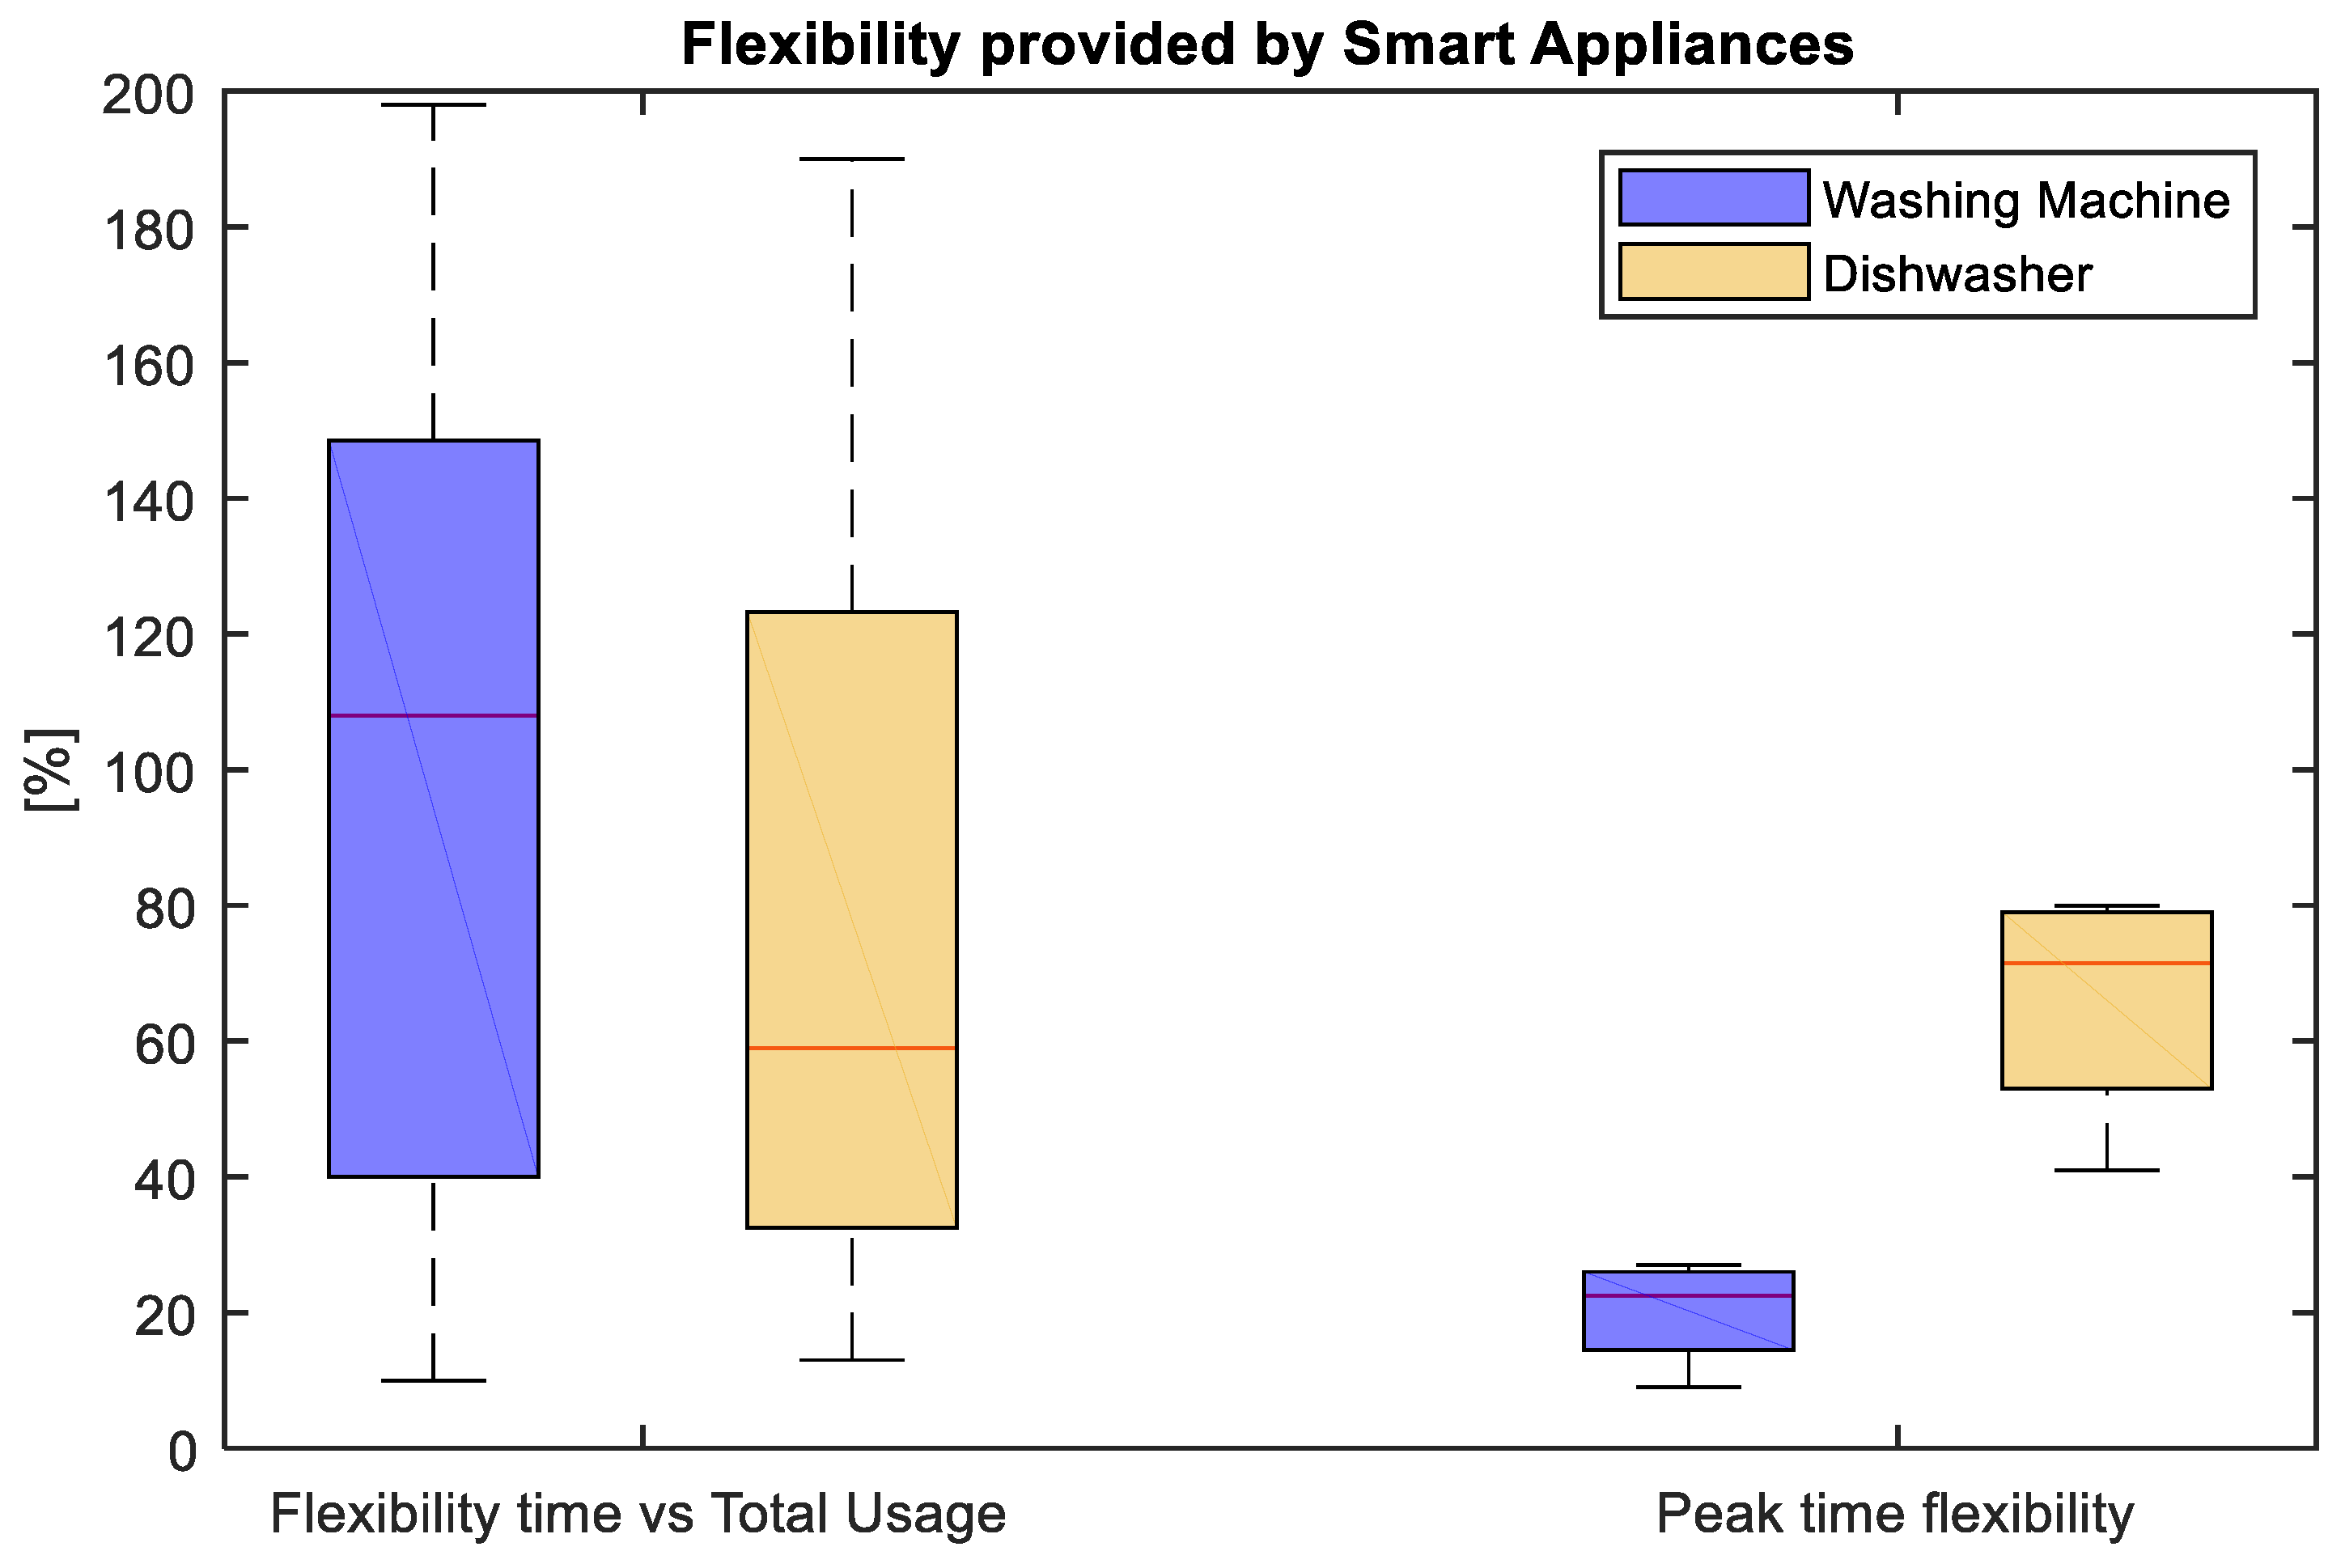
3.3. Flexibility with Smart Appliances

On average per household, 408 h of dishwasher activity and 297 h of washing machine activity were recorded during the year of 2012. By using the equations mentioned in Table 2, the average consumption of the washing machine per household in 2012 is 130.83 kWh. This value is 10% lower than the average Dutch laundry electricity consumption and 25% lower than in the EU-15 [35], which clearly shows the efficient use of smart washing machines comparing to classical machines, despite the greater number of household residents. The same methodology is applied for the smart dishwasher. The total consumption of the dishwasher for 2012 was 215.7 kWh per household. This value is 8% lower than the average value for the EU-15 [36]. In total, these smart appliances brought 346.5 kWh of load flexibility to the grid per household, which corresponds to 10.5% of the average Dutch household electricity consumption in 2012, and to 6.8% of the average household electricity consumption in PMC. Table 6 summarizes the average consumption of smart appliances based on the equations presented in Table 2 and compares those consumptions to average values of different countries.
Those percentages should be considered with the semi-automatic flexibility that it could contribute by users entering a latest run time. By using the same equations presented in Table 2, we considered this time how much the two smart appliances were shifted compared to their use time. The flexibility period offered by smart washing machines (WM) was similar to the usage time in median value and 60% for the smart dishwasher (DW) in comparison to the usage time (Figure 5).
Defining peak hours as 17:00–23:00 on weekdays, we found that on average, 60% of the DW peak hours were shifted with the latest runtime option and, similarly, 20% for WM, comparing again the actual runtime in the same year.
As providing full-automatic flexibility, the heat pumps with electric water boiler option consumed 400 kWh on average per household. Heating was mainly done by gas consumption, which is detailed in the discussion.

4. Discussion

As the number of residents, their socio-economic status, educational level, and the surface of the households are above the Dutch averages, and the sample is limited to 21 households and one single year, results should be considered with caution with respect to the average values. However, these results indicate to which extend PV infeed can be applied and how much self-sufficiency or energy savings may be obtained with the combination of technologies such as µ-CHP and heat pumps, knowing that using only PV will not be appropriate for the grid in northern countries such as the Netherlands. Yearly and weekly results highlight the benefits of DER combination in the seasonal variabilities of renewable energies. In this section, we present a simplistic energy bill analysis and discuss the flexibility before stating our conclusions.

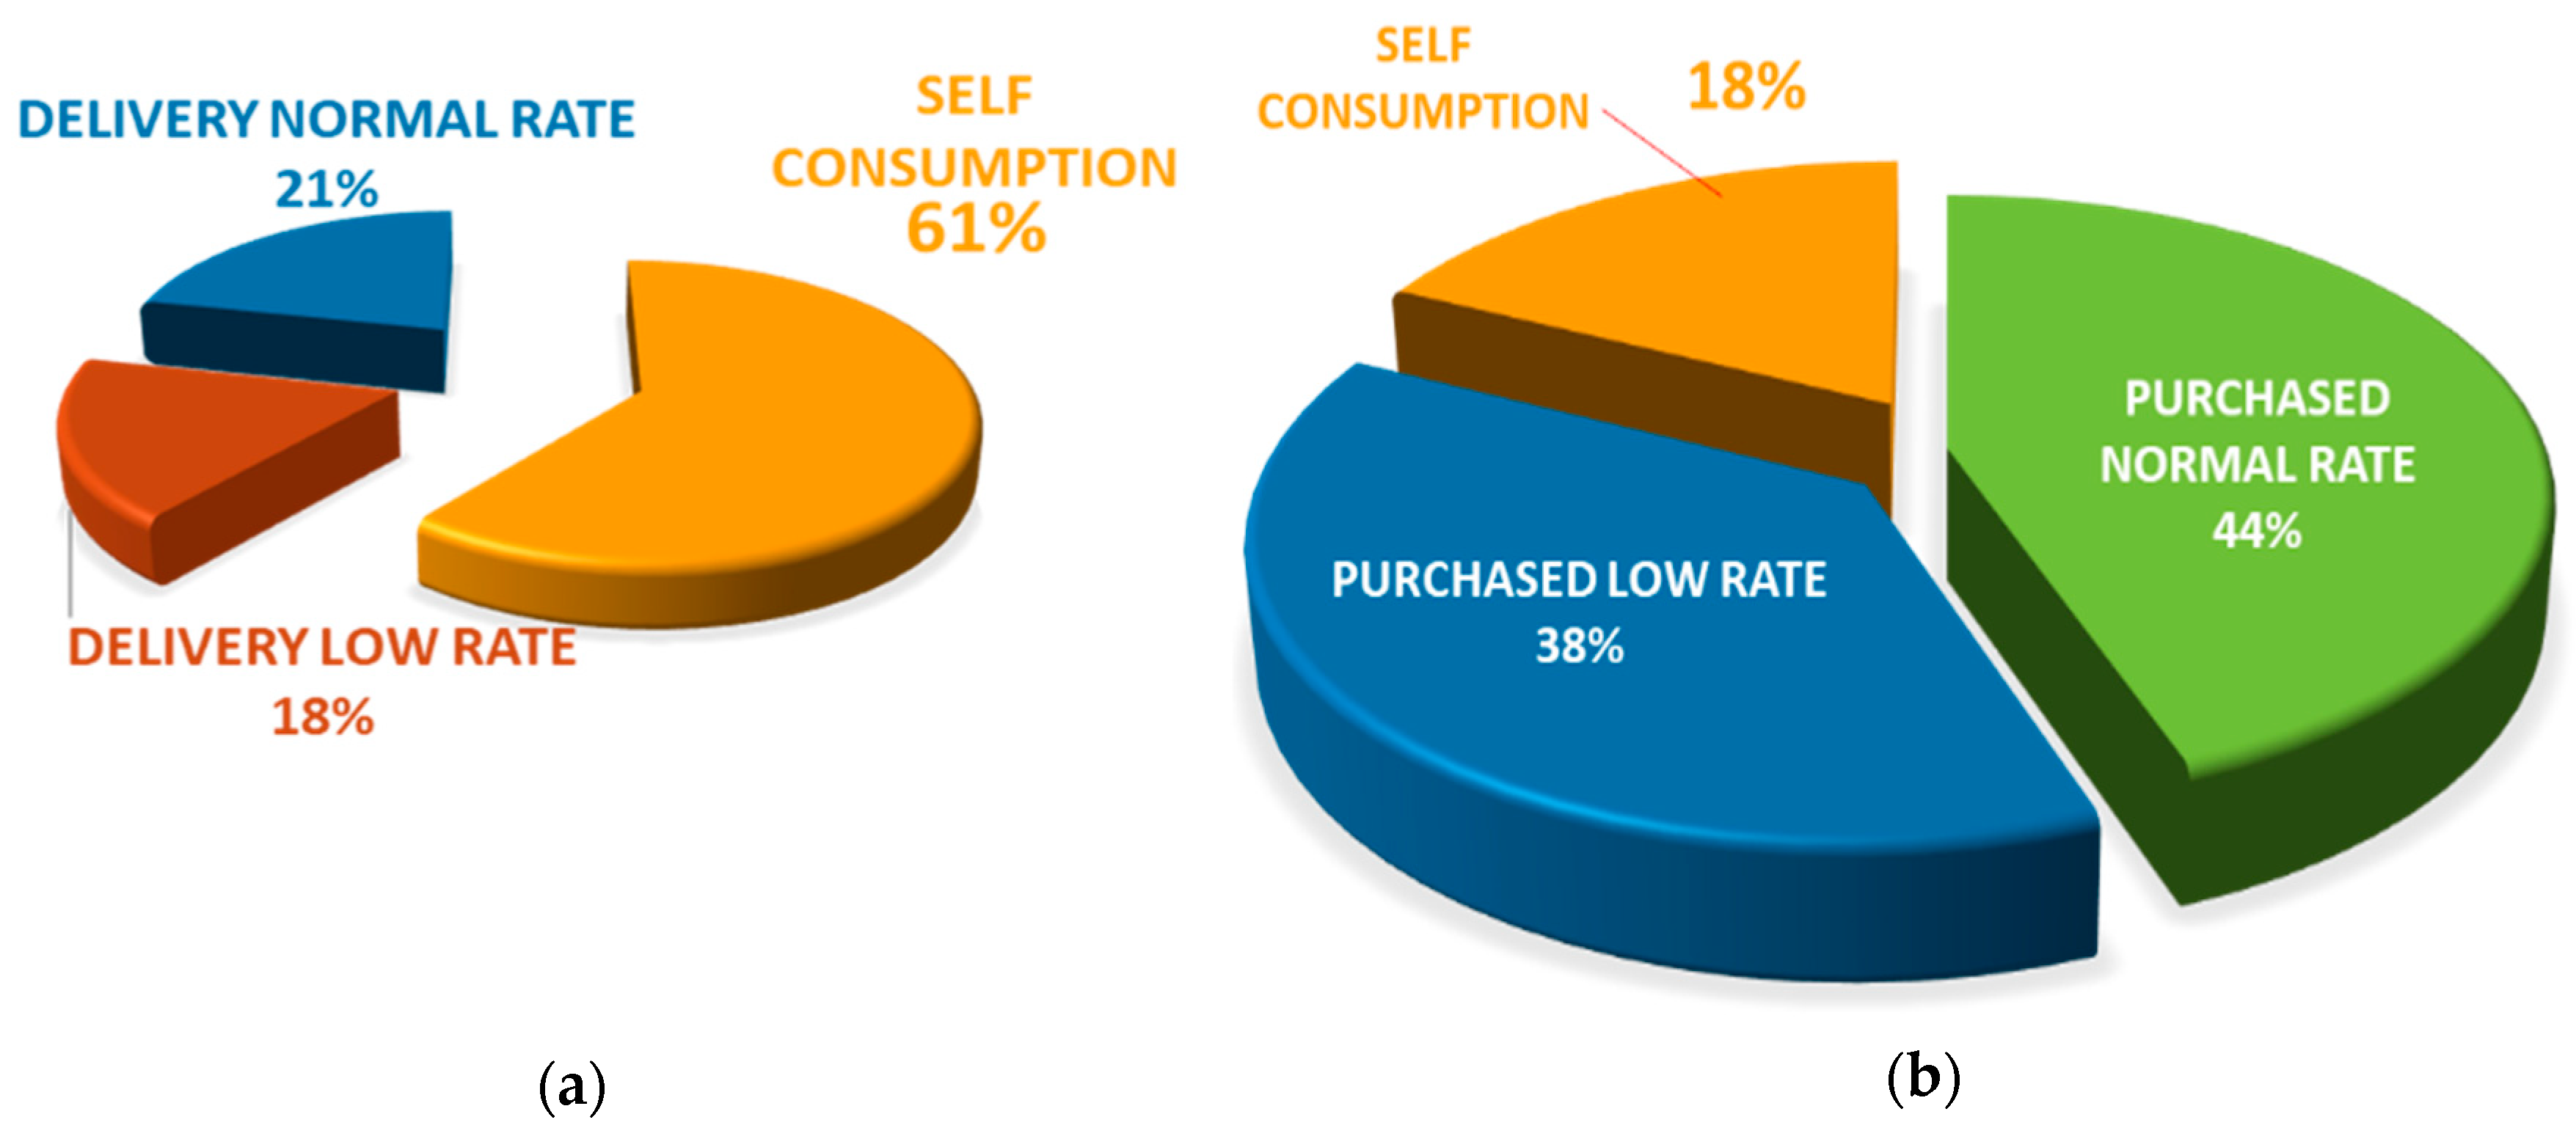
4.1. PV and µ-CHP: Electricity Production

Figure 4b indicates the weekly PV output in mean value with an average of 37 kWh, which is the same for µ-CHP power generation, shown in Figure 4c. The winter atmospheric conditions in the Netherlands have a consequent impact on the PV output, and µ-CHP power generation shows a good way of balancing the seasonal renewable energy output. This energy comes at an additional cost of gas consumption, which can be provided from sustainable sources such as biogas.
Gas consumption was 1700 m3, which is higher than the Dutch average (1400 m3) [38], but considering the surfaces varying between 150 and 199 m2 in the PMC, this values gets close to the Dutch average: 10.6 m3/m2 household surface. As the PV and µ-CHP provided a part of the consumption, the households could decrease their bill considerably, especially when they were potentially purchasing one electricity rate category lower. µ-CHP gas consumption costs 390€/year on average, similar to other heating means, and helps to maintain the seasonal electricity balance. Moreover, in time of use or dynamic tariff scenarios, their role will be much more important, as the peak hour purchase will vary.

4.2. Self Sufficiency

The households equipped with PV and µ-CHP had a self-sufficiency of 40.7% over the year, contrary to those furnished with PV and SHHP (20.3%). As presented in Figure 4, even in the worst weeks, µ-CHP had a self-sufficiency of over 20%, except for one week when it dropped to 12%. SHHP, which drops rapidly to under 5% for many winter weeks, even saw 1%, as it was only related to PV generation.

4.3. Energy Bill

To simplify and not take into account different prices and tariffs that different electricity providers offer, we will use the most common tariff in the Netherlands, net metering. The installation costs will be excluded from our analysis, as such information is difficult to access in hindsight. Only data on the difference between the total consumption and total purchase, and what is saved from the electricity bill has been considered.
For obvious reasons, the installation capacities of PV Wp played a major role in the savings. Up to 640 €/year were saved with µ-CHP and PV installations, with mean savings of 510 €/year in this group. The group without µ-CHP but with PV infeed saved 336 €/year on average, and the minimum savings were 40 €/year, because of a very small PV installation. Although savings are quite considerable, the real installation costs and maintenance costs have to be taken into consideration in order to conclude the real economic benefits of the smart grid for the prosumers.

4.4. Flexibility and Smart Washing Machine and Dishwasher

We observed that, despite the high number of residents per house and an energy consumption which was higher than the national average, the smart appliances in the PMC pilot were consuming less energy than the traditional ones. However, the arguments are not strong enough to draw the conclusion that smart appliances reduce the energy consumption, as the number of households was too low to be statistically significant (11). Additionally, there might be a bias in user behavior and the activation frequency of the appliances due to the Hawthorne effect (see [39]). More multidisciplinary studies as mentioned in [12] on the subject are needed, especially regarding user behaviors [40,41,42].
Current machines have become much more efficient, and accordingly, the residential electricity consumption has been decreasing since 2012. To respect the conditions at the time of data collection and to analyze the ratio between the overall electricity consumption and the smart appliances’ role, we have chosen literature from the same period, which we estimated being more significant in percentages. The amount of electricity and the existing ratio should be approved with current machines and ongoing smart grid initiatives.

5. Conclusions

To sum up, we compared the different configurations of a smart grid pilot in the Netherlands in order to identify the demand–supply balance of the configurations. Energy consumption and energy production is classified in three groups: low rate, normal rate, and energy self-consumption. The weekly purchase, PV output, and µ-CHP power generation is shown to highlight the seasonal complexity. The impact on the energy bill is discussed in the previous section, as well as the flexibility provided by smart appliances and heat pumps, which together corresponds to 14.4% of the electricity consumption for an average household.
In conclusion, µ-CHP might be a good solution for northern countries such as the Netherlands to provide heat and electricity when PV infeed is weak. The installation costs and the complexity to integrate this kind of equipment in existing buildings, as well as the insulation class of the household might be the barriers in those configurations. Regarding flexibility contributions, we support the findings of the social scientists that cleaning practices are potentially highly flexible for residential consumptions, which we demonstrated in this work to be as flexible as their usage time across the whole year.

Author Contributions

Writing—original draft preparation, formal analysis, investigation and algorithms, C.G.; conceptualization and validation, C.G. and A.R.; resources, review, editing, A.R. and C.G.; supervision, project administration, data and funding acquisition, A.R.

Funding

This research has received funding from the European Union’s Horizon 2020 research and innovation programme under the ERA-Net Smart Grids plus, grant number 646039, from the Netherlands Organisation for Scientific Research (NWO).

Acknowledgments

Our project has received funding in the framework of the joint programming initiative ERA-Net Smart Grids Plus, with support from the European Union’s Horizon 2020 research and innovation programme. Furthermore, we would like to acknowledge all participants in the smart grid pilot (PowerMatching City) involved in this study for their willingness to share their data, experiences, and knowledge with the researchers.

Conflicts of Interest

The authors declare no conflict of interest.

Disclaimer

The content and views expressed in this material are those of the authors and do not necessarily reflect the views or opinion of the ERA-Net SG+ initiative. Any reference given does not necessarily imply the endorsement by ERA-Net SG+.

References

  1. van Geenhuizen, M.; Schoonman, J.; Reinders, A. Diffusion of Solar Energy Use in the Built Environment Supported by New Design. J. Civ. Eng. Archit. 2014, 8, 253–260. [Google Scholar] [CrossRef]
  2. Campbell, M. The Economics of PV Systems. In Photovoltaic Solar Energy; Reinders, A., Verlinden, P., van Sark, W., Freundlich, A., Eds.; John Wiley & Sons Ltd.: Chichester, UK, 2017; pp. 621–633. ISBN 978-1-118-92749-6. [Google Scholar]
  3. Reinders, A.; Verlinden, P.; van Sark, W.; Freundlich, A. Photovoltaic Solar Energy: From Fundamentals to Applications; John Wiley & Sons Ltd.: Chichester, West Sussex, UK; Hoboken, NJ, USA, 2017; ISBN 978-1-118-92746-5. [Google Scholar]
  4. Quintero Pulido, D.; Hoogsteen, G.; ten Kortenaar, M.; Hurink, J.; Hebner, R.; Smit, G. Characterization of Storage Sizing for an Off-Grid House in the US and the Netherlands. Energies 2018, 11, 265. [Google Scholar] [CrossRef]
  5. Schram, W.L.; Lampropoulos, I.; van Sark, W.G.J.H.M. Photovoltaic systems coupled with batteries that are optimally sized for household self-consumption: Assessment of peak shaving potential. Appl. Energy 2018, 223, 69–81. [Google Scholar] [CrossRef]
  6. Hoogvliet, T.W.; Litjens, G.B.M.A.; van Sark, W.G.J.H.M. Provision of regulating- and reserve power by electric vehicle owners in the Dutch market. Appl. Energy 2017, 190, 1008–1019. [Google Scholar] [CrossRef]
  7. AlSkaif, T.; Schram, W.; Litjens, G.; van Sark, W. Smart charging of community storage units using Markov chains. In Proceedings of the Innovative Smart Grid Technologies Conference Europe, Torino, Italy, 26–29 September 2007; IEEE: Torino, Italy, 2017; pp. 1–6. [Google Scholar]
  8. Peters, J.F.; Baumann, M.; Zimmermann, B.; Braun, J.; Weil, M. The environmental impact of Li-Ion batteries and the role of key parameters—A review. Renew. Sustain. Energy Rev. 2017, 67, 491–506. [Google Scholar] [CrossRef]
  9. Kabalci, E. Power System Flexibility and Resiliency. In Power Systems Resilience; Mahdavi Tabatabaei, N., Najafi Ravadanegh, S., Bizon, N., Eds.; Springer International Publishing: Cham, Switzerland, 2019; pp. 81–100. ISBN 978-3-319-94441-8. [Google Scholar]
  10. Eid, C.; Codani, P.; Perez, Y.; Reneses, J.; Hakvoort, R. Managing electric flexibility from Distributed Energy Resources: A review of incentives for market design. Renew. Sustain. Energy Rev. 2016, 64, 237–247. [Google Scholar] [CrossRef] [Green Version]
  11. Lannoye, E.; Flynn, D.; O’Malley, M. Evaluation of Power System Flexibility. IEEE Trans. Power Syst. 2012, 27, 922–931. [Google Scholar] [CrossRef] [Green Version]
  12. Reinders, A.; Übermasser, S.; van Sark, W.; Gercek, C.; Schram, W.; Obinna, U.; Lehfuss, F.; van Mierlo, B.; Robledo, C.; van Wijk, A. An Exploration of the Three-Layer Model Including Stakeholders, Markets and Technologies for Assessments of Residential Smart Grids. Appl. Sci. 2018, 8, 2363. [Google Scholar] [CrossRef]
  13. Oldenbroek, V.; Verhoef, L.A.; van Wijk, A.J.M. Fuel cell electric vehicle as a power plant: Fully renewable integrated transport and energy system design and analysis for smart city areas. Int. J. Hydrogen Energy 2017, 42, 8166–8196. [Google Scholar] [CrossRef]
  14. Robledo, C.B.; Oldenbroek, V.; Abbruzzese, F.; van Wijk, A.J.M. Integrating a hydrogen fuel cell electric vehicle with vehicle-to-grid technology, photovoltaic power and a residential building. Appl. Energy 2018, 215, 615–629. [Google Scholar] [CrossRef]
  15. Salmerón Lissén, J.; Romero Rodríguez, L.; Durán Parejo, F.; Sánchez de la Flor, F. An Economic, Energy, and Environmental Analysis of PV/Micro-CHP Hybrid Systems: A Case Study of a Tertiary Building. Sustainability 2018, 10, 4082. [Google Scholar] [CrossRef]
  16. Beccali, M.; Ciulla, G.; Di Pietra, B.; Galatioto, A.; Leone, G.; Piacentino, A. Assessing the feasibility of cogeneration retrofit and district heating/cooling networks in small Italian islands. Energy 2017, 141, 2572–2586. [Google Scholar] [CrossRef]
  17. Staats, M.R.; de Boer-Meulman, P.D.M.; van Sark, W.G.J.H.M. Experimental determination of demand side management potential of wet appliances in the Netherlands. Sustain. Energy Grids Netw. 2017, 9, 80–94. [Google Scholar] [CrossRef]
  18. Zhai, S.; Wang, Z.; Yan, X.; He, G. Appliance Flexibility Analysis Considering User Behavior in Home Energy Management System Using Smart Plugs. IEEE Trans. Ind. Electron. 2019, 66, 1391–1401. [Google Scholar] [CrossRef]
  19. Godina, R.; Rodrigues, E.; Pouresmaeil, E.; Matias, J.; Catalão, J. Model Predictive Control Home Energy Management and Optimization Strategy with Demand Response. Appl. Sci. 2018, 8, 408. [Google Scholar] [CrossRef]
  20. Weck, M.H.J.; van Hooff, J.; van Sark, W.G.J.H.M. Review of barriers to the introduction of residential demand response: A case study in the Netherlands: Barriers to residential demand response in smart grids. Int. J. Energy Res. 2017, 41, 790–816. [Google Scholar] [CrossRef]
  21. Smale, R.; van Vliet, B.; Spaargaren, G. When social practices meet smart grids: Flexibility, grid management, and domestic consumption in The Netherlands. Energy Res. Soc. Sci. 2017, 34, 132–140. [Google Scholar] [CrossRef]
  22. Guo, P.; Lam, J.C.K.; Li, V.O.K. Drivers of domestic electricity users’ price responsiveness: A novel machine learning approach. Appl. Energy 2019, 235, 900–913. [Google Scholar] [CrossRef]
  23. PowerMatching City A Demonstration Project of a Future Energy Infrastructure. Available online: http://powermatchingcity.nl/ (accessed on 12 April 2018).
  24. Geelen, D.V. Empowering End-Users in the Energy Transition: An Exploration of Products and Services to Support Changes in Household Energy Management. Ph.D. Thesis, TU Delft, Delft, The Netherlands, 2014. [Google Scholar]
  25. Kok, K. The powermatcher: Smart coordination for the smart electricity grid. Ph.D. Thesis, Vrije University, Amsterdam, The Netherlands, 2013. [Google Scholar]
  26. Gangale, F.; Vasiljevska, J.; Covrig, C.F.; Mengolini, A.; Fulli, G. Smart Grid Projects Outlook 2017: Facts; Publications Office of the European Union: Luxembourg, 2017; ISBN 978-92-79-68899-7. [Google Scholar]
  27. Geelen, D.; Scheepens, A.; Kobus, C.; Obinna, U.; Mugge, R.; Schoormans, J.; Reinders, A. Smart energy households’ pilot projects in The Netherlands with a design-driven approach. In Proceedings of the IEEE PES ISGT Europe 2013, Lyngby, Denmark, 6–9 October 2013; IEEE: New Jersey, NJ, USA, 2013; pp. 1–5. [Google Scholar]
  28. Glasgo, B.; Hendrickson, C.; Azevedo, I.M.L. Using advanced metering infrastructure to characterize residential energy use. Electr. J. 2017, 30, 64–70. [Google Scholar] [CrossRef]
  29. Yuce, B.; Rezgui, Y.; Mourshed, M. ANN–GA smart appliance scheduling for optimised energy management in the domestic sector. Energy Build. 2016, 111, 311–325. [Google Scholar] [CrossRef] [Green Version]
  30. Centraal Bureau voor de Statistiek. Elektriciteit in Nederland; Centraal Bureau voor de Statistiek: The Hague, The Netherlands, 2015. [Google Scholar]
  31. Kok, K.; Roossien, B.; MacDougall, P.; Van Pruissen, O.; Venekamp, G.; Kamphuis, R.; Laarakkers, J.; Warmer, C. Dynamic pricing by scalable energy management systems—Field experiences and simulation results using PowerMatcher. In Proceedings of the 2012 IEEE Power and Energy Society General Meeting, San Diego, CA, USA, 22–26 July 2012; IEEE: San Diego, CA, USA, 2012; pp. 1–8. [Google Scholar]
  32. Netherlands Enviromental Assessment Agency. Dutch National Energy Outlook (NEV) 2015; Netherlands Enviromental Assessment Agency: The Hague, The Netherlands, 2015. [Google Scholar]
  33. Geelen, D.; Brezet, H.; Keyson, D.; Boess, S. Gaming for energy conservation in households. In Proceedings of the Knowledge Collaboration & Learning for Sustainable Innovation, Delft, The Netherlands, 25–29 October 2010; TU Delft: Delft, The Netherlands, 2010; pp. 1–18. [Google Scholar]
  34. Bliek, F.; van den Noort, A.; Roossien, B.; Kamphuis, R.; de Wit, J.; van der Velde, J.; Eijgelaar, M. PowerMatching City, a living lab smart grid demonstration. In Proceedings of the IEEE PES, Gothenberg, Sweden, 11–13 October 2010; IEEE: Gothenberg, Sweden, 2010; pp. 1–8. [Google Scholar]
  35. Pakula, C.; Stamminger, R. Electricity and water consumption for laundry washing by washing machine worldwide. Energy Effic. 2010, 3, 365–382. [Google Scholar] [CrossRef]
  36. Stamminger, R.; Broil, G.; Pakula, C.; Jungbecker, H.; Braun, M.; Rüdenauer, I.; Wendker, C. Synergy Potential of Smart Appliances; Report of the Smart-A Project; University of Bonn: Bonn, Germany, 2008. [Google Scholar]
  37. Energieonderzoek Centrum Nederland. Energie Trends 2012; ECN: Petten, The Netherlands, 2012. [Google Scholar]
  38. Centraal Bureau voor de Statistiek. Available online: https://www.cbs.nl/en-gb/news/2014/16/energy-consumption-marginally-down-in-2013 (accessed on 7 December 2018).
  39. Schwartz, D.; Fischhoff, B.; Krishnamurti, T.; Sowell, F. The Hawthorne effect and energy awareness. Proc. Natl. Acad. Sci. USA 2013, 110, 15242–15246. [Google Scholar] [CrossRef] [PubMed] [Green Version]
  40. Reinders, A.; de Respinis, M.; van Loon, J.; Stekelenburg, A.; Bliek, F.; Schram, W.; van Sark, W.; Esteri, T.; Uebermasser, S.; Lehfuss, F.; et al. Co-evolution of smart energy products and services: A novel approach towards smart grids. In Proceedings of the 2016 Asian Conference on Energy, Power and Transportation Electrification (ACEPT), Singapore, 25–27 October 2016; IEEE: New Jersey, NJ, USA, 2016; pp. 1–6. [Google Scholar]
  41. Geelen, D.; Vos-Vlamings, M.; Filippidou, F.; van den Noort, A.; van Grootel, M.; Moll, H.; Reinders, A.; Keyson, D. An end-user perspective on smart home energy systems in the PowerMatching City demonstration project. In Proceedings of the IEEE PES ISGT Europe 2013, Lyngby, Denmark, 6–9 October 2013; IEEE: Lyngby, Denmark, 2013; pp. 1–5. [Google Scholar]
  42. Obinna, U.; Joore, P.; Wauben, L.; Reinders, A. Preferred attributes of home energy management products for smart grids—Results of a design study and related user survey. J. Des. Res. 2018, 16, 99–130. [Google Scholar] [CrossRef]
Figure 1. PowerMatching City: (a) scheme of the system, (b) energy consumption (blue line), energy production (red line), and power flow (blue area) for a household with photovoltaic (PV) systems and Micro-combined heat and power (μCHP) jointly producing energy, in the winter of 2012. Negative power flows indicate that power is fed to the grid.
Applsci 09 00581 g001
Figure 2. PowerMatching City electricity purchase, self-consumption, and production in 2012: (a) Electricity generated by PV and μCHP; percentages of self-consumption and electricity delivery depending rates; (b) Self consumption and electricity purchased from the grid, with purchase percentages depending on rates.
Applsci 09 00581 g002
Figure 3. PowerMatching City electricity summary for the year 2012 per household.
Applsci 09 00581 g003
Figure 4. PowerMatching City (PMC) weekly values of (a) electricity purchase, (b) PV output, and (c) μ-CHP (micro-combined heat and power) power generation.
Applsci 09 00581 g004
Figure 5. PowerMatching City smart washing machine and dishwasher. The latest run time program was compared to the actual use in 2012, shown as total flexibility time and flexibility offered during peak time.
Applsci 09 00581 g005
Table 1. Summary of the smart grid pilot settings and photovoltaic (PV) energy production for 2012 in PowerMatching City.
Distributed Energy SourcesDetails of PV SystemsPV ProductionSmart App.
10 Households with µ-CHP (1kW Electric, 6 KW Thermal)2 Households: Rooftop PV500 Wp, 4 m2150 kWhNo
2200 Wp, 18.7 m21835 kWhYes
8 Households: Virtual PV1590 Wp, 11 m2 (on average per household)880 kWh (on average per household)4 Households out of 8
12 Households with Hybrid Heat Pump (4.5 kWh Thermal)2 Households: Rooftop PV500 Wp,4 m2350 kWhYes
3840 Wp, 16 m21858 kWhNo
10 Households: Virtual PV1590 Wp, 11 m2 (on average per household)880 kWh (on average per household)5 Households out of 10
Table 2. Number of residents per household in PowerMatching City (PMC) vs. the Netherlands [adapted from [24]].
PMC HouseholdsThe Netherlands
Household SizeNumber of HouseholdsDistribution (%)Number of HouseholdsDistribution (%)
1 person29%2,761,76437
2 persons522%2,455,42133
3 persons29%909,27412
4 persons731%971,48613
5 persons29%414,8796
Unknown418%--
Total22100%7,512,824100%
Table 3. Energy indicators and equations used to determine them; E, energy; P, power; t, time; n, number of appliances; m, number of energy sources; n.r., normal rate; l.r., low rate; S, logical array of activation time; and F, logical array of flexibility time.
Real-TimeCumulative
Power flow (Pf) i n P app . i ( t ) i n P source   k ( t ) EP − ED
Electricity purchase (Ep)Pf (t) > 0, rate according to t (see II.C)EP_l.r + EP_n.r.
Electricity delivery (Ed)Pf (t) < 0, rate according to t (see II.C)ED_l.r + ED_n.r.
Electricity generated (Eg)PPV(t) + Pµ-CHP(t)EPV + Eµ-CHP
Self-consumption (Es)PPV(t) + Pµ-CHP(t) − │Pf (t) < 0│EG − ED
Electricity consumption (Ec)│Pf (t) > 0│ + PPV(t) + Pµ-CHP (t) − │Pf (t) < 0│EP + ES
Smart appliance’s activation time (S)Si(t) = 1, smart appliance running
Si(t) = 0, smart appliance is not active
i n S i ( t )
Smart appliance’s flexibility time (F)Fi(t) = 1, smart appliance is waiting to run
Fi(t) = 0, smart appliance is not available for flexibility
i n F i ( t )
Smart appliance’s number of cyclesSi(t)/Average cycle time ( i n S i ( t ) ) Average   cycle   time
Smart appliance’s electricity consumption i n S i ( t ) × Average   consumtion Number of cycle × Average consumption per cycle
Heat pump electricity consumptionPhp(t) P hp ( t )
Table 4. Minimum, average, and maximum values for the PMC Households for the year 2012.
kWh/HH MinAverageMax
ProductionDelivery Low rate144350937
Delivery Normal Rate32247427
µ-CHP2929501396
PV1528661858
Total Production35012772832
ConsumptionPurchase Low rate71219973587
Purchase Normal rate96422913332
Self-Consumption2479351626
Total Consumption219351838188
Table 5. Monthly electricity consumption, production, and grid import on average per household for 12 households with heat pumps and 10 households with μ-CHP.
kWh/HHConsumptionProductionGrid Import *
MonthMin.MeanMaxPVµ-CHPOnly PVPV + µ-CHP
Jan16751682427217489271
Feb1484666332890438347
Mar894795616669413344
Apr1523476459692251159
May9934651213726209183
June963264739520231211
July12133070810917221205
Aug5529650911317183166
Sep1493216378352238186
Oct1465295704488485398
Nov14652057925106495389
Dec1255616409102552451
* according to the production subtracted from the mean consumption value.
Table 6. Smart appliance electrical consumption.
PowerMatching City (2012)Comparing to
Smart Appliance TypeData Fraction (%)Annual Energy Consumption Dutch Average [6] (%)EU-15 Average [7] (%)
Dishwasher97.8%215.7 kWhN.A.−8%
Washing Machine95.2%130.8 kWh−10%−25%
4 out of 9 washing machine data were recorded without any activation during a considerable period, making their consumption abnormally close to zero, they were excluded from the analysis.

