1. Introduction
Modern power systems have become so sophisticated that research in the area of protection and control remains of major interest. Due to the ever-increasing electrical demand, large electrical power systems (EPS) are usually loaded close to their steady-state stability limit and thus are more vulnerable to network disturbances [
1,
2]. The operation at points close to the steady-state stability limit is a huge threat to power system security, such that in the event of a disturbance, the probability of cascading events, which might lead to total system collapse, is inevitable if not rectified in time. The most common disturbances are generator tripping, transmission line outages, lightning strikes, and short circuits. These disturbances are attributed in literature as the major causes of the system frequency to fall below set thresholds and triggers corrective action [
3,
4].
During severe disturbances, frequency stability, control, and protection can be a subject of primary concern [
5,
6,
7]. In the past, several under-frequency load-shedding (UFLS) techniques have been introduced which can be mainly classified as traditional, adaptive, semi-adaptive, and computational-based UFLS techniques. In traditional techniques, relays make use of locally measured frequency which is constantly compared against a certain threshold as the input [
8,
9]. The frequency thresholds may differ from one power system to another and a violation of each threshold triggers relay action. The most important advantages of these schemes are simplicity, the ease of implementation, and their reliability. The major limitation in these schemes is that a steep frequency gradient (df/dt) and a gradual one is usually treated equally and may result in over or under-shedding [
10]. Over-shedding affects power quality and under-shedding usually leads to tripping of electricity services. This is due to its inability to estimate the actual amount of the power imbalance since they simply follow a rigid pre-set rule in which a fixed amount of load is shed when frequency deviates from the nominal value. Besides the local frequency measurements, traditional UFLS schemes can make use of a variety of input information which have an influence on system frequency stability such as governors, load characteristics, exciters [
11] and system inertia, and this can pose huge complexities in calculations.
In comparison to traditional methods, with adaptive UFLS schemes the complexity can be reduced and optimum load-shedding can be achieved. While traditional schemes are designed for the worst-case scenarios, adaptive methods are situation-based and works well under almost all cases. Based on dynamic behavior of the system’s frequency and swing equation, the actual active power imbalance can be determined, and consequently appropriate actions can be taken. An improved technique based on the swing equation to estimate the magnitude of generation loss was recently proposed in [
12]. The authors accounted for the inertia variations both before and soon after the disturbance to improve estimation accuracy.
Adaptive schemes can be semi-adaptive, power imbalance adaptive, or adaptive schemes with predictive capabilities. Predictive UFLS schemes introduces a new concept where it is not necessary to find the root cause for frequency variations such as demand-generation imbalance [
13]. In this scheme, a forecast in frequency behavior is made a few seconds before corrective action, if prediction indicates the violation of allowable frequency tolerances, load-shedding is triggered. The main limitation with this scheme is that predictive UFLS always have inherent prediction uncertainties and as time increase the prediction becomes even less reliable. However, the advantage of frequency prediction is that it can be performed in real time.
Adaptive schemes only work when the operator can gather information in real time. In such cases where frequency prediction is necessary, wide-area measurement system (WAMS) can be an essential tool for transmission system operators (TSOs) in power system dynamic studies [
14,
15,
16,
17,
18]. WAMS is based on the optical communication infrastructure and global positioning system (GPS), and can significantly contribute in assuring safe and reliable power system operation. The measurement data from WAMS is time tagged with GPS synchronization as a result data samples can be arranged to give the real-time status of the power system. The easy availability of data reduces delays significantly, hence the objective of enhancing UFLS to minimize the risk of ultimate system collapse due to extremely low frequency can be achieved. Since the measurements are gathered and processed in real time in the event of a severe disturbance, frequency can be easily restored [
19,
20]. Based on WAMS frequency measurements, the prediction is constantly being updated and is very accurate for short prediction periods. The use of WAMS in power systems protection and control is widely known as wide-area monitoring, protection and control (WAMPAC) and it can be used in under-frequency protection [
21].
Presently, many TSOs have taken advantage of WAMPAC in implementing robust UFLS schemes to curtail the severe effects of frequency collapse [
22]. With WAMS, the implementation of adaptive techniques is possible. Practical electrical grids cover large geographical areas and without the use of WAMS, it was difficult to quickly pick the root cause of system collapse. The extensive use of WAMS has brought flexibility to TSOs in power networks monitoring [
23,
24,
25]. With WAMS event monitoring, control and effects mitigation can now be performed more rapidly [
26].
By making use of wide-area measurements, the adaptive schemes can be further enhanced by incorporating the optimization of the load to be shed. In the past, optimization techniques have been implemented to solve the UFLS problem. Based on the power flow data, a genetic algorithm is proposed to obtain the optimum amount of load to be shed in [
27]. The main aim of the authors was to maintain the steady-state frequency within acceptable thresholds. In [
28], genetic algorithm is also applied to calculate the amount of load to be shed whenever a frequency threshold is violated. The fuzzy logic is used is used in the modeling of bus-load uncertainties. Though with genetic algorithm (GA) a global optimum solution can be achieved, the main problem is on its convergence rate [
29]. A comprehensive learning particle swarm optimization (CLPSO) technique is proposed in [
30] to implement planned load-shedding and maintain stability of the islanded system. In the event of power loss from the main grid, the islanded system generators must be able to continue in operation supplying the islanded system. The algorithm in [
30] is successfully applied to meshed and radial networks but it is also noted that the technique is affected by partial optimization.
A review of GA and particle swarm optimization (PSO) shows that the techniques are mainly meant for offline applications and can be interrupted easily in determining the load to be shed. With the availability of PMU measurements, imperialist competitive algorithm (ICA) algorithm can be enhanced to determine the load to be shed since it has been proven in [
31,
32] that ICA has a better convergence rate as compared to other algorithms such as PSO and GA. Also, for avoiding the cascading and blackout events in modern power systems, UFLS techniques need to be enhanced by adopting WAMS technologies and make use of real-time measurement data available from PMUs. Surveys on the existence UFLS techniques showed that there is a knowledge gap regarding developing optimal UFLS techniques based on WAMS technologies.
In this paper, a WAMS-based frequency model is setup and it is coupled together with an optimization algorithm to perform optimum UFLS. Therefore, we first propose a technique for online realization of SFR model which is a useful model in power system frequency studies. Then, an optimal multi-stage UFLS technique is proposed for avoiding the consequences of severe disturbances. The suggested optimization problem is solved by adopting a powerful meta-heuristic solver, i.e., ICA. The proposed technique use the WAMS technologies for real-time power system monitoring. In this regard, the power deficit is computed instantly after a disturbance occurs in which the speed of proposed UFLS technique is highly improved which leads to better results in comparison with other techniques. Though the frequency threshold can be fixed, based on the optimization algorithm, the amount of load-shed does not necessarily have to be fixed and is based on the fault level. In the adaptive case, based on the rate of change of frequency the amount of load to be shed can be determined before the frequency falls to critical levels unlike in traditional UFLS schemes. Based on system constraints, a minimum amount of load is shed to restore the frequency to acceptable levels. The main contributions, in this paper, are
Wide-area measurement system-based online aggregate frequency response model realization is proposed.
Evolutionary computing-based optimal multi-stage UFLS technique is proposed for mitigating the under/over load-shedding situations.
Three objective functions for achieving optimal UFLS are suggested for modern power systems considering practical constraints.
The rest of this paper is organized as follows.
Section 2 explains the use of WAMS and how the model can be set up based on the obtained data. In
Section 3, an
nth order SFR model-based WAMS is presented. In
Section 4, the proposed optimal multi-stage load-shedding is presented. An optimization algorithm is introduced in
Section 5. The power system under investigation are described in
Section 6.
Section 7 presents simulation results of different scenarios, while
Section 8 concludes.
2. WAMS-Based Power System Model Identification
WAMSs are measurement systems based on the transmission of analogue and/or digital information using communication systems and allowing synchronization of the measurements using a common time Reference [
33]. The ability to measure voltage and current phasors in a power system created new control possibilities of monitoring the operation of a large power system from the point of view of angles and magnitudes of both voltage and frequency. The ability to do this monitoring is commonly known as wide-area monitoring (WAM). Phasor Measurement Unit (PMU) is measurement system which allows the measurement of the phasors of voltages and currents in a power system. These PMUs construct dynamic measurements which includes phasors of voltage and currents and the frequency which comes together with a satellite triggered time stamp in milli-seconds time intervals. Methods on online dynamic event detection and location which uses wide-area generator rotor frequency measurements have been presented in literature [
34]. These methods combine a variance-based approach and event detection with a clustering-based approach to event location. Since WAMS provides voltage and current phasors, it is possible to express the system dynamics including the swing equation as follows
where
are the active power, reactive power, bus voltage, currents, and electrical angles, respectively.
, and
i are notations for
d-axis,
q-axis, loads, generation, and
ith busbar, respectively.
Where the state space representation of the above equation can be given as
where
, and
are the state, output, and input vectors, respectively.
From (
2), it can be seen that
p and
q are some known functions. The general assumption which will be consistent in this paper is that the initial values of the system are provided by WAMS. Once the power system operator has the real-time information and measurements provided by WAMS platform, the frequency behavior can be online monitored.
There are several model orders of synchronous machine that can be adopted for creating a suitable SFR model. It is proven that the electromechanical dynamics which are presented by swing equation are sufficient for modeling the system frequency behavior in interconnected power systems. The classical model of synchronous generator described by swing equation, integrated with suitable model of other power plant components such as governor and turbine systems can provide a suitable model of frequency dynamics. The electric network is modeled by their demand in SFR model. The SFR model realized based on WAMS is given in the next section. This model is adopted for developing a multi-stage UFLS based on WAMS technique. Then, the proposed optimization problem is solved based on the realized SFR model.
3. Frequency Model Set Up
In the control center of modern power systems, a suitable frequency model can be created based on the data provided from WAMS. From (
2), the frequency response model which can be used to design an optimal UFLS scheme, can be set up based on the swing equation considering the classical model of each generator [
3]. The basic idea on analyzing the power system dynamics is based on the swing equation of each synchronous generating unit which is given in (
3). This equation relates the change in frequency over time to mechanical and electrical power difference with the inertia of
ith power plant.
where
, and
are the mechanical power of the turbine in p.u., the electrical power in p.u., the inertia of
ith power plant in seconds, and the speed (frequency) in p.u. of generator
i, respectively.
Interconnected power systems consist of several generating units connected to loads by an electric grid. Practically, to reduce the calculation burden and simplify the complexity of interconnected power system models, it is better to equivalent the different generation units on a single aggregated unit [
35,
36]. To this end, the equivalent quantities can be determined based on (
4), and dynamic behavior of the aggregated system is represented by (
5) as follows
where
,
, and
are the mechanical power of the equivalent turbine in p.u., the electrical demand in p.u., active power losses in the electric network in p.u., electrical active powers of loads in p.u., the averaged center of inertia of the system in seconds, the average system frequency, and the frequency set of each generating unit, respectively.
Governor-turbine system plays a vital role in converting the primary energy into mechanical energy which is converted to electric energy by synchronous generators. The dynamic model of this system has great impacts on the power SFR during normal and emergency operation situations. In last decade, many models with different orders are suggested for governor-turbine systems. However, it has been proven in [
35,
36,
37] that the frequency response model based on the swing equation dynamics is sufficient for frequency studies. The dynamics of these important components are represented as their transfer functions as shown in
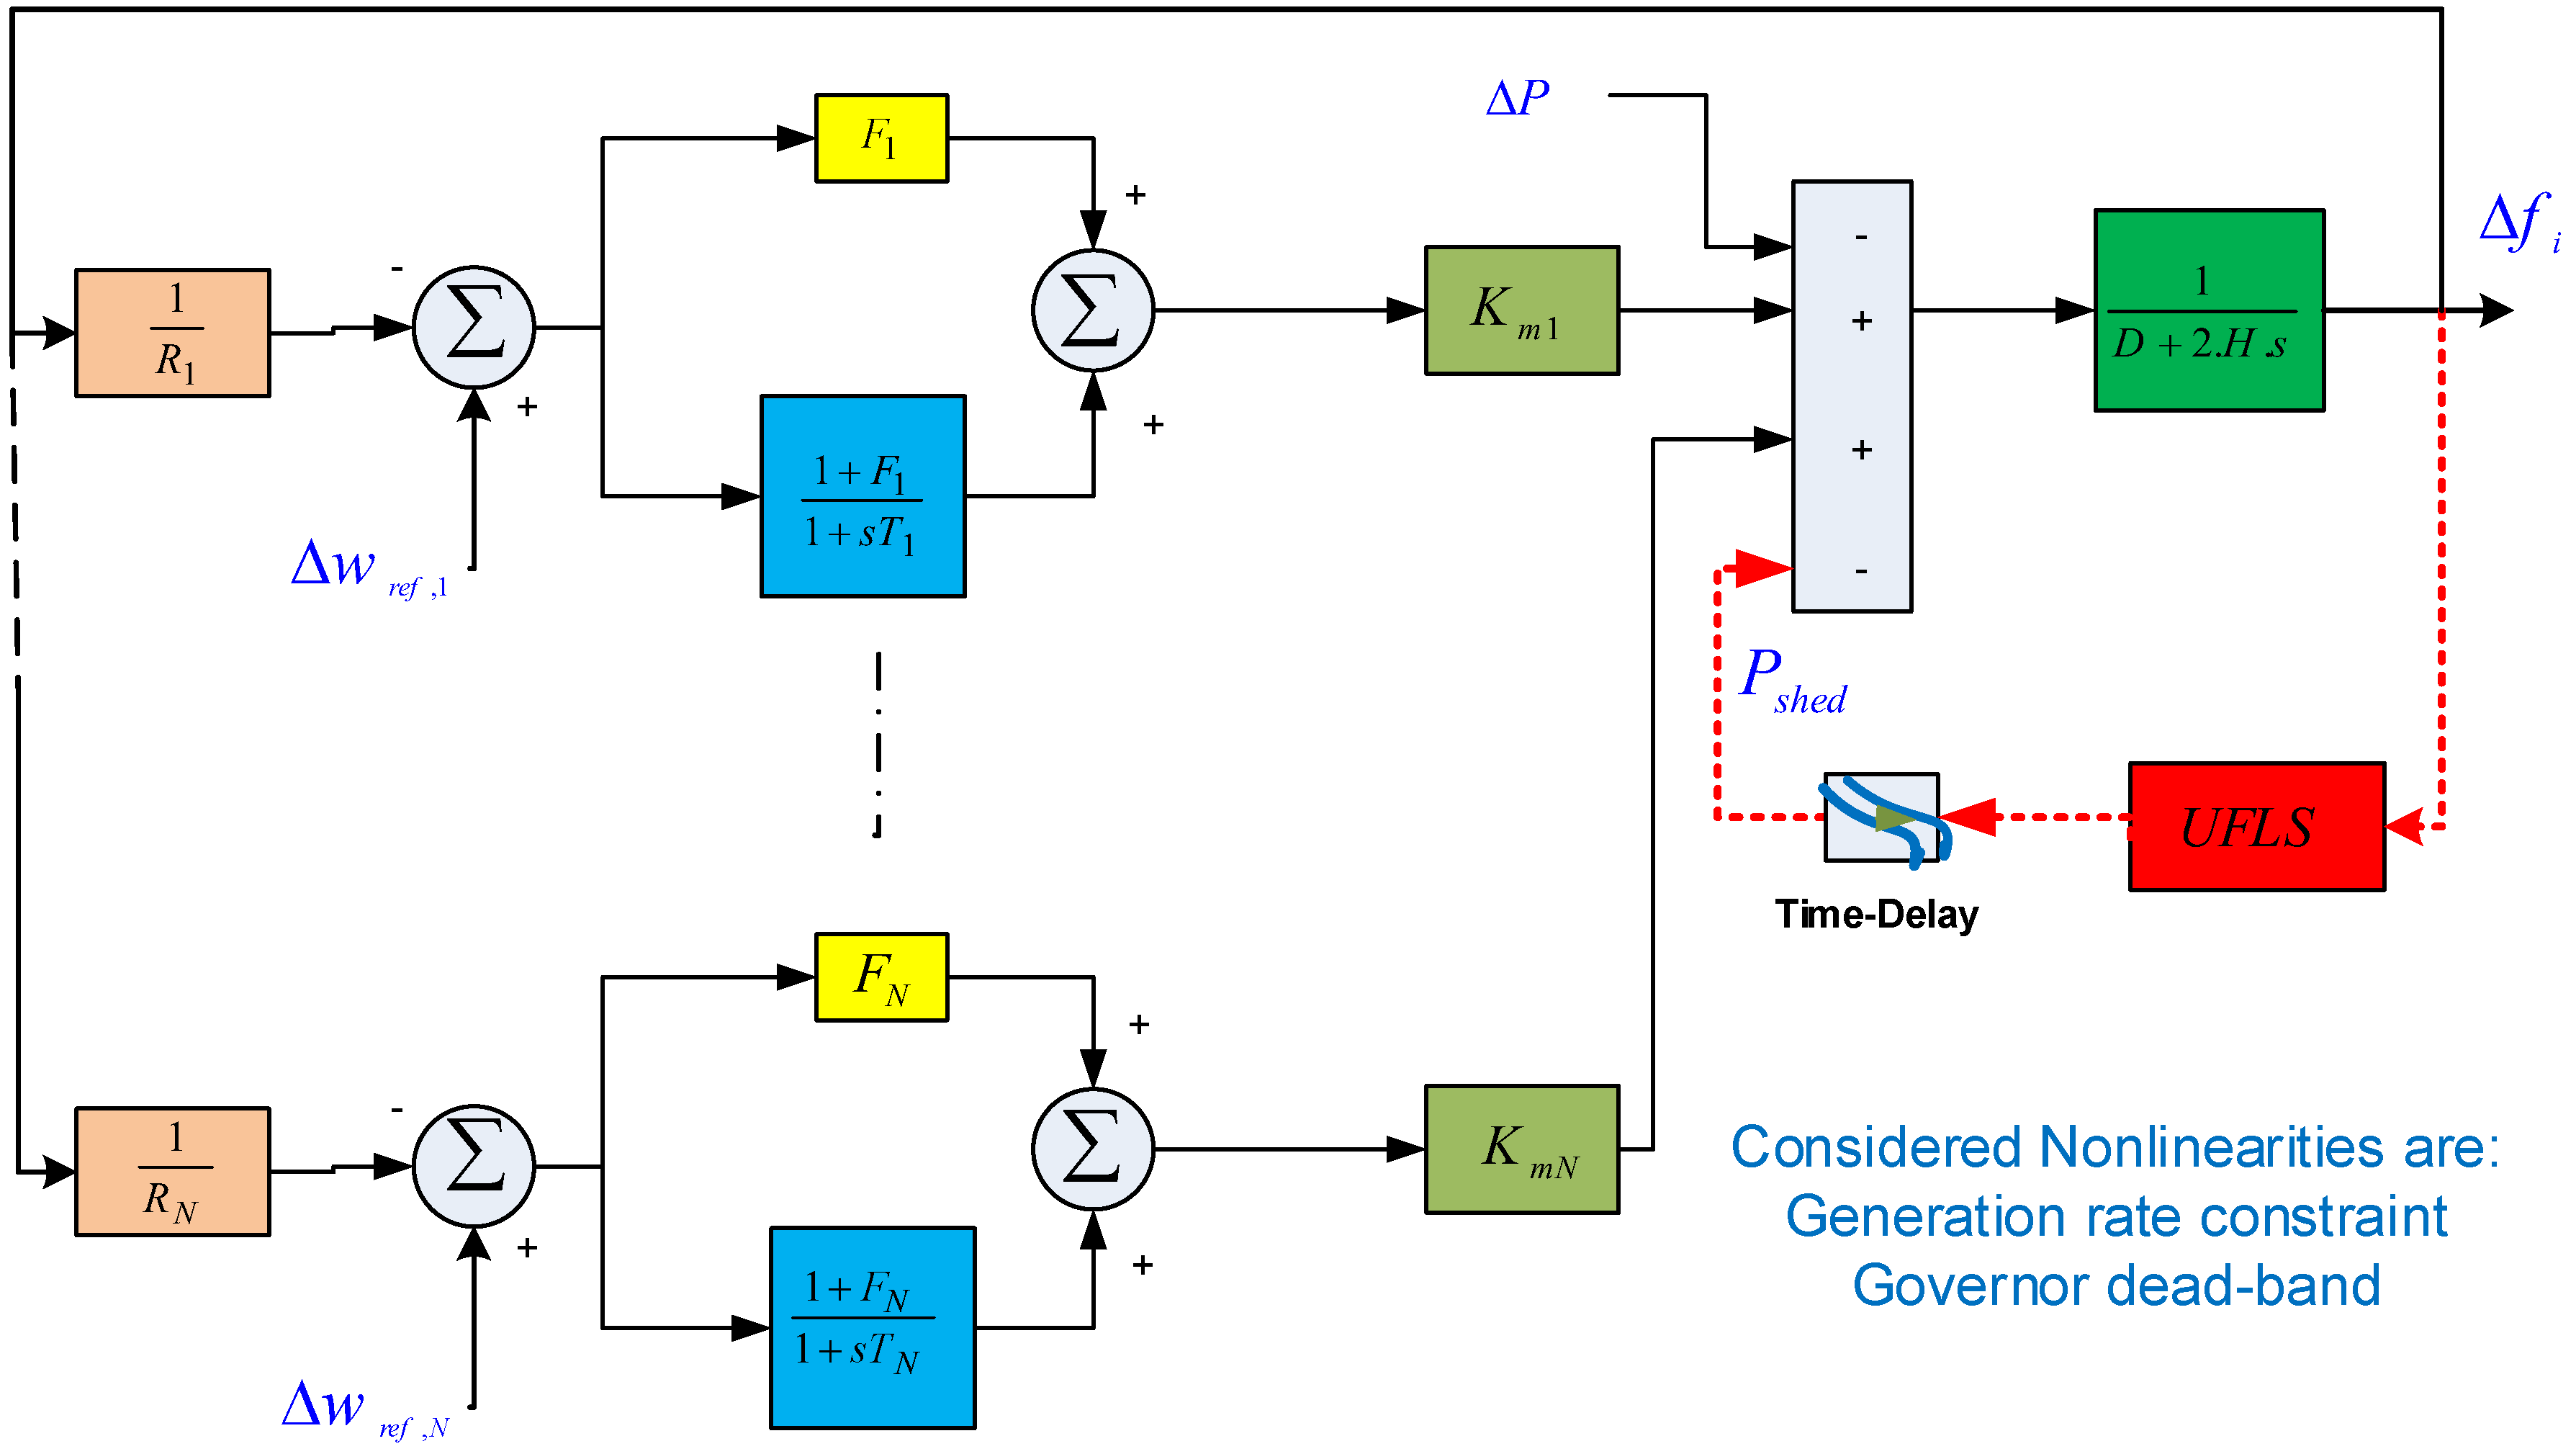
Figure 1.
For a power system which consists mostly of steam boiler power plants, the frequency response of the system in the event of a disturbance can be represented by a simple frequency response model [
37]. The model consists generally of an equivalent governor system regulation, system inertia, and system load damping. For a system with more than one generating units, each unit is modeled separately in the SFR model. An SFR model which consists of
N generators is of
dynamic order.
Figure 1 shows the general layout of the SFR model which includes the UFLS scheme.
The frequency response dynamic behavior of the system in the event of a disturbance is given by Equation (
6). For simplicity, the equation can be expressed in partial form as given by Equation (
7). It can be noted that in real systems, frequency is a time varying parameter therefore by Laplace conversions, Equation (
8) gives the time response of the system.
In (
6)–(
8),
is the initial demand-generation imbalance or system disturbance which can be a generator loss, sudden huge demand increase/decrease, or transmission line tripping.
R is the governor system regulation gain,
D is the system damping coefficient,
F is a fraction of the total power generated by the HP turbine,
T is a time constant and
is the effective gain constant that represent the generator share of
ith unit. The subscript,
i, corresponds to the generator number from 1 to
N.
The above obtained SFR model-based WAMS technologies can have several implementations in modern and future smart power systems. It can be used in load frequency control (LFC) studies which study the behavior due to load fluctuations. In this regard, this model is useful for optimal tuning of the LFC controllers’ parameters. Likewise, it can be adopted for frequency stability analysis of large power systems and can be equipped with other types of governor-turbine systems for investigating their effects on frequency stability. The model is also applicable for designing and testing the frequency protection schemes such as UFLS techniques.
4. Proposed Optimal UFLS Based on WAMS
Using WAMS, the frequency behavior can be easily predicted since measurements are constantly being monitored in real time, therefore, it is possible to predict the future few-seconds response of the system after a disturbance using the realized SFR based on WAMS as shown in (
6)–(
8). For example, we can online calculate the time when the derivative of (
8) is equal to zero, then by substituting the calculated time in (
8), we can predict the minimum frequency that the system will reach. Furthermore, the future frequency behavior can be easily predicted using (
8) at any time instance.
To implement WAMS-based optimal multi-stage UFLS, we assume that the disturbance is online estimated using the method proposed in [
3]. Firstly, a lumped equivalent model, which represents the dynamics of the whole power system, is developed online. From the equivalent model, the center of inertia is obtained which can be used in the swing equation to calculate the overall disturbance in the power system. Instead of monitoring the frequency of different generating units, the overall center of inertia frequency is monitored which is used to online estimate the disturbance with better accuracy. Based on the estimated magnitude of disturbance, the systems’ frequency nadir, new steady-state frequency and the rate of change of frequency (ROCOF) can be accurately obtained. Finally, the most optimum amount of load to be shed is determined and UFLS can be implemented to restore the frequency to permissible level. By combining the UFLS signal in the SFR model, the state space model of the system can be expressed as follows
From Equation (
9),
A and
B are matrices describing the system response where a disturbance
has occurred. The amount of load to be shed for mitigating the effects of the disturbance such that the frequency will be restored to permissible range is given by
. When a disturbance occurs, the event can be a generator loss or line tripping, the dynamics of the power system are observed from the modified swing equation which includes the load-shed to keep the frequency within a desired level. At time instance
, values needed for online model realization such as
are provided by WAMS and at this point
.
When disturbance occurs, the total load-shedding amount which is as an input to the system described by Equation (
9) needs to be optimized such that the frequency is restored to the predefined range. The optimization model has the following basic constraints which must be satisfied in the design of the UFLS:
The mechanical power
delivered by the turbine must not exceed certain limits;
The steady-state frequency
should be higher than a set threshold limit at any given time;
The minimum time
required to restore the frequency to a certain minimum acceptable operation value should be lower than a predefined time limit;
The maximum allowable number of load-shedding stages
;
The minimum and maximum amount of load-shed for each stage
;
The total load-shed
allowable as compared to the magnitude of the disturbance;
The minimum allowed frequency
;
minimum allowable frequency bands or the minimum margin
between two consecutive frequency thresholds; and finally
allowable time delay limits
.
With the constraints stated above, the proposed optimization problem is generally described as follows
if the adopted objective function.
and
are the lower and upper bounds constraints which can be summarized as
Equation (
10) describes a general optimization problem, to implement the UFLS, we shall describe the objective function describing the system and this is given by Equations (
12)–(
14).
where
and
are the constant cost coefficients of transient frequency deviations
, steady-state frequency deviations
, load-shed
and integral of squared error (ISE) of the frequency
, respectively.
The function is a further term that can be used to describe an economic dispatch problem. In situations where the cost function of the generators is available, this term can be considered in the optimization. However, in this paper is neglected and therefore the constant cost coefficients can be considered as weighting coefficients in the optimization.
The aim of the first objective function described in (
12) is to minimize the total load-shed such that the minimum system frequency with load-shedding should be equal or above the minimum allowable system frequency and at the same time giving a standard steady-state frequency. In (
13) instead of incorporating the final steady-state frequency into the objective function, the load to be shed is considered in the objective function in the aim of minimizing the load to be shed. The ISE criteria is adopted in the third objective function given in (
14) and it effectively zeros the frequency deviation which is one of its main advantages.
5. Evolutionary Computing-Based Optimal UFLS
In this paper, we use evolutionary computing method for solving the above suggested optimization model. In this regard, ICA, which is a powerful optimization algorithm, is adopted for obtaining the optimal solutions. In what follows, the suggested procedure for solving the aforementioned UFLS problem is comprehensively described.
5.1. Imperialist Competitive Algorithm
ICA is a sociopolitical meta-heuristic, inspired by the history of colonization and competition among imperialists, to capture more colonies. The set of countries which are the solutions in ICA, is partitioned to form several empires. Each empire consists of a single imperialist and several other weaker countries, called colonies [
32]. Two competition mechanisms are used in the algorithm which are the Intra-Empire Competition (ICE) and the Inter-Empire Competition (IEC), which are the competition among the members of an empire and the competition among empires, respectively. The power of each colony or imperialist is determined from the cost of the optimization algorithm. Countries with the least cost function becomes the imperialists and they form empires by taking control of countries with higher cost functions which becomes colonies in their empires. The process involves assimilation where the imperialists get stronger and gain full control for the colonies or revolution where some colonies become stronger than the imperialists. Among the imperialist as well competition to gain full control of other colonies exists [
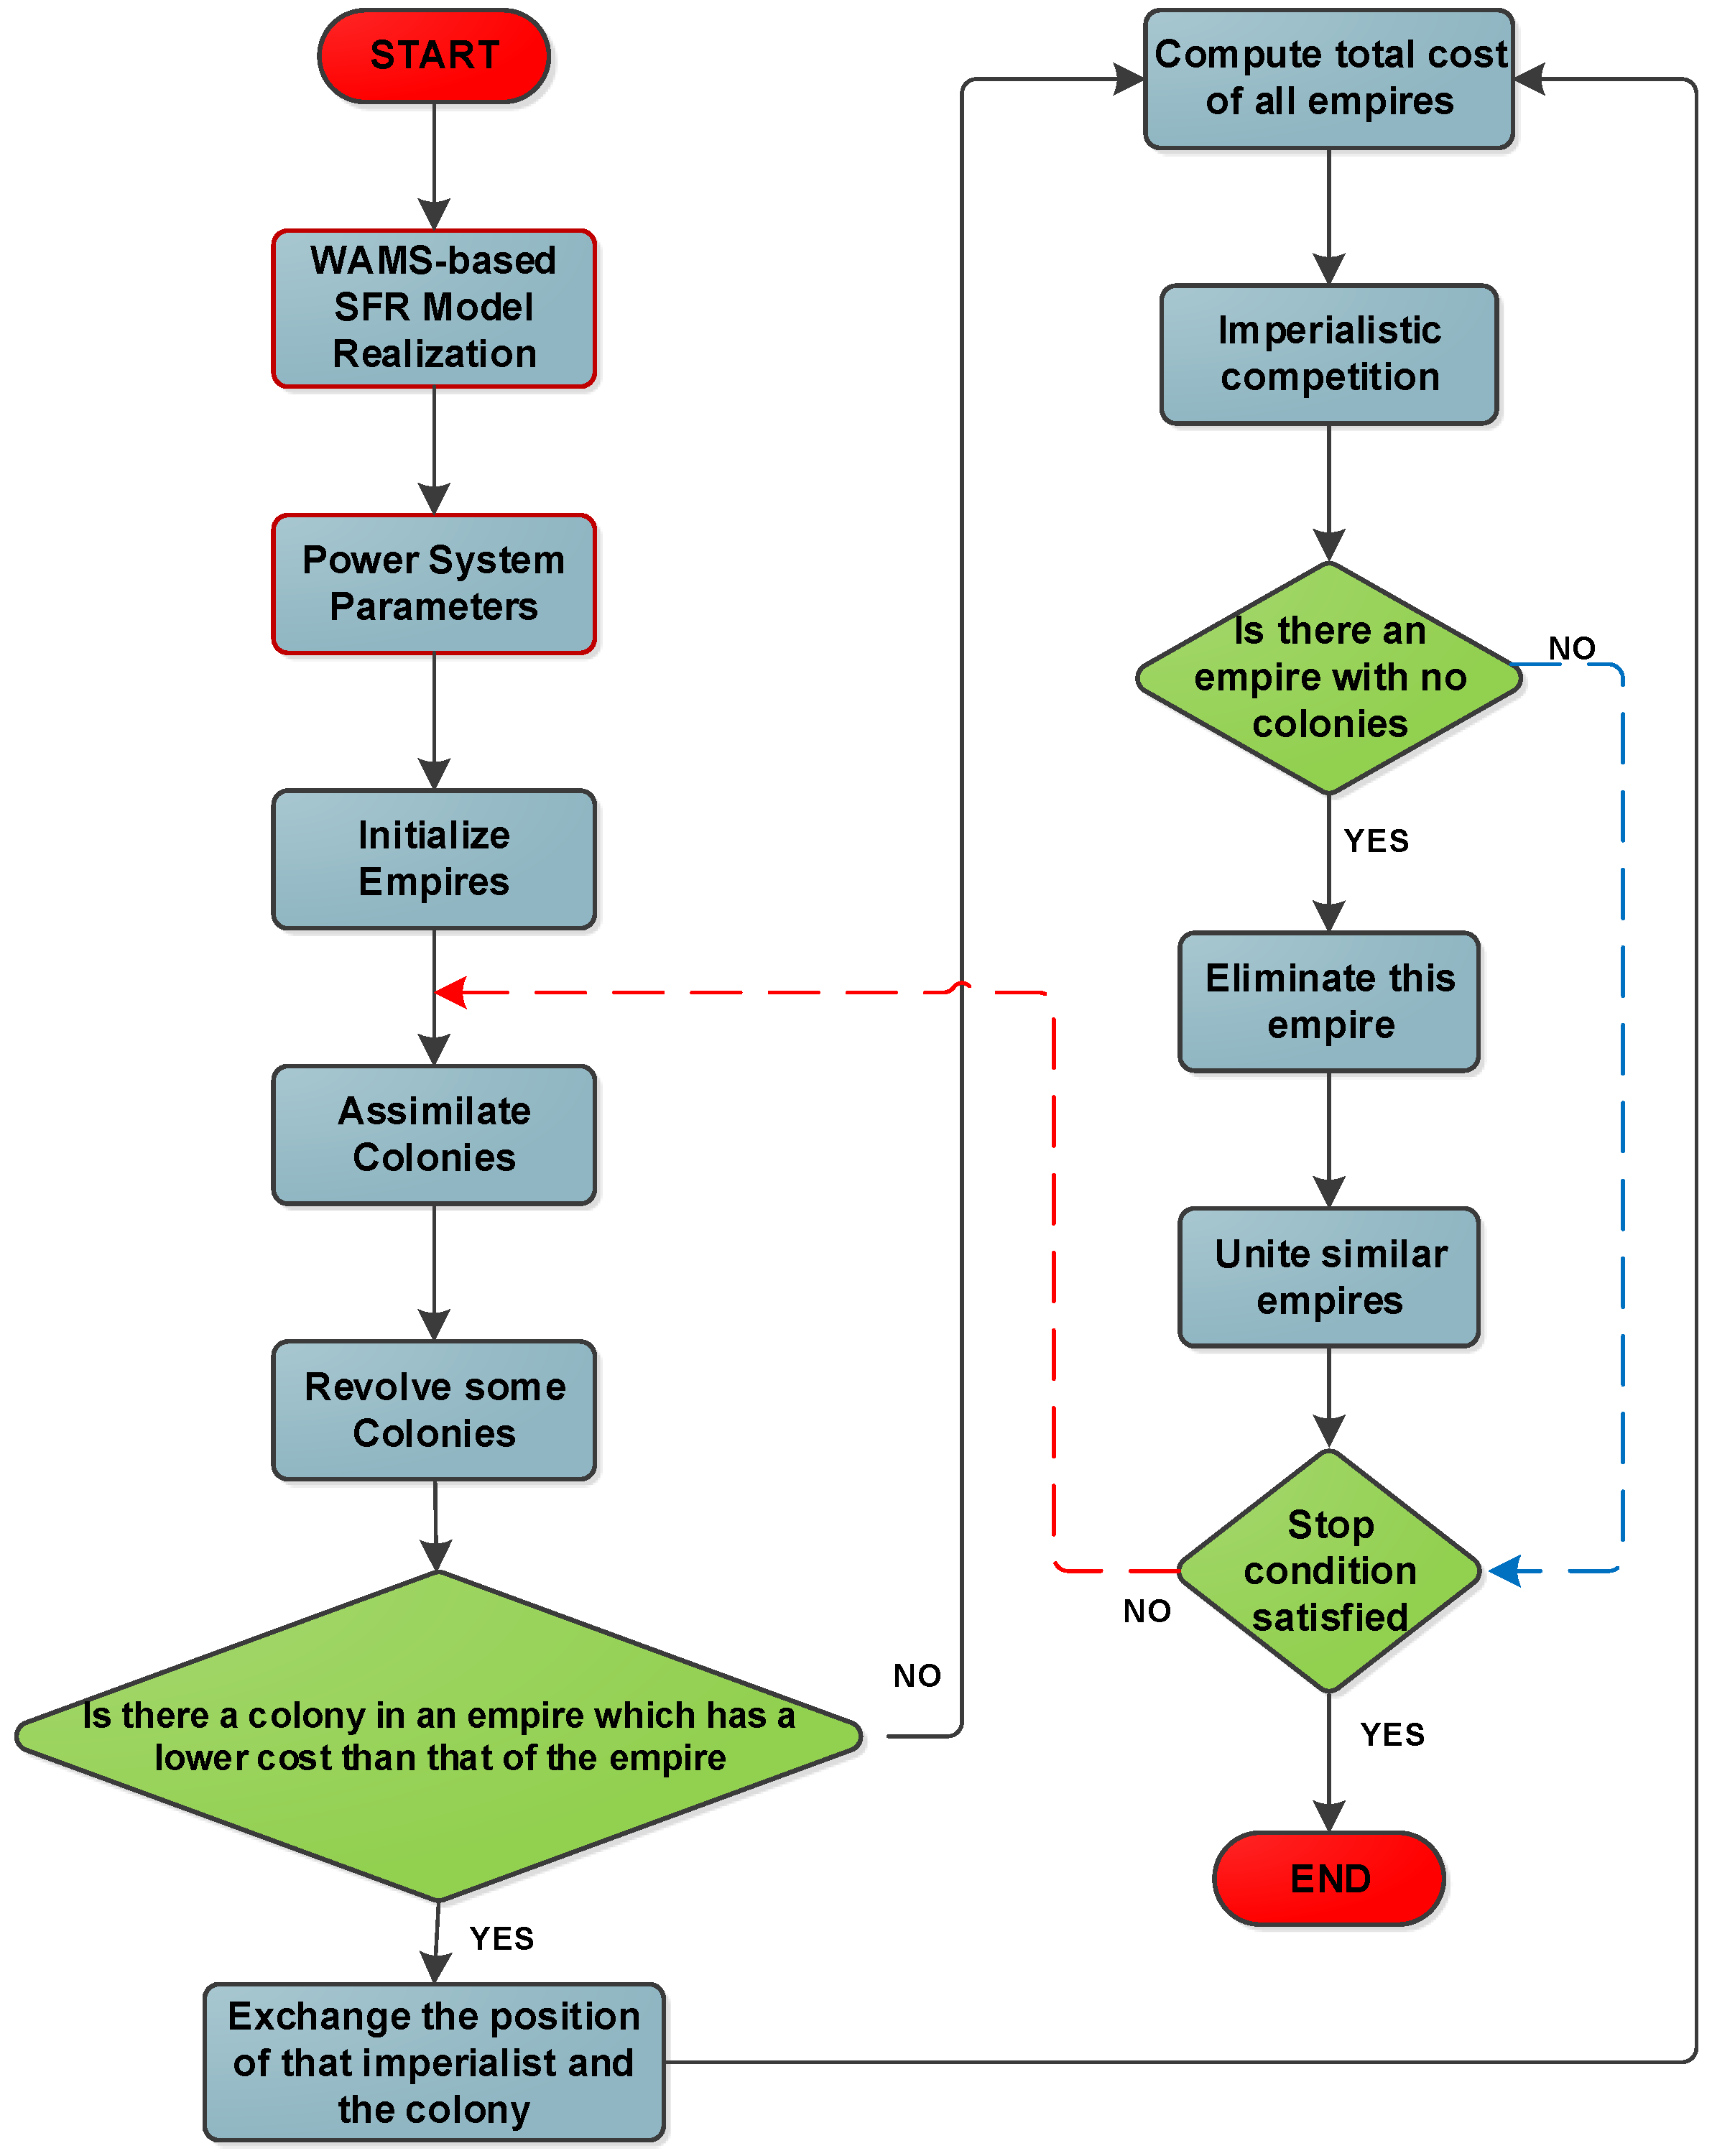
38]. The process stops when powerless empires have been completely eliminated. The process can be summarized in the flow chart of
Figure 2.
The ICA algorithm can be used in the implementation of the optimal UFLS scheme. With an objective defined as in (
10) where the goal is minimization of the overall objective function, the lesser the number of imperialists the better the solution. From (
13) and (
14), it can be noted that the smaller the mount of load-shed to restore the frequency, the lesser the value of the objective function. This algorithm enjoys several advantages like it works well with nonlinear systems and the solution obtained is a global one.
5.2. Implementation of ICA into UFLS
The initial values and variables which are required to solve the cost minimization problem of load-shedding must be pre-determined and then implemented in the algorithm. Like most algorithms when using ICA, initial population and the number of iterations must be specified. However, with ICA other parameters such as the number of colonies, number of decades as well as other algorithm parameters are also pre-set. In this paper, nine constraints were introduced but some of the constraints can be defined at once in the algorithm. As a result, the variables in the algorithm can be described as follows:
The number of variables are different for each case with or N, where N can be 10 or any other fixed integer greater than 5 (the maximum number of stages considered in this paper).
Here the minimum and the maximum amount of load to be shed at every stage is 0 and 0.2 per units, respectively. The values for and are re-defined at each load-shedding case or scenario to assess the effectiveness of the proposed method.
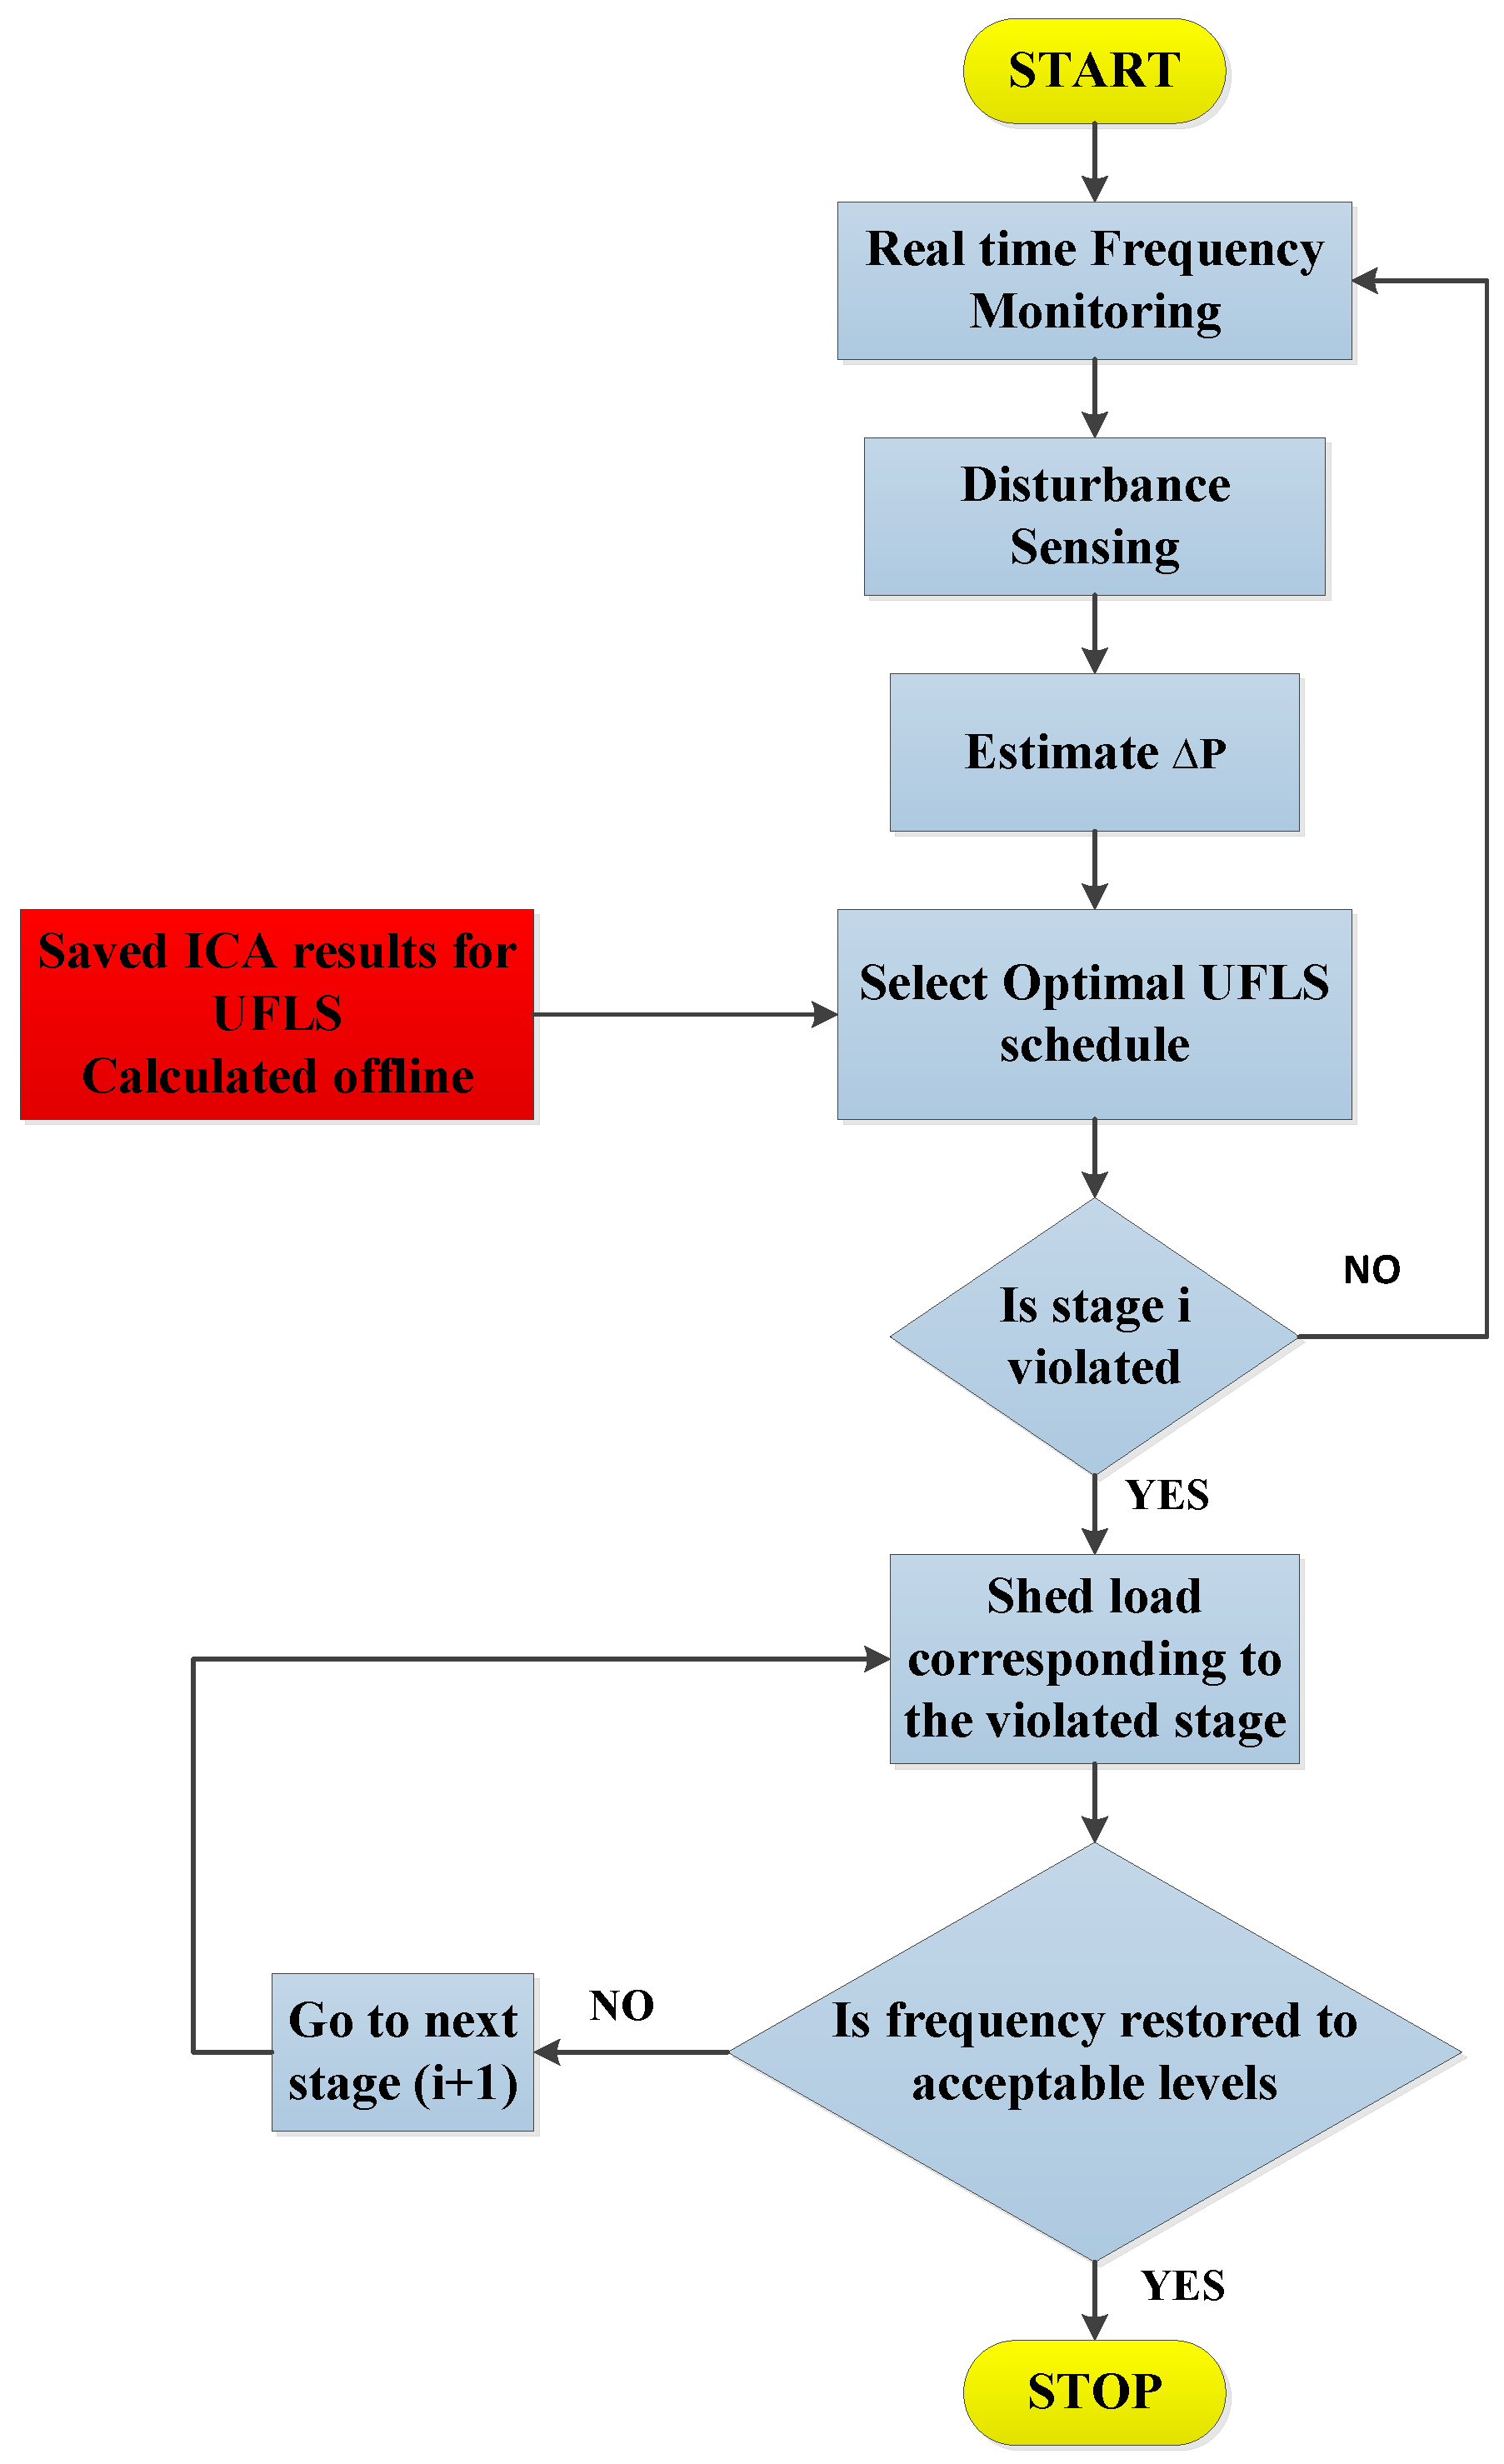
The ICA is used for solving the proposed UFLS optimization problem. In this problem, three objective functions are considered, and their performance are compared. For implementing the suggested algorithm, firstly the system frequency model is online validated using WAMS platform. Once the model parameters such as H, D, and others are obtained. The phasor measurements data using WAMS are assumed to be available in the control center. Then, the most severe disturbance is applied to the SFR dynamic model, and in parallel with this model, ICA is responsible to solve the UFLS problem by trying to find the best amount to be shed in which the frequency is maintained within a specific range. The online implementation of the proposed optimal multi-stage UFLS based on WAMS platform is shown in
Figure 3.
In the ICA platform, we have empires, countries, and colonies. Where colonies are countries within an empire. In our optimization problem, we had 3 objective functions cost which we can simply represent as (
p). Now the main goal is to find an argument,
p, whose relevant cost is optimum. If we consider that the optimization problem is N-dimensional, a colony or a country within an empire is a (
) array that can be expressed as follows
Our optimization problem is designing an optimum UFLS scheme to arrest frequency decline in the event of a large disturbance, so we generate the initial country that is defined by various arrays. If the aim was on finding the optimum load to be shed like in case 1 and case 2 the country will be represented as follows
However, if the aim is on finding both the load to be shed and the shedding frequency as in case 4 up to 6 the country will be defined as follows
In conclusion, the colony “country” depends on the selected objective function. The colony in the first objective is the load to be shed, whereas is the load and frequency threshold in the objectives 2 & 3.
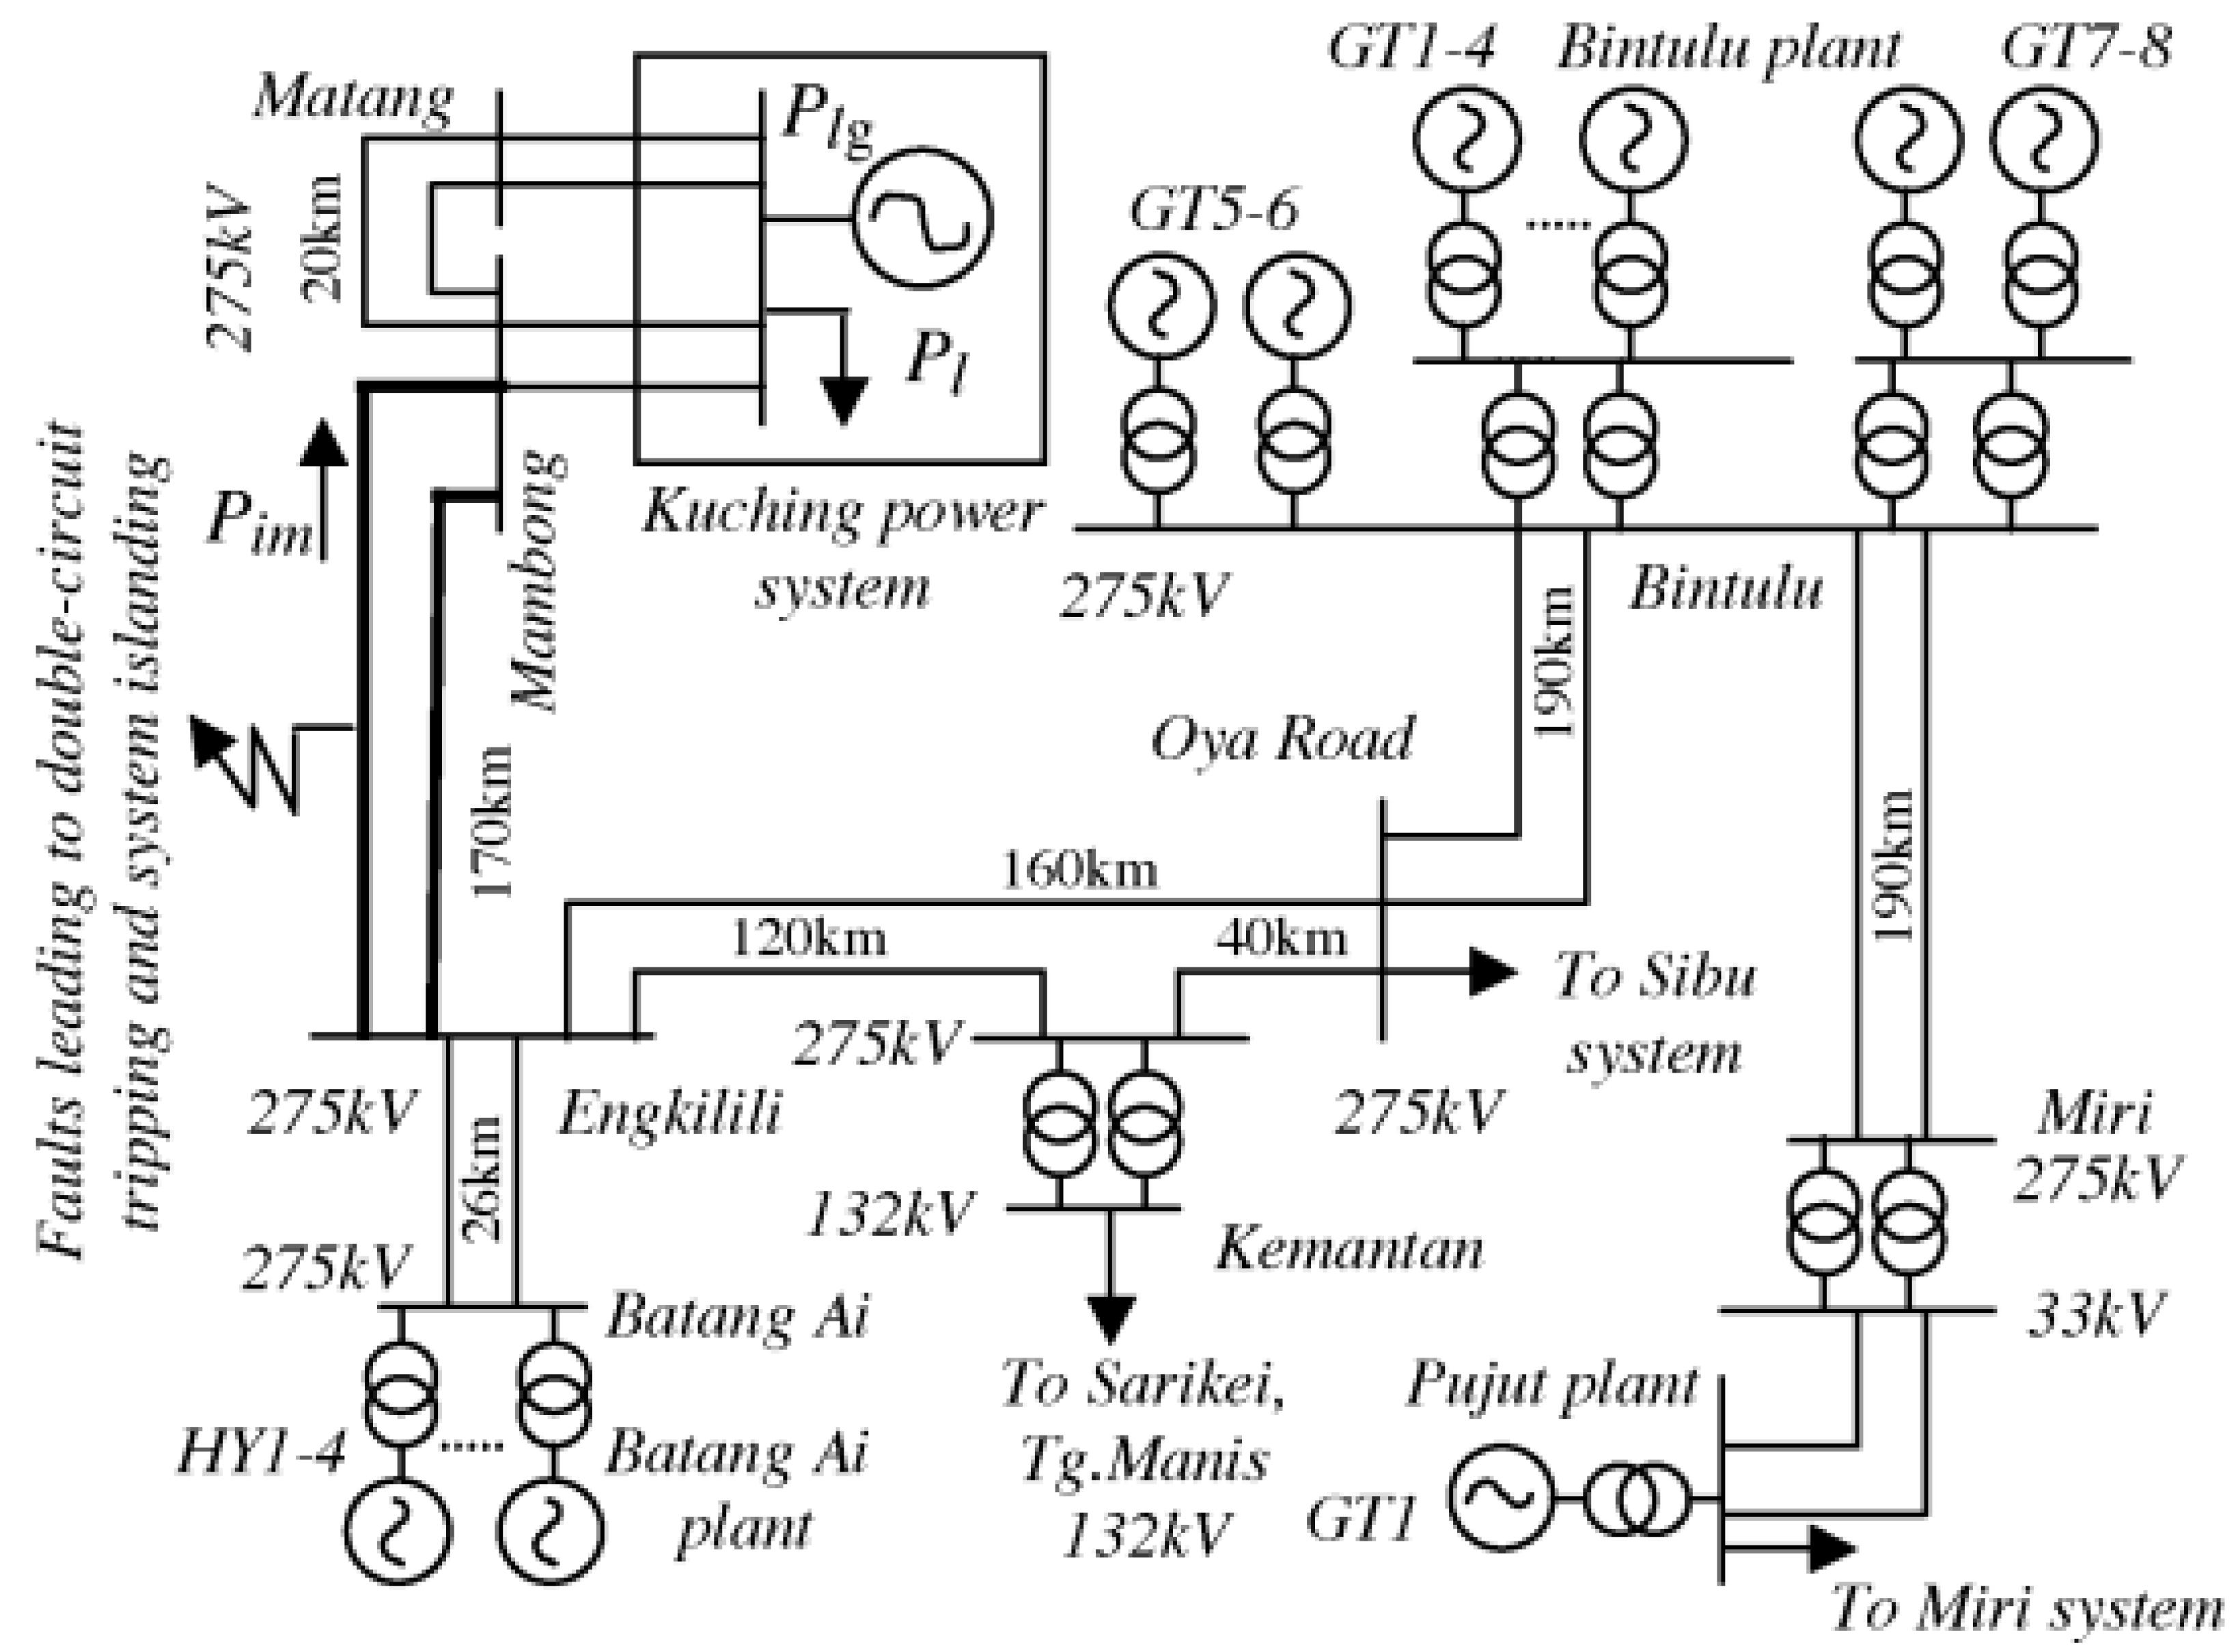
7. Simulation Results
The proposed optimal multi-stage UFLS-based WAMS technique is applied to the power system under investigation which is described in the previous Section. The simulations, in this paper, are done using MATLAB software. The different objective functions, which are defined in (
12)–(
14), are taken into account for the different simulation scenarios. The parameters of the adopted optimization algorithm, i.e., ICA is given in
Table 2. In all the simulated cases the initial load disturbance is online estimated based on the information from WAMS measurements and based on this value the most optimum amount to be shed is determined. In all six simulated cases given in
Table 3, a practical 0.5 p.u. disturbance as demonstrated in [
37] is assumed to have occurred at
s.
In this paper, three main scenarios considered for simulation are: the first scenario compares the simulation results of simulation cases considered in
Table 3 shown in
Section 7.1; the second scenario investigates the impacts of time delays due to communication problems and cyber-issues given in
Section 7.2; and finally the third scenario shows the superiority of the proposed UFLS technique by comparing its results with others shown in
Section 7.3.
To present the results of the different scenarios considered in this paper, the different cases shown in
Table 3 are firstly described. In this regard, the first and second cases (
and
) are optimized using Equation (
14). The frequency at which load-shedding is to be done in the event that a contingency has occurred is known and amount to be shed at the frequency at which shedding is to be done has to be optimized for a pre-set time of load-shedding. In cases three to six (
–
) frequency at which shedding is to be done is determined by the algorithm from the prescribed range as well as the amount of load to be shed. Optimization for Cases (
and
) is done using Equation (
12), while for cases (
and
) is done using Equation (
13).
Table 3 shows the frequency settings and obtained values for load-shedding.
7.1. Investigating the Performance of the Suggested Objective Functions
Firstly, we investigate the proposed objective function given in (
12). Two different cases (
&
) are considered in which these cases are different in terms of the pre-set minimum frequency at which a specific load to be shed is shown in
Table 3. The optimization results in these cases are loaded to be shed at each minimum frequency and stage as shown in
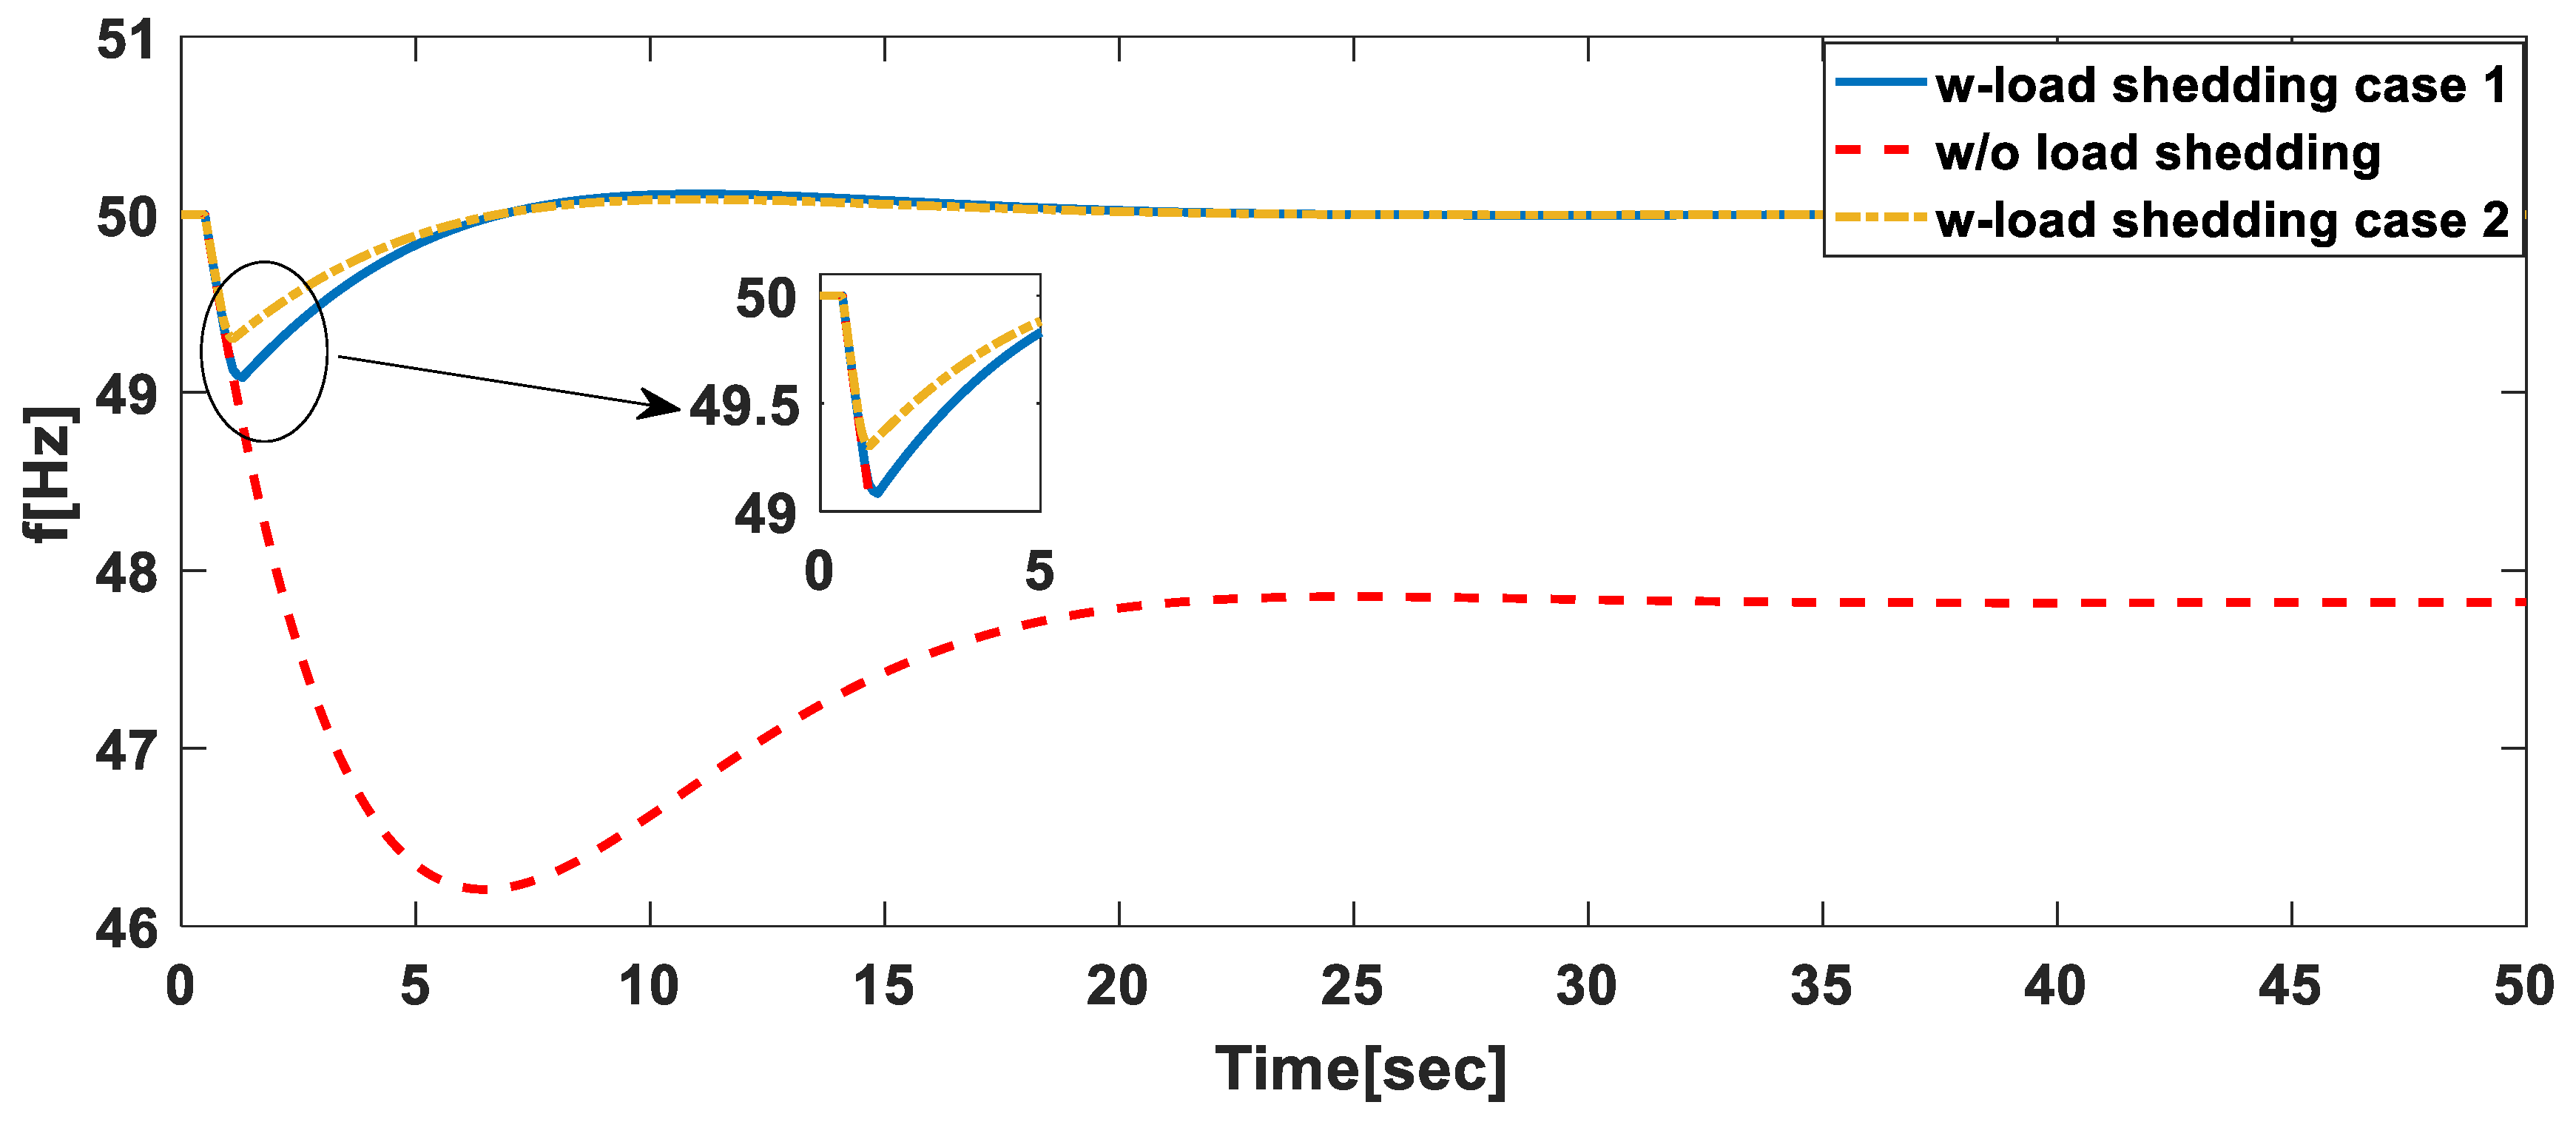
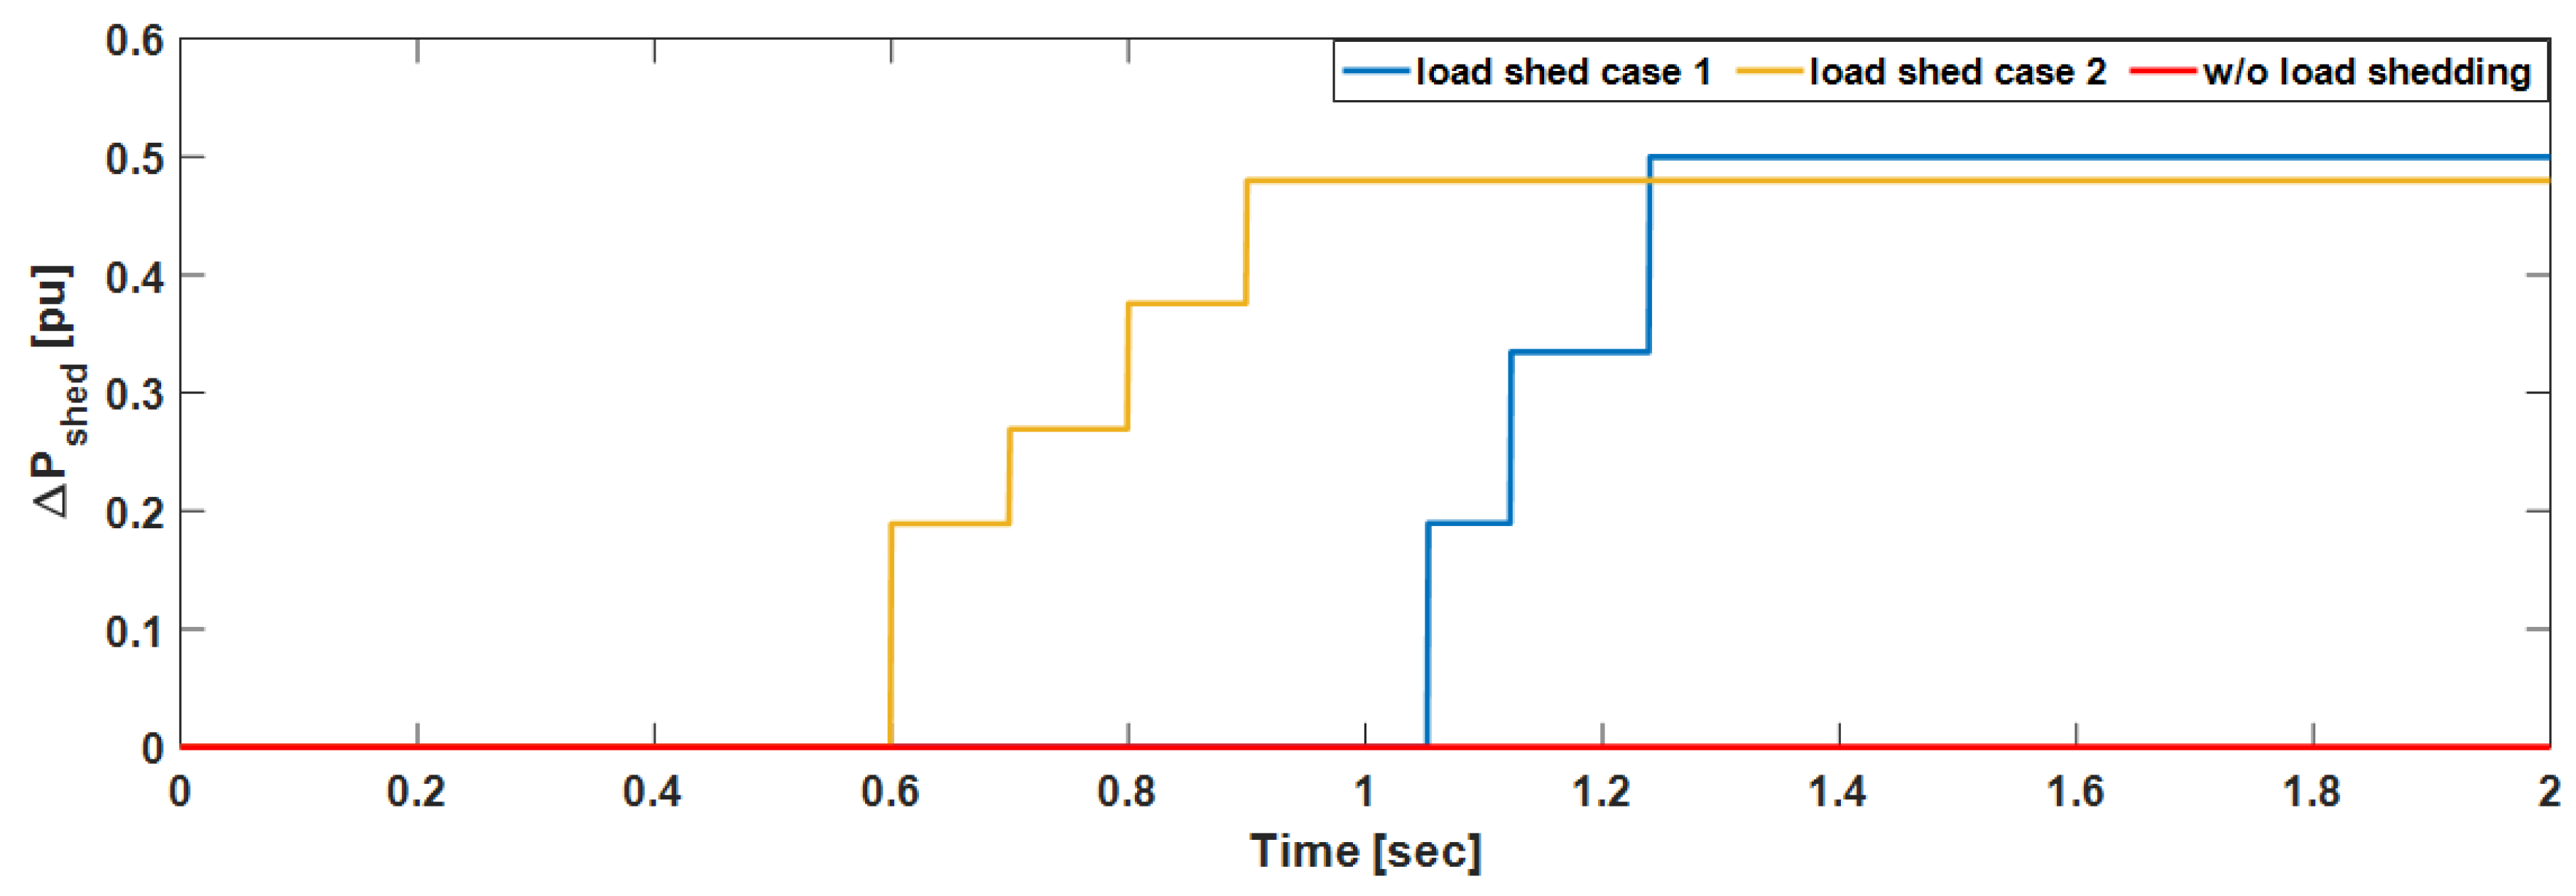
Table 3. In case 1, only 3-stages were activated to restore the frequency as shown in
Figure 5. As can be seen from
Figure 6, the frequency without load-shedding was below 46.5 Hz and at this frequency the system would have lost synchronism with the rest of the system. With load-shedding the frequency was restored to 50 Hz in 15 s in case 1 and within 10 s in case 2. The minimum system frequency was 49.1 Hz and 49.3 Hz for case 1 and 2, respectively. The differences in the minimum frequency reached was mainly due to two reasons, (i) the most minimum pre-set of the frequency was 48.8 Hz for case 1 while for case two was 49.0 Hz (ii) since the minimum set frequency was less for case 2, in optimization the algorithm shedding time was delayed compared to case 1. More load was shed in case 2 compared to case 1. Four load-shedding stages were activated in case 1 compared to the three activated stages in case 2 as shown in
Figure 5.
As a further discussion on the results depicted in
Figure 5 and
Figure 6, in case 2, more load-shedding steps are activated as compared to case 1. In case 1, both the initial and the minimum set frequencies were lower compared to case 2. As a result, we would expect that in case 1 there will be a delay in implementing the load-shedding as evident in
Figure 5. In both cases in the first step a large amount of load is shed to quickly arrest the frequency decline however in the second step of case 2 a small load is shed so that the frequency overshoot is maintained within the set limits. If a large load is shed in step 2 of case 2 the overshoot will be higher. Since a small amount is shed in step 2, an additional load-shedding stage is activated in case 2 as compared to case 1.
In cases (
&
), the optimization method should determine the load amount to be shed and at which frequency the load-shedding should be done as shown in
Table 3. Therefore, LB and UB of frequency at each stage are pre-set as shown in the same Table.
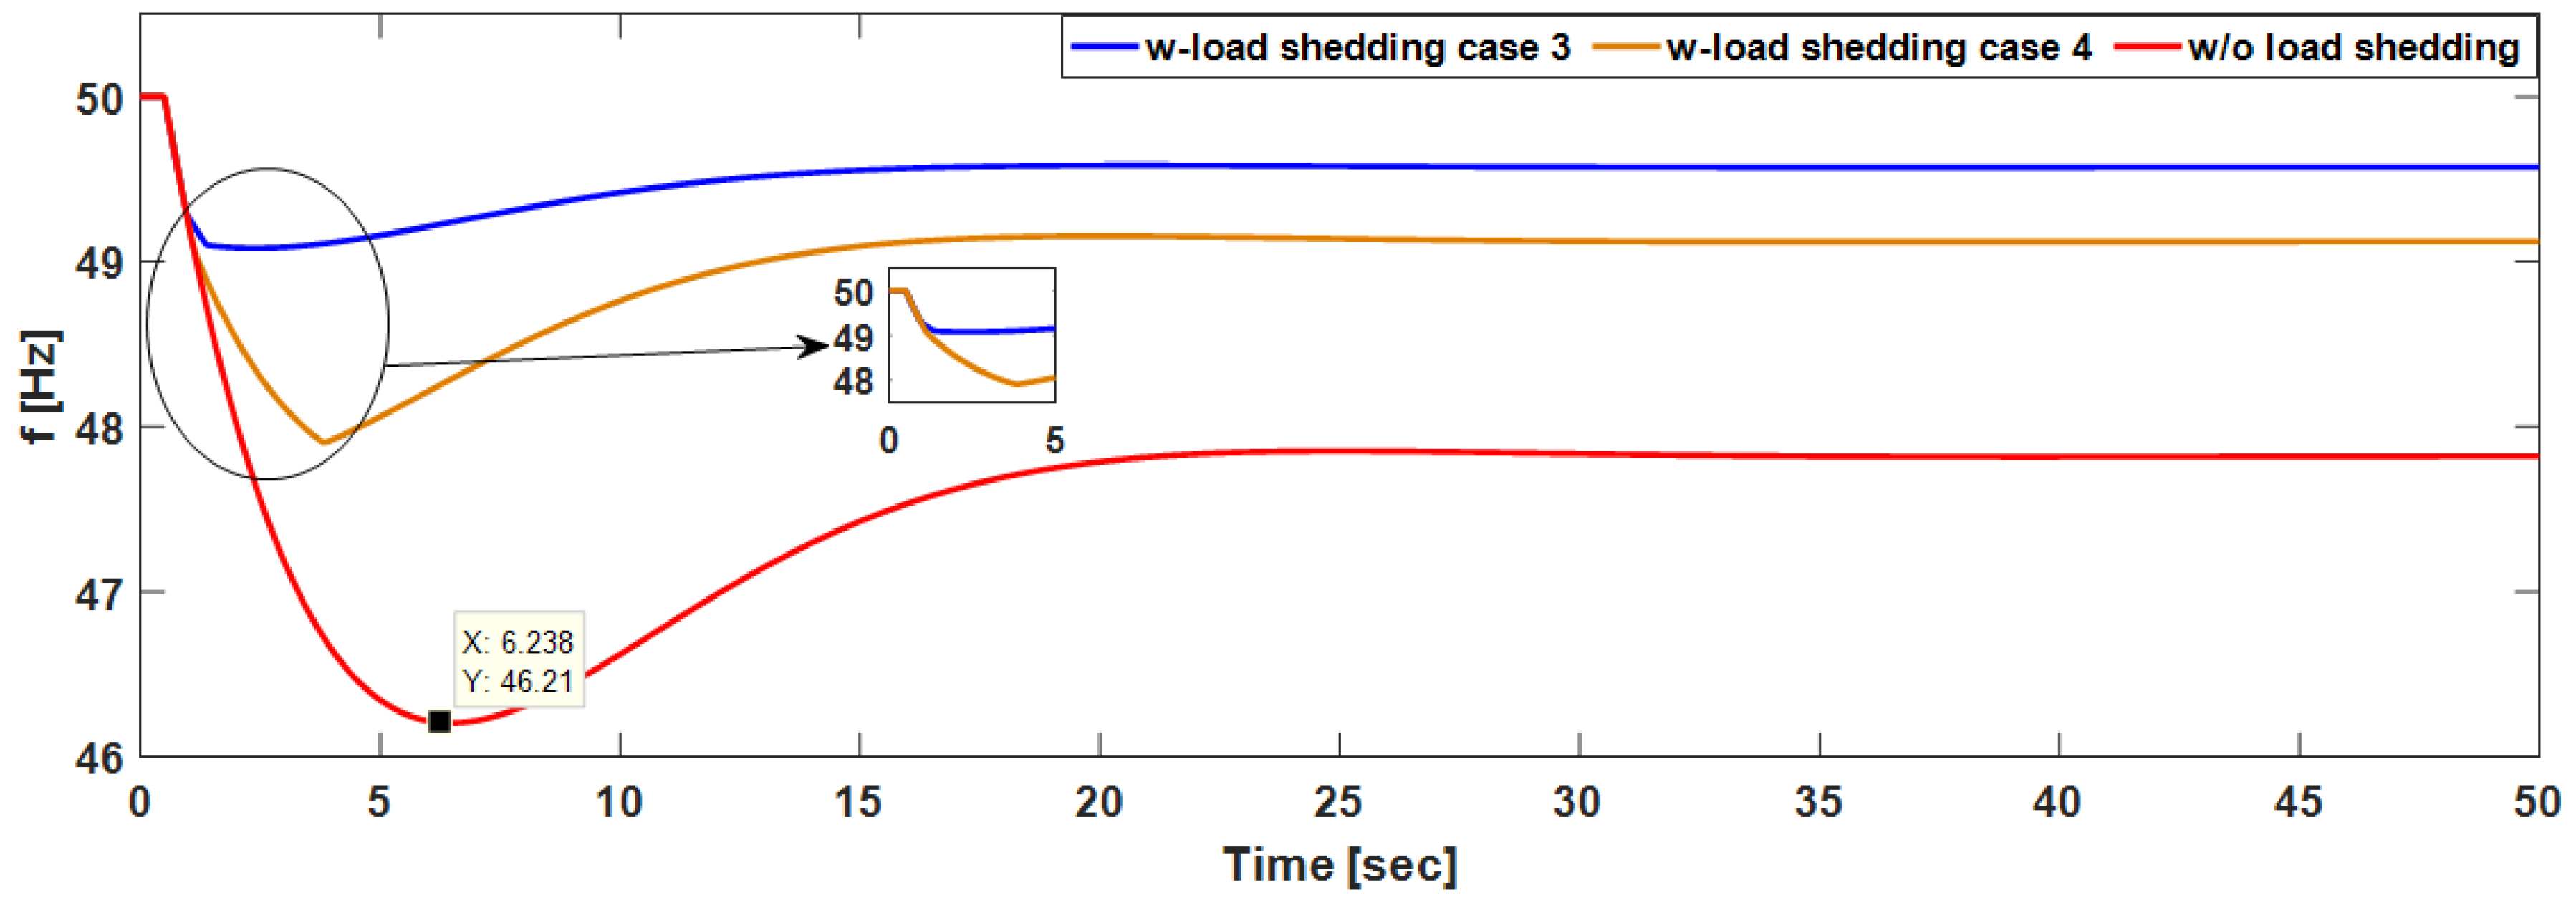
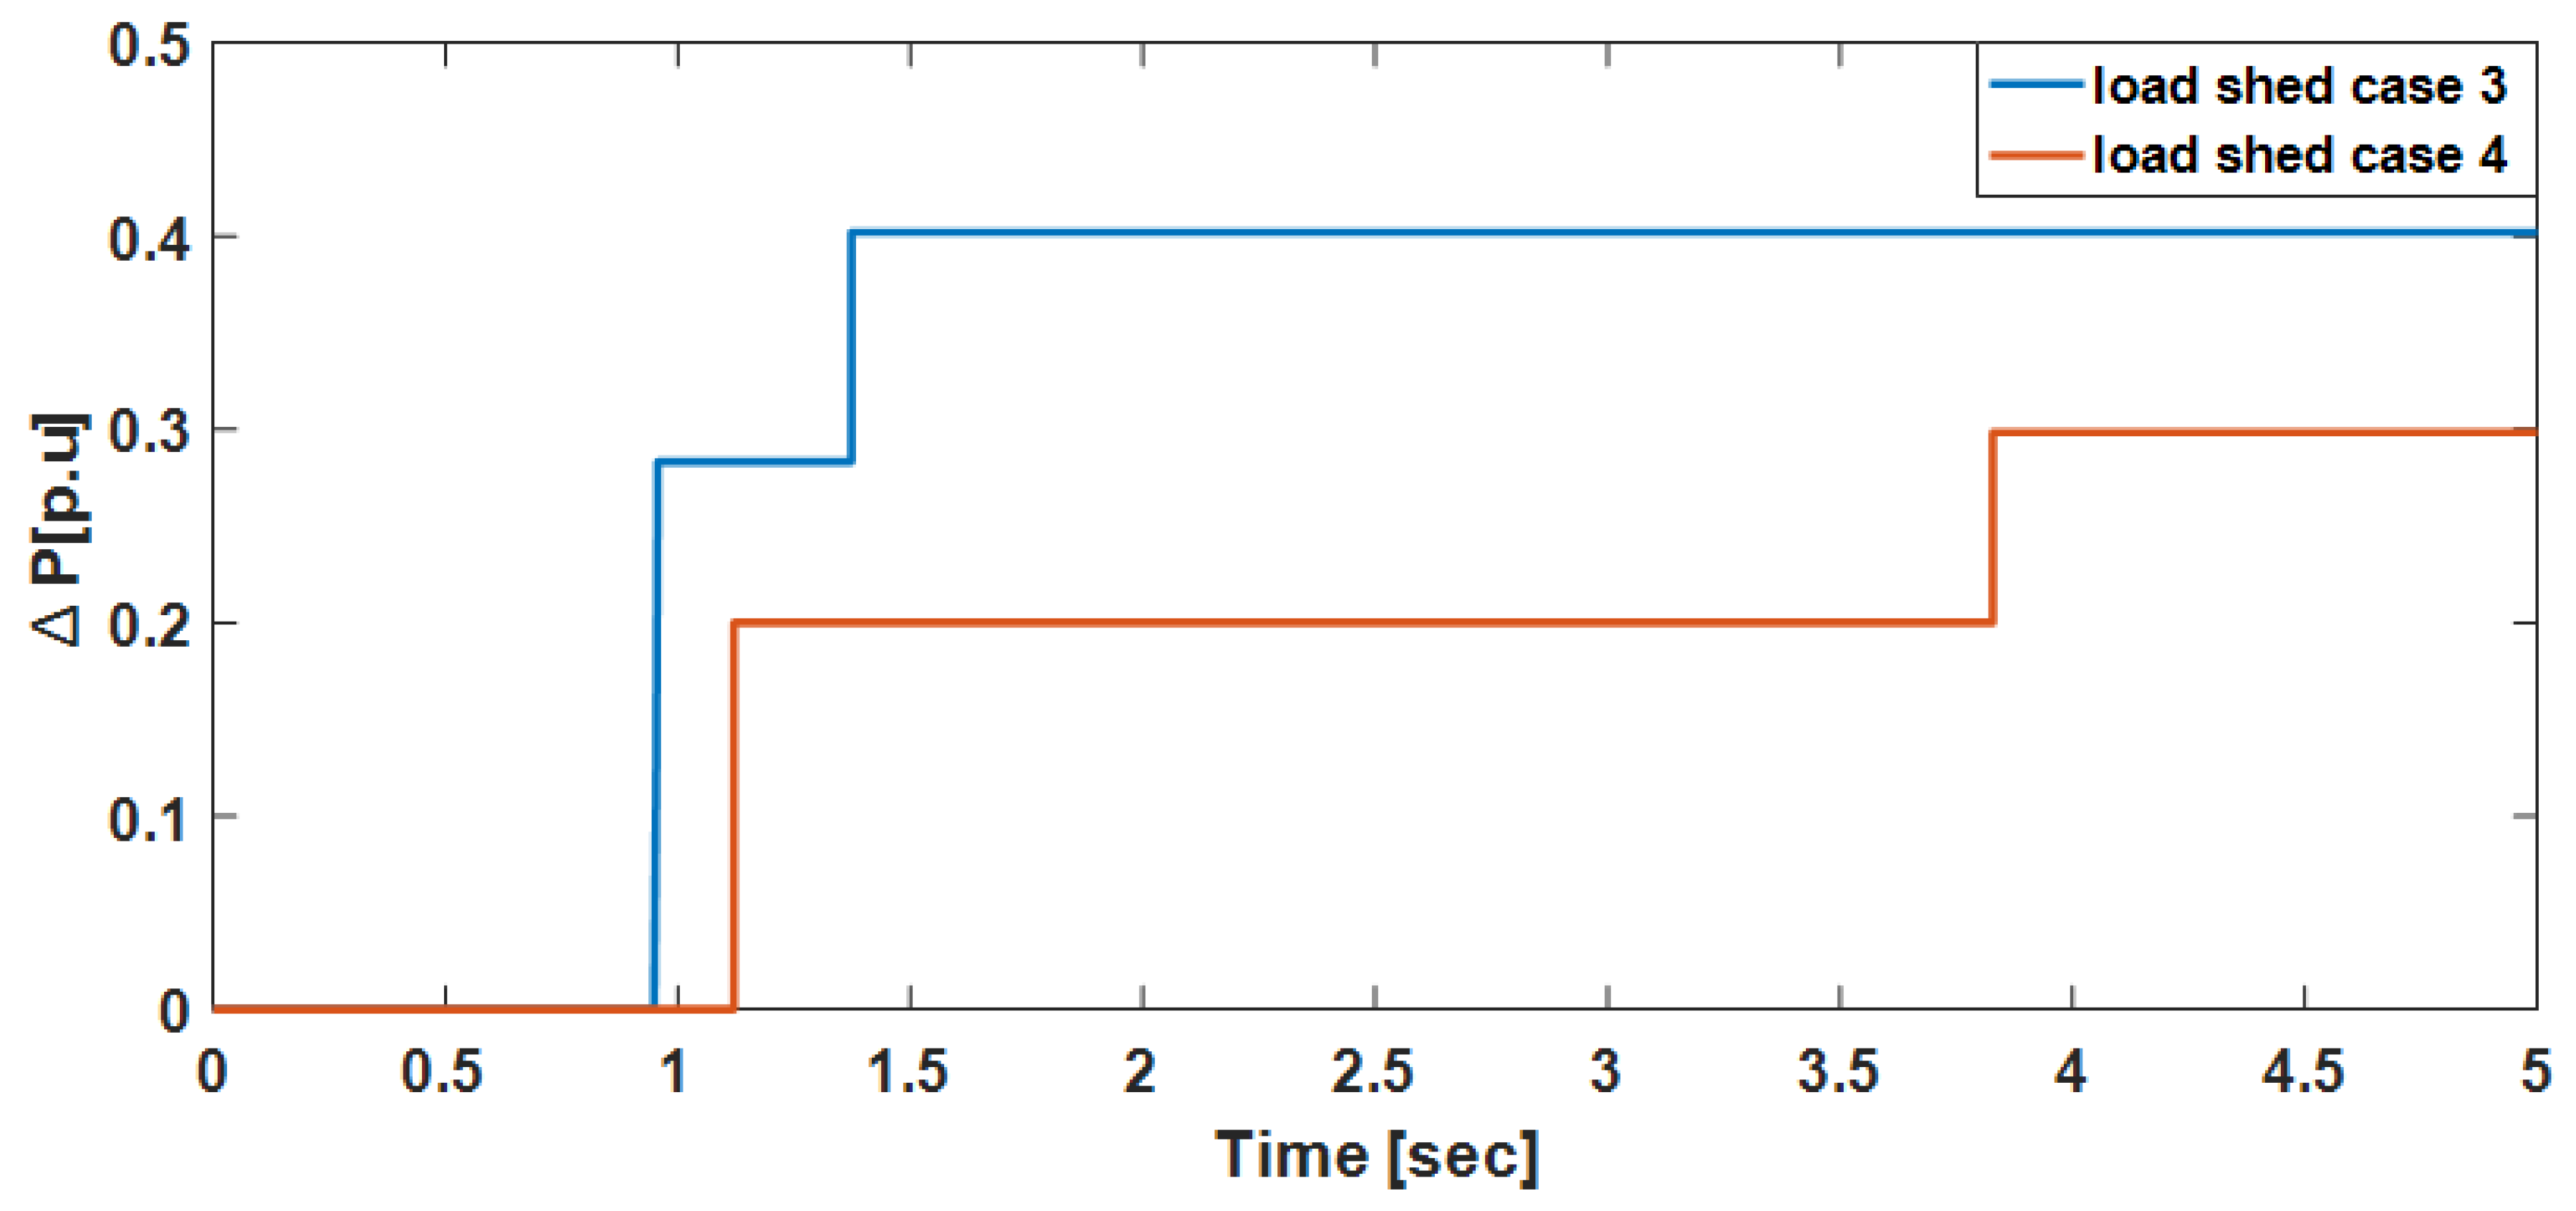
Figure 7 shows that in case 4 the minimum frequency with load-shedding was nearly 48 Hz and in case 3 it was almost 49 Hz. The same number of load-shedding stages were activated in both cases with case 3 shedding more as shown in
Figure 8. From the frequency settings shown in table, the minimum frequency for case 3 was less therefore it was more likely that less load should be shed to restore the system to nominal operating levels. In both cases, the frequency at which shedding is to be done and the amount of load to be shed was determined by the optimization algorithm. The lower and the upper limits for load to be shed were 0 and 0.2 respectively for each and every stage.
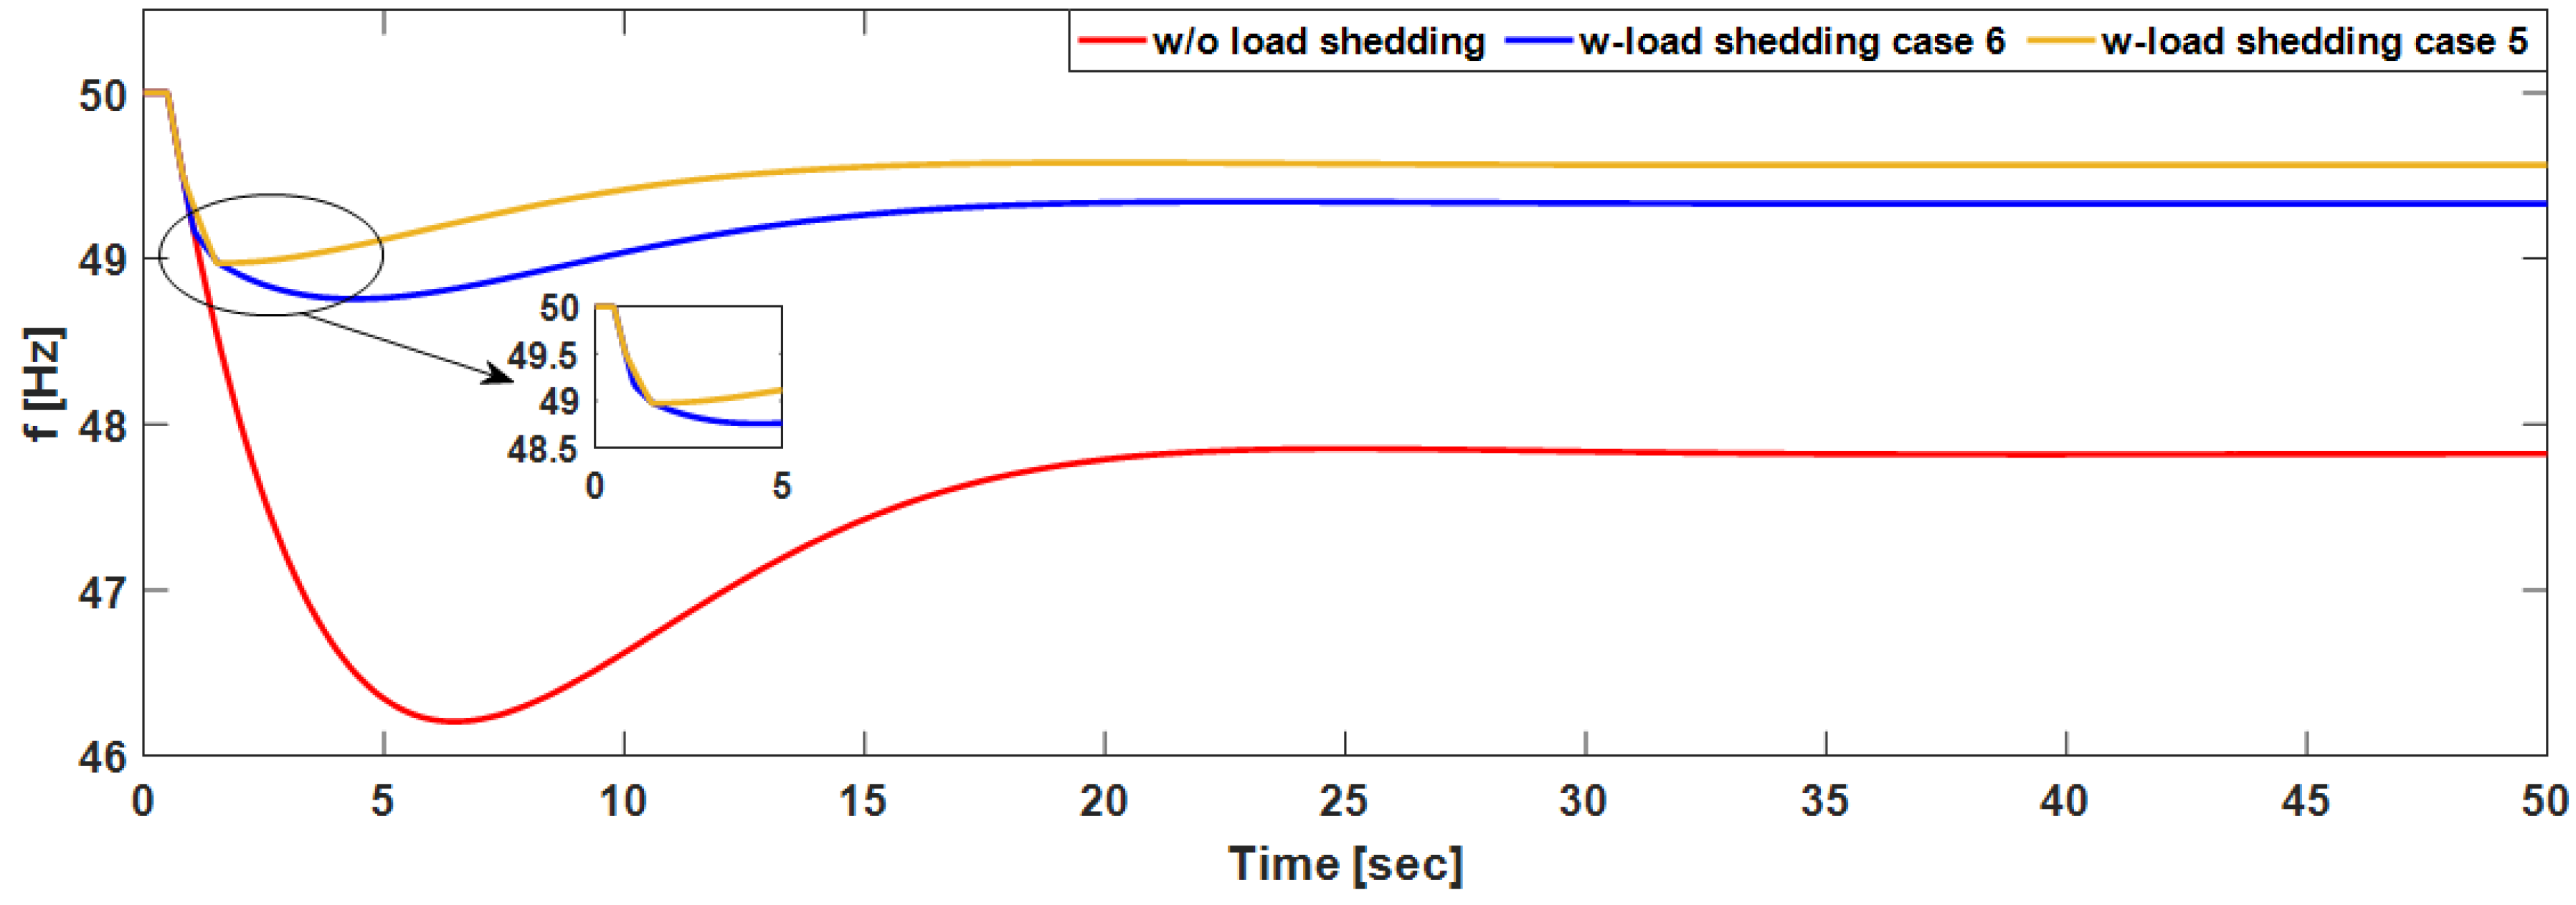
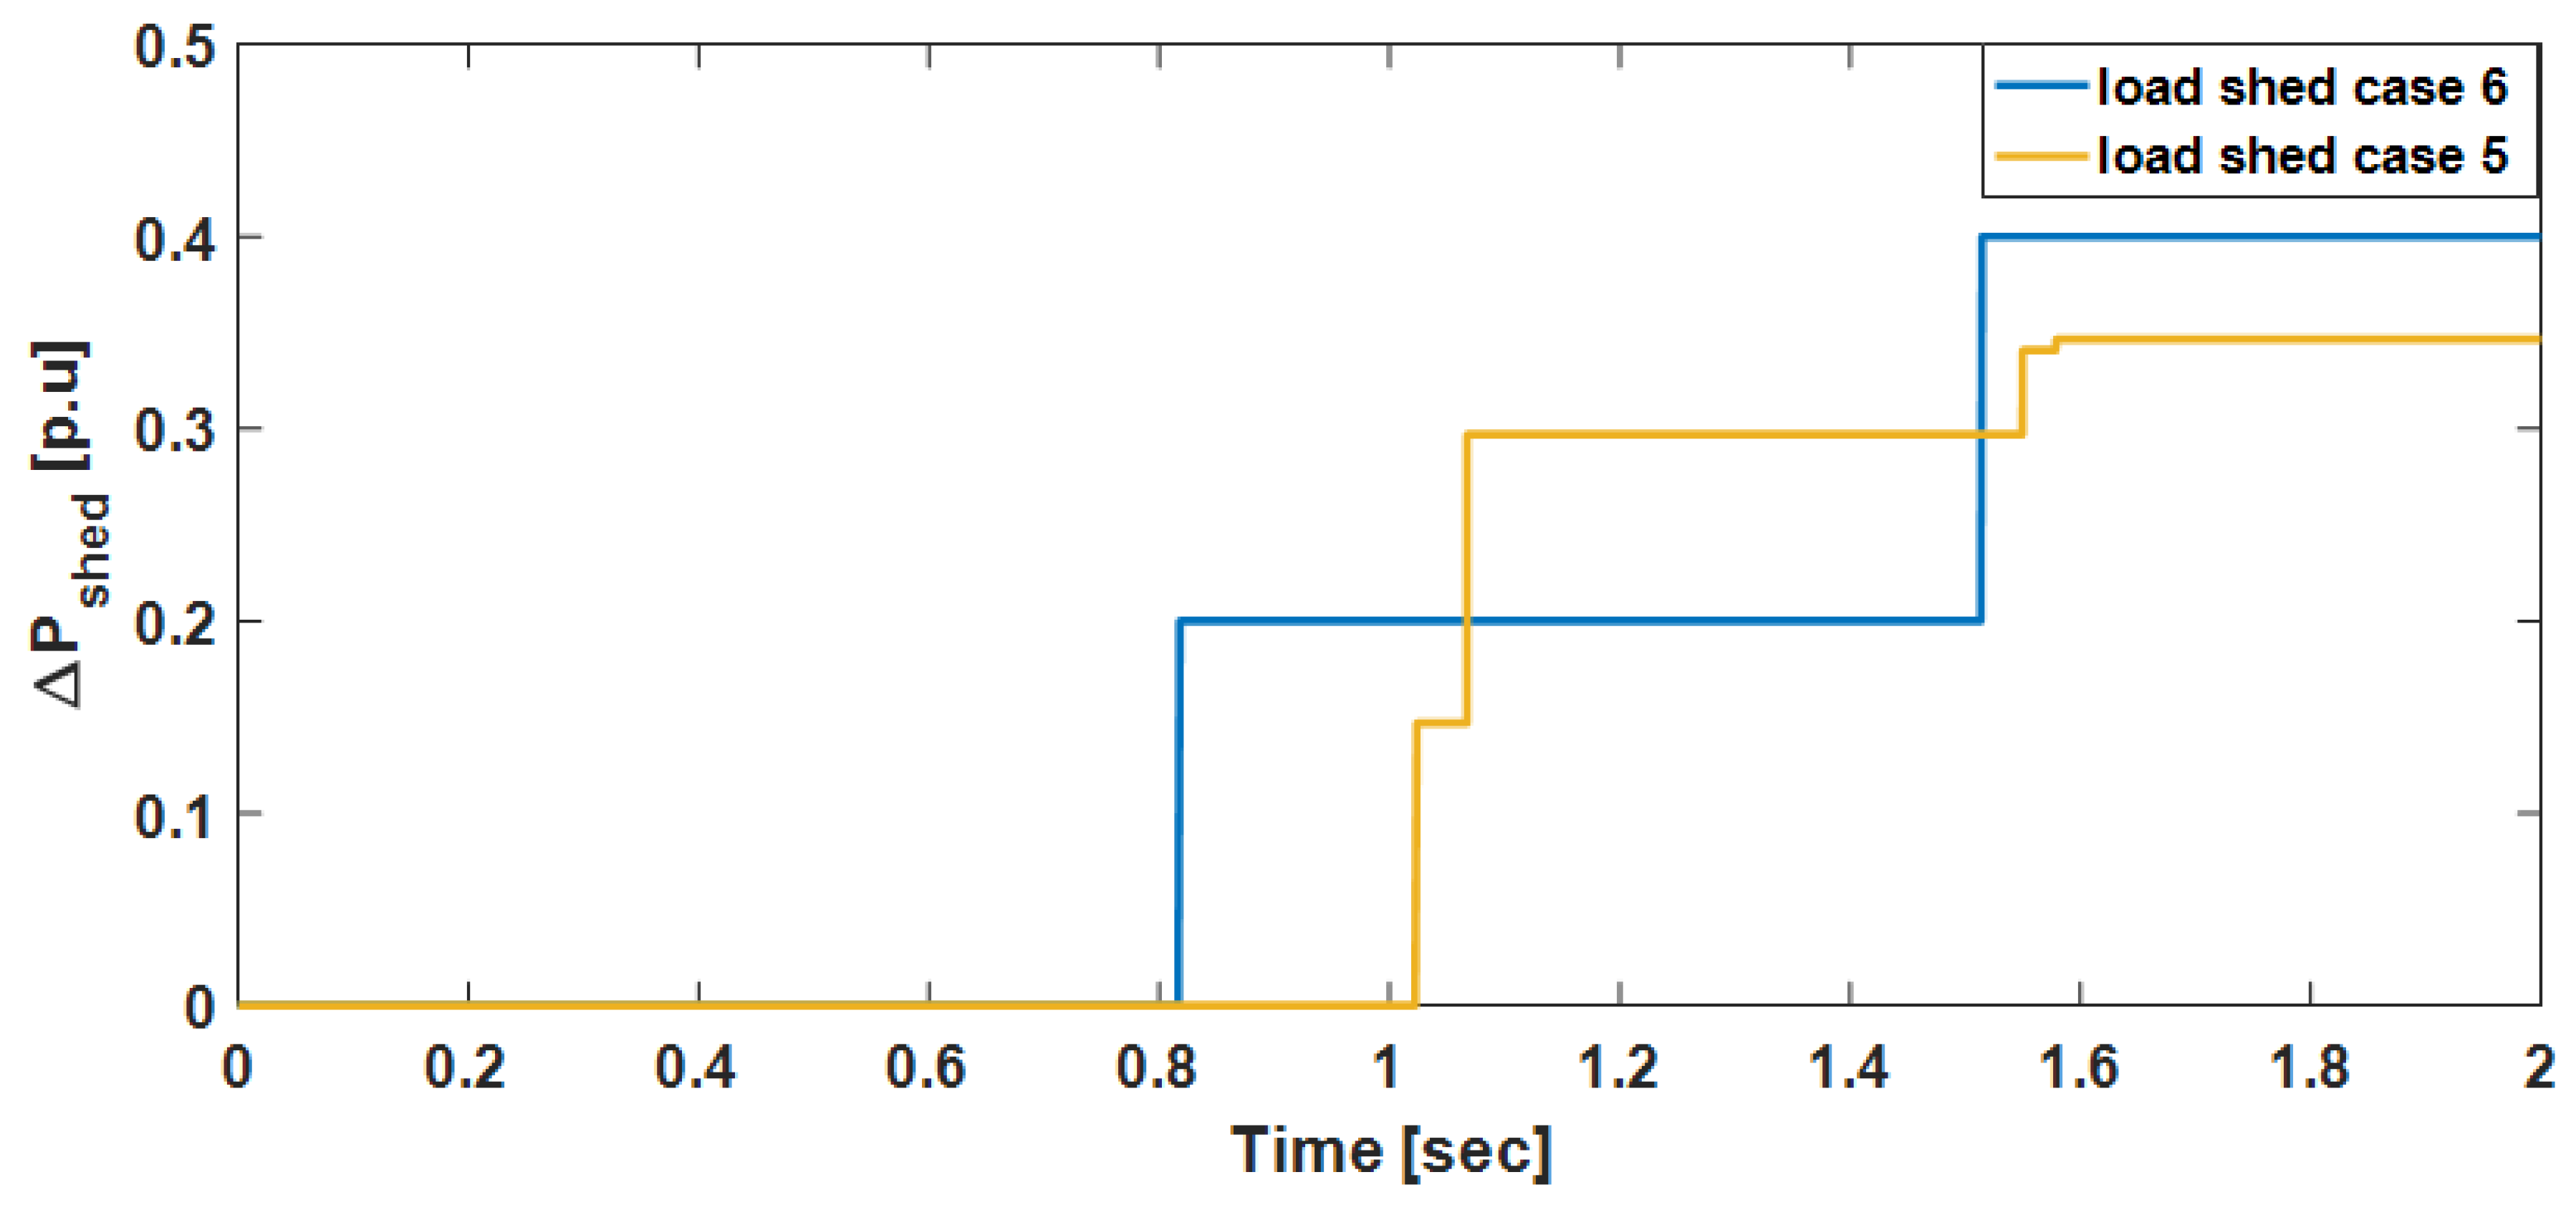
The frequency settings for case 3 were the same as for case 6 while those for case 4 were the same with case 5. The difference in these scenarios in that for case 3 and 4 Equation (
12) was used while in case 5 and 6 Equation (
13) was used. The results for case 5 and 6 (shown in
Figure 9 and
Figure 10) were much better compared to the results in case 3 and 4 (shown in
Figure 7 and
Figure 8). It can be concluded that including the actual load to be shed in the objective produces better results. By comparing case 4 and case 6 it can be seen that in 6 the minimum frequency reached was much closer to 49 Hz.
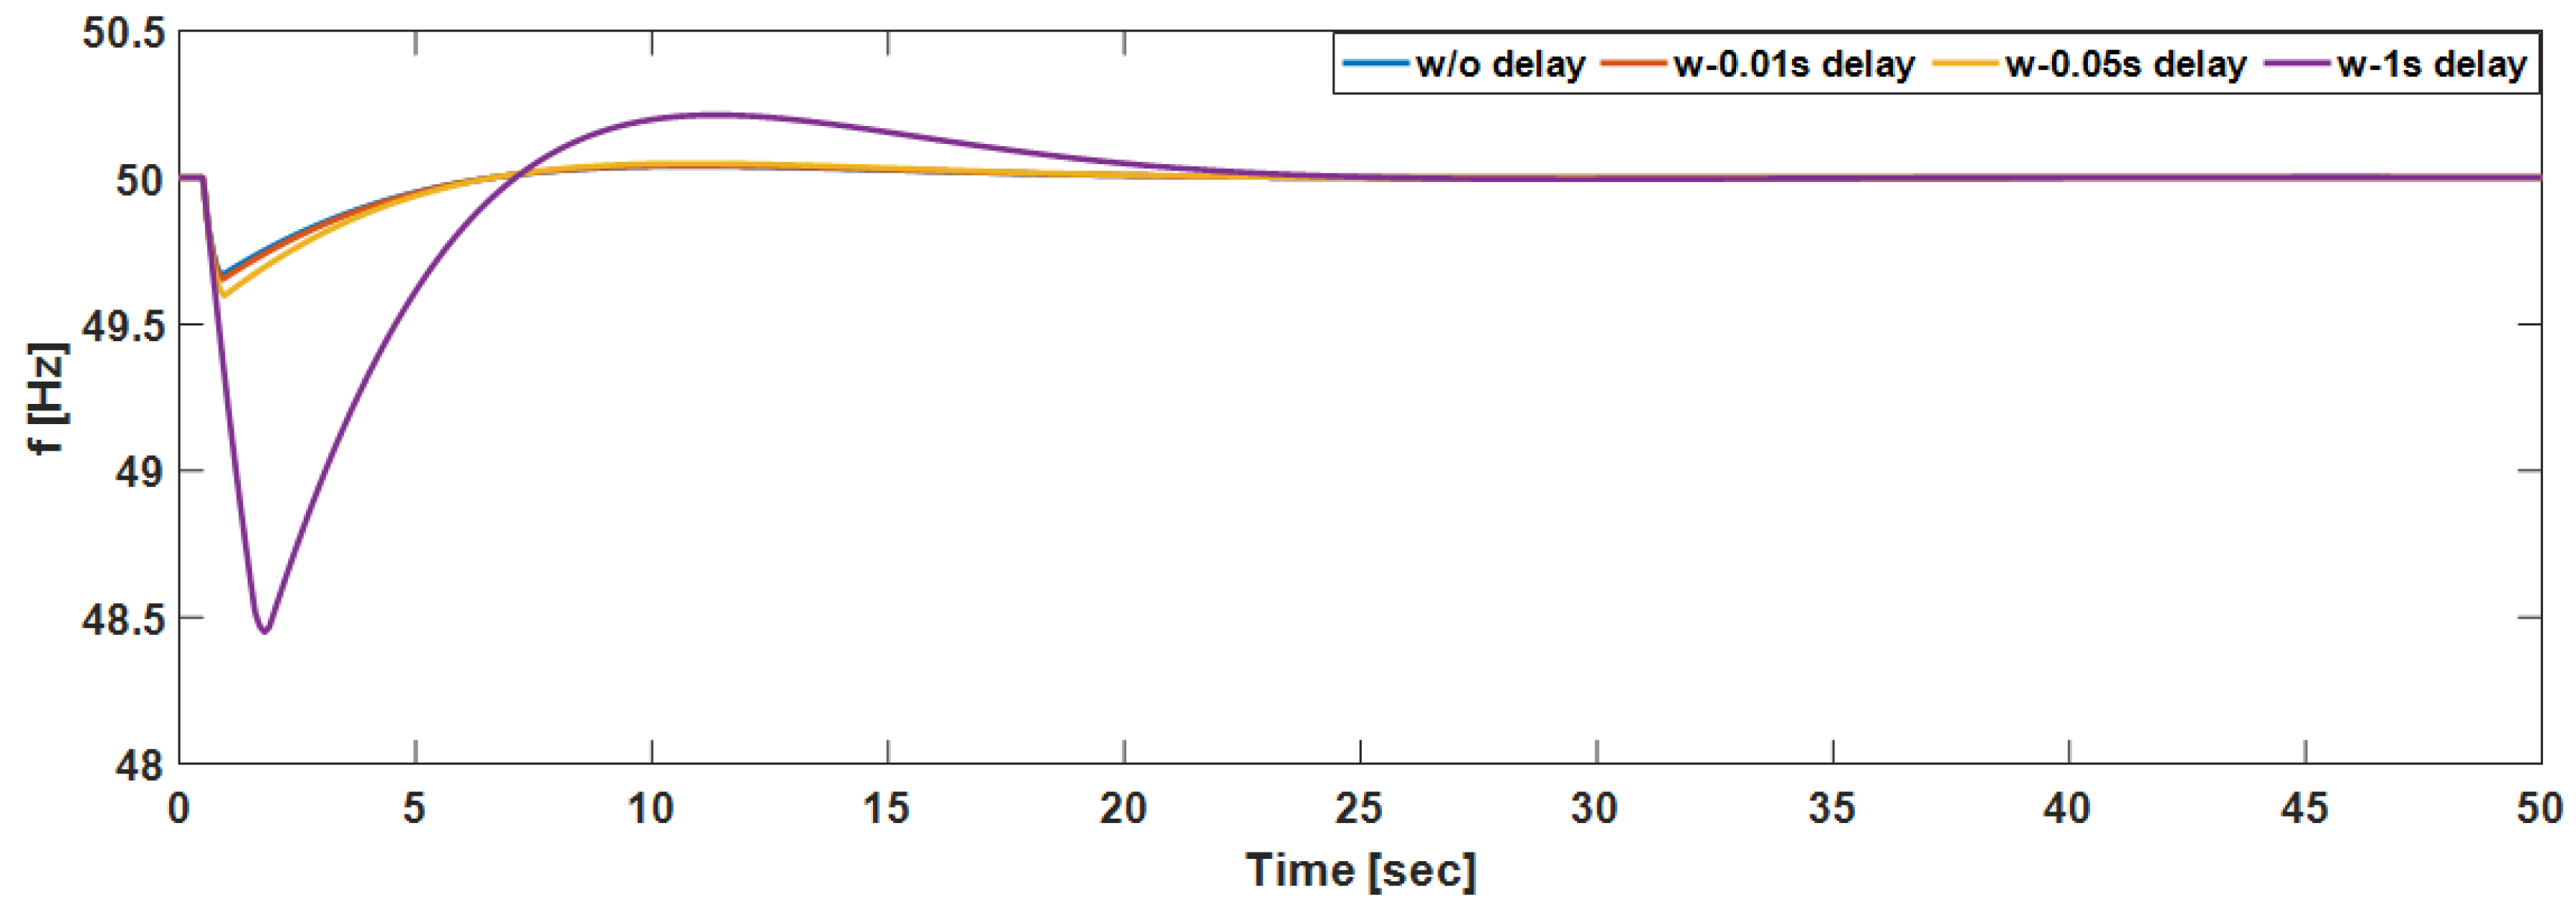
7.2. Time Delay Effects
WAMS have inherent communication delays and as a result the effect of delay is considered here. For consistence of results only case 2 was chosen. For the purpose of studies and just to show the effect of delay, in our simulations we varied the time delay to implement the load-shedding. Four scenarios are compared as shown in
Figure 11. The greater the time delay the lower the minimum frequency. For large delays, the system will lose synchronism. Mathematically, the objective is met since the error is finally zero but before we reach that point the system would have long lost stability.
7.3. Comparison with Other Methods
To further show the superiority of the proposed technique we compared it to the most commonly used UFLS schemes which are traditional UFLS, adaptive UFLS, and semi-adaptive or ROCOF-based schemes. It should be noted that the choice of settings for the used UFLS schemes will give different results. For consistence in results, we implemented the traditional UFLS with the settings shown in
Appendix A. For ROCOF-based UFLS we considered the requirements of IEEE Std. C37.118.1, and
Appendix A show the considered settings [
10]. With adaptive UFLS, we simply estimated the disturbance using the swing equation and the deficit is shed at once when the frequency reaches 49.0 Hz. Two scenarios are compared which are the most serious contingency of 0.5 p.u power deficit and a medium disturbance of 0.2 p.u.
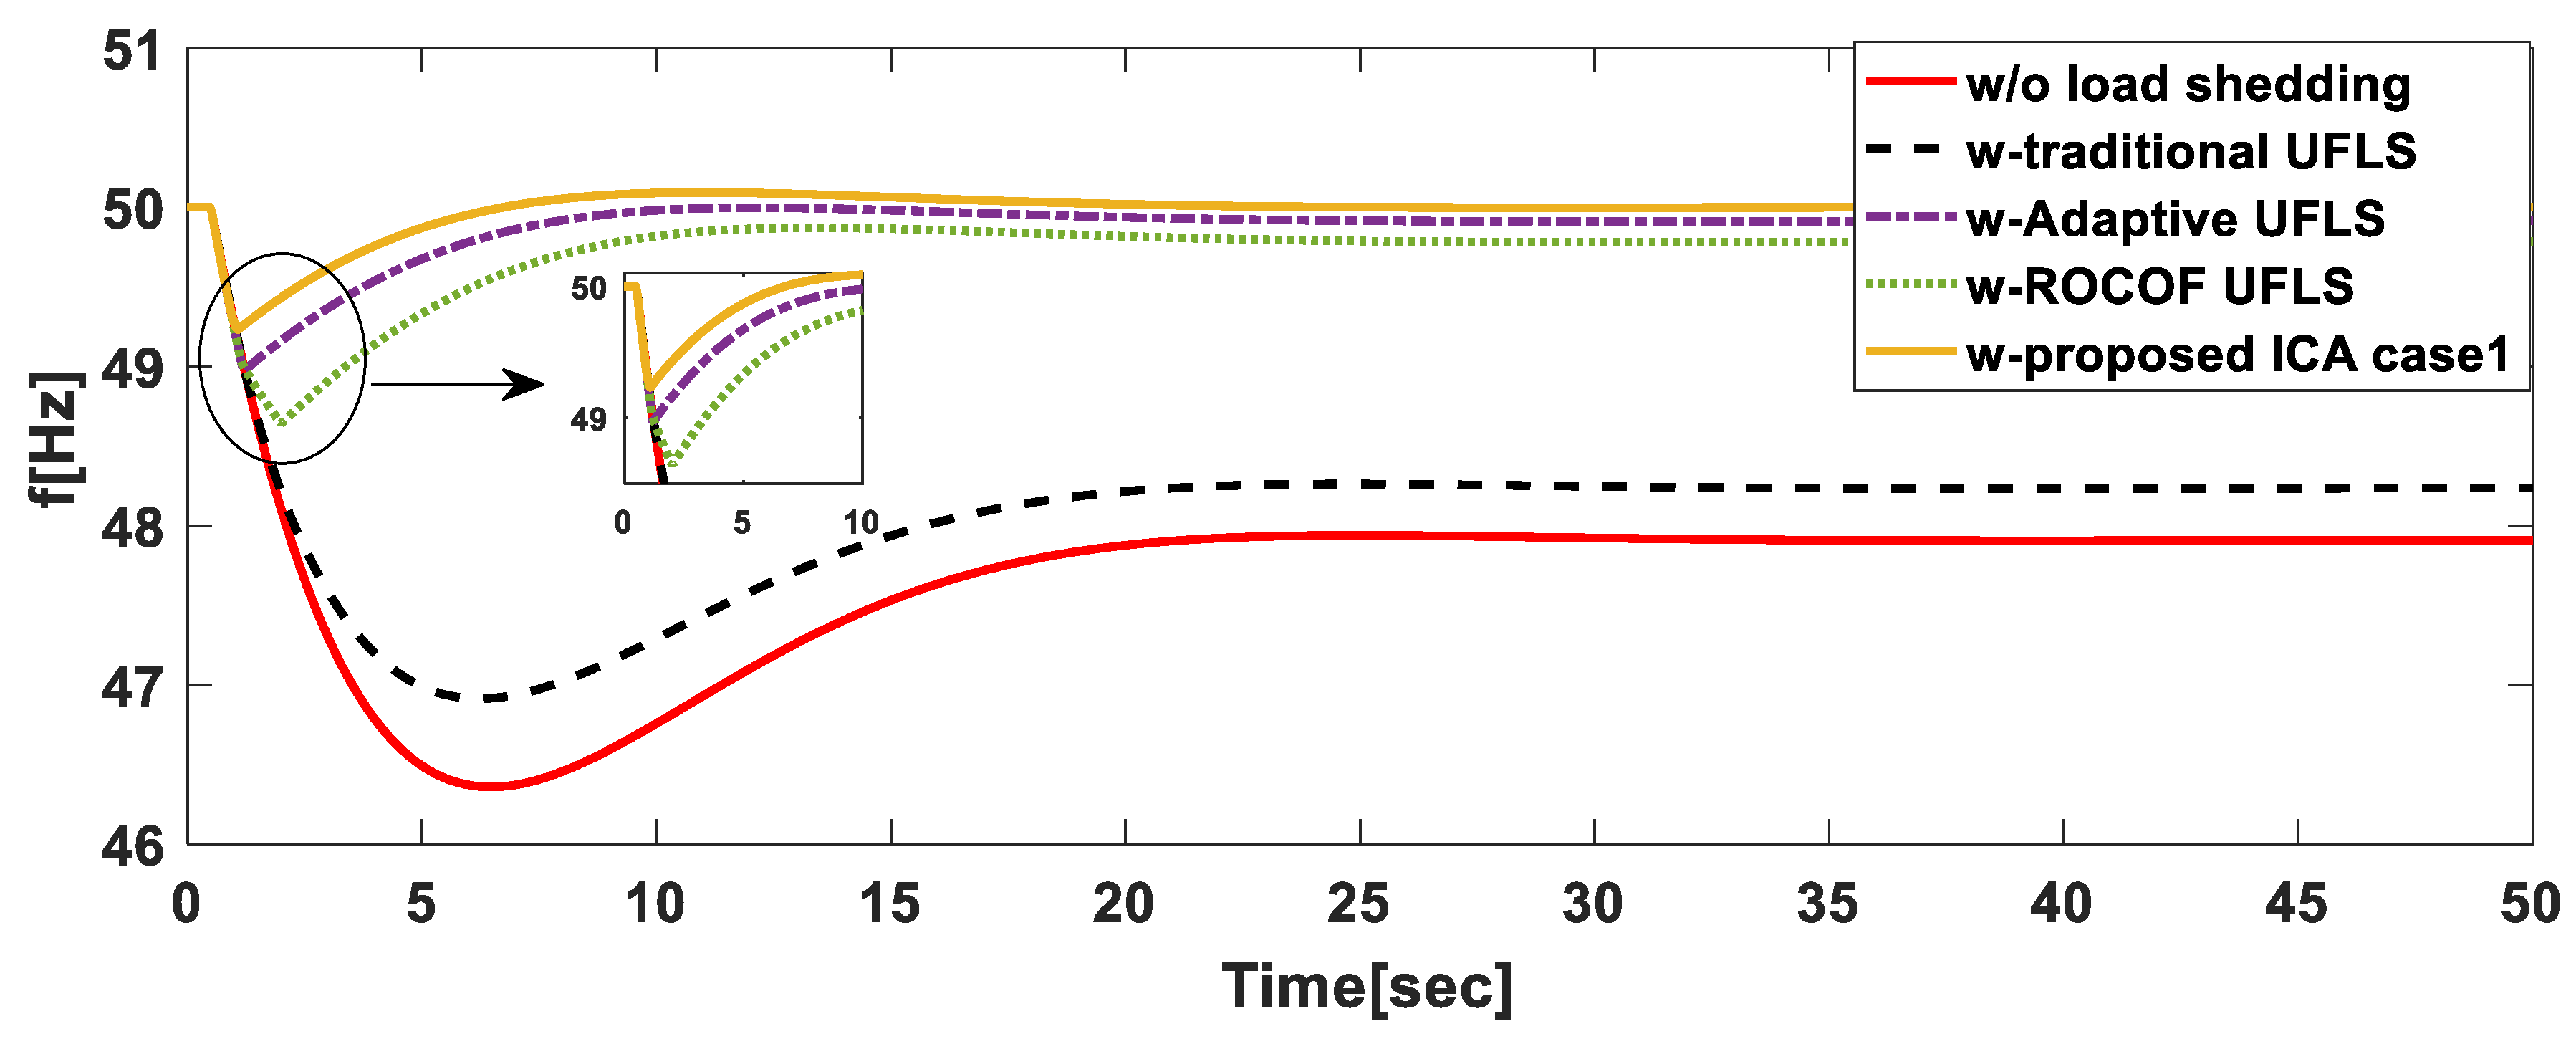
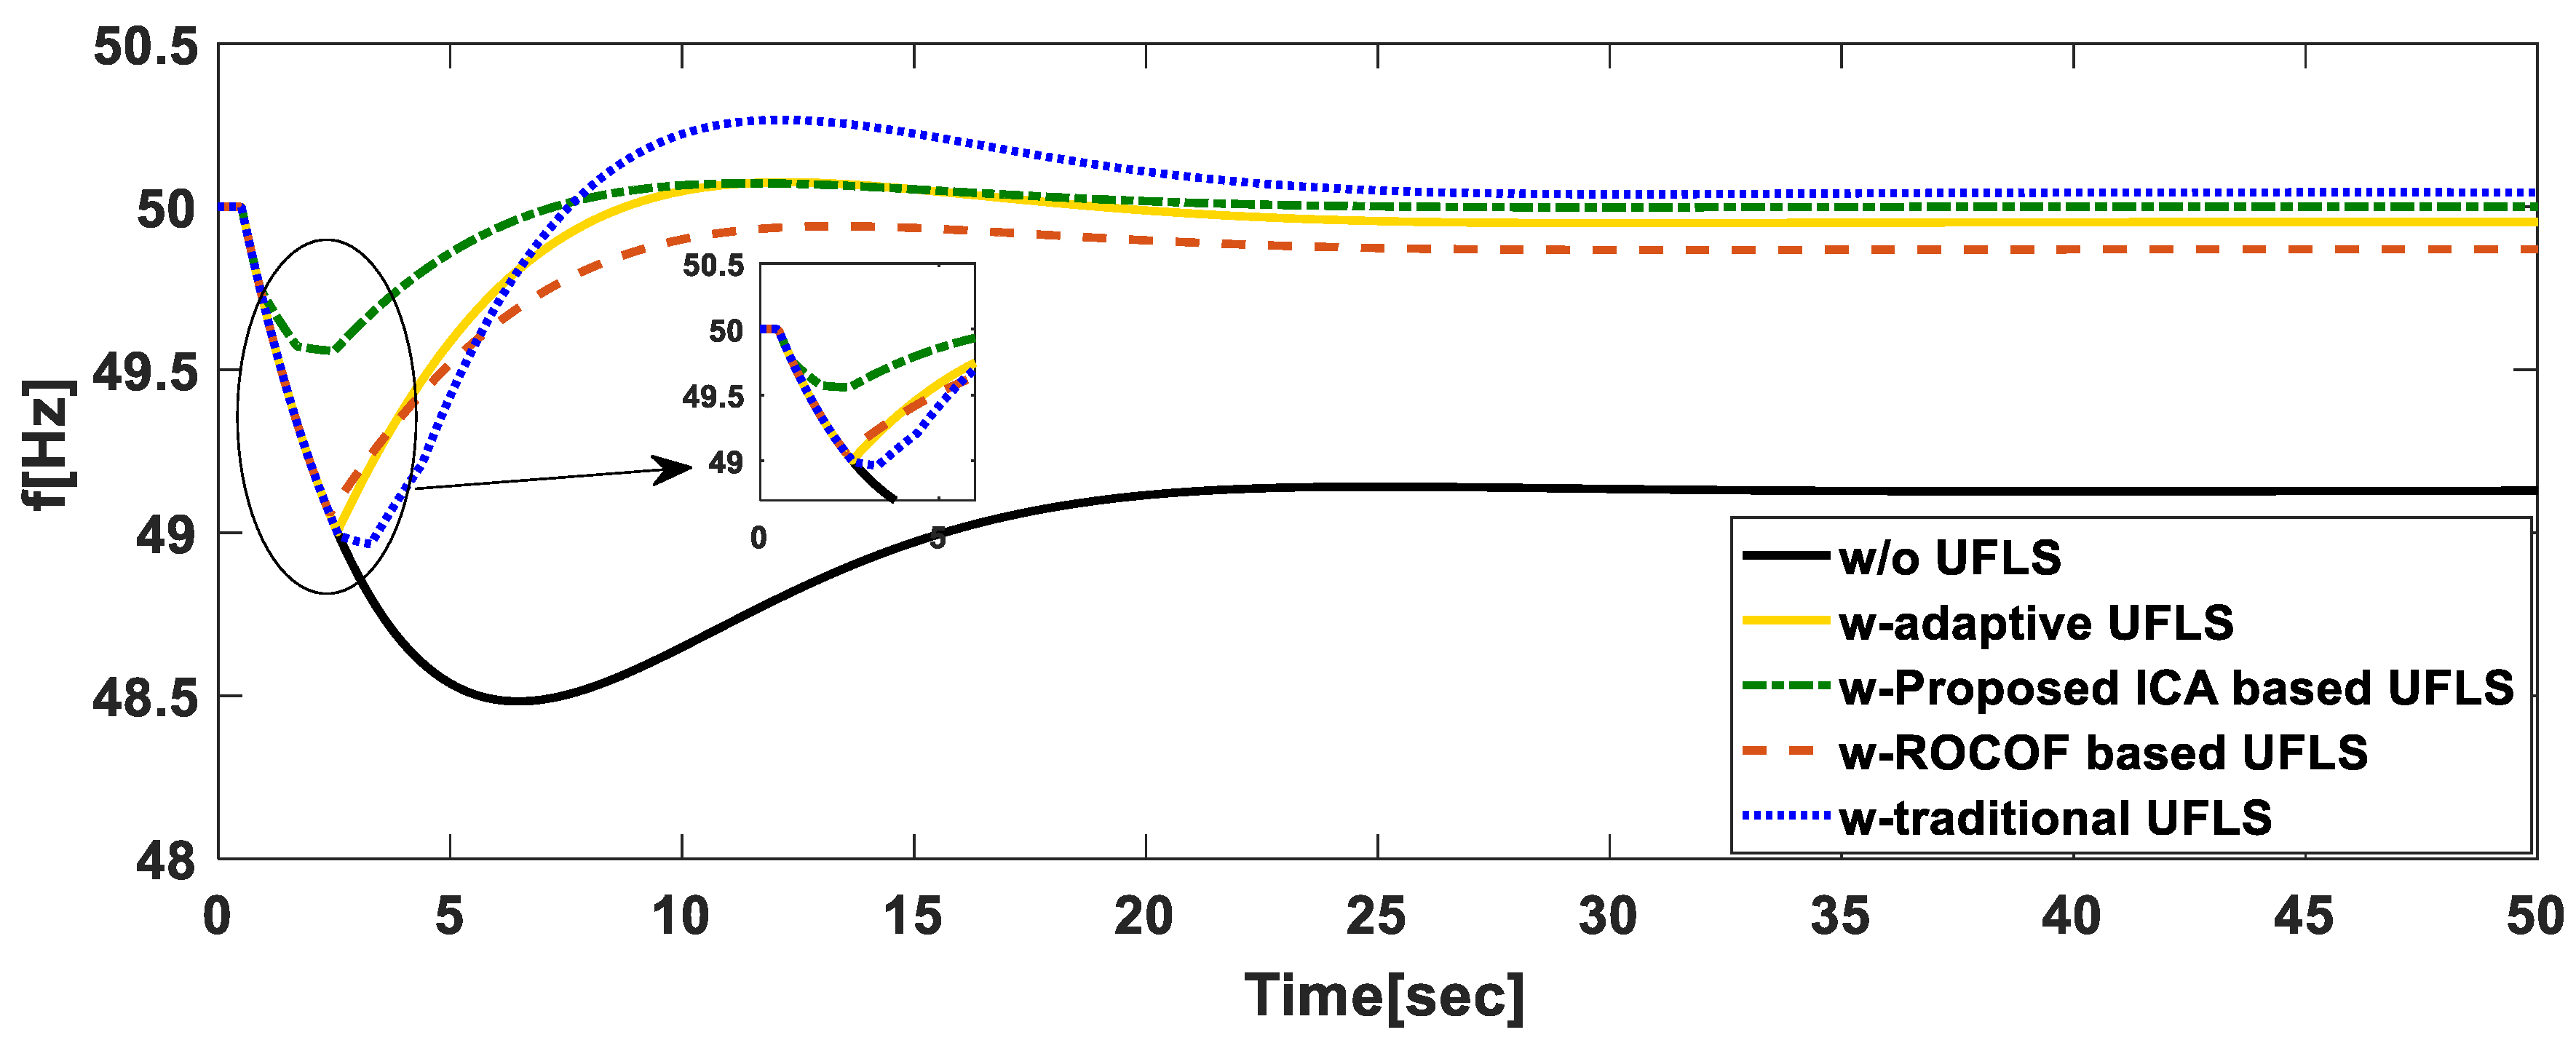
Firstly, we consider a large disturbance of 0.5 p.u. When this disturbance occurs, the frequency dropped to about 46.5 Hz as in
Figure 12. From
Figure 12, it can be observed that with traditional UFLS scheme, the frequency of the system dropped rapidly to 47 Hz in almost 5 s, an under-shedding situation occurred. At this rate of frequency decay if no drastic measures are taken, total system collapse will be experienced. Using adaptive and ROCOF-based UFLS techniques, the frequency was restored to a steady state of above 49.5 Hz; however, the frequency drop with ROCOF technique was much higher. With WAMS-based optimal UFLS scheme where the ICA algorithm is used, frequency only dropped to 49.1 Hz and it is restored to a steady state of about 49.5 Hz in almost 5 s. Therefore, it can be observed that the optimal UFLS scheme is more superior in that the frequency can be restored in a short period thereby avoiding system collapse, in the traditional case usually under-shedding or over-shedding occurs and they both affect system stability.
In the second scenario, we considered a medium disturbance of 0.2 p.u. After the disturbance occurred,
Figure 13 shows that without UFLS the frequency would drop to almost 48.5 Hz. This is a more common disturbance in power systems. In this scenario, all the considered UFLS techniques restored the frequency to above 49.5 Hz. With traditional UFLS, there was frequency overshoot due to over-shedding and the frequency finally settled at about 50.1 Hz. However, our proposed scheme was more superior if we consider the minimum frequency reached with other techniques.
We also compared the proposed ICA algorithm with another stochastic search algorithm. Meta-heuristic algorithms include GA, bacteria foraging, and PSO. These algorithms have proven to be efficient in handling complex nonlinear constraints and to provide high-quality solutions. However, it has been proven that PSO has better performance compared to GA and bacteria foraging algorithms [
39,
40]. They however have their challenges on convergence and issues to do with dimensionality [
39]. We chose the PSO algorithm in our comparisons as this algorithm is recently used to solve the UFLS in [
40]. Again, the most severe disturbance in the studied system, i.e., 0.5 p.u is considered.
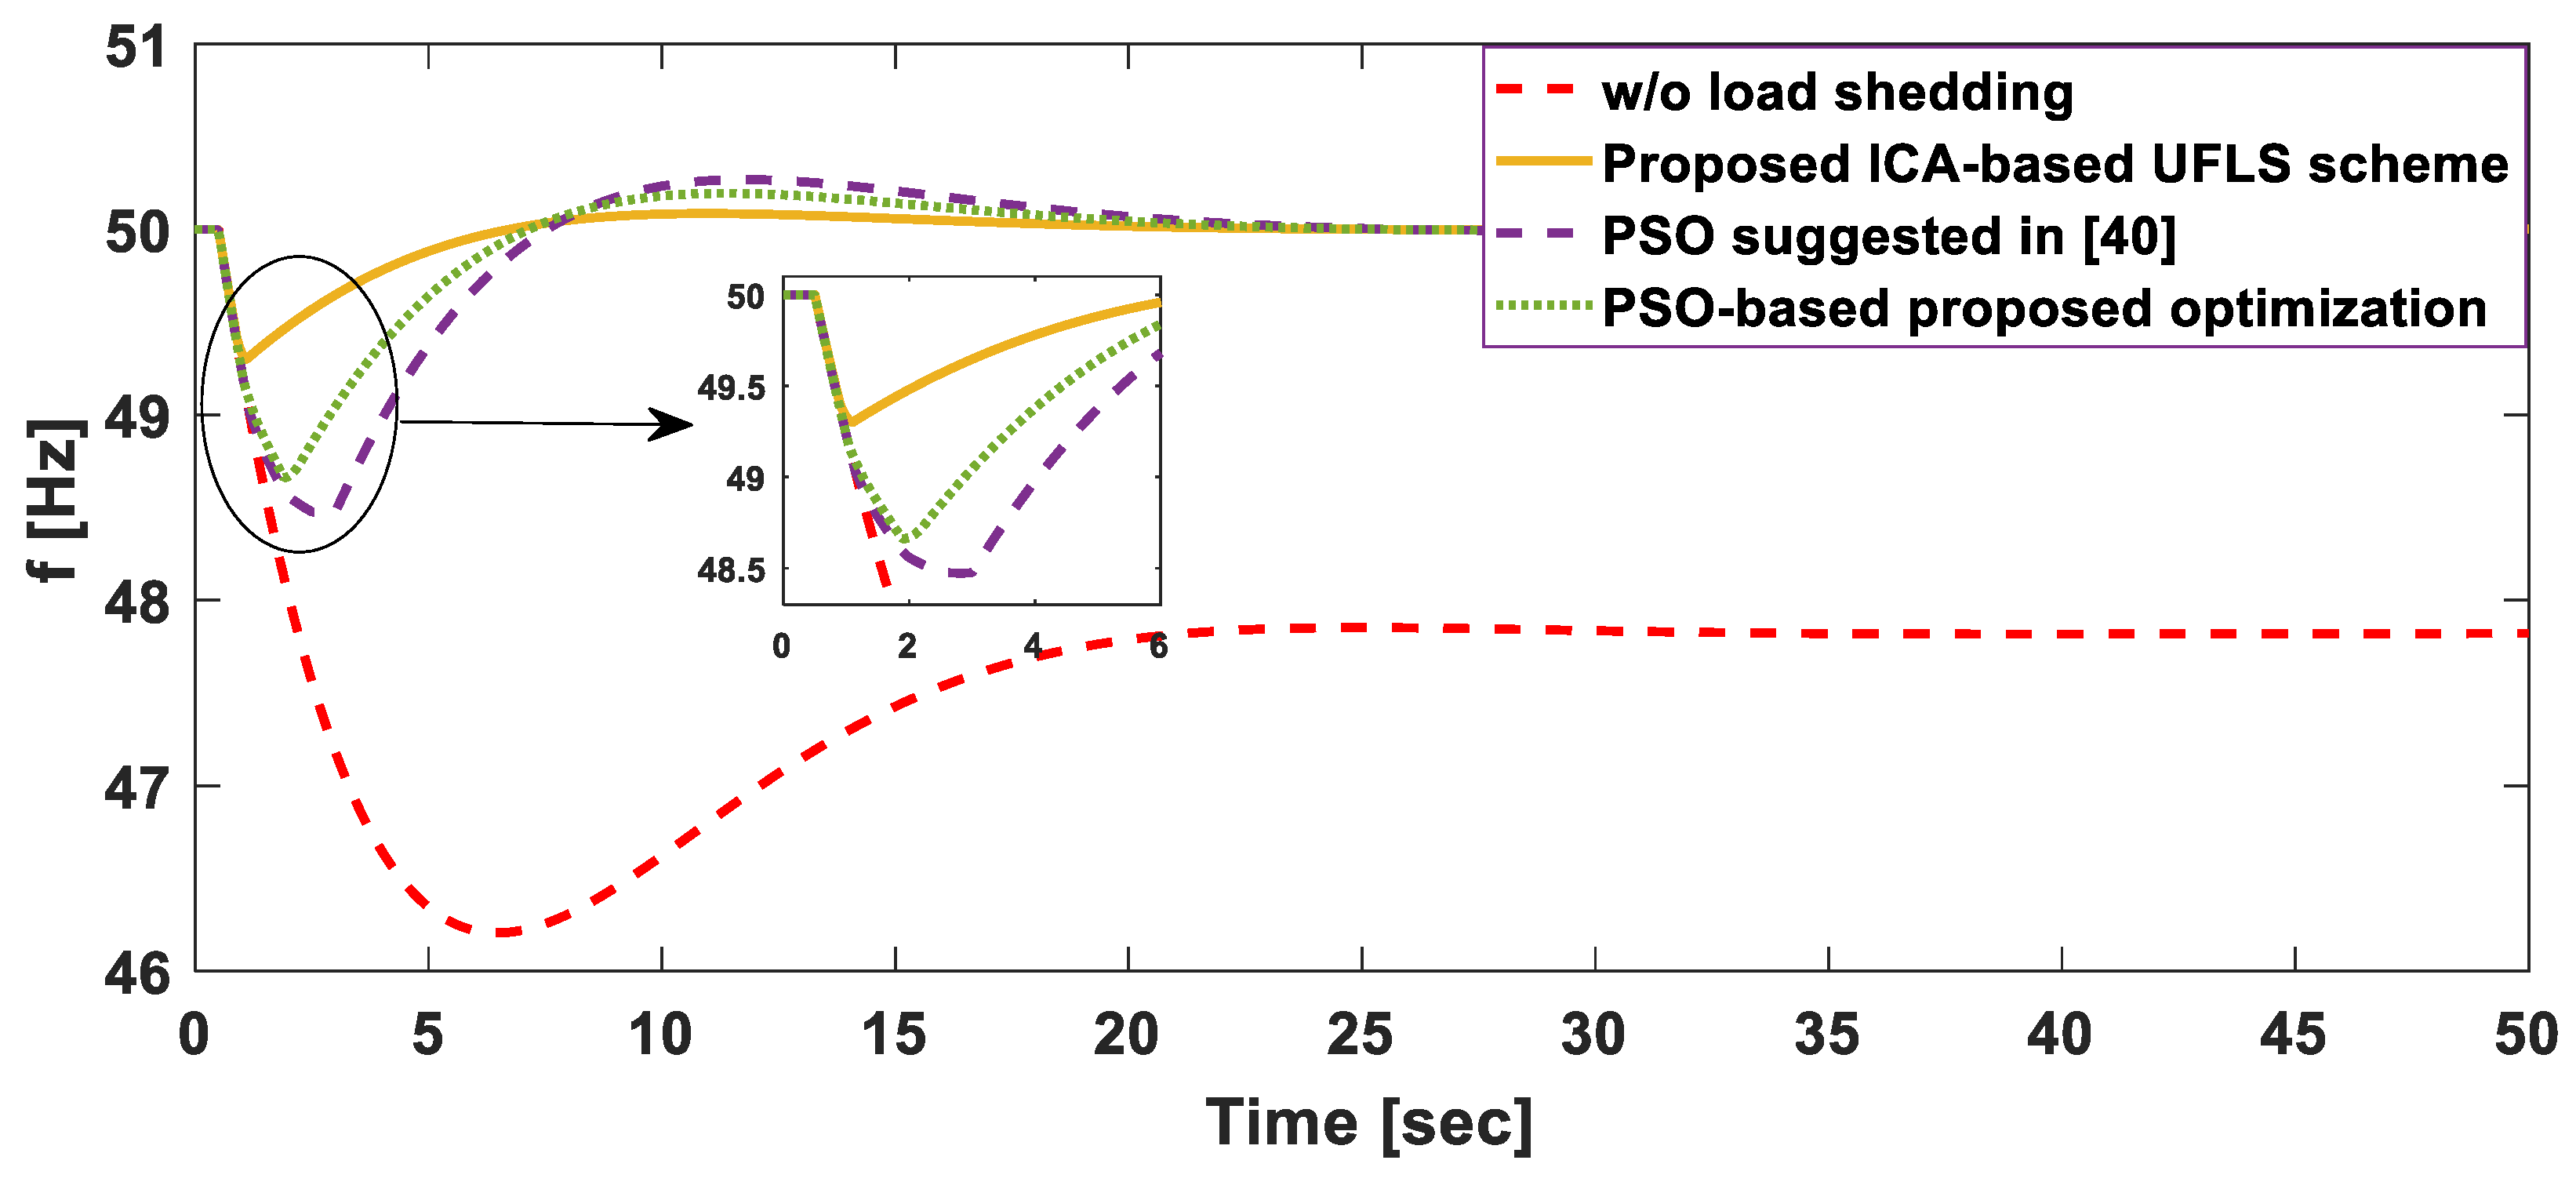
Figure 14 shows the results of the three compared scenarios. Using our proposed ICA-based UFLS specifically case 2 is used and comparing it to PSO suggested in [
40] it gave better results. With the PSO suggested in [
40] there was delayed shedding and the minimum frequency reached was almost 48.5 Hz. In the same case, a frequency overshoot is experienced, and the frequency finally reached a steady state after 22 s whereas in our case the frequency reached a steady state after 8 s. However, to make the comparison closer to our objective, we solve the proposed optimization problem in our paper using PSO, and compare the obtained result from PSO with the suggested ICA-based optimal multi-stage UFLS scheme. With these adjustments, there was a significant improvement with proposed PSO algorithm compared to the suggested PSO-based UFLS in [
40], the minimum frequency reached was almost 48.8 Hz, and the steady-state frequency was reached after about 18 s. This prove that the proposed UFLS optimization problem in this paper is better than [
40]. However, our proposed ICA-based optimal multi-stage UFLS scheme still gave better results as we had earlier shedding and the overshoot was smaller due to the suggested optimization problem and the performance of the adopted algorithm.
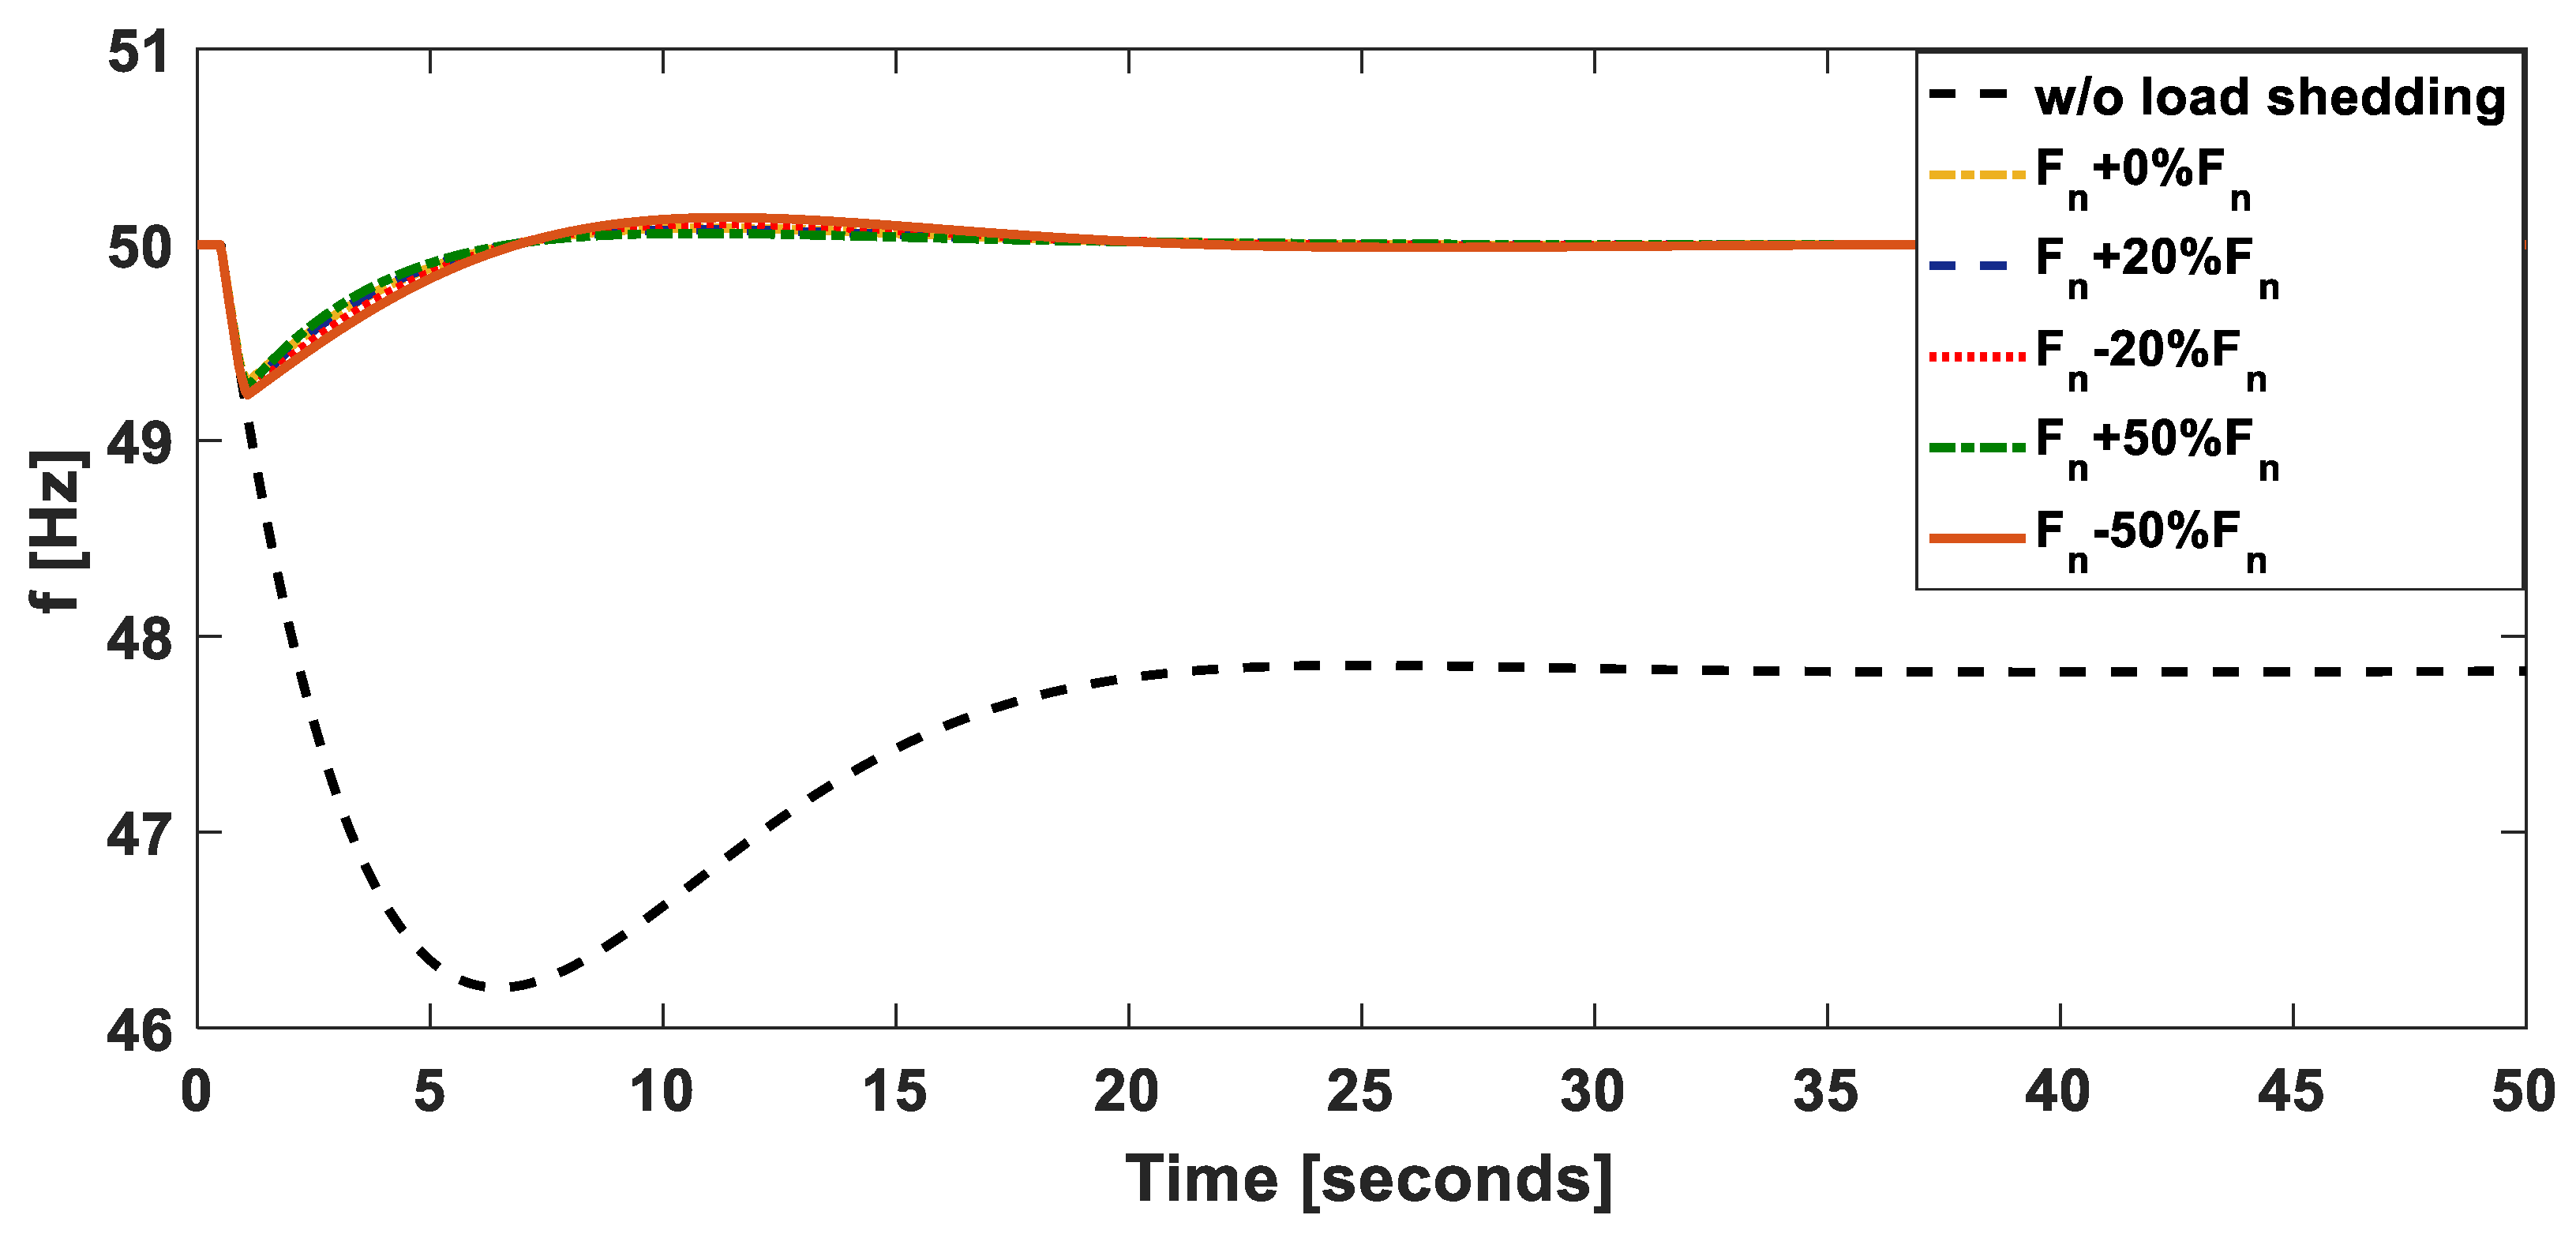
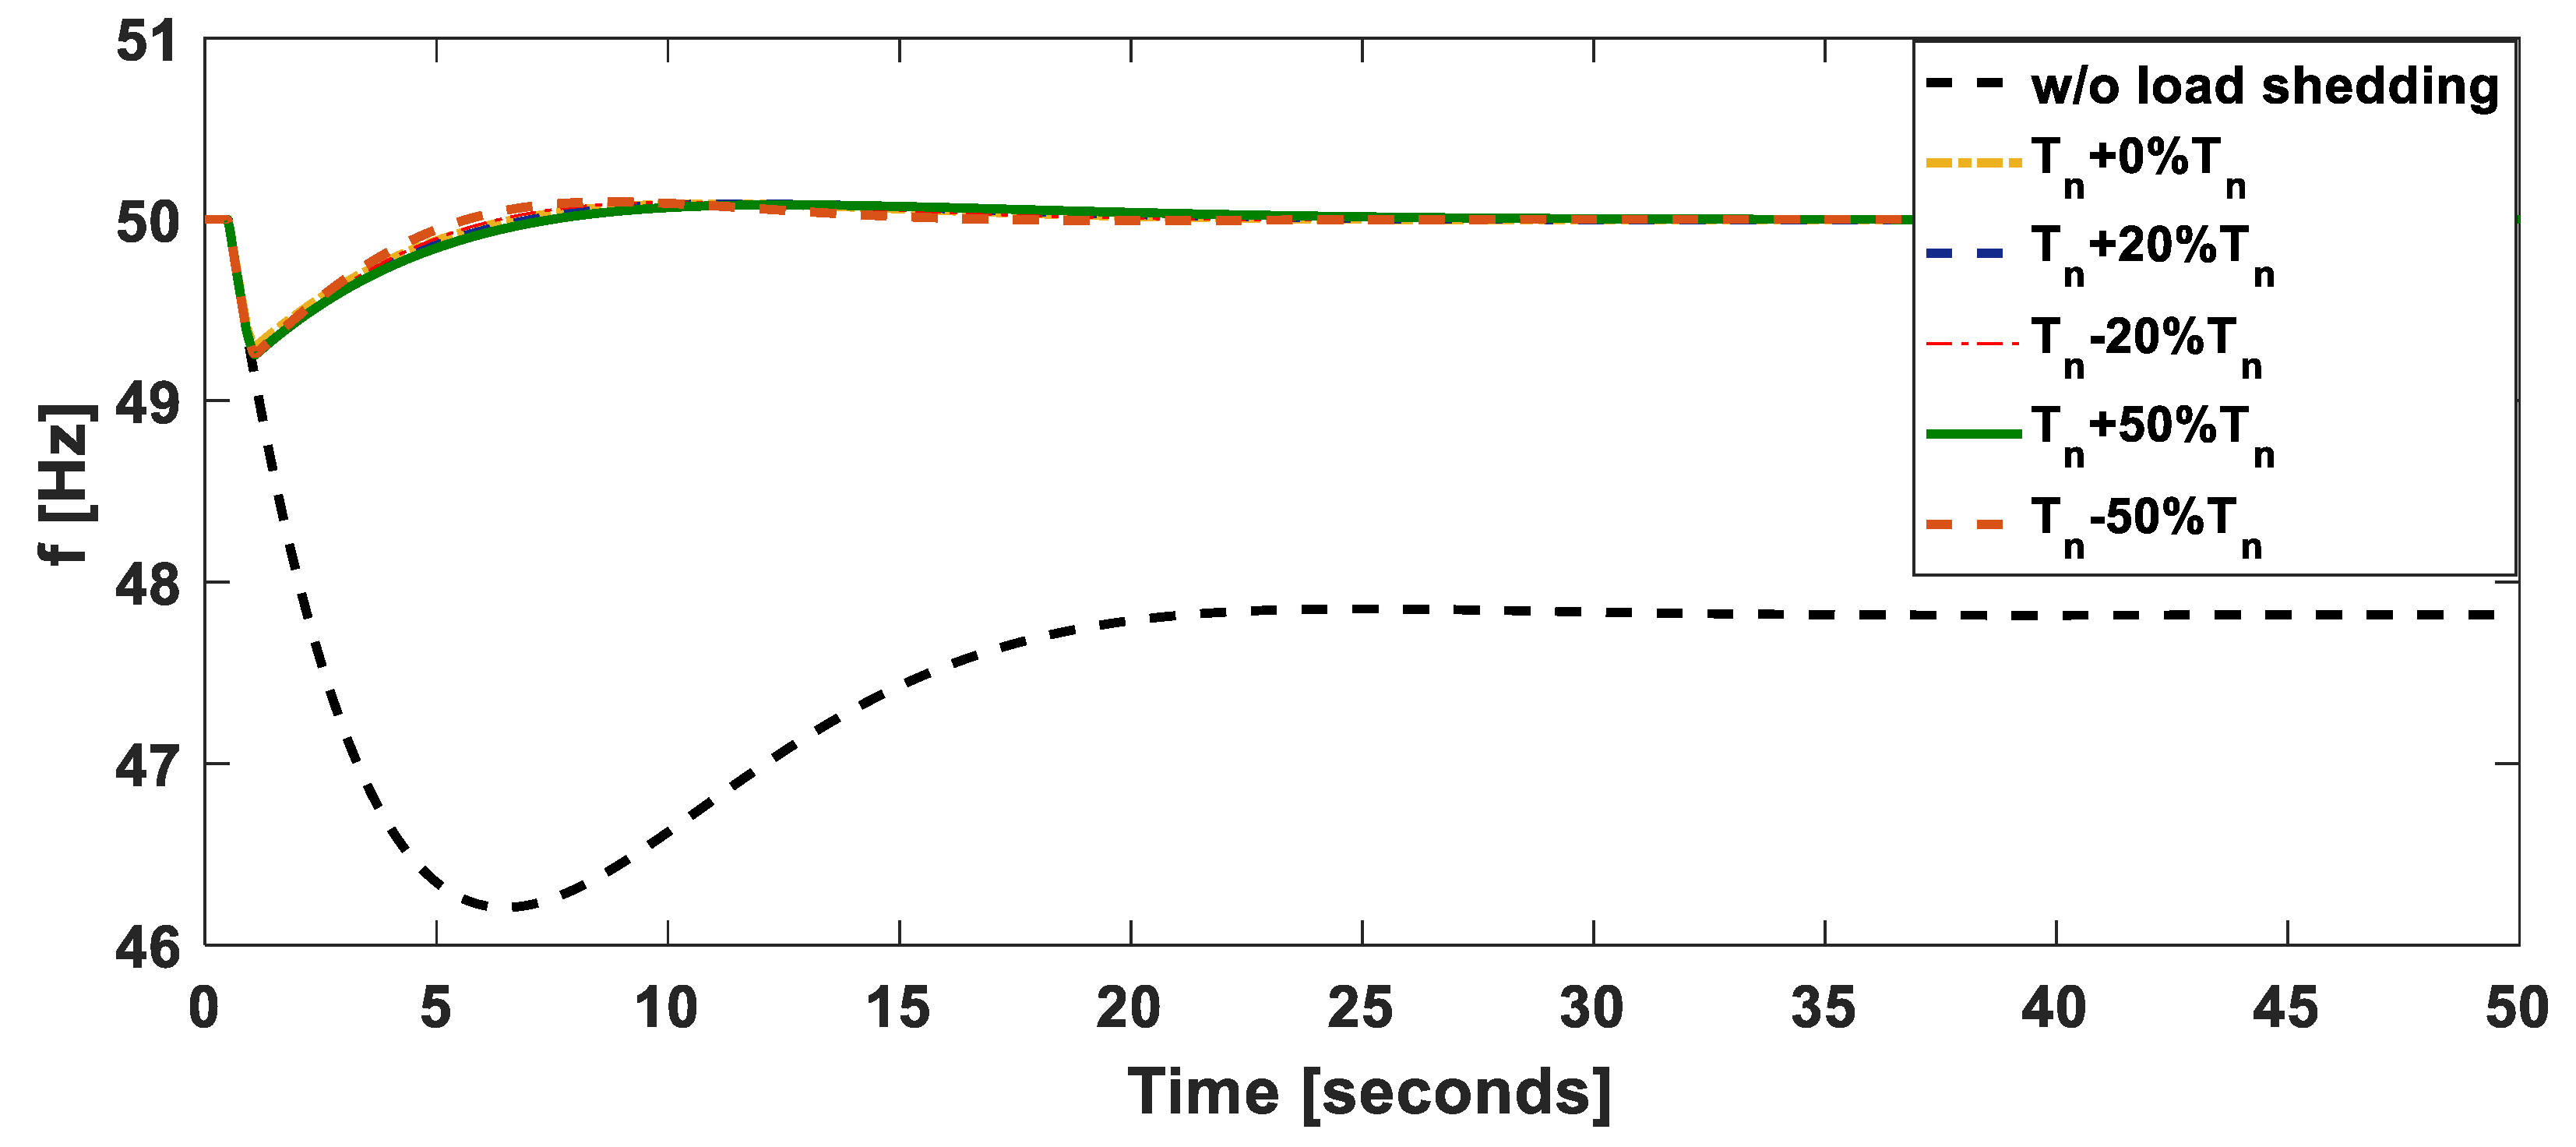
The SFR model is widely used in research to do with LFC as well as UFLS due to its simplicity and reduced computational burden. Studies also show that once the parameters are deduced the SFR models gives technically sound results. However, the process of obtaining these parameters is extensive and rigorous. From the additional simulations provided in our paper it can be seen from
Figure 15,
Figure 16 and
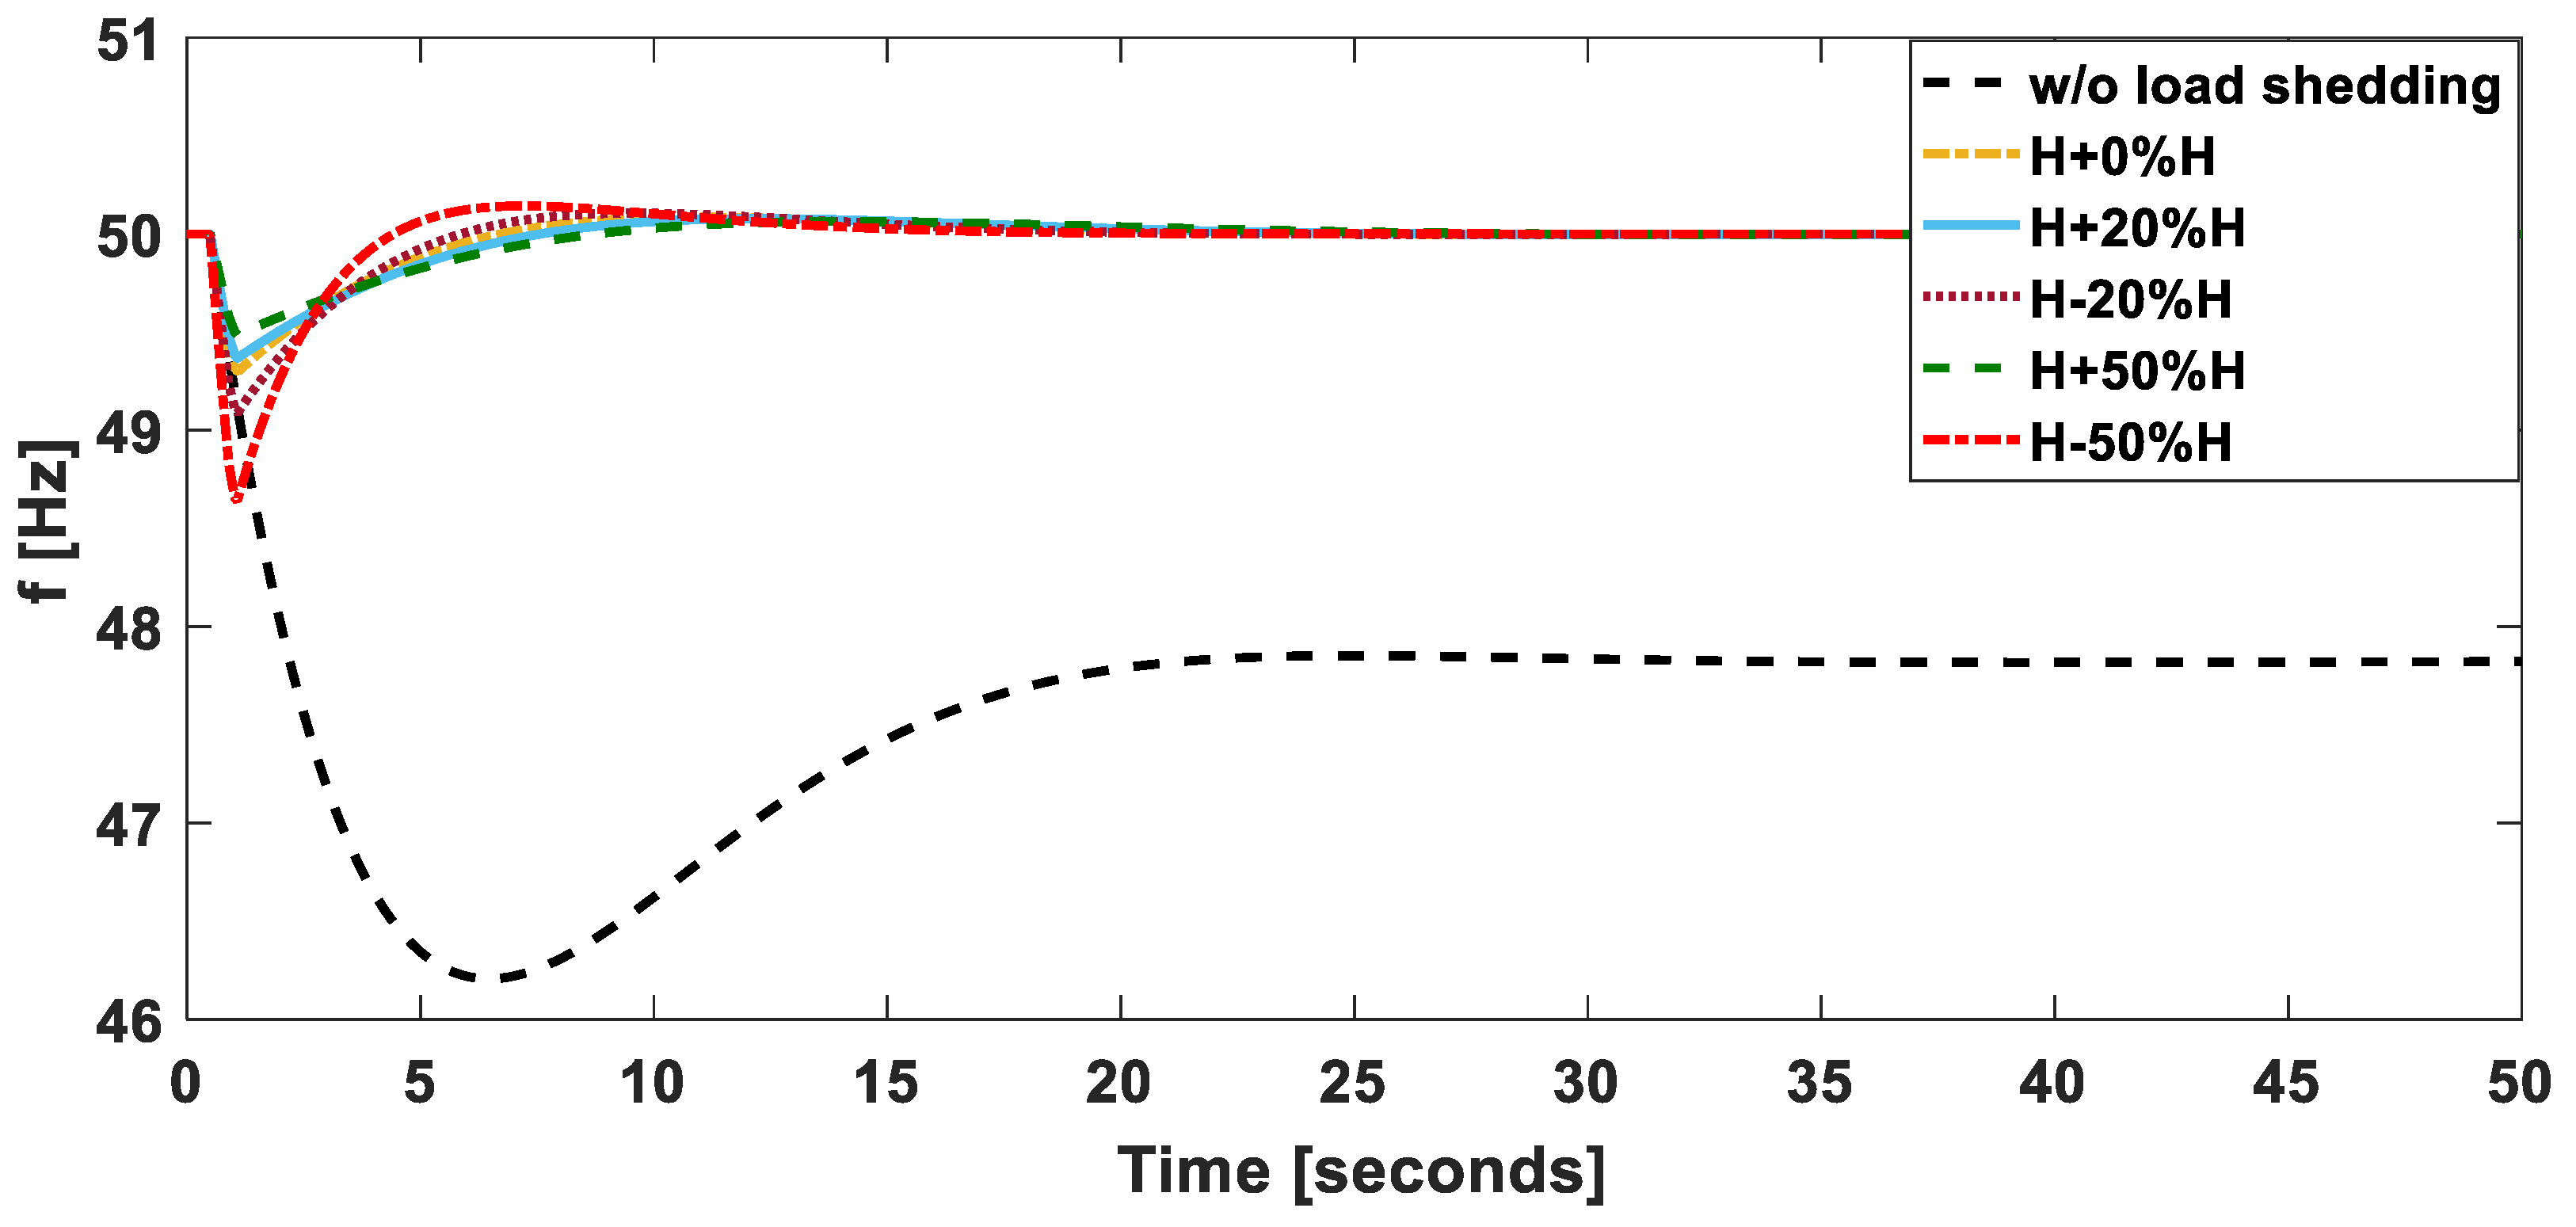
Figure 17 that the changes in some parameters such as the fraction of the total power generated by the HP turbine (F) and the time constant (T) due to uncertainties and inaccurate validation, have little effect on the overall frequency behavior. In our simulations, even a 50% change in F and T introduced slight changes to the frequency. This is due to the fact that the used gains were smaller compared to the overall introduced disturbance. Although the parameters T and F of the system can be accurately estimated and used in SFR model, the proposed technique has good performance in case of the uncertain estimation of these parameters. The proposed method is also tested under unusual variation in the total inertia of the system (under 10%), where its performance has been preserved. In addition to SFR model validation of the adopted system done in [
37], the aforementioned results verify that SFR model can be used in UFLS with high accuracy.

 ,
, 
