1. Introduction
Learning analytics (LA) refers to the processing and interpretation of a massive quantity and variety of information generated by students, in order to understand and optimise the learning process and environment [
1]. The information generated through this practice has increased in recent years, due to the growth of technology in educational processes. The implementation of virtuality and Internet use in these processes has produced what is known as the students’ digital footprint [
2]. The application of big-data techniques in educational settings is therefore a key element of LA [
3].
LA involves applying techniques derived from computing, sociology, and statistical psychology to analyse the data collected during the educational process. It is only used in educational practice [
4].
The origins of LA can be found in business analytics and data mining, which are focused on following up with potential clients. In [
5], it is stated that LA consists of the ‘measurement, collection, and analysis of information provided about students and their environment, in order to optimise the learning processes’. The technique allows great quantities of information to be used in managing and controlling students’ behaviour in the academic context. The improvements to be made in the optimisation of the learning process are based on the definition of patterns for decision-making [
6,
7]. With LA tools, it is possible to investigate what occurs within the black box of a virtual classroom and to identify the processes that are developed by students, using activity records.
Gathering data on the interaction between students, teachers and objects of learning is a complex task. Traditional approaches frame learning management systems (LMS) as data centres, but with the introduction of Web 2.0 functionality, those centres are no longer sufficient, due to activities taking place outside the model [
8]. This situation requires new methods for data gathering and analysis. Models must be adapted to incorporate customised academic data for each student, and to satisfy the needs being generated by the development of new educational patterns. A large quantity of information must be analysed to achieve a customised teaching process [
9].
The role played by LA in the analysis of a student’s information in virtual learning environments is fundamental for teachers, given that such information is generally not managed or evaluated otherwise. However, it must be noted that LA is also a technique that could be greatly useful for students, as it could provide feedback on their activities, thus supporting and improving their educational capabilities [
10]. It enables the identification of curricular impacts while fostering individual progress [
11].
Thus, the idea to develop a Sensor AnalyTIC Using LA for Subsequent Customised Tutoring was born. Sakai LMS [
12] was used to build the virtual classroom, PHP programming language was used in its development, and MySQL was selected as the database engine, because it is used by Sakai. The system was validated with a group of 39 students from the Cooperative University of Colombia. The present article is organized as follows: in
Section 2 (Background), we focus on the importance of LA as a key area of application in education, how the problem has been studied, and the methodology used for the development of the sensor is described below. The methodology used is Feature Drive Development, which is made up of six phases. In
Section 3 (Investigation Development), the process carried out for the development of the sensor and subsequent application of the solution is described; in
Section 4 (Results), the results found in the test performed with the sensor test group and the significance of the findings found are presented; in
Section 5 (Discussion), discussions are made around the topic and the application of the sensor in a real environment. Finally, in
Section 6 (Conclusions), established conclusions are reached for the development and subsequent testing of the sensor. We seek with this article to study and share experiences on the results of LA integration in daily educational practice [
13].
2. Background
LA is a decision-making tool for the teacher, as it tracks the footprint left by the student during the learning process and recorded in LMS through the use of smart devices, mobile phones, tablets and portables, as well as through participation in social media, photo blogs and chat rooms [
14]. Analytics produces real-time information; its goal is to strengthen and individualise the educational process for each student in each establishment, using measuring methods, collection models and database analysis that are contextualised according to specific interests, educational methods and the dynamics of virtual teaching. Therefore, LA should improve the educational system and the learning environment supported by information and communication technologies (ICTs) by incorporating sociological, psychological and statistical techniques, resources, and methods into the management and analysis of student data, and by allowing teachers to respond to specific situations [
15].
Teachers must rely upon information that is generated by students’ academic behaviour [
16].This information is useful for course evaluation, insofar as it helps to identify material that can continue to be used, and some of the causes of students’ academic difficulties. However, it would be too complex an activity to analyse massive quantities of information for each student and their academic activities. In this respect, LA plays a fundamental role in optimising that information through a process known as data distillation [
16]. which enables the filtering and evaluation of irrelevant information. Such filtering is necessary for proper decision-making.
When searching for the tools to process this information, [
17] mentions that one of the most important factors relates to collecting the correct information, a task that requires in-depth observation of student behaviour. Appropriate use of LA will be reflected in the educational customisation processes, as personal and institutional interpretations of their quality increase in relation to their content. Research in this area, which began in 2010, opens a wide field of application and study.
In the past, there has been some development of tools that apply concepts that substantiate and provide a rationale for LA. In reviewing these, we found some that focused on the teacher, and others that focus on the teacher–student relationship, and still others that focus on the student [
18]. Among those aimed at supporting decision-making for teachers, we found: (a) LOCOAnalyst, which offers teachers comments about students’ learning activities and performance; (b) Student Success System, which enables the identification and management of at-risk students; and (c) SNAPP, which visualises student relationships in discussion forums.
Among those with both teachers and students as the target audience, we found: (a) Student Inspector, which follows up (Who do you communicate with? What tool do you use to communicate?) on students’ interactions in the virtual learning environment; (b) GLASS, which offers a view of the individual student’s academic performance as compared to that of the group; (c) SAM, which shows what and how the student is doing academically, with the goal of improving their self-awareness; and (d) StepUp!, which seeks to encourage reflection on and awareness of the student’s own learning process.
Lastly, we have tools aimed at students, namely: (a) Course Signal, which seeks to improve student retention and to boost their results; and (b) Narcissus, which shows students their level of contribution to the group.
This review of the existing tools led to the identification of one of LA’s constraints, which is the complication that arises when adjusting for more relevant data. The question arose for how to manage the data, and how to model student and teacher behaviour, in order to enable the diagnosis and use of appropriate resources under diverse behavioural frameworks. Identifying this deficiency prompted us to embark on this project to develop a sensor that would: initially apply the four phases of LA; integrate and analyse the most significant student data in a Sakai virtual classroom; subsequently give the teacher enough information to create customised tutoring and adapted content for at-risk students. This content adaptation requires that the teacher have access to information that can prompt the modification of course materials by using different parameters and a set of defined guidelines [
19]. The first step in developing this tool was to generate an approximate description of the individual behaviour of each student in the course [
20]. It is important that educators use tools and methods that can improve students’ learning; LA offers potentially powerful ways to do so [
21]. After identifying these tools, we defined the need to resolve this deficiency in the applicability of LA, by developing a sensor.
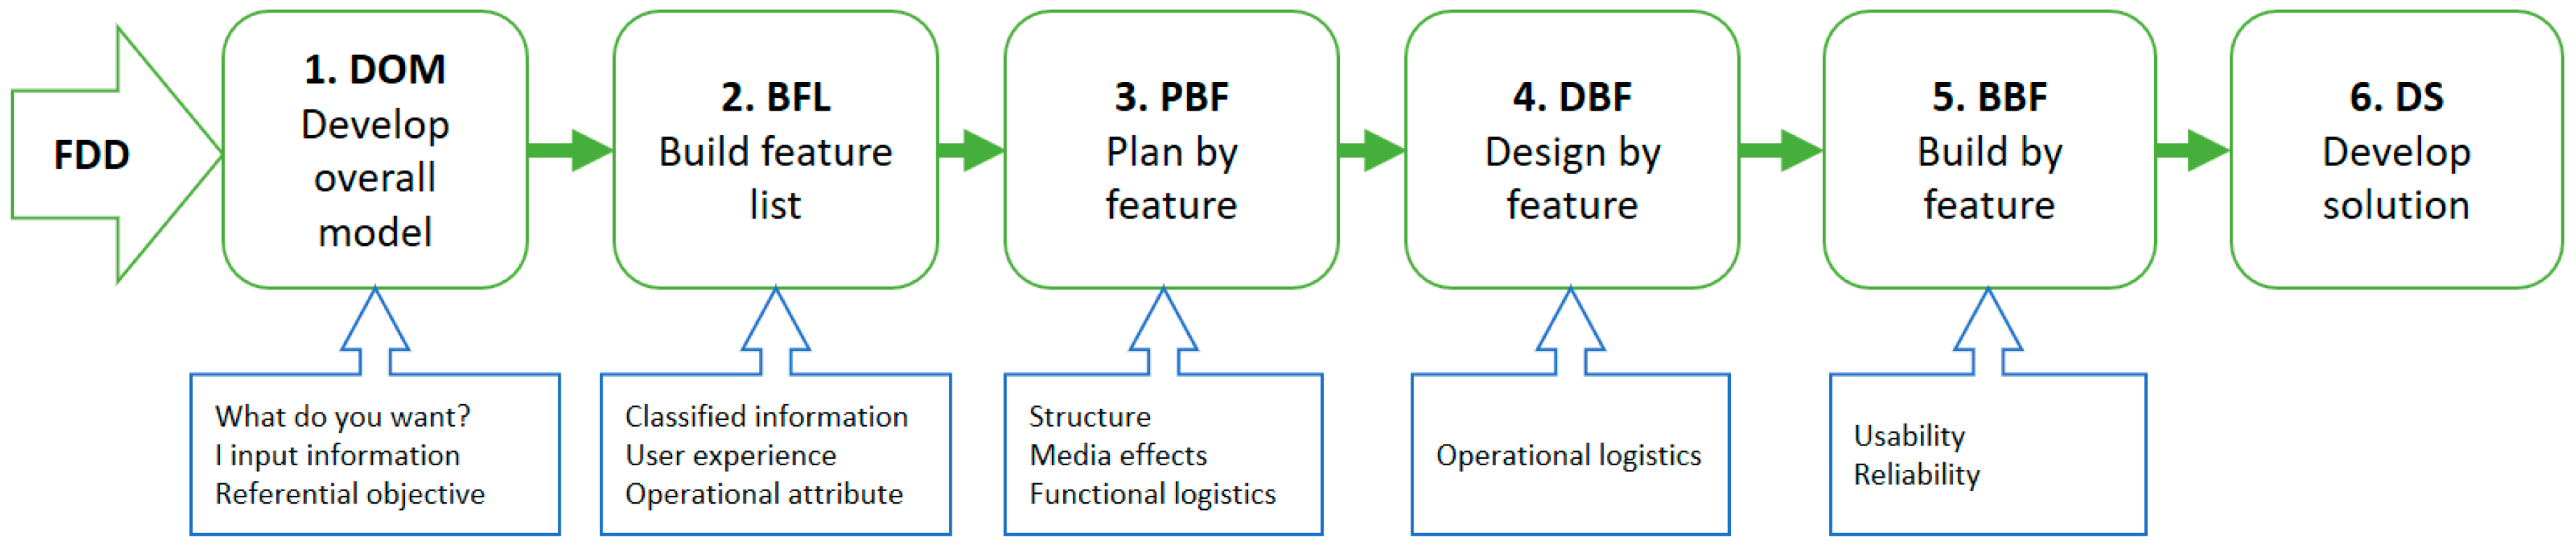
The development of a sensor that incorporated LA and could be employed to monitor struggling students in a virtual classroom was operatively contextualised by using agile methods with a logical base. These methods were focused on building a software unit that was defined by small group structures, limited players, changes validated by the user’s specific requests, and generic heuristic considerations regarding the logistics of the environment, where the finished product was intended to be used. After evaluating the main methodologies that verify the aforementioned factors, the method we chose, based on its logical significance as presented in
Figure 1, was Feature Drive Development (FDD) [
22]. This method was the road map for developing the system.
After we analysed the application’s target group, which was made up of teachers and students participating in the teaching–learning process, we identified the following activities as bases for joint consultation and assessment:
Familiarisation and contextualisation: Knowledge of the learning process, phenomenological awareness of the process, and gathering of information.
Functional outline of the solution: ‘What is desired, what will be revealed and why will it be revealed?’
Comprehensive projection of the solution outline: Modelling, prototype design, logical construction, user assessment, comprehensive adjustment, and installation of the solution.
2.1. Systemic Contextualisation of the Problem
In this phase, the analytical field of action and the situational study were investigated to provide answers to these questions: ‘What is desired? How will it be accomplished? Who will use it? How will its quality be supported and validated?’
The goal was to build a software tool that, by applying the four LA phases defined by [
23], would function as a logical sensor, enabling the teacher of a virtual course to identify students with learning difficulties by reviewing their grades to date. Subsequently, the teacher would be able to identify the characteristics of the student group, including the predominant learning style [
24], in order to prepare customised tutoring for struggling students, and to adapt the material in use in the virtual classroom, thus improving academic performance and consequently reducing the dropout rate for virtual learning environments.
To this end, we proposed that we would design a virtual classroom, and then develop software that would integrate the four LA phases to create a test of students’ predominant learning styles. The design and implementation of the virtual classroom was conducted in LMS Sakai [
12], the development tool was the PHP programming language [
25], and HTML5 and CSS were used for the layout.
The software would have two user profile specifications (Teacher and Student), which would allow for system validation in a real context. Additionally, it would enable students to see how they were performing and to compare their results with those of the group. This type of peer comparison is important in improving academic performance [
26].
Prior to our identification of the problem and the subsequent conception of a possible solution, our research showed that the LA tools and systems designed to date did not include these four established phases, nor were said phases later used to prepare a customised tutoring process that would improve the academic performance of students struggling with the course [
27],or as a real tool providing the teacher with information for decision-making; in this case, to adapt the course material being shared with students in the virtual classroom [
28]. It is important for the teacher to be able to identify which elements and/or objects have interested the students in the past, in order to develop similar content [
29,
30].
2.2. Classification of Information and Operational Implementation
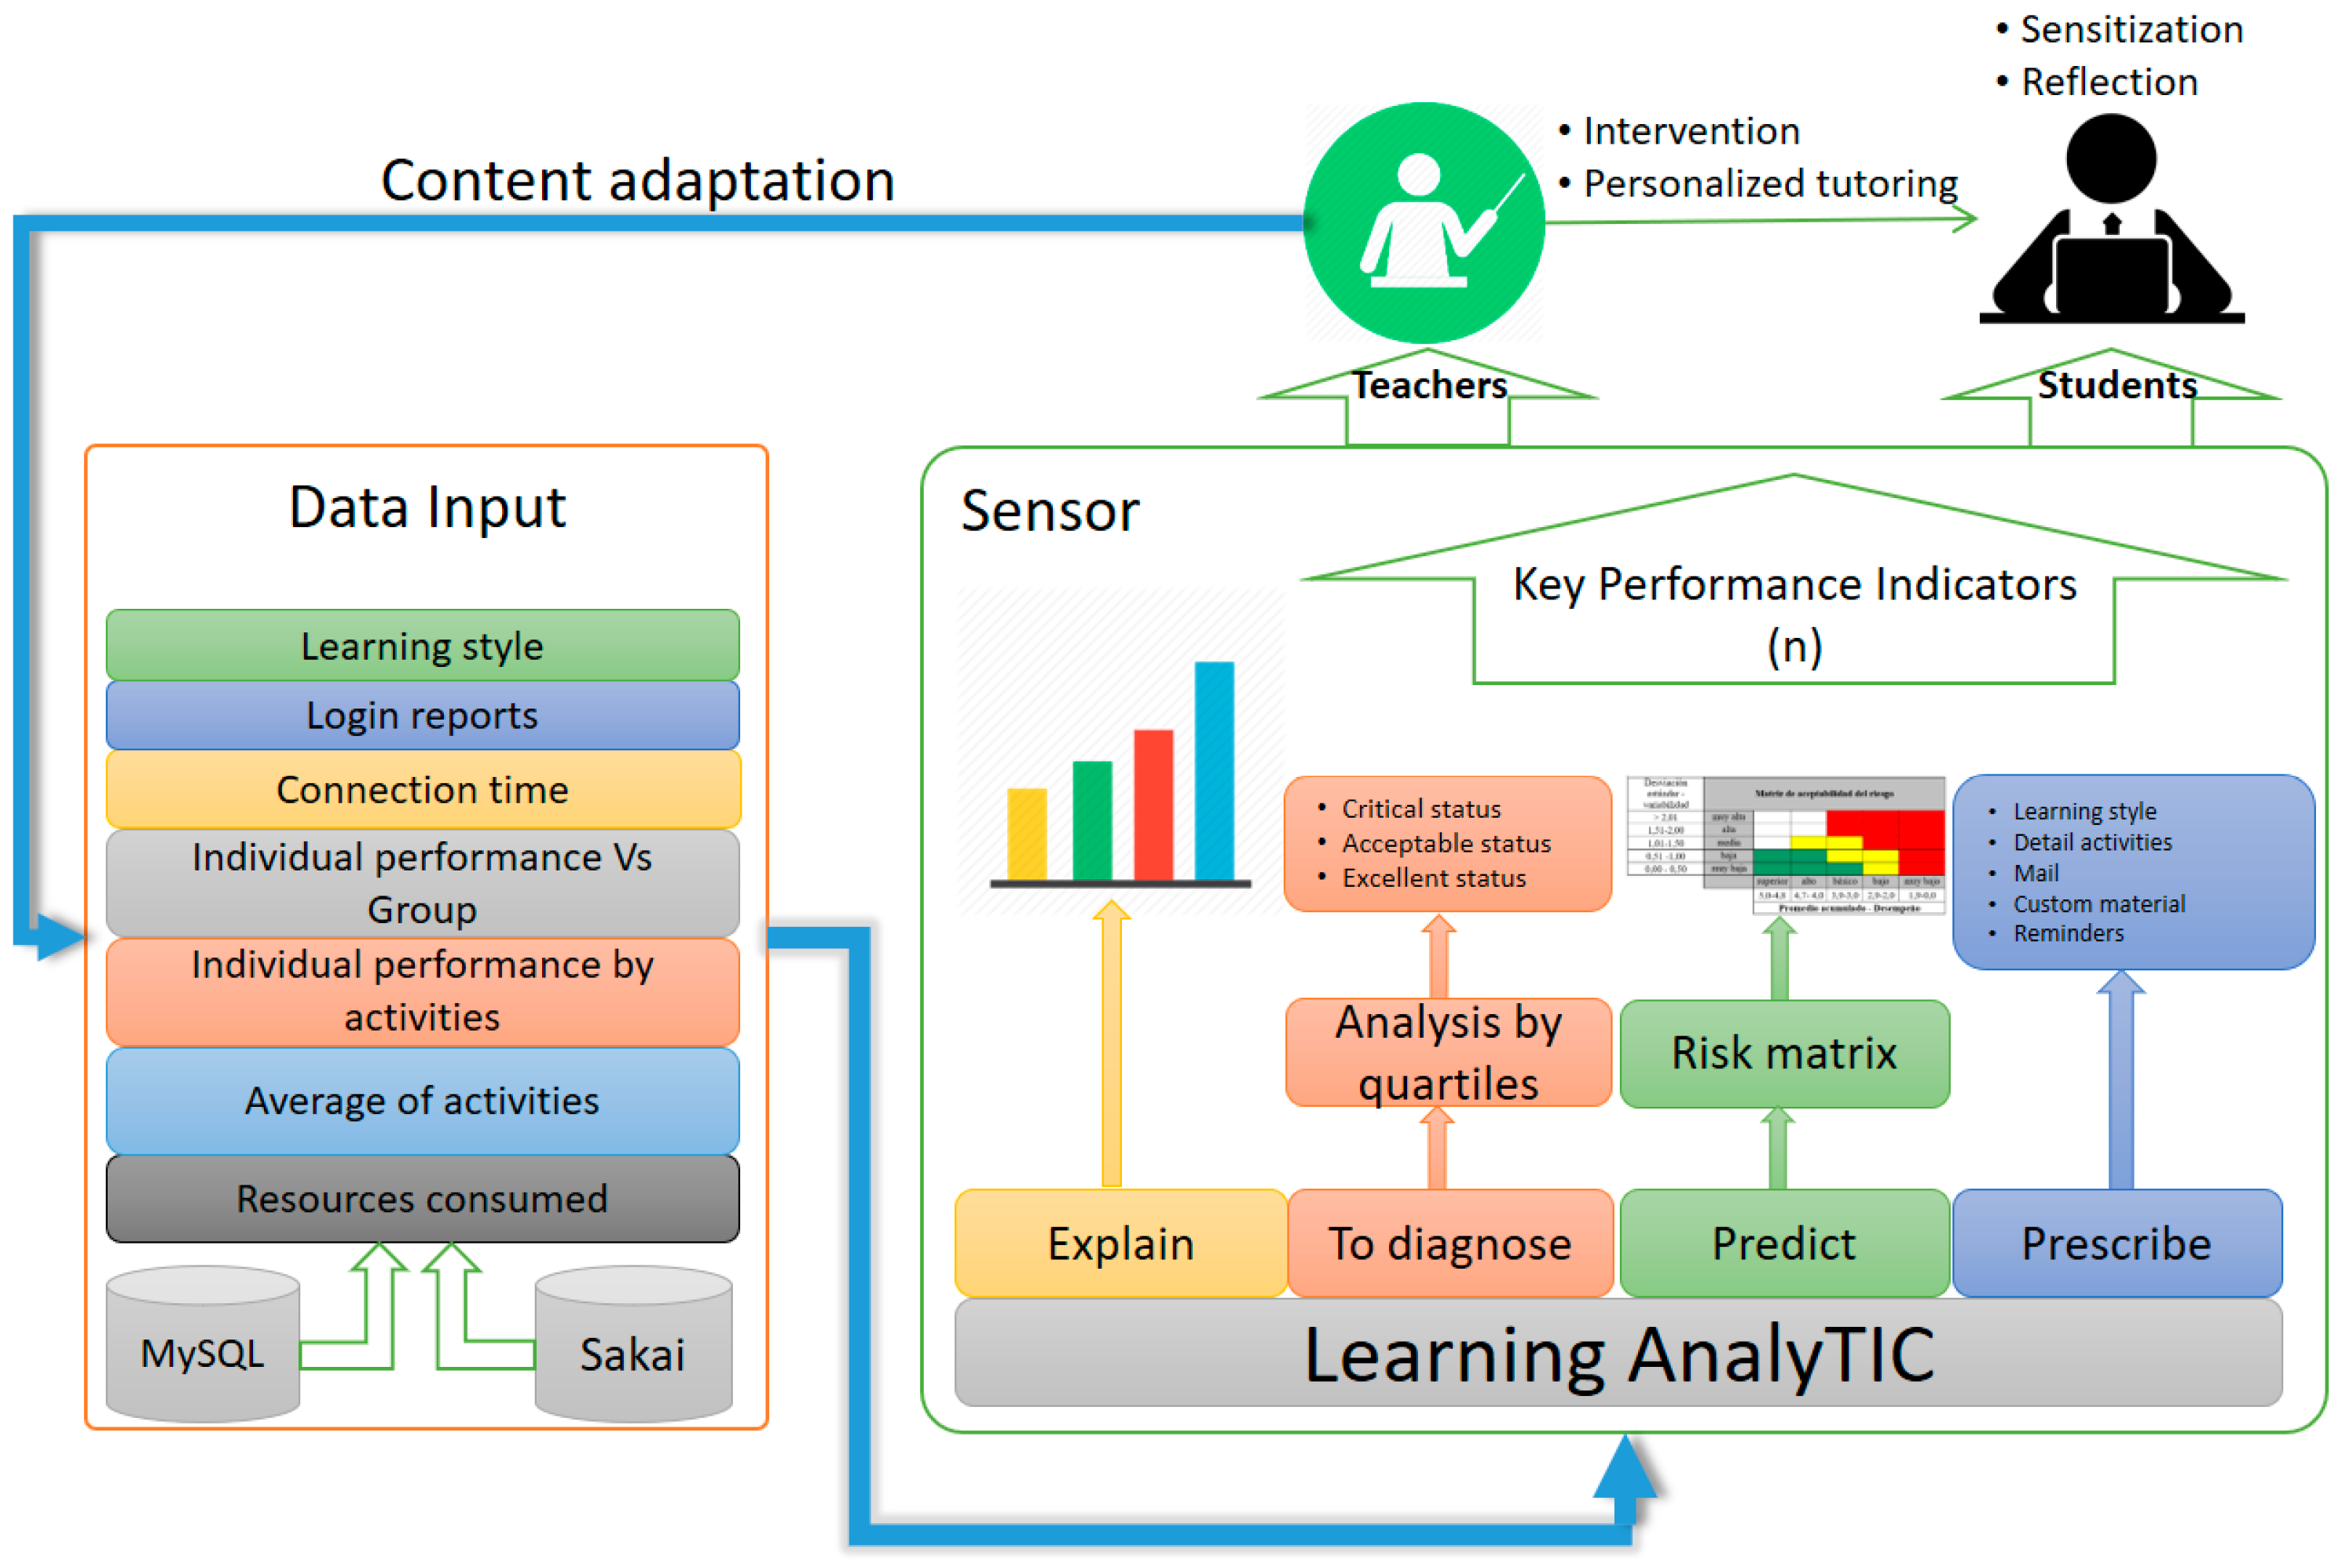
After diagramming the prospective action scenario, we proceeded to catalogue the data according to its focus, thus establishing the set of tools that were needed to define and classify the requirements for applying the four LA phases, identifying which input data would be considered, and establishing the output that would serve as indicators for the sensor’s corresponding alerts.
Based on the work by [
4], the information to be considered encompassed:
This information would be extracted from the student activity in the virtual classroom, in compliance with the first phase of LA, Explain the Data. The following phase would indicate the reason behind the data, and the third phase would deal with predicting and/or estimating a student’s grades for the course. Lastly, the Prescription phase would outline customised tutoring options for students considered to be struggling to obtain the desired average.
2.3. Sizing Up the Technology
In this phase, we reviewed and strengthened the impacts of various existing technologies, to identify the most appropriate one for our purposes. Given our established requirements, we opted for development in a license-free environment. Accordingly, we chose to develop the sensor by using Sakai LMS initially, as this is an open source project. For the same reason, we decided on PHP as the programming language, MySQL as the database engine, Apache as the web server, and HTML5 and CSS.
3. Investigation Development
3.1. Construction of the Prototype and Projection of the Modular Structure
In this phase, the Sensor’s general operation was established, and the considerations for technological implementation were incorporated, though not in excessive detail. System components that addressed the aforementioned functions were also designed. Construction of the prototype and its projection of the modular structure were diagrammed to describe the interaction between the parts and the sequencing in greater depth.
Figure 2 shows the components of the design.
The virtual classroom in which the sensor would be tested was built in Sakai LMS, working with the MySQL database engine. The data inputs to be taken from the virtual classroom were established as: Learning Style, Login Reports, Total Connection Time, Individual Student Performance vs. Group Performance, Individual Performance by Activity, Activity Average, and finally, and Resources Consumed (i.e., by the student). These resources included the reading of content, participation in chat rooms, tests taken, consumption of web content, the reading of the syllabus, evaluations sent, wiki participation, and forum participation, among others.
This data was addressed in the following LA phases:
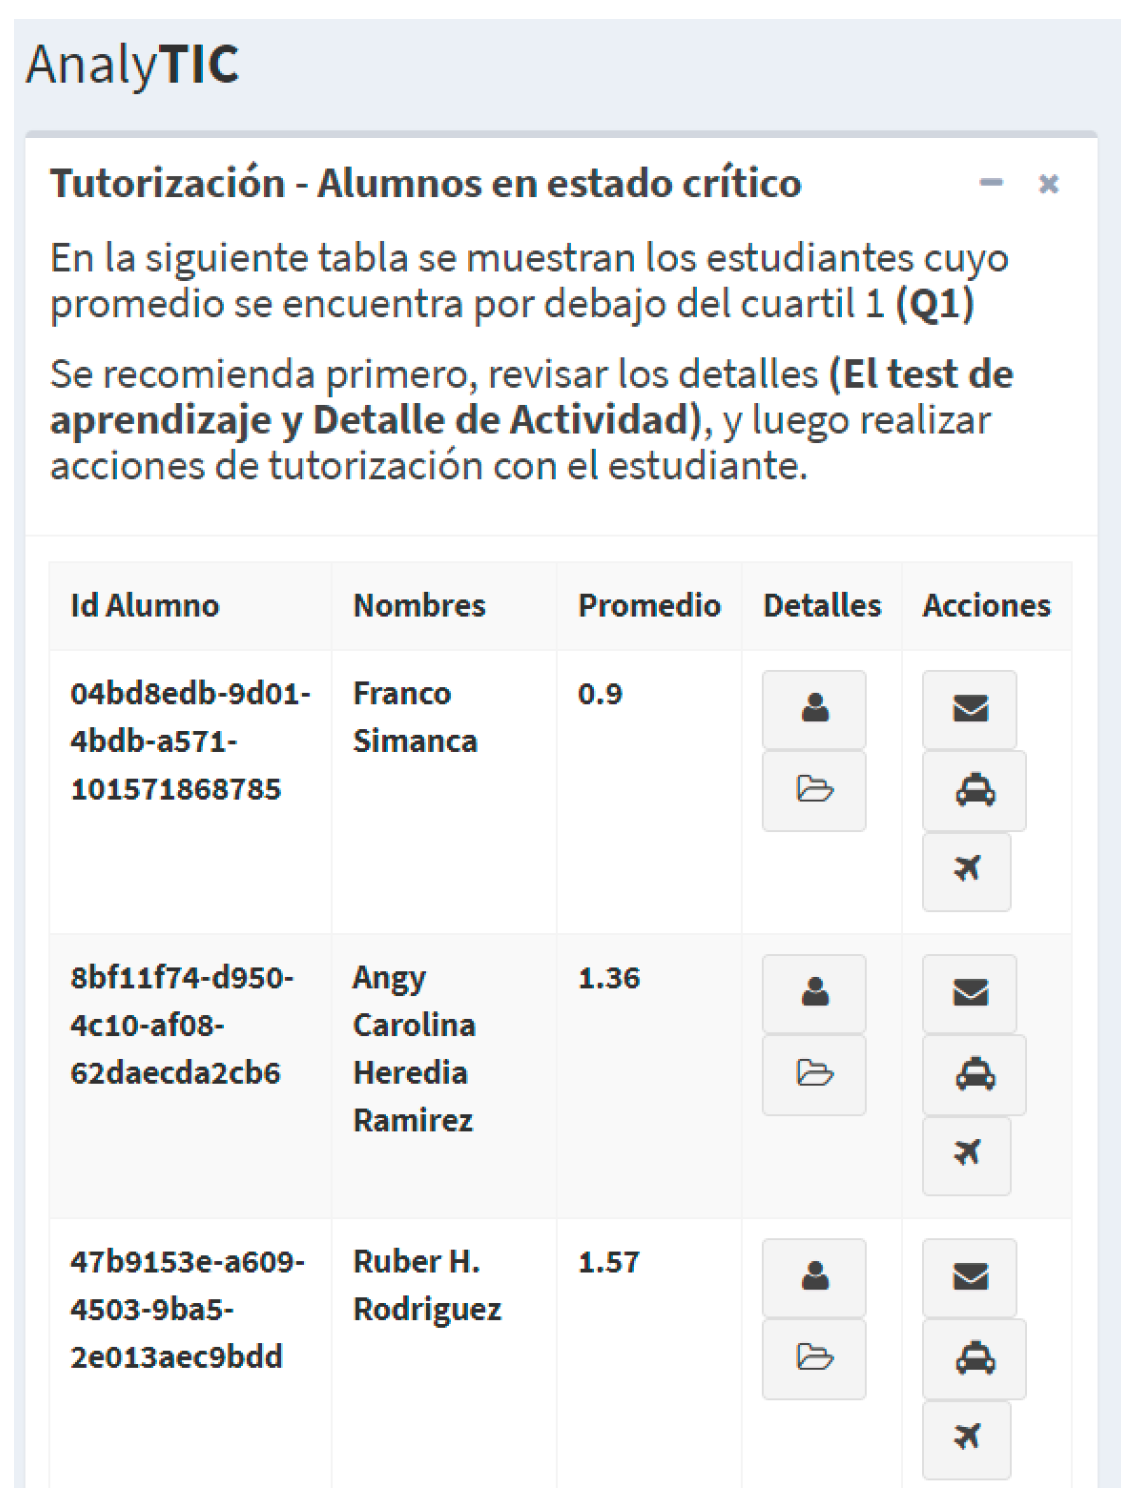
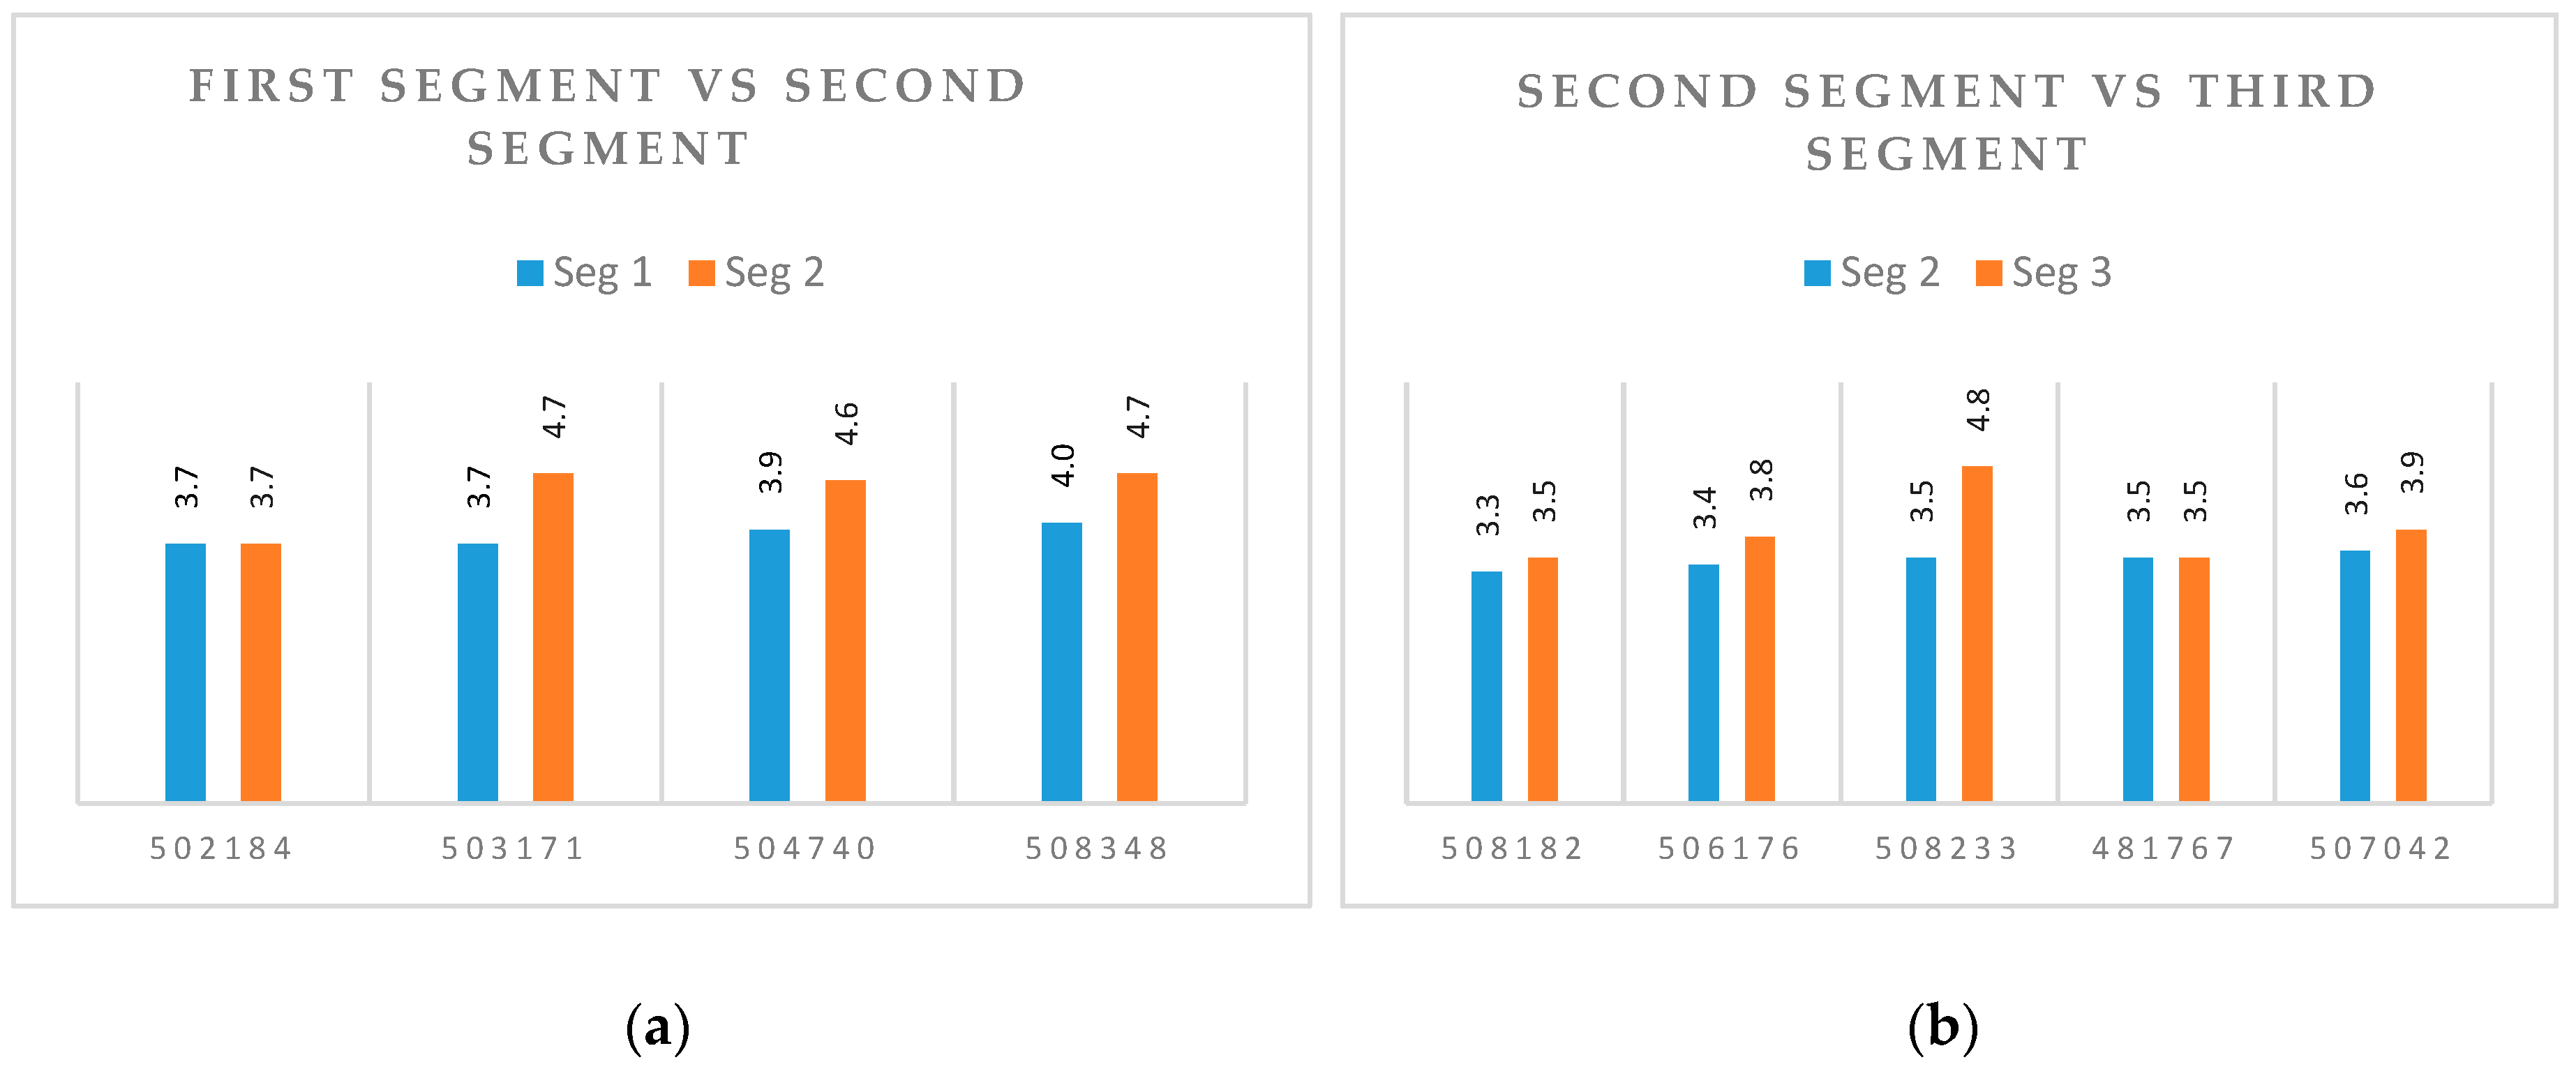
Explanation: Here, the teacher is shown a student’s footprint in the virtual classroom. These data are important for understanding academic performance. They are generally presented using graphs and tables.
Diagnosis: The student group is divided into quartiles, with each student located and identified within a quartile.
Prediction: This stage features a risk assessment matrix that was designed to allow the teacher to review each student individually, and to identify which ones might possibly fail the course.
Prescription: Here, the teacher can analyse a student’s predominant learning style, see which sources have been used, send emails, send additional study material, or send reminders for activities that are still pending.
The analysis of data gathered in the virtual classroom, and the subsequent application of these stages will result in a performance indicator for the student, which is the average grade to date. This indicator will have a dual purpose for the teacher: (a) it will assist the teacher in outlining customised tutoring options for students at risk of failing the course, which will be an expected performance improvement measure, and (b) it will prompt the teacher to do a review of the content and planning of course activities. This will occur because the teacher is able to answer the following questions: ‘What is the student’s predominant learning style?’ ‘Which resources are the participants consuming?’ ‘Are they reading more?’ ‘Are they participating in forums?’ and ‘Are they watching videos?’ These two previous steps should lead, in turn, to an adaptation of content and methodology, in order to again validate the data, and to boost the students’ academic performance.
3.2. Functional and Operational Modular Description
The Sensor was designed to apply the four phases of LA (Explain, Diagnose, Predict, and Prescribe). In accordance with the model designed for customised tutoring and subsequent improvement of student academic performance, the modules developed in the tool were:
Server
Level 1—Explanation
Level 2—Diagnosis
Level 3—Prediction
Level 4—Prescription
Documentation
Quick Overview
3.2.1. Server Module
This module has two options:
Server setting. This option shows the address for the Sakai virtual classroom database, along with the user, password, database name and the group to be analysed.
Update setting. This form is used for changing the server by entering one’s name or IP address, then the user ID, password, appropriate database, and course. This is an important step in the correct analysis of the information.
3.2.2. Level 1 Module Explanation
In this module, the point is to obtain answers to these questions about student interaction: ‘What has happened until now?’ and ‘What is currently happening in the virtual classroom?’
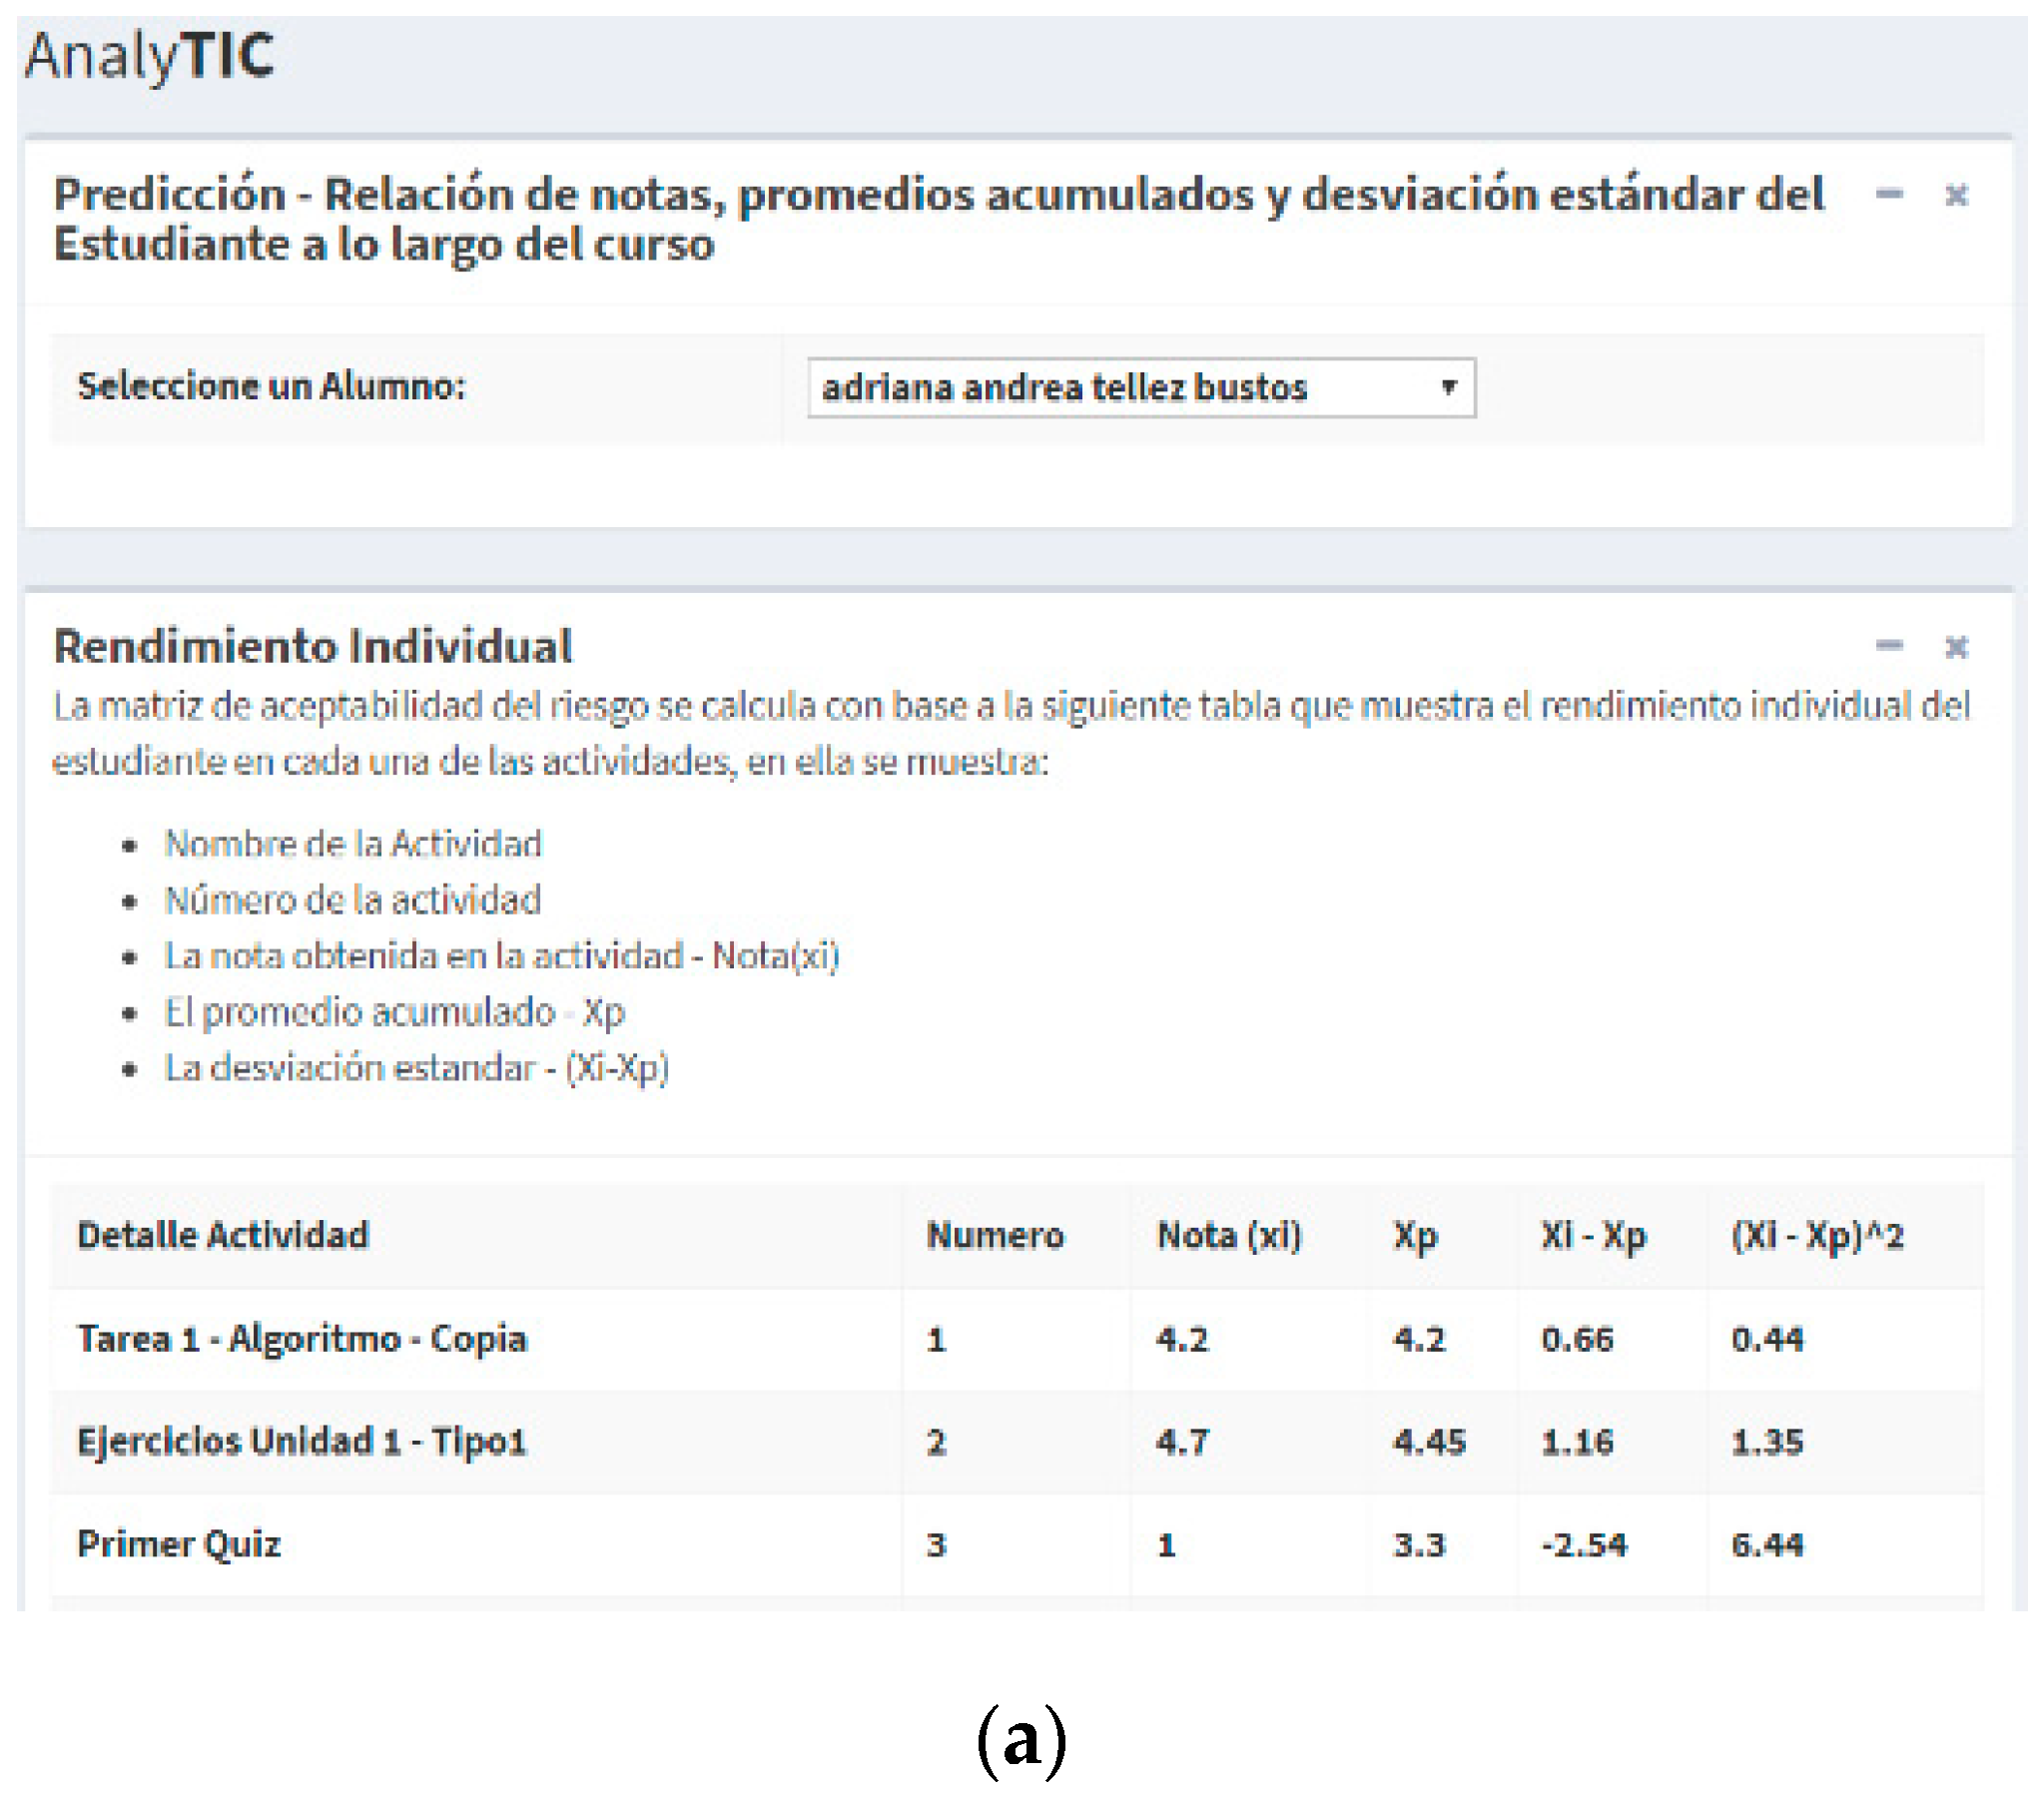
The module addresses these questions by showing measures of students’ behaviour in the virtual classroom, including connection frequency, total connection times, individual performance versus the group average, individual performance reports, activity reports, activity averages, and students’ use of different classroom resources [
31].
3.2.3. Level 2 Module—Diagnosis
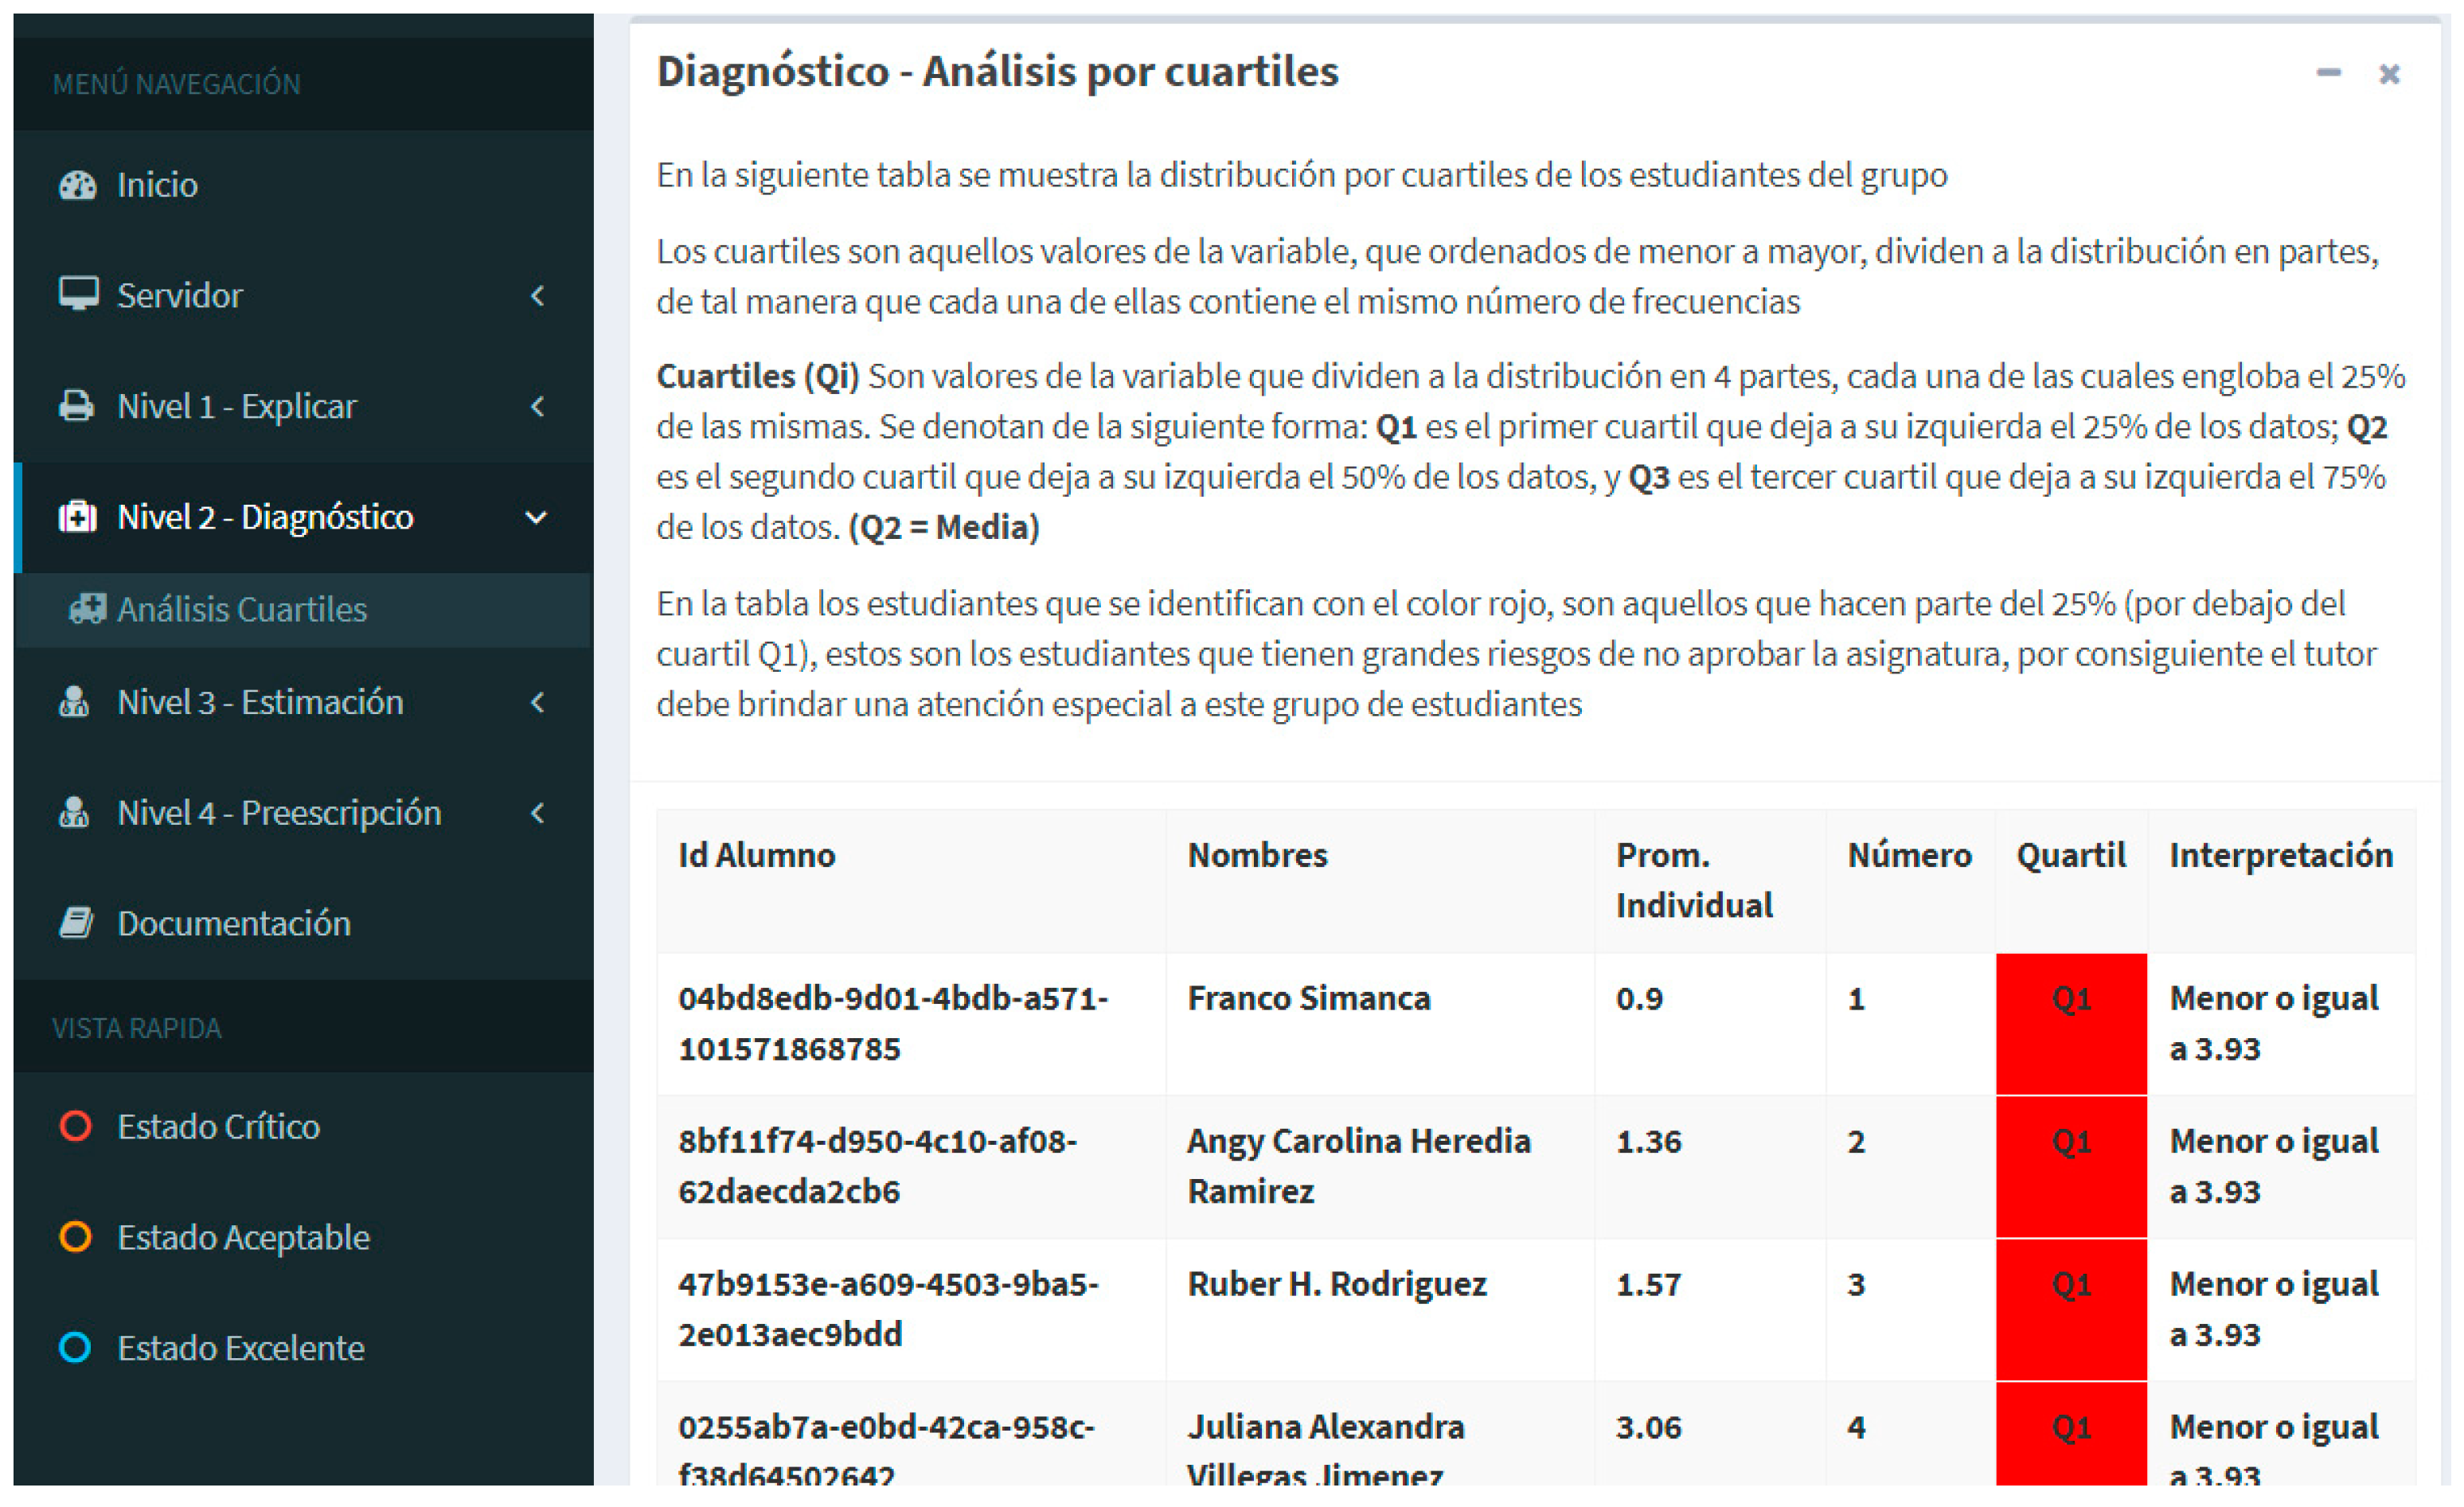
This phase of LA analyses past and present data. It answers the questions ‘How and why did this situation happen before?’ and ‘How and why is it happening now?’
The quartile distribution presented in this module allows the teacher to perform a diagnosis of the students’ current situations. Those that are in the first quartile are at a critical stage, while those in the second and third quartiles are in an acceptable state.
The quartiles are values obtained from a data set structured according to a four-part division, as follows:
The first quartile, represented by Q1, corresponds to a value that obtained from a data set in which 25% of the data is lower than Q1; it can also be stated that 75% of the data is higher than Q1. The first quartile represents the 25th percentile of the sample.
The third quartile, Q3, corresponds to a value obtained from a data set in which 75% of the data is lower than Q3; it can also be said that 25% of the data is higher than Q3. The third quartile represents the 75th percentile of the sample.
These position measures allow the student to be located in a specific place within the group according to their average as compared to the averages of the other students.
The mathematical average was established as the core measure of a central trend; however, it must not be the sole indicator of a teaching–learning process, as it depends on the number of grades accumulated and the number of grades still to be obtained. Therefore, the level of progress and the number of grades in the module or course must also be taken into account.
As the virtual module proceeds, there are activities and assessments taking place. These result in corresponding grades. The number of grades that are needed in order to obtain each student’s average might differ from one course to another, or from one module to the next. This would indicate that the chances of each student’s individual average improving or deteriorating will depend on the grades that are obtained from the remaining activities, or the assessments that are involved in the evaluation process.
3.2.4. Level 3 Module—Prediction
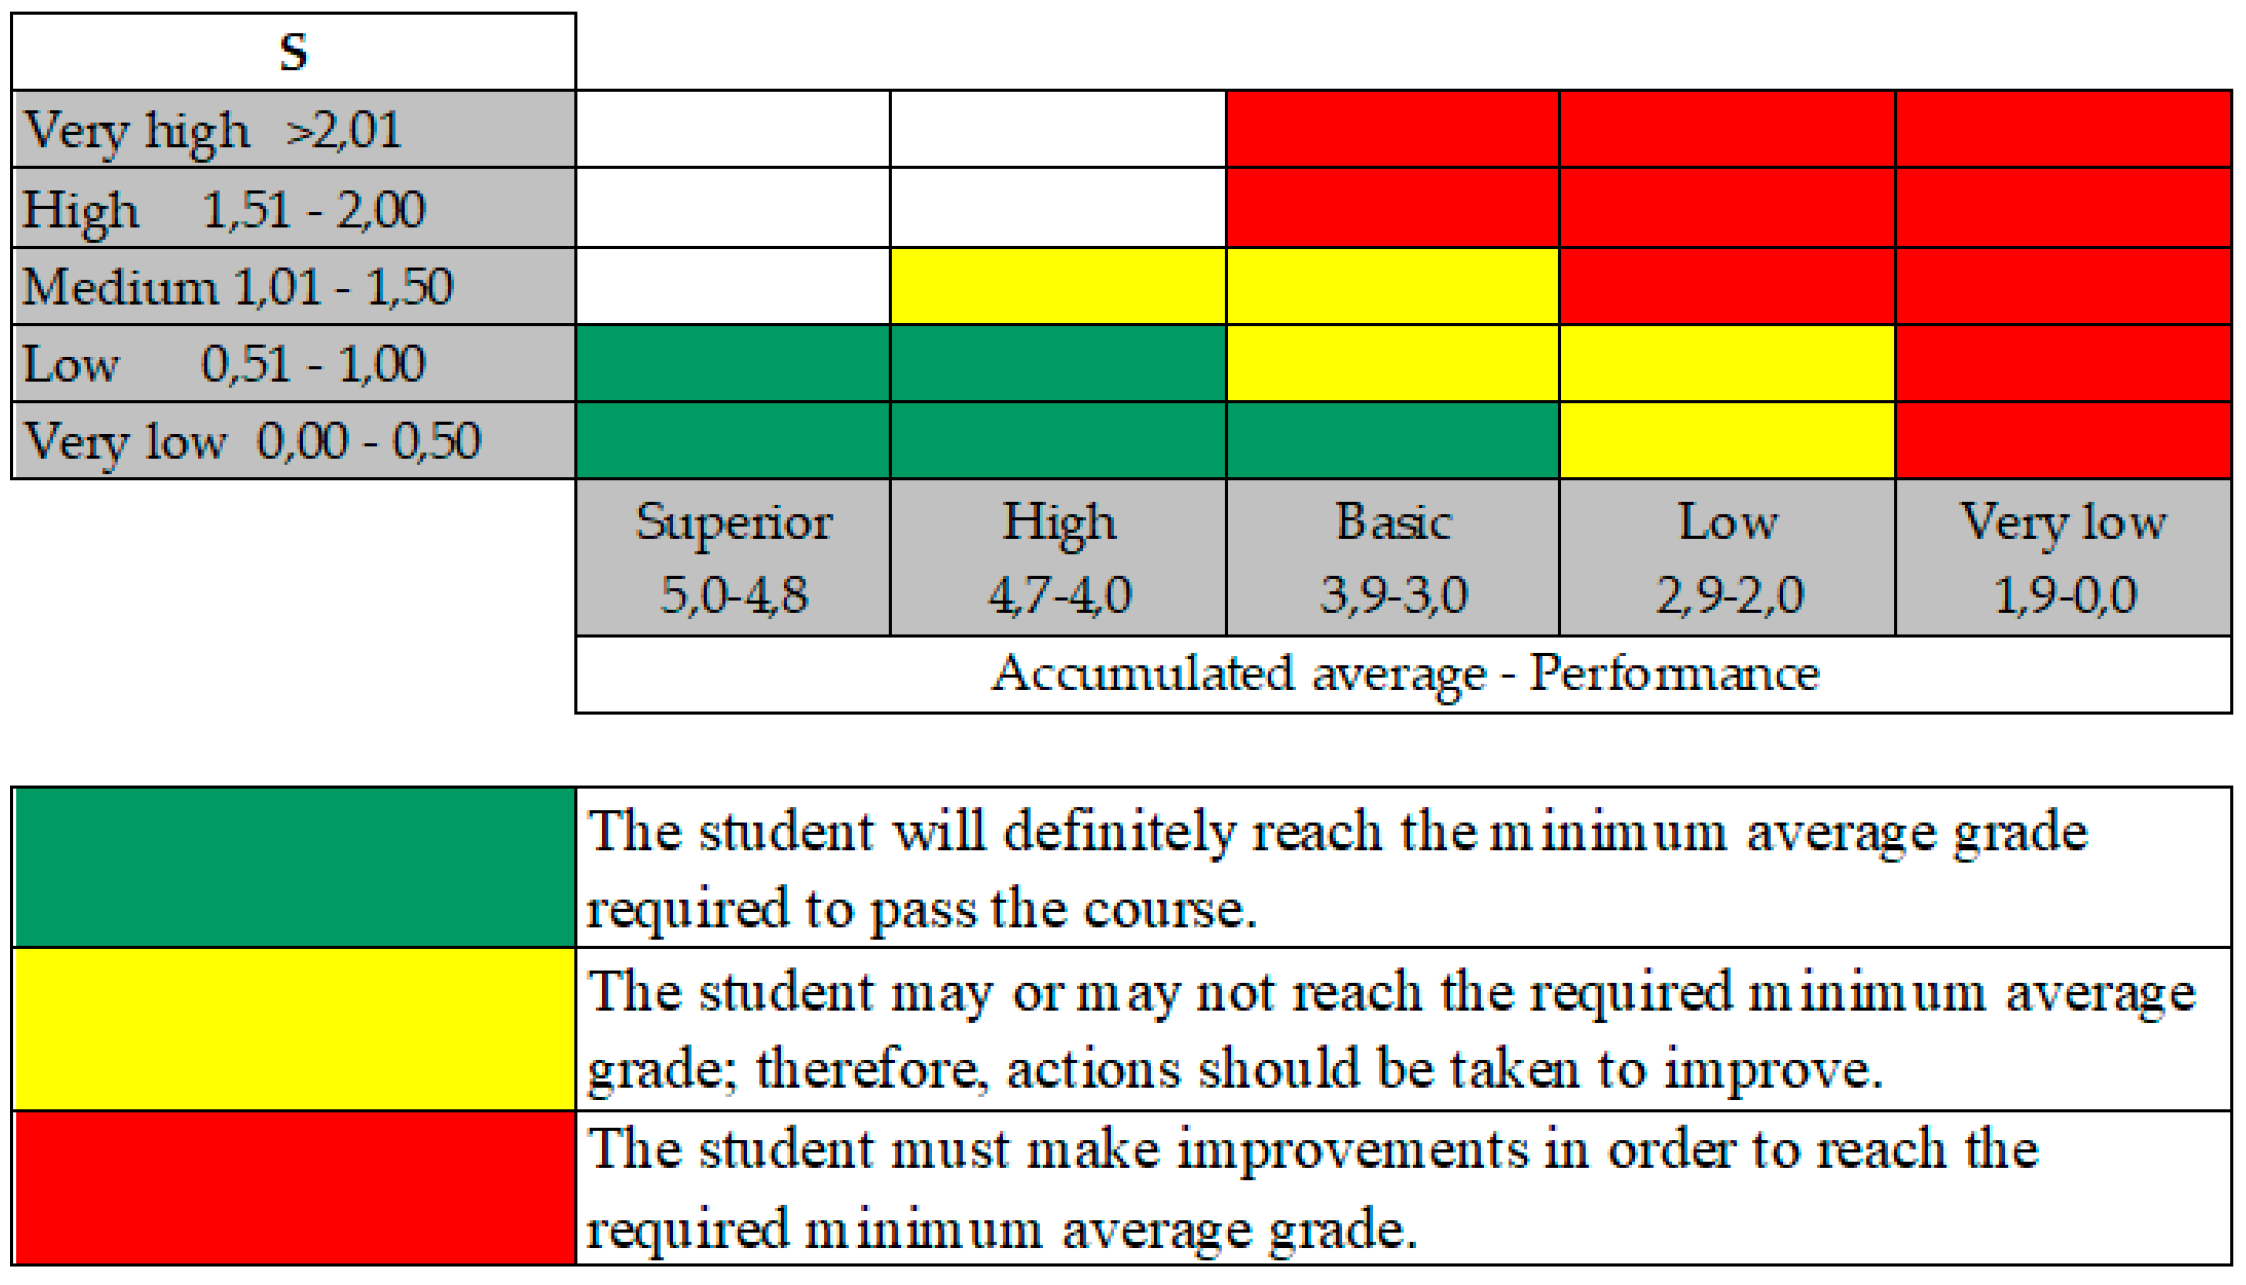
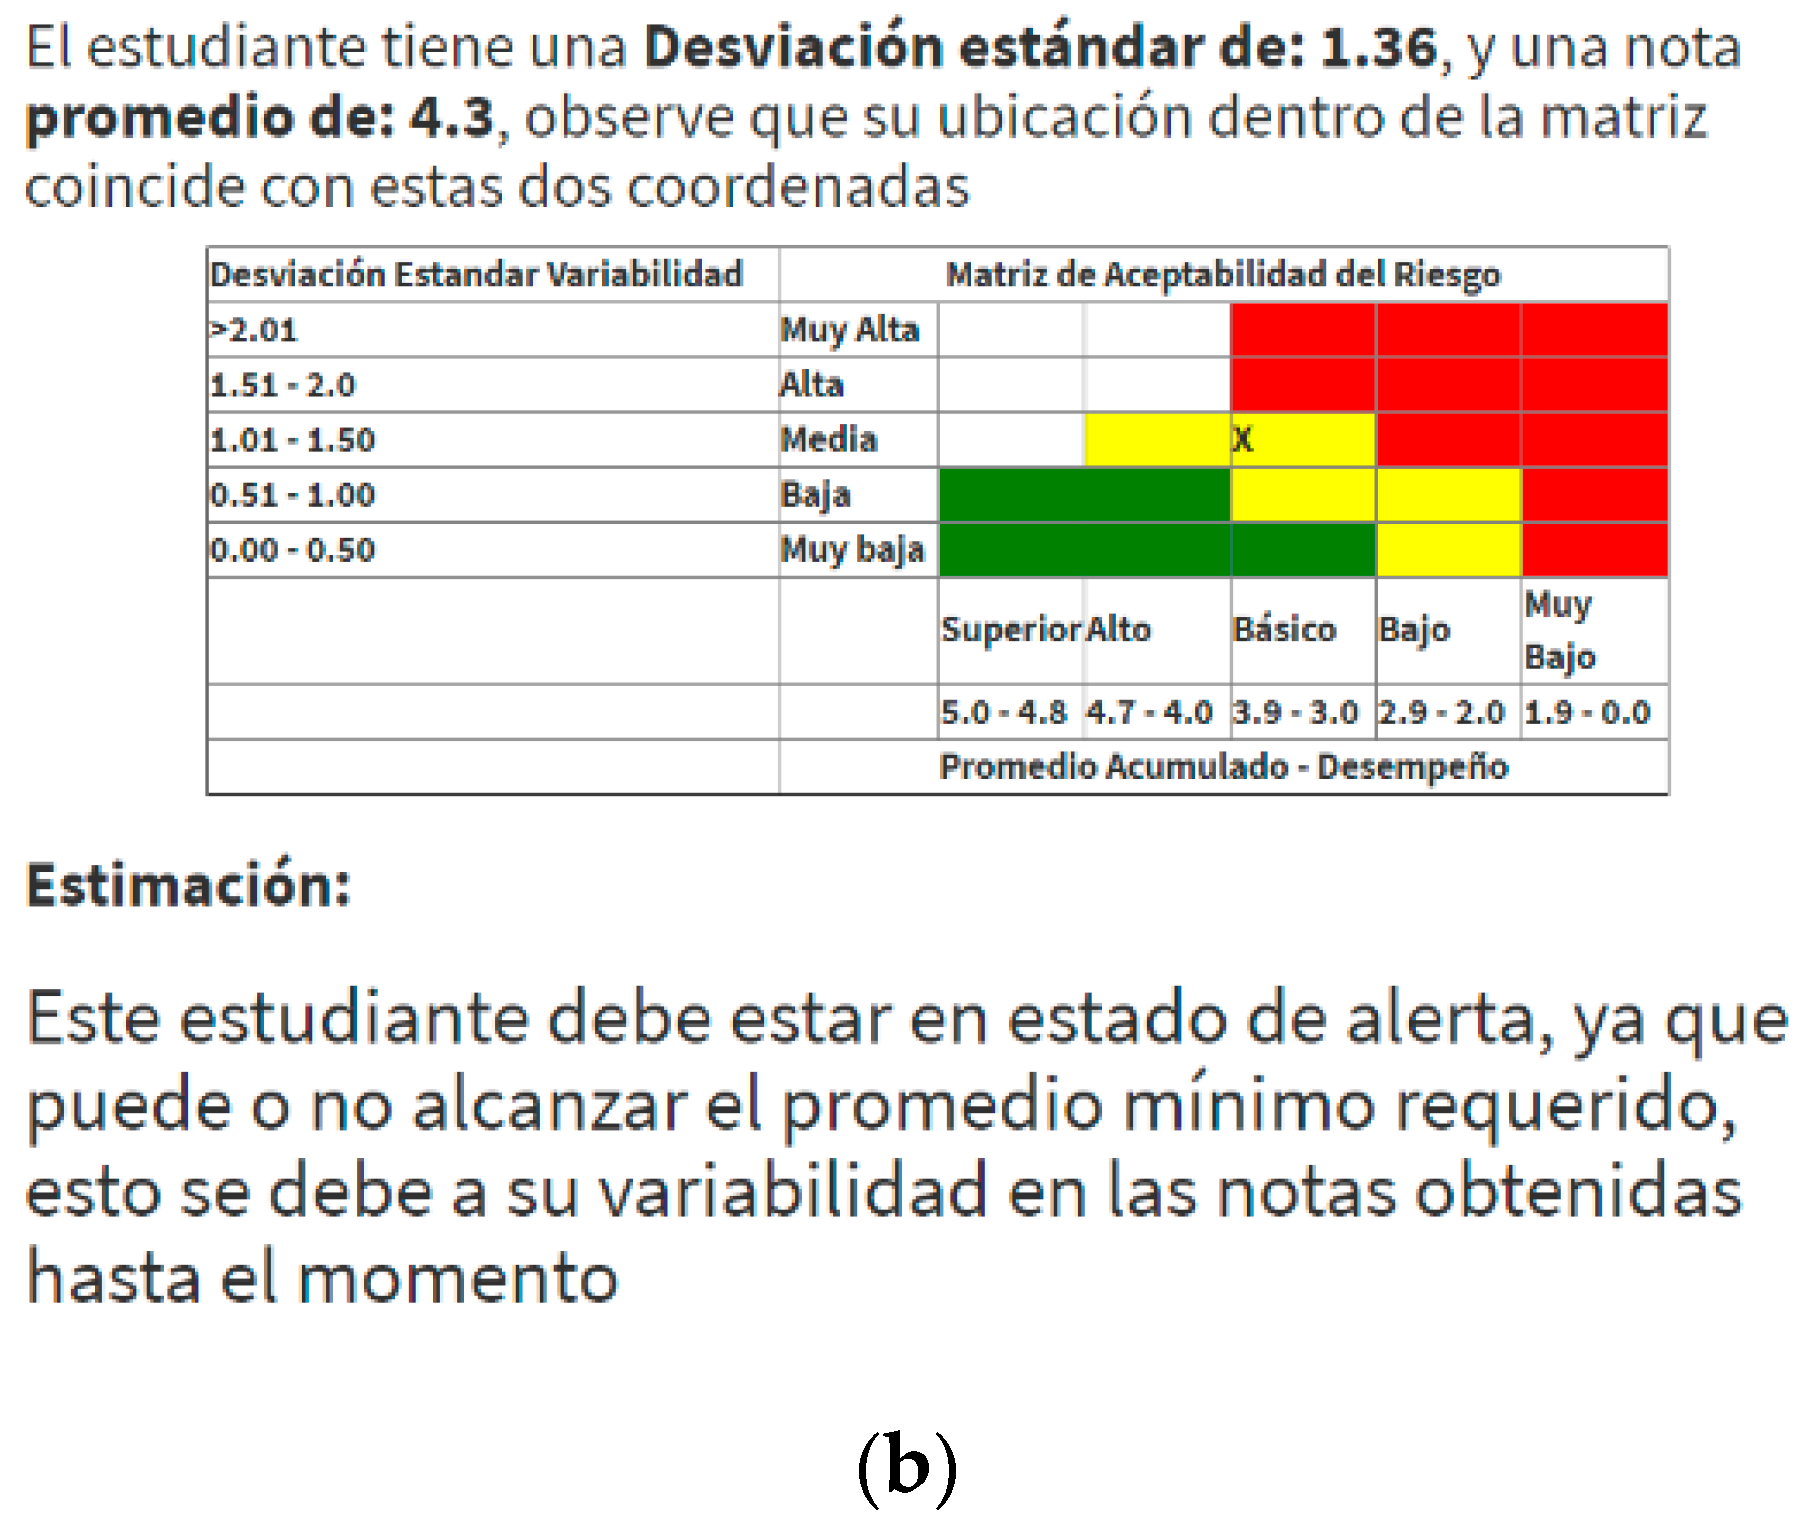
When establishing actions that are required for improvement, we must establish the variability of each student’s accumulated grades by means of a variance calculation and the standard deviation, the group average across the complete course and a determination of where each student is located in the range of group grades. In other words, the position measures enable us to establish that those elements are the median and the quartiles.
A risk management tool has been designed to determine each student’s risk of not attaining the minimum required average. This tool is called the risk assessment matrix. It seeks to calculate each student’s cumulative average, and the probability of improving that average, taking into account the trend of their accumulated grades and the location of their grades in comparison to the grades obtained by the remaining members of the group.
If a student’s cumulative average is below the minimum that is required to pass, this is an alarm for the tutor and improvement measures should be proposed to the student as a result.
If the student’s grade tends towards a large spread—that is to say, if there are ups and downs, with some good grades, others regular, and others poor—that would indicate a low probability of improving the average grade.
The proposed improvement measures are subject to evaluation, if not, they lead the student to improve his individual average and his position within the group. Whenever such actions are designed and applied by the teacher, and he can at any time modify them, to achieve the stated objective.
Each educational institution defines the minimum requirements for a student to show achievement of the objectives set for the virtual course, and indicates approval, via the grade or points obtained. Below, we present the risk assessment matrix proposal by which to estimate a student’s possible future results.
This matrix takes into account the variability of the student’s performance, as reflected in the standard deviation of accumulated grades and respective averages. This descriptive statistical data provides the teacher with analytical backing for the improvement measures that they implement, to assist the student in attaining the required minimum average.
To build this risk matrix, we considered the definition of the following statistical parameters and formulas:
The arithmetic mean or the average (median) is represented by
, as defined in Equation (1):
where
xi corresponds to each of the grades that are obtained by the student, and its value is in the range of 0.0 to 5.0.
n is the number of grades that are accumulated during the length of the course. This can range from 1 to as many as are determined by the teacher designing the course, and by the educational institution. This variable is discrete and finite, and it can generally be found in a range between 2 ≤
n ≤10.
The individual average of all of the grades that are obtained during the virtual course is what determines whether the student passes or not.
The variance is represented by
s2, which is defined by Equation (2):
The variance is an indicator of the spread of the data set, and its interpretation must take into account that units are expressed as squared numbers.
The standard deviation is represented by S, and it corresponds to the square root of the variance.
In calculations of the standard deviation of different sets of grades, sized n from 2 to 10 and with the greatest spread, a grade would range from 0.0 to 5.0 when n = 2 ≥ S = 3.535 and when n = 10 ≥ S = 2.635.
Both the variance and the standard deviation are measures of absolute variance that depend on the data set and the measurement scale.
Furthermore, the variation coefficient is represented by
V, and is defined in Equation (3):
This variation coefficient is a measure of the useful relative variation that is used to compare different data sets.
The median is the result of sorting the data that is from a data set in ascending order, while the mean is the observation value that appears in location number (n+1)/2, if n is an odd number, or as the average of the observation values appearing in the locations, if it is not.
As a result of this analysis, and to estimate the chances of passing or failing according to the grades the students obtained, we designed the matrix shown in
Figure 3.
3.2.5. Level 4 Module—Prescription
In this phase, LA interprets the prediction and seeks to answer the questions: ‘How can we act?’ and ‘How do we prevent the negative and strengthen the positive?’
To help them address these questions, the teacher has data about the students in a critical state, as well as some tools for providing guidance (customised tutoring). There is a Tutoring option, which gives the teacher several resources to guide the student: (a) identifying the student’s predominant learning style in order to recommend better material; (b) accessing details of student activities in the classroom, how many times they have connected to the classroom, how much time the connection lasts, notes taken on the activities, and levels of chat room participation, among other factors; and (c) taking actions such as sending the student an email, sending the student study material, keeping in mind their predominant learning style, and lastly, sending reminders about upcoming due dates.
3.3. Construction of the Solution
In consideration of software engineering principles regarding design processes, construction, and implementation, we decided on the modular development of each component of the solution. Each module was evaluated for usability, user-friendliness, and effectiveness, with white- and black-box tests. The following is an overview of the sensor modules under the teacher profile.
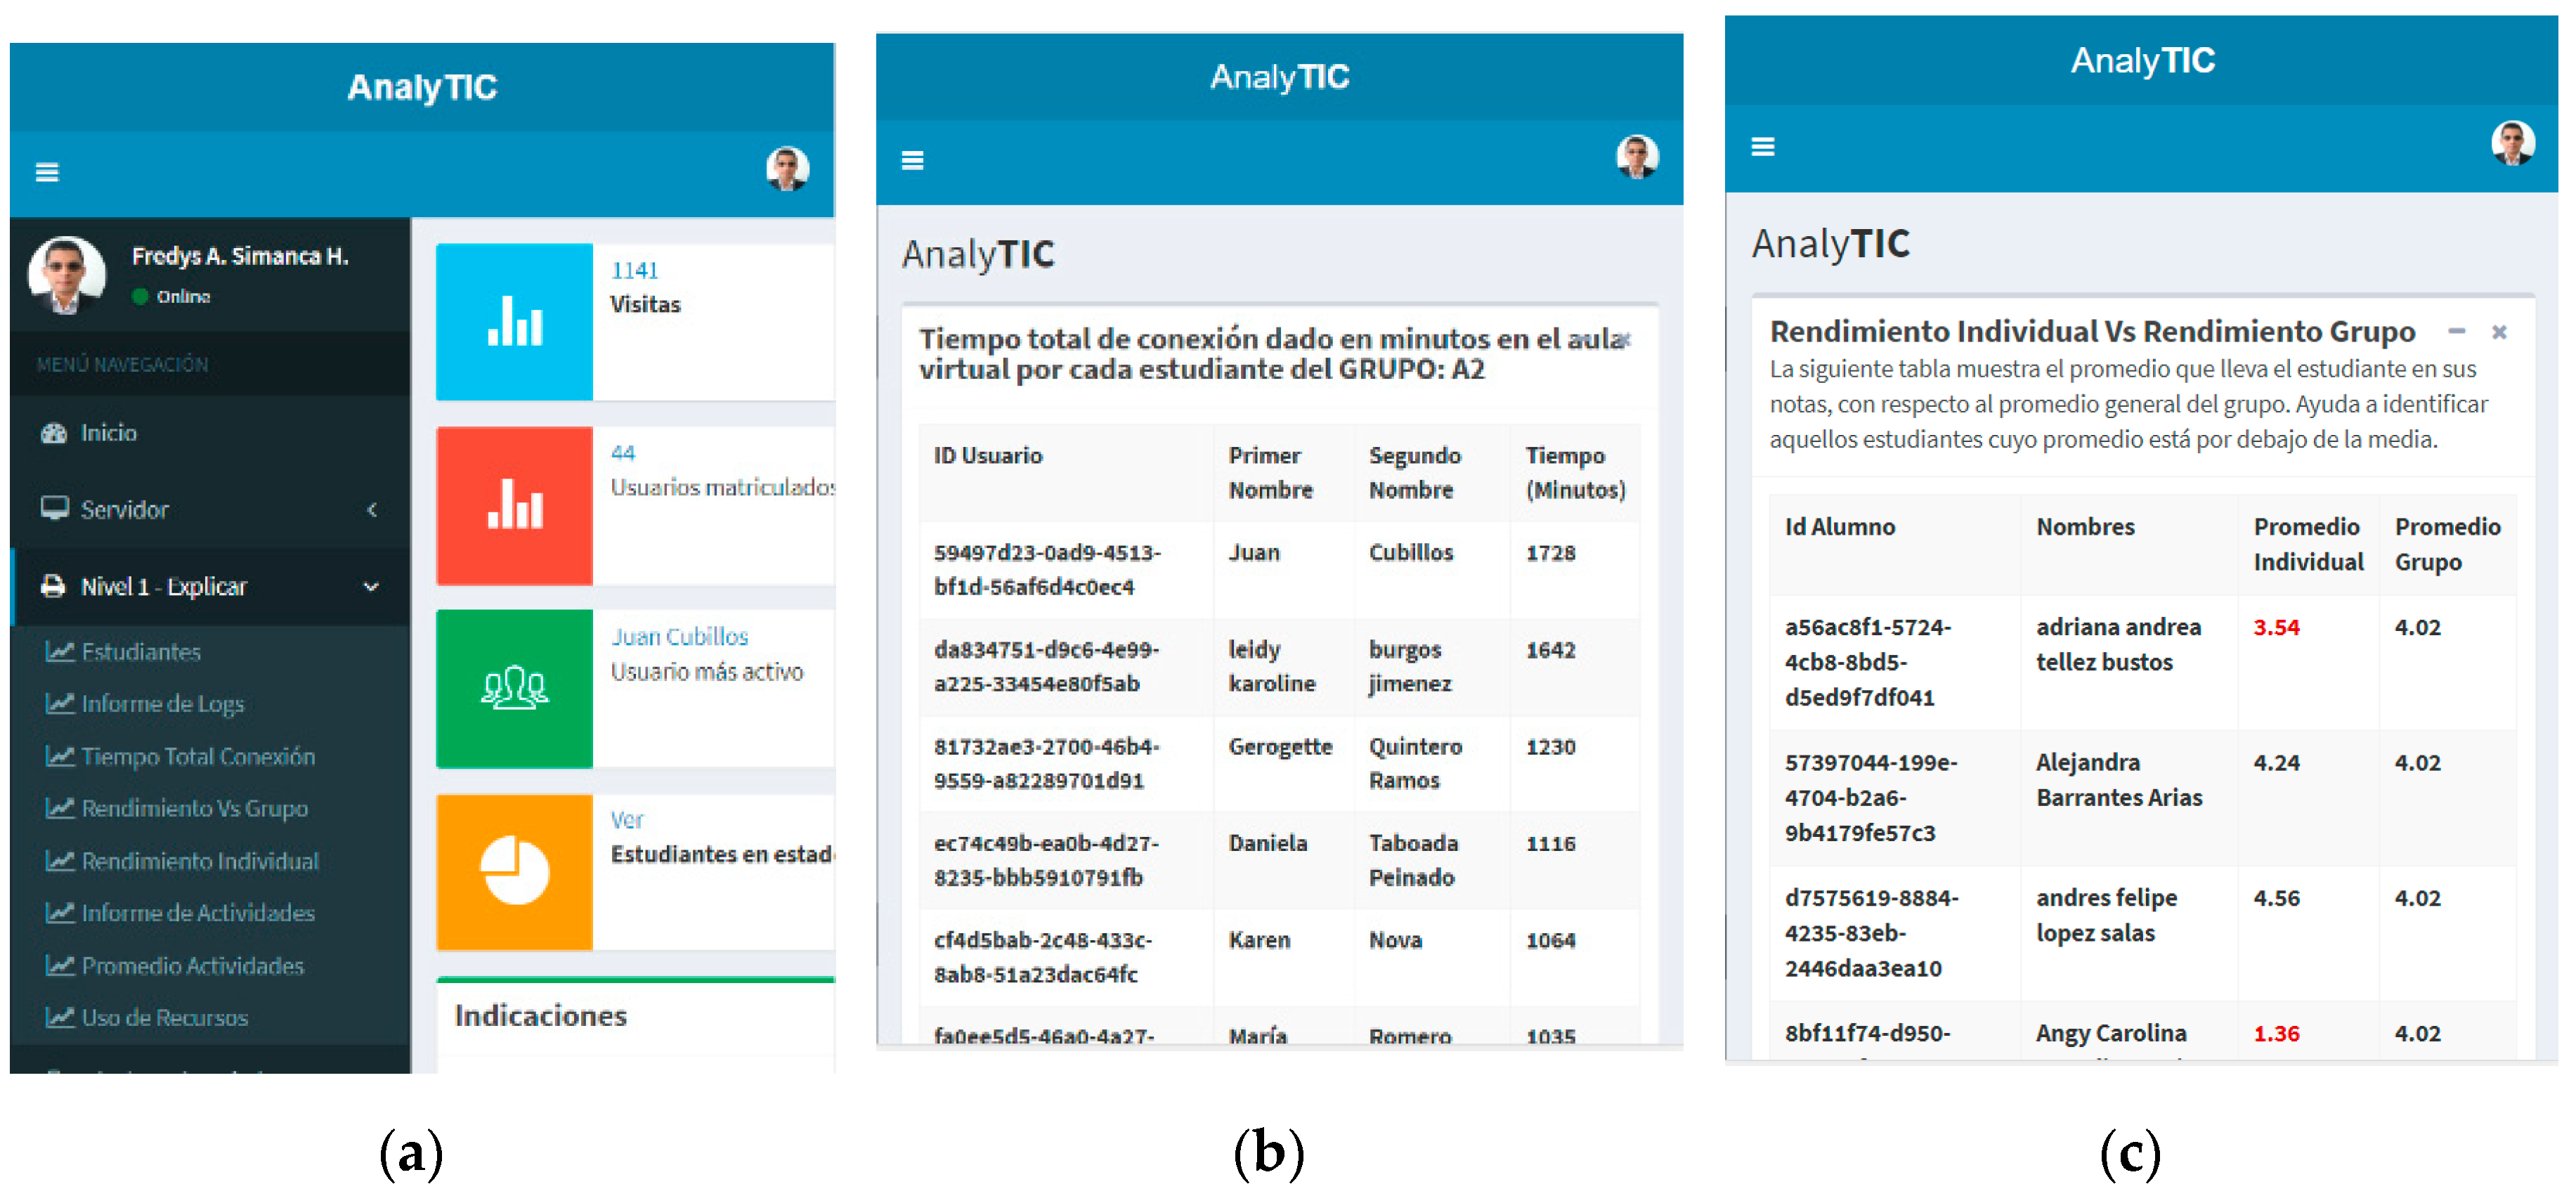
3.3.1. Level 1—Explanation
This is the first LA phase. The module shows the data taken from the virtual classroom, which has been detailed in the previous sections. In
Figure 4, three views of this option are detailed.
3.3.2. Level 2—Diagnosis
Quartile distribution for visualising each student’s situation.
Figure 5 contains the explanation and distribution by quartiles of the study group.
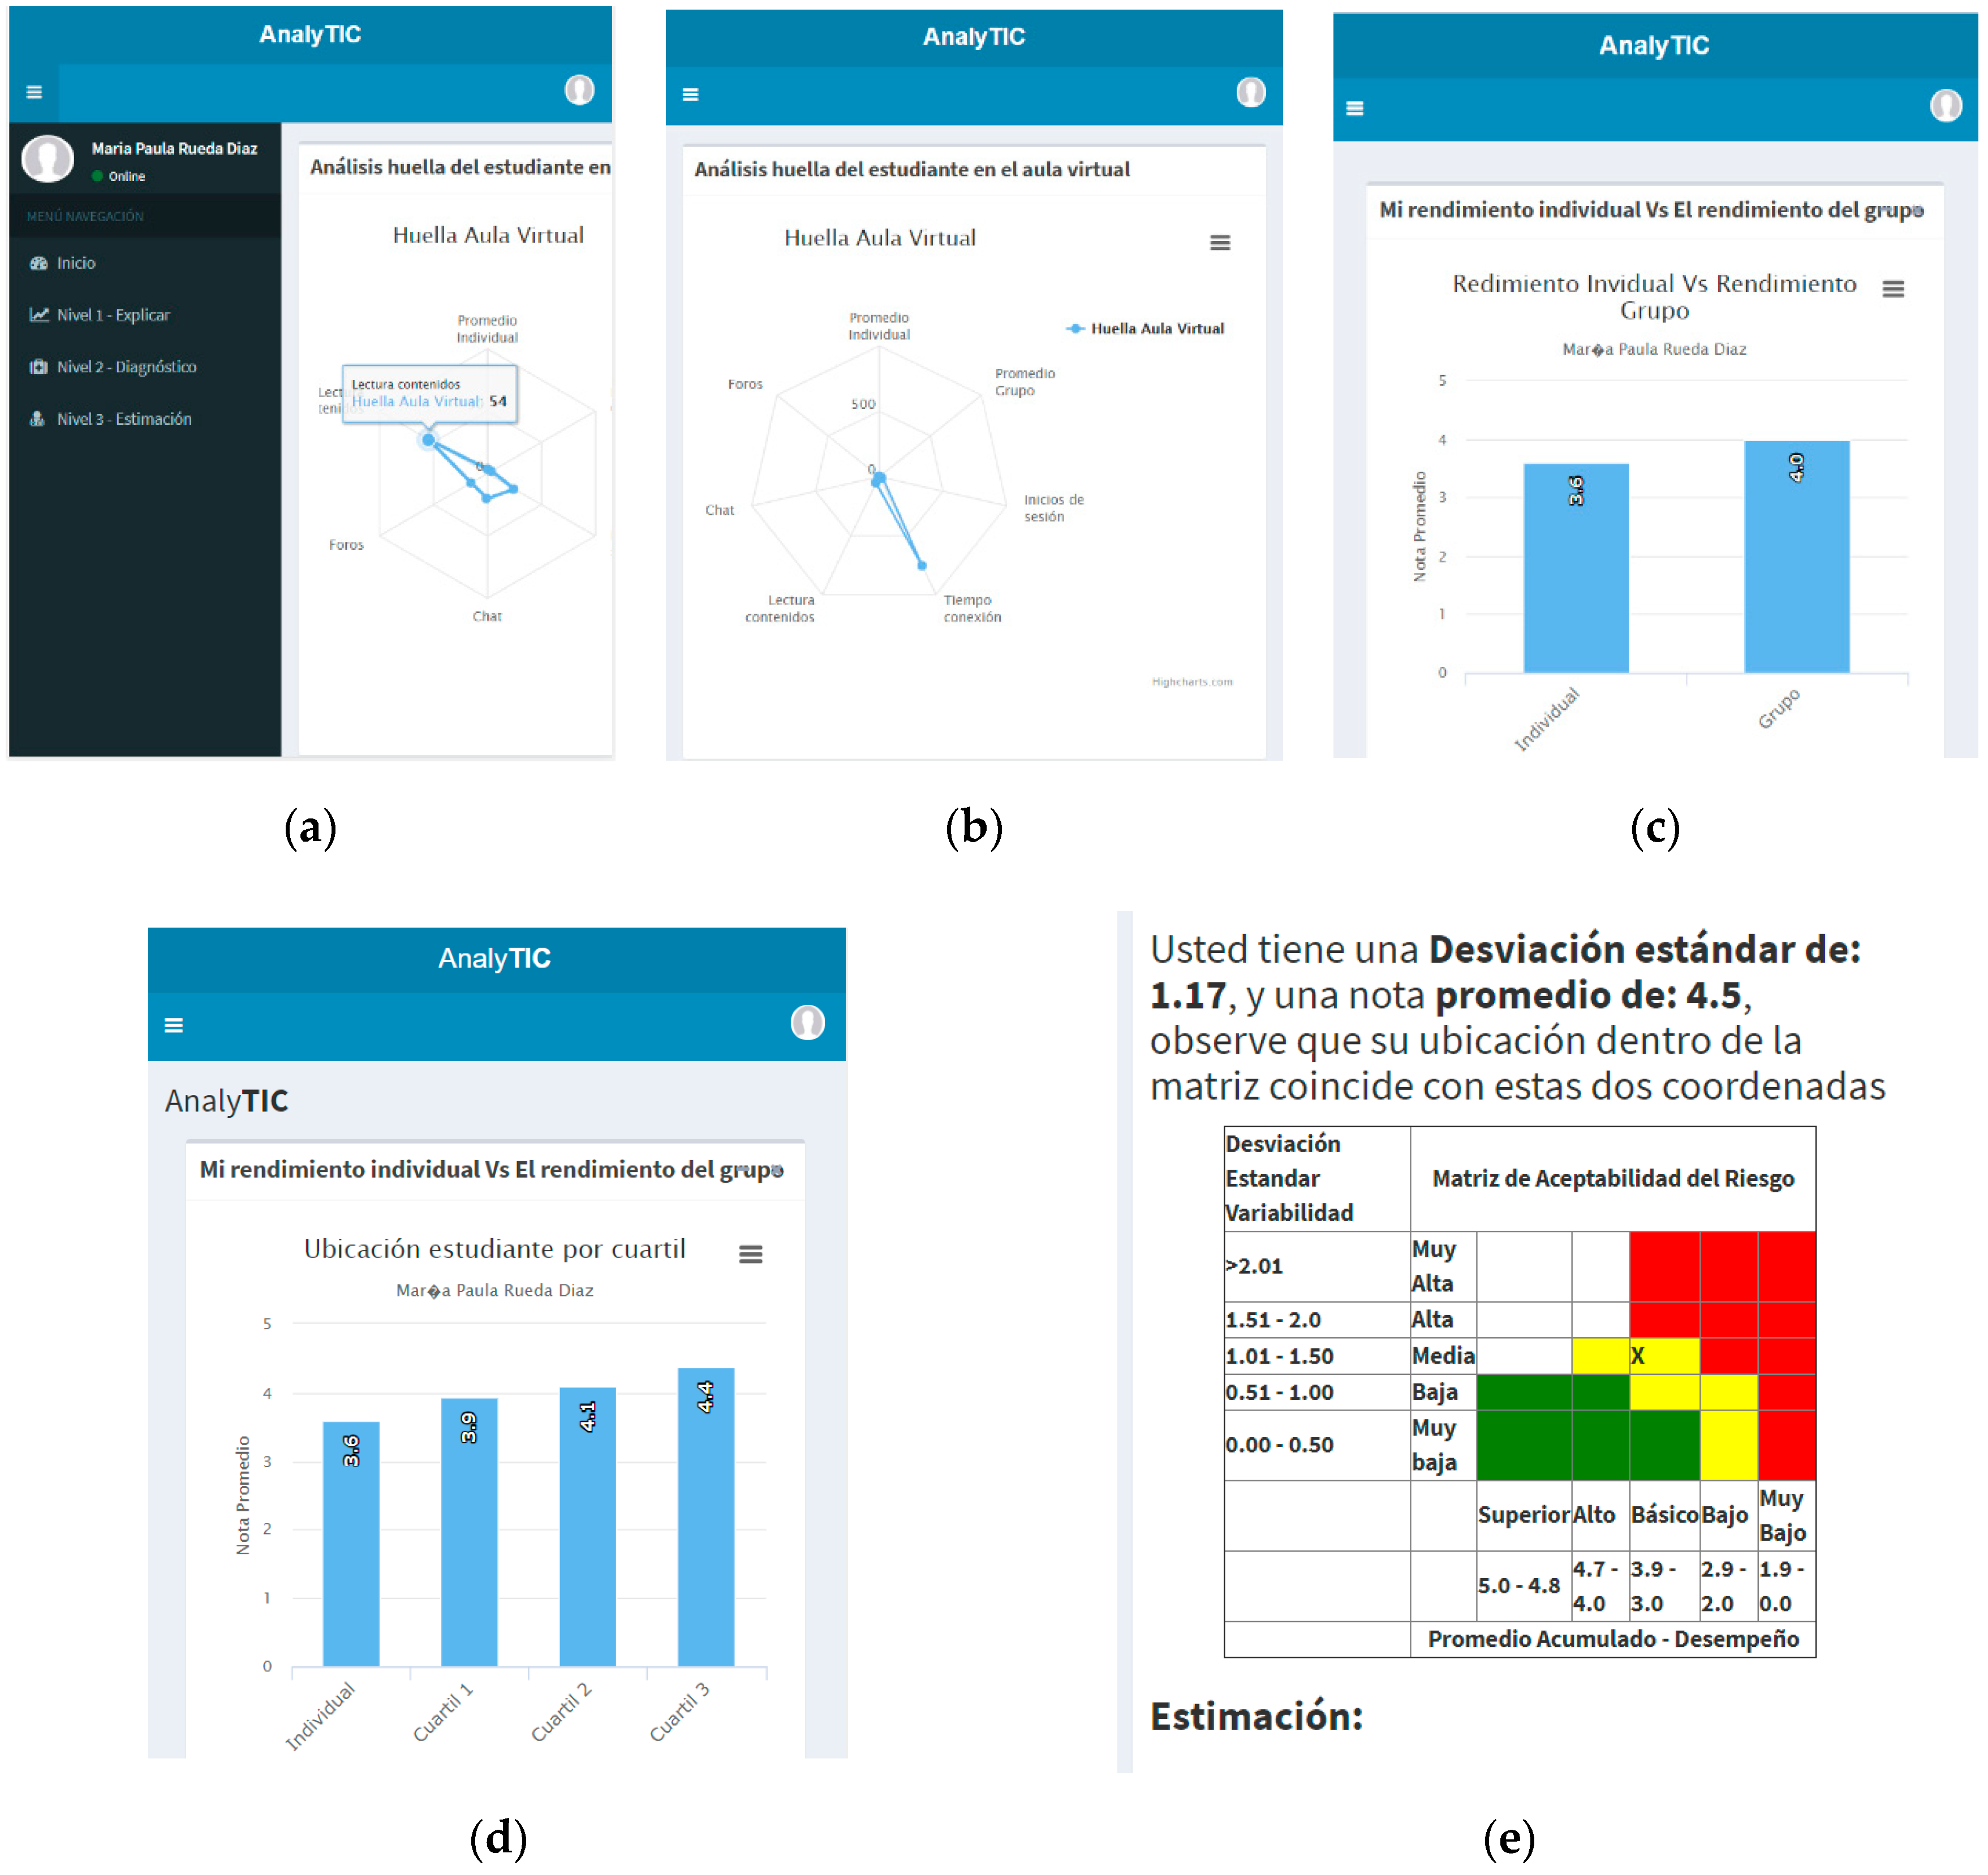
3.3.3. Level 3—Prediction
In this module, we see the application of the risk acceptance matrix, in which the teacher has the option to analyse each of their students, as evidenced in
Figure 6.
3.3.4. Level 4—Prescription
The teacher’s options for beginning customised tutoring are listed.
Figure 7 shows the details of the teacher’s views and the actions to be taken with the student.
Conversely, the student profile has options for Explanation, Diagnosis, and Prediction. The information that the student can see is shown in
Figure 8:
3.4. Solution Release and Socialisation
At this stage, the pilot population to validate the quality of the constructed solution was selected, in order to establish the corresponding socialisation and execution process for classification in the pilot institutions. The sensor’s validation was conducted with a group of 39 Algorithm students who were in Term 2017-1 of the Environmental Engineering program at the Cooperative University of Colombia.
5. Discussion
The results obtained with the test group allow us to state that LA, properly used, is a valid and efficient means of analysing student data that is contained in virtual classrooms, offering the teacher decision-making tools to employ in educational customisation and tutoring processes for students experiencing academic difficulties. However, when building the system, we identified a limitation in the selection and adaptation of the more relevant information, its analysis, and the subsequent modelling of student behaviour.
Therefore, LA tracks the footprint that the student leaves throughout education processes, which is recorded in the LMS systems through the use of smart devices, mobile phones, tablets, and portables, as well as through participation in social media, photo blogs and chat rooms. The goal of analytics is to strengthen and individualise the educational process for each student, in each establishment, using measuring methods, collection models and database analysis contextualised according to specific interests, educational methods, and the dynamics of virtual teaching. Therefore, LA should improve the educational system and the learning environment supported by ICTs by incorporating sociological, psychological and statistical techniques, resources and methods into the management and analysis of student data, thereby allowing teachers to respond effectively to specific behavioural situations, preferences and other factors.
Although it is true that some LMS have their own internal follow-up tools, it is currently necessary to use tools and standards that enable the structuring and storage of student interactions during various activities. There are standard options such as Tin Can APA, which extracts data from student activity and interacts with other applications, including SNAPP, LOCO-ANALYST, STUDENT SUCCESS SYSTEM D2L, Social Networks Adapting Pedagogical Practice, SAM, BEESTAR INSIGHT, ORANGE, RAPIDMINER and KNIME. However, it is necessary to conduct further research to structure and develop report processing elements and mechanisms for learning analytics that align with current educational guidelines, and to strengthen instructional and decision-making processes.
The sensor for identifying students that are at risk of failing a subject, using LA for subsequent customised tutoring, plays an important role in beginning to solve these needs, though there is much yet to be done and developed in this area to meet the above-noted requirements. This is a tool that differs from others in that it integrates four LA phases, enabling the teacher to access student information in the virtual classroom, as well as empowering the student to become aware of the progress and pattern of their academic performance. The commonly identified tools are focused on administrative processes and teachers, but none of them offer the student a comparative analysis of their progress as compared to that of the group. The sensor provides access to three of the four phases; a student can see their individual performance in relation to the group’s performance (Explanation), locate themselves within the corresponding quartile (Diagnosis), and lastly, use the risk matrix to obtain an estimate of success or failure in a given subject (Prediction).
Table 3 provides a comparison between the different tools, showing the function of the solution that we have developed.


