1. Introduction
Gasoline direct injection (GDI) together with downsizing and boosting is surely the most attractive answer to the demand for high energy efficiency of spark ignition (SI) engines [
1]. In addition, the development of new SI engines is needed to fulfil the new EU6 emission standards [
2]. This mean an important reduction of exhaust pollutants (HC, CO, NO
x) with special attention in the last few years to particulate emission [
3]. Direct injection (DI) has advantages over the port-fuel injected (PFI) engines, such as high precision in fuel metering [
4], greater flexibility for different operation regimes, low pumping losses and significant potential in fuel economy benefits [
5]. Another advantage is the greater charge cooling potential, which allows higher compression ratios to be used, increasing thermal efficiency [
6].
In general, GDI engines are operated at stoichiometric combustion mode to ensure high efficiency of the three-way catalytic converter (TWC) [
7]. Flexible control of the air–fuel ratio in the combustion chamber, typical of DI engines, is due to the possibility of realizing either stratified charge or homogeneous mixtures. This is possible by changing the injection pulse while maintaining the overall air–fuel ratio at the stoichiometric point [
8], and features the potential for applying advanced operating regimes. Yang et al. [
9] reported that injection during the intake stroke (“homogeneous mixture”) improves volumetric efficiency. Furthermore, injection during the latter stage of compression stroke (“stratified charge”) suppresses the tendency towards knock. Several researchers studied stratified injection mode [
10,
11,
12,
13,
14,
15] with significant improvements in performance. However, several problems were found in the form of a reduction in combustion stability, difficulties setting the desired air–fuel ratio at spark timing and an increase of particle emissions [
13]. Therefore, a potential alternative is the mix of both concepts to achieve a stable combustion process, with low particle emission and without losing performance. Some authors have studied this strategy of homogeneous in-cylinder charge with single [
16,
17], and multiple injections [
18,
19,
20] in the intake and early compression stroke. Marseglia et al. [
18] found that the split injection strategy introduces positive effects with respect to the single injection case, such as the reduction of coefficient of variation of the indicate mean effective pressure (COV
IMEP), tendency to knock, carbon monoxide emissions, as well as soot formation. However, many different injection permutations are possible, so there is no clear agreement on what constitutes an ideal strategy for each operative condition [
21]. Therefore, more fundamental studies are necessary for better understanding of the first and late phase of the combustion process.
Optical accessibility offers high temporal and spatial resolution, a significant advantage over the well-established in-cylinder pressure-based investigations. For example, the results of Clark et al. [
19] show that retarded second injections in the intake stroke lead to a less circular flame, potentially as a result of decreased charge homogeneity causing local regions of varied laminar flame speed throughout the combustion chamber. The spray dynamics and interaction with the surrounding air flow were recognized as strongly affecting mixture quality, combustion development and amount of pollutants released at the exhaust [
22]. Spray impact against walls also needs to be studied, since undesired deposition of liquid as wall film causes unburned hydrocarbons and soot formation, hence increased fuel consumption and even augmented cycle-by-cycle variations [
23]. It is therefore necessary to understand the mechanics behind injection strategies, which are capable of reducing particle emissions while also maintaining the performance and efficiency of the engine. All these findings demonstrate the capabilities of integrated thermodynamic and flame imaging data in characterizing combustion; they also represent a valuable validation database for simulation codes that can provide additional understanding of ignition and flame propagation.
Within the context of homogeneous charge SI combustion applications and detailed characterization of the effects of split injection, the present study provides insight into the features of the flame front propagation and burned gas properties in a direct injection wall guided engine, fuelled with gasoline during overall stoichiometric operation. Combined thermodynamic and optical techniques, with the support of exhaust gas and particle emission analyses, were applied on a SI engine operated at fixed crankshaft rotational speed, in wide open throttle (WOT) conditions. The combustion chamber featured a view from below, through the piston crown. Double and triple split injection strategies were tested with fixed first pulse and two variations for duration and position of the second pulse in the intake stroke. The results were compared with single injection at three different settings. The combination of consolidated techniques was aimed at offering a comprehensive overview of fundamental research results in a wide range of operating conditions with a specific interest in the injection-piston interaction and particulate production mechanisms. The results of this work are aimed at helping engine manufacturers and simulation research groups to develop the next generation of GDI engines and continue reducing CO2 emissions in the transport sector.
2. Experimental Apparatus and Methodology
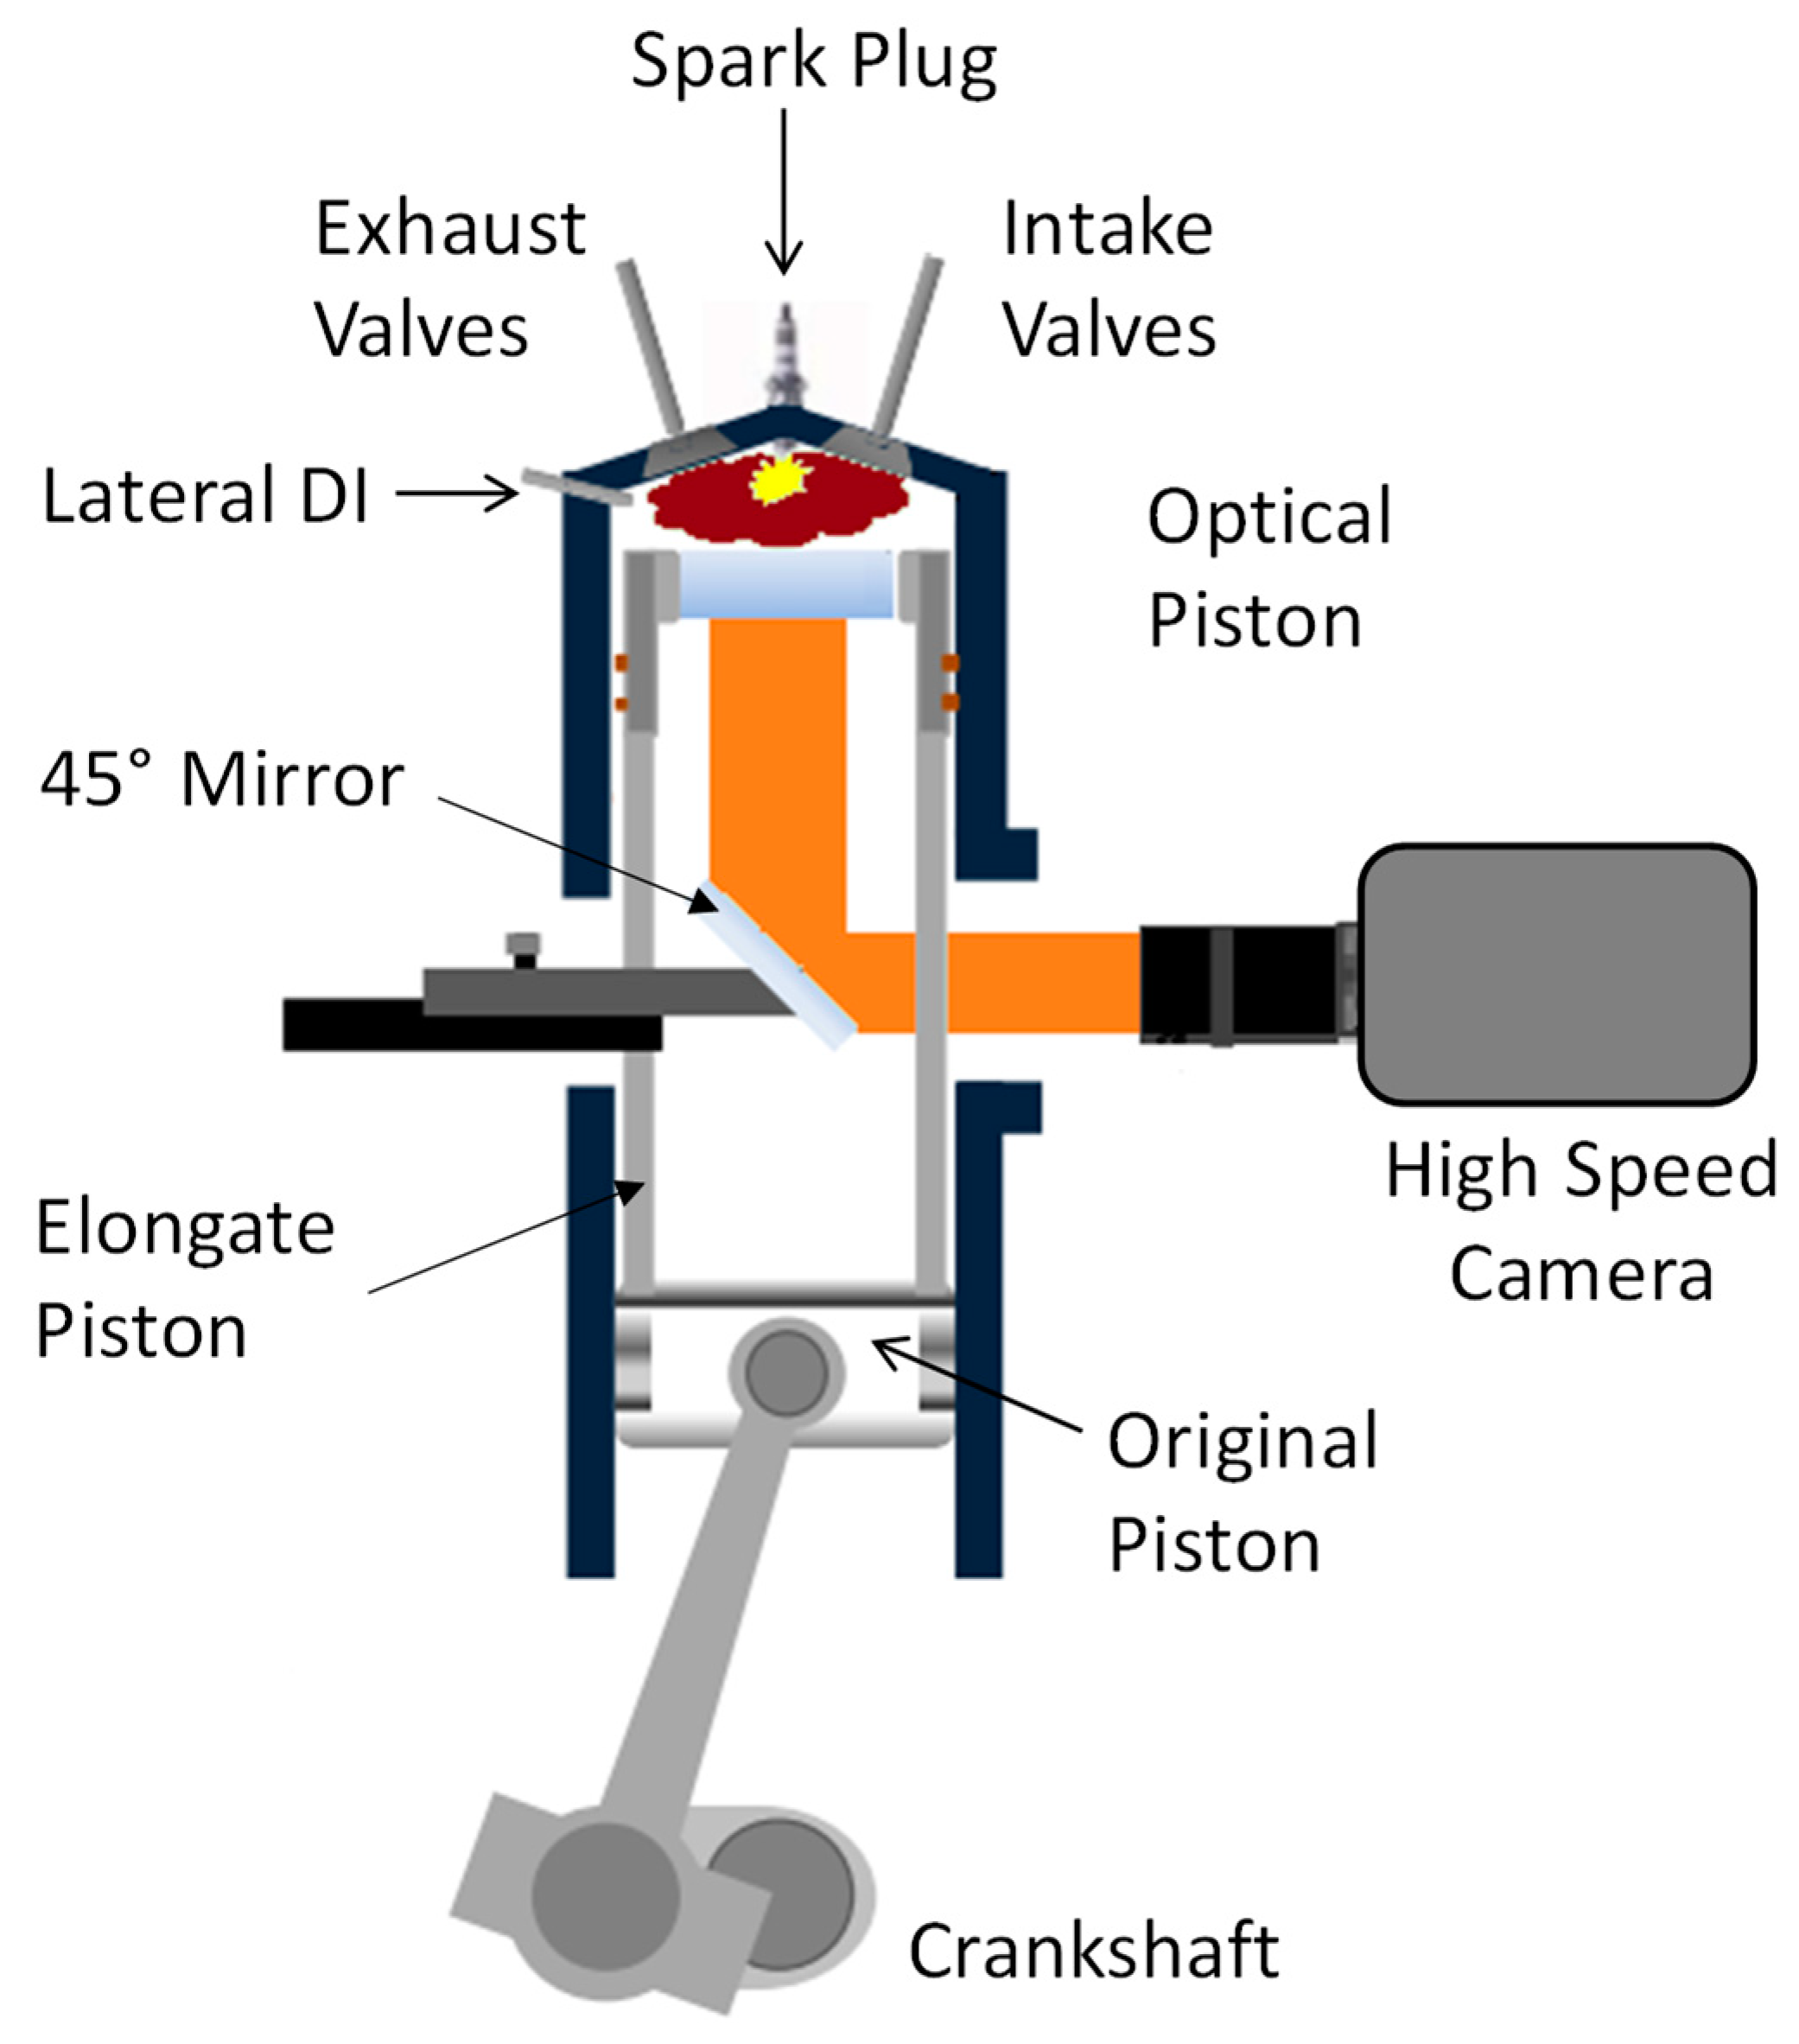
The measurements were performed on an optically accessible single cylinder DI-SI engine. It was equipped with the four-valve cylinder head of a commercial SI power unit, a centrally located discharge spark plug, and wall-guided injector. The fuel system featured a commercial six-hole solenoid injector installed in the lateral side of the cylinder head (
Figure 1). Further details on the engine specifications are reported in
Table 1. Reference is made in crank angle degree (CAD) with respect to the top dead centre (TDC) at the end of compression, mentioned as after top dead centre (ATDC) and before top dead centre (BTDC). A conventional Bowditch design was used for optical accessibility [
24], with an ultraviolet (UV) inclined (45°) mirror mounted within the hollow optical piston. The piston quartz window ensured a field of view of 57 mm in diameter, corresponding to 52% of the piston cross section. Slotted graphite piston rings were used to provide oil-less lubrication with uninterrupted bronze–Teflon rings used for sealing.
Engine speed was fixed at 2000 rpm and the load was set at wide open throttle (WOT).
Coolant and lubricant temperatures were maintained at 330–335 K using a thermal conditioning unit. Although under normal conditions of engine operation higher temperatures of the boundary conditions can be found, it is necessary to maintain a moderate temperature to protect the elongated piston-bore assembly that features high tolerance specific for optical engines. For comparative purposes between operating conditions, it will not have major effects. Intake air was at standard conditions (293 K and 1 atm) for all operative conditions. All measurements were performed with fixed spark advance (SA) of 15 CAD in order to maintain roughly the same fluid dynamic conditions (swirl, tumble, turbulence intensity, among others). In addition, this SA ensured a stable combustion process (COVIMEP < 3%) for all operative conditions.
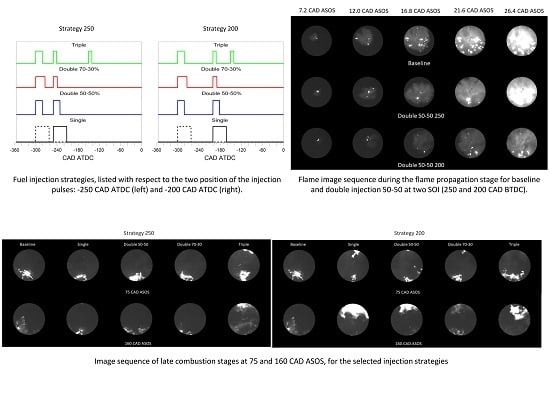
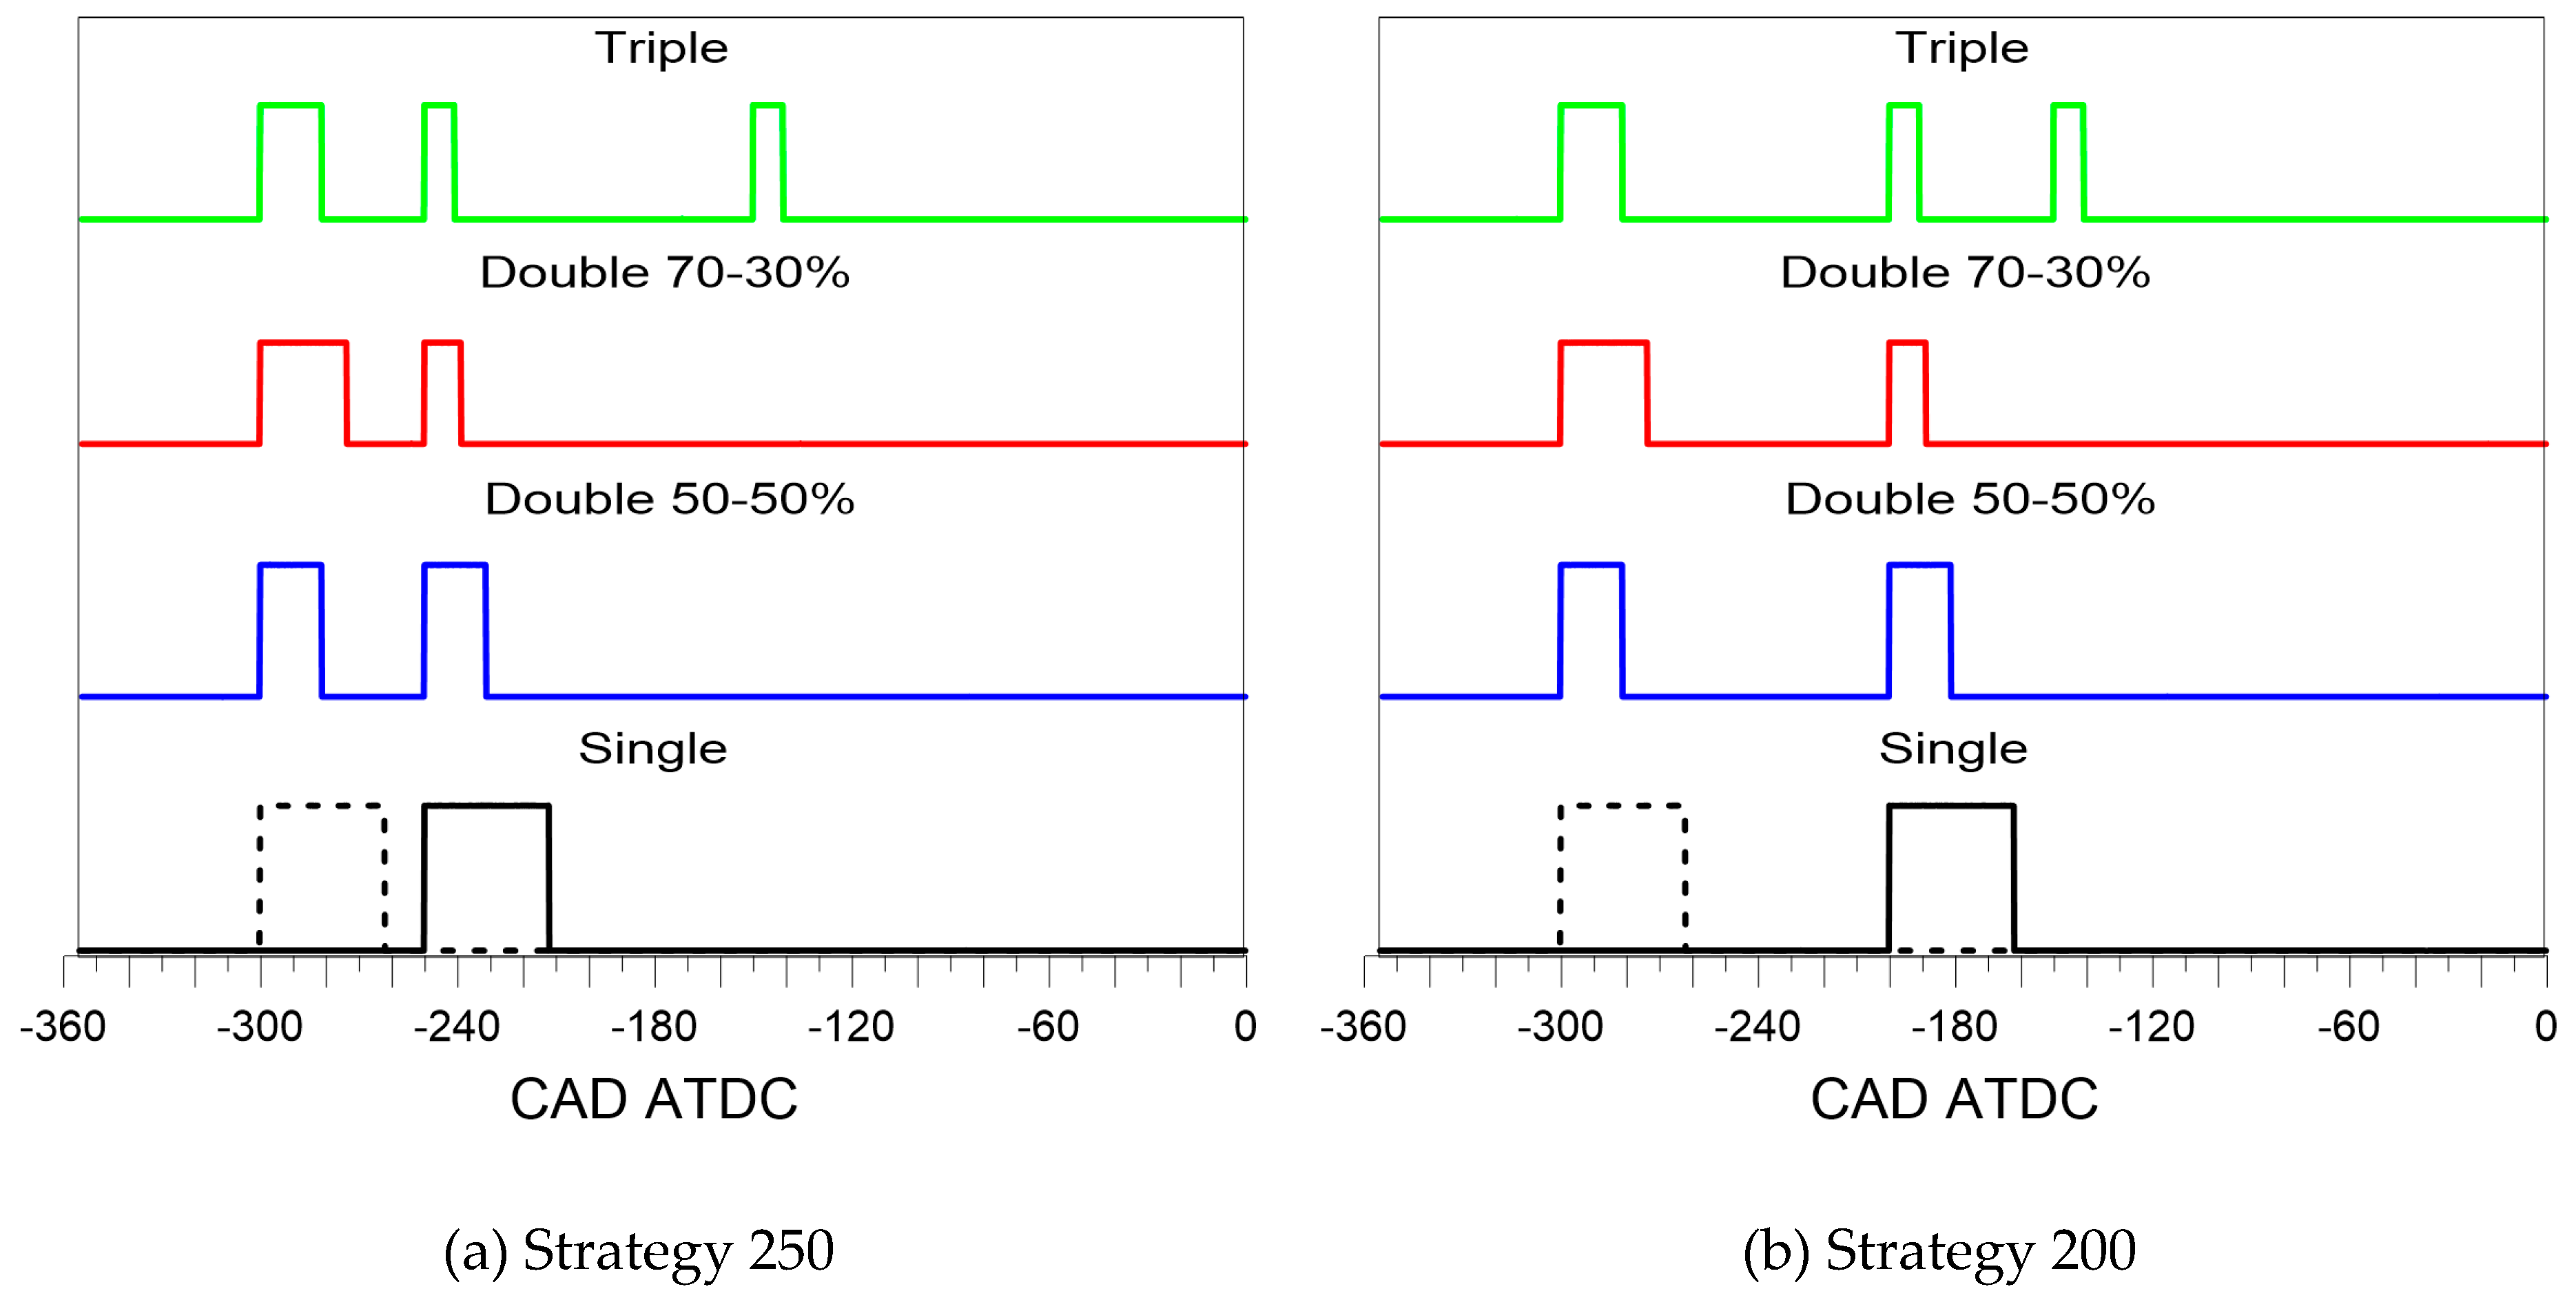
An experimental test matrix was designed with two injection strategies by varying the start of injection (SOI) of the second pulse (250 and 200 BTDC). Previous trials with more extensive SOI sweeps revealed that late injection tended to render the combustion process unstable, while early settings resulted in high smoke opacity [
17]. Therefore, the investigation was focused on fuel delivery during the second half of the intake stroke and early stages of compression. For both cases (i.e., 250 and 200), three different split injection were used: double pulse with a proportion of 1:1 injected fuel (called double 50-50%), double pulse with a first injection higher than the second in a proportion of 2.3:1 (called double 70-30%) and triple pulse with the highest in the first pulse and equal for the other two in a proportion of 2:1:1 (called triple). In addition, single injection was also analysed for three different starts of injection settings. The baseline was taken as the case of single injection with the earliest SOI (300 BTDC), due to the representative condition of “homogenous charge” injection mode. More information of the injection strategies is shown in
Table 2 and represented in
Figure 2.
In-cylinder pressure was acquired with an accuracy of ±1%, and averaged over 200 consecutive engine cycles; the optical measurements were carried out for 30 cycles of each set of 200 stable cycles, due to camera memory limitations. Mass fraction burned (MFB) traces were determined with a first-law analysis approach, which included the calculation of convective heat transfer [
25] and blow-by losses [
26]. A corrected compression ratio was used due to the large crevice volumes and top land region specific for optical engines; the method developed by Irimescu et al. [
27] was used for this purpose.
Injection pressure was maintained at 100 bar for all conditions. The relative air–fuel ratio was measured using a wide band exhaust gas oxygen sensor, with an accuracy of ±1%. Pollutant species concentrations (CO, CO2, HC and NOx) were measured in the undiluted exhaust gas stream using an AVL Digas 4000 analyzer (AVL, Graz, Austria), with a resolution of 0.01% for CO, 0.1% for CO2 and 1 ppm for the other two chemical species, all within 3% accuracy. The measurement principle was an electrochemical sensor for NOx and non-dispersive infrared (NDIR) analyser (AVL, Graz, Austria) for the other components. Lastly, smoke opacity was measured by using an opacimeter (AVL Opacimeter 439, AVL, Graz, Austria) with a resolution of 0.1%.
3. Optical Analysis
Early flame front propagation was investigated through cycle resolved digital imaging. Visualization was performed with a high-speed CMOS camera (CamRecord 5000, 8-bit, 16 µm × 16 µm pixel size by Optronis, Kehl, Germany) equipped with a 50 mm Nikon objective. The camera worked in full chip configuration (512 × 512 pixel) detecting 5000 frames per second with 200 µs fixed as exposure time. The f-stop of the objective was set at 2.8 to improve the signal-to-noise ratio without extensive saturation effects. Therefore, the set-up allowed the acquisition of the images with a dwell time of 2.4 CAD at 2000 rpm and a spatial resolution of 0.188 mm per pixel. The optical trials related to each engine operative condition consisted in the acquisition of 100 frames per cycle after spark timing, during 30 consecutive engine cycles.
A consolidated image processing procedure allowed the evaluation of macroscopic parameters related to flame morphology by a routine developed in Vision of National Instruments; details are reported in [
16,
25,
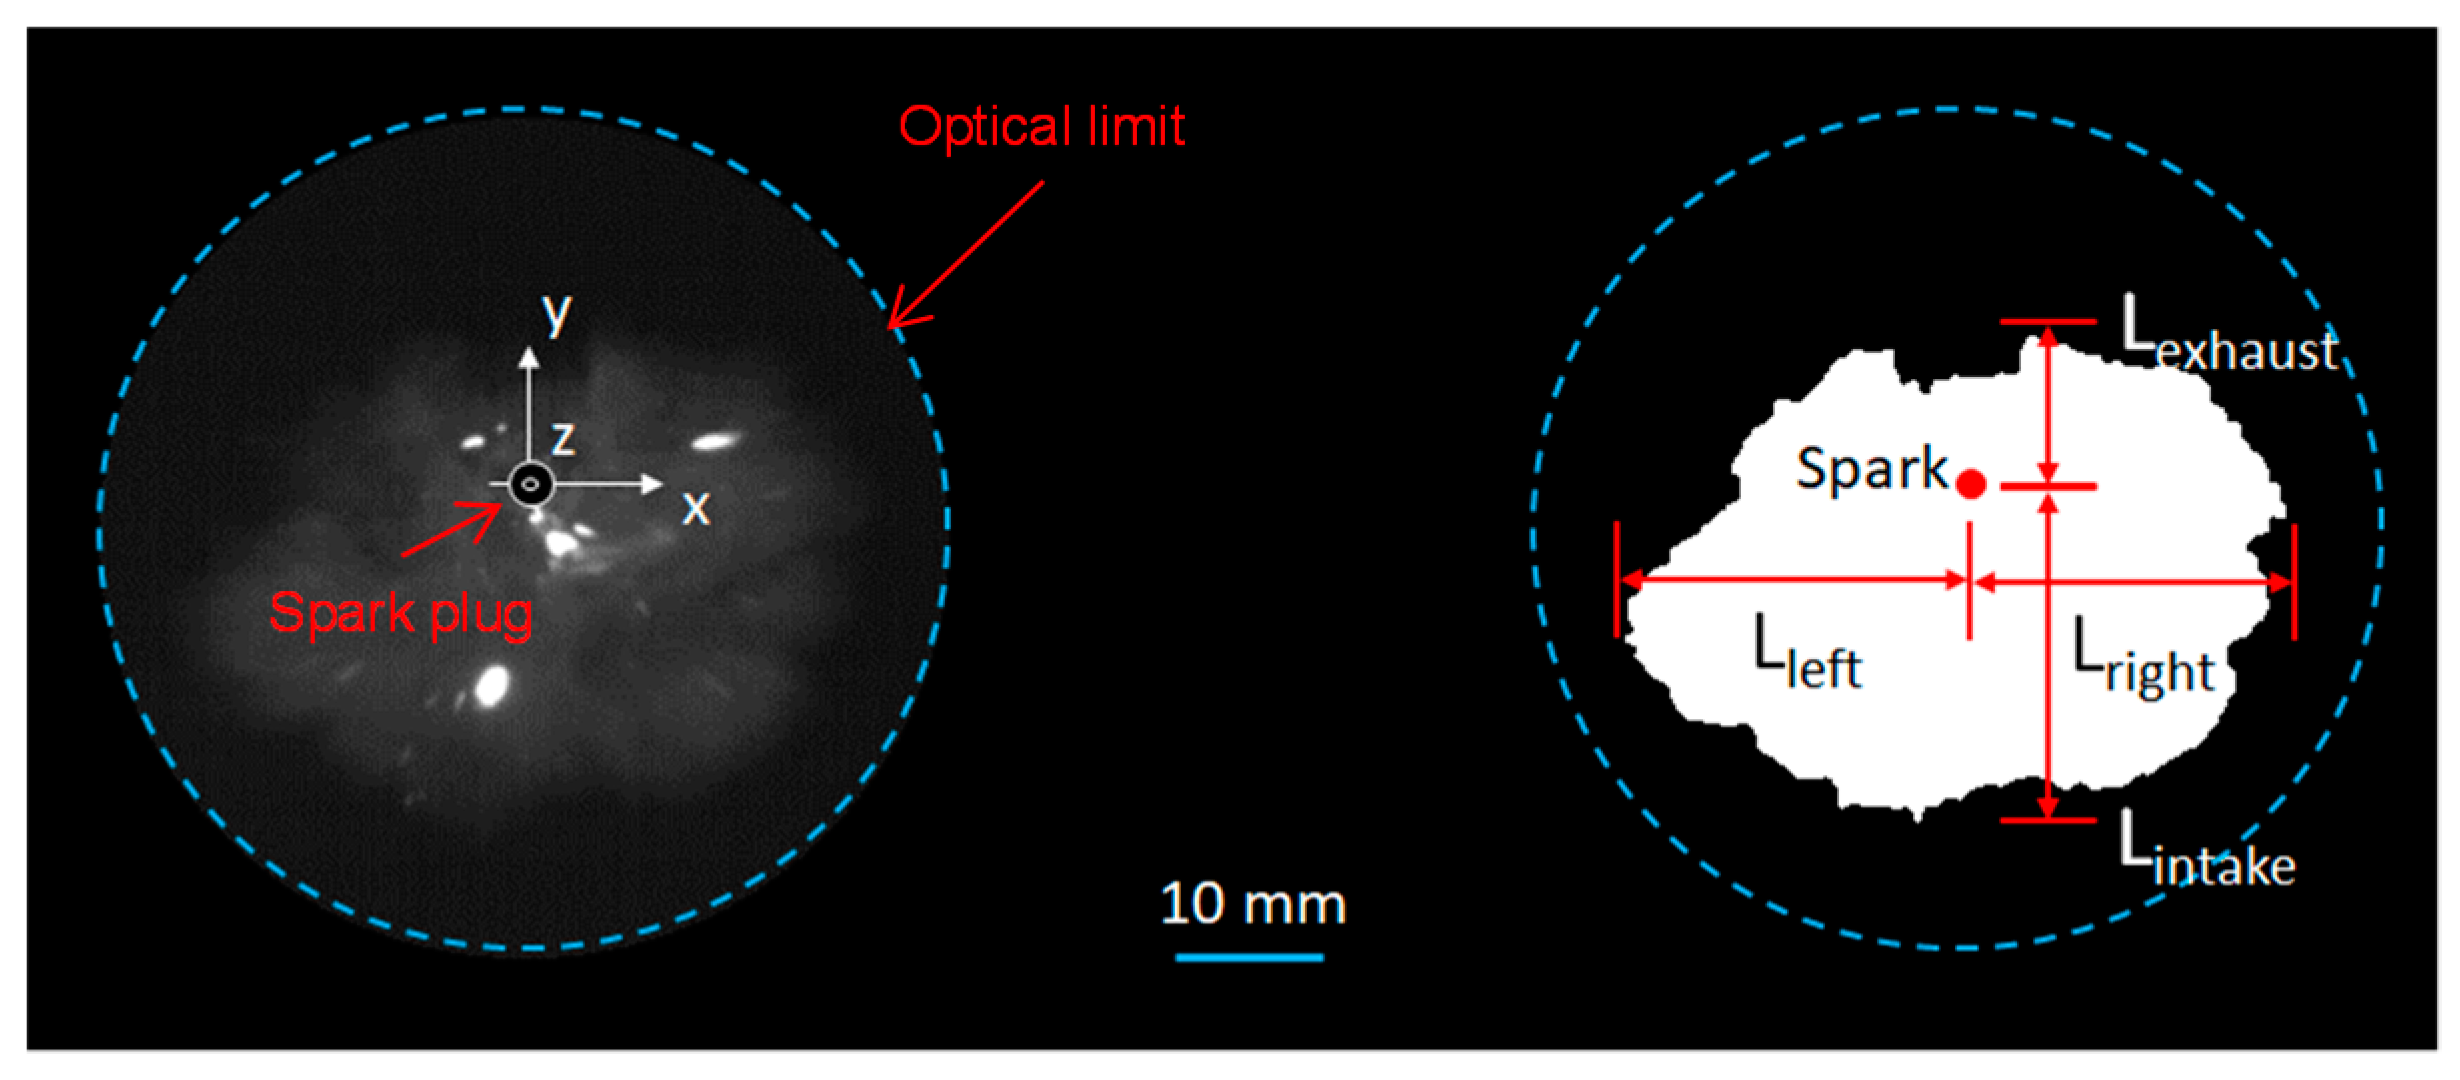
28]. Briefly, a mask was built around the images of each sequence to delineate the limit of the optical window (
Figure 3-left). Then, after applying a function for the optimization of brightness and contrast, binary images were achieved by fixing the threshold at 35/256 (
Figure 3-right). Advanced morphology functions applied to the binary images allowed the estimation of several flame parameters such as area, speed, distortion and preferential propagation. Flame area (A) corresponded to the number of pixels included in the foreground of binary images. Propagation speed (m/s) was calculated as the incremental ratio of the equivalent flame diameter (
) between two frames with respect to the dwell time (δt = 0.2 × 10
−3 s).
Previous studies identified preferential directions for flame propagation, due to fluid motion phenomena (tumble and swirl) as well as temperature gradients and non-homogeneity of the mixture inside the combustion chamber [
28]. This determined a flame distortion that was quantified by the Heywood circularity factor (HCF) corresponding to the ratio between the perimeter P of the image and the circumference of a perfect circle with the same area
.
To better characterise the previously mentioned effect, a new concept was introduced based on the quantitative analysis of the preferential propagation, evaluated by the ratio between flame size towards intake and exhaust, and left to right with respect to the position of spark plug. In addition, the size in horizontal and vertical axes was estimated. These parameters were calculated using Equations (1)–(4),
where
,
,
, and
indicated the distance between the extreme side of the flame front in each direction with respect to the spark plug (see
Figure 3). The tool for the automatic evaluation of distances was inserted in the image processing procedure for morphological analysis of flame propagation. Moreover, a supplementary routine was developed for post-processing; for each sequence, the images with the same flame size along the vertical axis direction (
, 45% of the piston diameter) were selected and then the ratio between the distances along
x and
y were calculated. This clamp size was chosen because it is representative of an intermediate phase of flame propagation, without any interference with the optical limit.
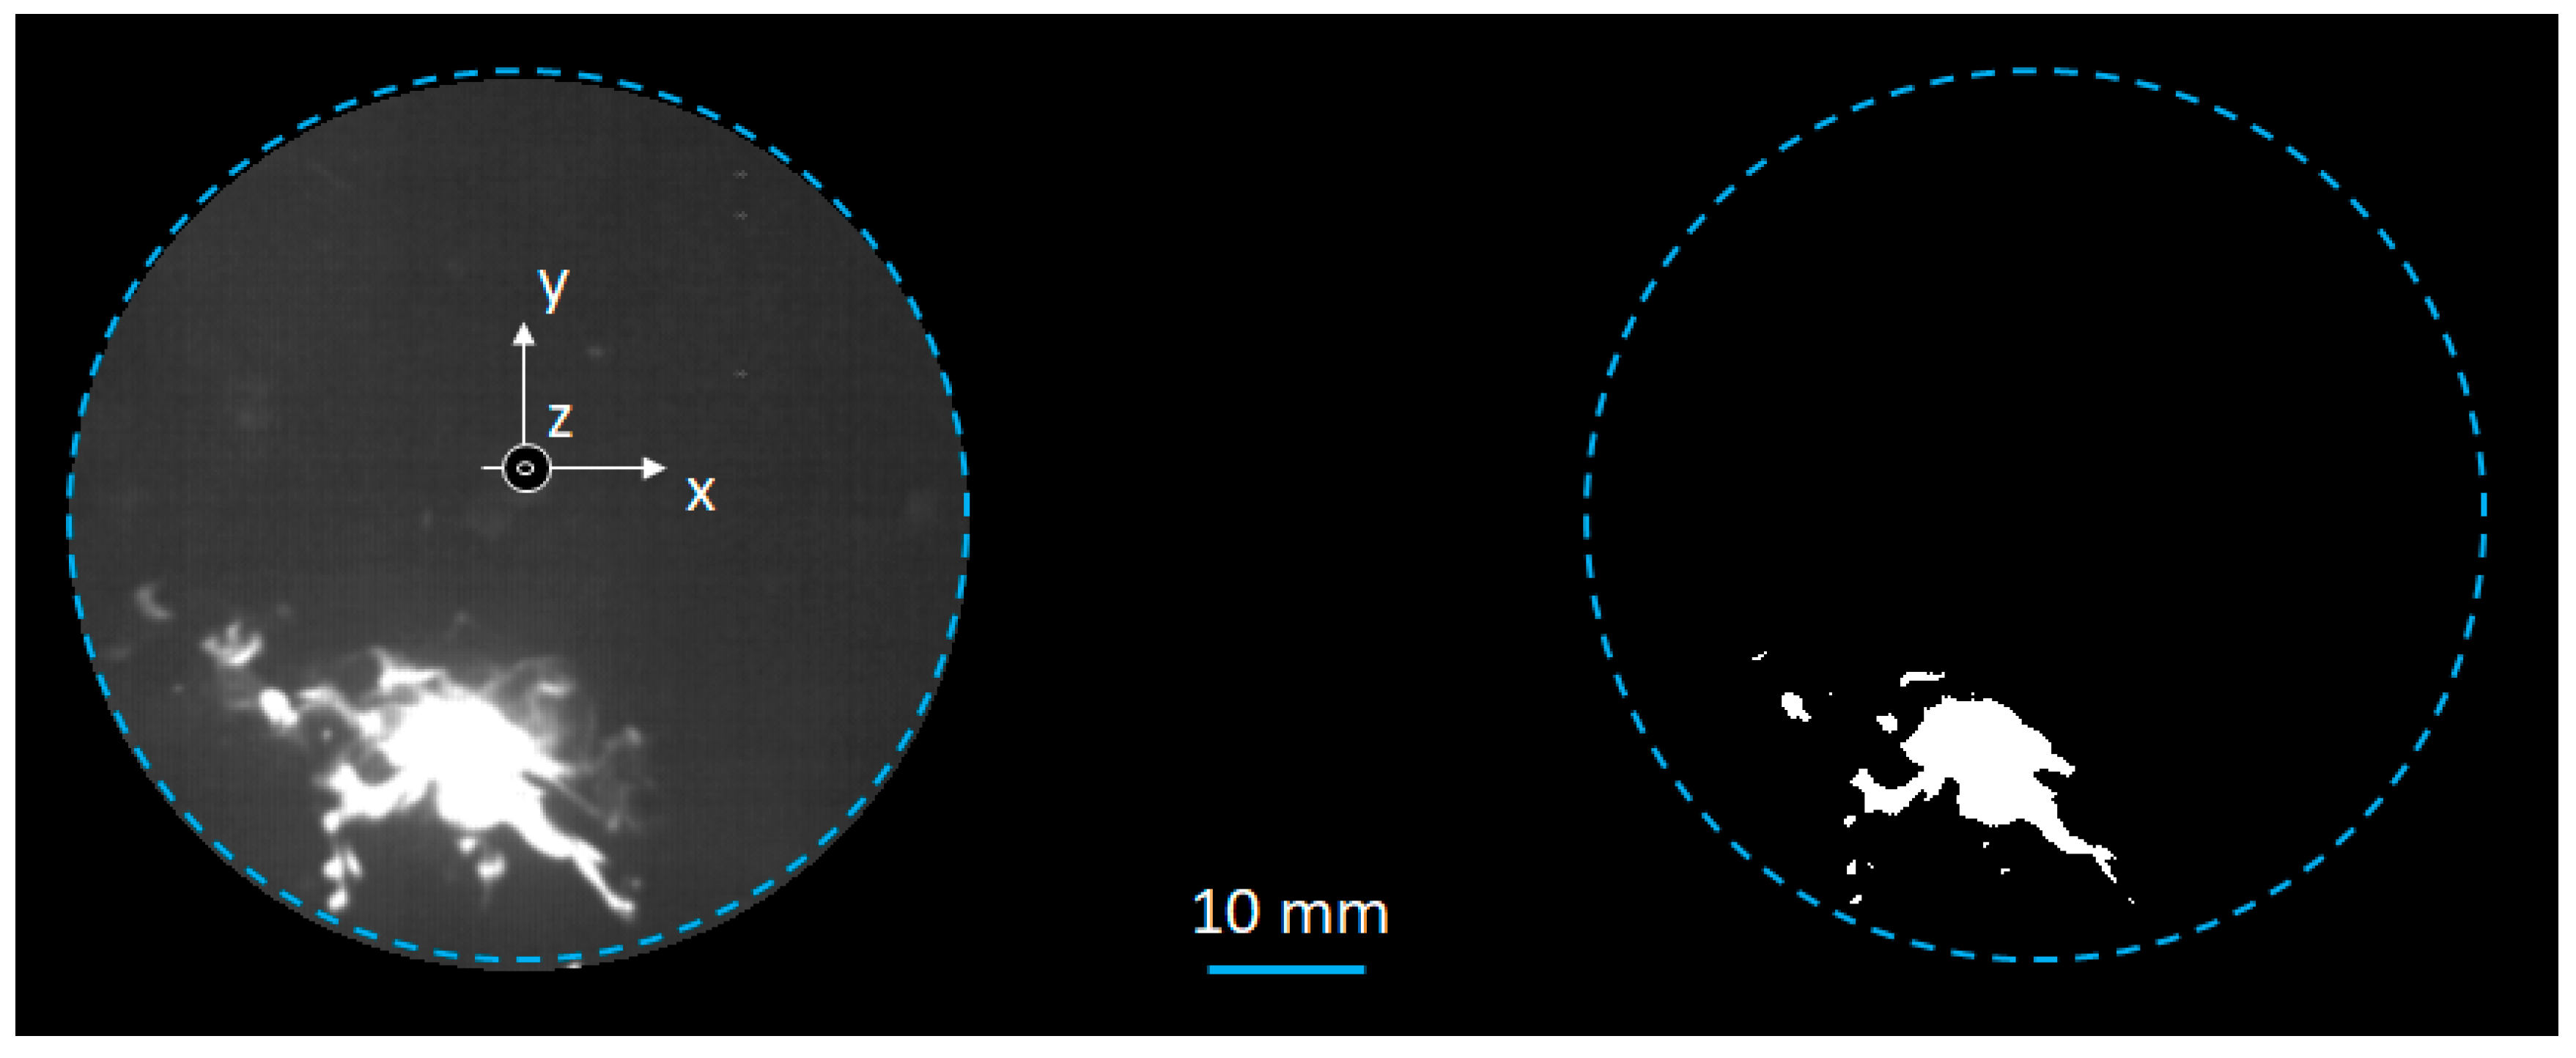
A tool was also implemented in the image processing for the characterization of the luminosity induced by the oxidation of liquid fuel films (
Figure 4) [
29,
30]. The tool applied a look-up table (LUT) exponential function to the circular masked images to improve the contrast of high-luminosity regions. Then, a manual threshold was fixed (200/255 bits images) to remove the flame front luminosity and background reflections. This method allows the separation of the high luminosity emission induced by the oxidation of fuel film as diffusive flames (
Figure 4). Successively, the area of these zones (white pixels in the binarized image shown in
Figure 4) was calculated with the same methodology used for the analysis of flame front propagation.
4. Results
The results section is divided into three subsections. First, a global analysis based on the measured in-cylinder pressure traces is presented. Following this, the cycle resolved visualization images and post-processing information in the different split injection modes is presented. A detailed morphology characterization of the flame front was performed. Lastly, soot formation is analysed based on the information taken from direct flame visualization and compared with the opacity results.
4.1. Thermodynamic Analysis
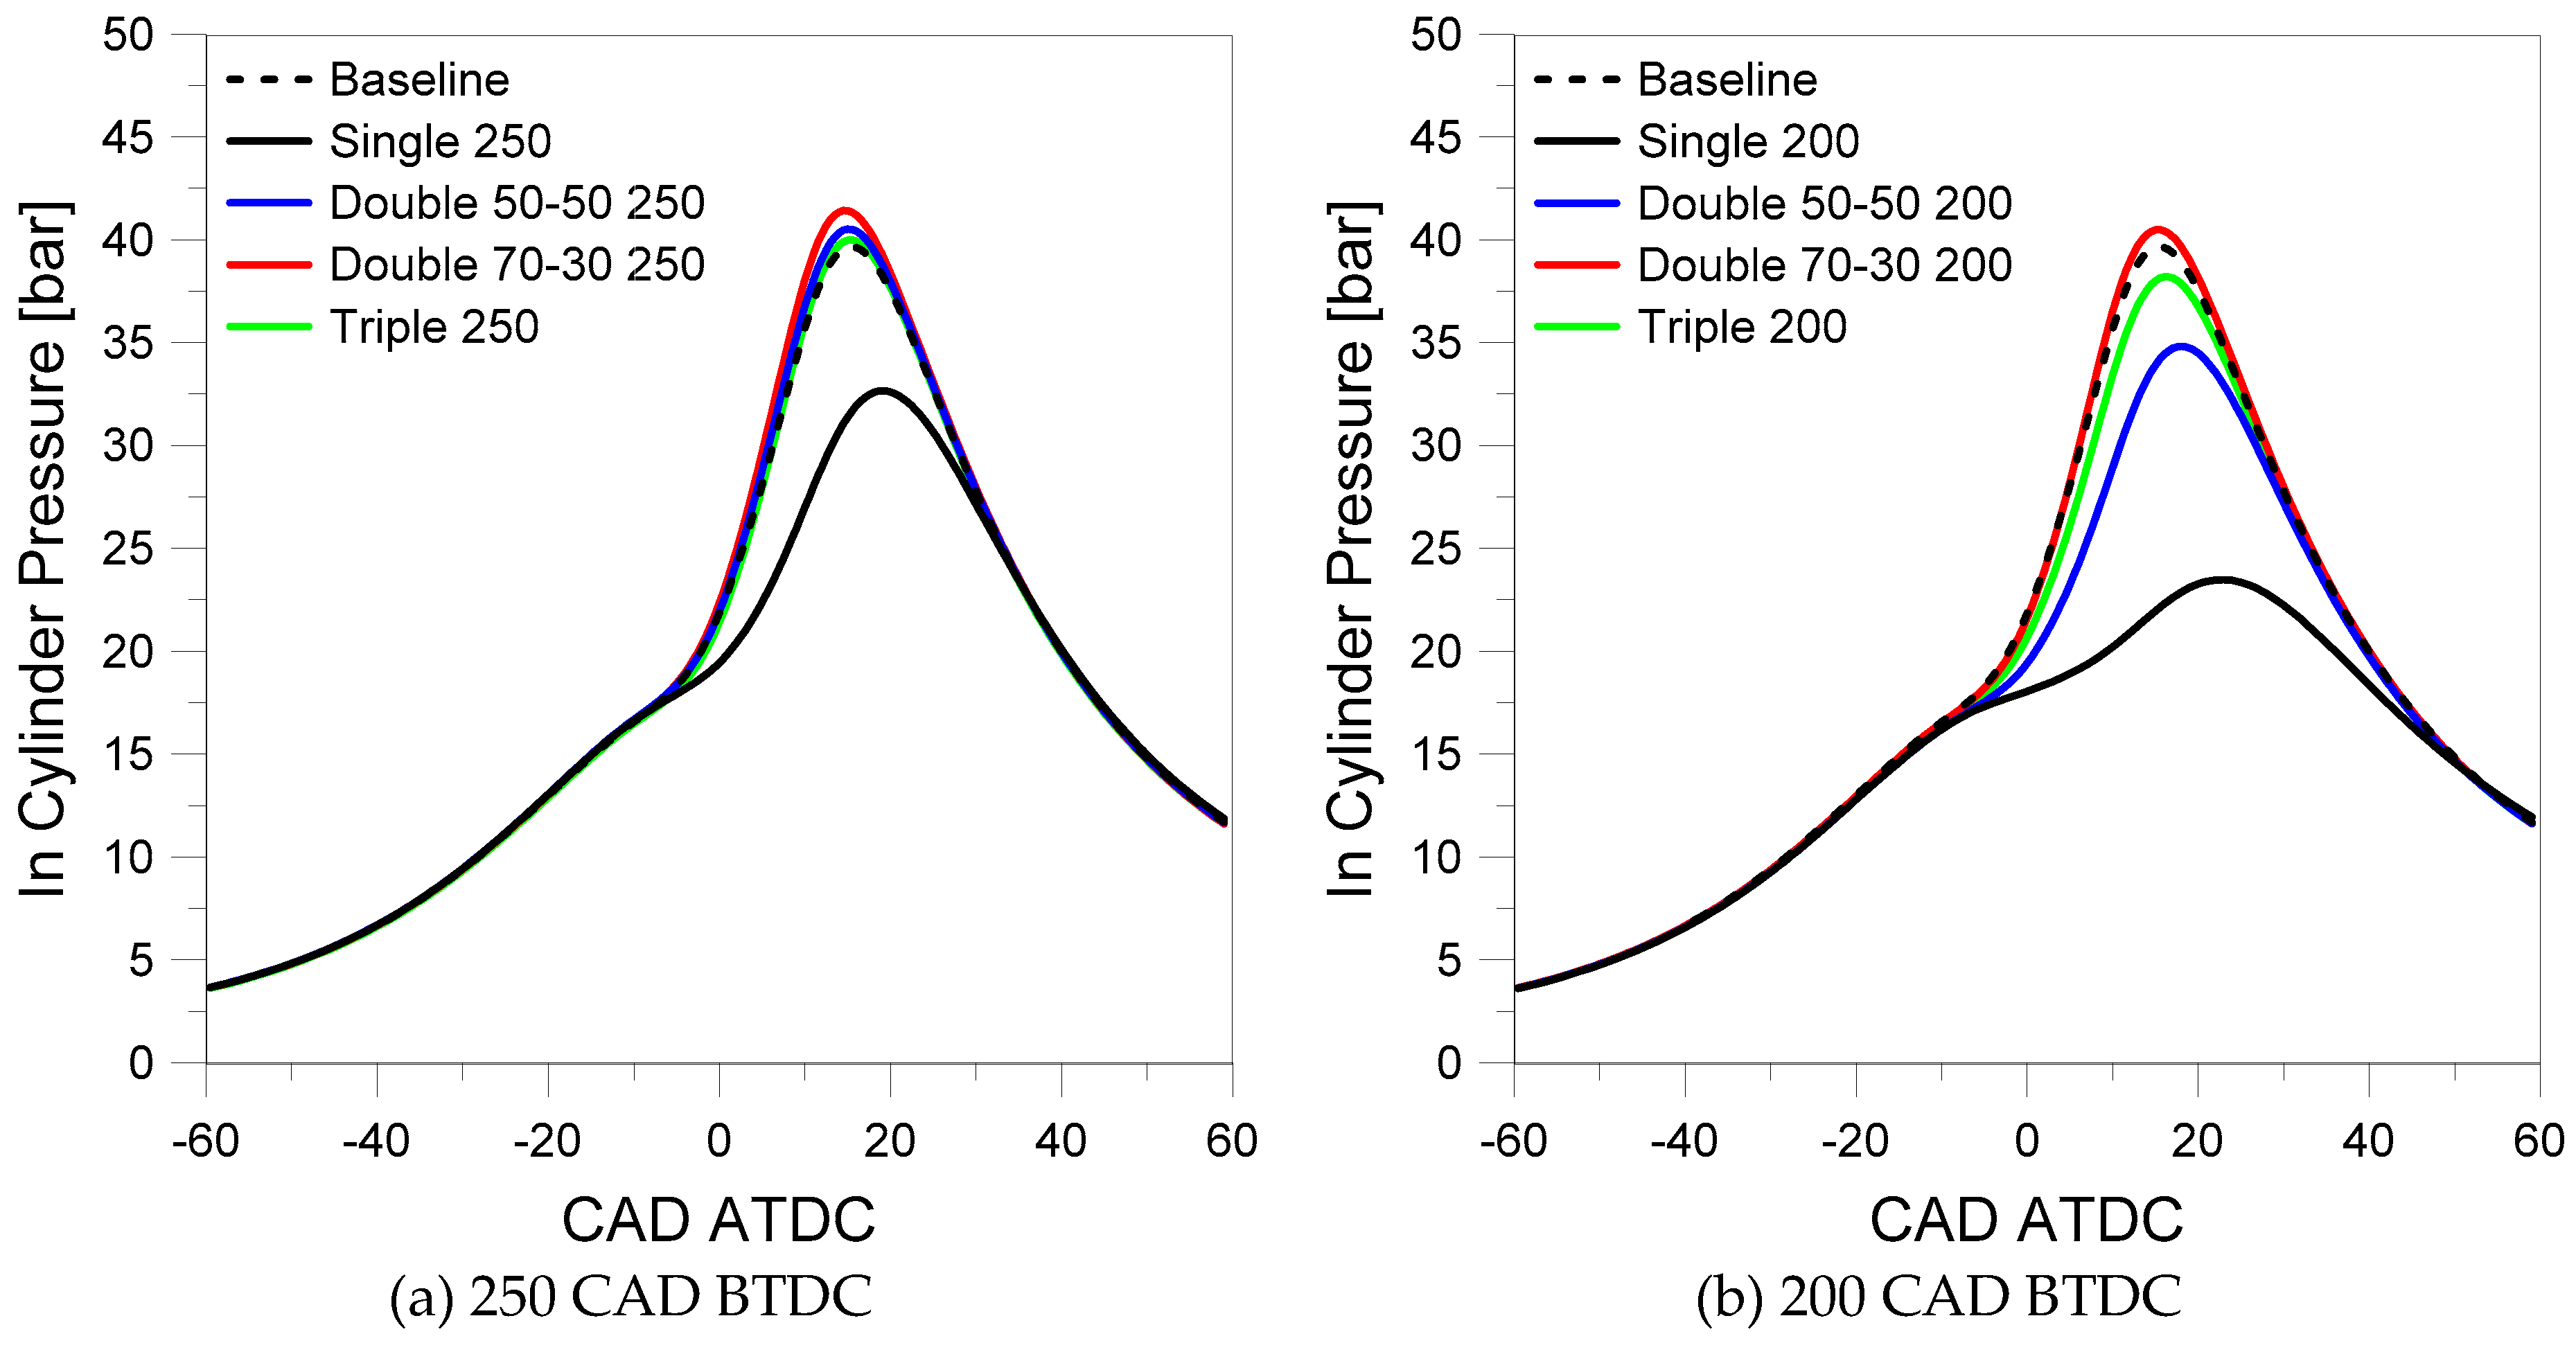
In-cylinder pressure was measured for all conditions presented in
Table 2, and the results are shown in
Figure 5. The earlier injection position
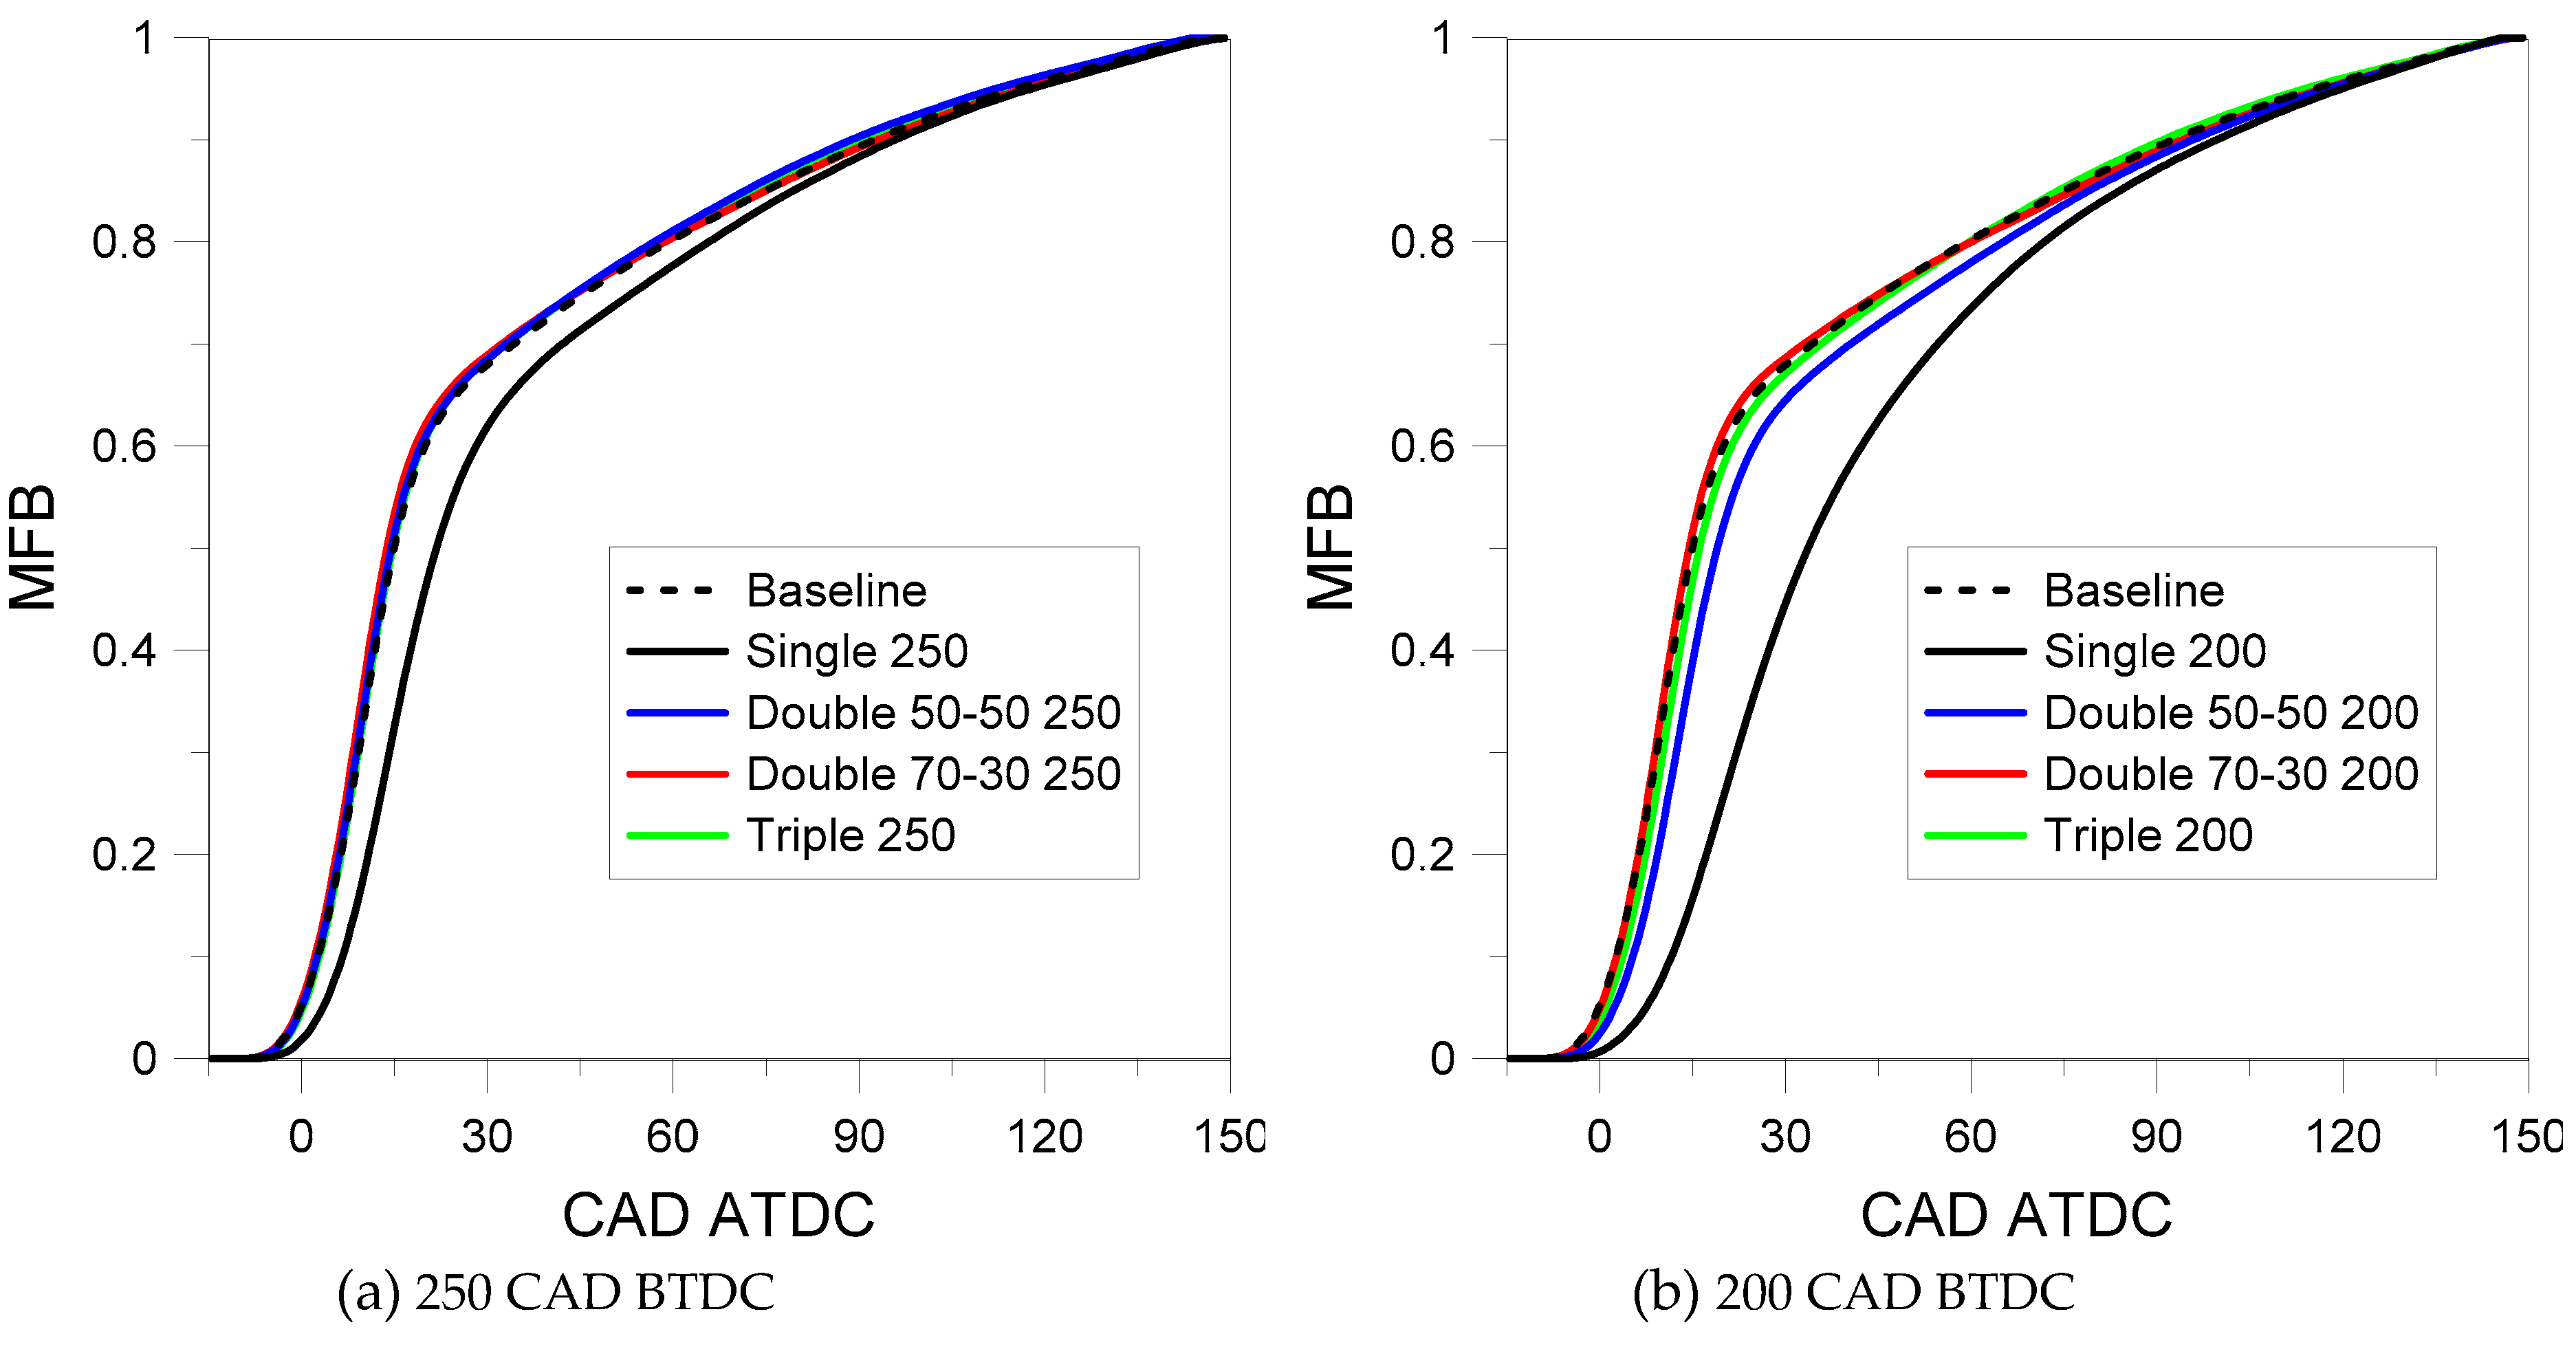
Figure 5-left was not strongly affected by the split injection. The baseline case, double and triple injections showed similar pressure traces. However, for the single injection case with SOI 250 CAD BTDC, the decrease in terms of peak in-cylinder pressure was significant (over 25%). These results suggest that retarding the main injection from 300 to 250 CAD BTDC results in a reduction of fuel-air homogeneity and with this, a slower combustion process. The effect was even more evident for the SOI 200 cases. This is directly seen in the MFB curve (
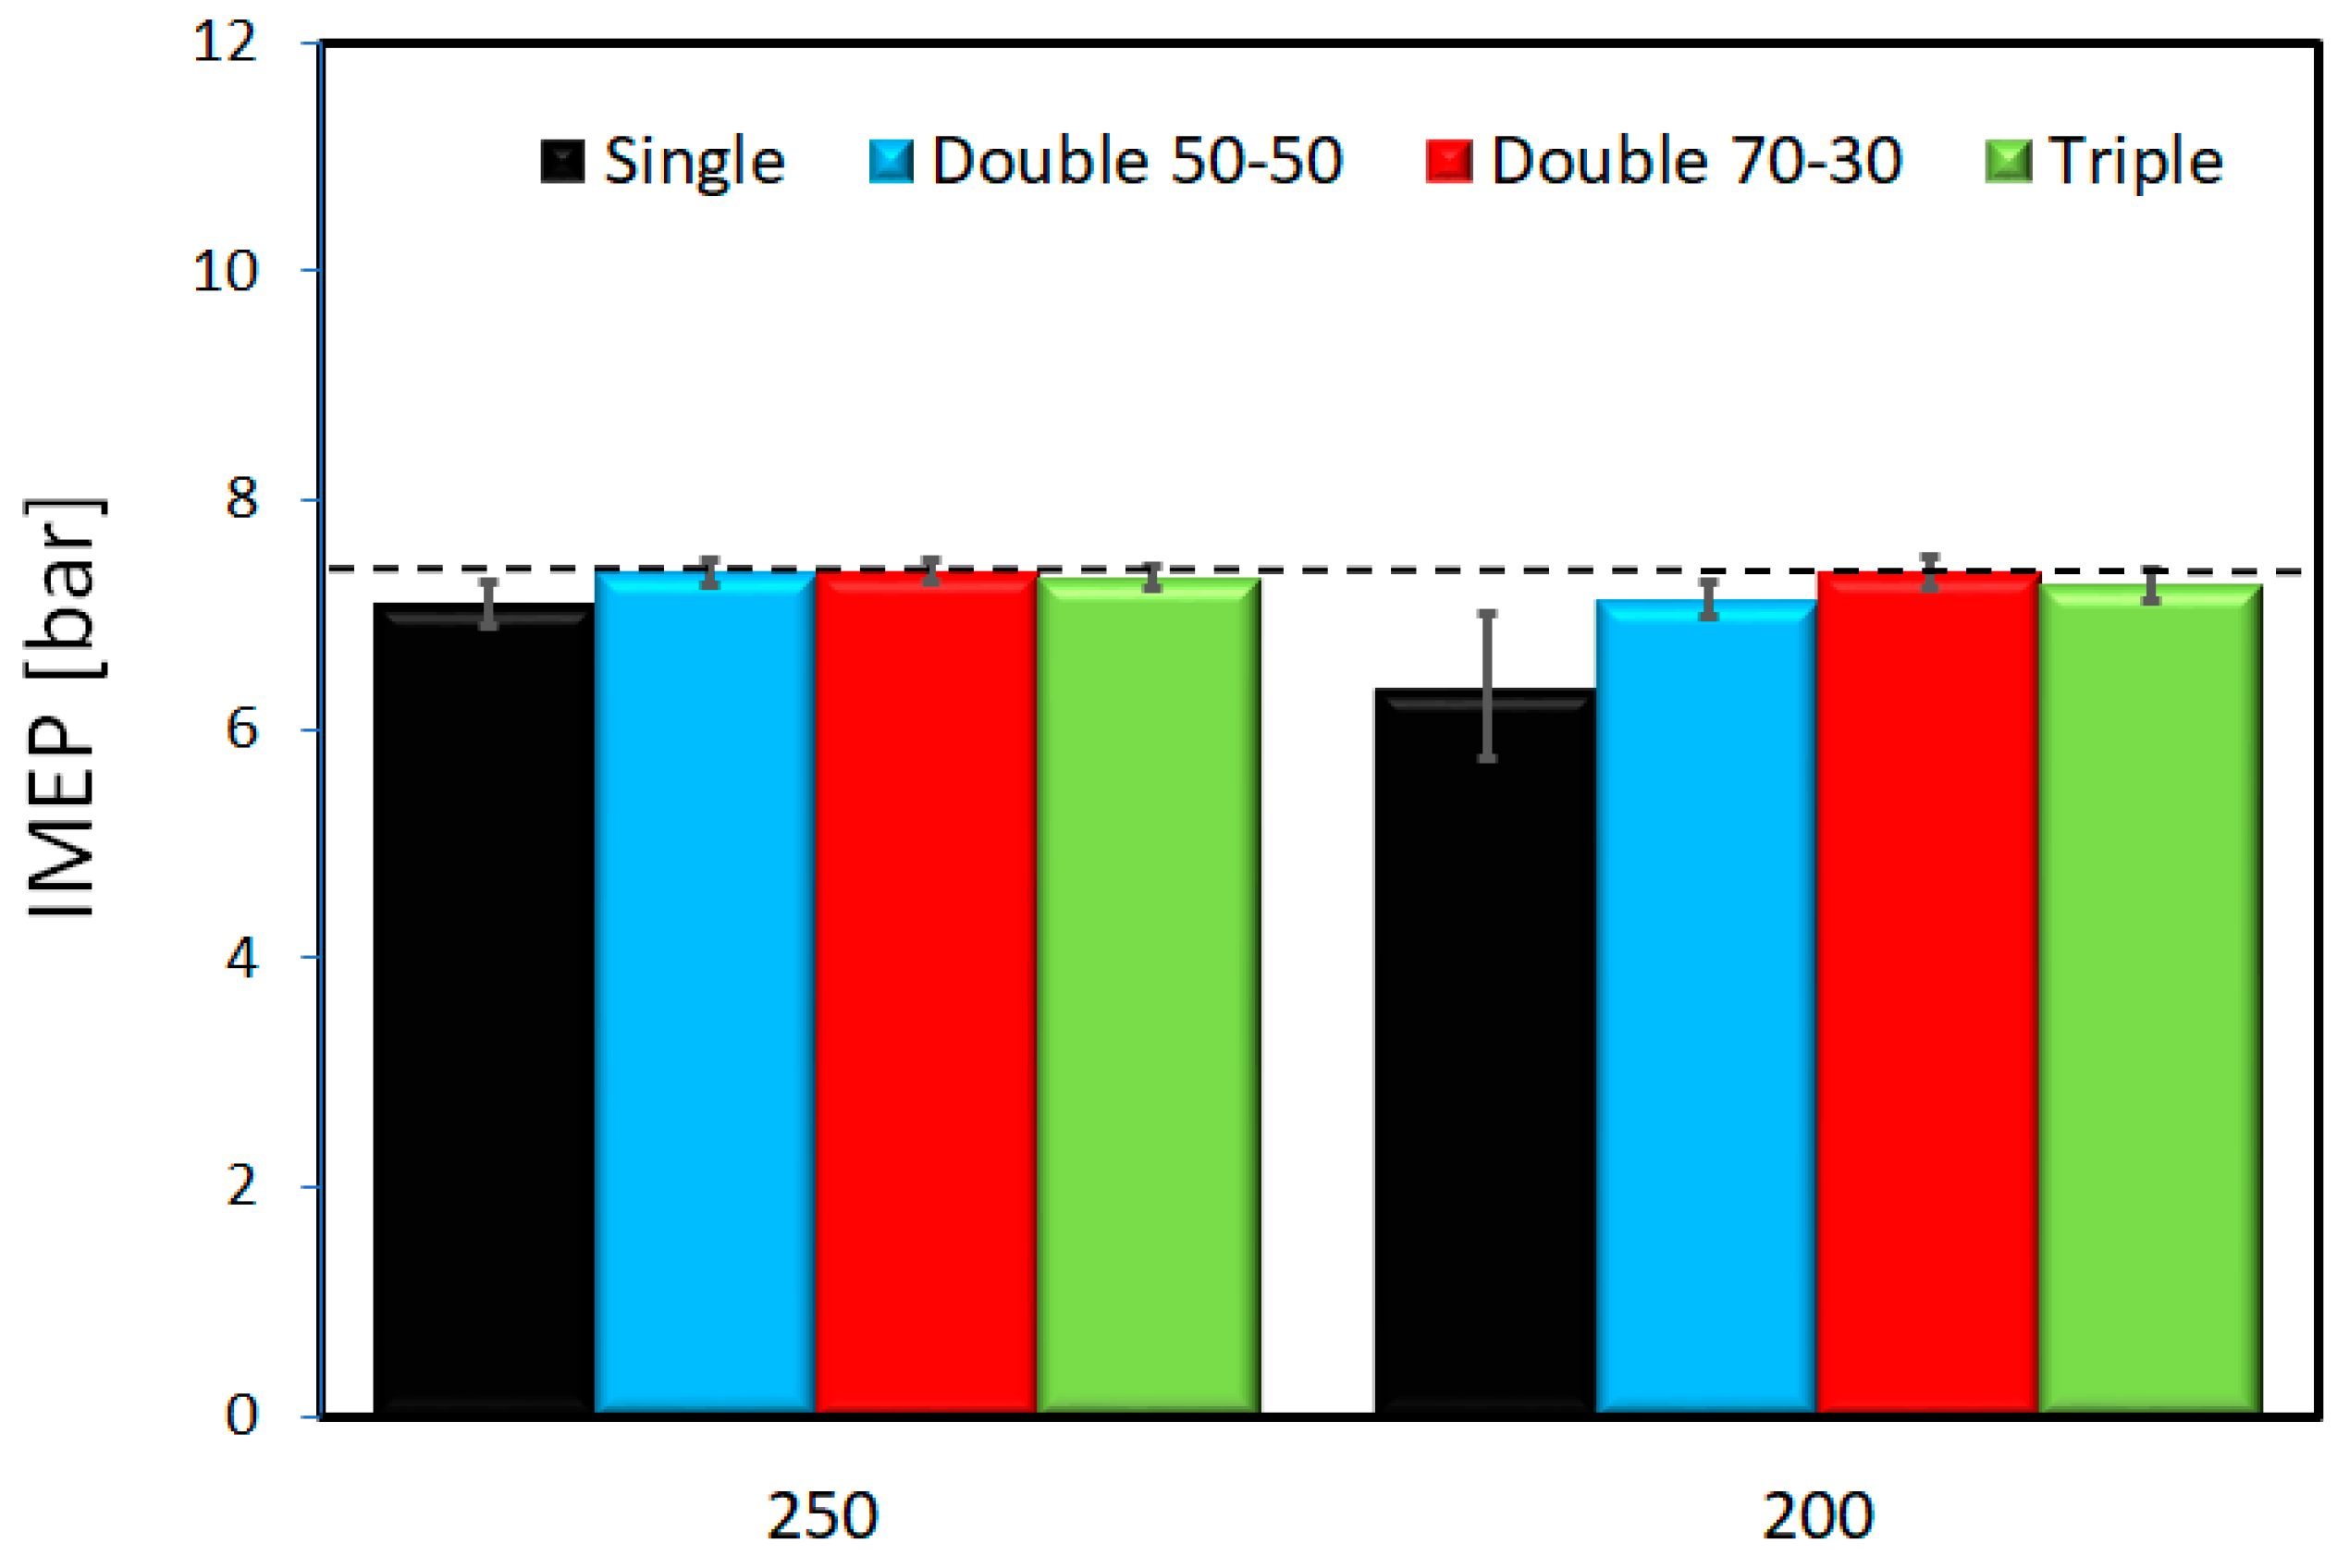
Figure 6a). As the spark timing was fixed, the variations in terms of performance (IMEP) seen in
Figure 7 can be directly related to the changes in injection patterns.
Similar behaviour was seen when retarding the second injection pulse (
Figure 5-right). For the case that the injected quantity during the second event was low (double 70-30), the pressure trace was similar to the baseline case. However, the decrease in terms of pressure was important for the case of single injection, double 50-50 and for the triple injection case. In these three cases, retarding the fuel delivery event(s) decreased overall combustion speed (
Figure 6b) and with that, resulted in lower performance values (
Figure 7).
An overall conclusion is that splitting the injection event decreases the effect of injection retarding, most likely due to the better homogeneity between fuel and air. When looking at the engine output values, all split injection strategies produced similar results to the baseline case, with only retarded single injection showing a decrease in IMEP. From this evaluation as well, placing the second injection at 250 CAD BTDC was found to ensure better results.
An important observation is that despite operating at WOT and 2000 rpm, the IMEP values are only around 7.2 bar (equivalent to an output power of 4.8 kW). This phenomenon is attributed to the fact that in units with optical accessibility the top land region and crevice volumes are larger than in commercial engines, as is the mass lost due to blow-by past the sealing rings. This reduces the compression ratio and lowers efficiency (5 to 10%) with respect to conventional engines. In addition, this effect prolongs the last phase of the combustion process (MFB between 90 CAD ATDC and 150 CAD ATDC), as observed in other work of the research group [
31]. On the other hand, this type of test bed provides valuable information in terms of in-cylinder phenomena. Therefore, it has been used by many researchers and companies in recent years [
1,
32,
33]. One other issue is that the optical window is flat, while the setup found in the commercial engine from which the cylinder head was taken featured a profile designed for wall guided stratification (i.e., one of the six fuel jets is deflected towards the spark plug by the piston shape for injection during the late compression stroke). Even if there are differences in fluid motion with respect to real-world applications, the fact that fuel delivery was performed during the intake stroke, as well as the fact that comparative analyses were intended, should reduce the influence of these alterations to a minimum.
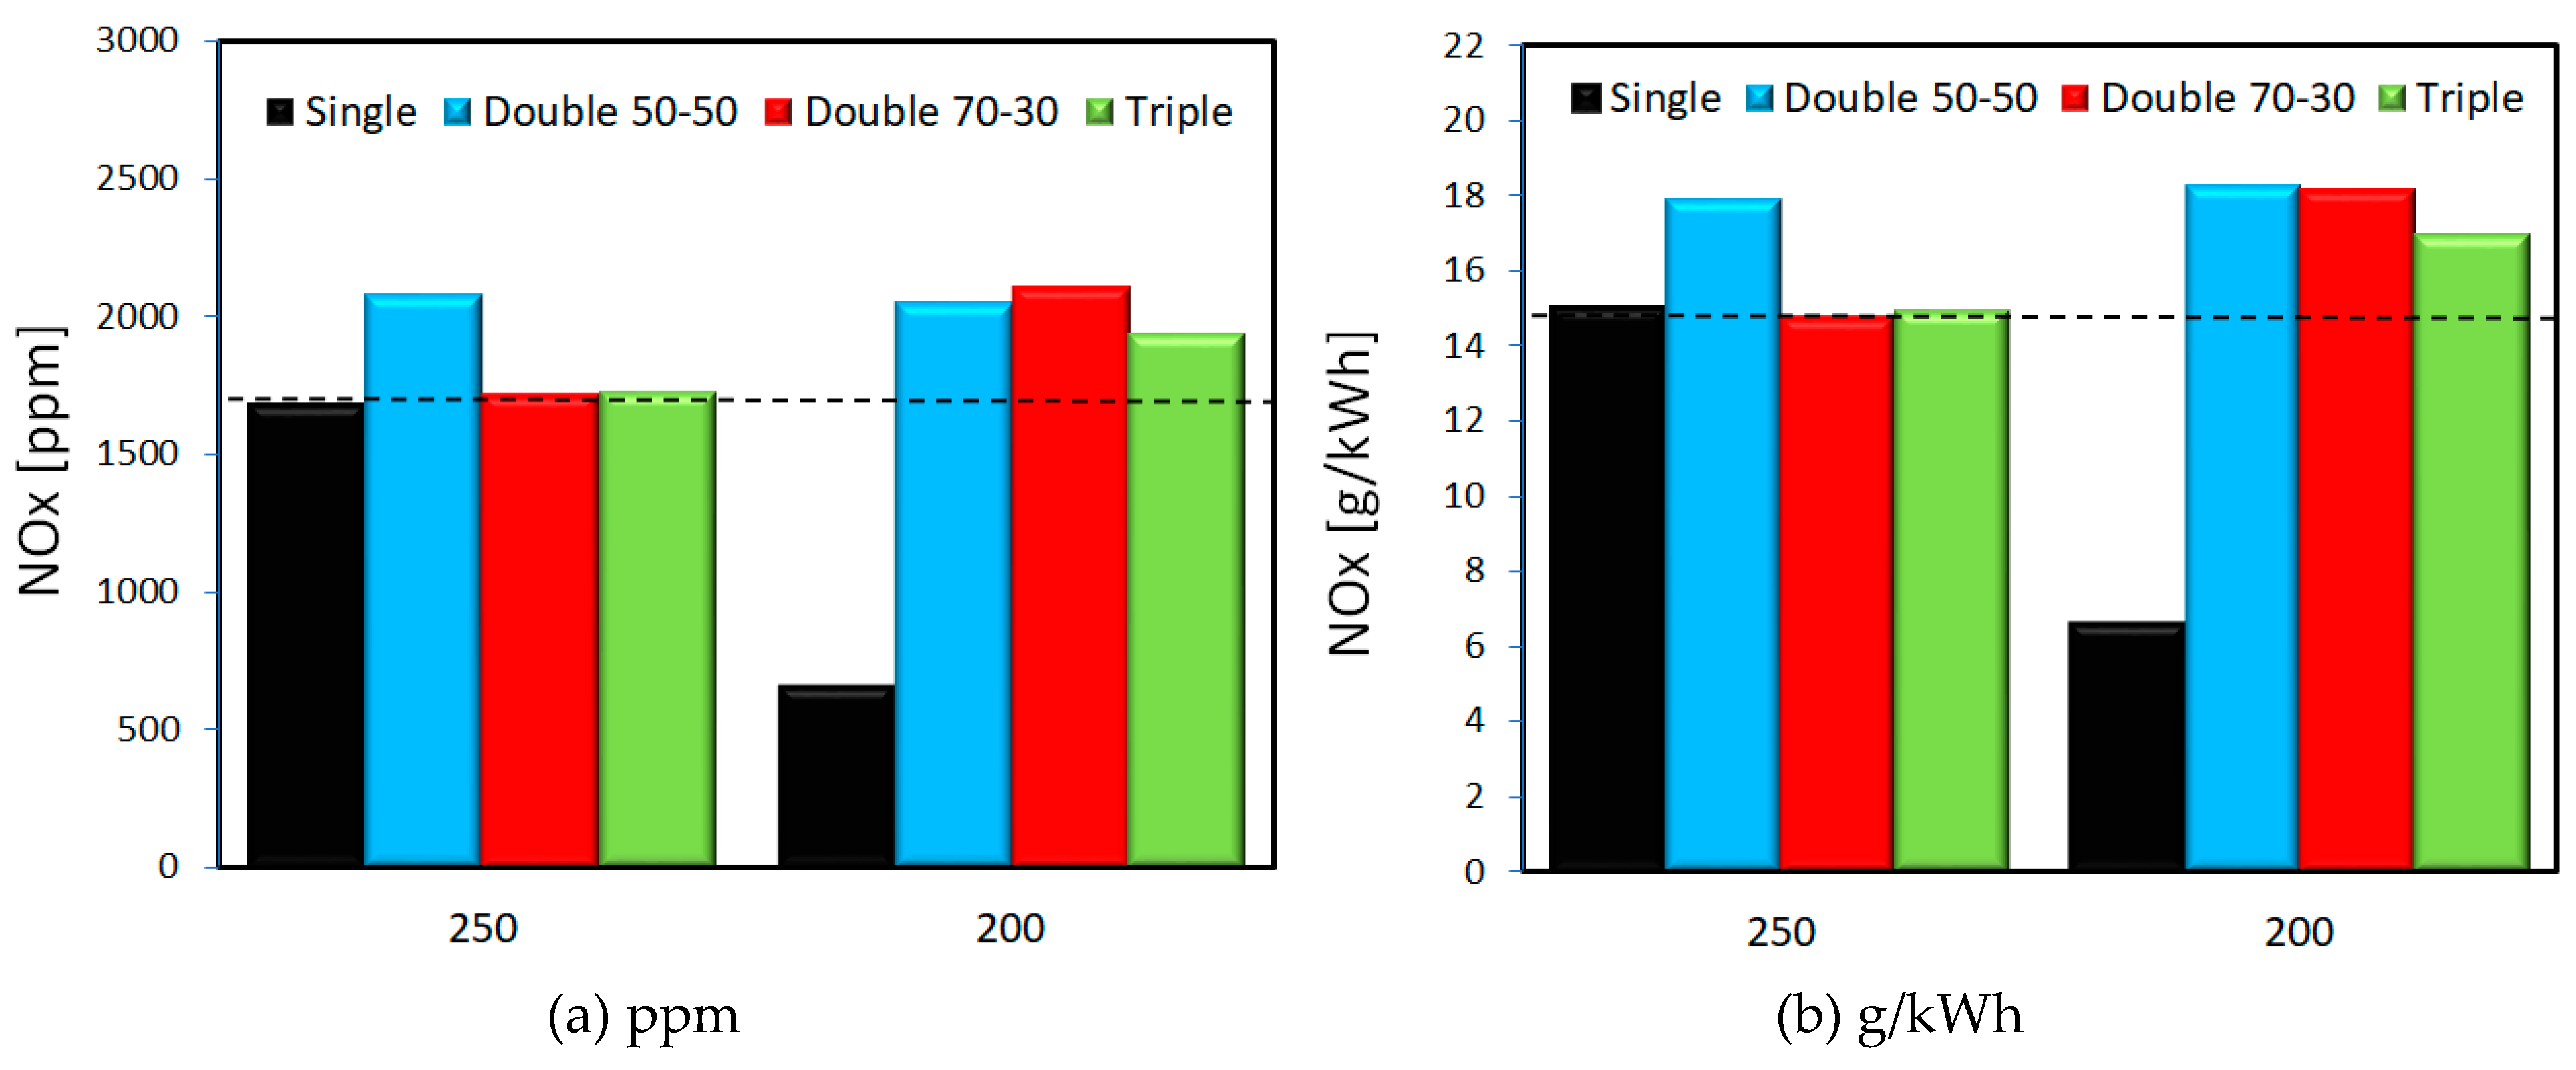
Given the relatively high conversion efficiency of oxidation catalysts that cut CO and HC emissions, the main elements that benefit significantly from direct reduction inside the combustion chamber are NO
x and particulate matter (PM). Strict rules such as Euro VI regulations are pushing engine manufacturers to develop new strategies and technologies to reach near-zero emissions in the future. In this context, split injection and other technology concepts need to be studied to optimize engine performance and emissions. For this test matrix, NO
x emissions were found to be higher when retarding the second (and third) injection pulse(s), as evidenced in
Figure 8. One of the two ‘extreme’ cases with respect to this pollutant category were double 50-50 at 250 CAD BTDC and single injection at 200 CAD BTDC. These cases also presented significant differences in peak pressure values, thus confirming the influence of temperature as dominant for NO
x. On the other hand, the other cases have similar pressure values but slight differences in measured NO
x concentration, suggesting that formation is linked with fuel homogeneity and the presence of locally lean/rich regions. The same trend can be seen for NO
x emissions in terms of ppm or g/kWh due to similar engine performance (
Figure 7) and volumetric efficiency. The same explanation that was found for the low IMEP values can be attributed to the relatively high specific emission values with respect to commercial GDI engines. Nonetheless, the information is still of interest when comparing the differences between different injection strategies.
The measured values for opacity in the exhaust line (around 1%) suggests similar particulate emission for all the cases that were investigated. However, the duration of continuous firing is reduced for optical single cylinder engines. Therefore, better insight can be gained by applying optical techniques in the combustion chamber, as detailed in the next sections.
4.2. Cycle Resolved Visualization Analysis
In this study, after the global analysis of the combustion process with the thermodynamic tools, the sequence of images acquired with the high-speed camera were post-processed and analysed to have a better understanding of the spatial behaviour of the combustion process.
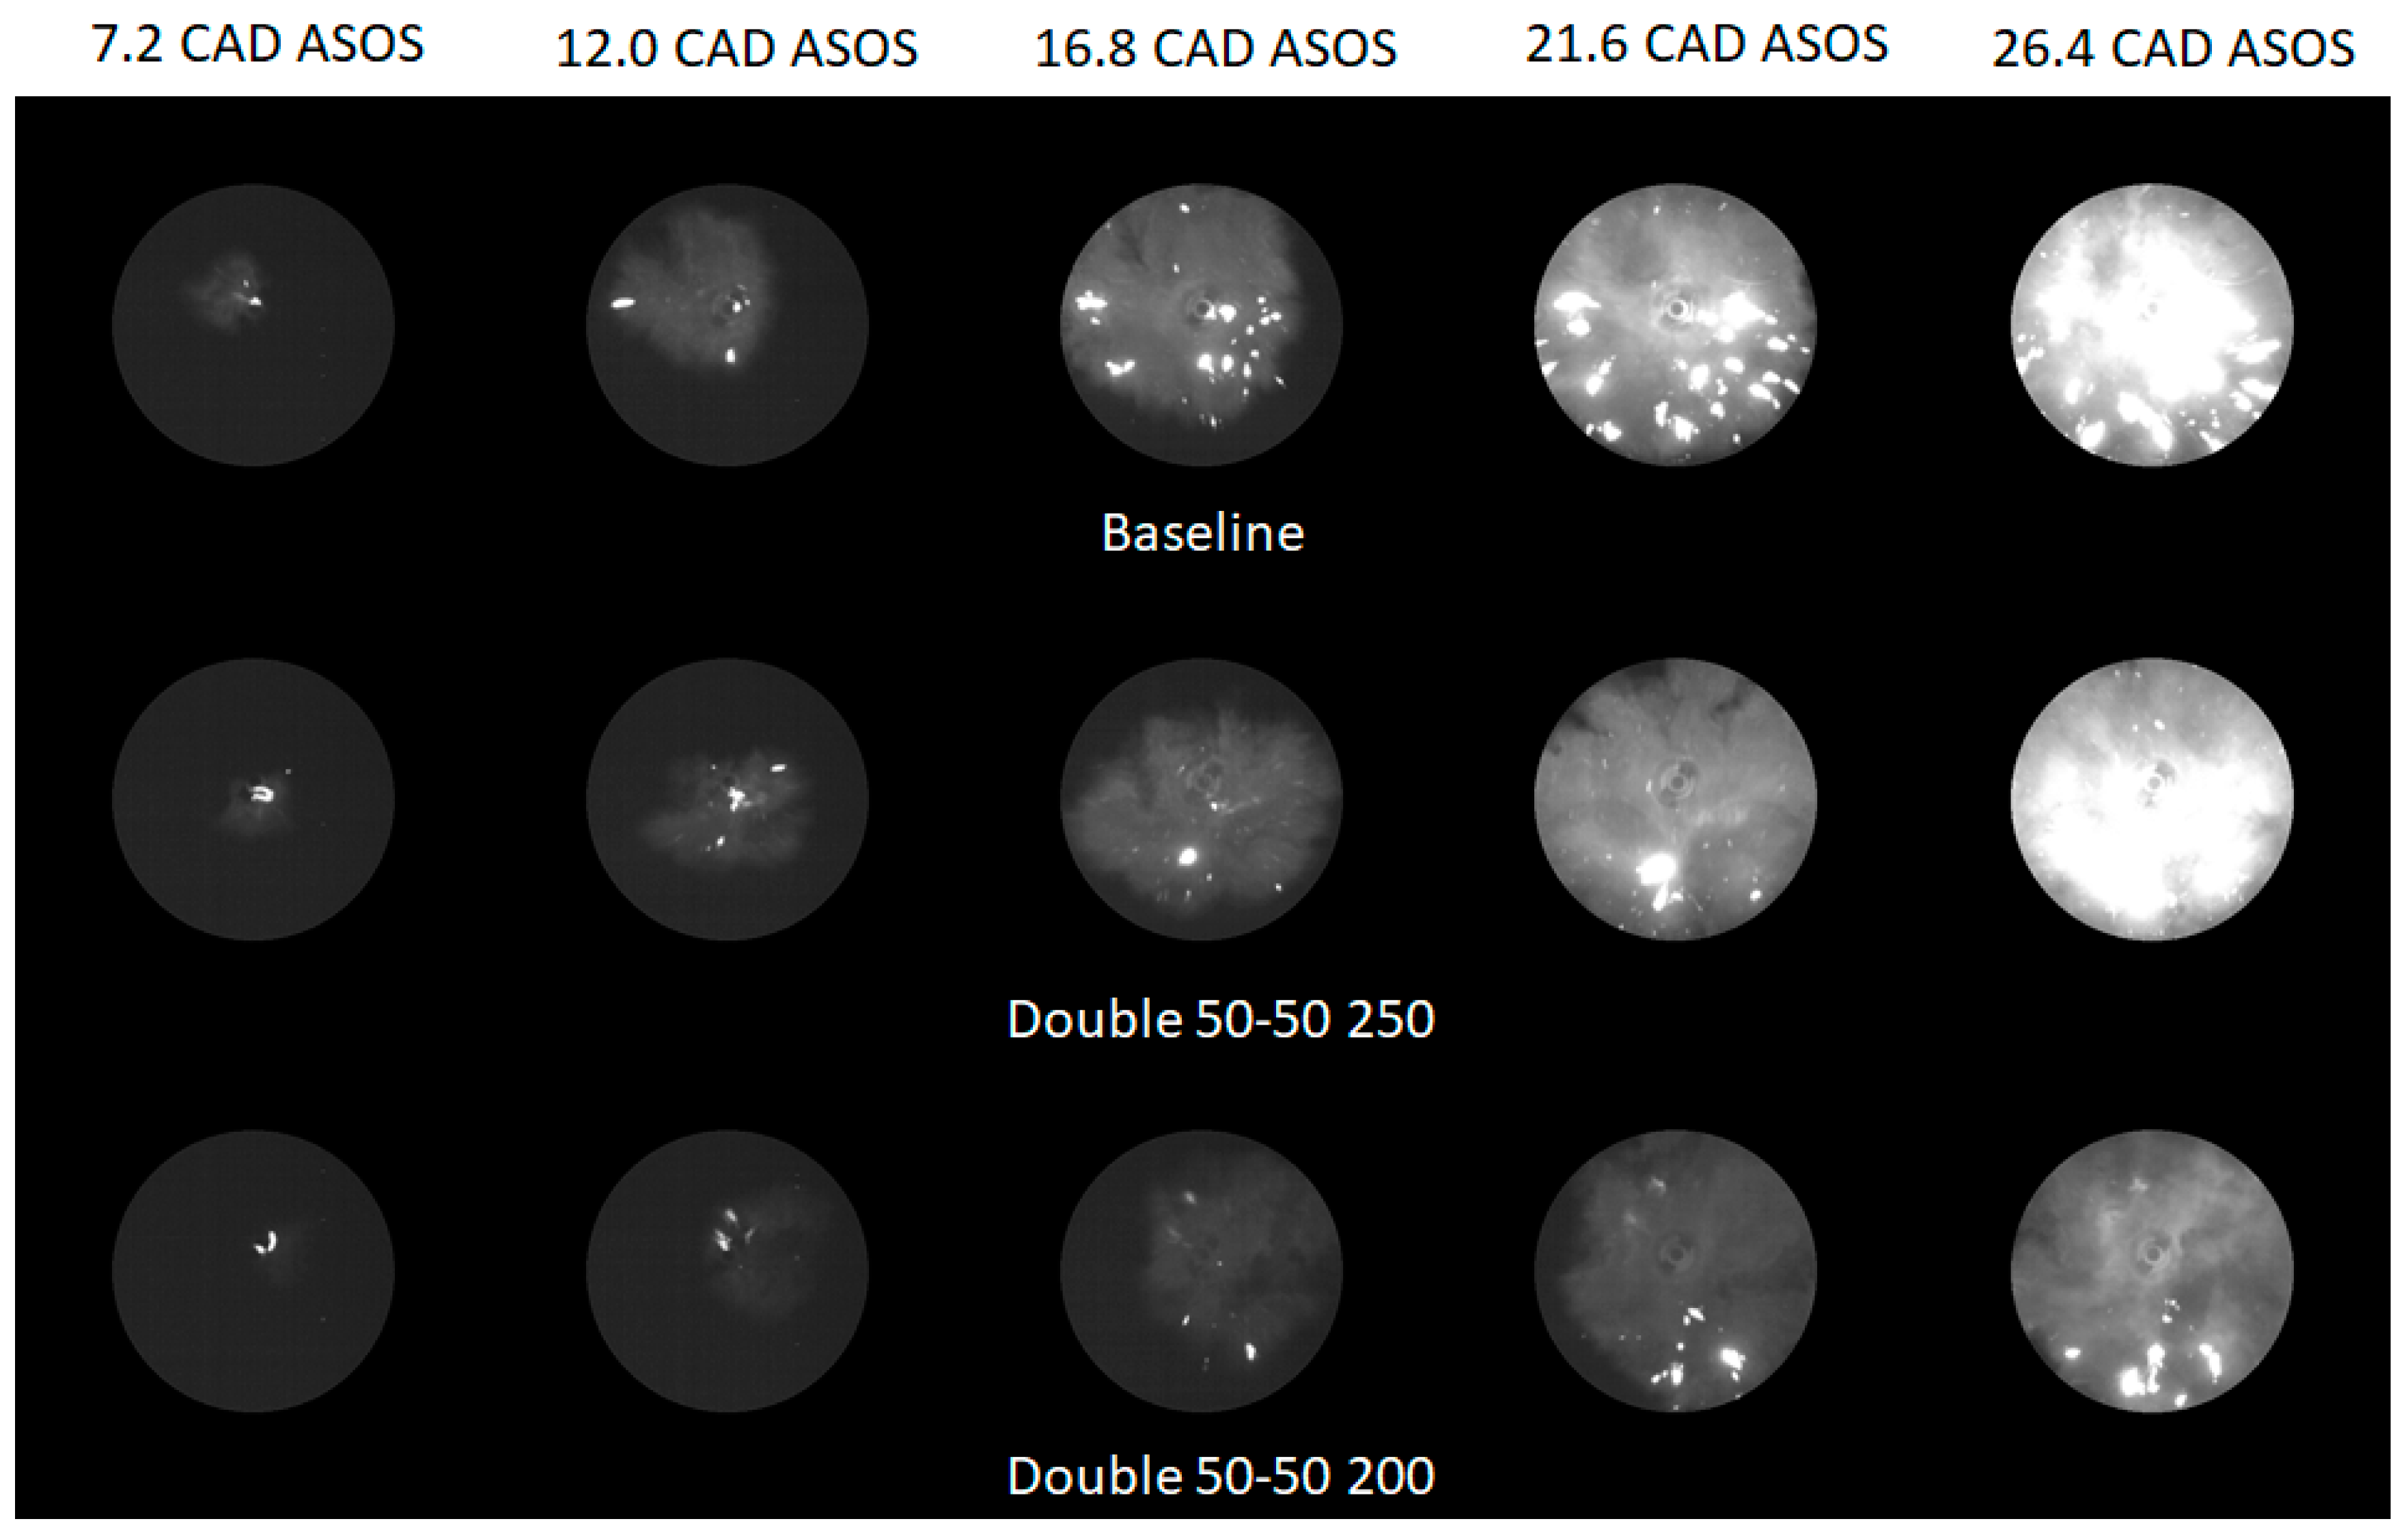
Figure 9 shows a selection of representative images of the combustion process in the first stage for the baseline case and the two cases of double injection with different second injection phasing. The images are presented in terms of crank angle after the start of the spark (ASOS). By analysing these raw data images, it is possible to note a decrease in terms of flame luminosity as fuel delivery events were retarded. In addition, flame growth is lower for the double 50-50 at 200 CAD BTDC with respect to the other two cases. This behaviour could be associated with differences in the air-fuel mixing as was hypothesized for the thermodynamic analysis.
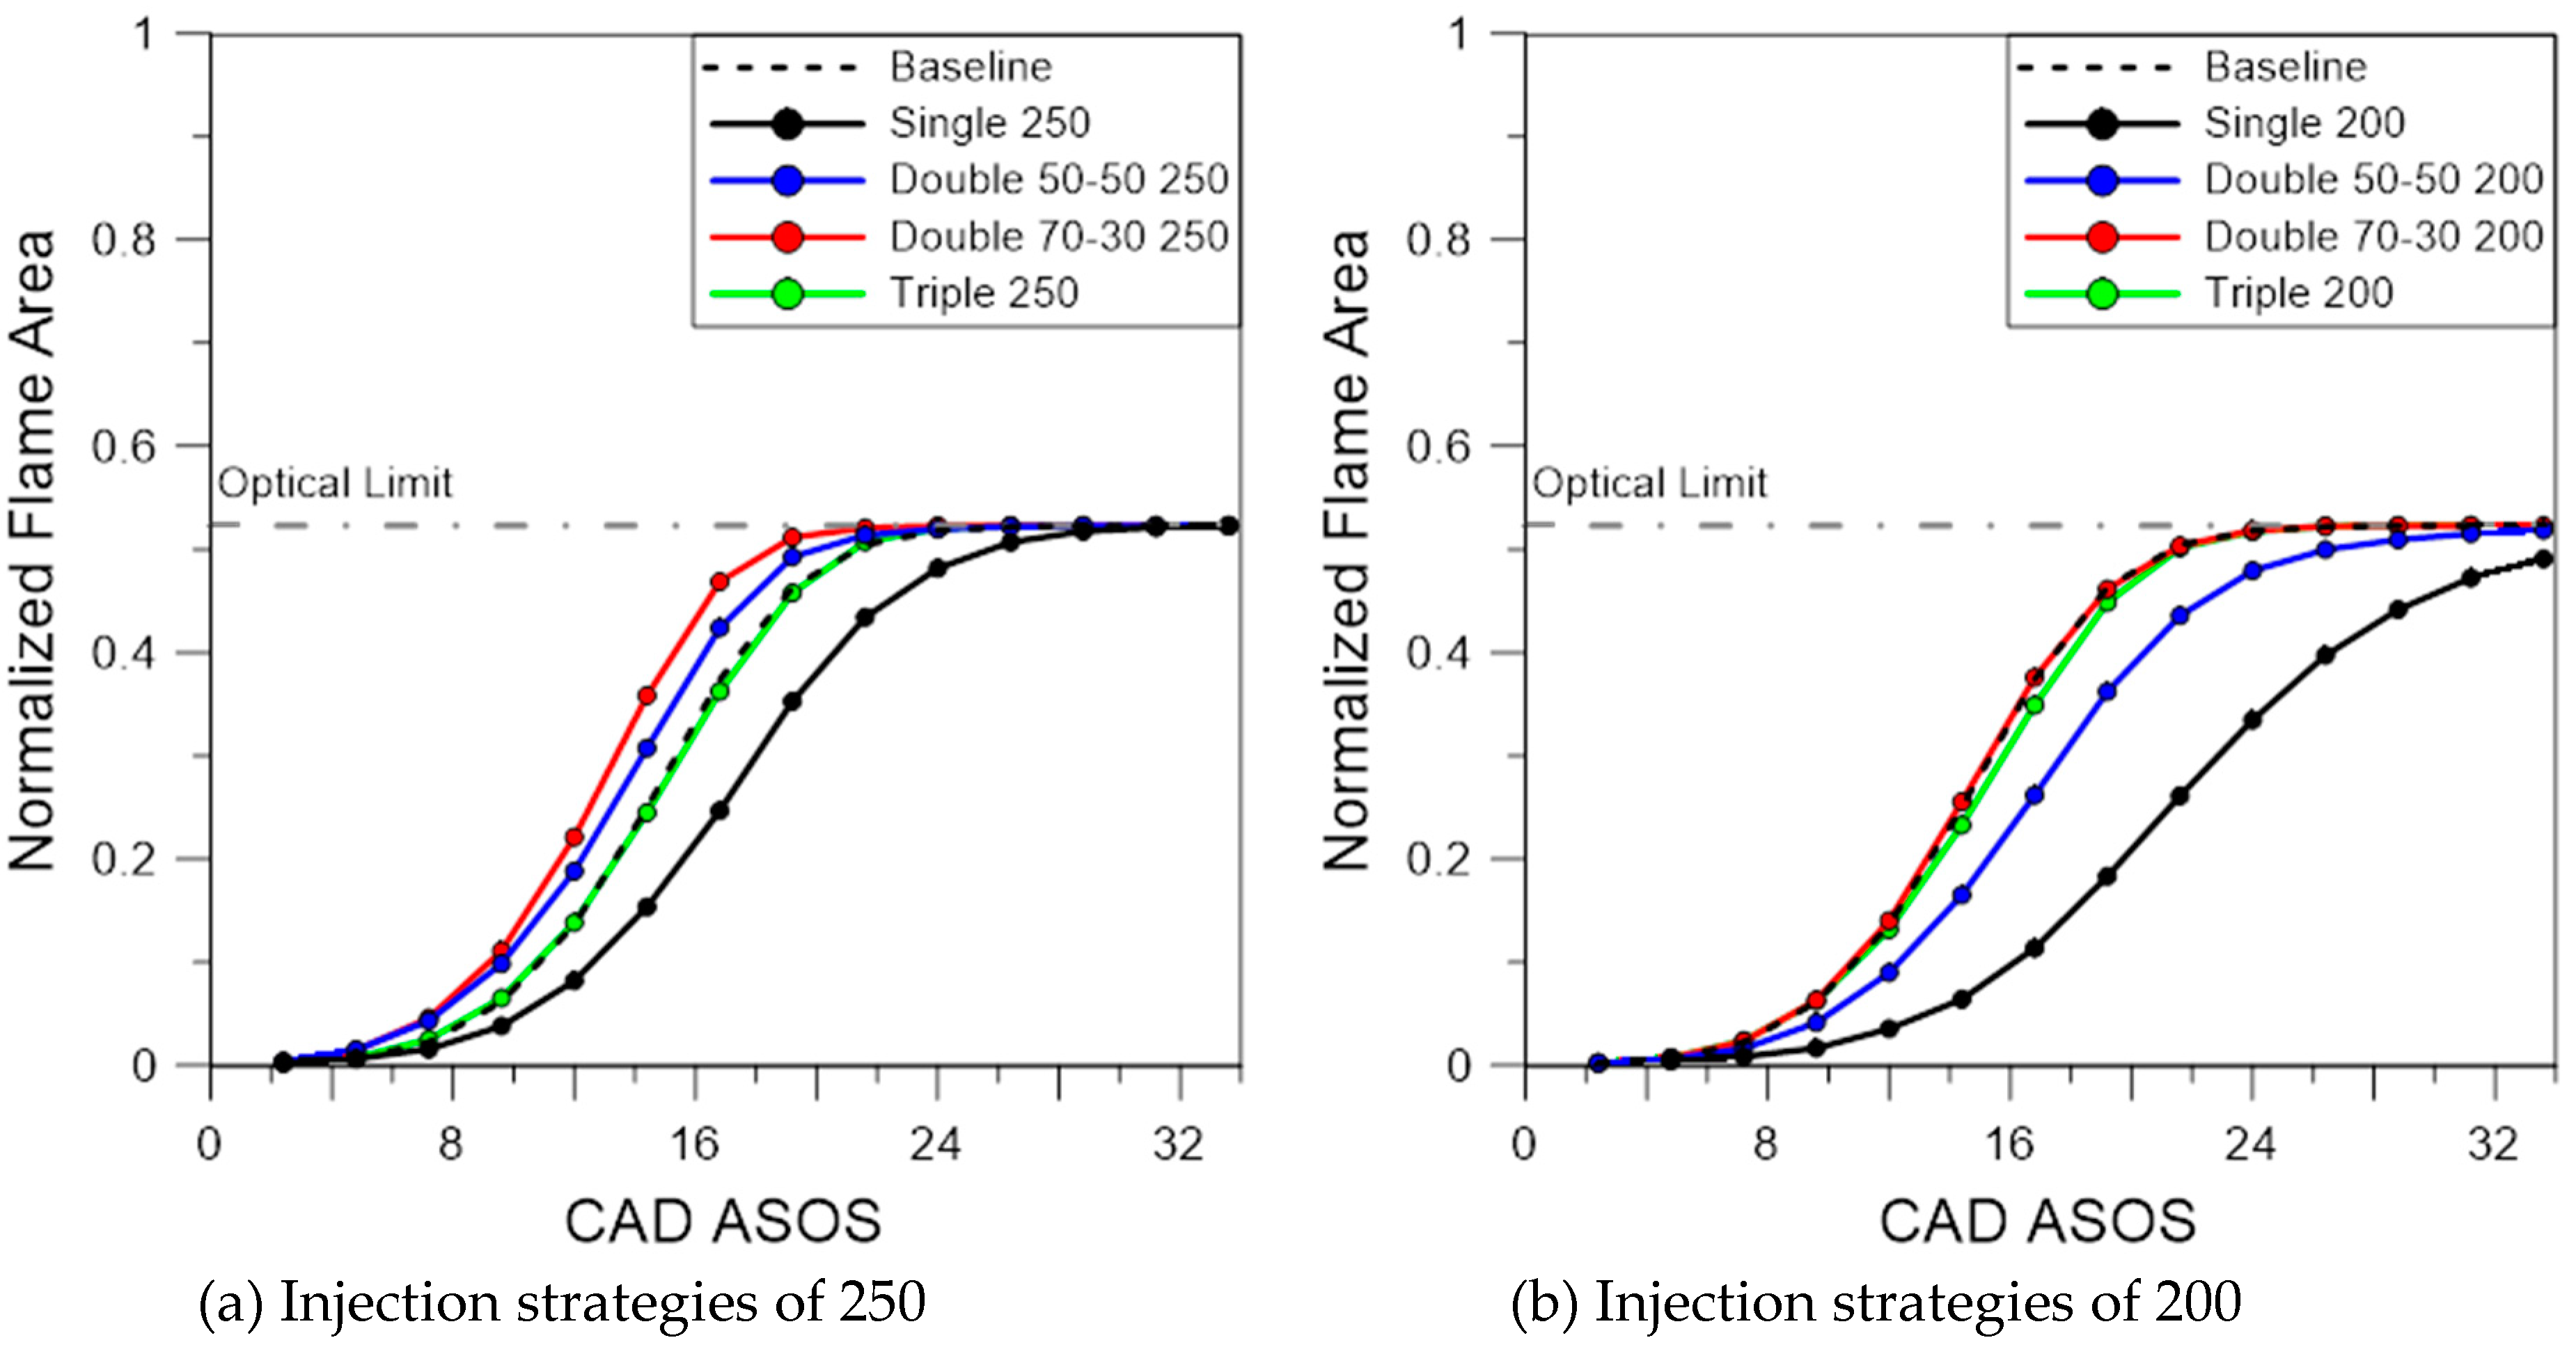
For all the cases tested, flame morphology was studied with the post-processing methodology explained in the Optical Analysis section.
Figure 10 shows the results of the area growth normalized by the piston cross-section. For the cases of early injection (
Figure 10a) the split improves the combustion process. However, for the cases where the injection was retarded, flame growth showed significant delay for single and double injections. Triple injection featured similar behaviour compared with the baseline, while the double 70-30 shows the best results. Therefore, splitting the injection seems to render the flame propagation process less sensitive to fuel delivery phasing compared to single cases.
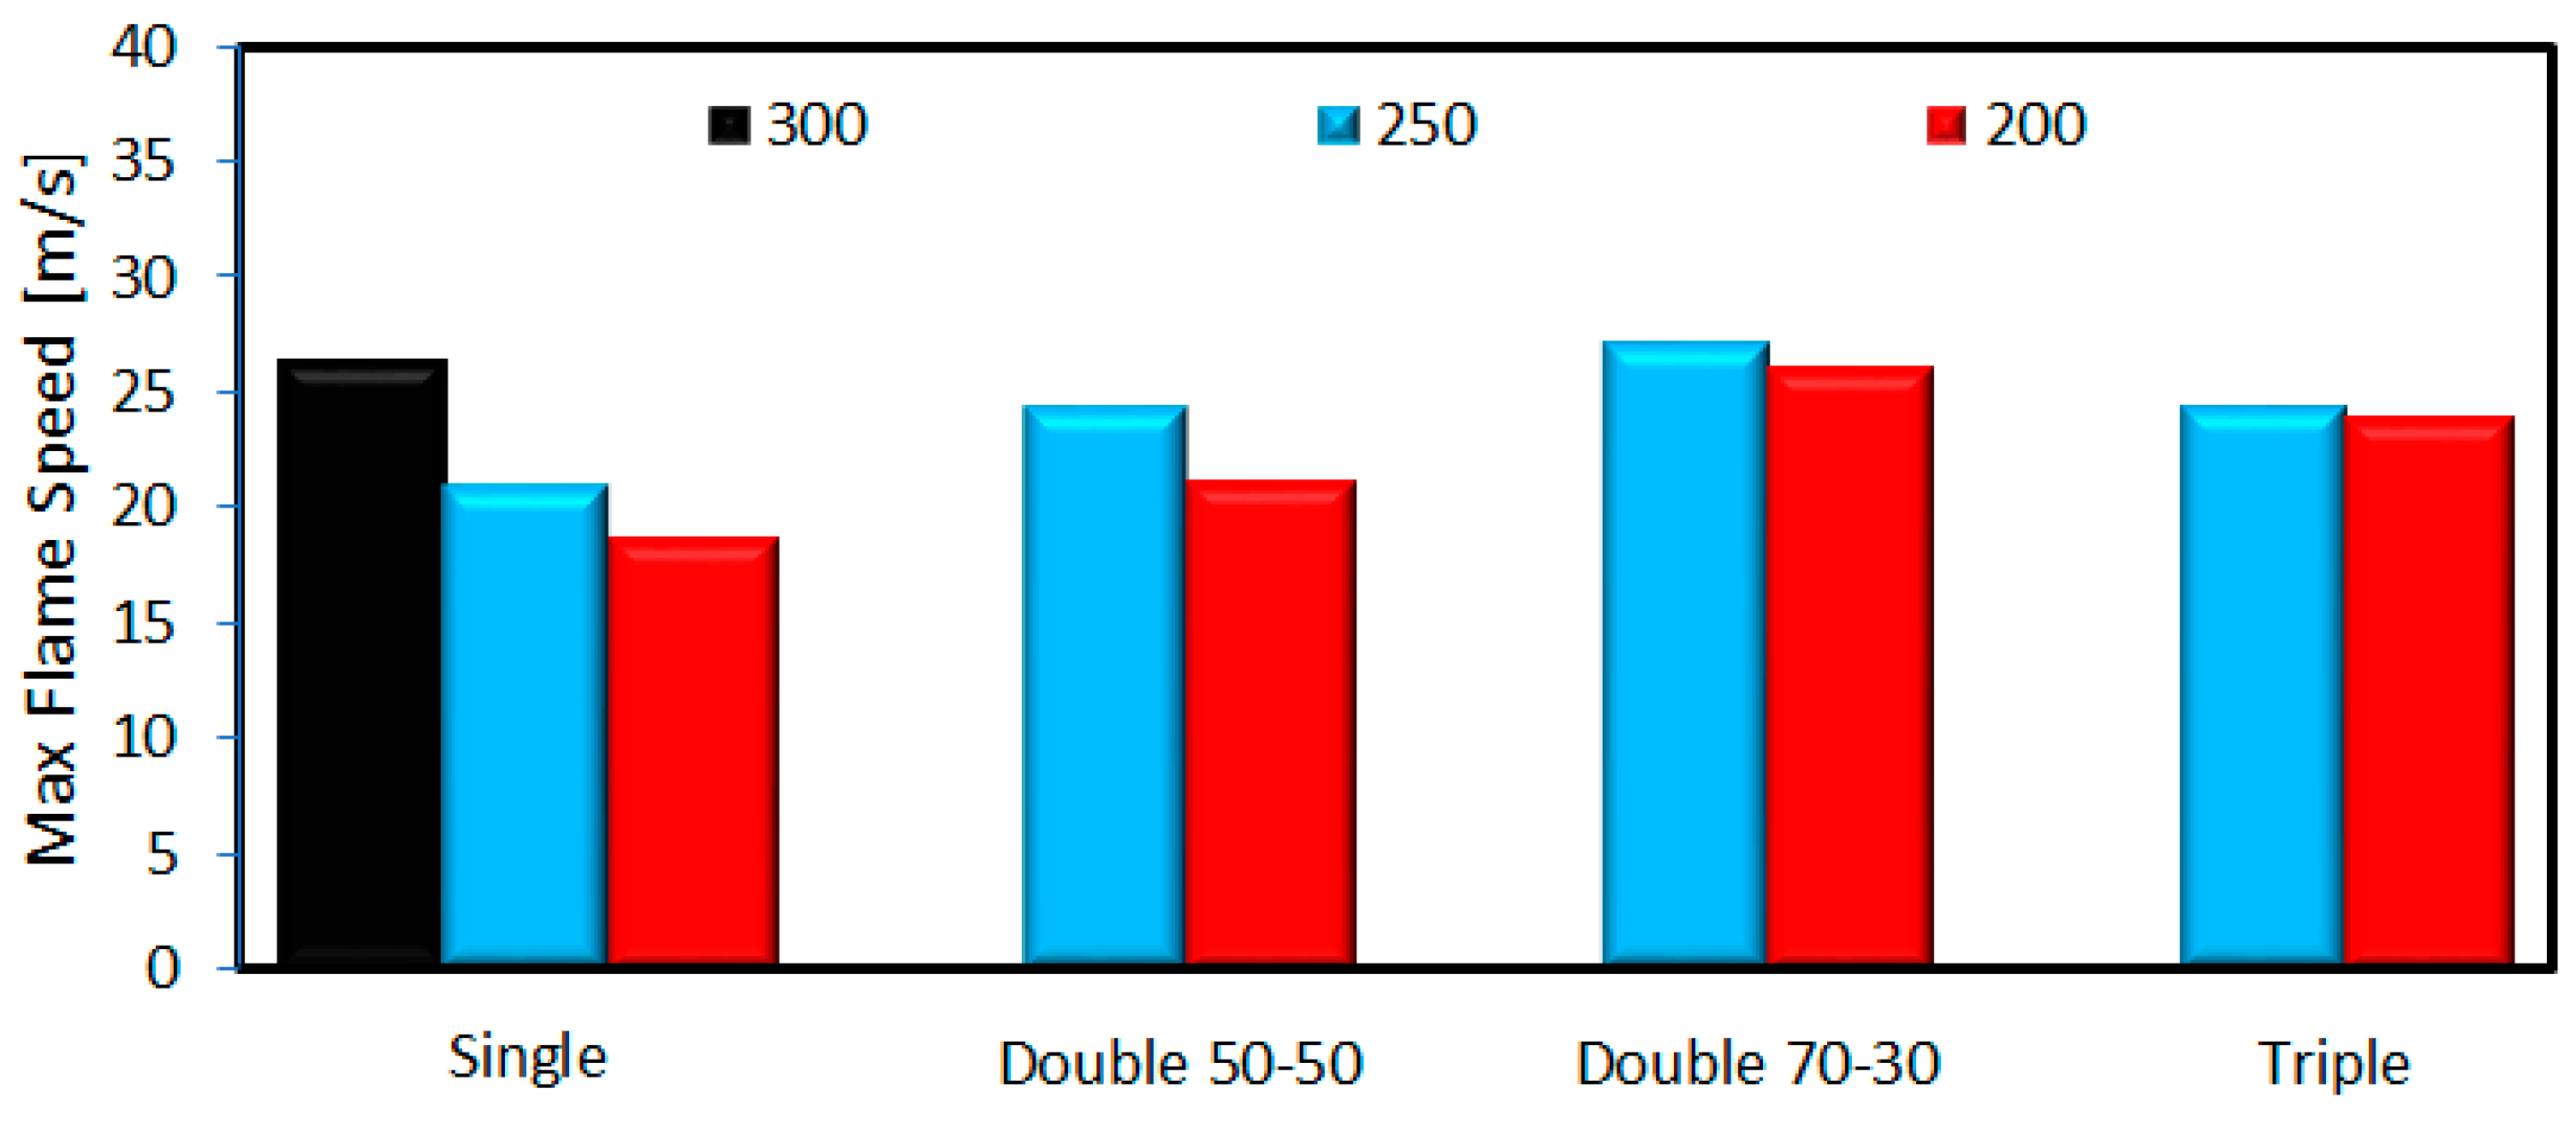
Flame speed values were calculated for each case from the area growth graph. The main hypothesis is to consider the flame perfectly spherical until the wall is intercepted. The maximum value for each injection strategy is shown in
Figure 11. The trend reveals a decrease of flame propagation speed when delaying the start of injection (by 50 CAD). The largest differences were found for single and double 50-50, due to the increase of injected fuel during the last phase of the intake stroke. For these operative conditions, the peak values of flame speed were found to be between 20 and 25 m/s.
The next step in the combustion analysis was the calculation of complementary parameters as Heywood circularity factor (HCF) and preferential flame propagation. It is important to note that as the engine has combustion variability, all the parameters were studied by considering the average value of 30 consecutive combustion cycles. The circularity parameter shows the flame deformation with respect to a perfect circle, measured with the perimeter ratio as was explained in the Optical Analysis section. The results were presented in terms of maximum values, as shown in
Figure 12. A clear tendency of increased distortion could be seen as injection was retarded (i.e., HCF values close to unity suggest more circular flames). In addition, splitting the injection decreases the flame circularity parameter, with the lower values recorded for the triple injection strategy.
Regarding the preferential propagation in a certain direction, it was defined as the case for which the flame propagates faster to one side than the other. Two different directions were considered, one along the line going from the intake to the exhaust valves (taken as y) and the other between the left and the right side of the combustion chamber (taken as x), following the definitions shown in
Figure 3.
Figure 13 shows the results for the y axis, obtained as the average values at the same flame size for all the cases that were studied. A preferential direction towards the exhaust side was noted for most cases. The baseline and triple injection showed values around one, meaning equal propagation between sides. Furthermore, the results suggested that splitting the injection reduced the preference for a certain propagation direction when the injection point is retarded. In terms of left to right propagation, as the engine has symmetry between these two sides, the ratio was near one for all the cases, without a clear tendency between the different injection ratios (
Figure 14).
4.3. Soot Formation
In order to study the effect of the split injection strategy on soot formation and oxidation, luminosity of the late combustion phase (60-145 CAD ATDC) was evaluated from the cycle resolved images. It is relatively well known in the literature that diffusion-controlled flames represent a source of soot, which generally does not oxidize prior to exhaust valves opening [
29,
34,
35]. Some authors [
36,
37] suggested that one of the main reasons why DISI engines did not deliver the level of improvement in power, fuel economy and emissions expected by manufacturers was due to inadequate design and performance of the direct-injection systems, as well as the engine calibration strategies used. In general, DI systems generate fuel impingement on the walls and piston that provokes the well-known pool fire regions [
38,
39]. Practically, during the normal combustion process, it is possible to achieve gas temperature and mixture strength conditions that lead to fuel film ignition by the normally propagating flame front. This phenomenon can create diffusion-controlled flames that can persist well after the first combustion phase [
40]. Just before the opening of the exhaust valves, these flames produce soot that cannot be completely oxidized due to low temperatures in the cylinder [
41].
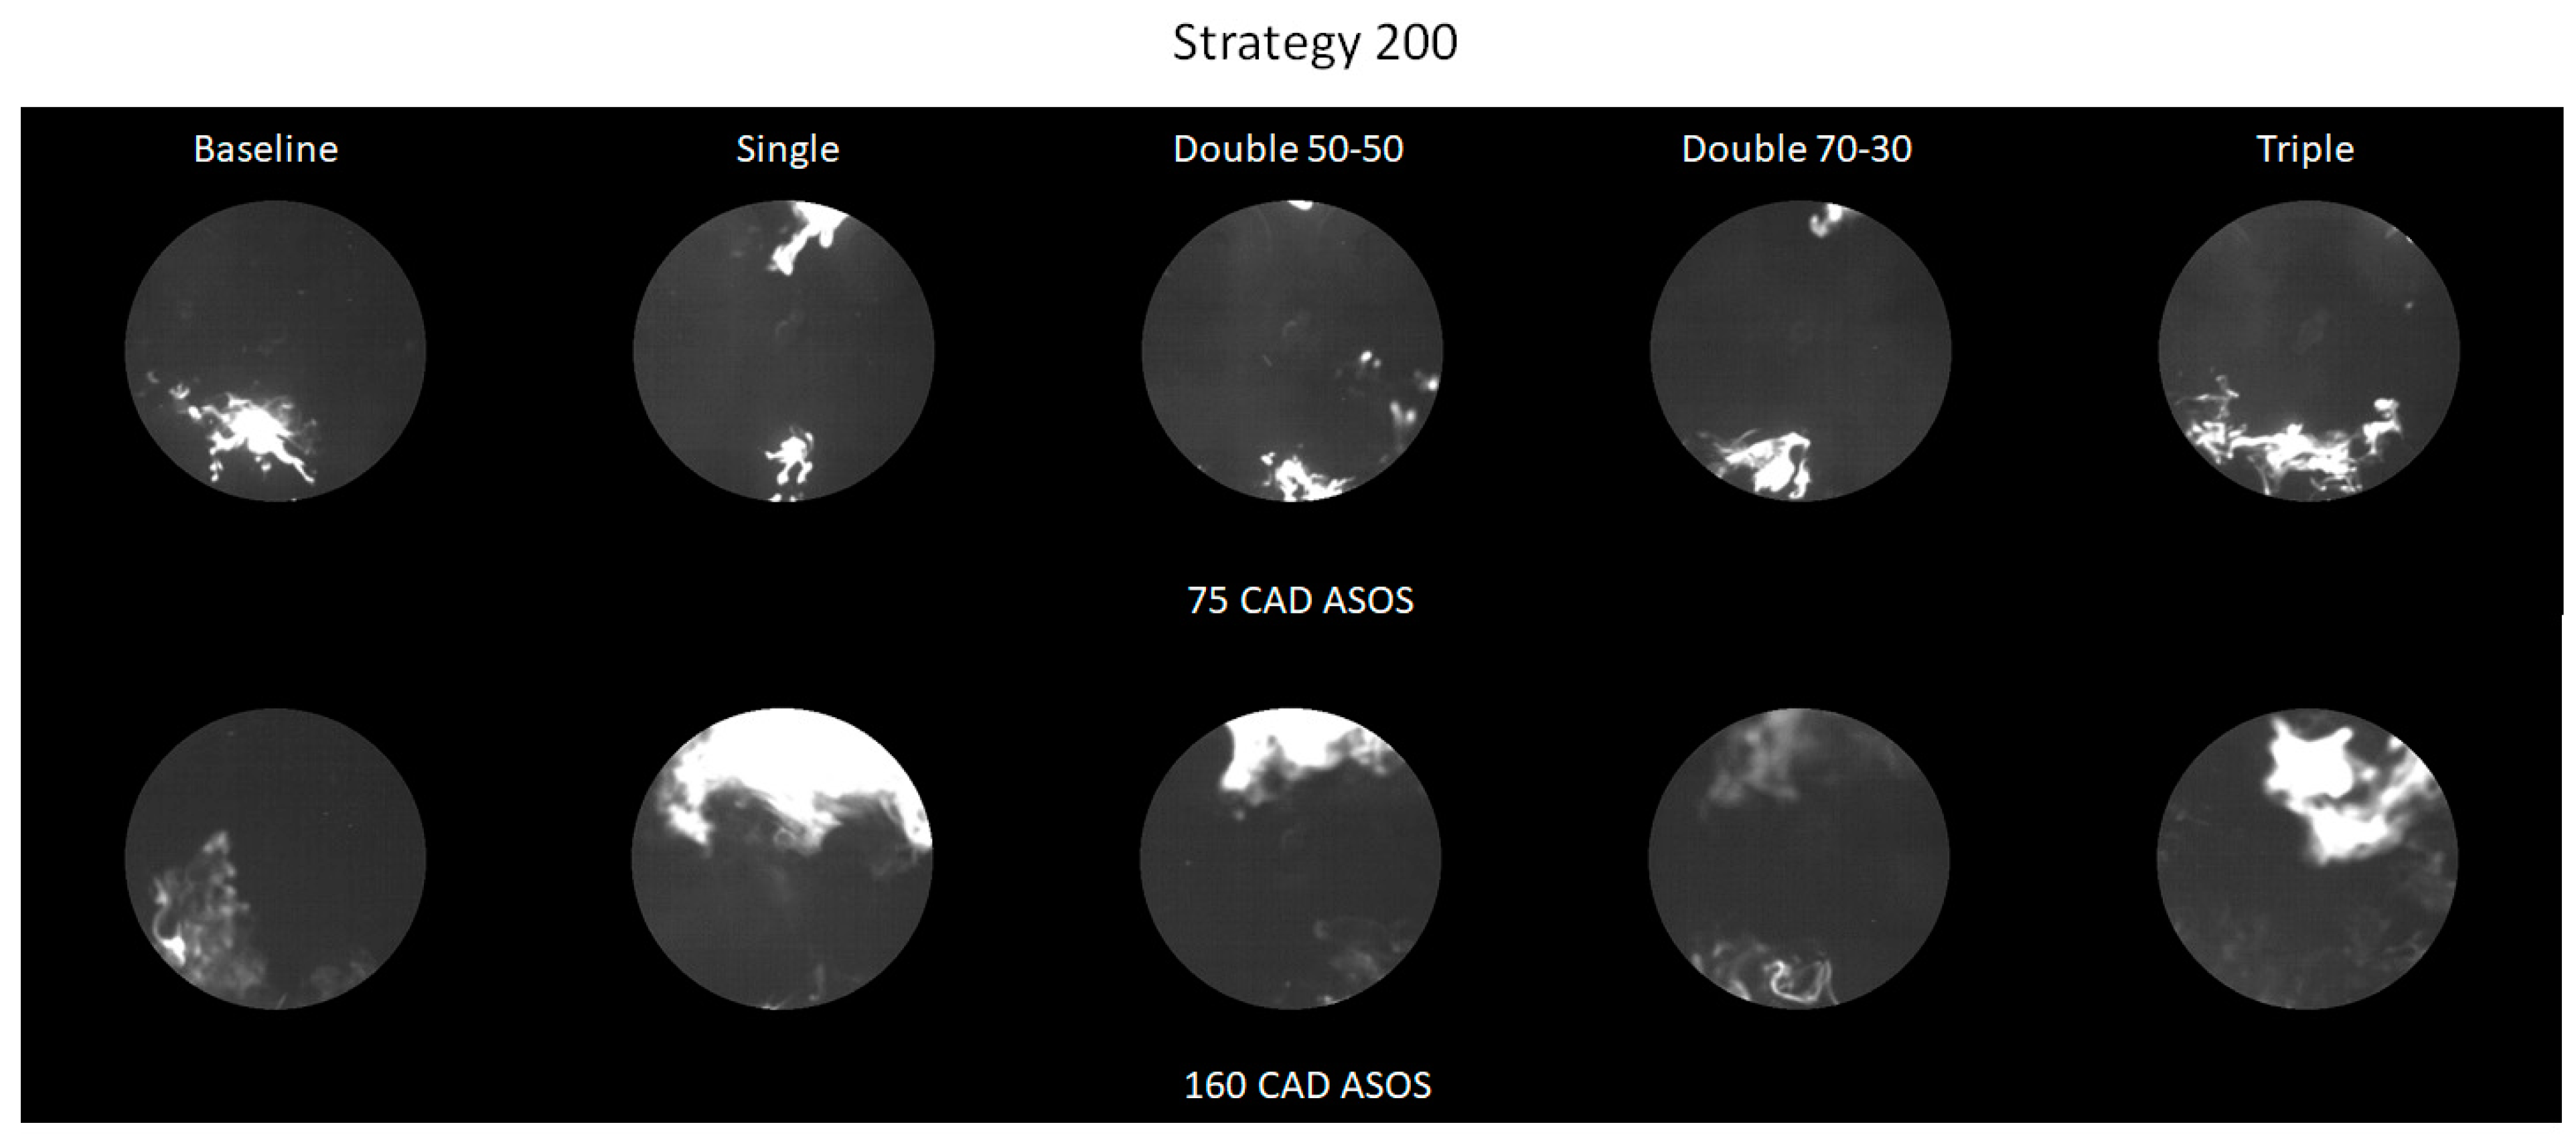
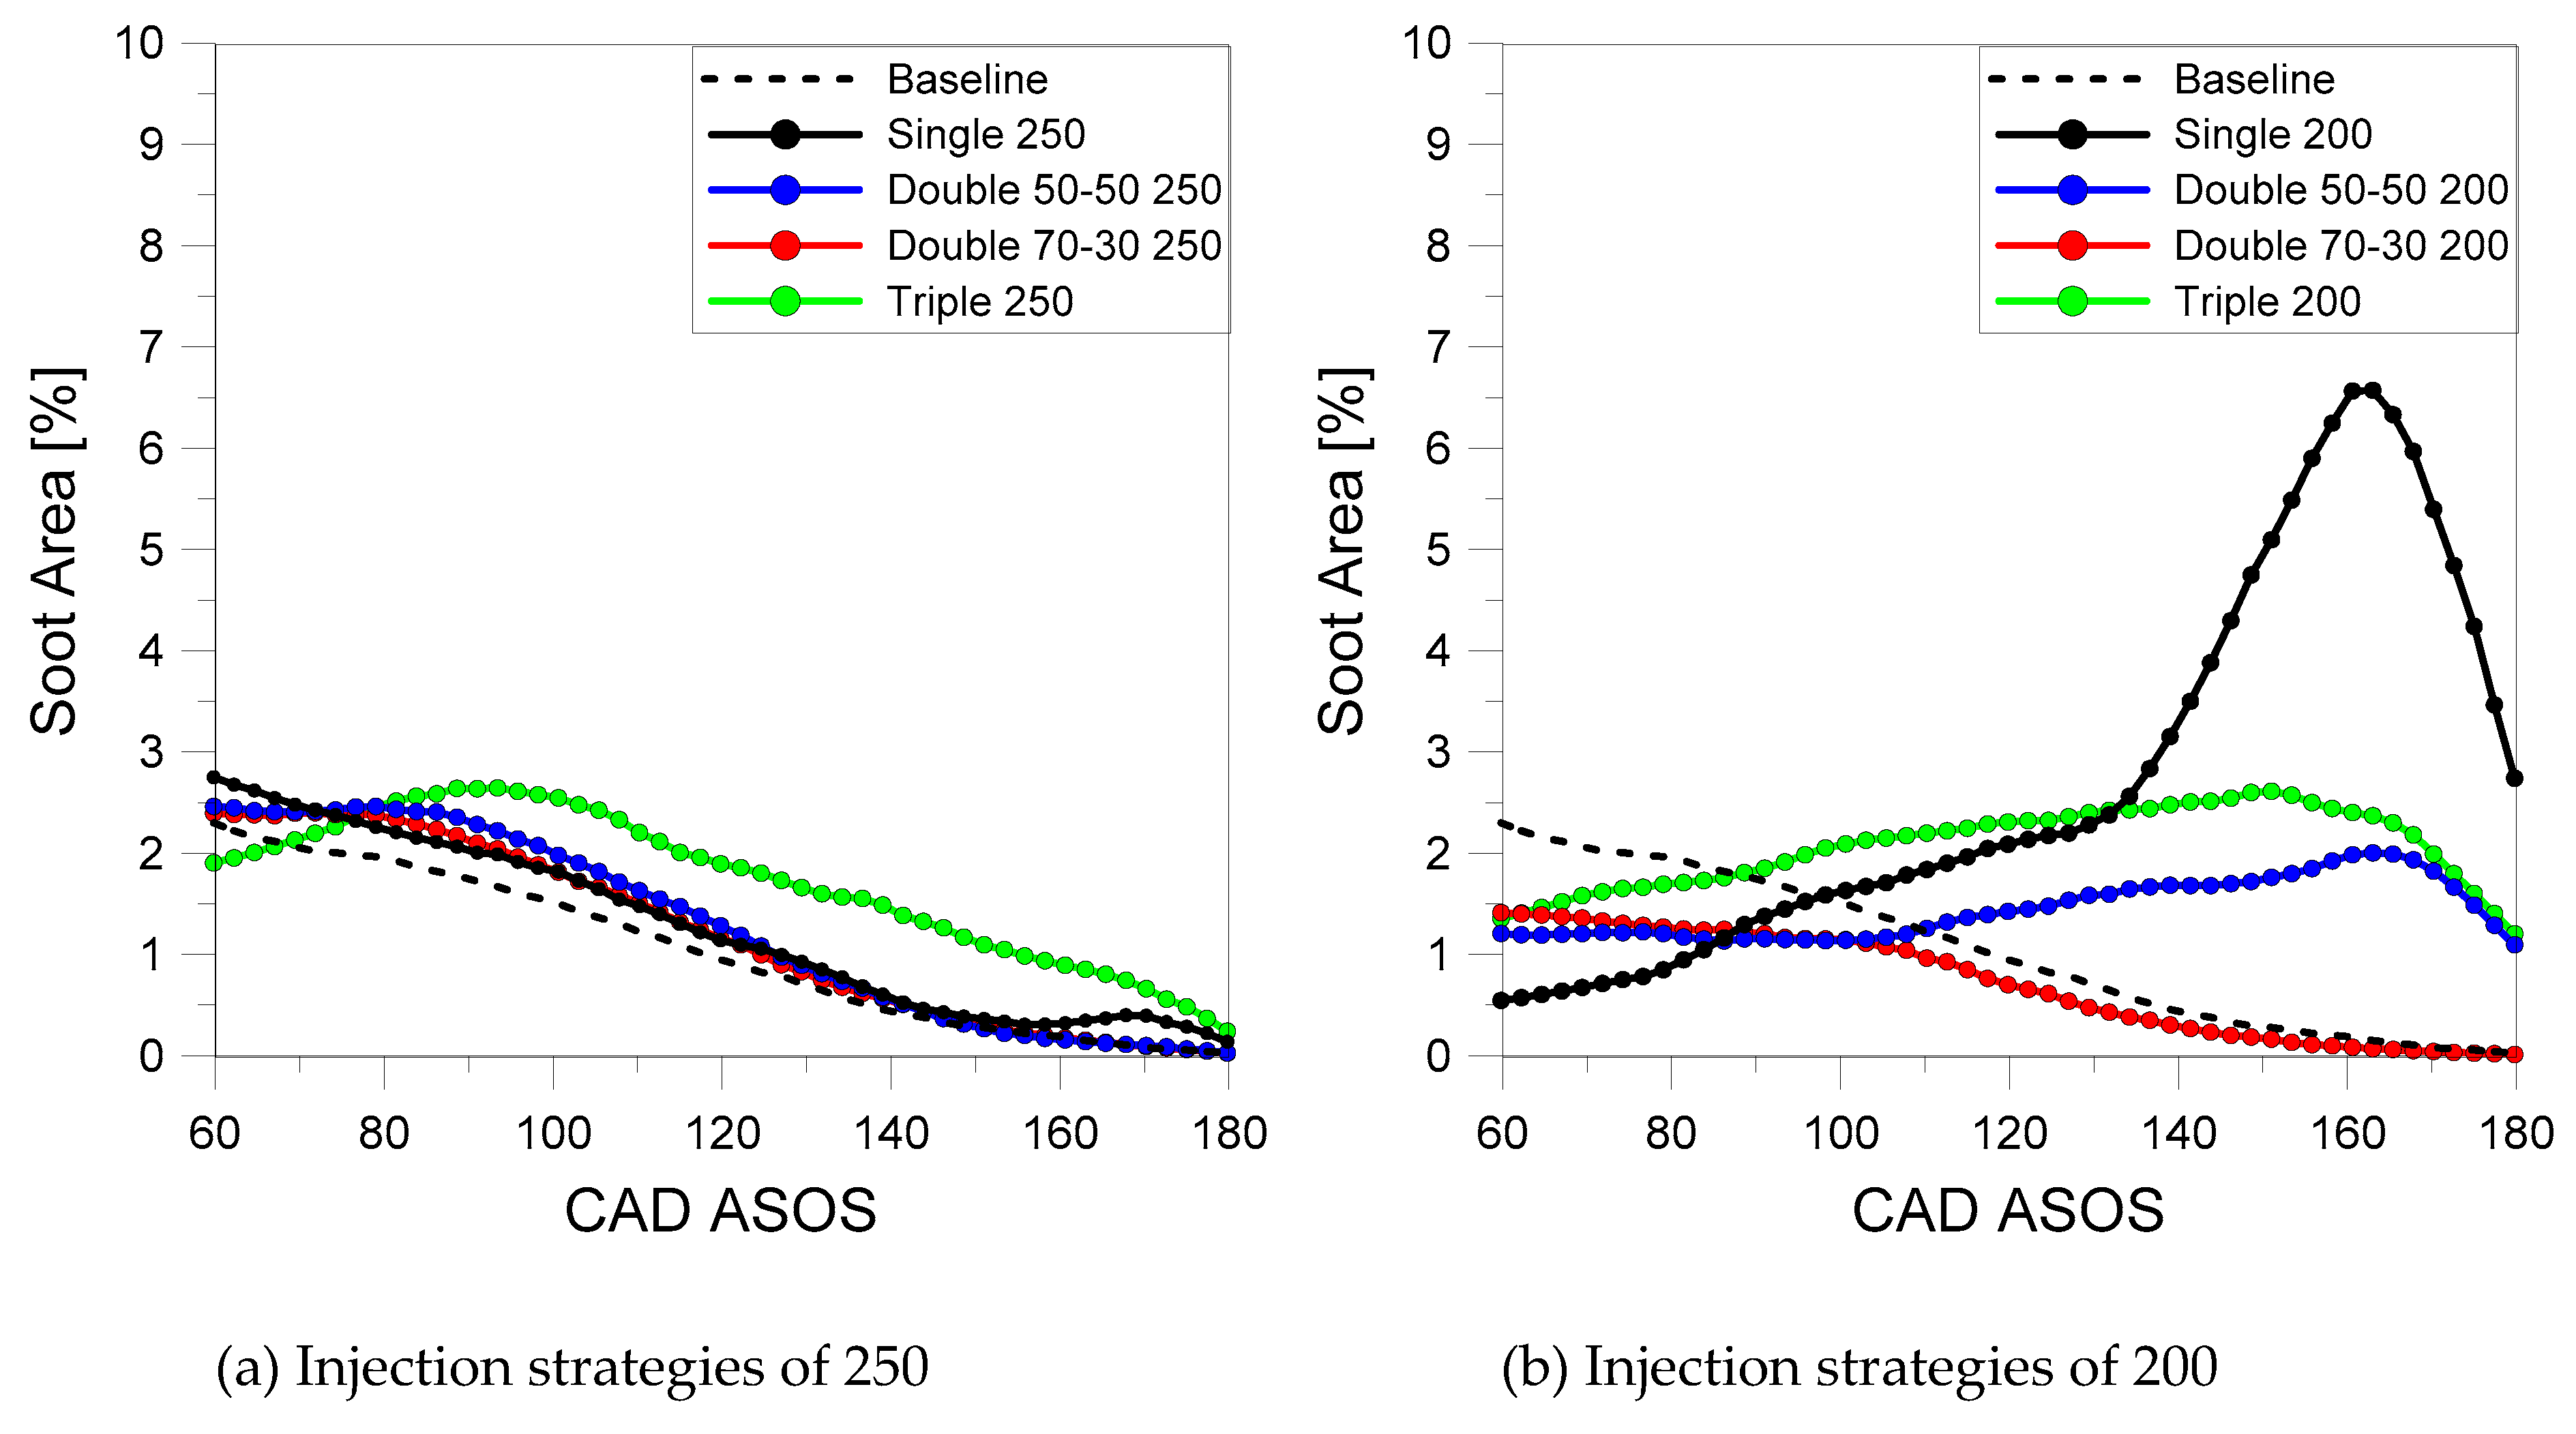
The trends for the investigated conditions are shown in
Figure 15 and
Figure 16. Two different instances of the late combustion phase are shown, 75 CAD ASOS (60 CAD ATDC) and 160 CAD ASOS (145 CAD ATDC). It is possible to observe that the delay of the injection timing increased the size and intensity of the pool fire regions. In addition, splitting the injection contributes to reducing these zones with respect to the single injection case. The total area of this region was estimated by an in-house post-processing method explained in the Optical Analysis section. The results are depicted in
Figure 17, which confirmed that retarding the injection timing produced high fuel impingement in the piston surface and top land region. The highest soot signal was detected for single injection at 200 strategy. In this condition, a more heterogeneous distribution of fuel position in the combustion chamber is shown, compared to split conditions. It is interesting to note that for single injection 200 strategy a peak was detected in the last phase of the combustion process. This phenomenon could be induced by the flame generated in the top land region that returns to the combustion chamber. In addition, this effect was seen in
Figure 16 at 160 CAD ASOS.
Going further into the specifics of soot formation, the discussion of two types of diffusive flames is useful. The differentiation was detailed in a previous study [
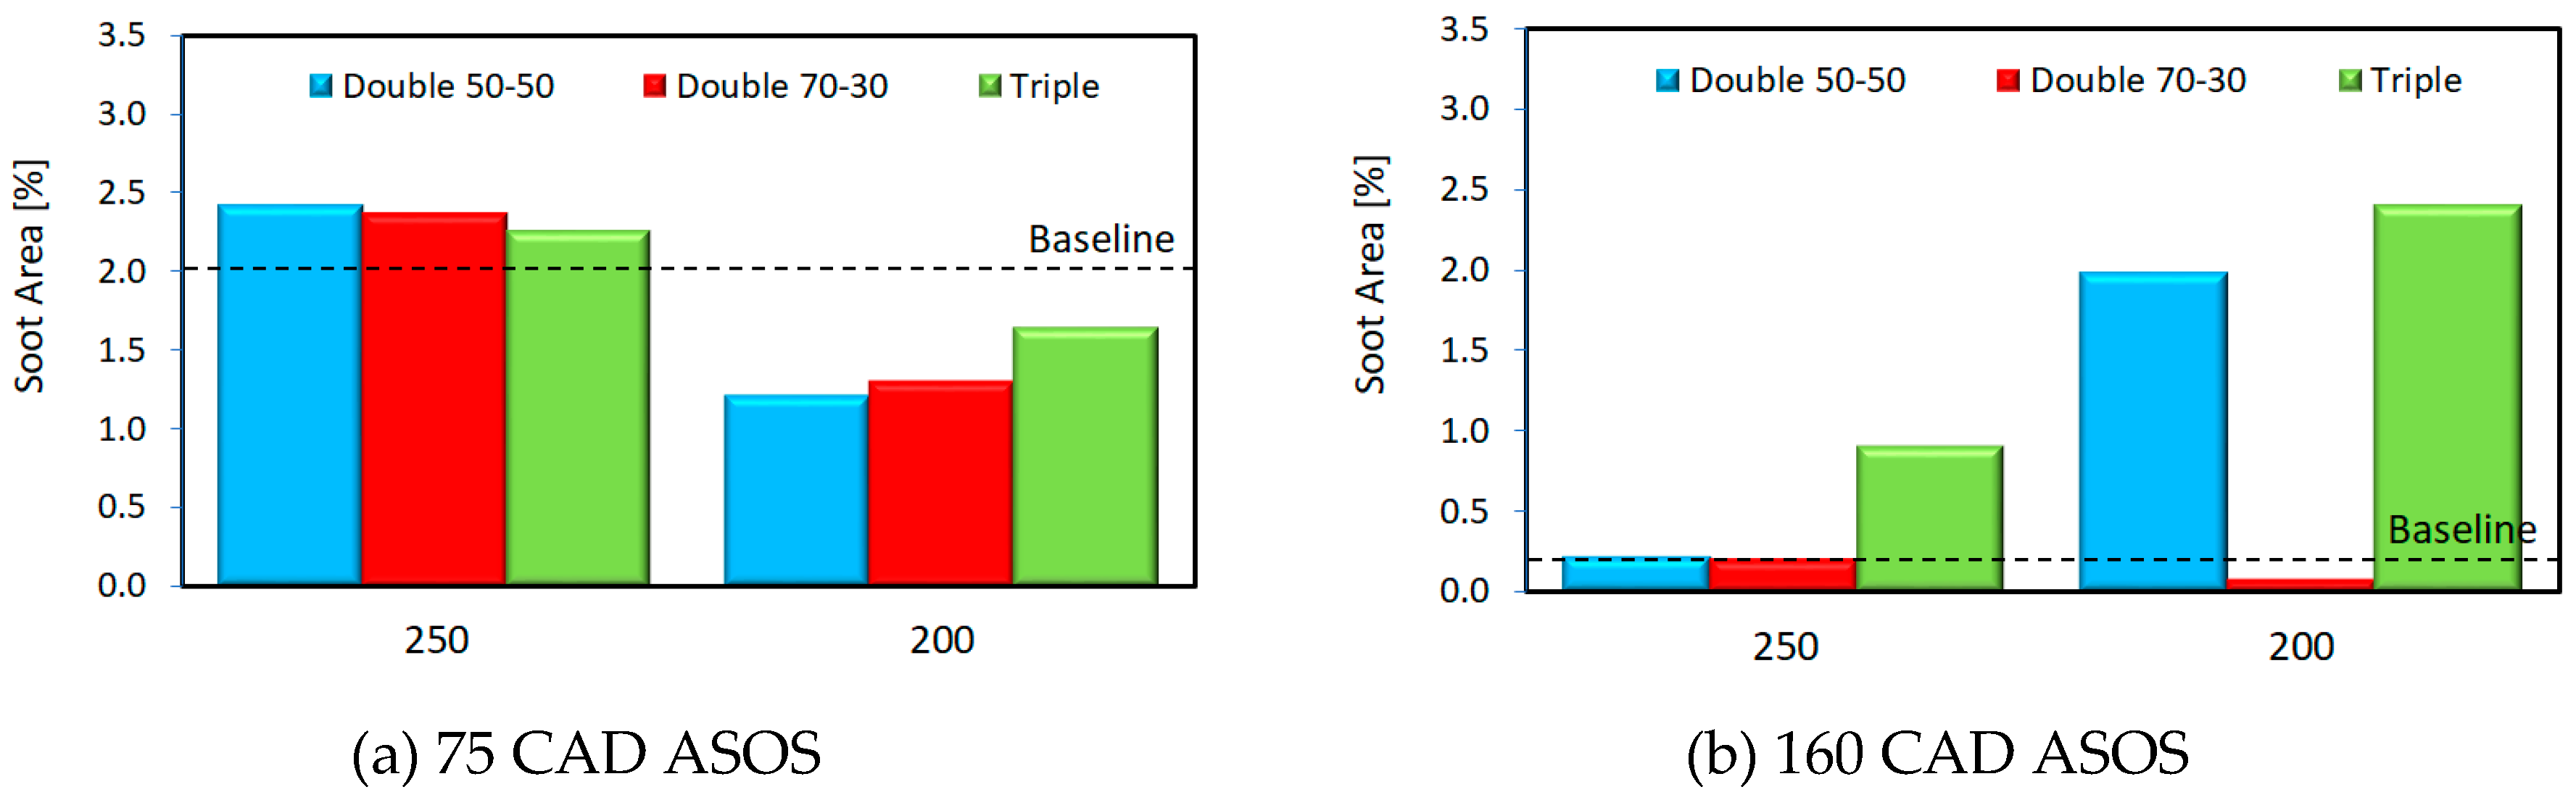
28] that also looked at the combination of air-fuel ratio temperature and identified the flame originating in the top land region as leaner and cooler with respect to those formed on the piston surface. It is interesting to note that the triple injection cases tend to feature a higher soot area later during the expansion stroke compared to the double injection strategies. As expected, the effect is more important for the SOI 200 cases, as these settings featured more pronounced impingement on the cylinder liner. Therefore, both observations seem to confirm the correlation of the observed trends to the spray impingement pattern on the piston and cylinder liner.
Figure 18 shows the total soot area at 75 CAD ASOS and 160 CAD ASOS; the baseline case is represented with a dashed line. An interesting observation is that at 75 CAD ASOS for the SOI 250 settings a decreasing trend is observed when going from double to triple injection, while the opposite is true for SOI 200 cases. Splitting the injection generally results in improved mixing, but air velocity also needs to be considered. Delaying the process moves it in a region with lower average fluid motion and turbulence intensity, thus hindering mixture formation. Furthermore, when increasing the number of injections, overall the fuel delivery is delayed, thus resulting in more impingement on the liner. As previously discussed, the diffusive flames originating in the top land region are most likely ‘leaner’, therefore more prone to oxidation. This could explain the increase in terms of flame area for the cases of three injections (
Figure 18b), but overall the effect on measured smoke opacity is less evident (
Figure 19). Comparing the two data categories, it could be seen that triple injection shows slightly higher values in terms of opacity and is similar to the baseline case. The setting that presents lower values of soot formation was double 70-30. These findings suggest that even though the processes within the top land region play an important role (and they are not visible with the field of view provided by the setup), the optical analysis has the potential to detect small differences in terms of soot formation. A further strong point of direct visualization is that it gives results in terms of spatial distribution and quantity within the visible part of the piston region, instead of local average values as in the case for opacity results.
5. Conclusions
An experimental study was undertaken in order to evaluate the effects of split injection in a DISI engine fuelled with commercial gasoline. To this aim, an optically accessible engine was run at 2000 rpm, 15 CAD BTDC spark timing and WOT. Single, double and triple injection division was performed for two different strategies (250 and 200 start of injection timing BTDC). The study was focused on stoichiometric air fuel ratio with thermodynamic and optical analyses of the combustion process.
The overall thermodynamic analysis revealed that retarding the injection towards the compression stroke decreased the in-cylinder pressure for this operative condition. In addition, splitting fuel delivery decreased the sensitivity with respect to injection phasing. These results suggest that improved mixing of the fuel and air can be achieved with early injection and several pulses. The MFB traces show an important decrease of combustion speed when single injection was used during the late phase of the intake stroke. Therefore, an important decrease in terms of performance (IMEP) was observed. On the other hand, the split of injection results is similar to IMEP values (dispersion of 1.5%) with respect to the baseline case. The highest values were found for double injection 70-30 with early and late injection. The cycle resolved visualization shows similar results in terms of flame propagation speed. This technique adds valuable information in terms of flame distortion and preferential propagation speed. The results show that splitting the injection reduced flame deformation and improved the homogeneity of the propagation. For the case of triple pulse injection control, the propagation between intake-exhaust and left-right was almost negligible.
Soot formation due to pool fire generated on the piston surface and top land region was studied with direct visualization and opacity measurements. This phenomenon is induced by fuel impingement during the injection process. The results suggest that more luminous regions were generated close to the intake region compared to the exhaust. In addition, splitting the injection reduced the pool fire phenomena due to better homogenization of the air-fuel mixture and larger distance between the injector and the piston surface. Lastly, the early injection setting reduced the amount of fuel trapped in the top land region (as the main contributor to the effect of crevice volumes), which during the expansion stroke returns to the combustion chamber as diffusive flames, further contributing to soot formation.


