Abstract
Surface tracking has been one of the challenges for outdoor organic insulations, in electronic and electrical devices. In this paper, surface tracking behavior of nano-MgO/epoxy composite samples were measured according to the standard IEC 60112. Improved tracking resistance was obtained in nanocomposites with an 18.75% uplift in the comparative tracking index, and a decrease of 58.20% in the surface ablation area at a fixed 425 V. It was observed that the tracking resistance and surface hydrophobicity shared the same tendency—both, the comparative tracking index and surface contact angle increased with an increase of the nanofiller content. Samples with better hydrophobicity exhibited a higher tracking resistance. It could be the case that the conductive pathway of contamination was harder to form, as a result there were fewer discharging processes. With the development of surface tracking, the surface contact angle abruptly decreased, at first, and tended to be constant, which was also accomplished with the failure of samples. In addition, reduced surface resistivity was also found in the nanocomposites, which was beneficial for releasing surface charges and inhibiting distortions in the electric fields.
1. Introduction
Epoxy-based materials are widely employed for outdoor insulations in electrical devices because of the excellent insulating and mechanical properties [1,2,3,4]. Outdoor insulating materials are exposed to complicated environments, including sunlight, dusts, moisture, etc. Dust accumulates, easily, on the surface of insulating materials. Conductivity of the dust increases when they are wetted from raining, fog, dew, etc. In this situation, discharge is likely to be induced on the dust surface, under an external electric field. Irreversible surface tracking is finally formed under continuous electrical stress, with an extensive deterioration of insulating properties. Permanent damage to the insulation and even serious accidents might be caused by surface tracking. It has been one of the important challenges for outdoor organic insulations.
A number of studies were carried out to reveal the physical essence of surface tracking [5,6,7,8,9]. Nowadays, surface tracking is acknowledged as a surface degradation process of organic insulations [5,6]. The liquid contamination acts as a conduction pathway for the leakage current, under an external electric field. It is non-uniformly heated and evaporated due to the joule heat, leading to the formation of a dry-band zone. Most of the applied voltage is then withstood by the resistive dry-band zone. In consequence, an extremely high electric field consequently appears at the dry-band zone. Surface discharge finally takes place when the electric field is high enough. Finally, surface tracking is formed under the combined stresses from electricity, heat, particle collisions, ultraviolet light, etc.
In recent years, researchers have gradually focused on the surface tracking processes of nanodielectrics. The science and technology of nanodielectrics, which are considered to be the next generation of insulating materials, have developed rapidly since the proposal of “Nanometric Dielectric” by Lewis [10], in 1994, and the redefinition of the term “Nanodielectric”, by Frechette [11] in 2001. Remarkable thermal, mechanical, and dielectric properties have been achieved in nanodielectrics, due to the induced interfaces between the nanofillers and the polymer matrix [7,8,9,12,13,14,15,16,17,18]. Improved tracking resistance has also been achieved in nanodielectrics, by enhancing thermal conductivity [9,19], stability of the chains [7], surface charge dissipation [20], etc. Among various nanofillers, MgO was found to be an effective nanofiller for inhibiting the space charge [21], treeing breakdown, and partial discharge [22]. Cross linked polyethylene (XLPE)/MgO nanocomposite material has been employed as the insulation for 500 kV DC cable, developed in Japan, due to its excellent electrical performance [23]. In our previous work, surface treeing, consisting of a series of segmented ablation holes has been observed in nano-MgO/epoxy composites [8]. It suggested that the scattering effect of nanoparticles on electrons plays an important role in the tracking process. Enhanced tracking resistance in the nanocomposites was partially attributed to the electron scattering by nanoparticles. However, besides the intrinsic properties of nanodielectrics, extrinsic surface properties were also found as important factors in our follow-up studies. Electrical properties are inevitably affected by surface conditions, including surface hydrophobicity [24,25,26,27,28]. In this paper, surface tracking measurements were conducted on nano-MgO/epoxy composite samples. Surface hydrophobicity was characterized by surface contact angle (SCA) [29], and its correlation with surface tracking has been discussed.
2. Materials and Methods
Commercial bisphenol-A epoxy resin (E51, Bluestar Wuxi Petrochemical Co., Ltd., China) and MgO nanoparticles (Beijing DK nano technology Co., Ltd., China) have been employed as the major raw materials. The nanoparticles were 50 nm, in average diameter, 50 m2/g in specific surface area, 0.34 g/cm3 in apparent density, and 3.5 g/cm3 in true density. Nanocomposites were prepared by dispersing the nano-MgO particles into the epoxy matrix, with the nanofiller contents of 0.1, 1, 2, 6, and 10 wt%, respectively. The procedure has been explained below, in detail [8].
First, the surface-treated nano particles were prepared by uniformly mixing the coupling agent (3-Glycidoxypropyltrimethoxysilane, KH-560, Shanghai Aladdin Biological Technology Co., Ltd., China), nano-MgO particles, and ethanol for 30 minutes, by a homogenization system (SPCH-18, China). Second, the epoxy matrix was added in and mixing was continued for another 30 minutes. The mixture was heated at 60 °C, until the ethanol was completely volatilized. Third, the curing agent (methyl tetrahydrophthalic anhydride, GH9303, Orient Chemical Factory Jia Xing, China) and accelerator (2.4.6-Tris(dimethylaminomethyl)phenol, DMP-30, Shanghai Aladdin Biological Technology Co., Ltd., China) were added in and the mixture was stirred, in vacuum, for an hour, until potential bubbles were sufficiently removed. Finally, the samples were prepared after pre-curing at 80 °C, for 2 h, heat preserving at 105 °C, for 2 h, and post-curing at 120 °C, for 8 h, in steel molds.
Surface tracking was measured according to the IEC 60112; the experimental apparatus (KS-53B, China) is shown in Figure 1. Two wedge-shaped platinum electrodes were placed on the surface of the sample, with a distance of 4 mm. AC voltage was applied to the electrodes. Statistical electric field of the sample surface near the electrodes was applied to the right electrode when the left electrode was at 0 V and 100 V, as shown in the enlarged figure on the right. The solution had a resistivity of (1.70 ± 0.05) Ω∙m at room temperature; it was prepared by dissolving 0.1% NH4Cl and 0.5% sodium-di-butyl naphthalene into deionized water, for a more severe tracking process, instead of a 0.1% NH4Cl solution [30]. The solution droplets were controlled to continuously drop 35 mm above the sample, at an interval of 30 s, when the AC voltage was applied to the sample surface. The sample was defined to fail the measurement when the discharge current was bigger than 0.5 A, for 2 s. The measurement was repeated at a voltage that was higher by 25 V, until the sample failed the text in the voltage range from 100 V to 600 V. The comparative tracking index (CTI), which was defined as the maximum voltage that the sample withstands, for 50 solution droplets, was obtained to characterize the tracking resistance. In addition, the surface ablation area was calculated, as another parameter, to precisely present tracking resistance, as well. Samples were set to withstand 50 droplets at a fixed voltage (425 V) and tracking pictures were taken on their surfaces. Surface ablation area was, thus, calculated by selecting the surface tracking regions and numbering the corresponding pixel numbers by an image processing software (Adobe Photoshop).
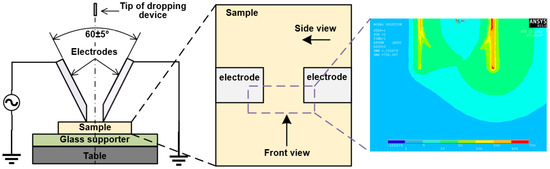
Figure 1.
Schematic diagram of surface tracking measurement and electric field distribution near the electrodes.
Hydrophobicity greatly affects the distribution of liquid contamination, on the sample’s surface. In this study, SCA was utilized to characterize surface hydrophobicity via a contact angle instrument (JY-PHa, Chengde yote Instrument Sales Co. Ltd, China). Deionized water was used as the experimental solution. To guarantee the accuracy of the measurement results, the samples should be placed in parallel, during the test, with each droplets of test solution ensured between 4–5 µL.
Surface resistivity was measured by home-made devices. Two parallel rectangle electrodes (20 × 8 mm) with the distance of 2 mm, were pasted on to the samples. Current across the electrodes were measured by an ampere meter (6517B, Keithley, America).
In addition, the nanocomposite samples were fractured in liquid nitrogen and the pictures of the cross-sections were taken by a Scanning Electron Microscope (SEM, KEYENCE VE9800, Japan) to make sure that the nano-MgO particles were uniformly dispersed into the epoxy matrix. Detailed tracking patterns were characterized by SEM, as well.
3. Results and Discussions
It is acknowledged that nano-particles are easy to agglomerate, due to their large specific surface area. Therefore, samples were fractured in liquid nitrogen and SEM pictures were taken on their cross-sections, which are shown in Figure 2. A smooth surface can be observed in Figure 2a, since no nano-particles were doped into it. On the contrary, white dots, which are marked by yellow circles in each picture, were found in the nanocomposites. Cracks first appeared at the interface between nano-particles and the epoxy matrix in them, so it can be inferred that the white dots refer to the nano-MgO particles. It can be seen from Figure 2b–e that the nano-particles were uniformly dispersed into the epoxy matrix when the MgO content was less than 6 wt%. A slight conglomeration was found in Figure 2f when it was over-doped (samples with an addition of 10 wt% nano-MgO particles).
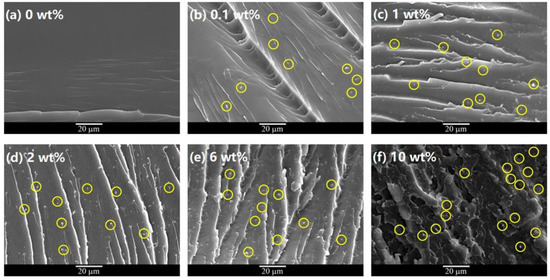
Figure 2.
SEM pictures of the cross-sections of the samples with different additions of nano-MgO particles. (a) Neat epoxy, (b) 0.1 wt%, (c) 1 wt%, (d) 2 wt%, (e) 6 wt%, and (f) 10 wt%. The white dots marked by the yellow circles refer to the nano-MgO particles.
Figure 3 shows the anti-tracking properties of the nanocomposite samples. The typical ablation morphology of the samples is shown in Figure 3a, in which three ablation regions can be observed. As shown in the enlarged SEM pictures, the smooth surface around the electrode/sample contacts was detected in Region A. A “tank” ablation in Region B, was located between the two halves of Region A. The most severe ablation area appeared in Region C. In this region, the surface trees started from the end of Region A and extended along the electric field, leading to the crossed ablation trees. In addition, enhanced tracking resistance was found in the nanocomposite samples. As shown in Figure 3b, CTI increased from 400 V of neat epoxy samples to 475 V of samples with a 10 wt% addition of nano-MgO particles. Considering the relatively low precision (25 V) of CTI, ablation area of the samples under a fixed voltage (425 V), was also measured, as shown in Figure 3c, to evaluate the tracking resistance. In accordance with the increase of CTI, ablation area decreased from 308.72 mm2 of neat epoxy samples to 129.05 mm2 of 10 wt% nano-MgO-doped samples. All these results indicated an improved tracking resistance in nanocomposites.
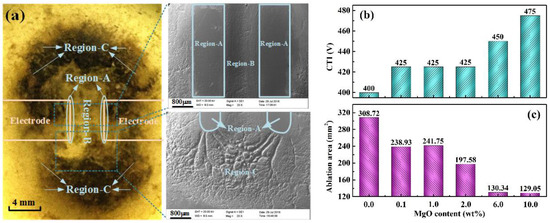
Figure 3.
Typical surface morphology of the epoxy samples, after the tracking measurement, with enlarged SEM pictures for the tree regions (a). The corresponding comparative tracking index (CTI) (b) and ablation area after 50 droplets, at a fixed voltage of 425 V (c) for samples with different nanofiller contents.
An interesting phenomenon, as shown in Figure 4, was that the dependence of the SCA on the addition of nano-MgO particles, presented a similar tendency with that of the CTI. SCA for neat epoxy samples were about 80 degree, which was similar to other reports [31]. With an increase of the MgO content, both the SCA and the CTI increased remarkably. It is, thus, reasonable to deduce that surface hydrophobicity is closely correlated with tracking resistance characteristics in nano-MgO/epoxy composites. The reason for this remarkable similarity could be due to the better hydrophobicity of the sample; the smaller water film area deposited on the surface of sample. The test solution tended to be cohesive, when SCA was relatively high. As a result, the formation of the drying region was probably inhibited. Accompanying this was the inhibited, non-uniform electric field distribution, which arose from the evaporation of the solution, by joule heat. Consequently, the probability of forming a continuous conduction path was considerably reduced, resulting in an increased tracking resistance. However, it should be marked that this conclusion was derived from a single factor comparison, while the tracking resistance was related to a variety of factors. Further research is necessary for understanding the process of surface tracking.
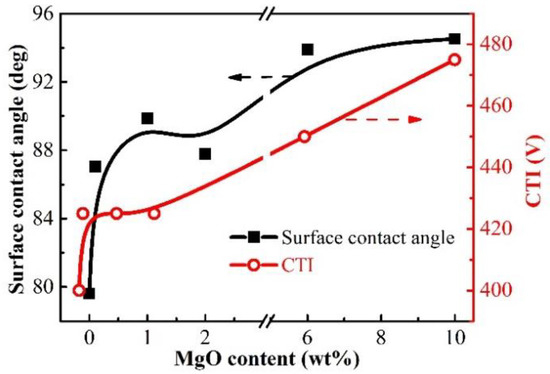
Figure 4.
Comparison of surface contact angle and CTI of the nanocomposites.
Different morphologies of water droplets were found in different ablated regions, after the tracking process. Pictures of the water droplets, taking a sample with a doped 1 wt% nano-particles, as an example, in Region B and Region C, are shown in Figure 5. In Region B, the droplets showed an irregular strip shape, with significant difference in the front and side morphology. In Region C, however, the shape of the droplet was a regular circular shape, i.e., the front and side profiles of the droplet were almost the same. This phenomenon arose from the different morphologies in those two regions. During the tracking process, the dendritic ablation region (Region C) was relatively uniform, while the ablation area between electrodes (Region B) was a long ‘tank’. The ‘tank’ distribution of Region B finally resulted in irregular shapes of the water droplets.
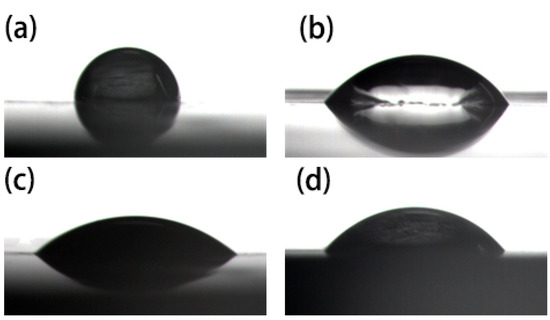
Figure 5.
Pictures of water droplets on the surface of the epoxy sample. Front view (a) and side view (b) of the droplet, after the tracking process in Region B; front view (c), and side view (d) of the droplet after tracking process in Region C.
To further study the effect of SCA on the nanocomposites, the samples were subjected to a tracking test with a number of experimental droplets—5, 10, 15, 20, 25, 35, 45, and 50—controlled separately. Then the SCA measurement of each sample was carried out to investigate the hydrophobicity of the epoxy nanocomposites, during the tracking process. When the surface of the specimen was carbonized, the water droplets will be directly applied to the surface of the specimen, resulting in an inability to measure the SCA. Therefore, the surface contamination was wiped before the measurement. Considering the difference of Region B and Region C in the tracking process, dependences of the SCA on the number of droplets that were remaining, in both Region B and Region C, are presented in Figure 6. As can be seen from Figure 6b, the front contact angle of the droplet was greater than the side contact angle in Region B, during the tracking process, while the two contact angles were almost equal in Region C, in Figure 6c. This result was consistent with the observations in Figure 5. The common phenomenon of the two ablation regions was that the contact angle decreased, gradually, with the development of the tracking process, which indicated that the hydrophobicity of the sample gradually decreased. The decreasing of hydrophobicity resulted in the increase of the water film area, as well as the contaminant area of the specimen surface. It is worth noting that fifteen droplets might be a crucial number for the tracking process. Ablation area slowly increased in Figure 6a, while SCA decreased rapidly in Figure 6b,c, by the time the fifteenth droplet was administered. When the number of droplets administered was over fifteen, the ablation area increased rapidly, while the SCA gradually tended to be constant. This could be because losing the hydrophobicity led to a more severe ablation and s faster approach to the failure stage, as shown in Figure 6a.
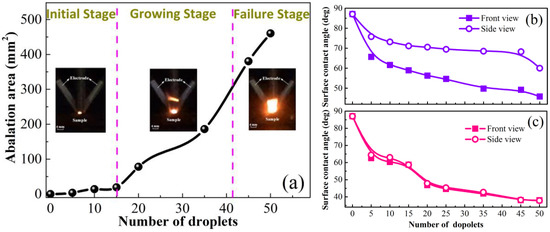
Figure 6.
Evolution of the ablation area of 1 wt% nano-MgO-doped samples, at 500 V during the surface tracking measurement (a) and the corresponding contact angles in Region B (b) and Region C (c).
Surface resistivity of the nanocomposite samples is plotted in Figure 7. It decreased rapidly and then slowly increased, with increasing nano-MgO particles. Lowered surface resistivity was detected in the nanocomposite samples, on the whole, which is beneficial for reducing the accumulation of surface charges and distortion of the electric field. In addition, great effects of surface tracking on surface resistivity was also observed. The resistivity was about one magnitude lower, after the surface tracking process. This is predictable, as a result of formation of conductive pathways, during the surface tracking measurement. Meanwhile, surface resistivity after the tracking process, showed a similar MgO content, as that before tracking.
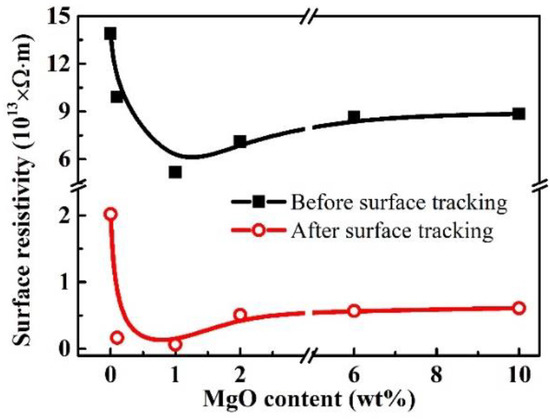
Figure 7.
Surface resistivity of the nano-MgO/epoxy composite samples, before and after surface tracking measurement.
4. Conclusions
Effects of surface hydrophobicity on the tracking resistance of epoxy/nanocomposites were investigated in this study. The main conclusions are listed as follows:
(1) Increased tracking resistance was obtained in MgO/epoxy nanocomposite samples. CTI increased from 400 V, for the neat epoxy samples, to 475 V, for the 10 wt% nano-MgO-doped samples. Accordingly, the ablation area under a fixed 425 V, decreased from 308.72 mm2, for the neat epoxy samples to 129.05 mm2, for 10 wt% nano-MgO-doped samples, which indicated an improved anti-tracking performance.
(2) Surface hydrophobicity was found to be an important factor for the tracking process. A good consistence was found between the initial SCA and ablation area of the MgO content. In addition, the inflection point of the SCA, during the tracking process, might be a crucial point for the tracking process. Losing hydrophobicity also led to a more severe ablation and a faster approach to the failure of samples.
Author Contributions
Z.X. performed the experiment, analyzed the data, and wrote the paper. P.G. helped in using the tools and machines. C.Z., X.H. and J.Z. contributed in providing reagents/materials and characterizations. P.G. helped in sample preparation. Z.W., K.W. and J.L. conceived the idea and designed the experiment. K.W. and J.L. offered suggestions about the paper.
Funding
This work was funded by the State Grid Corporation of China (SGRIDGKJ[2017]607), the State Key Laboratory of Advanced Power Transmission Technology (GEIRI-SKL-2018-011), the National Key Research and Development Program of China (No. 2018YFB0905802), and the Power Electronics Science and Education Development Program of Delta Group (DREM2017001).
Conflicts of Interest
The authors declare no conflict of interest.
References
- Kim, J.; Lee, W.; Kim, T.; Kim, H.; Seo, B.; Lim, C.; Cheong, I. Synthesis of thermally stable reactive polyurethane and its physical effects in epoxy composites. Appl. Sci. 2018, 8, 1587. [Google Scholar] [CrossRef]
- Kim, Y.J.; Shin, T.S.; Choi, H.D.; Kwon, J.H.; Chung, Y.; Yoon, H.G. Electrical conductivity of chemically modified multiwalled carbon nanotube/epoxy composites. Carbon 2005, 43, 23–30. [Google Scholar] [CrossRef]
- Ohki, Y. Development of epoxy resin composites with high thermal conductivity. IEEE Electr. Insul. Mag. 2010, 26, 48–49. [Google Scholar] [CrossRef]
- Nagendiran, S.; Alagar, M.; Hamerton, I. Octasilsesquioxane-reinforced DGEBA and TGDDM epoxy nanocomposites: Characterization of thermal, dielectric and morphological properties. Acta Mater. 2010, 58, 3345–3356. [Google Scholar] [CrossRef]
- Sarathi, R. Investigations of surface degradation of high-density polyethylene materials resulting from tracking, using physicochemical analysis. J. Appl. Polym. Sci. 2002, 83, 2843–2849. [Google Scholar] [CrossRef]
- Sarathi, R.; Rajesh Kumar, P.; Sahu, R.K. Analysis of surface degradation of epoxy nanocomposite due to tracking under AC and DC voltages. Polym. Degrad. Stabil. 2007, 92, 560–568. [Google Scholar] [CrossRef]
- Liu, Y.; Li, Z.; Du, B. Effects of nano-SiO2 particles on surface tracking characteristics of silicone rubber composites. Appl. Phys. Lett. 2014, 105, 102905. [Google Scholar] [CrossRef]
- Wu, K.; Wang, Z.; Zhao, C.; Huang, Y.; Li, J.; Li, S. Surface treeing and segmented worm model of tracking behavior in MgO/Epoxy nanocomposites. IEEE Trans. Dielectr. Electr. Insul. 2018, 25, 2067–2075. [Google Scholar] [CrossRef]
- Du, B.X.; Xiao, M. Effects of thermally conducting particles on resistance to tracking failure of polyimide/BN composites. IEEE Trans. Dielectr. Electr. Insul. 2014, 21, 1565–1572. [Google Scholar] [CrossRef]
- LEWIS, T.J. Nanometric dielectrics. IEEE Trans. Dielectr. Electr. Insul. 1994, 1, 812–825. [Google Scholar] [CrossRef]
- Frechette, M.F.; Trudeau, M.L.; Alamdari, H.D.; Boily, S. Introductory remarks on nanodielectrics. In Proceedings of the 2001 Annual Report Conference on Electrical Insulation and Dielectric Phenomena (CEIDP), Kitchener, ON, Canada, 14–17 October 2001; pp. 92–99. [Google Scholar] [CrossRef]
- Tanaka, T.; Kozako, M.; Fuse, N.; Ohki, Y. Proposal of a multi-core model for polymer nanocomposite dielectrics. IEEE Trans. Dielectr. Electr. Insul. 2005, 12, 669–681. [Google Scholar] [CrossRef]
- Lewis, T.J. Interfaces are the dominant feature of dielectrics at the nanometric level. IEEE Trans. Dielectr. Electr. Insul. 2004, 11, 739–753. [Google Scholar] [CrossRef]
- Xie, Q.; Fu, K.; Liang, S.; Liu, B.; Lu, L.; Yang, X.; Huang, Z.; Lü, F. Micro-structure and thermomechanical properties of crosslinked epoxy composite modified by nano-SiO2: A molecular dynamics simulation. Polymers 2018, 10, 801. [Google Scholar] [CrossRef]
- Haleem, Y.; Song, P.; Liu, D.; Wang, C.; Gan, W.; Saleem, M.; Song, L. The effect of high concentration and small size of nanodiamonds on the strength of interface and fracture properties in epoxy nanocomposite. Materials 2016, 9, 507. [Google Scholar] [CrossRef] [PubMed]
- Dombek, G.; Nadolny, Z.; Marcinkowska, A. Effects of nanoparticles materials on heat transfer in electro-insulating liquids. Appl. Sci. 2018, 8, 2538. [Google Scholar] [CrossRef]
- Li, Z.; Su, J.; Du, B.; Hou, Z.; Han, C. Inhibition effect of graphene on space charge injection and accumulation in low-density polyethylene. Nanomaterials 2018, 8, 956. [Google Scholar] [CrossRef] [PubMed]
- Hassan, M.; Abukmail, A.; Hassiba, A.; Mauritz, K.; Elzatahry, A. PVA/Chitosan/Silver nanoparticles electrospun nanocomposites: Molecular relaxations investigated by modern broadband dielectric spectroscopy. Nanomaterials 2018, 8, 888. [Google Scholar] [CrossRef]
- Nazir, M.T.; Phung, B.T.; Yu, S.; Li, S.; Xie, D.; Zhang, Y. Thermal distribution analysis and suppression mechanism of carbonized tracking and erosion in silicone rubber/SiO2 nanocomposites. Polym. Test. 2018, 70, 226–233. [Google Scholar] [CrossRef]
- Du, B.X.; Xiao, M. Influence of surface charge on DC flashover characteristics of epoxy/BN nanocomposites. IEEE Trans. Dielectr. Electr. Insul. 2014, 21, 529–536. [Google Scholar] [CrossRef]
- Takada, T.; Hayase, Y.; Tanaka, Y. Space charge trapping in electrical potential well caused by permanent and induced dipoles for LDPE/MgO nanocomposite. IEEE Trans. Dielectr. Electr. Insul. 2008, 15, 152–160. [Google Scholar] [CrossRef]
- Kawano, M.; Murakami, Y.; Nagao, M.; Sekiguchi, Y.; Reddy, C.C.; Murata, Y. Treeing breakdown phenomena in MgO/LDPE nanocomposite material. In Proceedings of the 9th International Conference on Properties and Applications of Dielectric Materials (ICPADM), Harbin, China, 19–23 July 2009; pp. 837–840. [Google Scholar]
- Murata, Y.; Kanaoka, M. Development History of HVDC Extruded Cable with Nanocomposite Material. In Proceedings of the 8th International Conference on Properties and Applications of Dielectric Materials (ICPADM), Bali, Indonesia, 26–30 June 2006; pp. 460–463. [Google Scholar]
- Douar, M.A.; Beroual, A.; Souche, X. Assessment of the resistance to tracking of polymers in clean and salt fogs due to flashover arcs and partial discharges degrading conditions on one insulator model. IET Gener. Transm. Dis. 2016, 10, 986–994. [Google Scholar] [CrossRef]
- Li, Y.; Jin, H.; Nie, S.; Zhang, P.; Gao, N. Dynamic behavior of water droplets and flashover characteristics on a superhydrophobic silicone rubber surface. Appl. Phys. Lett. 2017, 110, 201602. [Google Scholar] [CrossRef]
- Lu, J.; Xie, P.; Hu, J.; Jiang, Z.; Fang, Z. AC flashover performance of 10 kV rod-plane air-gapped arresters under rain conditions. Energies 2018, 11, 1563. [Google Scholar] [CrossRef]
- Li, C.; Hu, J.; Lin, C.; Zhang, B.; Zhang, G.; He, J. Surface charge migration and dc surface flashover of surface-modified epoxy-based insulators. J. Phys. D Appl. Phys. 2017, 50, 65301. [Google Scholar] [CrossRef]
- Xue, J.; Wang, H.; Chen, J.; Li, K.; Liu, Y.; Song, B.; Deng, J.; Zhang, G. Effects of surface roughness on surface charge accumulation characteristics and surface flashover performance of alumina-filled epoxy resin spacers. J. Appl. Phys. 2018, 124, 83302. [Google Scholar] [CrossRef]
- Chen, C.; Wang, F.; Chang, S.; Yang, C. Using oxygen plasma pretreatment to enhance the properties of F-doped ZnO films prepared on polyimide substrates. Materials 2018, 11, 1501. [Google Scholar] [CrossRef] [PubMed]
- Method for Determining the Comparative and the Proof Tracking Indices of Solid Insulating Materials; IEC60112, Ed.4; International Electrotechnical Commission (IEC): Geneva, Switzerland, 2009.
- Motoyama, T.; Hackam, R. Effect of temperature and water salinity on hydrophobicity of epoxy resin. In Proceedings of the 2001 Annual Report Conference on Electrical Insulation and Dielectric Phenomena (CEIDP), Kitchener, ON, Canada, 14–17 October 2001; pp. 157–160. [Google Scholar] [CrossRef]
© 2019 by the authors. Licensee MDPI, Basel, Switzerland. This article is an open access article distributed under the terms and conditions of the Creative Commons Attribution (CC BY) license (http://creativecommons.org/licenses/by/4.0/).