Article

How Can Low-Frequency Noise Exposure Interact with the Well-Being of a Population? Some Results from a Portuguese Municipality

by
Juliana Araújo Alves
1,2,
Lígia Torres Silva
2 and
Paula Remoaldo
1,*
1
Lab2PT—Landscape, Heritage and Territory Laboratory, University of Minho, 4710-057 Braga, Portugal
2
CTAC—Centre for Territory, Environment and Construction, University of Minho, 4800-058 Guimarães, Portugal
*
Author to whom correspondence should be addressed.
Appl. Sci. 2019, 9(24), 5566; https://doi.org/10.3390/app9245566
Submission received: 5 November 2019 / Revised: 10 December 2019 / Accepted: 13 December 2019 / Published: 17 December 2019
(This article belongs to the Special Issue New and Old Environmental Impacts on Population Well Being)

Abstract

:

Featured Application

Authors are encouraged to provide a concise description of the specific application or a potential application of the work. This section is not mandatory.

Abstract

Noise pollution is the second most harmful environmental stressor in Europe. Portugal is the fourth European country most affected by noise pollution, whereby 23.0% of the population is affected. This article aims to analyze the effects of exposure to low frequency noise pollution, emitted by power poles and power lines, on the population’s well-being, based on a study of “exposed” and “unexposed” individuals in two predominantly urban areas in north-western Portugal. To develop the research, we used sound level (n = 62) and sound recording measurements, as well as adapted audiometric test performance (n = 14) and surveys conducted with the resident population (n = 200). The sound levels were measured (frequency range between 10 to 160 Hz) and compared with a criterion curve developed by the Department for Environment, Food and Rural Affairs (DEFRA). The sound recorded was performed 5 m away from the source (400 kV power pole). Surveys were carried out with the “exposed” and “unexposed” populations, and adapted audiometric tests were performed to complement the analysis and to determine the threshold of audibility of “exposed” and “unexposed” volunteers. The “exposed” area has higher sound levels and, consequently, more problems with well-being and health than the “unexposed” population. The audiometric tests also revealed that the “exposed” population appears to be less sensitive to low frequencies than the “unexposed” population.

Graphical Abstract

1. Introduction

At an international level, there are many studies on health impacts due to occupational and environmental exposure to noise. In general, these studies were developed using voluminous samples involving patient reports, distributing questionnaires, adopting cross-sectional studies based on databases, and comparing environmental noise levels measured using criteria curves. However, there are still few studies focusing exclusively on health impacts and discomfort due to low-frequency noise. One of the main reasons is the low sensitivity of the human auditory system to low frequencies. On the other hand, this type of noise has very particular characteristics and causes much more discomfort and long-term non-auditory effects [1,2,3,4].
Until the 1930s, it was believed that the effects of noise on health were restricted only to hearing loss. In a study published in the Journal of the Acoustical Society of America, Jüichi Obata et al. [5] concluded that the effects of noise on human health went beyond hearing loss.
The 1970s were marked by the emergence of a series of studies addressing the annoyance caused by environmental noise [3,6,7,8,9,10,11]. The most cited effects on human health refer to emotional changes, such as agitation and distraction [12,13,14,15,16,17], in addition to the association of low-frequency noise with cognitive alterations [18], the development of cardiovascular diseases [19,20,21], sleep disorders [22,23], and high blood pressure [24].
Thus, the effects of noise pollution comprise “auditory effects”, which directly affect the human auditory system and “non-auditory effects”, i.e., the impact of noise on physiological functions. Regarding “non-hearing effects”, discomfort has been reported as the most frequent effect caused by exposure to low-frequency noise in humans [5,25,26].
In addition, discomfort may vary from individual to individual and depends not only on the noise pressure levels but also on the exposure time, as well as the low frequency components present in the noise. Thus, noise levels that contain low frequency components tend to be more annoying than noise without such components [5,27].
Since 2000, the World Health Organization has recognized low-frequency noise as an environmental problem. In addition, the health impacts of low-frequency components on noise are estimated to be more severe [5].
As urbanization has increased, noise pollution has become more acute and is currently the second most harmful environmental stressor in Europe. In Europe, this type of pollution has been considered a public health problem, whereby Portugal ranks fourth as the most affected country concerning noise pollution (23.0% of the population is affected by this type of pollution—[
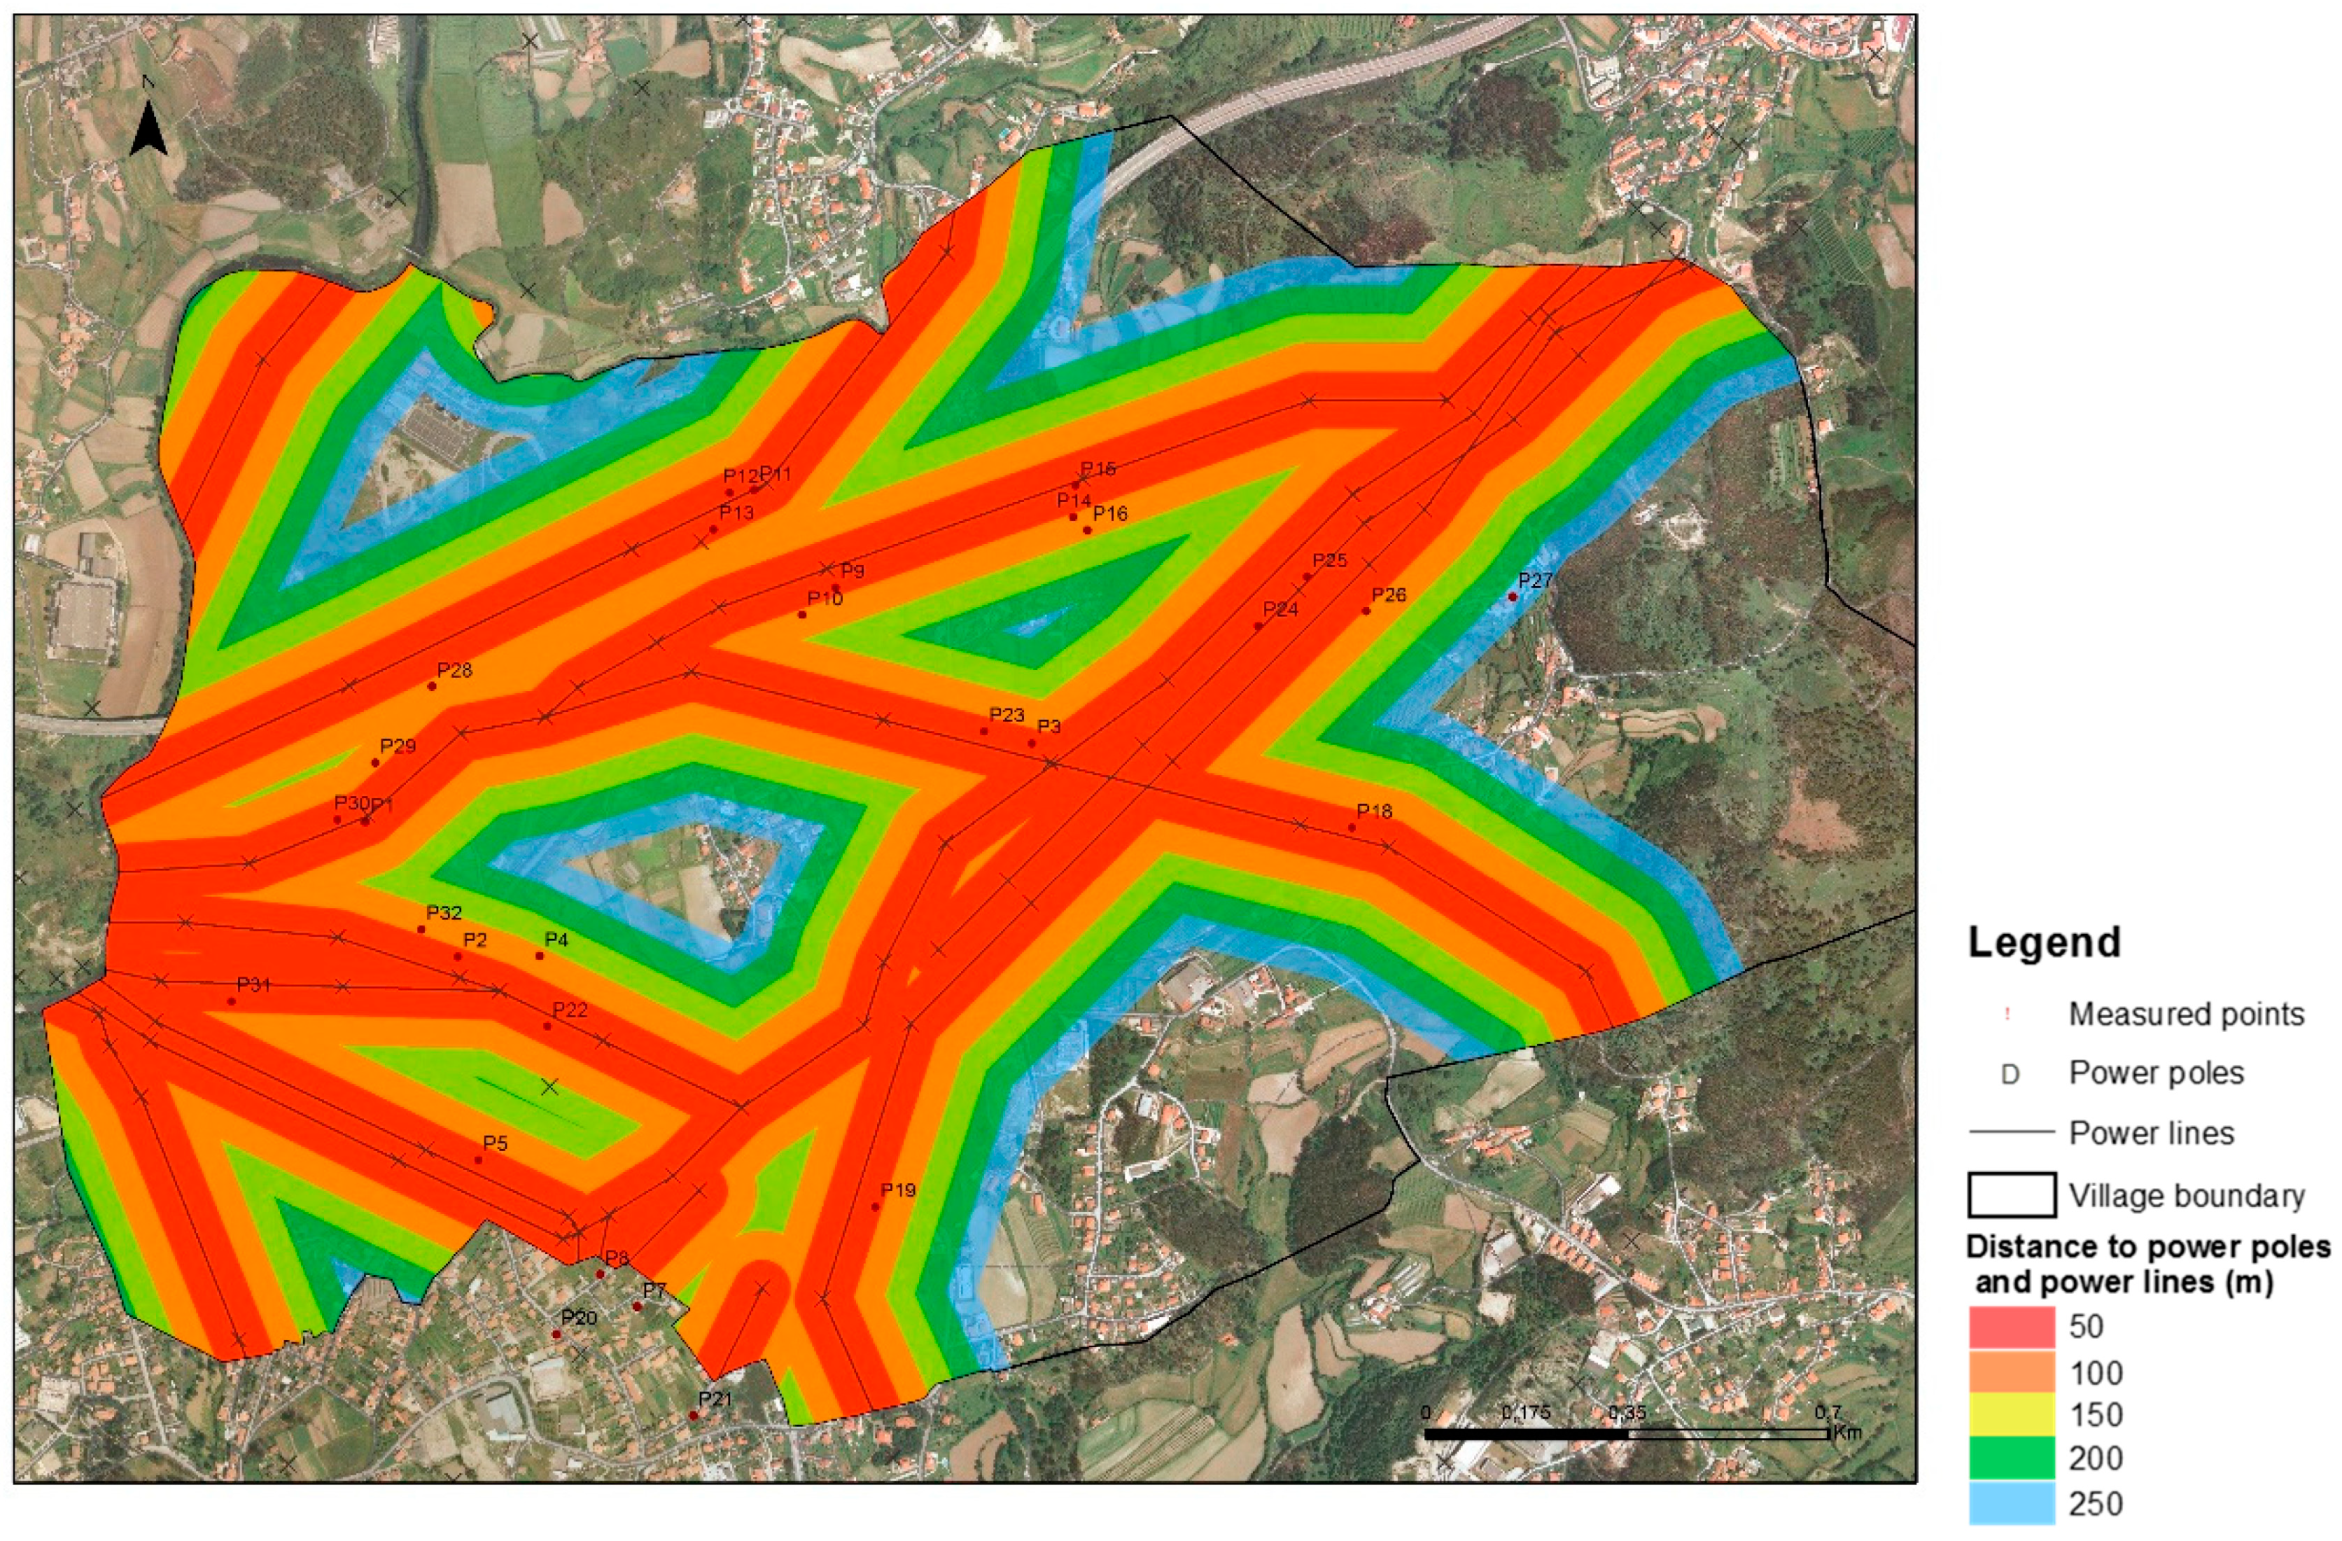
28]). In Portugal, the northern region is the territory that suffers the most demographic pressure and where the electrical substation with the highest voltage at national level is located, the Substation of Riba d’Ave (south-west of the municipality of Guimarães). The village of Serzedelo is one of the 69 villages (until 2013) in the municipality of Guimarães and has the largest installed electrical substation in the country. Moreover, 80% of the region is under the influence of power poles and power lines, including 90 power poles and 12 power lines of high and very high voltage. In a survey carried out in 2010 by Azevedo [29], out of the 1022 dwellings located in the village of Serzedelo, only 98 are at 250 m or more from the power poles and power lines of high and very high voltage, that is, 9.6% are very close to these elements (up to 250 m) [
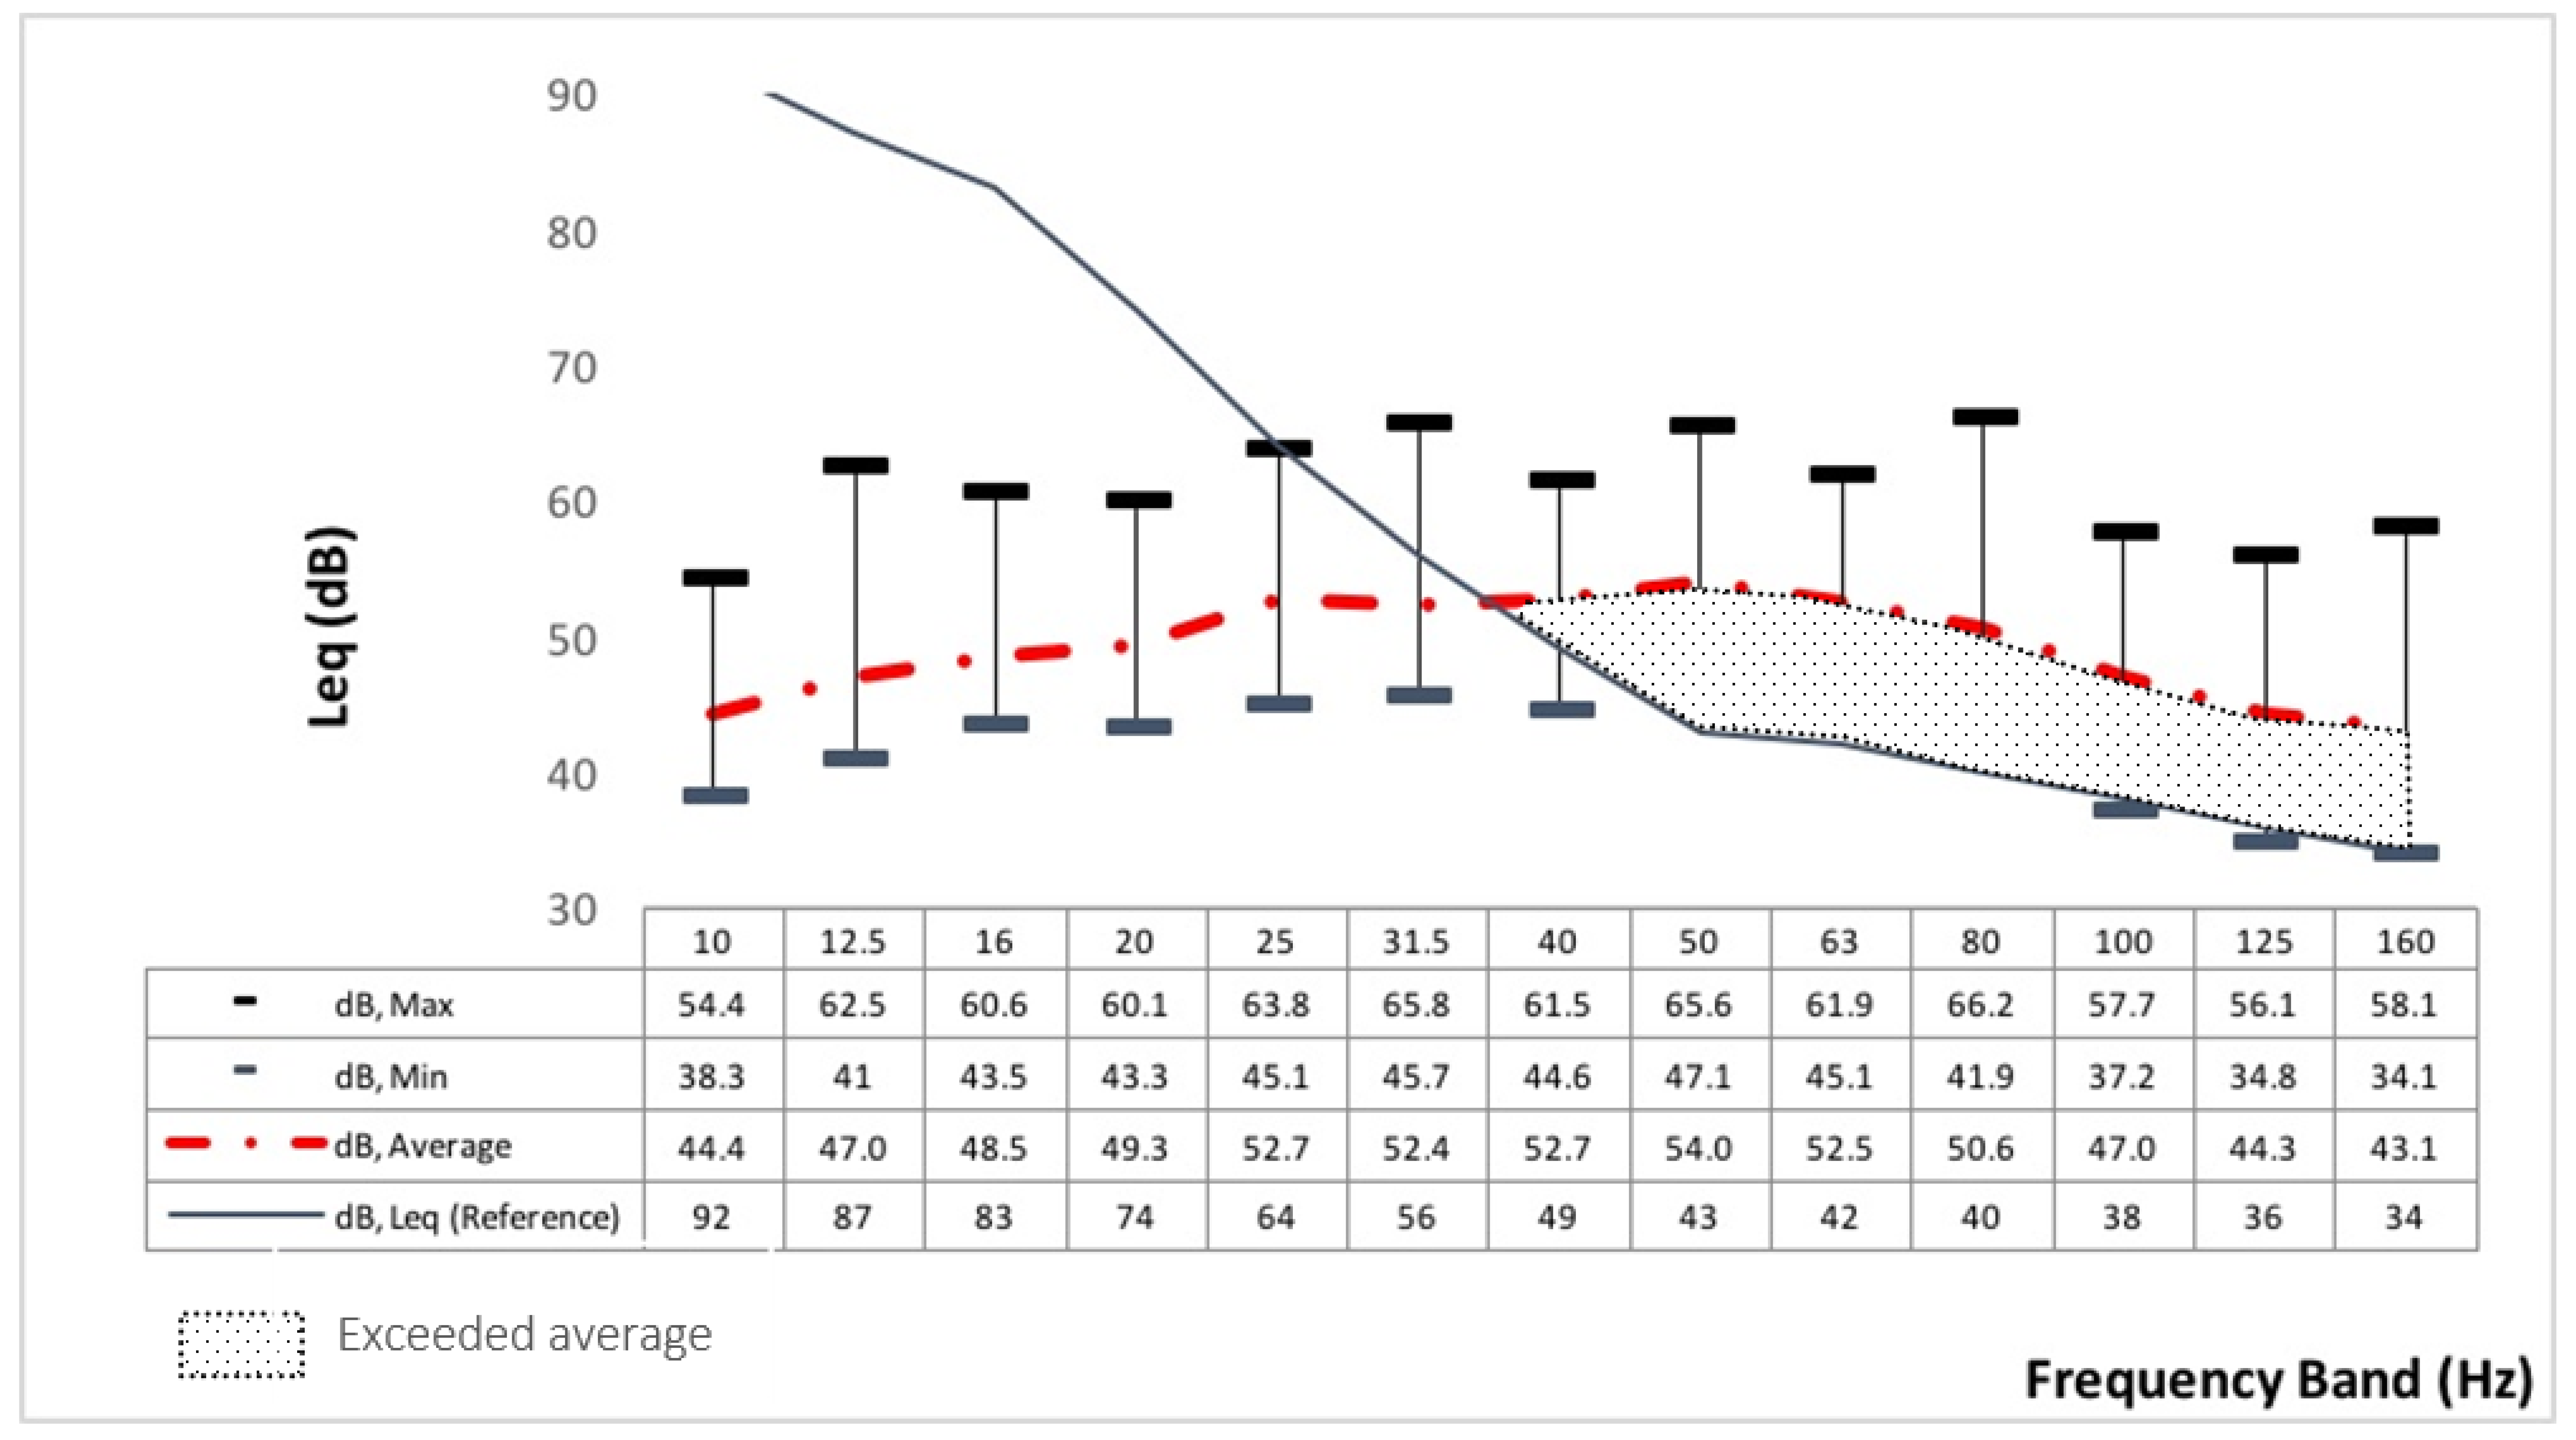
29]. This generates a conflict regarding the use of space. Alves et al. (2015), in an evaluation of the impact of low-frequency noise pollution on the population of the village of Serzedelo, concluded that the measured low-frequency sound levels exceeded the criterion curve of the Department for Environment, Food and Rural Affairs methodology [30], which makes that type of noise audible and annoying to the population.
Based on these assumptions, the guiding questions that underlie the present investigation are the following: (1) Do power poles and power lines cause discomfort due to low frequency noise? (2) Do power poles and power lines affect the quality of life of the population?
The noise levels emitted by power poles and power lines can be a potential source of low frequency noise and discomfort in residential areas [1,
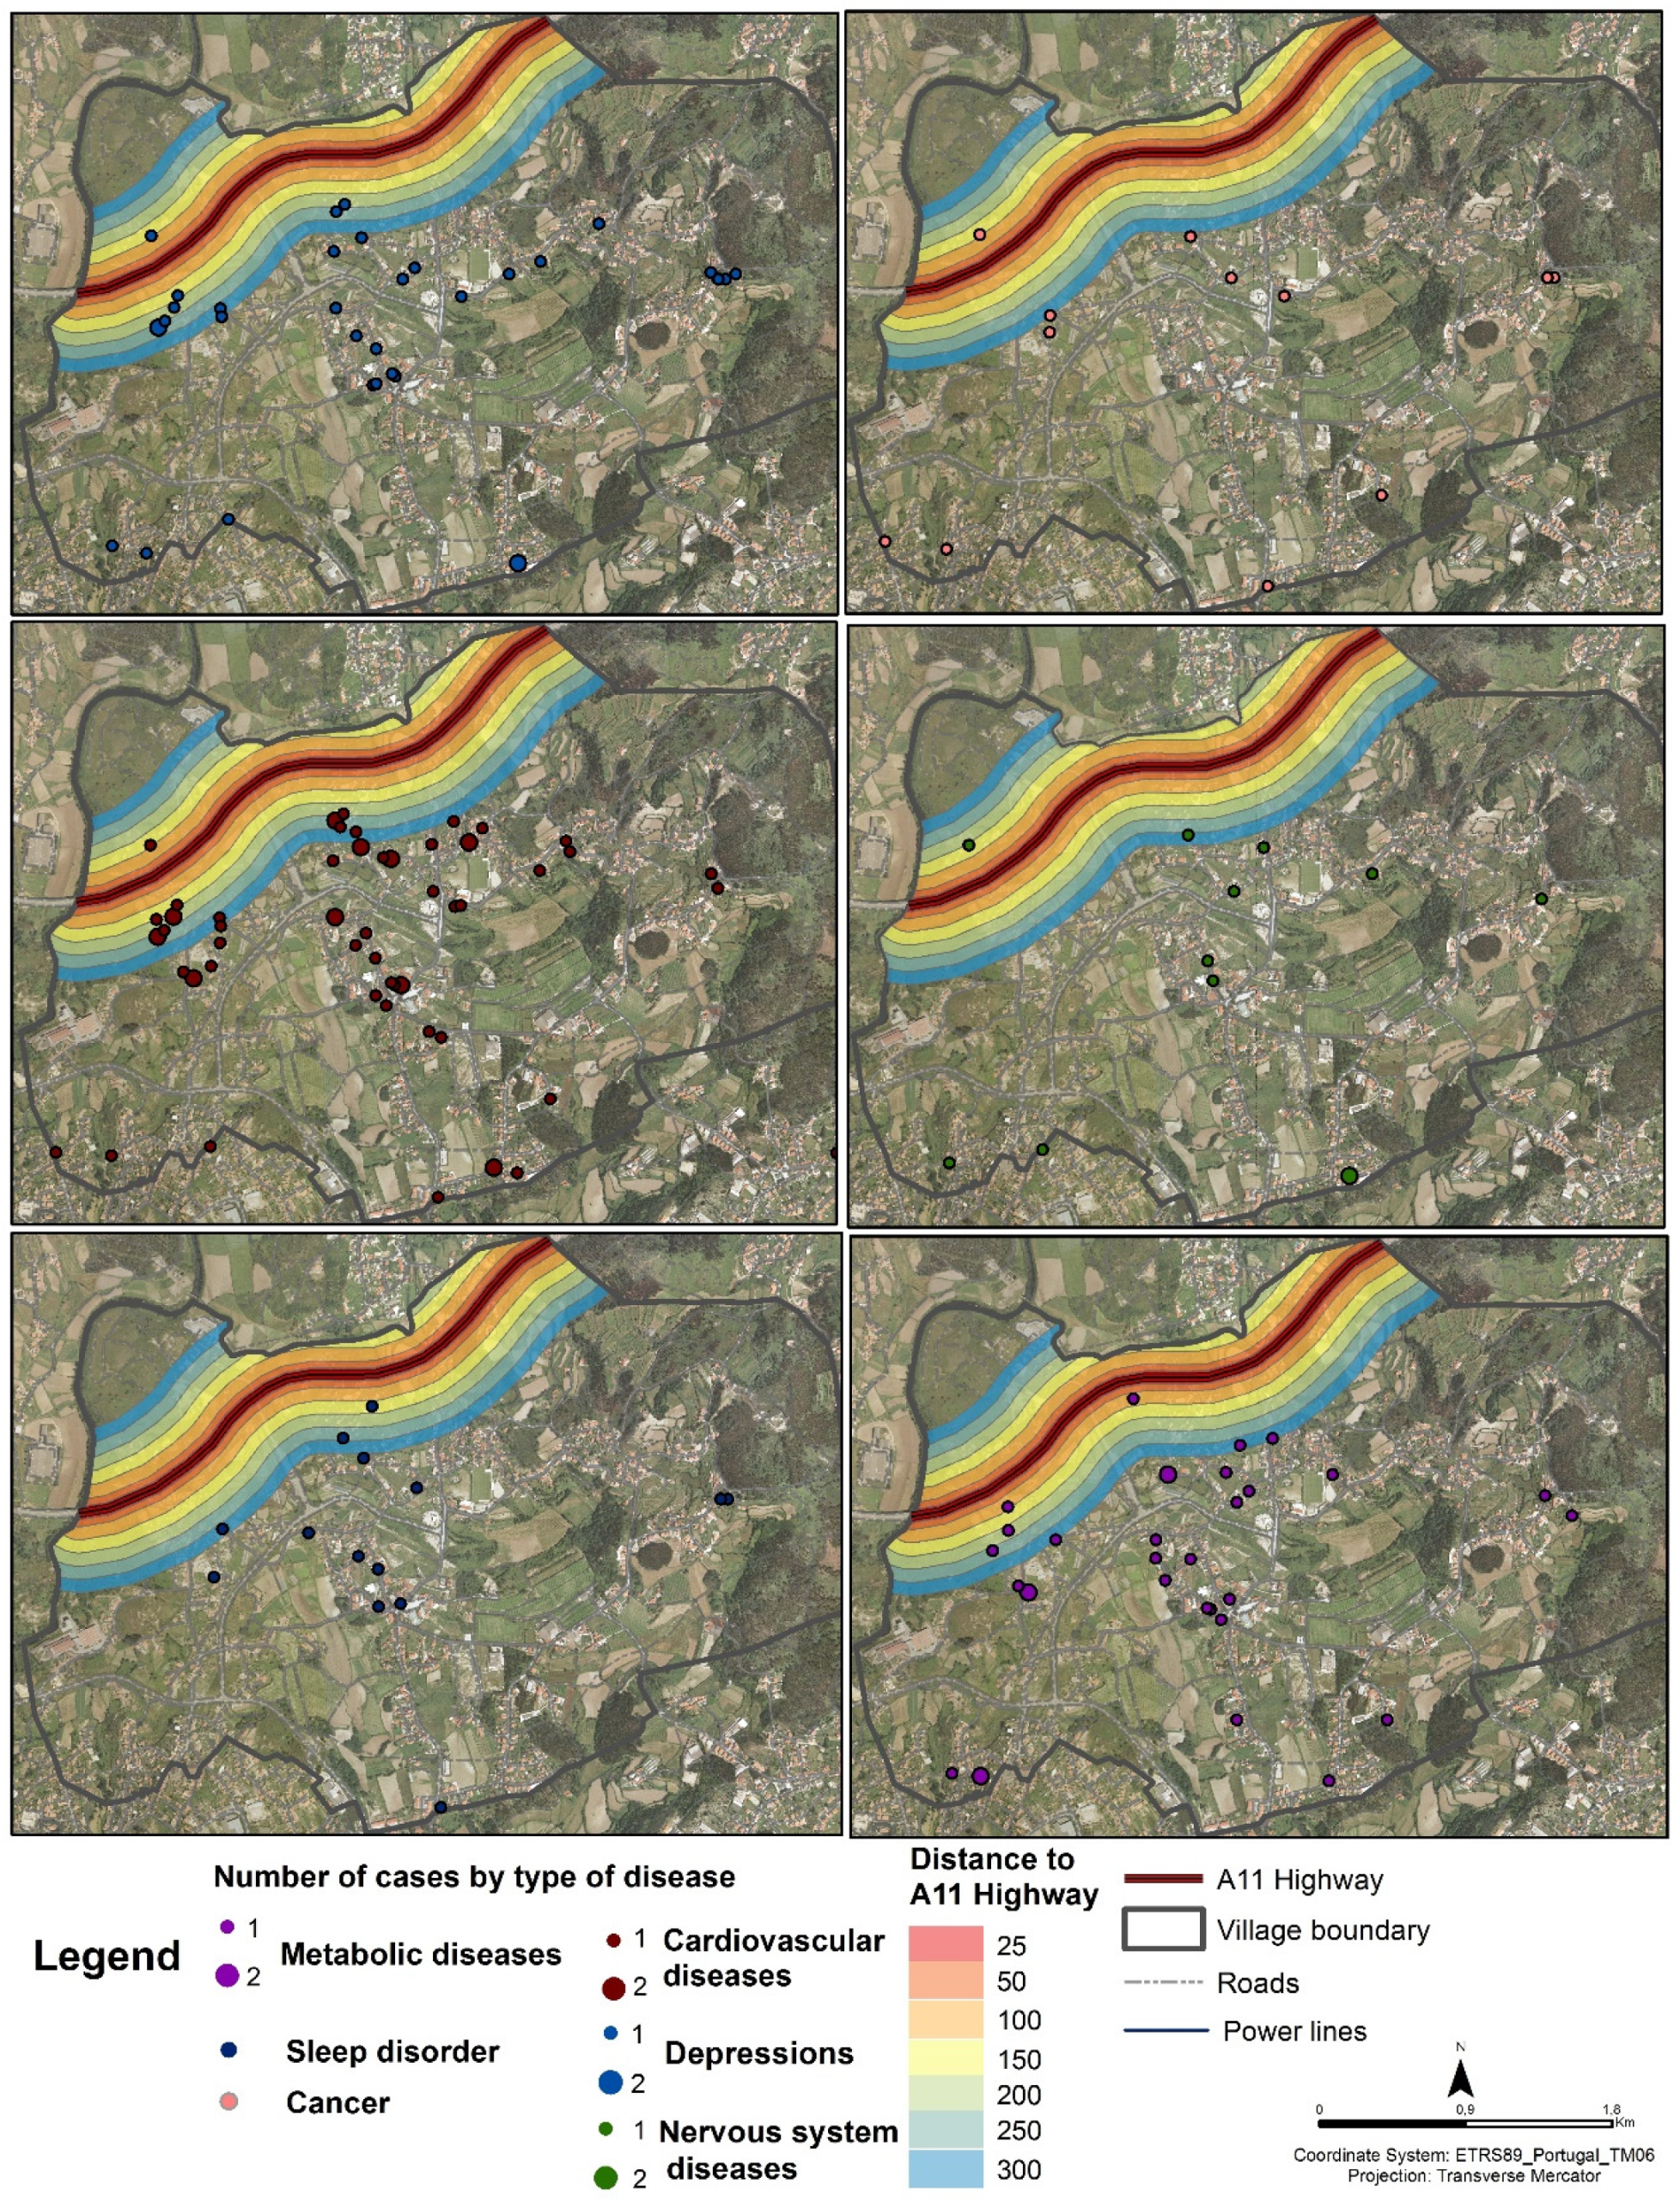
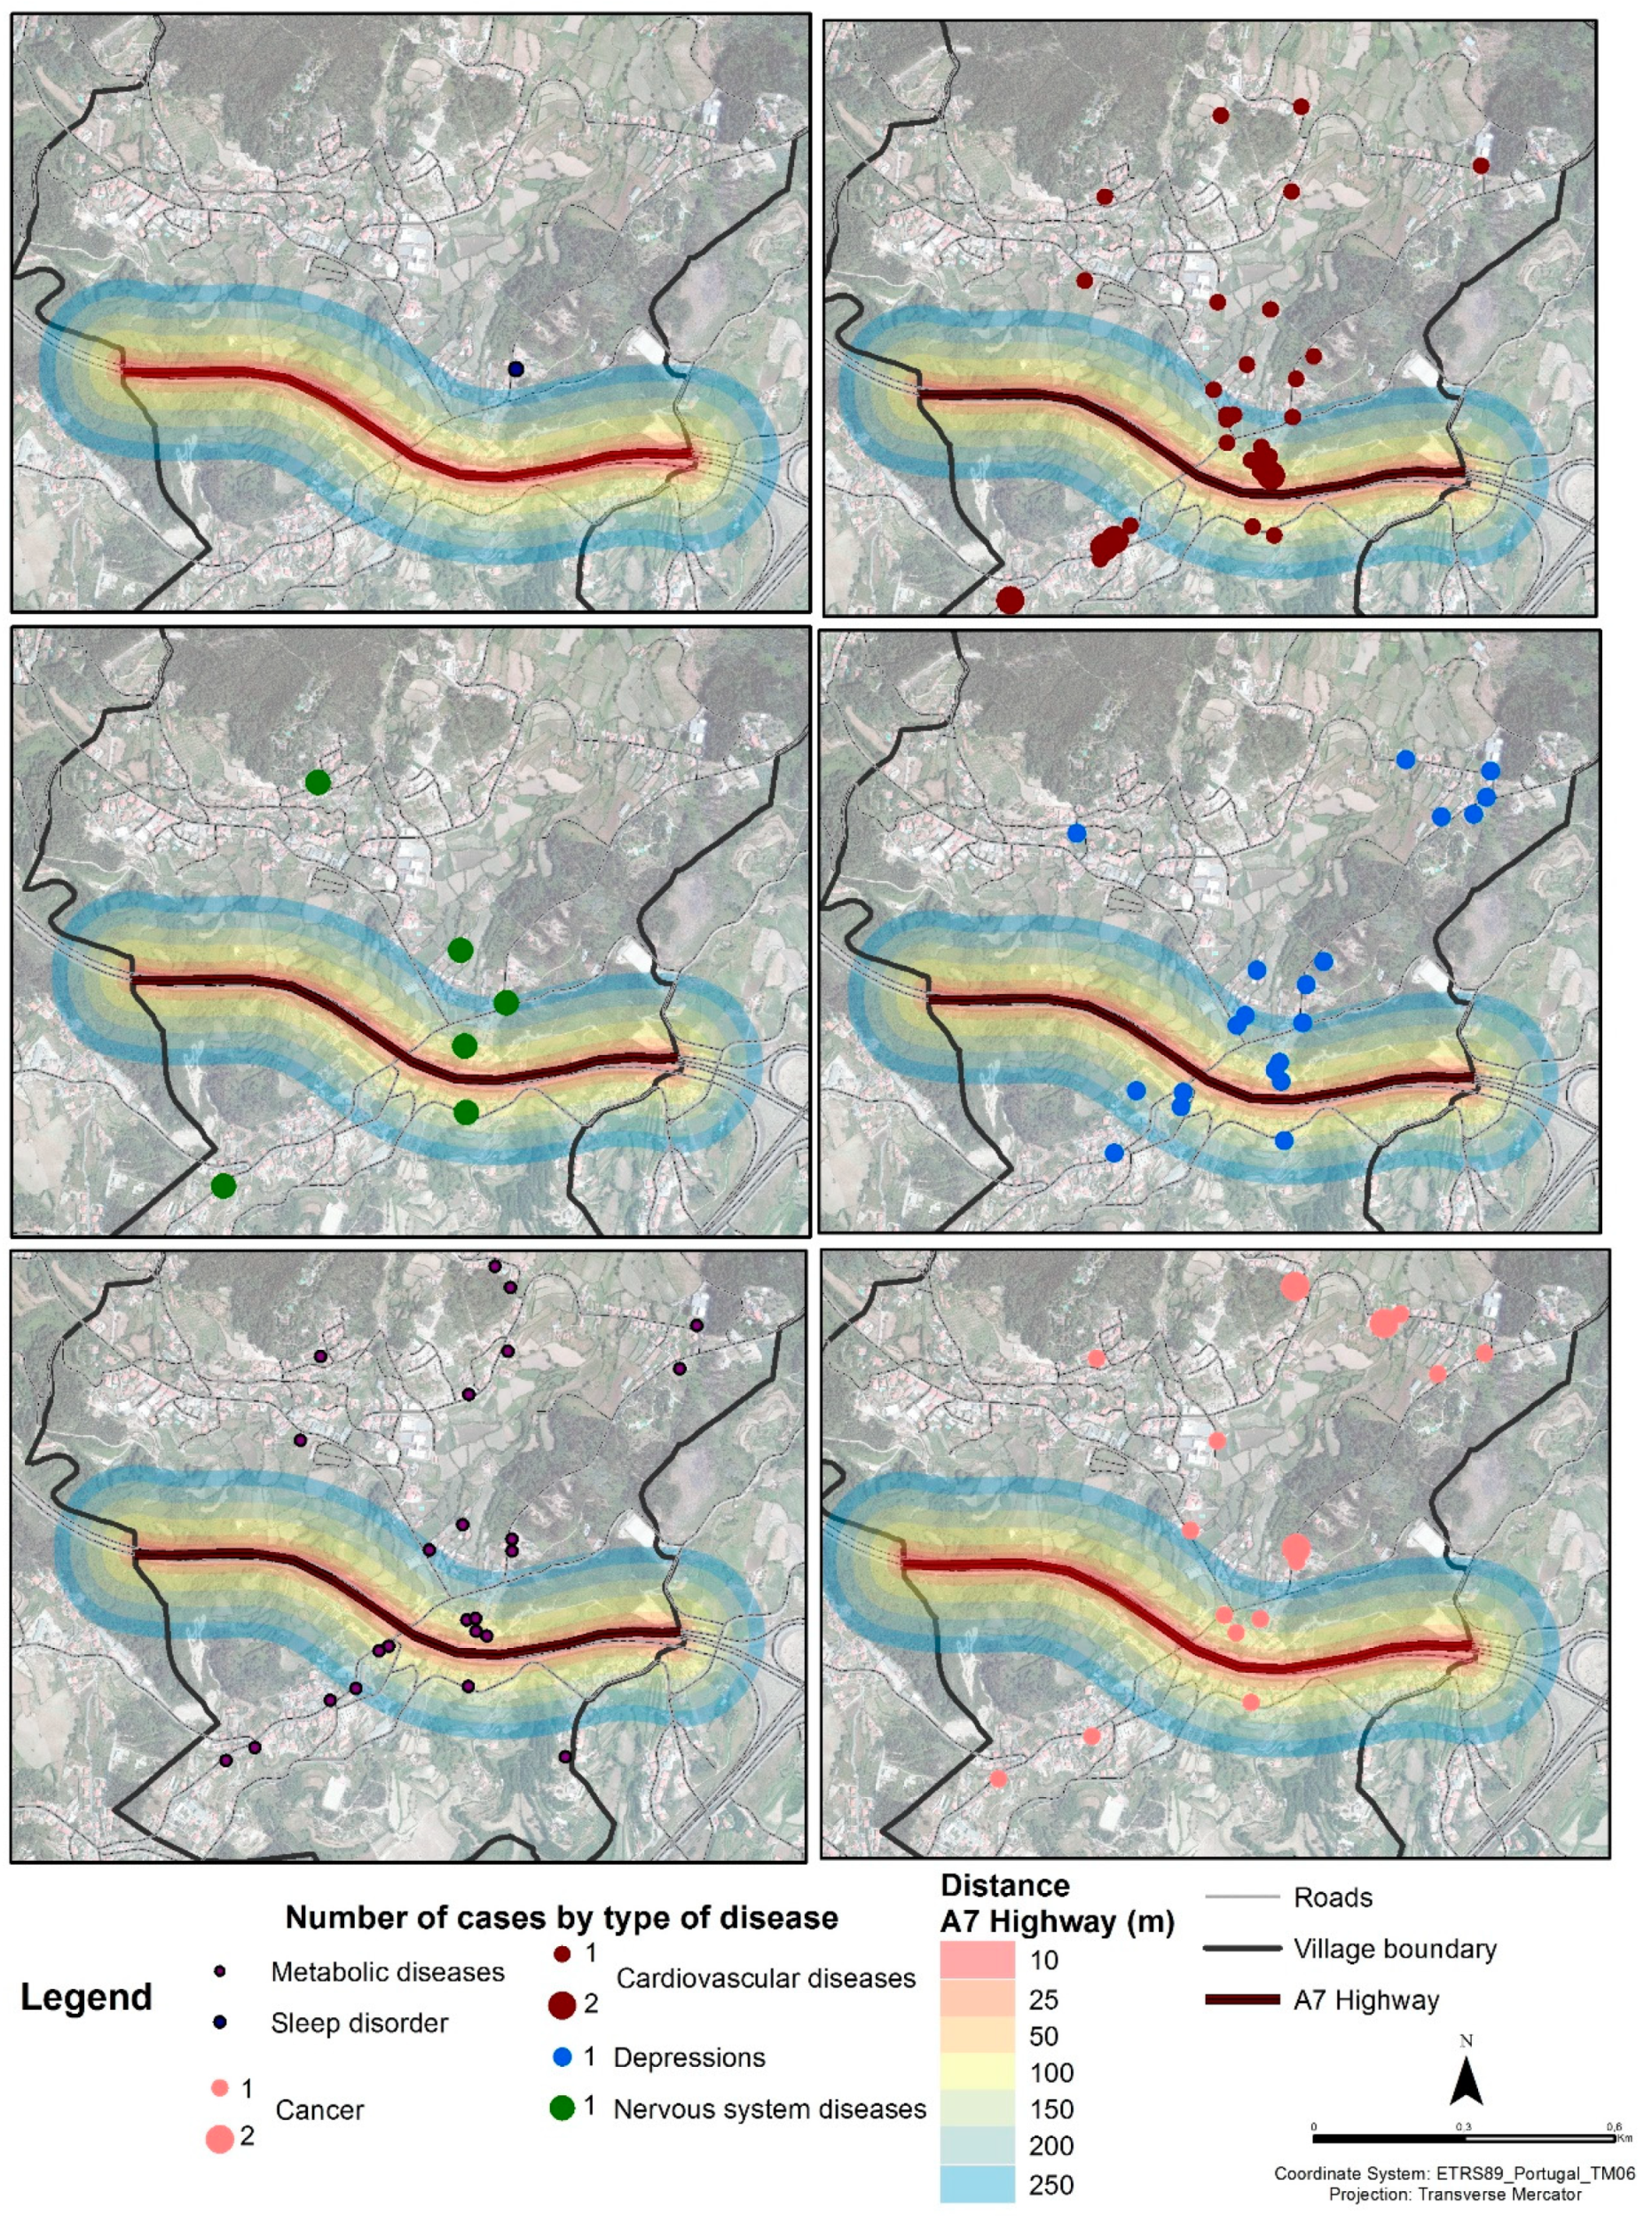
31]. Nevertheless, how the population perceives the noise emitted by power poles and power lines should be determined, corresponding to a more subjective approach and complementing a more objective approach. Thus, this article aims to analyze the impacts of low frequency sound pollution, emitted by power poles and power lines, in two predominantly urban areas of the municipality of Guimarães (north-western Portugal), from the objective approaches (noise level and sound recording measurements) and the subjective assessment of noise discomfort (distributing surveys to the resident population and adapted audiometric test performance). It is hypothesized that people living in these spaces develop more health problems (e.g., insomnia, irritation, depression) than those living far away from these places.
This research comprises a study of “exposed” and “unexposed” individuals carried out in the village of Serzedelo, which was classified as an “exposed” territory because of the high concentration of power poles and power lines. The second concerns the village of Abação (São Tomé) classified as “unexposed” due to the inexistence of this type of infrastructure.
At an international level, existing production concerning the low frequency noise still remains very low. This paper can contribute to more complete methodologies to assess low-frequency noise discomfort. Additionally, it not only considers objective evaluation parameters (noise level measurement), but it also takes into account the perception of discomfort obtained from the surveys and the audiometric tests adapted to low frequencies. In addition, this type of study can contribute to the formulation of public policies in terms of installing power poles and power lines in residential areas.
This article is structured in four sections. This section includes a literature review on noise pollution, as well as impacts on the well-being of the population and an introduction to the subject. Section 2 presents the methodology used in the objective and subjective dimensions of the investigation. Section 3 comprises the results and the discussion. In Section 4, we present some conclusions obtained from this investigation and suggestions for future investigations.

2. Materials and Methods

2.1. Study Area

The municipality of Guimarães is located in the Ave sub-region (north-western Portugal) and had 158,124 inhabitants in the last census [32]. The city of Guimarães has a population of 54,097 inhabitants and is crossed by four aerial power lines of 400 kV and nine aerial power lines of 150 kV. Concerning the village of Serzedelo (southwest of the city of Guimarães), it has a population of 3680 inhabitants in the last Census and a high density with 90 power poles and 12 power lines [29,31]. The village of Abação (São Tomé—southeast of Guimarães) has a population of 2252 inhabitants and was selected due to the absence of aerial power lines [32].

2.2. Assessment Framework

Regarding the adopted methodology, it focuses on a macrostructural approach that comprises two aspects of analysis, denominated as subjective dimension and objective dimension of evaluating the discomfort caused by low-frequency noise.

2.2.1. Adapted Department for Environment, Food and Rural Affairs (DEFRA) Methodology Proposed Criteria for the Assessment of Low Frequency Noise Disturbance (NANR45)

Among various methods to analyze the discomfort due to low-frequency noise is the procedure developed by the Department for Environment, Food and Rural Affairs (DEFRA), inserted in the Acoustics Research Center at the University of Salford (United Kingdom), using the Proposed Criteria for the Assessment of Low Frequency Noise Disturbance (NANR45). The procedure proposes the noise level measurement for 72 h (three days) and comprises the night-time from 02h00 to 04h00, in 1/3 octave bands from 10 to 160 Hz [30,31].
Thus, an adaptation of this methodology was used, and a higher number of measurements were taken for shorter periods of 15 min each at several points of the two urban areas under study, which allowed a greater spatial representation of the two urban realities evaluated [1].
The sound pressure levels were measured with a fixed-tripod, a class one sound level meter CESVA approved by IPQ (Instituto Português da Qualidade) (A-weighting filter), at a height of 1.5 m from the ground and away from surfaces and obstacles (>3.5 m). The measurement was made in 1/3 octave frequency bands and with a frequency range between 10 Hz and 160 Hz. In the village of the “exposed” group, 32 measurements were performed (Figure 1) and 30 measurements in the village of the “unexposed” (Figure 2) between November and December, 2015.

2.2.2. Recorded Sound

The sound recording was always performed with the same sound level meter on a fixed-tripod and at the same distance from surfaces and obstacles (>3.5 m). Sound capture lasted for 15 min and was performed under favorable weather conditions for sound propagation, i.e., in humid weather scenarios at approximately 5 m projected distance from the nearest source.

2.2.3. Surveys

A sample of 200 surveys was used, of which 100 were distributed to the population of the “exposed” group and 100 to the “unexposed” group. This volume corresponds to 2.7% of the population living in the village of Serzedelo and 4.4% in the case of the village of Abação (S. Tomé). The survey was conducted door-to-door and consisted of approximately 80 questions and took an average time of 25 min. It was divided into three axes and 12 sections. The present article only uses the variables that are related to the objective component of the investigation carried out (e.g., period of time living in the same place, quality of sleep). For data analysis, descriptive and analytical statistics were used, using the Statistical Package for the Social Sciences (SPSS). From the analysis of the output, chi-square tests (for qualitative variables) and t-test (quantitative variables) were carried out to identify statistical significance.

2.2.4. Adapted Audiometric Tests

During the survey at the “exposed” population, it was observed that the population seemed to be accustomed to the noise emitted by the power lines, revealing a kind of “psychological defense” as a significant number of the interviewees seemed to be less sensitive to that kind of noise. For this reason, it was decided to remove the “exposed” population from its usual place and introduce the same acoustic stimulus to which they are exposed in their day-to-day in an audiometric booth and analyze the differences in hearing thresholds recorded for “exposed” and “unexposed” volunteers.
Consequently, audiometric tests adapted and oriented exclusively for low frequencies were performed as a complement to the objective analysis, between 2016 and 2017.
It should be noted that in the international literature on the subject, there is no audiometric evaluation methodology oriented to low frequencies and, because of this, the developed protocols were based on ISO 8253-1/2010 [33].
The protocols developed for audiometric tests oriented at low frequencies aimed to verify whether the recorded sound was audible, as well as to determine the hearing threshold for the pure sounds and for the recorded sound, of the “exposed” and “unexposed” volunteers.
Audiometric tests were performed with eight volunteers from the “exposed” group, aged between 24 and 68 years, with different occupations (e.g., students, retired workers, textile industry employees) and education levels (e.g., 4 years of schooling, 9 years, 11 years, graduation and master’s degree). In the “unexposed” group, audiometric tests were performed with 6 volunteers, aged between 44 and 60 years and a differentiated occupational profile (unemployed, drivers and construction workers) and with education levels varying between 2 and 9 years of schooling. After innumerable telephone contact attempts and even after the team offered transportation (approximately 15 km away for the “exposed” and 10 km for the “unexposed” groups) to the individuals invited to participate in the audiometric tests at the university (where the audiometric booth is installed), few accepted to participate.
To determine the pure sound hearing threshold, pure sound was reproduced by frequency bands, from 10 Hz to 90 Hz with a variation in the signal intensity. The tests were carried out in an Optac audiometric booth—Aumec Horprufkabine brand-and two acoustic signals were introduced: pure sounds (tracks from a high-fidelity CD, of the Nordost brand—System Set-Up & Tuning Disc) and the sounds previously recorded at the place of exposure. The sound was reproduced inside the audiometric booth using HE4OOS headphones with good response at low frequencies, from the Hifiman brand. Connections were made to allow the passage and control of the signal by the AD28—Interacoustics audiometer. The pure sounds were played by Windows Media Player and the recorded sound was played by dBTrait software [34].

3. Results and Discussion

In this section, the results obtained are presented, as well as their discussion in the objective (sound level measurements) and subjective dimensions (resident population surveys and adapted audiometric tests).

3.1. Objective Dimension

The objective dimension included noise level measurements in 62 points of the two villages and a comparison with the criterion curve of the DEFRA methodology [30].
For the “exposed” group, 32 measurements were performed, with projected distances varying between 1 and 250 m, and in several points in the village of Serzedelo (Figure 3).
In the “unexposed” group, 30 measurements were performed at several points in the village of Abação (São Tomé—Figure 4).
The exceeded average was obtained by averaging the values of the sound pressure levels obtained at each measurement point. For the “exposed” group, the exceeded average was 68.9 dB (Figure 3), while for the “unexposed” group it was 64.6 dB (Figure 4).
The difference in the exceeded average for the “exposed” group and for the “unexposed” group was 4.3 dB, which shows a considerable difference between the two villages assessed. If the source evaluated was only from the power poles and power lines, it could be induced that in the “exposed” group, the source more than doubled, compared to the “unexposed” group.
In previous studies, the authors took measurements without interference from road sources [31]. The results showed that for the “exposed group”, and using 26 isolated points, without interference from traffic road sources, the noise levels were exceeded for all points measured between 50 and 160 Hz and the mean exceeded recorded in this group was 55.7 dB. For the “unexposed” group (21 points), the measured noise levels were exceeded at all points between 50 and 80 Hz. The mean of the exceedance, for this group, was 50.1 dB.

3.2. Subjective Dimension

The subjective dimension entailed distributing surveys to the resident population in the “exposed” and “unexposed” areas and audiometric tests adapted for low frequencies.

3.2.1. Survey Given to the Resident Population

In this section, the results of the surveys are presented, by village, and the comparison of some variables included in the questionnaire between the two villages aiming to perform an overall analysis of the results obtained. It should be emphasized that the analysis focused on the most important variables that were most closely related to noise pollution (allowing to complement the objective analysis performed in each village).

Choice of Place to Live

The place of residence and its characteristics are important indicators for understanding the state of the population’s health, as well as their perception [35,36,37,38]. Thus, we selected some variables that consider this dimension for the analysis, e.g., how long have they been living in the village, how long have they been living in their current dwelling and the number of people living in it. It is important to remember that in the literature on the subject, the effects are directly proportional to the time factor of exposure [39].
Concerning the group of respondents from Serzedelo, 58.0% have been living in this village since they were born and 42.0% had lived in another village before Serzedelo, usually in another village belonging to the municipality of Guimarães. In the case of Abação (São Tomé), the percentage was similar, that is, 54.0% of respondents have “lived there since they were born” (Table 1; Table 2). These are high percentages that indicate that respondents had a long period of exposure to factors that may have influenced their health.
It is important to mention the very low percentage of respondents living in the home reported in the survey up to 2 years ago. (5.0% in the case of Serzedelo and 2.0% in the case of Abação (São Tomé)). Whether in one village or the other, most of the population lived between 11 and 40 years in the reported house (40.0% in the case of Serzedelo and 38.0% in the case of Abação (São Tomé)—Table 2).
Regarding the composition of the household (which indicates how many people may be at risk due to exposure to low frequency noise), in both Serzedelo and Abação (São Tomé), the most representative class was “three to four people” (40.0% in Serzedelo versus 54.0% in Abação (São Tomé)—Table 3). This was followed by a greater representation of families with two people in the two villages and the families of only one person which had practically the same percentage (9.0% in Serzedelo versus 8.0% in the other village). This scenario follows the national trend, which is close to the standard of countries in the European Union. It should be recalled that couples with children still constitute the main household composition and that other types of family are on the rise, such as single-parent families and couples without children [40,41,42].

Impacts due to Noise Pollution

To assess the impact of noise pollution on health, an analysis was made of some of the most important variables in the survey. The following impacts were analyzed: sleep quality, occupational aspects and morbidity and, finally, noise pollution.

Sleep Quality

Sleep has an important role in physiological terms and its quality may have aggravating effects in immunological, cardiovascular, neurological terms and the development of chronic diseases [43,44,45,46,47,48]. Even at night, when the noise tends to be reduced, low frequencies dominate the perceived noise spectrum. Thus, sleep disturbances can occur as a consequence of exposure to noise during the night period [3,49,50].
Perception of sleep quality was evaluated between “good” and “acceptable” by both samples (Table 4).
Sleeping pills were used by 24.0% of those interviewed in each of the villages (Table 5).
The habit of getting up at night has significant impacts on sleep quality and the well-being of the population. The percentage of respondents who are used to getting up at night seems to be higher among those who live within a radius of up to 200 m from the source (power poles and power lines). However, this correlation is not statistically significant for the village of the “exposed” (chi-square = 9.15 for 7 gl; p-value > 0.05—Table 6). In the case of the village of Abação (São Tomé), the percentage of respondents living near the A7 motorway and that are used to getting up during the night is also higher. However, the correlation is not statistically significant (chi-square = 0.51 for 4; p-value > 0.05—Table 7).
Table 8 shows the association between the use of sleeping medication by large groups of professions in Serzedelo and Abação (São Tomé).
It can be observed that sleep quality is very similar in both samples (Table 4; Table 5). It was observed that for the two villages a more significant percentage of those interviewed who used sleeping medication corresponds to the retired group (15.0% in Serzedelo and 8.0% in Abação) (Table 8).

Occupational Aspects and Morbidity

In this section, we present the variables that consider the occupational aspects and the morbidity of the population of the “exposed” and “unexposed” villages.
The results show that 64.0% of the interviewees in the village of the “exposed” group had a health problem. In the case of the “unexposed” group, this percentage was lower (49.0%) (Table 9).
Regarding the percentage of interviewees who had a health problem, by age group, in the village of the “exposed” group, there were more health problems in those interviewed aged 50 years and over. This was statistically representative in the village of the “exposed” group, 54.0% (chi-square = 31.3 for 7 gl; p-value < 0.001) versus 30.0% in the village of the “unexposed” group (chi-square = 18.8 for 12 gl; p-value > 0.05) (Table 10).
The variable “residence time” showed to be important to understand the state of health of the population. The percentage of those interviewed who had a health problem was higher among those who lived in the village of the “exposed” group (for those over 30 years of age) when compared to the village of the “unexposed” group (49.0% in the case of Serzedelo and 37.0% in the case of Abação). The relationship is statistically significant only for Serzedelo (chi-square = 15.0 for 7 gl; p-value < 0.05 and in Abação—chi-square = 14.6 for 14 gl; p > 0.05) (Table 11).
The percentage of those interviewed who had a health problem was higher for the village of Serzedelo, especially cardiovascular diseases—32.0% in the case of the “exposed” group and 19.0% in the case of the “unexposed” group. In both groups, the largest segment of the population surveyed presented a health problem that affects the heart and blood vessels (cardiovascular diseases), namely, hypertension and cardiac arrhythmia, besides mental illnesses, depressive episodes and anxiety (Table 12).
These results follow other investigations, such as the one conducted in the 1990s in Poland, with 30 individuals disturbed by noise [51,52]. The 30 individuals were compared to an equal number of people, living in the same apartment block, but without the presence of low frequency noise. This study showed a greater number of sleep disorders and depression among exposed individuals. However, the author clarifies that the results can be confounded by the differences between the populations studied.
The high percentages for cardiovascular diseases, depression and sleep disorders may be caused by exposure to low-frequency noise. The population of the village of the “exposed” group may suffer more from influence due to exposure to the noise emitted by high voltage power poles and power lines (added to that emitted by sources other than the study source, such as traffic road noise), rather than the presence of the electromagnetic field emitted by these infrastructures. Concerning the association between distance to the highway and the presence of health problems, there is no clear pattern in the spatial distribution of disease in the villages of the “exposed” (Figure 5) and the “unexposed” (Figure 6) groups. We also find it complex to establish a spatial distribution pattern of the diseases in Serzedelo due to the presence of power poles and power lines in more than 80% of the territory (Figure 7).
There is no statistically significant correlation between residing near the source (power poles and power lines) and the presence of health problems in Serzedelo (chi-square = 6.94 for 7; p-value > 0.05—Table 13).
When considering the distance in relation to the highway, there is also no statistically significant relationship between the variables (chi-square = 2.01 for 3; p-value > 0.05—Table 14). In the case of the village of Abação (São Tomé), the results were similar in relation to the distance to the highway and to the presence of health problems in those interviewed (chi-square = 3.29 for 8 gl; p-value > 0.05—Table 14).
However, it seems to us complex to draw any kind of conclusion about the relation between the distance and the presence of health problems among those interviewed. This is due to the fact that the sample did not represent the entire population of the two villages under study, and also because health status was a complex element of analysis whose perception varies from individual to individual.

Sources of Noise Pollution

Concerning noise pollution in Serzedelo, 73.0% of those interviewed lived near a highway and a national road. In Abação (São Tomé), this percentage was 64.0% of those interviewed (Table 15). A recent study published in The Lancet [53] found that individuals living within 50 m of a highway with high road traffic are more likely to develop dementia than individuals living more than 300 m away from this type of road.
In Serzedelo, 39.0% of those interviewed answered that there was another type of noise that caused them discomfort, versus 8.0% in the other village.
Among the interviewees who said that there is a different type of noise, besides that caused by road traffic, 24.0% of those interviewed in Serzedelo characterized the noise as a “buzz”. In the case of Abação (São Tomé), only 8.0% stated that there was another type of noise that caused discomfort (e.g., screaming, dogs barking and truck noise). The percentage of interviewees who “did not respond” or “did not apply” refers to those who do not feel discomfort by any kind of noise (Table 16).

3.2.2. Adapted Audiometric Tests

Adapted audiometric tests were performed as a complement to the objective dimension analysis and were used to determine the hearing threshold of “exposed” and “unexposed” volunteers. Thus, the tests were performed with eight “exposed” individuals (Serzedelo—Figure 8) and with six “unexposed” individuals (Abação (São Tomé)—Figure 9).
The differences recorded for the hearing threshold for pure sounds and recorded sound for both groups were significant. For the recorded sound, the difference between the average of the hearing threshold was 27.2 dB [54]. The data shows that the “exposed” group revealed being used to low frequency noise, and corroborates the results shown in Figure 6; Figure 7, which clearly illustrates the low sensitivity of the “exposed” group below 39 Hz when compared to the “unexposed” group [54].

4. Conclusions

The research carried out reveals a novelty in Portugal, whether in the social sciences or the more exact ones, such as environmental acoustics. The originality of the research derived from considering the health impacts on the population due to the noise emitted by the power poles and power lines in residential areas, from the sound level measurements, besides distributing surveys and adapted audiometric test performance. Regarding the first question formulated in the introduction to this paper, “Do power poles and power lines cause discomfort due to low-frequency noise?” the distance between the receiver and the source may interfere with the degree of discomfort experienced by individuals. Especially due to the specific characteristics of high propagation of low-frequency noise and its low absorption by materials and the environment. For the results presented here, the sound was recorded to 5 m of distance from the source (400 kV power pole) and was audible to the “exposed” and “unexposed” volunteers during the adapted audiometric tests. The noise level measurements exceeded the criterion curve of the DEFRA methodology [30]. The difference in the exceeded average of 4.3 dB shows a considerable difference between the two villages. If the source evaluated was only from the power poles and power lines, it could be induced that in the “exposed” group, the source more than doubled compared to the “unexposed” group.
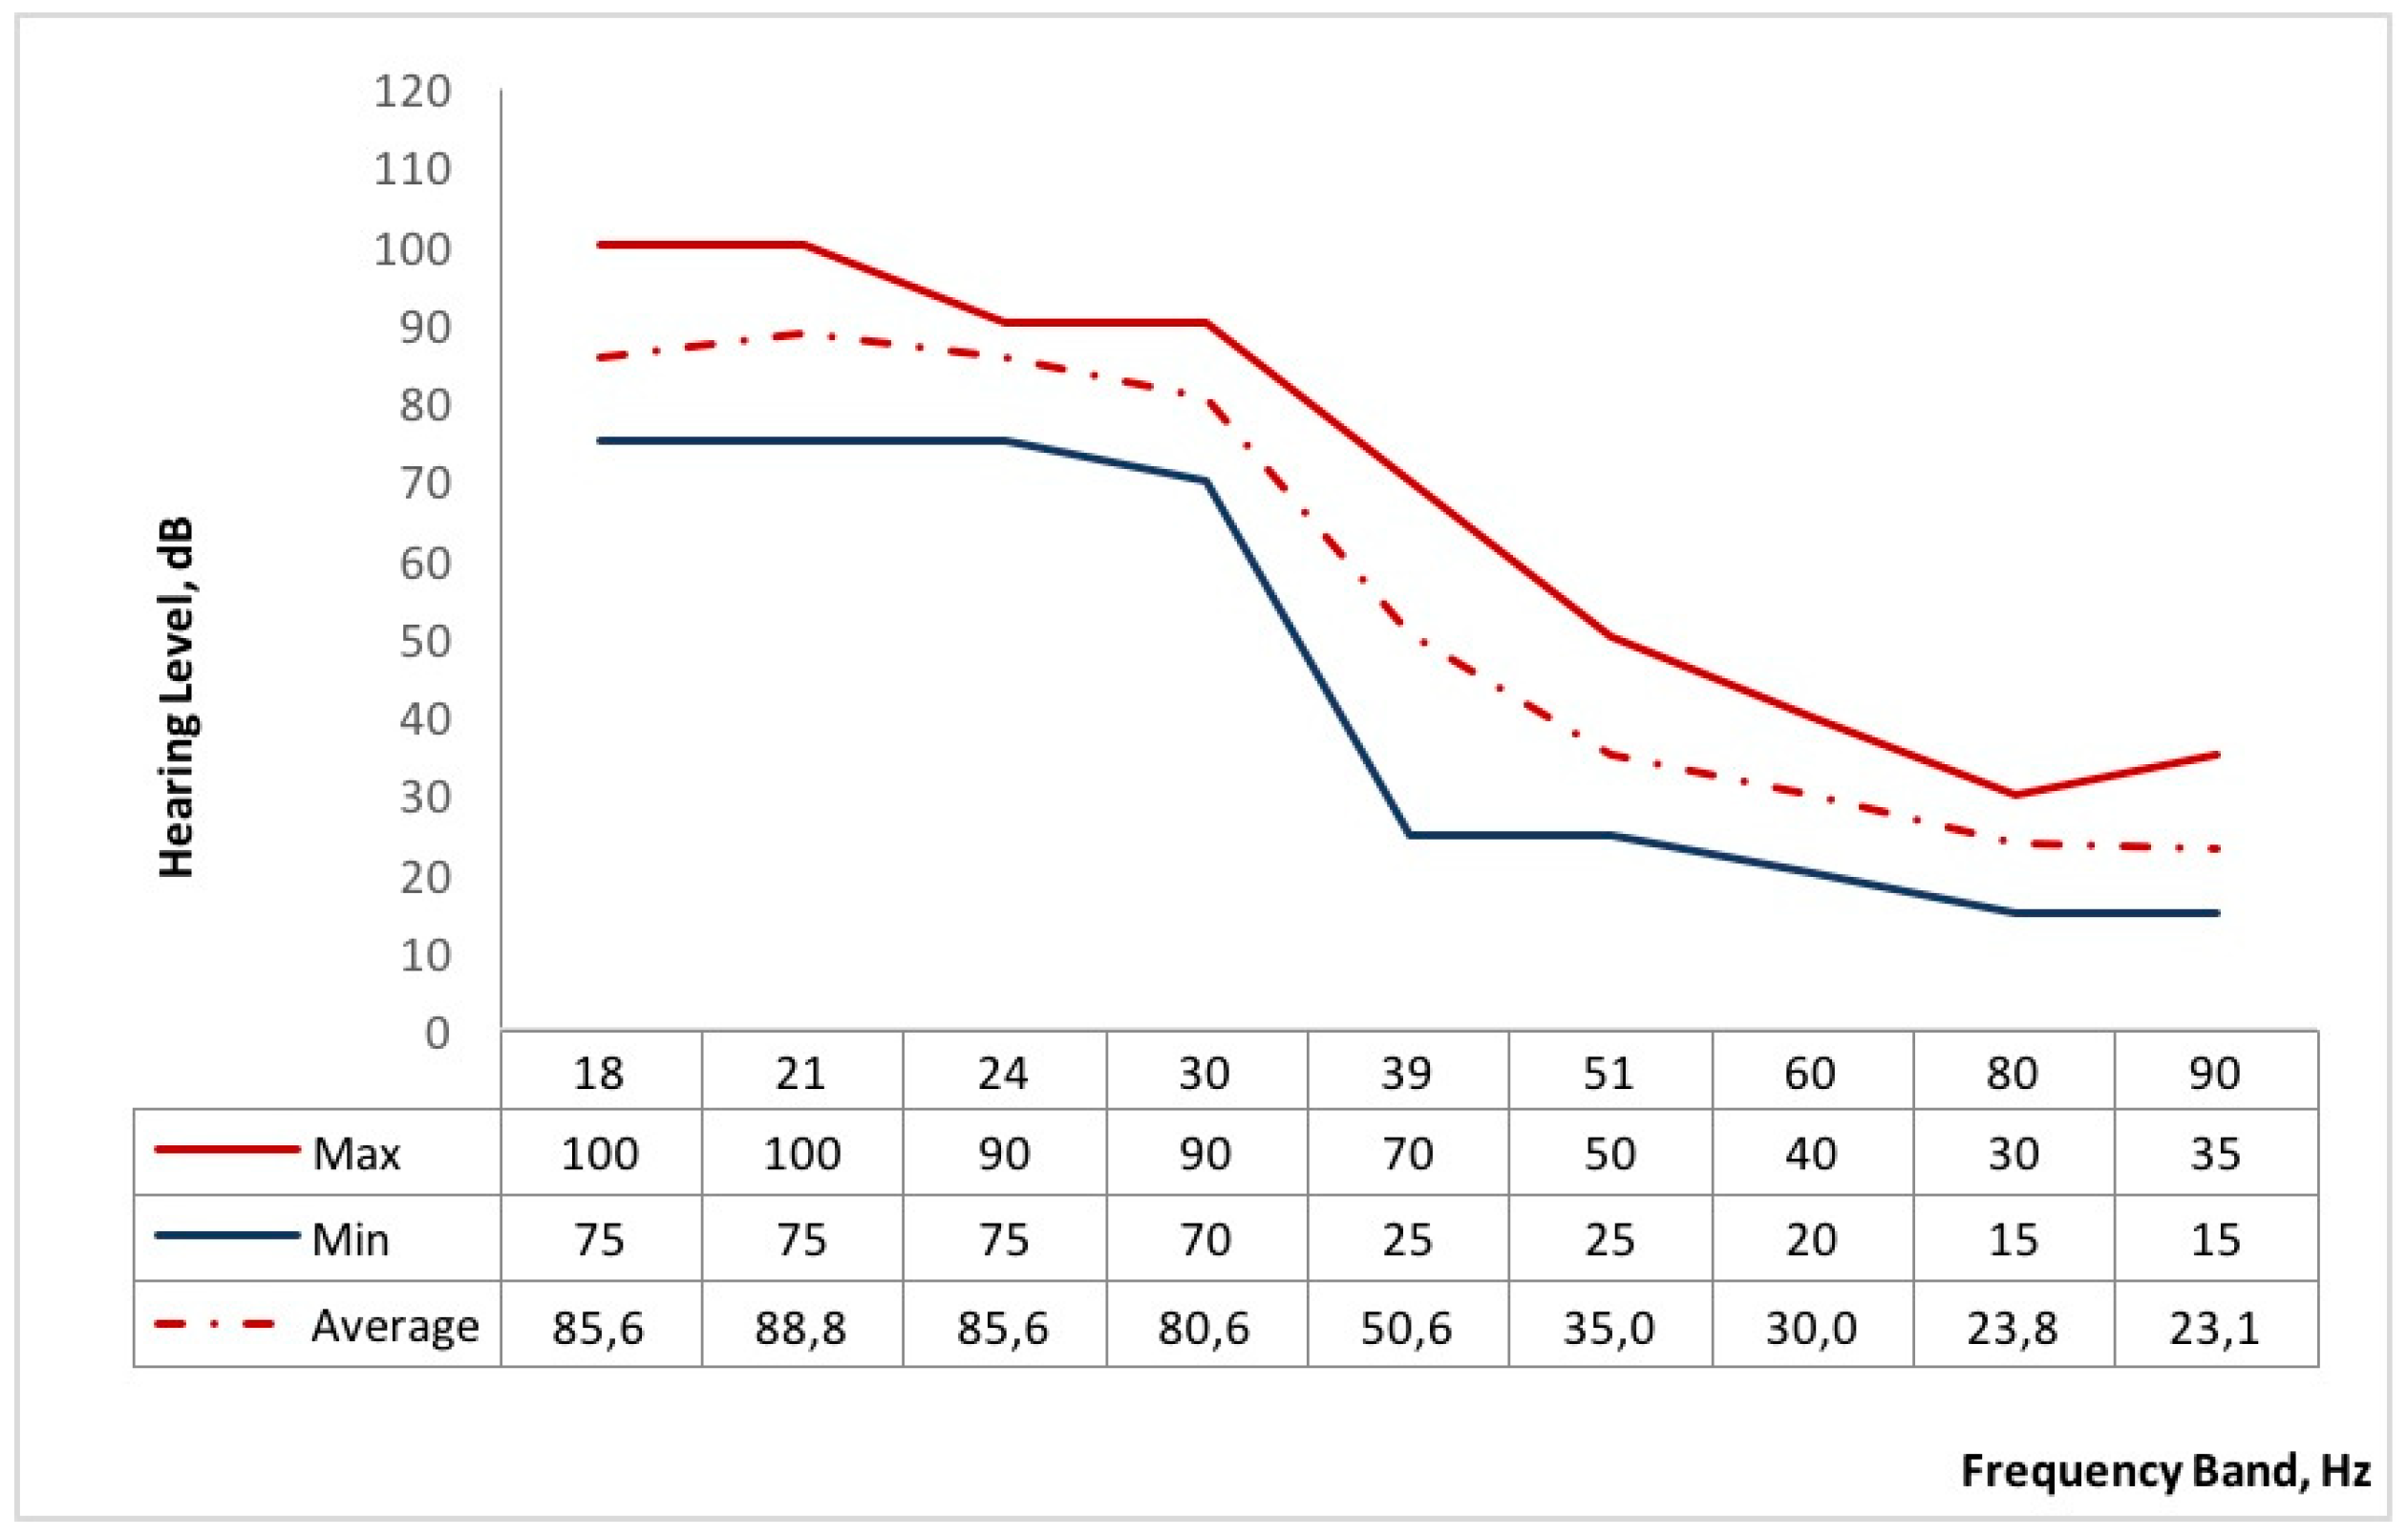
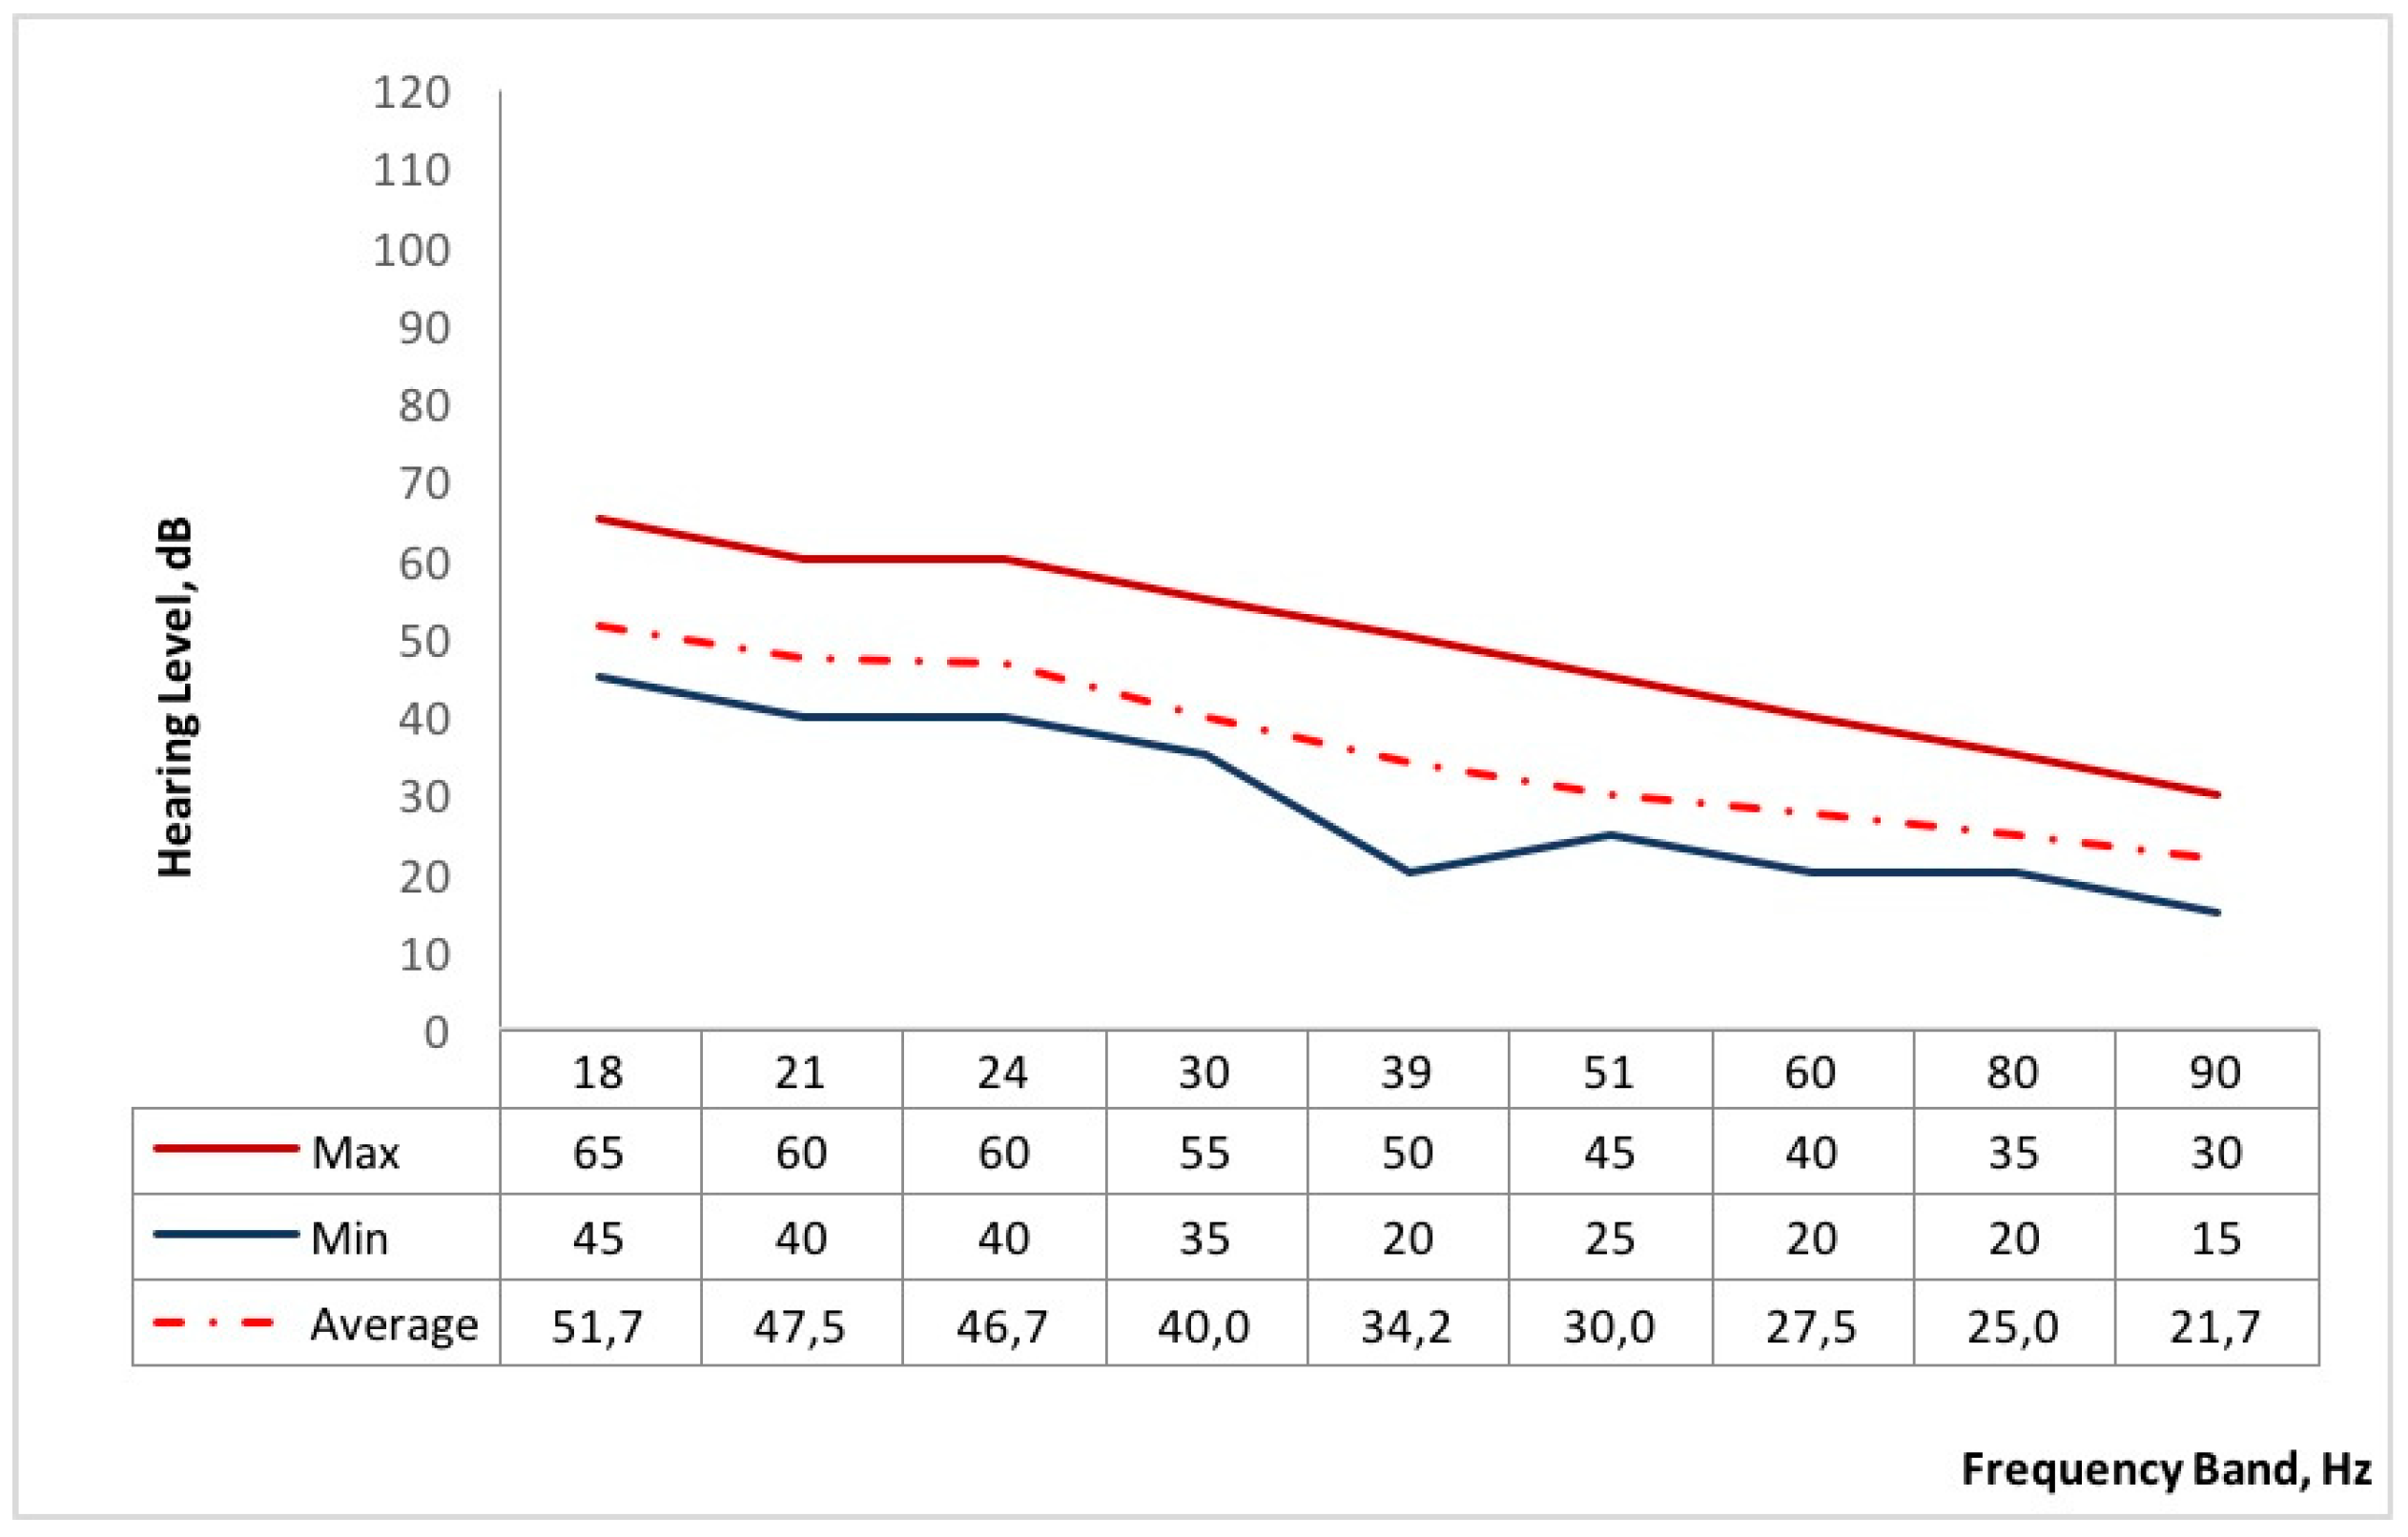
Regarding the second question, “Do power poles and power lines affect the population’s quality of life”?, the results of the audiometric tests showed a significant difference between the two groups, mainly the hearing threshold below 39 Hz, which shows that the “exposed” volunteers are not very sensitive to the low frequencies. This implies that the “exposed” group needs a greater sound intensity to perceive the noise, especially in the lower frequencies. As most interviewees have lived most of their lives in Serzedelo, this low sensitivity to low frequencies could be a consequence of the long period of exposure to the noise emitted by power poles and power lines. In turn, the “unexposed” group tends to perceive the noise at a slightly lower sound intensity due to the fact that this village is free from these infrastructures. Additionally, the “exposed” group has a greater number of respondents with health problems (e.g., cardiovascular diseases, insomnia and depression), which may be caused from the characteristics of the place where they live and, probably mainly, from exposure to low-frequency noise emitted by power poles and power lines.
Case-control type studies seem to be the most appropriate for the continuation of this type of research. It is essential to monitor the daily life of the interviewees and their lifestyles (for example, diet and sleep quality), aspects related to work dynamics such as current occupation and previous occupation, genetic predispositions, that is, the history of cases of illness in the immediate family circle, and the characteristics of the structure of the house. However, it is worth mentioning the complexity of conducting a case-control study, due to the difficulty of accessing information on patient morbidity and access to the patient database that is subject to confidentiality. In addition, a study of this nature would take several years.
It is expected that in future studies this type of evaluation can be explored by varying the distance between the receiver and the source. This may provide important information on the definition of the limits for installing power poles and power lines in residential areas, based not only on the objective component (measurement of sound levels and setting the minimum limit of evaluation below the usual 50 Hz), but also considering the subjective component, that is, the perception of discomfort reported by the exposed population.
Finally, we propose that investigations of this type should consider the subjective parameters for the evaluation of noise discomfort, that is, the perception of the population.

Supplementary Materials

Supplementary File 1

Author Contributions

The authors contributed equally to this work.

Funding

The authors gratefully acknowledge CAPES/Brazil (Process: BEX1684-13/2) for the financial support granted though a doctorate scholarship, the Project Lab2PT—Landscapes, Heritage and Territory Laboratory—AUR/04509 and FCT through national funds and when applicable of the FEDER co-financing, under the new partnership agreement PT2020 and COMPETE2020—POCI 01 0145 FEDER 007528, the FCT/C-TAC for the financial support granted, in particular from acquiring equipment essential for the research development.

Acknowledgments

The authors would like to acknowledge Pedro Arezes (Ergonomics Laboratory/University of Minho) for the dedicated orientation and technical support in the adapted audiometric tests, Filipa Manuela Neto Paiva (student at the Civil Engineering Department/University of Minho) and Sandra Rodrigues (student at the Department of Geography/University of Minho), as well as the Serzedelo Village Council and Abação and Gémeos Village Council for helping us to recruit volunteers.

Conflicts of Interest

The authors declare no conflicts of interest.

References

  1. Alves, J.A.; Silva, L.T.; Remoaldo, P.C. Impacts of low frequency noise exposure on well-being: A case-study from portugal. Noise Health 2018, 20, 131–145. [Google Scholar] [CrossRef] [PubMed]
  2. Alves, J.A. Os Impactes da Poluição Sonora na Saúde e na Sustentabilidade dos Lugares: Estudo de caso no Município de Guimarães. Ph.D. Thesis, University of Minho, Braga, Portugal, 2017. [Google Scholar]
  3. Berglund, B.; Hassmén, P.; Job, R.F. Sources and effects of low-frequency noise. J. Acoust. Soc. Am. 1996, 99, 2985–3002. [Google Scholar] [CrossRef] [PubMed]
  4. Pawlaczyk-Łuszczyńska, M.; Dudarewicz, A.; Szymczak, W.; Sliwinska-Kowalska, M. Evaluation of annoyance from low frequency noise under laboratory conditions. Noise Health 2010, 12, 166–181. [Google Scholar]
  5. Obata, J.; Morita, S.; Hirose, K.-I.; Matsumoto, H. The effects of noise upon human efficiency. J. Acoust. Soc. Am. 1934, 5, 255–261. [Google Scholar] [CrossRef]
  6. Schultz, T.J. Synthesis of social surveys on noise annoyance. J. Acoust. Soc. Am. 1978, 64, 377–405. [Google Scholar] [CrossRef] [Green Version]
  7. Hall, J.W.; Haggard, M.P.; Fernandes, M.A. Detection in noise by spectro-temporal pattern analysis. J. Acoust. Soc. Am. 1984, 76, 50–56. [Google Scholar] [CrossRef]
  8. Fidell, S.; Green, D.M. Noise induced annoyance of individuals and communities. Handb. Acoust. Meas. Noise Control 1991. [Google Scholar]
  9. Bradley, J.S. Annoyance caused by constant amplitude and amplitude modulated sounds containing rumble. Noise Control Eng. 1994, 42, 203–208. [Google Scholar] [CrossRef]
  10. Paulsen, R.; Kastka, J. Effects of combined noise and vibration on annoyance. J. Sound Vib. 1995, 181, 295–314. [Google Scholar] [CrossRef]
  11. Oliveira, M.F.; Silva, L.T. The influence of urban form on facades noise levels. WSEAS Trans. Environ. Dev. 2011, 7, 125–135. [Google Scholar]
  12. Karpova, N.I.; Alekseev, S.V.; Erokhin, V.N.; Kadyskina, E.N.; Reutov, O.V. Early response of the organism to low-frequency acoustical oscillations. Noise Vib. Bull. 1970, 11, 100–103. [Google Scholar]
  13. Brown, J.E.; Thompson, R.N.; Folk, E.D. Certain non- auditory physiological responses to noise. Am. Ind. Hyg. Assoc. J. 1975, 36, 285–291. [Google Scholar] [CrossRef] [PubMed]
  14. Job, R. The role of psychological factors in community reaction to noise. In Noise as a Public Health Problem; Vallet, M., Ed.; INRETS: Arcueil, France, 1993; Volume 3, pp. 47–79. [Google Scholar]
  15. PawlaczykŁuszczyńska, M.; Dudarewicz, A.; Waszkowska, M.; Szymczak, W.; Kameduła, M.; Śliwińska-Kowalska, M. Does low frequency noise at moderate levels influence human mental performance? J. Low Freq. Noise Vib. Act. Control 2005, 24, 25–42. [Google Scholar] [CrossRef]
  16. Silva, L.T.; Mendes, J.F.G. City Noise-Air: An environmental quality index for cities. Sustain. Cities Soc. 2012, 4, 1–11. [Google Scholar] [CrossRef]
  17. Silva, L.; Oliveira, I.; Silva, J. The impact of urban noise on primary schools. Perceptive evaluation and objective assessment. Appl. Acoust. 2016, 106, 2–9. [Google Scholar] [CrossRef]
  18. Miedema, H.M.; Vos, H. Exposure-response relationships for transportation noise. J. Acoust. Soc. Am. 1998, 104, 3432–3445. [Google Scholar] [CrossRef]
  19. Babisch, W. Traffic noise and cardiovascular disease: Epidemiological review and synthesis. Noise Health 2000, 2, 9–32. [Google Scholar]
  20. Passchier-Vermeer, W.; Passchier, W.F. Noise exposure and public health. Environ. Health Perspect. 2000, 108, 123–131. [Google Scholar]
  21. Kyriakides, K.; Leventhall, H.G. Some effects of infrasound on task performance. J. Sound Vib. 1977, 50, 369–388. [Google Scholar] [CrossRef]
  22. Ising, H.; Kruppa, B. Health effects caused by noise: Evidence in the literature from the past 25 years. Noise Health 2004, 6, 5–13. [Google Scholar]
  23. Sygna, K.; Aasvang, G.M.; Aamodt, G.; Oftedal, B.; Krog, N.H. Road traffic noise, sleep and mental health. Environ. Res. 2014, 131, 17–24. [Google Scholar] [CrossRef]
  24. Bluhm, G.; Berglind, N.; Nordling, E.; Rosenlund, M. Road traffic noise and hypertension. Occup. Environ. Med. 2007, 64, 122–126. [Google Scholar] [CrossRef] [Green Version]
  25. Waye, K.P. On the Effects of Environmental Low Frequency Noise. Ph.D. Thesis, Gothenburg University, Gothenburg, Sweden, 1995. [Google Scholar]
  26. Pawlaczyk-Luszczyńska, M.; Szymczak, W.; Dudarewicz, A.; Sliwiñska-Kowalska, M. Proposed criteria for assessing low frequency noise annoyance in occupational settings. Int. J. Occup. Med. Environ. Health 2006, 19, 185–197. [Google Scholar] [CrossRef]
  27. Leventhall, G. Low frequency noise and annoyance. Noise Health 2004, 6, 59–72. [Google Scholar]
  28. Eurostat. The Statistical Office of the European Union. Noise from Neighbours or from the Street—EU-SILC Survey; Eurostat: Brussels, Belgium, 2018.
  29. Azevedo, B.F.O. O impacto do Lugar na Saúde da População do Concelho de Guimarães—Estudo de Caso do Electromagnetismo em Serzedelo. Master’s Thesis, Universidade do Minho, Braga, Portugal, 2010. [Google Scholar]
  30. Moorhouse, A.; Waddington, D.; Adams, M. Proposed Criteria for the Assessment of Low Frequency Noise Disturbance (NANR45); Report for Defra; University of Salford: Manchester, UK, 2011. [Google Scholar]
  31. Alves, J.A.; Silva, L.T.; Remoaldo, P.C. The influence of Low-frequency noise pollution on the quality of life and place in sustainable cities: A case study from Northern Portugal. Sustainability 2015, 7, 13920–13946. [Google Scholar] [CrossRef] [Green Version]
  32. Instituto Nacional de Estatística. Censos—Resultados definitivos. Portugal—2011. In XV Recenseamento Geral da População. V Recenseamento Geral da Habitação; Instituto Nacional de Estatística: Lisboa, Portugal, 2012. [Google Scholar]
  33. ISO8253-1. Audiometric Test Methods. In Part 1: Pure-Tone Air and Bone Conduction Threshold Audiometry; ISO: Geneva, Switzerland, 2010.
  34. DOC 1081. In Dbtrait Software User Manual; DOC1081 December; ACOEM: Limonest, France, 2013.
  35. Macintyre, S.; Mckay, L.; Ellaway, A. Are rich people or poor people more likely to be ill? Lay perceptions, by social class and neighborhood, of inequalities in health. Soc. Sci. Med. 2005, 60, 313–317. [Google Scholar] [CrossRef]
  36. Zagozdzon, P.; Kolarzyk, E.; Marcinkowski, J. Quality of life and rural place of residence in Polish women—population based study. Ann. Agric. Environ. Med. 2011, 18, 429–432. [Google Scholar]
  37. O′Campo, P.; Wheaton, B.; Nisenbaum, R.; Glazier, R.; Dunn, J.; Chambers, C. The Neighbourhood effects on health and well-being (NEHW) study. Health Place 2015, 31, 65–74. [Google Scholar] [CrossRef] [Green Version]
  38. Sword, W.; Eyles, J.; DeLuca, P.; Heaman, M.; Kingston, D.; Buist, S.; Johnston, N.; Sprague, A. Place of residence and maternal health behaviours: Wendy Sword. Eur. J. Public Health 2015, 25 (Suppl. 3), ckv173.038. [Google Scholar] [CrossRef] [Green Version]
  39. Castelo-Branco, N.; Lopez, E. The vibroacoustic disease—An emerging pathology. Aviat. Space Environ. Med. 1999, 70, A1–A6. [Google Scholar]
  40. Wall, K.; Aboim, S.; Leitão, M. Observatório das Famílias e das Políticas de Família; Relatório 2010; Centro de Investigação e Estudos de Sociologia: Lisboa, Portugal, 2010. [Google Scholar]
  41. Aboim, S.; Vasconcelos, P.; Wall, K. Support, social networks and the family in Portugal—two decades of research. Int. Rev. Sociol. 2013, 23, 47–67. [Google Scholar] [CrossRef] [Green Version]
  42. Mateus, A. A Economia, a Sociedade e os Fundos Estruturais—25 Anos de Portugal Europeu; Fundação Francisco Manuel dos Santos: Lisboa, Portugal, 2013. [Google Scholar]
  43. Kim, Y.; Bolortuya, Y.; Chen, L.; Basheer, R.; McCarley, R.W.; Strecker, R.E. Decoupling of sleepiness from sleep time and intensity during chronic sleep restriction—evidence for a role of the Adenosine System. Sleep 2012, 35, 861–869. [Google Scholar] [CrossRef] [Green Version]
  44. Rod, N.H.; Vahtera, J.; Westerlund, H.; Kivimaki, M.; Zins, M.; Goldberg, M.; Lange, T. Original contribution sleep disturbances and cause-specific mortality—results from the GAZEL cohort study. Am. J. Epidemiol. 2011, 173, 300–309. [Google Scholar] [CrossRef]
  45. Lohsoonthorn, V.; Khidir, H.; Casillas, G.; Lertmaharit, S.; Tadesse, M.; Pensuksan, W.C.; Rattananupong, T.; Gelaye, B.; Williams, M. Sleep quality and sleep patterns in relation to consumption of energy drinks, caffeinated beverages, and other stimulants among Thai college students. Sleep Breath 2013, 17, 1017–1028. [Google Scholar] [CrossRef]
  46. Verhoef, S.; Camps, S.; Gonnissen, H.; Westerterp, K.; Westerterp-Plantenga, M. Concomitant changes in sleep duration and body weight and body composition during weight loss and 3-mo weight maintenance. Am. J. Clin. Nutr. 2013, 98, 25–31. [Google Scholar] [CrossRef] [Green Version]
  47. Whinnery, J. Short and long sleep duration associated with race/ethnicity, sociodemographics, and socioeconomic position. Sleep 2013, 37, 601–611. [Google Scholar] [CrossRef]
  48. Sanchez, S.; Martinez, C.; Oriol, R.A.; Yanez, D.; Castaneda, B.; Sanchez, E.; Gelaye, B.; Williams, M.A. Sleep quality, sleep patterns and consumption of energy drinks and other caffeinated beverages among Peruvian College Students. Health 2014, 5, 26–35. [Google Scholar] [CrossRef]
  49. Berglund, B.; Berglund, U.; Lindvall, T. (Eds.) Adverse Effects of Community Noise—Research Needs; Nordic Council of Ministers: Oslo, Norway, 1984. [Google Scholar]
  50. Waye, K.P.; Bengtsson, J.; Kjellberg, A.; Benton, S. Low frequency noise “pollution” interferes with performance. Noise Health 2011, 4, 33–49. [Google Scholar]
  51. Mirowska, M. An investigation and assessment of annoyance of low frequency noise in dwellings. J. Low Freq. Noise Vib. Active Control 1998, 17, 119–126. [Google Scholar] [CrossRef]
  52. Mirowska, M. Evaluation of Lowfrequency noise in dwellings. New Polish Recommendations. J. Low Freq. Noise Vib. Active Control 2001, 20, 67–74. [Google Scholar] [CrossRef]
  53. Chen, H.; Kwong, J.; Copes, R.; Tu, K.; Villeneuve, P.; Donkelaar, A.; Hystad, P.; Martin, R.; Murray, B.; Jessiman, B.; et al. Living near major roads and the incidence of dementia, Parkinson´s disease, and multiple sclerosis: A population-based cohort study. Lancet 2017. [Google Scholar] [CrossRef]
  54. Alves, J.A.; Silva, L.T.; Remoaldo, P.C. The Impacts of Exposure to Low Frequencies in the Human Auditory System? A Methodological Proposal. In Engineering Vibration, Communication and Information Processing. Lecture Notes in Electrical Engineering; Ray, K., Sharan, S., Rawat, S., Jain, S., Srivastava, S., Bandyopadhyay, A., Eds.; Springer: Singapore, 2019; Volume 478, pp. 75–85. [Google Scholar]
Figure 1. Location of measurement points in the village of the “exposed” group.
Applsci 09 05566 g001
Figure 2. Location of measurement points in the village of the “unexposed” group.
Applsci 09 05566 g002
Figure 3. Analysis of the “exposed” group sound levels—Leq (dB).
Applsci 09 05566 g003
Figure 4. Analysis of the “unexposed” group sound levels—Leq (dB).
Applsci 09 05566 g004
Figure 5. Location of the cases, by group of diseases, in the “exposed” group (distance in relation to the highway).
Applsci 09 05566 g005
Figure 6. Location of cases, by disease group, in the “unexposed” group (distance from highway).
Applsci 09 05566 g006
Figure 7. Location of cases, by disease group, in Serzedelo (distance from power poles and power lines).
Applsci 09 05566 g007
Figure 8. Hearing threshold for pure sounds—“exposed” group.
Applsci 09 05566 g008
Figure 9. Hearing threshold for pure sounds—“unexposed” group.
Applsci 09 05566 g009
Table 1. Interviewees that have always lived in villages of the Serzedelo and Abação (São Tomé).
Analyzed AreasYes (%)No (%)
Serzedelo58.042.0
Abação (São Tomé)54.046.0
Total100.0100.0
Table 2. Percentage of time the interviewees have lived in the same household in Serzedelo and Abação (São Tomé).
Analyzed AreasLess than 1 YearFrom 1 to 2 YearsFrom 3 to 10 YearsFrom 11 to 20 YearsFrom 30 to 40 YearsMore than 40 YearsSince He/She Was BornDid Not AnswerTotal
Serzedelo2.03.08.014.016.010.041.06.0100.0
Abação (São Tomé)1.01.09.019.015.04.050.01.0100.0
Table 3. Percentage of people in the household in Serzedelo and Abação (São Tomé).
Analyzed AreasOnly the Interviewed Person2 PeopleFrom 3 to 4 PeopleFrom 5 to 6 People7 and more PeopleDid not AnswerTotal
Serzedelo9.037.040.08.02.04.0100.0
Abação (São Tomé)8.018.054.017.03.00.0100.0
Table 4. Perception of interviewees’ sleep quality in Serzedelo and Abação (São Tomé).
Analyzed AreasVery GoodGoodAcceptablePoorVery PoorTotal
Serzedelo16.039.030.08.07.0100.0
Abação (São Tomé)9.035.036.013.07.0100.0
Table 5. Percentage of interviewees using sleep medication in Serzedelo and Abação (São Tomé).
Analyzed AreasYesNoRarelyTotal
Serzedelo24.076.00.0100.0
Abação (São Tomé)24.074.02.0100.0
Table 6. Percentage of interviewees considering the distance from the source (power poles and power lines) who had a habit of getting up at night in Serzedelo.
Distance from Source (m)YesNoTotal
50–9917926
100–14918422
150–19917421
200–24910212
250–299112
300–349011
350–399404
≥4007512
Total7426100
Table 7. Percentage of interviewees considering the distance from the source (highway A7) who had a habit of getting up at night in Abação (São Tomé).
Distance from Source (m)YesNoTotal
50–997310
100–14910414
150–1998311
200–249527
≥250451358
Total7525100
Table 8. Interviews that used sleeping medication by large groups of professions in Serzedelo and Abação (São Tomé).
The Portuguese Classification of Occupations (CPP/2010)SerzedeloAbação (São Tomé)
Yes (%)No (%)Yes (%)No (%)Rarely (%)
Current Occupation1—Managers0.00.00.01.00.0
2—Professionals0.04.01.00.01.0
3—Technicians and associated professionals1.02.00.01.00.0
4—Clerical support workers0.03.00.02.00.0
5—Service and sales workers1.02.01.04.00.0
6—Skilled agricultural, forestry and fishery workers0.01.00.00.00.0
7—Craft and related trade workers2.07.04.025.00.0
8—Plant and machine operators and assemblers1.09.00.05.00.0
9—Elementary occupations1.06.05.03.00.0
Unemployed2.07.02.012.00.0
Retired15.028.08.017.01.0
Housewives0.01.03.01.00.0
Students0.01.00.03.00.0
Did not answer0.01.00.00.00.0
Total24.076.024.074.02.0
Table 9. Interviewees who have a health problem in Serzedelo and Abação (São Tomé).
Analyzed Areas Yes (%)No (%)Total (%)
Serzedelo64.036.0100.0
Abação (São Tomé)49.051.0100.0
Table 10. Interviewees who have health problems, by age group, in Serzedelo and Abação (São Tomé).
Age GroupSerzedeloAbação (São Tomé)
Yes (%)No (%)Yes (%)No (%)
18 to 28 years0.010.00.07.0
29 to 39 years3.06.03.09.0
40 to 49 years8.07.016.016.0
50 to 59 years20.05.012.07.0
60 to 69 years20.07.012.05.0
70 and more years11.01.06.04.0
Did not answer2.00.00.02.0
Total64.036.049.050.0
Table 11. Proportion between residence time and health problems in Serzedelo.
Residence TimeSerzedeloAbação (São Tomé)
YesNoYesNoDid not Answer
Less than 1 year0.02.00.01.00.0
From 1 to 2 years3.00.00.01.00.0
From 3 to 10 years3.05.03.06.00.0
From 11 to 20 years6.08.08.010.01.0
From 21 to 30 years0.00.00.00.00.0
From 31 to 40 years12.04.010.05.00.0
More than 40 years9.01.04.00.00.0
Since he/she was born28.013.023.027.00.0
Did not answer3.03.01.00.00.0
Total64.036.049.050.01.0
Table 12. Percentage of interviewees who have some type of disease in Serzedelo and Abação (São Tomé).
Analyzed AreasCancerDepressionCardiovascular DiseasesDiseases of the Nervous SystemSleep DisordersMetabolic DiseasesTotal
Serzedelo5.019.032.05.011.019.0100.0
Abação (São Tomé)4.018.019.01.01.015.0100.0
Table 13. Percentage of interviewees who have a health problem regarding distance from the source (power poles and power lines) in Serzedelo.
Distance from Source (m)YesNoTotal
50–9918826
100–14913922
150–19914721
200–2497512
250–299202
300–349011
350–399404
≥4006612
Total6436100
Table 14. Percentage of interviewees who have a health problem regarding distance from the source (highway) in Serzedelo and in Abação (S. Tomé).
Distance from Source (m)SerzedeloAbação (S. Tomé)
YesNoTotalYesNoDid not AnswerTotal
50–9900073010
100–14931486014
150–19930356011
200–2495383407
≥2505332852631158
Total643610049501100
Table 15. Interviewees living near a highway and/or national road in Serzedelo and Abação (São Tomé).
Analyzed AreasYes (%)No (%)Did not Answer (%)Total (%)
Serzedelo73.024.03.0100.0
Abação (São Tomé)64.034.02.0100.0
Table 16. Percentage of interviewees who claimed there was another noise, besides the road traffic, which caused discomfort, and how they characterized this noise in Serzedelo.
Type of NoiseYesNoDid Not Answer
Crackle/Sizzle8.01.01.0
Humming24.03.00.0
Sparks4.00.00.0
Did not answer7.02.014.0
Not applicable0.036.00.0
Total43.042.015.0

