Article

TrafficWave: Generative Deep Learning Architecture for Vehicular Traffic Flow Prediction

Computer Science Department, Università degli studi di Bari Aldo Moro, 70125 Bari, Italy
*
Author to whom correspondence should be addressed.
Appl. Sci. 2019, 9(24), 5504; https://doi.org/10.3390/app9245504
Submission received: 17 October 2019 / Revised: 22 November 2019 / Accepted: 12 December 2019 / Published: 14 December 2019

Abstract

:
Vehicular traffic flow prediction for a specific day of the week in a specific time span is valuable information. Local police can use this information to preventively control the traffic in more critical areas and improve the viability by decreasing, also, the number of accidents. In this paper, a novel generative deep learning architecture for time series analysis, inspired by the Google DeepMind’ Wavenet network, called TrafficWave, is proposed and applied to traffic prediction problem. The technique is compared with the most performing state-of-the-art approaches: stacked auto encoders, long–short term memory and gated recurrent unit. Results show that the proposed system performs a valuable MAPE error rate reduction when compared with other state of art techniques.

1. Introduction

Traffic can be defined as the movement of vehicles on a road transport network regulated by specific rules for its correct and safe organization [1]. More in general, the term indicates the number of vehicles in circulation in a specific area. Roads congestion can occur in situations of intense traffic: it is characterized by low speed and long travel times. This happens when the vehicular flow is greater than the capacity of the road. This is a well-known phenomenon very familiar to those living in medium/large cities: it results in loss of time, stress, incremented CO2 emissions and nevertheless acoustic and atmospheric pollution [2].
In recent years, local administrations, also to comply with legal obligations, are increasingly paying attention to the traffic prediction problem. Among the most effective interventions, there are the strengthening of public transport, the adoption of predictive planning tools to limit the number of accidents, increase viability and decrease the previously mentioned forms of pollution as well as to provide intelligent public roads lighting solutions.
Under this light, it is essential to understand when road congestion or other traffic flow conditions are going to occur. In order to have good predictions, traffic data should be accurately and continuously collected over long periods and at all hours (both day and night). The most common methods of automatic detection are pneumatic tubes, aerial photography, infrared sensors, magneto dynamic sensors, triboelectric cables, video images, VIM sensors, microwave sensors, and many others [3,4]. These conditions are leading technological research to produce increasingly refined instruments and automatic detection systems.
This work proposes the use of a tuned version of the Google Deepmind Wavenet [5] architecture for traffic flow prediction problem and compare its performance to other state-of-the-art techniques thus providing a review of the most profitable approaches highlighting pro and cons.
The paper is organized as follows. Section 2 contains a literature review focusing on a specific set of state-of-the-art techniques stacked auto encoders, long–short term memory and gated recurrent unit architectures. Section 3 describes the TrafficWave architecture proposed in this work. Section 4 presents datasets and the experimental setup. Section 5 shows and discusses the result. Section 6 concludes the article.

2. Methods

2.1. Mathematical Properties of Traffic Flow

Traffic flow deals with interactions between travelers (including pedestrians, cyclists, drivers and their vehicles) and infrastructures (including motorways, signage and traffic control devices), in order to understand and develop a transport network with efficient circulation and minimum traffic congestion problems [6,7]. It is important to underline that spatial and temporal constraints must be considered to properly model the flow [8,9].
Let X i t denote the observed traffic flow for the t-th time interval at the i-th sensing location and given a sequence { X i t } of observed traffic flow data points with i = 1, ..., m, and t = 1, ..., T, the traffic flow problem aims to forecast the flow for the next (t + Δ) time interval under a prediction window Δ [10]. The traffic flow can also be defined, such as:
T = { X i t }     i , t       i , t 0 .
If we consider highways, the traffic flow is generally limited along a one-dimensional path (for example a travel lane).
Three main variables for displaying a traffic flow: speed (v), density (k), and flow (q). In general-purpose systems, the speed of each vehicle cannot be tracked; therefore, the average speed is measured by sampling the vehicles in a given area for a time period. However, in many other cases, due to the adoption of speeding violations tools, average speed on a segment of the highway and instantaneous speed, can also be monitored (e.g., Safety tutor system on Italian highways).
The density (k) is defined as the number of vehicles per length unit. Spacing (s) is the distance from center to center between two vehicles. The relation between density and spacing is the following:
k = 1 s .
Even in this case, density can be estimated in general terms or an extended evaluation of it can be available depending on the specific devices available on the highway. The flow (q) is the number of vehicles that exceed a reference point per unit of time, its unit of measure is vehicles per hour:
q = k v .
The inverse of the flow is progress (h), which is the time between the first vehicle passing a reference point in space and its successive vehicle:
q = 1 h .
In this work, the main metric is Flow (q). This value is aggregated with respect to the datasets adopted for experiments by using timestamps of when each car was detected which implies also its speed (v) and the overall density (k) over a predefined time window.

2.2. State of the Art on Deep Learning for Vehicular Traffic Flow Prediction

There are three main categories of traffic flow prediction solutions: parametric, non-parametric and hybrid [10,11]. However, the traffic flow prediction problem is non-deterministic and non-linear because it can exhibit variations due to weather, accidents, driving characteristics, etc. Due to these reasons, this work focuses on non-parametric solutions with special attention to very recent deep learning techniques, which have been demonstrated to achieve state-of-the-art accuracies [11,12,13].
Authors of [12] have been among the first to address the challenge of road traffic prediction by using big data, deep learning, in-memory computing and high-performance computing through GPU. More specifically, the California Department of Transportation (Caltrans) dataset was adopted. Eleven years of traffic at 5-min level were analyzed (thus the motivation on big data), in-memory computing usage for real-time evaluations and convolutional neural networks (CNNs). The work reached a minimum MAPE (mean absolute percentage error) of 3.5 against other works on the same dataset who had a MAPE of 6.75 [10] and 9 [13]. Respectively authors in [10] used stacked autoencoders to learn generic traffic flow features over the Caltrans dataset. The solution was tested against 15, 30, 45 and 60 min of data aggregation, the best result was achieved at 45 min aggregation. In [14] authors used stacked layers of CNNs and recurrent neural networks layers merged by an attention model able to score how strong the input of the spatial (CNN)-temporal (recurrent neural network (RNN)) position correlates to the future traffic flow. When dealing with neural network models for traffic flow prediction, an interesting issue deals with the selection of the most profitable one. In [15], long short–term memory (LSTM) RNN, gated recurrent unit (GRU) RNN and ARIMA were compared: GRU outperformed the others. In [16] authors developed an architecture able to combine a linear model fitted using L1 regularization and a sequence of tanh layers. The first layer identifies spatio–temporal relations among predictors, the other layers model non-linear relations, the accuracy obtained was acceptable and the authors showed an in-depth analysis on the fact that the architecture was learning spatio–temporal features. In [17], the authors proposed a deep architecture consisting of a deep belief network in the bottom and a regression layer on top. The Deep Belief Network was used for unsupervised traffic flow feature learning. The authors reported a 3% improvement over state of the art. In [18] authors used an Italian dataset belonging to the city of Turin for traffic flow prediction adopting a deep feed-forward neural network to model the non-linear regression problem of the traffic flow. Their solution was better than other shallow learning (all non-deep learning models) tested solutions. The authors also tested several time window lags and data aggregation. In [19], the authors used the Auto Encoder to model the internal relationship of the traffic flow by extracting the characteristics of upstream and downstream traffic flow data. Additionally, the LSTM network utilizes the characteristic acquired by the autoencoder and the historical data to predict linear traffic flow. The error rate obtained was slightly lower than the reviewed works. In [20], authors created an improved spatio–temporal residual network to predict the traffic flow of buses by using fully connected neural networks to capture the bus flow patterns and improved residual networks to capture the bus traffic flow spatio–temporal patterns. Their accuracies were the best among the compared. In [21], the authors proposed a novel approach for identifying traffic-states of different spots of road sections and determine their spatiotemporal dependencies for missing value imputations. The principal component analysis (PCA) was employed to identify the section-based traffic state. The pre-processing was combined with a support vector machine for developing the imputation model. It was found that the proposed approach outperformed other existing models. In [22], the authors proposed e a deep autoencoder-based neural network model with symmetrical layers for the encoder and the decoder which was able to learn temporal correlations of a transportation network and predicting traffic flow. Their architecture outperformed all their reviewed works.
As it is possible to note from the reviewed works, state of art solutions make use of Stacked Denoising Autoencoders, LSTM RNN, and GRU NN. In addition, almost all works compare their accuracies with the ARIMA model. Unfortunately, different works perform experiments on different dataset and under different testing conditions, so that it is hard to clearly state which approach performs better than another. The aims of this work are:
(1)
to briefly review the most used and performing ones (i.e., stacked auto encoders (SAEs), LSTM, GRU),
(2)
to introduce a new one named TrafficWave able to outperform the previous,
(3)
to perform comparisons under a common testing framework.

2.3. Deep Learning Techniques

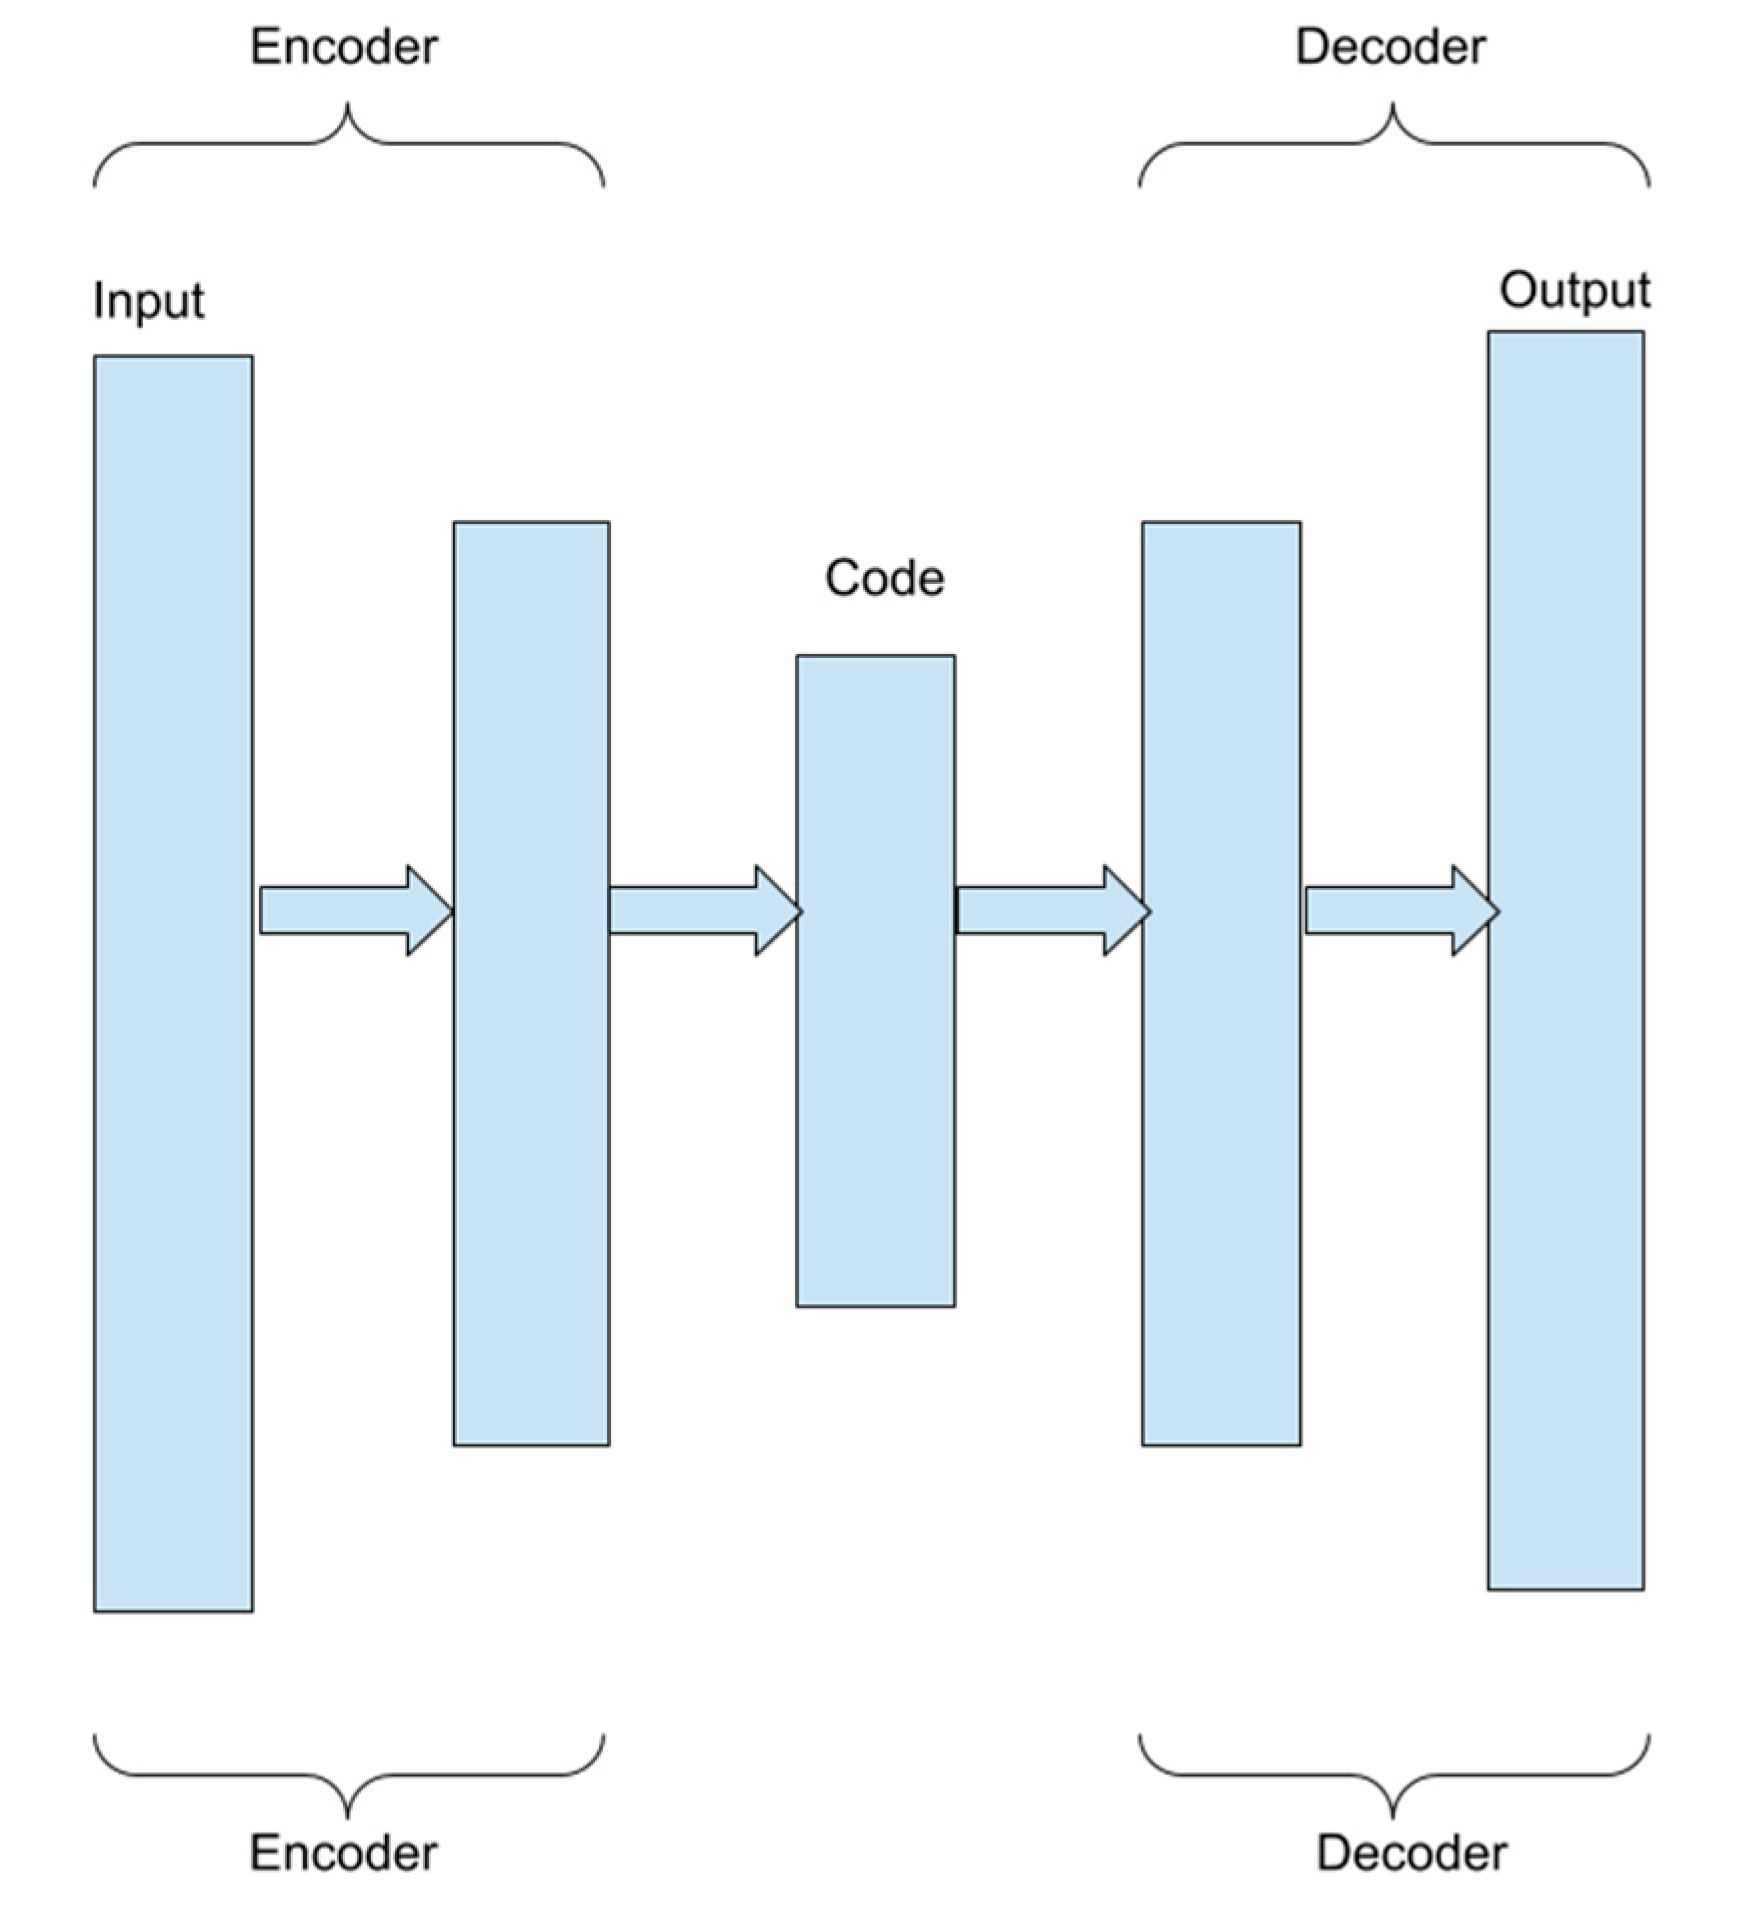
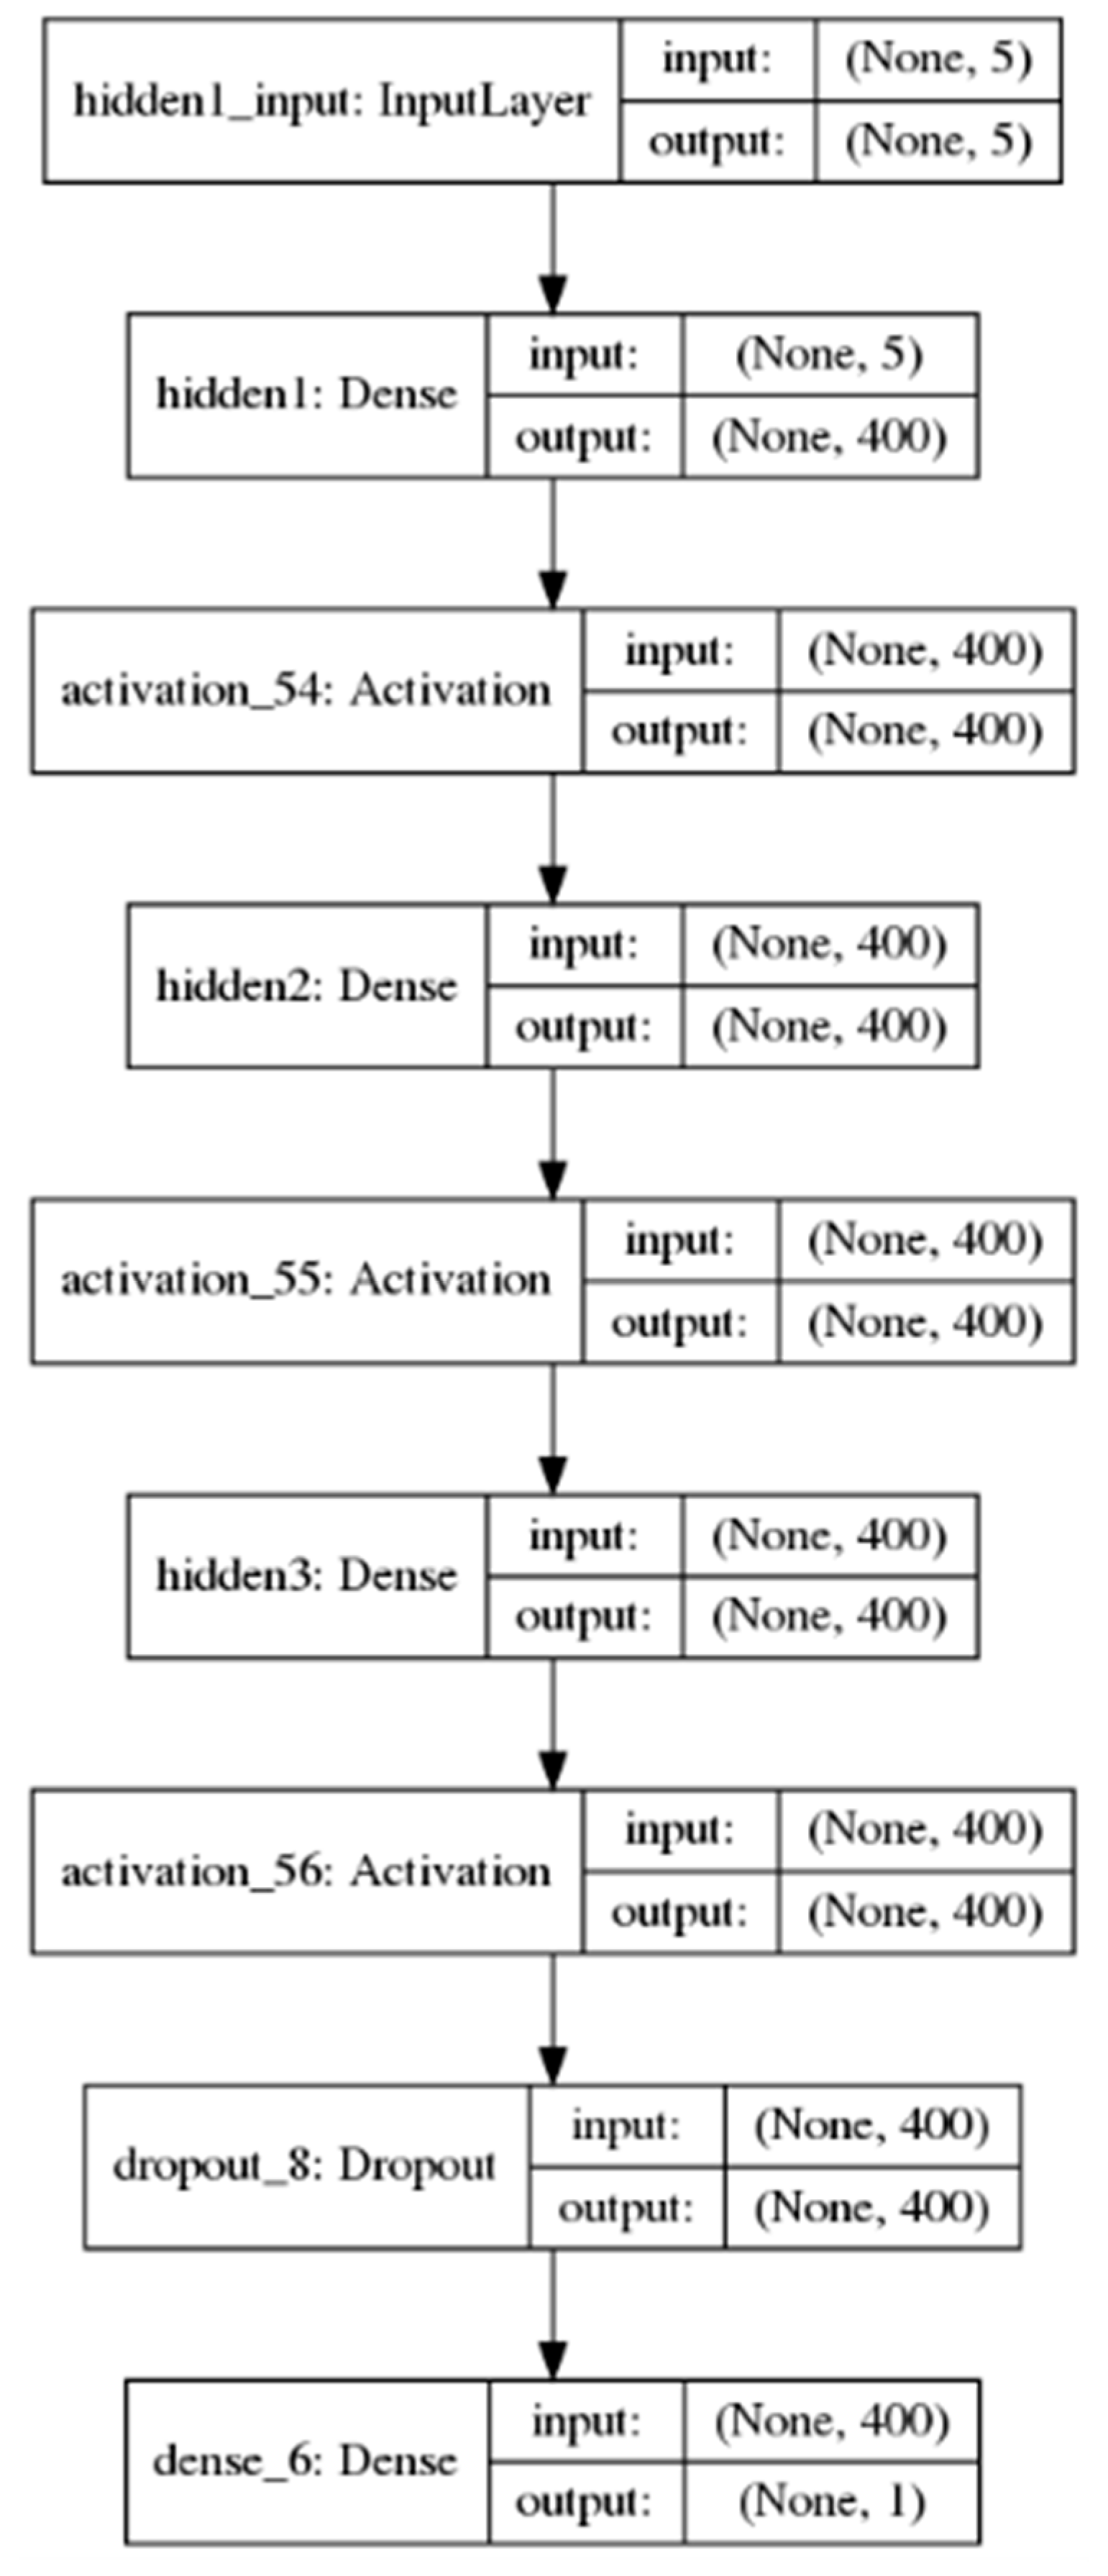
2.3.1. SAEs (Stacked Auto Encoders)

An SAE model is a stack of autoencoders used as building blocks to create a deep network [9]. An autoencoder is a Neural Network that attempts to reproduce its input. It has an input layer, a hidden layer, and an output layer. Given a set of training samples { X ( 1 ) , X ( 2 ) , X ( 3 ) . , X ( n ) } where X ( i ) ∈ R which can be considered to be the traffic flow at i-time, an autoencoder first encodes an input X ( i ) in a hidden representation y ( X ( 1 ) ) on the basis of (5):
y ( x ) = f ( W 1 x + b ) ,
then it decodes the representation y ( X ( 1 ) ) in a reconstruction named z ( X ( 1 ) ) calculated as in (6):
z ( x ) = g ( W 2 y ( x ) + c .
being:
  • W 1 a weight matrix,
  • b a coding polarization vector,
  • W 2 a decoding matrix,
  • c a decoding polarization vector,
  • f (x) and g (x) sigmoid functions.
An SAE model is created by stacking autoencoders to form a deep neural network taking the autoencoder output found on the underlying layer as current level input as shown in Figure 1. After obtaining the first hidden level, the output of the k-hidden layer is used as an entrance to the (k + 1)-th hidden level. In this way, more autoencoders can be stacked hierarchically.
In order to use the SAE network for traffic flow prediction, it is necessary to add a standard predictor on the top level. A logistic regression layer is generally considered [9].
Stacked denoising autoencoders for traffic flow prediction are adapted to learn network-wide relationships, these are necessary to estimate missing traffic flow data, and thus predict the future traffic value as a missing point with respect to the input data.
SAE networks have been used in [19,22,23]. Figure 2 reports the SAE architecture used in this work to perform tests and comparisons.

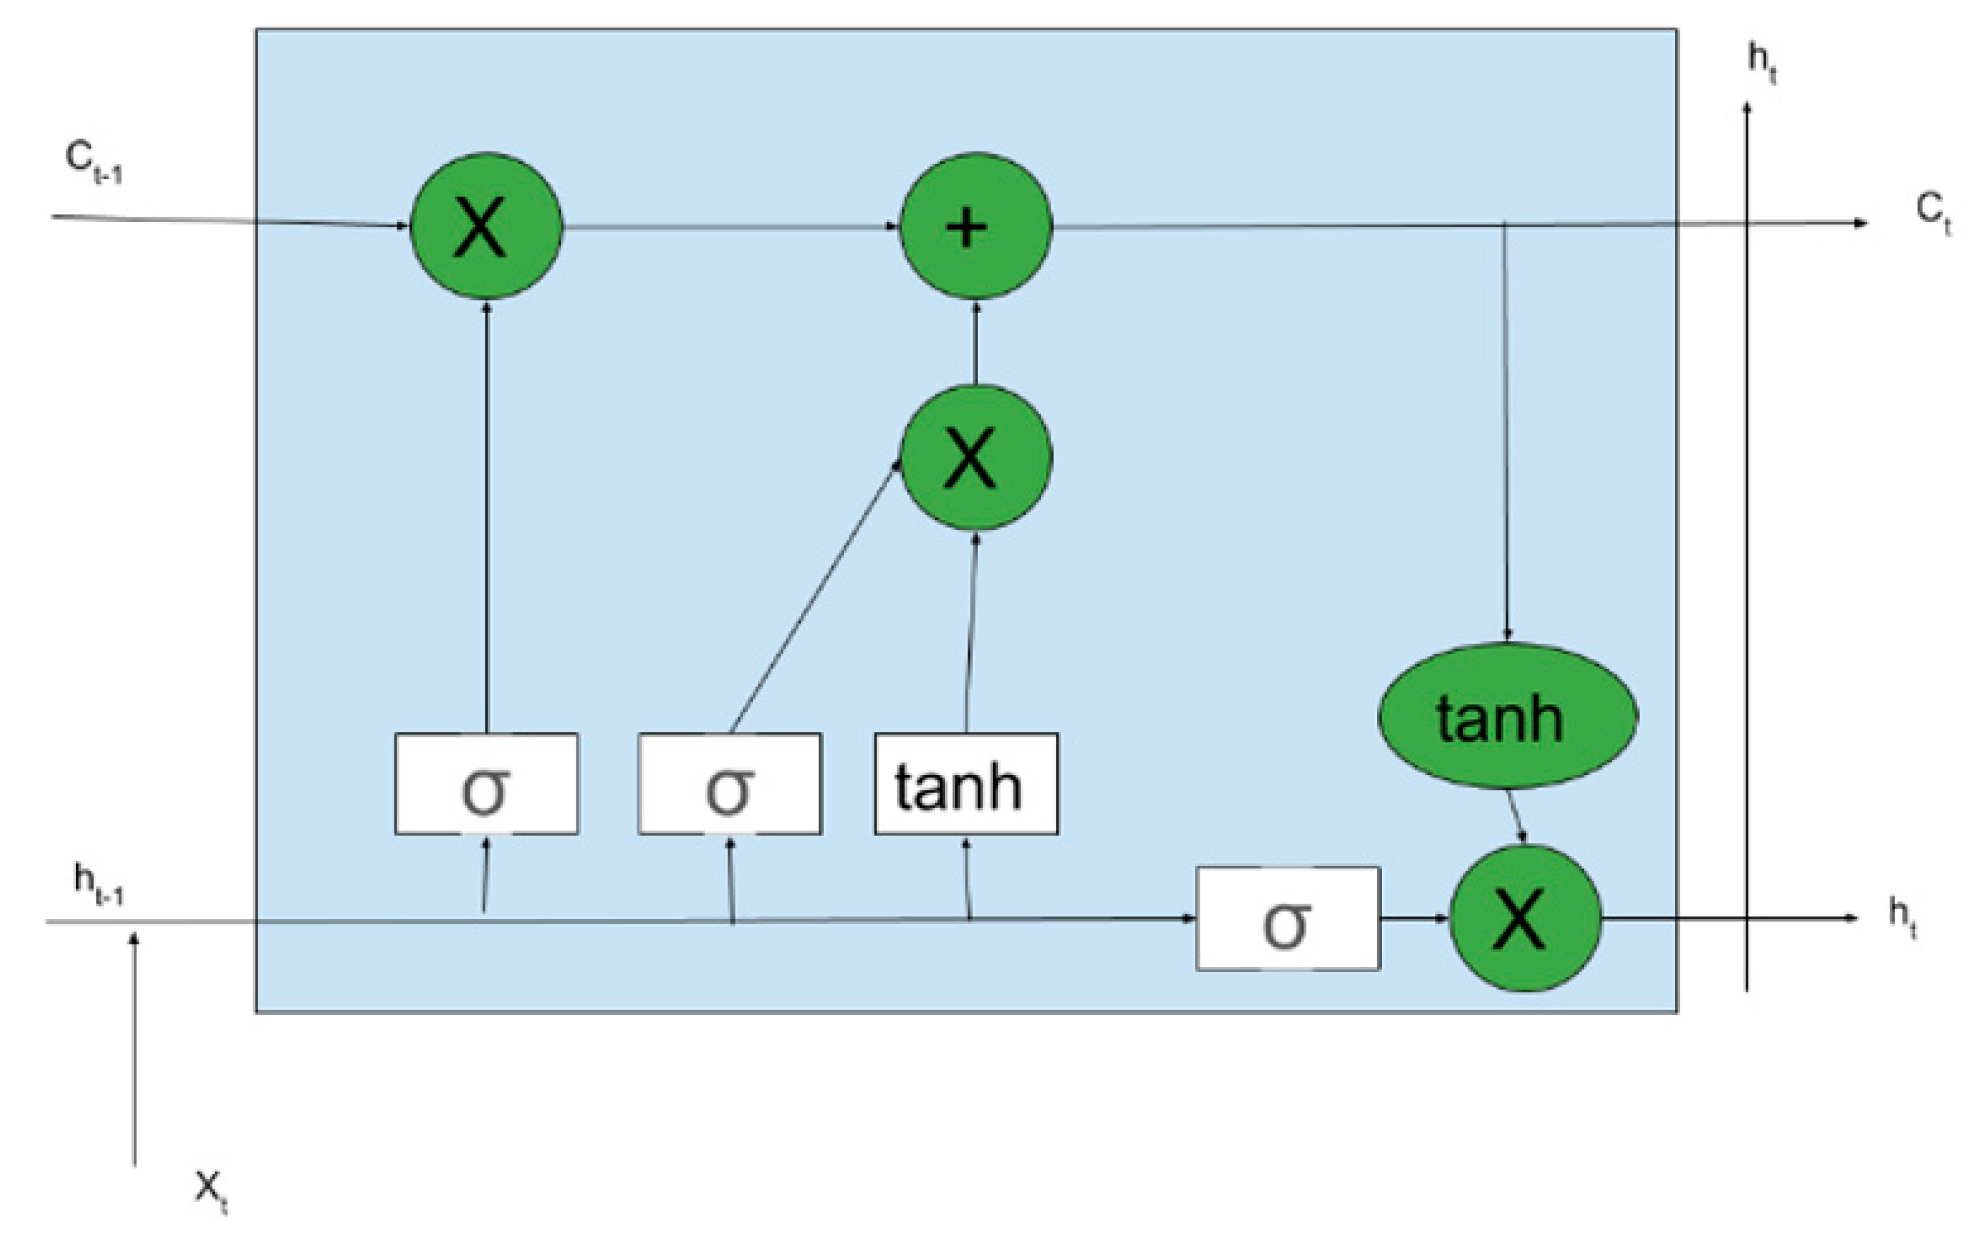
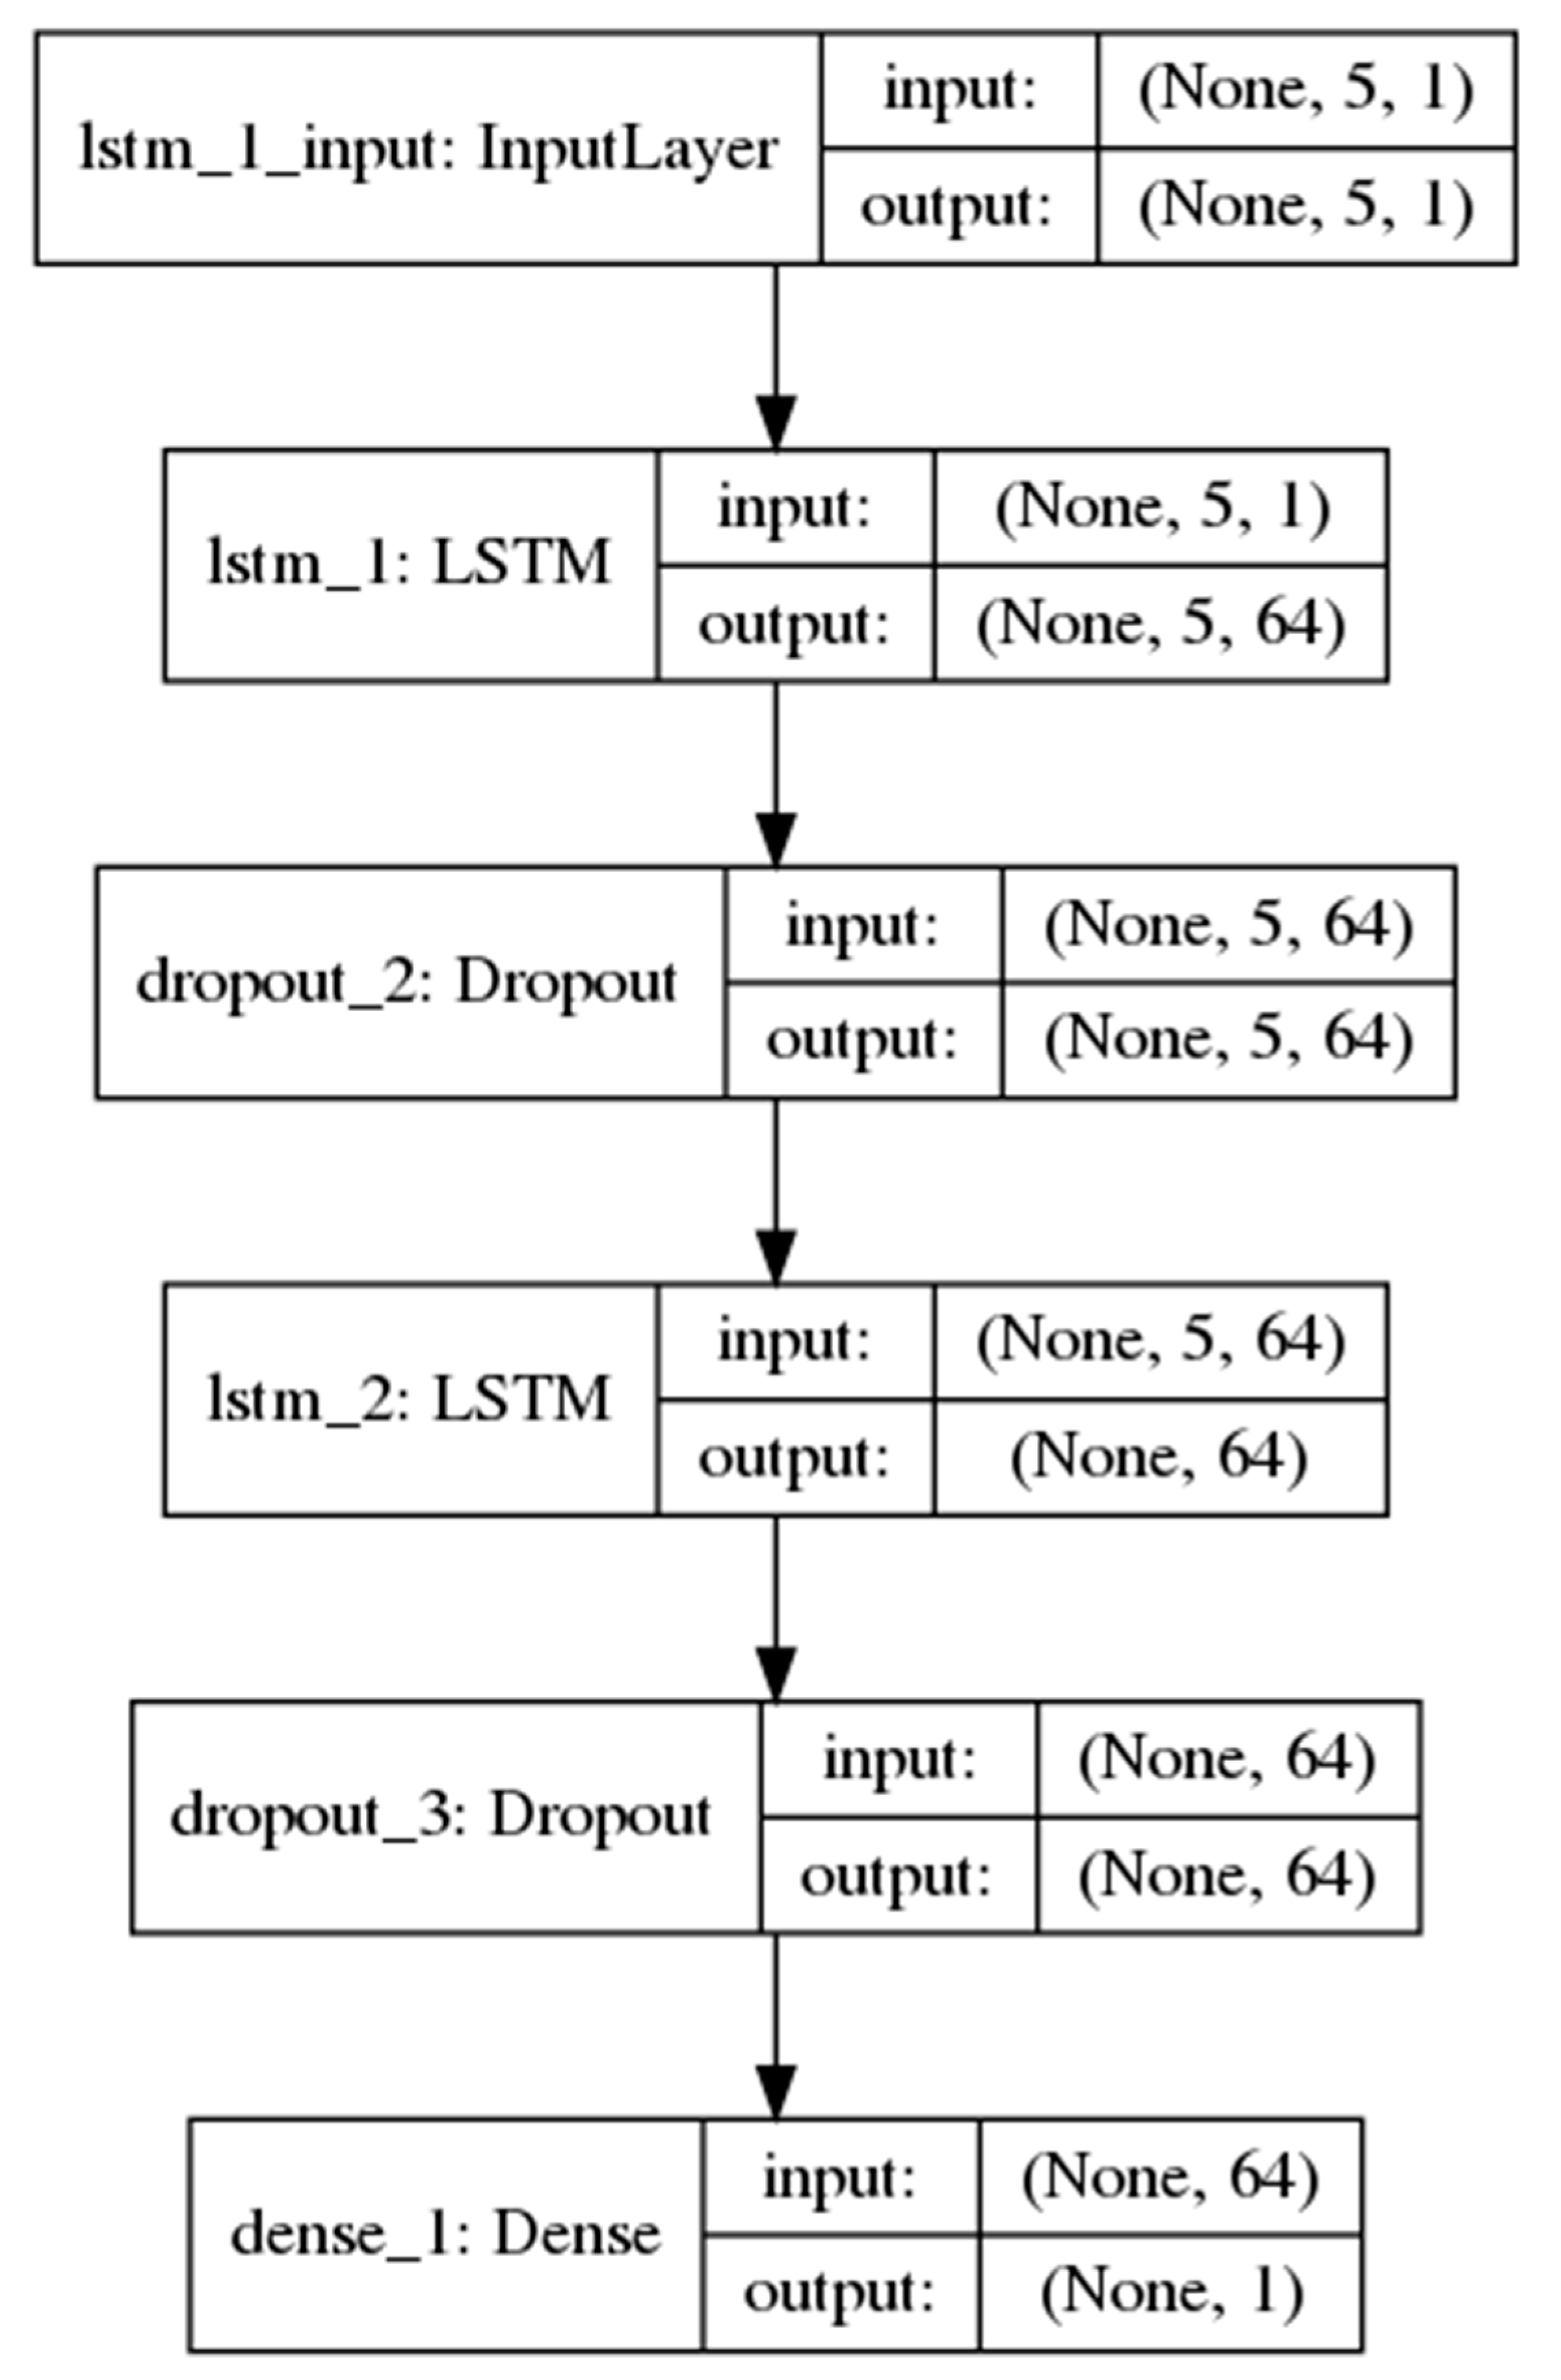
2.3.2. LSTM (Long–Short Term Memory)

LSTM was originally introduced by Hochreiter [24]. A typical LSTM cell, Figure 3, is mainly composed of four gates: input gate, input modulation gate, forget gate and output gate. The input gate takes a new input and processes the incoming data. The input port of the memory cell receives as input the output of the LSTM cell of the previous iteration. The forget gate decides when to discard the results and then selects the optimal delay for the input sequence. The output gate takes all the calculated results and generates the output for the LSTM cell. In linguistic models, a soft-max layer is usually added to determine the final output. In the traffic flow prediction model, a linear regression layer is applied to the output level of the LSTM cell. A typical architecture is presented in Figure 4 and is equivalent to the architecture used in [9]. In this domain, LSTMs have been used by [15,19] and [23].

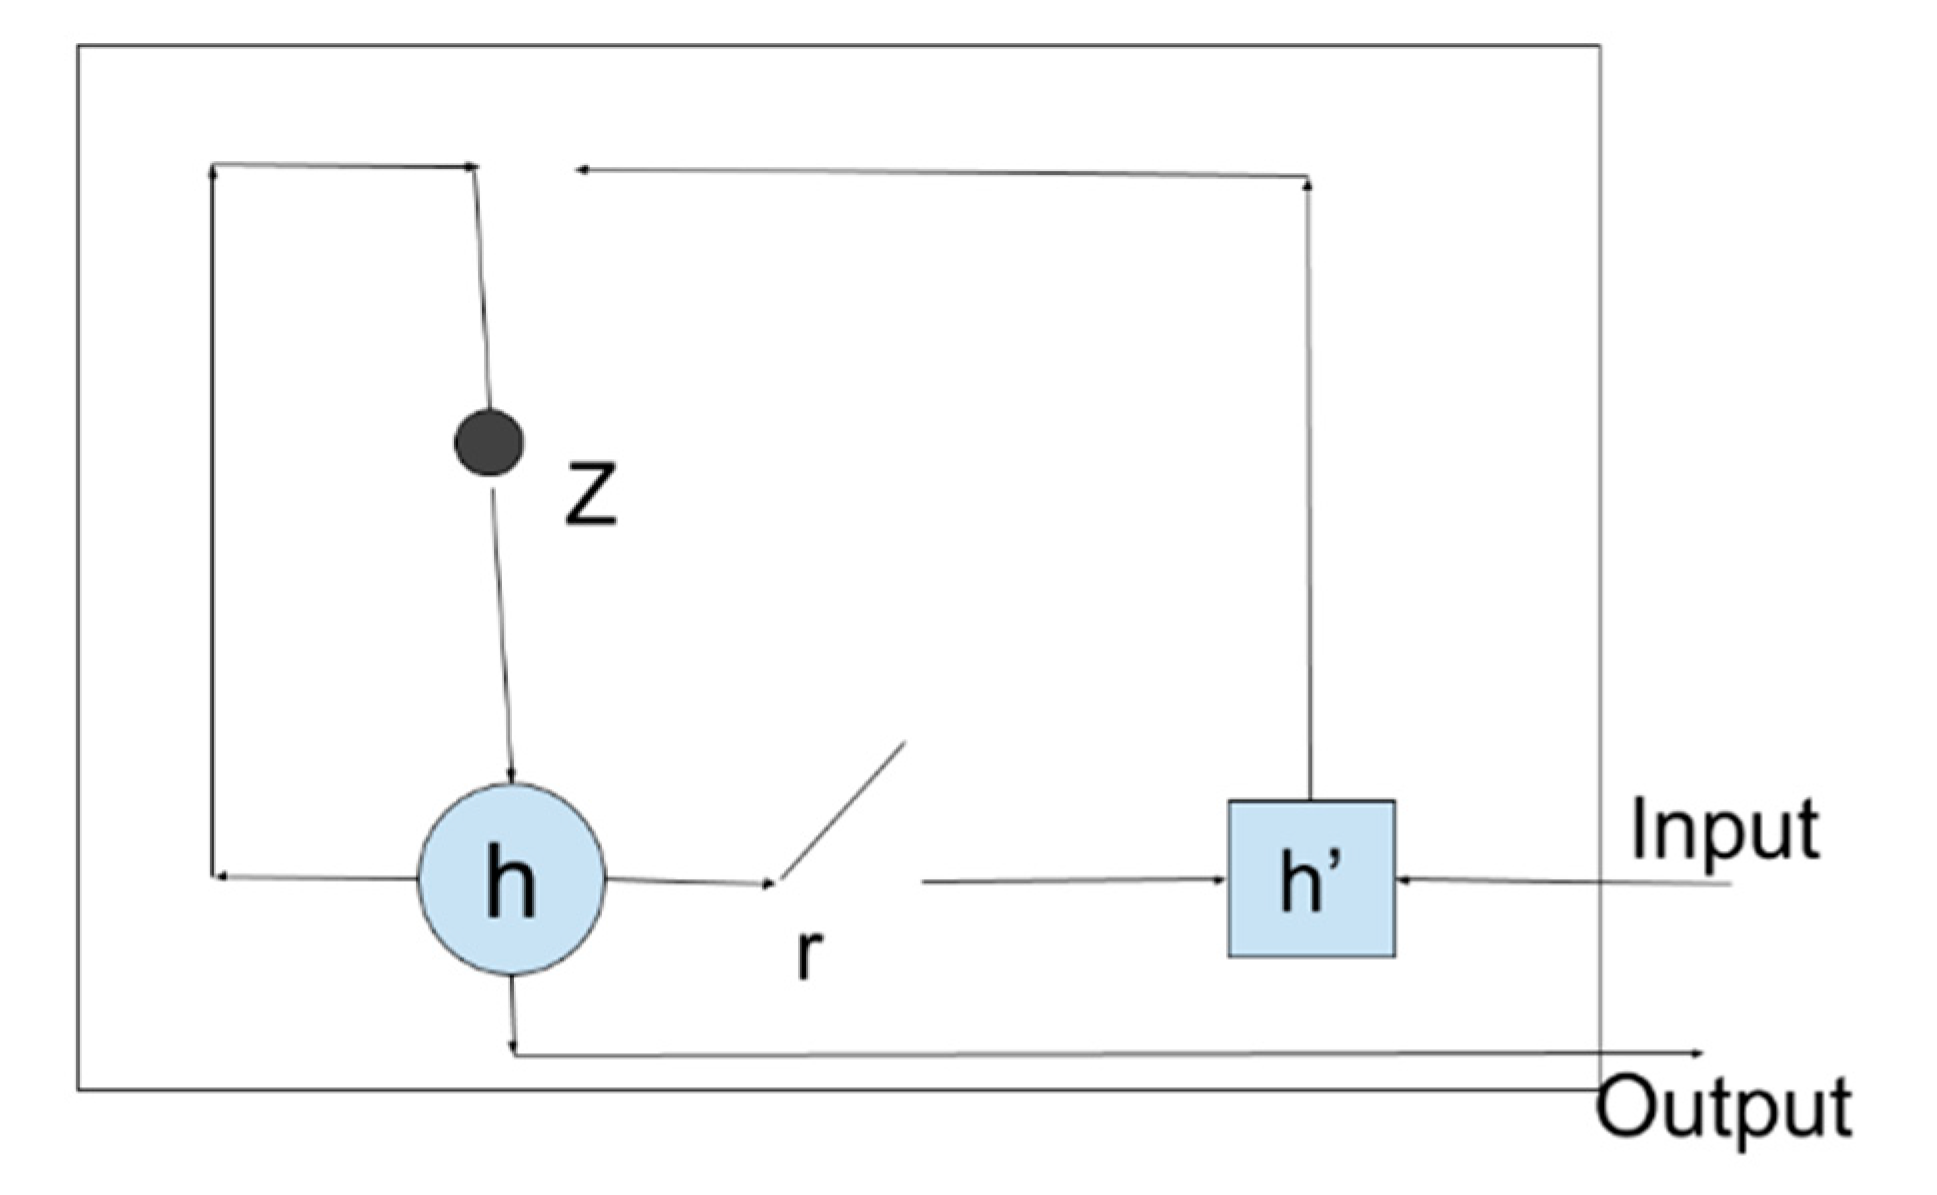
2.3.3. GRU (Gated Recurrent Unit)

GRU was originally proposed by Cho et al. [25]. The typical GRU cell structure is shown in Figure 5. A GRU cell is composed of two gates: reset gate r and update gate z. The output of the hidden layer at time t is calculated using the hidden layer of t − 1 and the input value of the time series at time t:
h t = f ( h t 1 , x t ) .
The reset gate is similar to the LSTM forget gate. Interested readers can find details in [25]. The regression part and the optimization method are, in general, the same as for an LSTM cell. The architecture is presented in Figure 6. GRUs have been used by [15,23].

3. TrafficWave Architecture

The solution here proposed, named TrafficWave, is based on Wavenet [5]. Wavenet was originally developed with the aim of producing (imitating) human voice. Wavenet uses a deep generative model able to produce realistic sounds. It works by extracting patterns from human voice recordings, in order to create sound waves able to reproduce a syllable sound. Wavenet calculates the trend of the single wave: it merges knowledge of what has been produced before and knowledge about how waves operate (the previously extracted patterns), therefore, it foresees the trend of the wave (in terms of rise and fall) for each instance. In other words, at each instant, a value is generated based on all the previous values and on rules learned from the analysis of many samples.
Van Den Oord et al. [5] had the intuition of stacking 1D convolutional layers one on top of the other, and, at the same time, doubling the dilation rate per layer. The dilation rate can be considered as the “distance” between each neuron’s input in the same layer, a sort of quantity of how much spread apart every neuron input is. For example, if the dilation rate is 2, 4 and 8, then the first 1D convolutional layer foresees two time-steps at time, while the second 1D convolutional layer foresees four time-steps and the last one eight. This allows the capability of learning short-term patterns in the lower layer and longer-term patterns in the higher layer. This is shown in Figure 7.
The system is a generative model: it can generate the sequences of real-valued data starting from some conditional inputs. The behavior is mainly due to the dilated causal convolutions. A big number of layers and large filters are used to increase the receptive field within the causal convolutions.
Dilated convolution allows to exponentially increase the receptive field which grows as a function of the number of 1D CNN layers skipping inputs by a constant dilation rate. Casual dilated convolutions allow to skip inputs at casual distance. This architecture allows the net to get a more in-depth pattern extraction being able to output and add a new node with relatively low computation. Just for comparison, a similar solution developed with several layers of CNN and 512 inputs would require 511 CNN layers with respect to the 7 stacked casual dilated convolutions in Wavenet. Given a specific dilation rate, it is possible to extract similar patterns with minutes, days and months lag. This fits very well with traffic flow prediction. Similar architectures were used for predicting Uber demand in NYC [26] and for predicting sales forecasting during a Kaggle competition [27]. Kaggle is a private owned company that hosts competitions where students, researchers, and other experts publish their solutions and accuracies for benchmarking purposes.
The TrafficWave network here proposed is a modified Wavenet network, where the number of filters is 12 and each filter depth is defined by the lag of sliding window, which has been empirically set to 5. The convolutions used are 1D convolutional layers. The filters depth is the number of channels of the residual output for the 1D convolutional layer of the initial casual convolution. Dilation rates used are {1, 2, 4, 8, 16, 32, 64, 128, 256, 512, 1024, 2048, 1, 2, 4, 8, 16, 32, 64, 128, 256, 512, 1024, 2048}. These dilation rates are used to increase, up to 2048 traffic data points, its receptive fields.
This allows to learn very recent trends (for small dilation rates) but also capturing events that happened a long time back.
The resulting network is extremely complex and it would require several pages to be displayed.

4. Dataset and Experimental Set-Up

Two datasets have been considered for experimental evaluation: Caltrans PeMS [28], briefly Caltrans, and TRAP-2017 [29].

4.1. PeMS (Caltrans Performance Measurement System)

Caltrans is composed of five-minute interval traffic data on various freeways. It contains data such as the vehicle flow, speed, occupancy, the ID of the Vehicle Detector Station (VDS), etc. Caltrans dataset has been used in [9,15,19] for traffic flow prediction. According to the current state of the art methodologies, traffic data from 1 January 2016 to 29 February 2016 have been aggregated, in this work, every 5 min and then used as a training set, traffic data of March 2016 has been aggregated every 5 and used for the test. The lag of the sliding window has been set to 5 as in [9] for comparison aims. SAEs, LST, GRU and TrafficWave have been tuned using Adam optimizer [30]. All algorithms have been trained for 500 epochs with a batch size of 64.

4.2. TRAP-2017 (Traffic Mining Applied to Police Activities)

TRAP-2017 was released by the Italian National Police [30]. It was acquired using Number Plate Reading Systems in 2016, from 1 January to 31 December, on 27 gates distributed over the Italian highway. The dataset is composed of 365 commas separated values (CSV) files containing the following data: plate number, gate, lane, timestamp and nationality (of the plate). The total number of rows is 111089717. Each gate represents a point of the highway network on which the traffic flow prediction can be performed. In this study, the prediction has been done on gate 1 considering only the timestamp field which uniquely represents the transit of a vehicle.
Data have been aggregated over a 5-min time window enumerating the number of vehicles that have transited under the gate and successively normalized with min-max rule. The Δ lag has been set to 5 min for three reasons:
  • To be consistent with other authors implementations (comparison aims);
  • Δ = 5 min produce the best accuracy for all models with respect to other solutions (i.e., 15, 30 and 45 min);
  • Δ = 5 min implies a near real-time prediction, therefore it allows to promptly implement strategies of traffic control.
The dataset has been preprocessed as follow:
  • Data have been aggregated over 5-min time window: the number of vehicles which have transited under the gate 1 every 5 min are reported along with the time stamp captured of the last vehicle belonging to the 5 min time window.
  • Time windows with 0 transited cars, have been reported as 0.
  • Data have been separated in months and days.
  • Data has been normalized with min-max rule within [0.1–1.0].
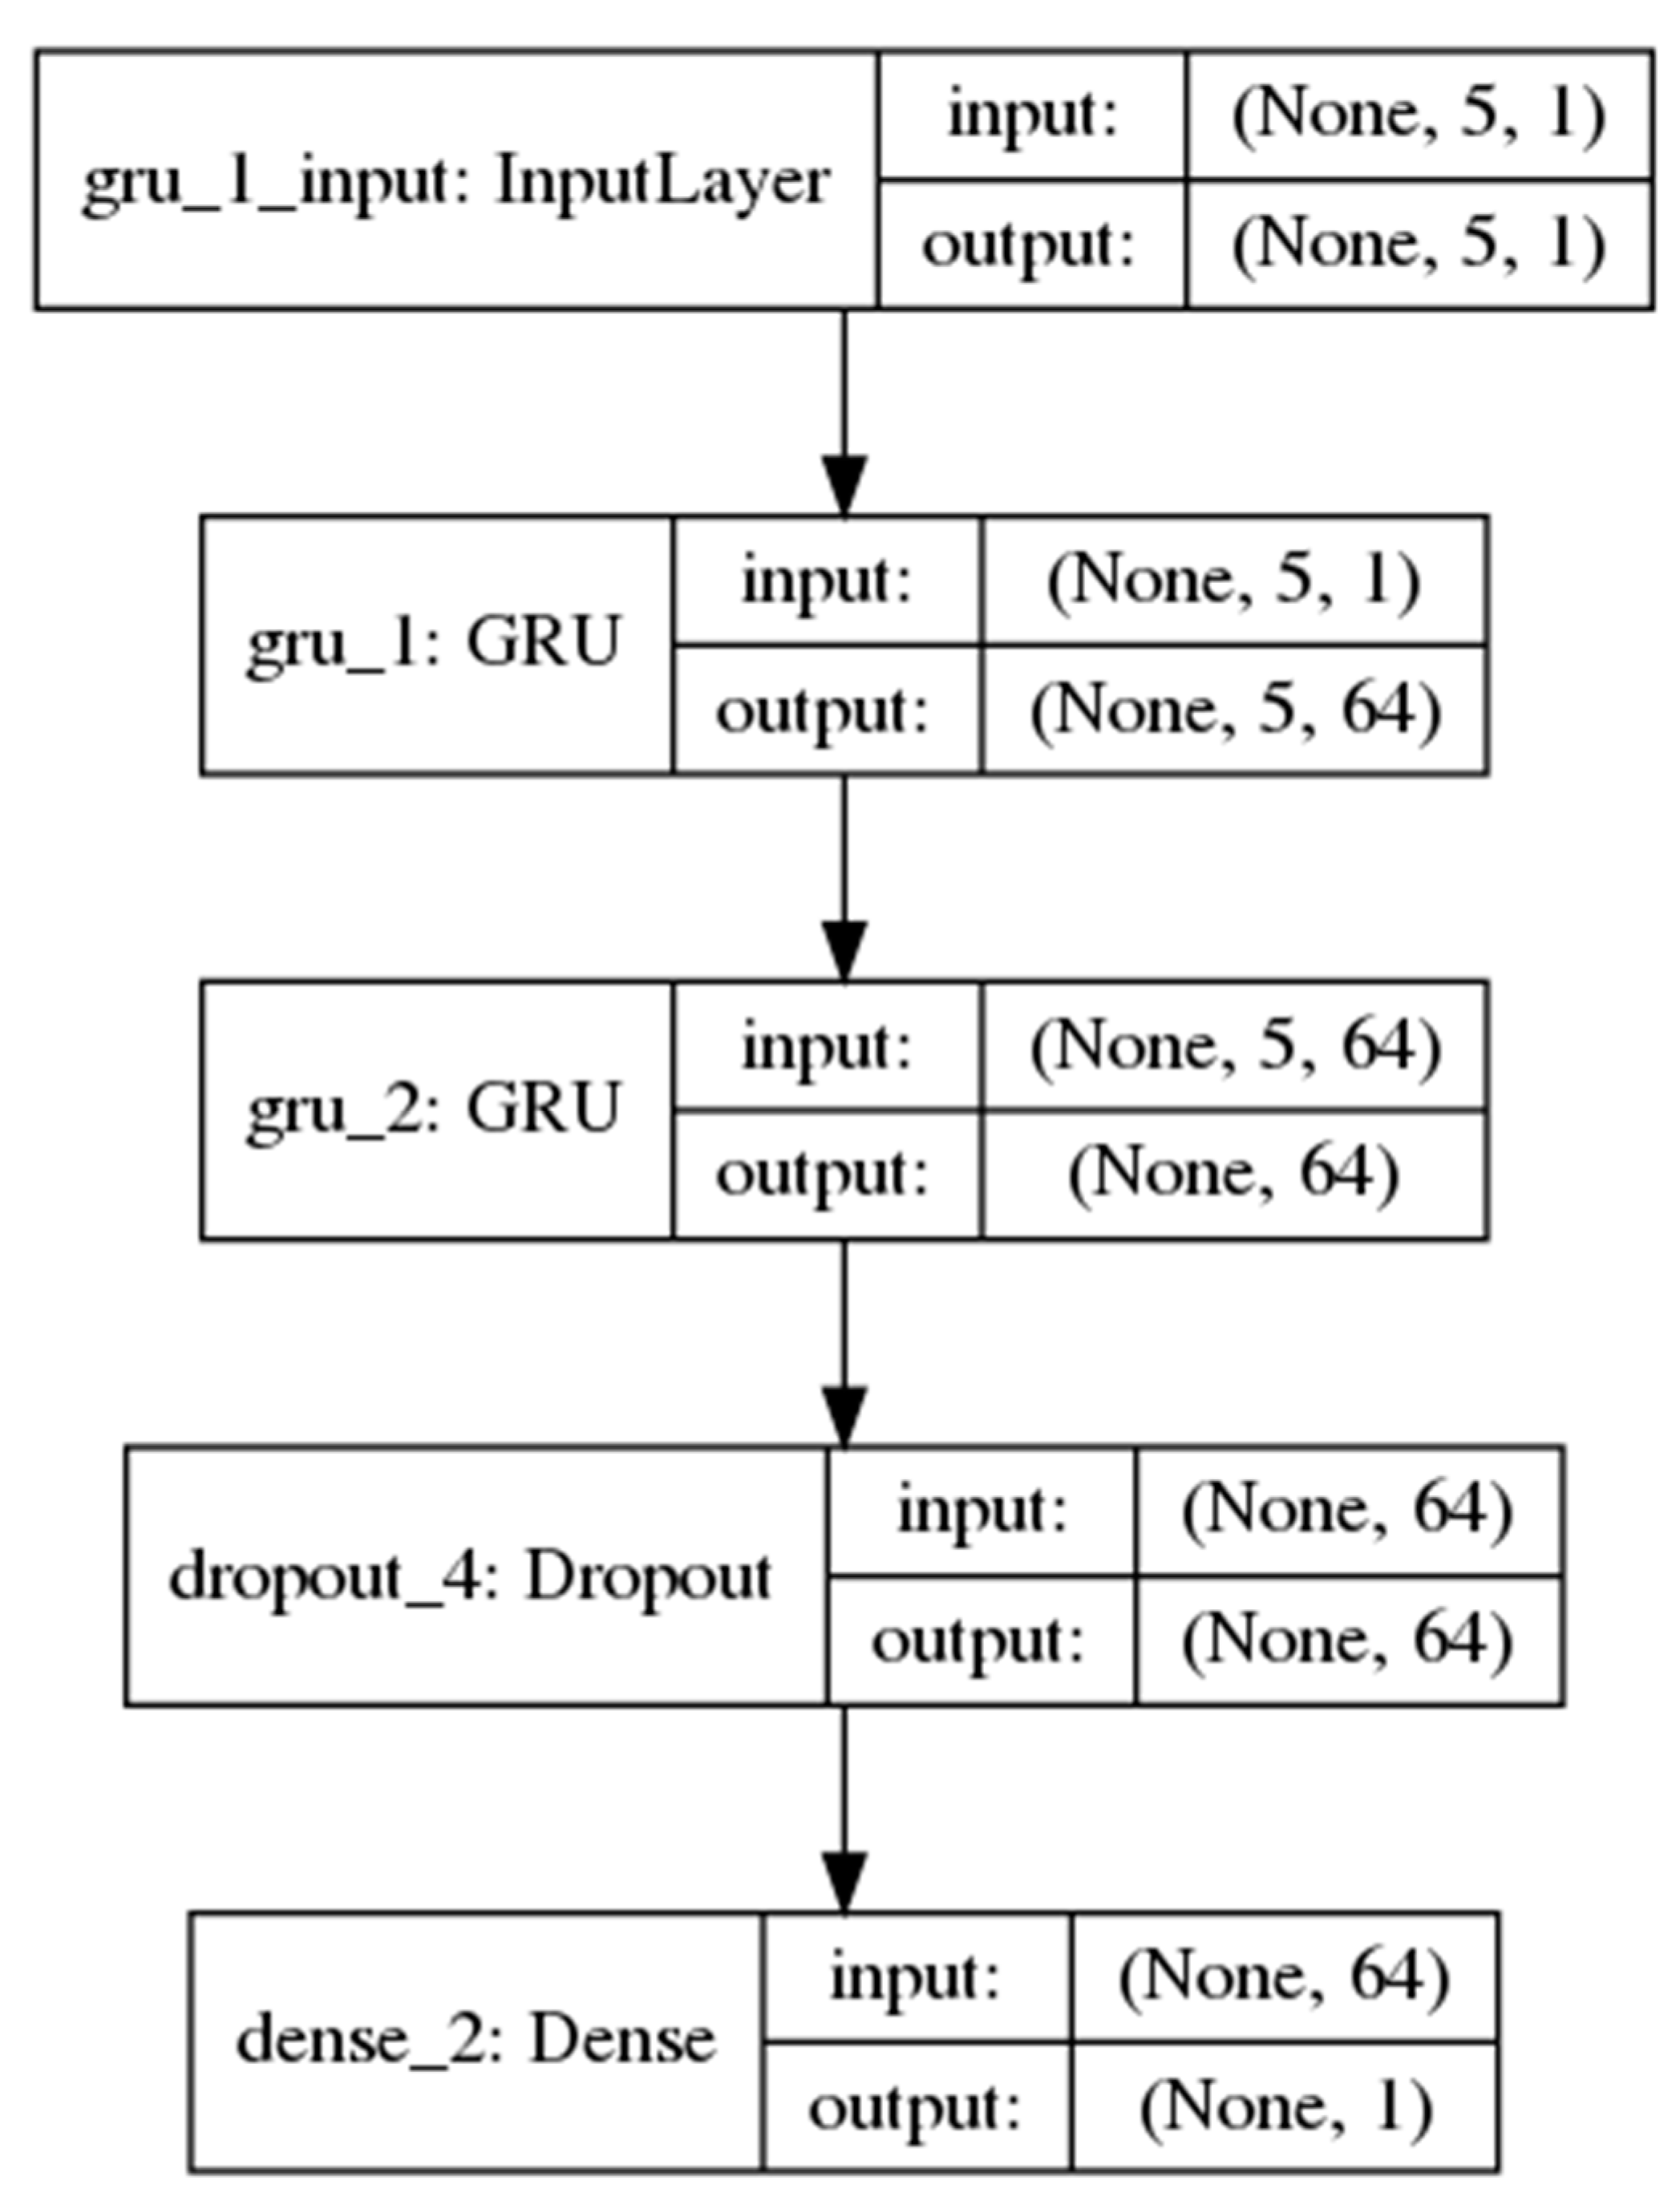
  • The sliding window approach has been then used on the normalized data (lag = 5).
  • Monday has been selected as the day of forecasting.
  • The preprocessed data is then fed to the various neural network architectures.
The input to the various architectures are the following 5 min lag datapoints: T5, T10, T15, T20, T25. These are used to do forecast T30 datapoint. The days used for training were 60 days for PeMS dataset and 44 days for TRAP-2017.

5. Results

The following metrics have been used for results evaluation.
Mean absolute percentage error (MAPE), defined as:
100 % n t = 1 n | A t F t A t | .
Mean absolute error (MAE), defined as:
i = 1 n | A t F t | n .
Root mean square error (RMSE):
i = 1 N ( A t F t ) 2 N ,
where At is the actual value and Ft is the forecast value.
Experiments were performed using AMD Ryzen threadripper 1920x with 64GB RAM and Nvidia Titan RTX with Nvidia CUDA and Keras with Tensorflow GPU backend.
Table 1 shows the results obtained on the Caltrans dataset.
The proposed architecture outperforms all other architectures in terms of MAPE. MAPE is a percentage value so that it has a simple and intuitive understanding: in general, TrafficWave performs better than other approaches. Results related to RMSE and MAE report that SAEs is able to perform, in specific cases, an error lower than TrafficWave, however the distance (in terms of performance) is little. SAEs are able to limit huge errors in general, but TrafficWave is able to suddenly capture trend changes, this can be seen in Figure 8 and Figure 9, but often at the cost of a major error.
It is worth noting that the training time is very high compared to other networks. However, this is a minor limitation since training is usually performed off-line. Table 1 also reports results obtained by other authors on the same dataset, however, it is important to state that these tests were performed on different months and with different aggregations. This is the main point of this benchmark: compare the state of art techniques plus a novel one (TrafficWave), on the exact same data and same conditions.
Figure 8 shows the prediction trend of the different neural networks over time.
Table 2 reports results obtained on the TRAP-2017 dataset. Results confirm that TrafficWave outperforms all other approaches. Considerations are similar to those already reported for the Caltrans dataset. Figure 9 confirms that the proposed architecture has the closest pattern with the ground through data.
Once more, TrafficWave needs more computational time than other techniques. The reason relies on the high complexity of the model. The architecture, being a generative one, it reaches 199 sequential hidden layers. It is more difficult to be trained if compared to sequential architecture. This is caused by stacking dilated convolutions as previously explained.
Table 3 shows the MAPE for all the weekdays. TrafficWave outperforms all the competition achieving the lower error in all the weekdays, confirming results already observed for a single day.

6. Conclusions and Future Research

TrafficWave net has been proposed in this work. It has been used for the weekday traffic flow prediction problem on two different datasets. The approaches outperform other state-of-the-art techniques in terms of MAPE. Results have been confirmed over two different datasets. Other metrics, such as MAE and RMSE, have been inspected too. Considering these metrics, SAEs is able to limit huge errors in general, but TrafficWave is able to suddenly capture trend changes.
Due to its complexity, TrafficWave results in increased training time, however, this is a minor limit since training is generally performed off-line in real scenarios and, more in general, it can be speeded up with more performing architectures.
Future research will focus on considering also contour conditions as, for example, weather [11].

Author Contributions

Conceptualization, D.I. and G.P.; Data curation, V.D. and L.S.; Investigation, D.I., V.D., G.P. and L.S.; Methodology, D.I., G.P. and L.S.; Software, V.D. and L.S.; Supervision, D.I. and G.P.; Visualization, V.D. and L.S.; Writing—original draft, D.I. and V.D.; Writing—review & editing, V.D. and D.I. project administration, D.I.; funding acquisition, D.I.

Funding

This work is within the “YourStreetLight” project funded by POR Puglia FESR-FSE 2014–2020 - Fondo Europeo Sviluppo Regionale—Asse I—Azione 1.4—Sub-Azione 1.4.b—Avviso pubblico “Innolabs”.

Conflicts of Interest

The authors declare no conflict of interest.

References

  1. World Health Organization. Global Status Report on Road Safety 2015; World Healt Organization: Geneva, Switzerland, 2015. [Google Scholar]
  2. Cavallaro, F. Policy implications from the economic valuation of freight transport externalities along the Brenner corridor. Case Stud. Transp. Policy 2018, 6, 133–146. [Google Scholar] [CrossRef]
  3. Askari, H.; Hashemi, E.; Khajepour, A.; Khamesee, M.B.; Wang, Z.L. Towards self-powered sensing using nanogenerators for automotive systems. Nano Energy 2018, 53, 1003–1019. [Google Scholar] [CrossRef]
  4. Impedovo, D.; Balducci, F.; Dentamaro, V.; Pirlo, G. Vehicular Traffic Congestion Classification by Visual Features and Deep Learning Approaches: A Comparison. Sensors 2019, 19, 5213. [Google Scholar] [CrossRef] [PubMed] [Green Version]
  5. Oord, A.V.D.; Dieleman, S.; Zen, H.; Simonyan, K.; Vinyals, O.; Graves, A.; Kalchbrenner, N.; Senior, A.; Kavukcuoglu, K. Wavenet: A generative model for raw audio. arXiv 2016, arXiv:1609.03499. [Google Scholar]
  6. Nicholls, H.; Rose, G.; Johnson, M.; Carlisle, R. Cyclists and Left Turning Drivers: A Study of Infrastructure and Behaviour at Intersections. In Proceedings of the 39th Australasian Transport Research Forum (ATRF 2017), Auckland, New Zealand, 27–29 November 2017. [Google Scholar]
  7. Perez-Murueta, P.; Gómez-Espinosa, A.; Cardenas, C.; Gonzalez-Mendoza, M., Jr. Deep Learning System for Vehicular Re-Routing and Congestion Avoidance. Appl. Sci. 2019, 9, 2717. [Google Scholar] [CrossRef] [Green Version]
  8. Ni, D. Traffic Flow Theory: Characteristics, Experimental Methods, and Numerical Techniques; Butterworth-Heinemann: Oxford, UK, 2015. [Google Scholar]
  9. Lv, Y.; Duan, Y.; Kang, W.; Li, Z.; Wang, F.Y. Traffic flow prediction with big data: A deep learning approach. IEEE Trans. Intell. Transp. Syst. 2014, 16, 865–873. [Google Scholar] [CrossRef]
  10. Chen, Y.; Shu, L.; Wang, L. Traffic flow prediction with big data: A deep learning based time series model. In Proceedings of the 2017 IEEE Conference on Computer Communications Workshops (INFOCOM WKSHPS), Atlanta, GA, USA, 1–4 May 2017; pp. 1010–1011. [Google Scholar]
  11. Koesdwiady, A.; Soua, R.; Karray, F. Improving Traffic Flow Prediction with Weather Information in Connected Cars: A Deep Learning Approach. IEEE Trans. Veh. Technol. 2016, 65, 9508–9517. [Google Scholar] [CrossRef]
  12. Aqib, M.; Mehmood, R.; Alzahrani, A.; Katib, I.; Albeshri, A.; Altowaijri, S.M. Smarter traffic prediction using big data, in-memory computing, deep learning and GPUs. Sensors 2019, 19, 2206. [Google Scholar] [CrossRef] [PubMed] [Green Version]
  13. Huang, W.; Song, G.; Hong, H.; Xie, K. Deep architecture for traffic flow prediction: Deep belief networks with multitask learning. IEEE Trans. Intell. Transp. Syst. 2014, 15, 2191–2201. [Google Scholar] [CrossRef]
  14. Wu, Y.; Tan, H.; Qin, L.; Ran, B.; Jiang, Z. A hybrid deep learning based traffic flow prediction method and its understanding. Transp. Res. Part C Emerg. Technol. 2018, 90, 166–180. [Google Scholar] [CrossRef]
  15. Fu, R.; Zhang, Z.; Li, L. Using LSTM and GRU neural network methods for traffic flow prediction. In Proceedings of the 2016 31st Youth Academic Annual Conference of Chinese Association of Automation (YAC), Wuhan, China, 11–13 November 2016; pp. 324–328. [Google Scholar]
  16. Polson, N.G.; Sokolov, V.O. Deep learning for short-term traffic flow prediction. Transp. Res. Part C Emerg. Technol. 2017, 79, 1–17. [Google Scholar] [CrossRef] [Green Version]
  17. Huang, W.; Hong, H.; Li, M.; Hu, W.; Song, G.; Xie, K. Deep architecture for traffic flow prediction. In International Conference on Advanced Data Mining and Applications; Springer: Berlin/Heidelberg, Germany, December 2013; pp. 165–176. [Google Scholar]
  18. Albertengo, G.; Hassan, W. Short term urban traffic forecasting using deep learning. ISPRS Ann. Photogramm. Remote Sens. Spat. Inf. Sci. 2018, 4, 3–10. [Google Scholar] [CrossRef] [Green Version]
  19. Wei, W.; Wu, H.; Ma, H. An AutoEncoder and LSTM-Based Traffic Flow Prediction Method. Sensors 2019, 19, 2946. [Google Scholar] [CrossRef] [PubMed] [Green Version]
  20. Liu, P.; Zhang, Y.; Kong, D.; Yin, B. Improved Spatio-Temporal Residual Networks for Bus Traffic Flow Prediction. Appl. Sci. 2019, 9, 615. [Google Scholar] [CrossRef] [Green Version]
  21. Choi, Y.Y.; Shon, H.; Byon, Y.J.; Kim, D.K.; Kang, S. Enhanced Application of Principal Component Analysis in Machine Learning for Imputation of Missing Traffic Data. Appl. Sci. 2019, 9, 2149. [Google Scholar] [CrossRef] [Green Version]
  22. Zhang, S.; Yao, Y.; Hu, J.; Zhao, Y.; Li, S.; Hu, J. Deep autoencoder neural networks for short-term traffic congestion prediction of transportation networks. Sensors 2019, 19, 2229. [Google Scholar] [CrossRef] [PubMed] [Green Version]
  23. Li, J.; Wang, J. Short term traffic flow prediction based on deep learning. In Proceedings of the International Conference on Robots & Intelligent System (ICRIS), Haikou, China, 15–16 June 2019; pp. 466–469. [Google Scholar]
  24. Hochreiter, S.; Schmidhuber, J. Long short-term memory. Neural Comput. 1997, 9, 1735–1780. [Google Scholar] [CrossRef] [PubMed]
  25. Cho, K.; Van Merriënboer, B.; Gulcehre, C.; Bahdanau, D.; Bougares, F.; Schwenk, H.; Bengio, Y. Learning phrase representations using RNN encoder-decoder for statistical machine translation. arXiv 2014, arXiv:1406.1078. [Google Scholar]
  26. Chen, L.; Ampountolas, K.; Thakuriah, P. Predicting Uber Demand in NYC with Wavenet. In Proceedings of the Fourth International Conference on Universal Accessibility in the Internet of Things and Smart Environments, Athens, Greece, 24–28 February 2019; p. 1. [Google Scholar]
  27. Kechyn, G.; Yu, L.; Zang, Y.; Kechyn, S. Sales forecasting using WaveNet within the framework of the Kaggle competition. arXiv 2018, arXiv:1803.04037. [Google Scholar]
  28. Caltrans, Performance Measurement System (PeMS). 2014. Available online: http://pems.dot.ca.gov (accessed on 13 December 2019).
  29. TRAP 2017. TRAP 2017: First European Conference on Traffic Mining Applied to Police Activities. Available online: http://www.wikicfp.com/cfp/servlet/event.showcfp?eventid=64497©ownerid (accessed on 14 October 2019).
  30. Kingma, D.P.; Ba, J. Adam: A Method for Stochastic Optimization. arXiv 2014, arXiv:1412.6980. [Google Scholar]
Figure 1. Stacked denoising autoencoder.
Applsci 09 05504 g001
Figure 2. Stacked auto encoders (SAEs) architecture.
Applsci 09 05504 g002
Figure 3. Long short–term memory (LSTM) cell.
Applsci 09 05504 g003
Figure 4. LSTM architecture.
Applsci 09 05504 g004
Figure 5. Gated recurrent unit (GRU) cell.
Applsci 09 05504 g005
Figure 6. GRU architecture.
Applsci 09 05504 g006
Figure 7. The wavenet architecture.
Applsci 09 05504 g007
Figure 8. Intraday flow prediction for Caltrans dataset.
Applsci 09 05504 g008
Figure 9. Intraday flow prediction for first Monday of November 2017 from TRAP-2017 dataset.
Applsci 09 05504 g009
Table 1. Performance on Caltrans dataset.
MAPEMAERMSETIME
TrafficWave15.522%6.2298.6685293s
LSTM15.703%6.2748.734820s
GRU17.757%6.3238.637641s
SAEs16.742%6.0958.3351163s
Wei et al. [19]NA25.2635.45NA
Fu et al. [15]NA17.21125.86NA
Lv et al. [9]NA34.1.850.0NA
Note: Bold is the solution proposed in this work. Normal have been calculated. Italics are just reported from other works.
Table 2. Performance on the TRAP-2017 dataset.
MAPEMAERMSETIME
TrafficWave14.929%35.40650.902893s
LSTM15.991%37.95953.552292s
GRU15.964%37.87953.669245s
SAEs16.674%36.37451.267198s
Table 3. MAPE results for TRAP-2017 on various weekdays of November 2016.
MondayTuesdayWednesdayThursdayFridaySaturdaySunday
TrafficWave14.929%17.354%14.998%12.190%14.779%14.891%17.439%
LSTM15.991%18.041%16.835%12.394%14.884%23.253%17.483%
GRU15.964%22.478%17.119%12.212%15.463%16.591%17.950%
SAEs16.674%18.620%15.593%21.260%14.986%15.895%17.580%

