Article

Image Transmission over Cognitive Radio Networks for Smart Grid Applications

1
Department of Electrical Engineering, Amirkabir University of Technology (Tehran Polytechnic), Tehran 15875-4413, Iran
2
Faculty of Science and Technology, University of the Faroe Islands, Tórshavn FO 100, Faroe Islands
*
Authors to whom correspondence should be addressed.
Appl. Sci. 2019, 9(24), 5498; https://doi.org/10.3390/app9245498
Submission received: 19 October 2019 / Revised: 1 December 2019 / Accepted: 5 December 2019 / Published: 13 December 2019
(This article belongs to the Section Electrical, Electronics and Communications Engineering)

Abstract

:
Today, Smart Grids (SGs), as the goal of the next-generation power grid system, span extremely wide aspects from power generation to end-user utilities. In smart grids, Energy and Information flows are mutually dependent and performance degradation of one side may have a high impact on the other side. In this work, we introduce our architecture for monitoring of Wind Turbine (WT) farms in smart grids. In our proposed system an industrial camera is embedded on a Wireless Cognitive Radio node for each WT to capture appropriate images and stream videos to the cognitive coordinator. Any packet loss in transmission between an embedded cognitive node and the coordinator can degrade peak signal-to-noise ratio (PSNR) of the received images. The image streaming is a delay sensitive transmission which should be done in harsh environments in SGs. To tackle these challenging issues, we introduce our efficient model, called JOPSS, for joint optimization of both packet size and Number of Spectrum Sensing Iterations (NSSI) during image transmission in time-restricted conditions. We define our proposed objective function as the quotient of the Overhead Time and the Effective Transmission Time (ETT). In addition, we introduce our methods based on the Minimum of Overhead Time Channel Selection (MOTS) for the efficient channel selection along with Dynamic Parameter Updating Procedure (DPUP) to benefit different strategies in Mandatory and Proactive Handoffs (MHO/PHO). The obtained results show that noticeable improvements in both PSNR and feature-similarity (FSIM) can be achieved on our models JOPSS and JOPSS-SAFE, respectively.

1. Introduction

Nowadays, the concept of Smart Grid (SG) networks as the next generation of electricity networks covers various aspects of technical, economical and social affairs. In these networks, a two-way path is considered for both Energy and Data flows [1,2,3,4]. These two flows are not only independent but also have mutual functional effects [5]. Smart grids utilize modern communication networks [6,7,8,9], cyber security measures [4], computational intelligence and efficient information systems throughout the energy production supply chain including distributed generation (DG) resources [10], transmission lines, substations, distribution lines, and end-users as an integrated complex system [11,12]. This description covers a full range of energy systems from the production point to the endpoints at the customer section. Its purpose is to provide a clean, safe, reliable, flexible, and stable system. In these wide networks, interoperability of various production technologies, information and communication technologies with each other and adapting them to traditional infrastructures of power network leads to the complexity of smart grids [12,13,14].
With the development of smart grids, many new applications are also developing [5]. One of the most important issues in the development of smart grids is communication networks which should transmit a wide range of information. There are many different communication technologies for the infrastructure of smart grids [1,15,16,17]. Considering the fact that smart grid is a very wide and complex system of systems with high industrial standards, designing of communication networks must be done in such a way that improves quality of service (QoS), tolerance capability and reliability [18].
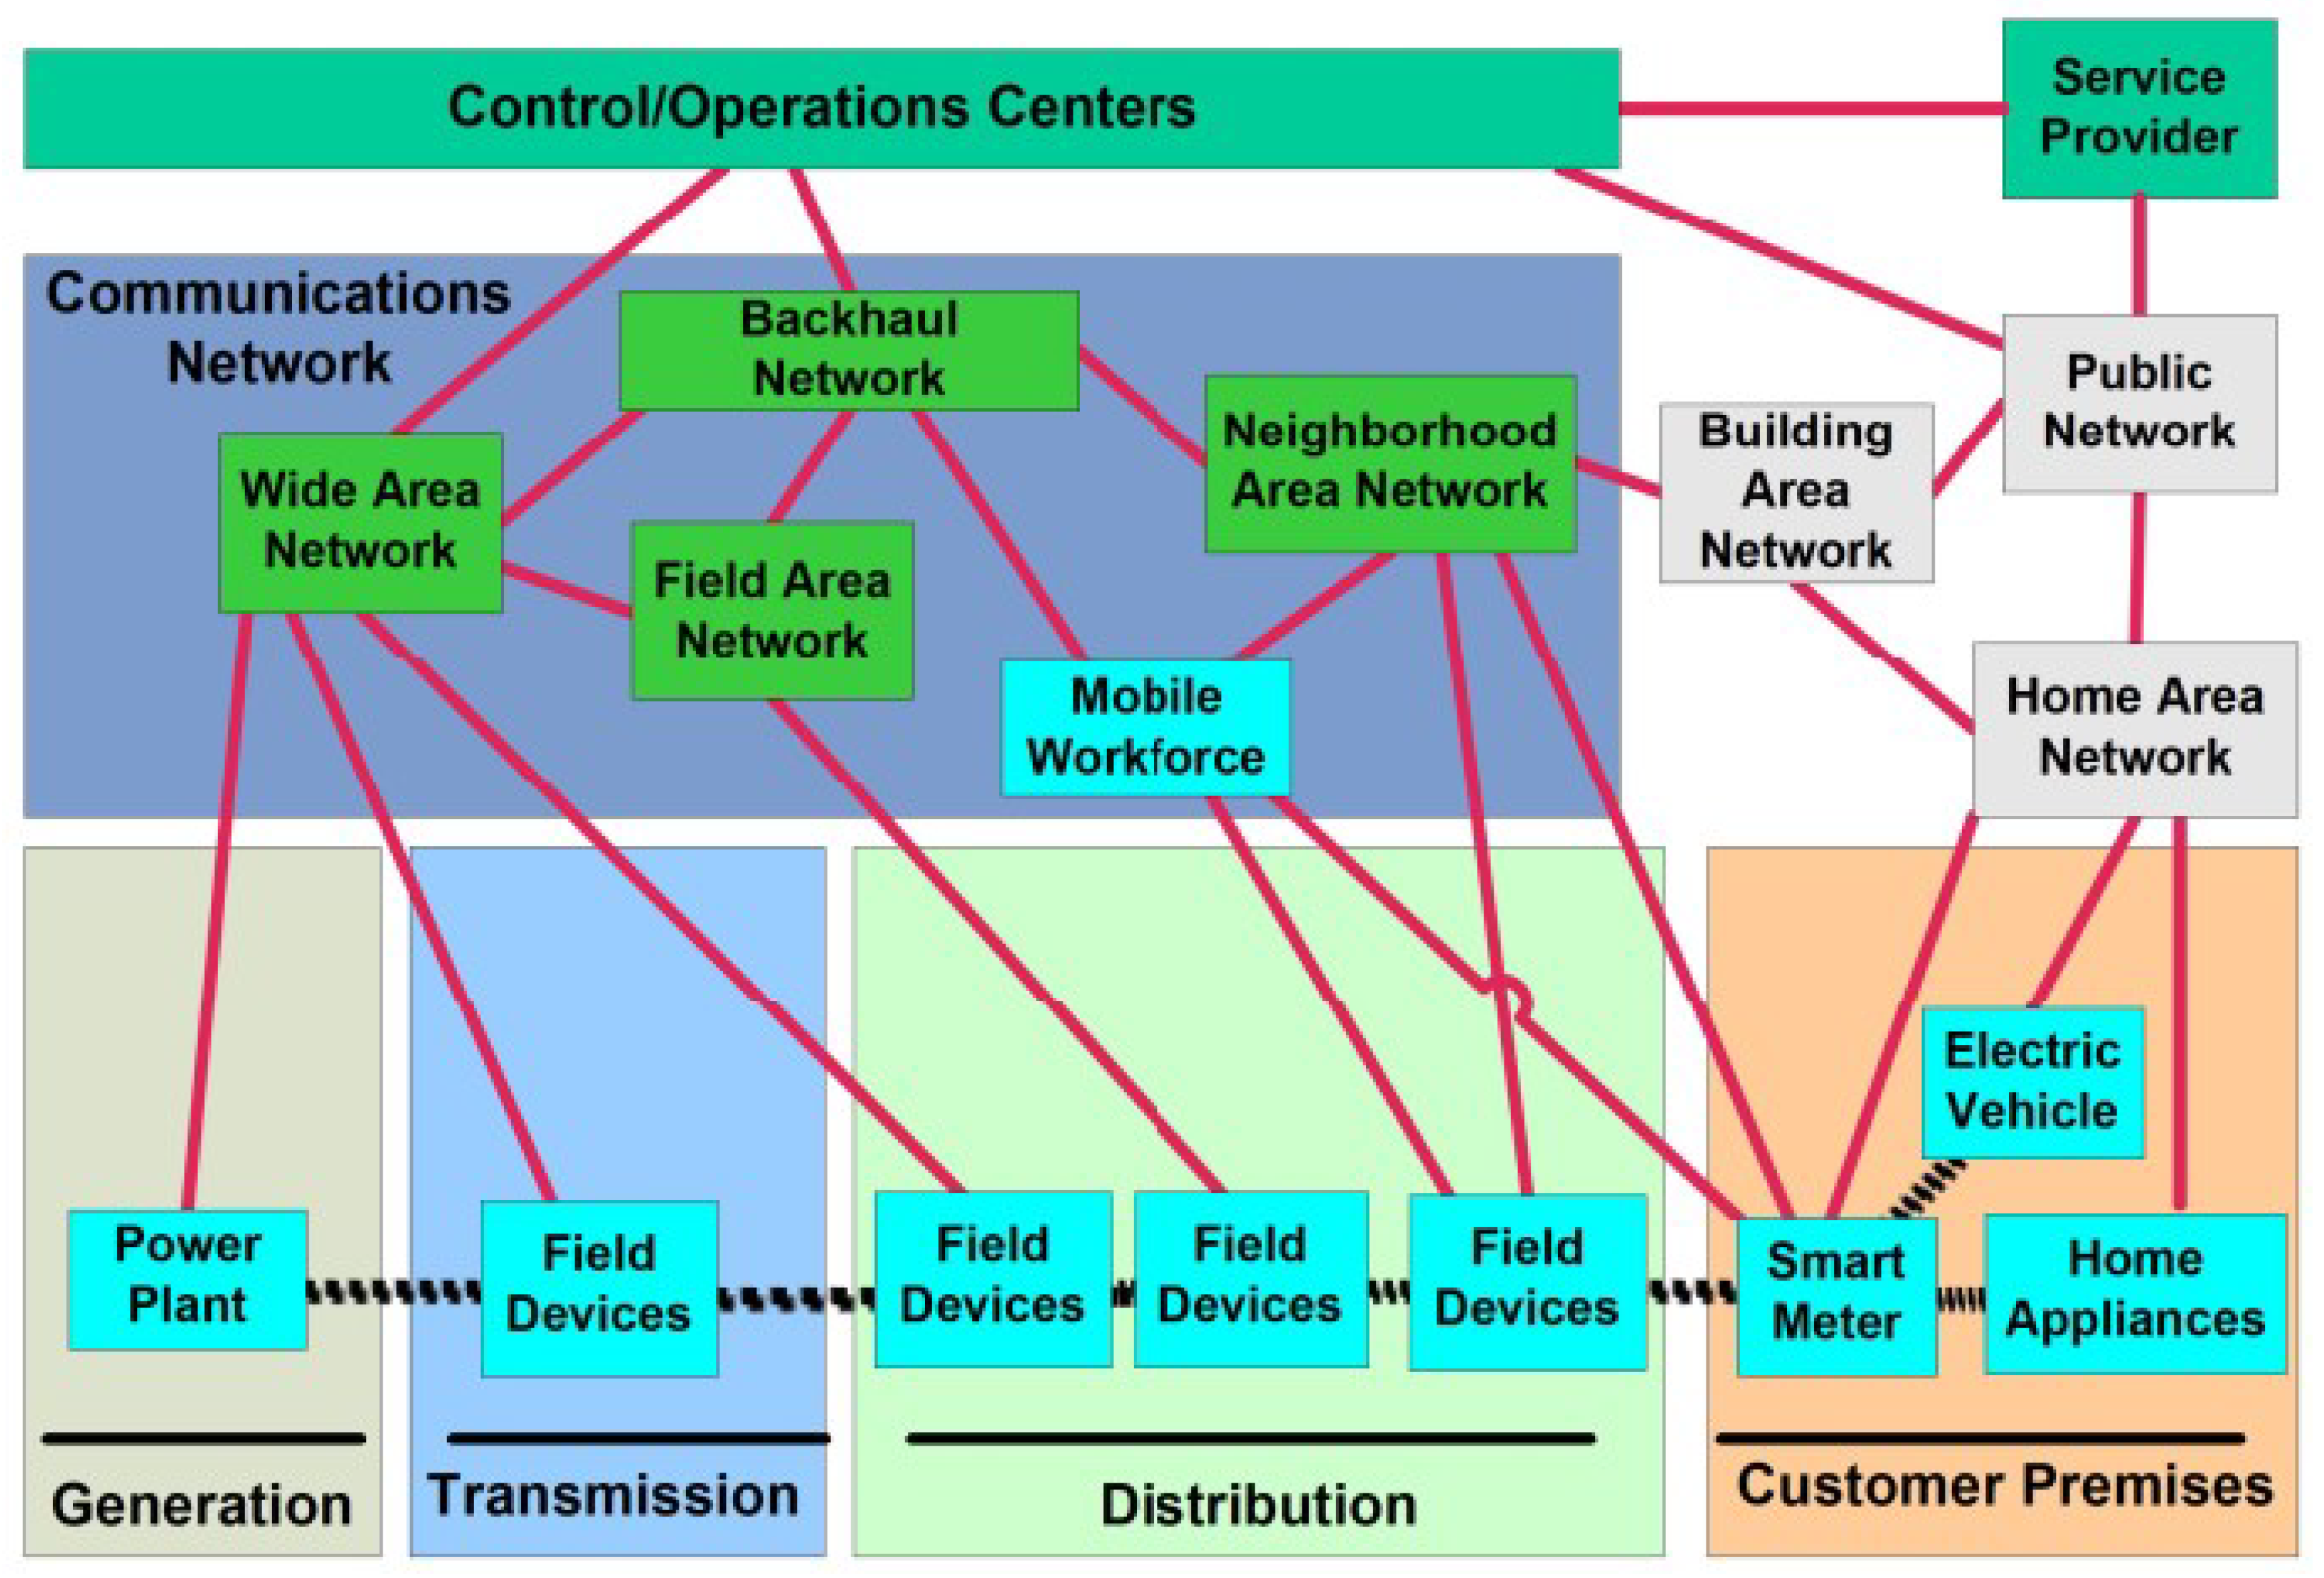
The smart grid communication technologies cover various types of networks with different areas and applications which should be fitted with relevant requirements [12,19]. Some network types are mentioned below [20]:
  • Wide area networks (WANs) which connect large geographic areas. Phase Measurement Units (PMU) [21,22,23], and Wide Area Monitoring Systems (WAMS) [24] are some examples of these networks. WAMS is the only reference that provides information about the angles of current and voltage of the network simultaneously and precisely throughout the entire network [9].
  • Field Area Networks (FANs) or Neighbor Area Networks (NANs) [25,26] which provide infrastructures for communication among Intelligent Electrical Devices (IEDs) together and their connections with circuit breakers, actuators, and transformers for automation of DGs, substations and monitoring lines in Advanced Distribution Automation (ADA) applications of SGs.
  • Home Area Networks (HAN) which includes customers’ networks and other application networks in customer domain for home automation, smart homes, smart meters, and etc. [20,27].
Figure 1 demonstrates various network types in SGs.
Wide ranges of network types with various data mean that these infrastructures should carry a massive amount of information such as control signals, measured data, monitoring data, multimedia end etc. via communication networks. In addition to the challenging issue of high volume data transmission, the end-to-end delay is an extremely important problem for SGs, especially for power protection systems. For example, in circuit breakers, any latency in the control command signals can lead to destructive impacts on the power network. Therefore, IEEE and IEC, as two main standard organizations for power systems, had defined solid standards for delays in the SGs including the IEEE 1646 [29] and IEC 61850 [28]. Some details about these standards are collected in Table 1 and Table 2.
Now, there are increasing demands of multimedia applications in SG communication networks that inherently require a huge amount of bandwidth and well-designed resource allocations methods. For example, wind turbines (WTs) are considered as high-cost devices that have advance maintenance services [30]. The WT conditional monitoring and diagnostics are actually a complex challenge. In order to increase the lifetime of WTs and reduce the maintenance cost, it is essential to have accurate prediction of system faults and failures using advanced Non Destructive Tests (NDTs) methods during in-service operation [31]. These systems usually benefits smart sensors with artificial intelligence and machine learning techniques to perform advance inspections [5,32,33,34,35,36].
In this paper, our main goal is to implement an appropriate wireless telecommunication infrastructure to send images of thermal cameras mounted on wind turbine towers (WTTs). For this purpose, an efficient design of the Media Access Control (MAC) layer based on cognitive radio (CR) technology with consideration of delay constraints which were defined in smart grid standards is aimed. This communication structure provides inspection tools for fault detection and NDTs purposes in wind farms. This platform can also be used to prevent outage and its consequences. However, it is subject to the accuracy of the performance of the communication network and its efficiency. The remainder of the paper is written as follows: In Section 2, related works are discussed. In Section 3, the proposed MAC layer model is elaborated in full details. Then in Section 4, obtained results of our simulations are presented and finally, the conclusion and discussion are stated in Section 5.

2. Related Works

In smart grids, there is a diverse range of sensors and IEDs in value chains from consumers to DGs and vice versa. Although scalar sensors in the smart grids can provide valuable data, they also suffer from their limited information and restrictions [37,38]. Thus, there are increasing needs for multimedia applications that require additional bandwidth for intranet communications within SGs [38,39,40]. In fact, there is the potential for massive multimedia applications for both end-users and commercial/industrial sectors in SGs [37,38,39,40]. For example, wireless surveillance cameras can be installed in substations (NAN), home electric appliances and smart meters (HAN) to achieve high levels of safety and security [41]. Multimedia data that collected can be analyzed either to identify network faults and failures or to detect tampering of smart meters. Another example of multimedia applications in SGs was presented in [42]. They deployed multimedia sensors for solar panels that can predict the amount of energy produced [42]. In [5], a new idea based on computer vision and a wireless camera network was introduced to estimate wind turbine velocity. This information can be used for energy predictions in DGs. Having an accurate estimation of the production rate of DGs plays a significant role in load management and optimal power distribution within the power network [43].
These new services in SGs depend on ICT infrastructures. Among all smart grid experts, there is a general agreement on the need for two-way communication networks to establish the flow of information among the different components of the power network. However, there is still many debates about which of the specific communication technologies (both cable and wireless) should be applied in different network types in SGs [1,15]. Indeed, this is a hard challenge among researchers in this field of work and there is no clear and applicable response to the issue until now [44,45]. Given the fact that the effective information sharing throughout the network is a key factor to the success of smart grid technology, SG communication subsystems should meet quality of services mentioned in the SG standards [46].
Nowadays, we face huge growth of wireless technologies in the form of cellular networks, satellite networks, wireless sensor networks, IoT and etc. [47,48,49,50]. Wireless networks have different strengths and weaknesses compared to wired networks. Due to the wide advantages of wireless networks, many studies address the weaknesses and persist to decrease their negative effects as much as possible. However, there are major challenges in the design and development of delay-sensitive and high bit rate wireless communication networks over SGs. Some of these problems are as follows:
  • Need to transfer high volumes of information, including scalar sensors, measurement tools, multimedia data and control signals [17,51].
  • Increasing radio interference in the limited wireless spectrum [40]
  • The low rate of data transmission on existing standards such as IEEE 802.15.4 and their low performance in delay-sensitive applications [52].
  • Managing media communication with heterogeneous Quality of Experience (QoE) for a wide variety of both users and data [12,13,53].
  • Renewable and clean power resources such as solar energy and wind turbines usually have a wide geographic distribution in places where there are not any communication infrastructure [13,19].
Among all wireless solutions in SG applications, wireless sensor network (WSN) is one of the main options in future generation power networks. WSNs are very low cost, scalable with high standards [41,54,55,56]. Indeed, flexible WSNs can be a feasible and economical solution for communication platforms in measurement, monitoring, inspection, and remote sensing tasks in SGs [45]. In [57], the use of wireless sensor network for electrical power systems along with opportunities and challenges had been investigated and a practical evaluation was presented in different environments of the electrical power system. They concluded that with the help of wireless sensor networks, it is possible to identify outages in the power network and manage it before any hierarchical damage on the network. In fact, the real-time recognition of network faults based on WSNs can play a significant role in outage reduction and optimization of related parameters such as System Average Interruption Frequency Index (SAIFI) and System Average Interruption Duration Index (SAIDI). Other research works in the use of wireless sensor networks are available in [54,55,58]. In [54], the implementation of an intelligent monitoring system on more than one wireless sensor network, with particular emphasis on constructing a secure routing infrastructure using routing protocol for low loss power networks was presented. In [56], a closed-loop energy management scheme with a WSN was introduced, which can be used as the network infrastructure of an industrial energy management system. Its importance lies in its high security, intelligence, and low cost hardware.
In [53], three wireless sensor networks named HART, Zigbee, and ISA100.11a were evaluated. All these networks are based on IEEE 802.15.4 standard protocol and available as low-cost industrial options for smart grids. But their applications are limited to low bitrate applications so they are not well fitted to delay-sensitive and high volume data transmission in multimedia applications. Generally, using traditional WSNs in SGs suffers from some restrictions which are listed below:
  • Using overcrowded ISM bands with high delay due to high competition in channel access [59,60].
  • High retransmission rate because of high interference in ISM bands [45,61].
  • Low energy efficiency due to high retransmission [62,63,64].
  • These networks were essentially developed for low data rate applications with low efficiency for multimedia transmission [52].
  • Low spectrum efficiency [65,66].
In contrast to classical sensor networks, it is possible to benefit from cognitive radio networks (CRNs). Cognitive radio (CR) is a very important wireless technology for achieving spectrum efficiency. In CRNs, two networks are defined, the first one named primary networks and the second one called secondary networks. The licensed bound are dedicated to Primary Users (PUs) but Secondary Users (SUs) also can use them with lower priority providing that they are Idle [62,65,67]. Opportunistic usage of unoccupied licensed bands in CRNS can increase the spectral efficiency noticeably. Due to the availability of the licensed band and the possibility of transmission based on multichannel methods, interference will be reduced in large-scale cognitive radio networks [68]. As a result, CRNs are increasingly being developed in both infrastructure-based networks and Ad Hoc/Sensor Networks in recent years [67].
Ref. [69] had studied the performance of the innovative hierarchical modulation based multimedia streaming in CR communication systems with this assumption that imperfect channel sensing on transmission power level and also interference were accessible. In this research, the efficient power control method that can minimize weighted sum of average bit error rates (BERs) of high priority (HP) bits and low priority (LP) bits or its upper bound subject to peak/average transmit power and average interference power constraints was introduced and a low-complexity power control approach was developed. They had achieved closed-form expressions of error probabilities for both HP and LP bits in hierarchical quadrature amplitude modulation (HQAM) over Nakagami-m fading channels under sensing uncertainty. Their focuses were more concentrated on the physical layer (PHY) rather than the MAC layer.
In [70], they introduced a model for multimedia traffic transmission over cognitive radio TDMA networks under secondary collision errors. They used a model based on the redundancy for link maintenance to compensate for any spectrum resource loss due to the primary traffic reclaims. Their model had aimed minimization of the collision effects to increase the Goodput but the system suffers from high complexity.
Among all available and frequently used multimedia formats, JPEG2000 has a lot of practical features that make it a viable choice for CRNs [71]. In [71], a new channel allocation algorithm found on JPEG2000 and OFDM (orthogonal frequency division multiplexing) was introduced, which improved the quality of the SU’s received image by providing dynamic access (DA) to the available spectrum pool, without violating the interference requirement to the PU. The maximization of Signal to Noise Ratio (SNR) was aimed at this work to get higher QoS but it just limited to JPEG2000 standard.
In this work, we also have replaced traditional WSN with Cognitive Radio WSN, so called CRSNs. In the next section, full details of our customized CR-MAC layer for image streaming over smart grids are presented.

3. Proposed MAC Layer for Image Streaming over CRSNs

In multimedia applications, time-bound constraints are very challenging [66,72,73]. In this work, sending an image within the given time should be completed. In the literature, this time is named the maximum allowed time to transfer an image ( D m ). To this end, the time overhead should be minimized. The overhead of transmission can be resulted due to several factors such as propagation delay ( τ P r ), the MAC layer latency ( τ M A C S S ) due to the internal competition of secondary nodes, the delay caused by the spectrum sensing ( τ S p e c t r u m S e n s i n g ) [74,75,76,77,78], the delay caused by the retransmission ( τ R e t r a n s m i s s i o n ), and the delay resulting from Negotiation/Agreement process between two cognitive nodes ( τ N ). Therefore, the total delay can be written as follows:
τ O H = τ P r + τ M A C S S + τ M A C S P
where τ M A C S P is the delay caused by the competition between the secondary and primary nodes to occupancy of channels with an emphasis on the higher priority for the primary network users (PUs). We write it as below:
τ M A C S P = τ S p e c t r u m S e n s i n g + τ R e t r a n s m i s s i o n + τ N
Given the fact that the air interface between the cognitive sensor nodes and the cognitive coordinator are assumed as a short-range line of sight, we assume that the delay caused by the propagation is negligible ( τ P r = 0 ). In addition, based on the assumption that M (the number of cognitive senders with is limited in a cluster and can be even lower than the S which is the number of sub-channels ( M S ), the delay caused by τ M A C S S , also can be ignored. This is one of the assumptions of our proposed model.
In our proposed MAC layer, a Common Channel (CC) is considered for dialogue between the cognitive transmitter and receiver nodes. Each time that a spectrum sensing process is executed, the spectrum pool including the S empty channel can be detected and ranked. Then, the decision that has made on the selected optimal channel ( C j ) along with the sender and receiver identifiers should be delivered to the receiver node. The receiver, subsequently, should whether acknowledge or disapprove it to the sender (based on the channel situation on the receiver side). Since both the number of channels (S) and the number of transmitter nodes (M) are limited, the data needed to conduct the negotiation between two nodes will be negligible in comparison with the massive amount of the video stream ( τ N = 0 ). As a result, we consider the total time delay overhead as follows:
τ O H = τ S p e c t r u m S e n s i n g + τ R e t r a n s m i s s i o n
When a collision occurs in the network, the sender should retransmit its last packets. This reduces the successful transmission probability of an input image within the maximum allowed time window ( D m ). The imposed time overhead due to retransmission depends on the length of the packet has been lost in the last transmission. If the length of the packet is high, the latency will be high (and vice versa), but the important point is that lowering the packet length may reduce the delay due to retransmission, it also means that because of lower packet length it will result in more spectral sensing (SS) iterations. This exactly means that the time span of spectral sensing will increases. Therefore, there should be a tradeoff between the packet length and the number of spectral sensing iterations. In most of the works that have been done, the reduction of the spectrum sensing time window ( T S ) is considered as the main and straight idea to reduce the spectrum sensing overhead time [63,79,80]. The important problem with these methods is that although any decrease in T S may lead to a spectrum sensing overhead reduction, in practice, both P F A and P C D fall and consequently both probability of successful transmission and throughput will decrease [81]. So, in this work, we proposed the idea of Joint Optimizing the Packet Size ( τ P ) and the Number of Spectral Sensing Iterations ( N S S I or X), and we named it JOPSS. In fact, in our proposed JOPSS method, the goal is to minimize the average time spent on retransmission and the spectrum sending sensing time.
For this purpose, the optimal packet size ( τ P ) and the optimal number of spectrum sending iterations ( X * ) are estimated simultaneously based on the proposed model.

3.1. Primary and Secondary Users Behavior Models

In this work, similar to existing works in [68,72,73,82,83], it is assumed that the time distance between PUs arrivals has an exponential distribution with the mean μ i (i is the channel number). Therefore, the arrival of PUs in the channel i has a Poisson distribution at the arrival rate λ i = 1 μ i .
In order to prevent the degradation of the primary network quality of service (QoS), the secondary nodes must perform SS before any transmission, and only send the channel when it is in IDLE state and recheck the status of the current channel during the sending process at specific times. In the case of a primary user arrival, the SU node should execute the handover operation (HO) from the current channel to release the channel capacity for an arriving PU. Additionally, all sensors are assumed to be equipped with a single interfaced module that can be switched between the existing S traffic channels as well as a common channel (CC). Here, it is assumed that the transmitter node always has a stream of images from its camera ready to be sent. Each image frame has I b = r × c × d bits in which r is the number of rows in an input image, c the number of columns, d is the number of sub color channels and n is the depth of the bit (in our simulations, these parameters are considered to be 512, 512, 3, and 8, respectively).

3.2. The Structure of the Proposed Model for the Delay-Sensitive Data Transmission

In delay-sensitive data transmission applications such as image and multimedia communications, time constraints are the most challenging issue. In this work similar to [72,73,83], we have defined D m as the maximum allowable time to send an input image. Therefore, a successful transmission is one that an image packet including I b bits and transmission rate R b are fully transmitted within [ 0 , D m ] .
In our proposed JOPSS method, the goal is to minimize the average time spent on retransmission and spectrum sensing. Given the Equation (3), time overhead τ O H is a function of spectral sensing and retransmission events. Any increase in the packet length may increase the probability of collision in the current channel, so retransmission can occur with a higher probability. Since in the retransmission, the re-larger packets should be transmitted again, the delay may significantly increase. But if the interference does not occur, the longer packet means that the time overhead due to spectrum sensing will be fallen.
On the other hand, a packet length reduction means reducing the possibility of interference. Also in the event of interf erence, smaller packets should be resent, which means that the effect of retransmission in the overhead delay is reduced. But unfortunately, in this case, the time overhead due to spectrum sensing is much greater than before because of calling the process in shorter times. Therefore, if similar to the existing work in this field, only the packet length is defined as the optimization variable, it will not satisfy the high performance needed. For this purpose, we jointly extract the optimal packet length ( ( τ P i ) * ) and the number of spectral sensing iterations ( X * o r N S S I ) in our proposed model. Finally, we use the peak signal-to-noise ratio (PSNR) criterion in the receiver to evaluate the quality of receiving images. Table 3 lists all parameters of the proposed MAC layer model with their descriptions. In our model, τ P i is the packet length in i’th channel, and taking into account the time T s as a SS time, the time required to send each packet will be equal: t P i = τ P i + T s

3.3. The Average Time Overhead Due to Retransmission

To estimate the average time overhead due to the retransmission, the user arrival model must be applied. Considering the Poisson arrival model with the arrival rate λ p for primary users and subsequently taking into account the time interval exponential distribution, the probability function P ( X i x ) is expressed in terms of the following Equations (4) and (5) [60,72,84,85]:
P { X i x } = L i x , x = 0 , 1 , 2 , X L i = L i 1 = ( 1 P f ) e λ i t P i
So it can be written as Equation (5) [60,72,84,85]:
P { X i = x } = L i x L i x + 1 x < X L i x x = X
If we have X i transmissions is in the i’th channel, then the Actual Transmission Time in the channel t A T T i , is equal to X i t P i that we should have: t A T T i D m and t A T T i τ I where τ I is the time it takes to transfer I b bits at the rate R b in an ideal channel. Given the Equation (3), we want to evaluate the weights of both parameters T s and τ P i on the total overhead time. For this purpose, we consider the probability function P A r P U , X ( X i ) as the probability of a secondary user arrival in X i t h iterations:
P A r P U , X ( X i ) P ( X X i ) = ( 1 P f a ) X i e x p ( λ i X i ( τ P i + T S ) )
Based on this definition, if a PU arrival does not occur during the sending of the packet, the time overhead on the channel is just related to the spectrum sensing and will be equal to X i T s while if the new spectrum sensing process detects a PU arrival into the existing channel “i”, then the last packet will need to be retransmitted. The latency in this state is equal to X i T s + τ P i . According to the presented description, the overhead time of spectrum sensing and retransmission for the current channel can be modeled as follows:
τ O H i = ( X i T s + τ P i ) P A r P U , X ( X i ) + ( X i T s ) ( 1 P A r P U , X ( X i ) )
With consideration P A r P U , X ( X i ) = g ( t P i , X i , λ i , P f a , T S ) we have τ O H i = X i T s + τ p i g ( t P i , X i , λ i , P f a , T S ) .
Now, we should estimate the average of time overhead:
E ( τ O H i ) = E ( X i ) T s + τ P i E ( g ( t P i , X i ; λ i , P f a , T S ) )
According to the Equation (8), we need to extract the relationships for E ( X i ) and E ( g ( t P i , X i , λ i , P f a , T S ) ) . In the following, we find the mathematical equation for E ( X i ) :
E ( X i ) = x = 0 X x p { X i = x } = x = 0 X 1 x ( L i x L i x + 1 ) + X L i X = X L i X + x = 0 X 1 x L i x ( 1 L i ) = X L i X + ( 1 L i ) x = 0 X 1 x L i x x = 0 X 1 x L i x = L i 1 X L i X 1 + ( X 1 ) L i X ( 1 L i ) 2 x = 0 X x p { X i = x } = X L i X + ( 1 L i ) ( L i 1 X L i X 1 + ( X 1 ) L i X ( 1 L i ) 2 ) = 1 ( 1 L i ) ( X L i X ( ( 1 L i ) ) + L i X L i X + X L i X + 1 L i X + 1 ) = 1 ( 1 L i ) ( X L i X X L i X + 1 + L i X L i X + X L i X + 1 L i X + 1 ) = 1 ( 1 L i ) ( L i L i X + 1 ) = L i ( 1 L i X ) ( 1 L i )
So we can write Equation (9):
E ( X i ) = x = 0 X x p { X i = x } = L i ( 1 L i X ) 1 L i
Then, we continue to fine the E ( g ( t P i , X i , λ i , P f a , T S ) ) :
E ( g ( τ P i , X i ; λ i , P f a , T S ) ) = E ( L i X ) = x = 0 X 1 L i x ( L i x L i x + 1 ) x = 0 X 1 L i x ( L i x L i x + 1 ) = 1 ( 1 L i ) + + L i X 2 ( L i X 2 L i X 1 ) + L i X 1 ( L i X 1 L i X ) = 1 L i + L i 2 L i 3 + + L i 2 X 4 + L i 2 X 3 + L i 2 X 2 + L i 2 X 1 x = 0 2 X 1 ( 1 ) x L i x = x = 0 X 1 L i 2 x ( 1 L i ) = ( 1 L i ) x = 0 X 1 L i 2 x = ( 1 L i ) 1 ( L i 2 ) X 1 + 1 1 L i 2 = 1 L i 2 X 1 + L i
Now, we can write Equation (10):
E ( g ( t P i , X i ; λ i , P f a , T S ) ) = E ( L i X ) = 1 L i 2 X 1 + L i
Ultimately, based on all proofed formulas from Equations (8)–(10), we demonstrate our extracted Equation (11):
E ( τ O H i ) = L i ( 1 L i X ) ( 1 L i ) T S + τ P i 1 L i 2 X 1 + L i , L i = L i 1 = ( 1 P f ) e λ i t P i
As a result, we have achieved the important formula that describes weights of both SS and Retransmission on the time overhead. These weights are L i ( 1 L i X ) ( 1 L i ) , and 1 L i 2 X 1 + L i for them, respectively. In Figure 2, assuming the fixed number of the spectral sensing iterations ( N S S I = X = 3 ), the curve of the mean time overhead ETOH = E ( τ O H i ) due to the retransmission and the spectral sensing, is plotted in terms of the packet length ( τ p i ). As this figure, the average amount of overhead is low for small values of packet time ( τ p i ). The reason is that the smaller τ p i is equivalent to the more frequent spectrum sensing. Therefore, the time overhead will be more due to the spectrum sensing. Now, if its value goes up from the minimum point at τ p i = 0.023 s, the time interval between spectral sensing runs will increase but in the case of interference, it means that a longer-length packet should be retransmitted. Thus, increasing the packet size can magnify weigh of retransmission side effects on the total time overhead in comparison to the SS.
In the following, Figure 3 shows the effect of variations X on the value of E ( τ O H i ) . In this figure, with the assumption that the packet length is constant ( τ p i = 0.001 s), increasing X will lead to an increase in the average time overhead.
In the following, we plan to examine the effect of variations in the SS time on the mean time overhead. As shown in Figure 4 and Figure 5, when T S is increased the average overhead time will be increased as well.

3.4. Defining the Average Effective Transmission Time

In the following, we intend to estimate the average Effective Transmission Time (ETT), E ( τ E T T i ) . For this purpose, we first define τ E T T i in the same way according to the Equation (12):
τ E T T i = ( X i τ P i ) P A r P U , X ( X i ) + ( X i 1 ) ( τ P i ) ( 1 P A r P U , X ( X i ) )
With a little simplicity we can write the Equation (13):
τ E T T i = ( X i τ P i ) P A r P U , X ( X i ) + X i τ P i X i τ P i P A r P U , X ( X i ) τ P i + τ P i P A r P U , X ( X i ) = X i τ P i τ P i ( 1 P A r P U , X ( X i ) )
The average packet transmission time E ( τ E T T i ) should now be computed based on the Equation (14):
E ( τ E T T i ) = E ( X i ) τ P i τ P i ( 1 E ( g ( τ P i , X i , λ i , P f a , T S ) ) )
Using the extracted Equations (9), (10), (13) and (14) we can note the Equation (15) as below:
E ( τ E T T i ) = L i ( 1 L i X ) ( 1 L i ) τ P i τ P i ( 1 ( 1 L i 2 X ) ( 1 + L i ) ) = τ P i ( ( 1 L i X ) ( 1 L i ) ( L i L i 2 X ) ( 1 + L i ) )

3.5. Proposed Objective Function

It is desirable to E ( τ E T T i ) be maximized so that the transmitter node has the highest transmission in the current channel. However, the system’s performance must be such that the average time overhead E ( τ O H i ) is also minimized. In order to jointly maximize E ( τ E T T i ) and minimize E ( τ O H i ) , we define the objective function f as a ratio of these two functions as indicated in Equation (16):
f = E ( τ O H i ) E ( τ E T T i ) m i n ( f ) = m i n ( E ( τ O H i ) E ( τ E T T i ) )
So we can write Equation (17):
E ( τ O H i ) E ( τ E T T i ) = L i ( 1 L i X ) ( 1 L i ) T S + τ P i 1 L i 2 X 1 + L i τ P i ( ( 1 L i X ) ( 1 L i ) L i + L i 2 X 1 + L i )
By replacing the Equations P f * = ( 1 P f ) and L i = ( 1 P f ) e λ i t P i applying the constraints related to the problem variables, the final mathematical presentation of our proposed optimization model is obtained as follows:
m i n ( E ( τ O H i ) E ( τ E T T i ) ) = m i n ( P f * e λ i t P i ( 1 ( P f * e λ i t P i ) X ) ( 1 P f * e λ i t P i i ) T S + τ P i ( 1 ( P f * e λ i t P i ) 2 X ) 1 + P f * e λ i t P i i τ P i ( ( 1 ( P f * e λ i t P i X ) ( 1 P f * e λ i t P i i ) P f * e λ i t P i i + ( P f * e λ i t P i ) 2 X 1 + P f * e λ i t P i ) ) P f * = ( 1 P f ) S . t : ( 1 ) t b τ P i D m , ( 2 ) 1 X [ D m T S + t b ] , ( 3 ) X ( τ P i + T S ) D m ( 4 ) X ( τ P i ) τ I .
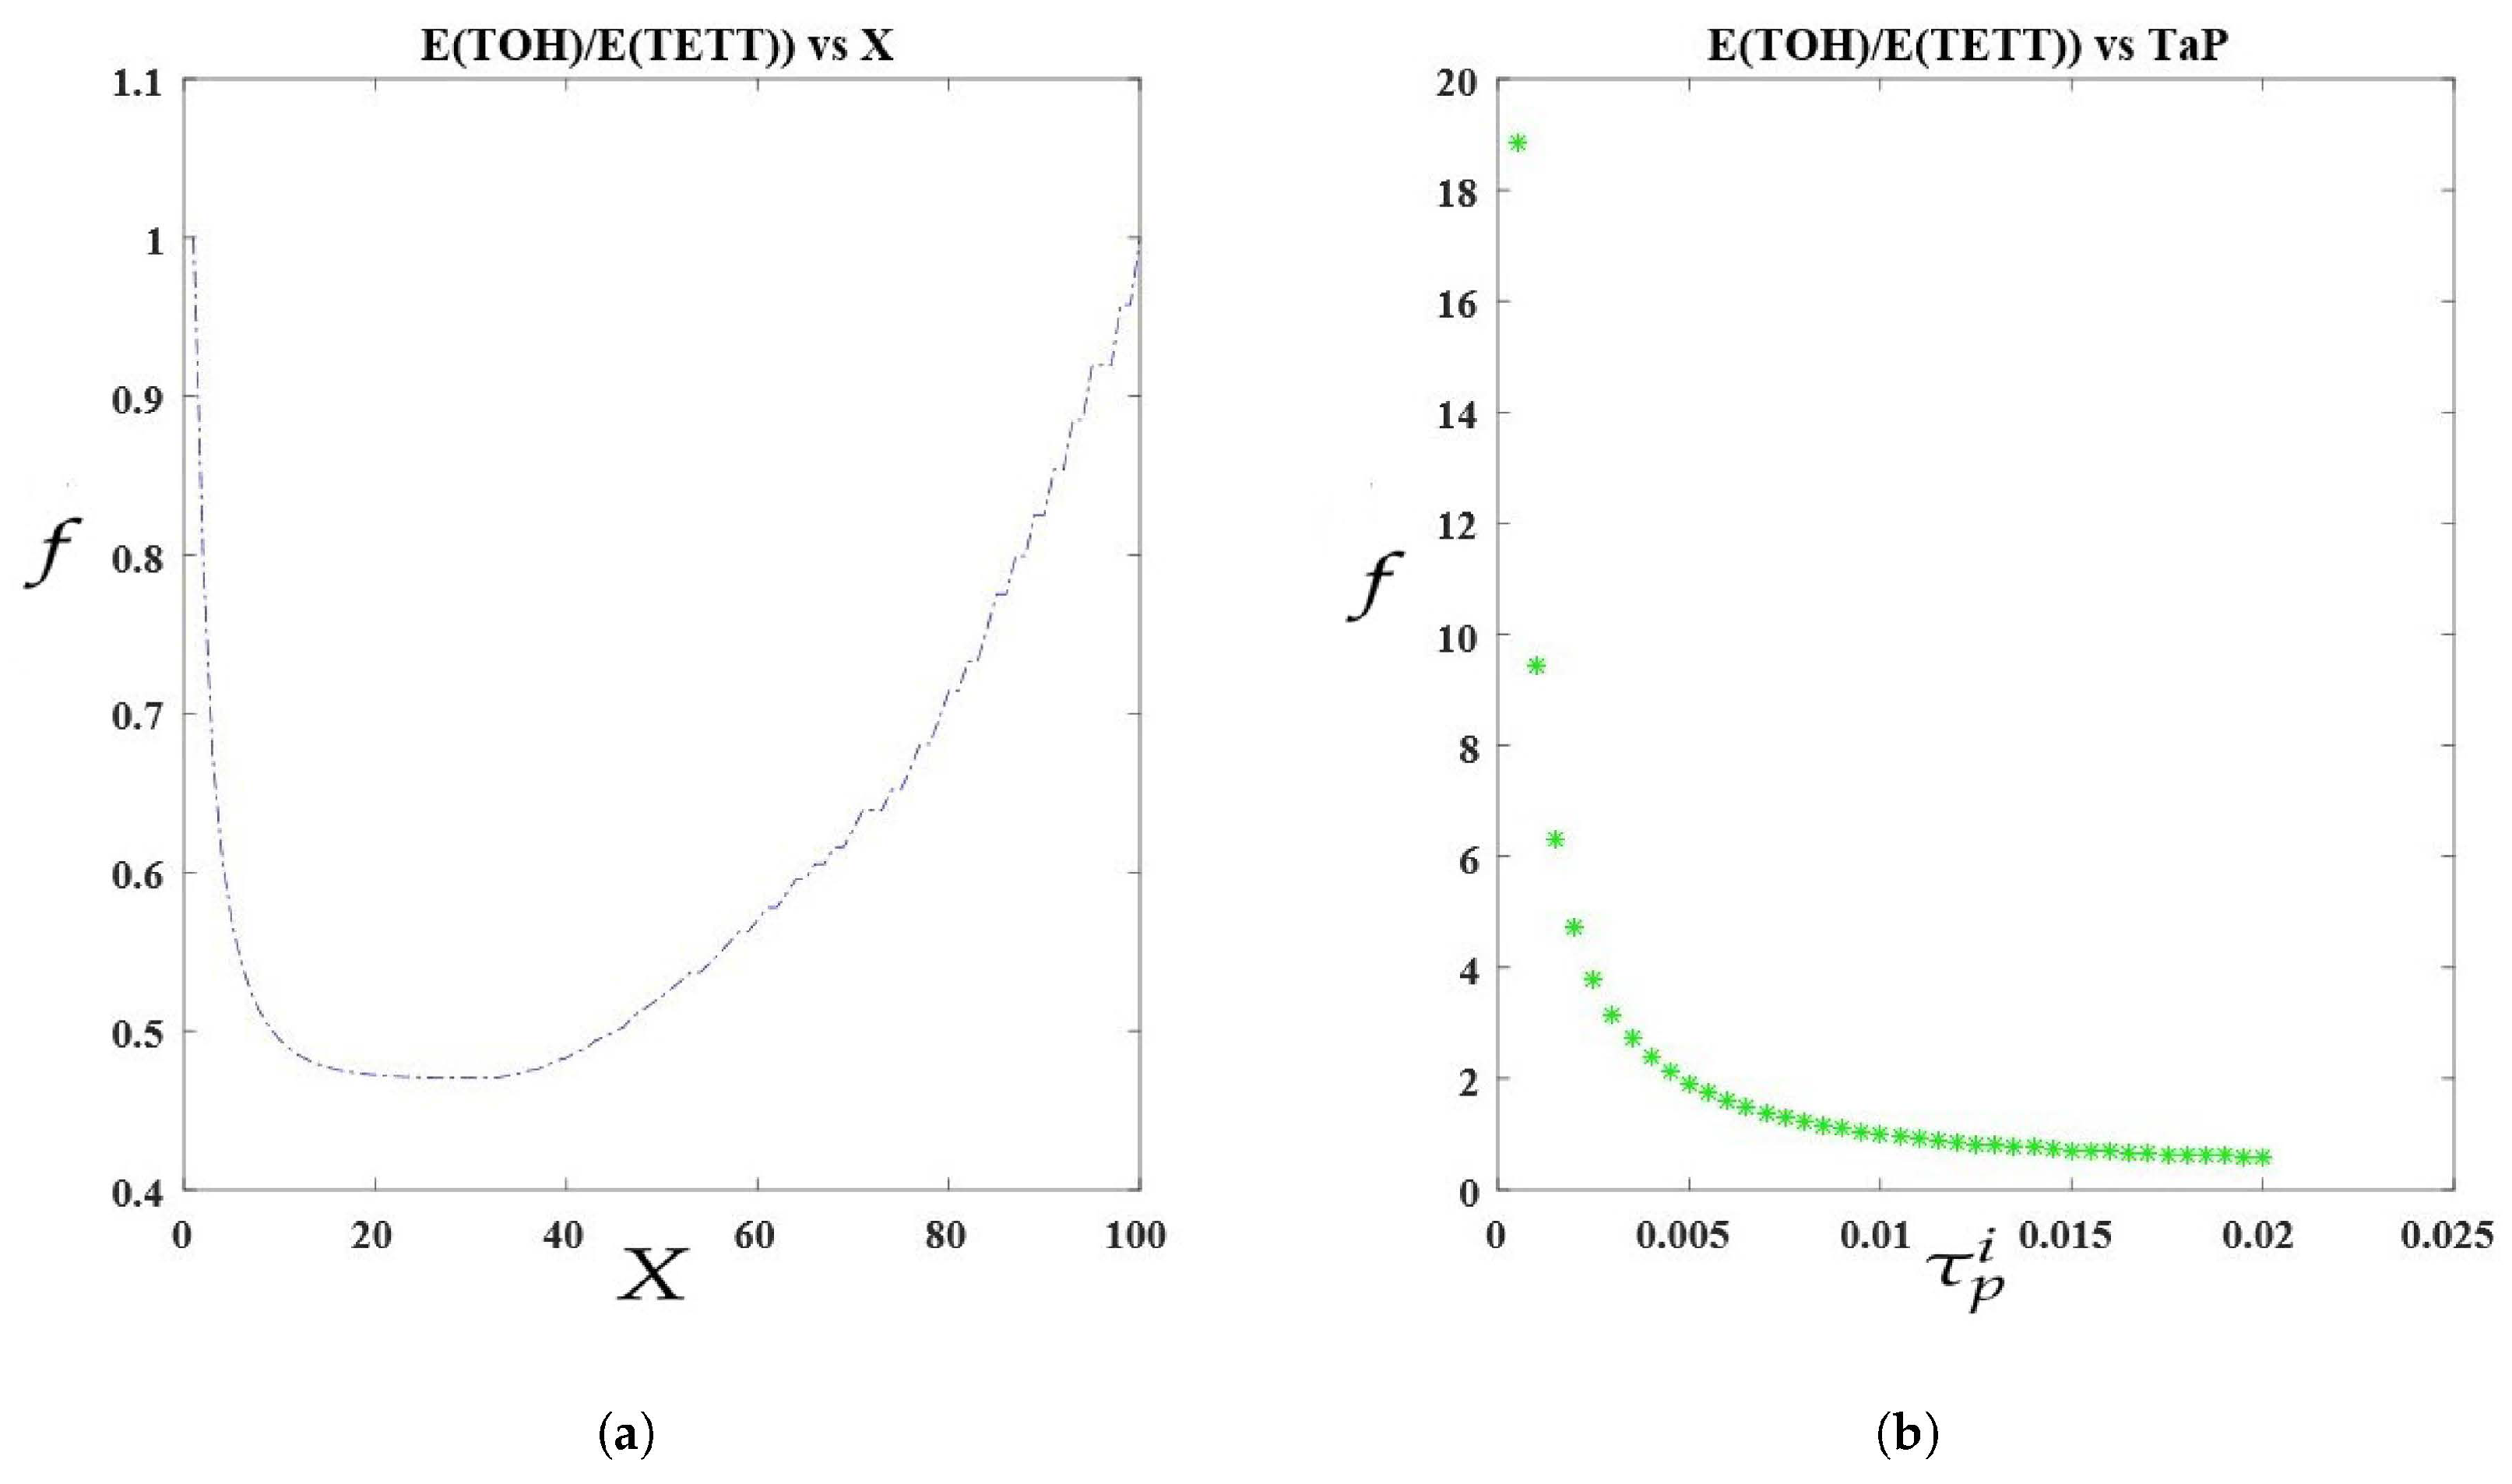
In the following, Figure 6 shows the changes of E ( τ O H i ) / E ( τ E T T i ) in terms of X and τ p i in two subfigures with considering all parameters and restrictions in the Equation (18).

3.6. The Proposed Algorithm for Delay-Sensitive Data Transferring

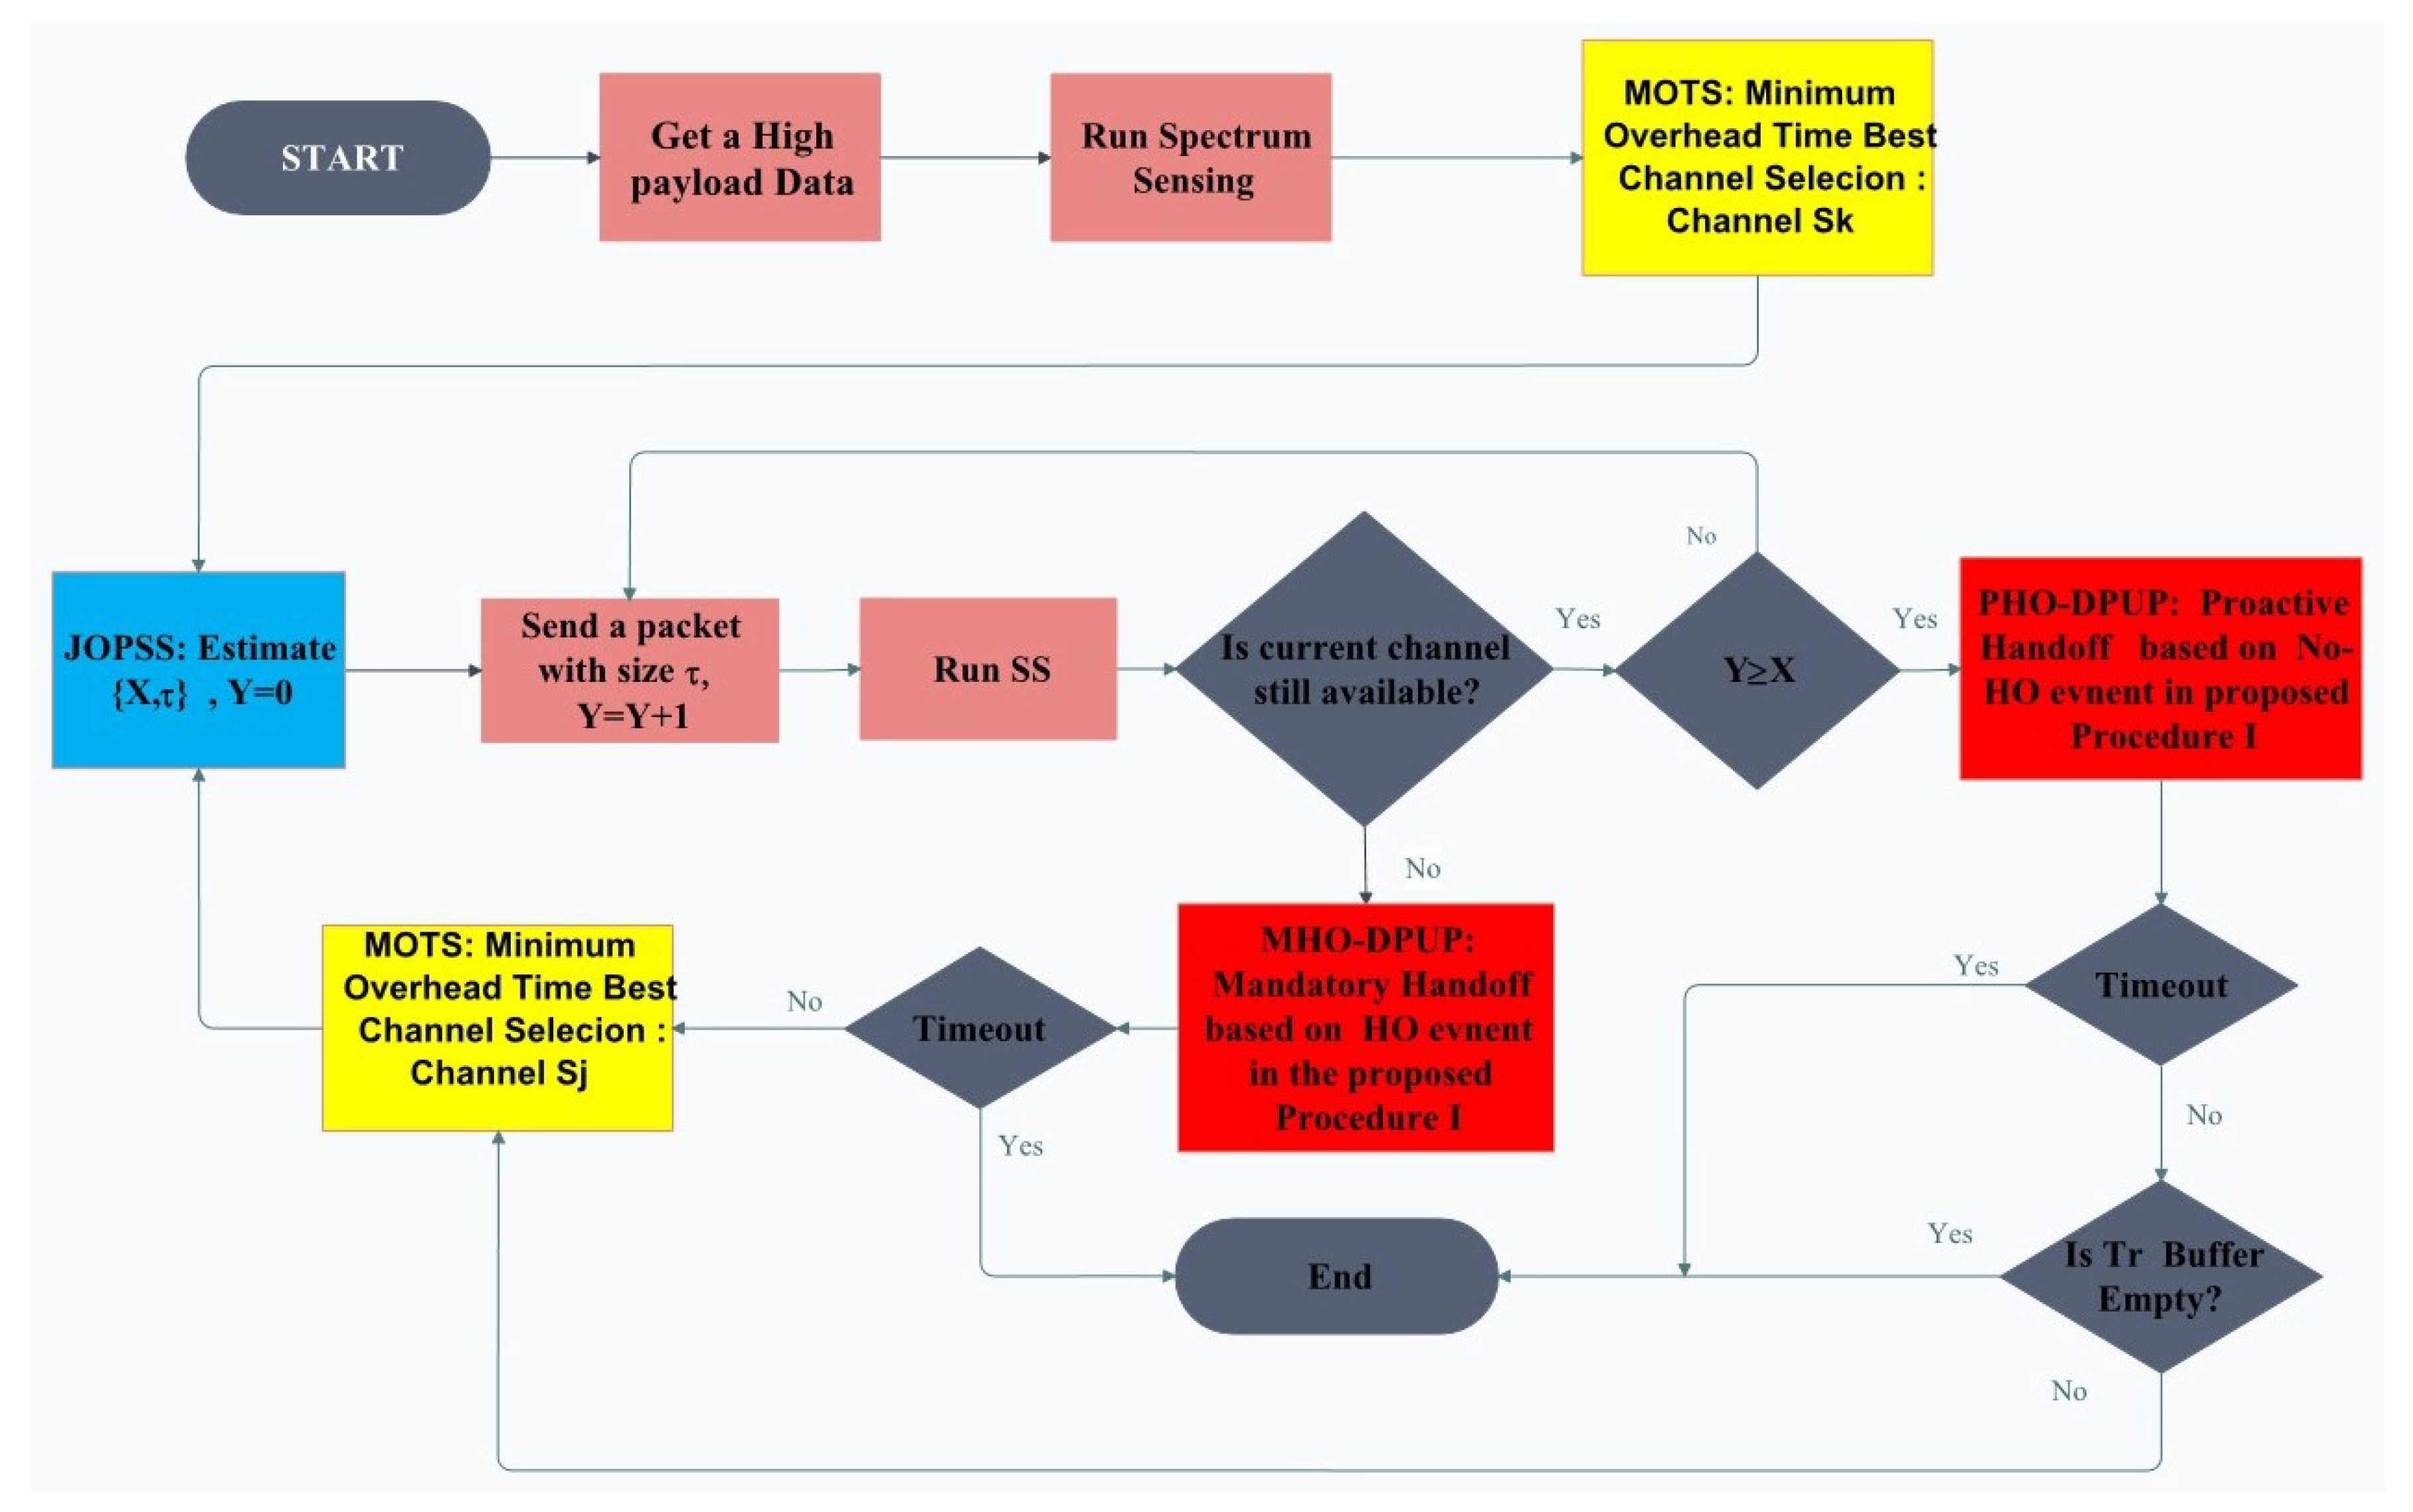
By solving the proposed Equation (18), unknown variables { X * , ( τ p i ) * } can be estimated by the transmitter node. Then it considers the length of its packet to be equal ( τ p i ) * and sends it. After that, it runs the SS again to check the status of the current channel. If the channel is still free, it will send the second packet with the same time. This procedure can be continued until completing ( X * ) th packet transmissions (providing that no arrival occurred during the transmission time). At that time, the transmitter node attempts to release the current channel and switch to a new alternative channel, even if the current channel is Empty. This is called Proactive Hand Off or PHO. If the current channel has been occupied by the user before the actual X * transmission, then an HO should be made in a reactive or mandatory manner (MHO). In the following, our mentioned algorithm is well presented in Figure 7.
In the proposed model, to reduce the computational overhead, the operation of updating the model parameters is defined in accordance with the following two specific events: PHO and MHO. We have named our proposed Dynamic Parameter Updating Procedure as DPUP method and its details are given in the Algorithm 1.
Algorithm 1.DPUP
i f P r o a c t i v e H a n d o f f ( P H O ) o c c u r e d :
       i f τ I ( n e w ) > 0 & & D m a x ( n e w ) > 0
            C h a n n e l C o n d i t i o n :
           i j
           i = C u r r e n t C h a n n e l    
           j = N e x t C h a n n e l , a n d i j
           M a x i m u m T o l e r a b l e D e l a y :
           D m a x ( n e w ) D m a x ( n e w ) = D m a x ( o l d ) X ( τ P i + T S )
           τ I ( n e w ) = τ I ( o l d ) X ( τ P i )
        E n d
e l s e i f M a n d a t o r y H a n d o f f ( M H O ) o c c u r e d :
        i f τ I ( n e w ) > 0 & & D m a x ( n e w ) > 0
           C h a n n e l C o n d i t i o n :
           i j
           i = C u r r e n t C h a n n e l
           j = N e x t C h a n n e l a n d i j
           M a x i m u m T o l e r a b l e D e l a y :
           D m a x ( n e w ) D m a x ( n e w ) = D m a x ( o l d ) Y ( τ P i + T S )
           τ I ( n e w ) = τ I ( o l d ) ( Y 1 ) ( τ P i )
        E n d
E n d

3.7. The Proposed Method for Channel Ratings and Optimal Channel Selection: MOST

At the sender node, before sending the packet with an estimated length ( τ p i ) * , the MAC layer submits the request for the SS process to the physical layer. Here, it is assumed that the S S module in the physical layer is based on the energy detection approach (ED). Assuming AWGN channel, the received signal in the receiver in the case that channel is busy by a S U ( H 1 mode) is y ( n ) = s ( n ) + w ( n ) . If there is no sending ( H 0 mode), the observed signal in the channel will be y ( n ) = w ( n ) . In this regard, w ( n ) is the Additive White Gaussian Noise (AWGN) with a zero mean and variance σ w 2 . In the ED spectrum sensing method, N samples are gathered from the channel, then the decision criterion M is calculated as the energy of the recorded samples ( M = n = 1 N | y ( n ) | 2 ) . To evaluate the performance of the energy detector, two probabilities are used: P d (probability of detection) and P f (probability of false alarms). These two probabilities are defined as follows:
P d = P r ( M > λ E | H 1 )
P f = P r ( M > λ E | H 0 )
In this work, we consider P d = 1 and P f = 0.01 . When the physical layer performs spectral sensing based on energy detection, assuming that the channel is not saturated, S empty channels (not occupied by the primary users) are detected. In order to insure the channel not to be saturated and to provide service to secondary users, we need to have M τ o n < S ( τ o n + τ o f f ) , where M is the number of primary users ( P U s ). P U s traffic is expressed by an exponential distribution with arrival rate λ i , average ON state τ o n and OFF state τ o f f . Additionally, the sender sensor node is assumed to be equipped with a single interface module that can switch opportunistically between the S traffic channel and also a CC common control channel. In order to increase the efficiency of the communication channel, the sender sensor node should have the ability to rate this S channel and select the best sub-channel for sending. To this end, we propose the following method in which the channel with the minimum overhead time E ( τ O H J ) is selected as the best channel. We named this channel selection method as MOTS (Minimum of Overhead Time Selection).
E ( τ O H J ) = P f * e λ J t P J 1 ( P f * e λ J t P J ) X 1 P f * e λ J t P J T S + τ P J 1 ( P f * e λ J t P J ) 2 X 1 + P f * e λ J t P J , J = 1 , 2 , 3 , , S
In this way, the optimal sub-channel ( J * ) ( 1 ) is achieved using Equation (22):
( J * ) ( 1 ) = A r g m i n ( E ( τ O H J ) ) , S = { 1 , 2 , 3 , , s } J S
Subsequently, the second optimal sub-channel is also obtained found on the Equation (23):
( J * ) ( 2 ) = A r g m i n ( E ( τ O H J ) ) , J S & J ( J * ) ( 1 )
The rest channels of the pool are ranked accordingly based on the proposed method. As a result, the transmitting node has knowledge about all available channels with their priorities ( { ( J * ) ( 1 ) , ( J * ) ( 2 ) , ( J * ) ( s ) } ) . The obtained data is named Sorted Channels Information (SCI). In fact, the proposed algorithm tries to enhance the system performance by engaging the channel with the least average time overhead.

3.8. Channel Negotiation Process between the Sender and Receiver

Another problem that still remains is that the sender cannot decide alone on the final channel because the peer receiver does not necessarily have access to all of these detected channels ( { ( J * ) ( 1 ) , ( J * ) ( 2 ) , ( J * ) ( s ) } ) . To solve this problem, the architecture of the proposed MAC layer has been designed so that S U s can use the common control channel ( C C C ) to create an agreement (between a pair of secondary transmitter and receiver) on one of the available S traffic channels which were listed before. This MAC algorithm is deployed to solve this problem in order to negotiate the final traffic channels between S U s . With these explanations, the proposed channel negotiation mechanism is abstracted as follows:
  • The node n T x who has the data to be sent in its transmission buffer implements the spectrum measurement algorithm and finds the best empty traffic channels, S C I = { ( J * ) ( 1 ) , ( J * ) ( 2 ) , ( J * ) ( s ) } , in accordance with the proposed algorithm.
  • n T x is set up on the common control channel ( C C C ) and measures the carrier. If it is busy, it runs the backoff mechanism and waits for a random time.
  • After finding out the idle channel, it waits for the completion of the distributed inter frames space so called DIFS interval. Then, it attempts to send the “request to send beacon” ( C R T S ) . In C R T S , in addition to transmitter and receiver identifiers ( n T x I D a n d n R x I D ) , information on spectral sensing and S C I = { ( J * ) ( 1 ) , ( J * ) ( 2 ) , ( J * ) ( s ) } with the header H and footer F are sent as follows:
     H  n T x I D n R x I D  SCI  F 
  • While the receiver node, n R x , completes receiving the C R T S beacon signal, it begins to inspect its channel access status which can take T S seconds. After this time, the node n R x will gain the necessary information about the current status of the channel from its point of view. Now, with applying the MOTS algorithm, it is capable to select the best available channel, ( J * ) ( k ) , which is in common with the peer sender ( n T x ) .
  • To confirm the channel availability, n R x should send the C C T S beacon to the n T x after the expected time, so named short interframe space (SIFS ). The C C T S is defined as below:
     H  n R x I D n T x I D ( J * ) ( k )  ack  F 
    Now, it should adjust all initiations needed for the ( J * ) ( k ) channel.
  • When the node n T x receives the C C T S from the n R x , it also will tune itself to the admitted channel ( ( J * ) ( k ) ) .
  • At this moment, both the sender and receiver nodes have been set up on the negotiated channel, ( J * ) ( k ) , for data transmission. At the final step, n T x waits for DIFS and then it will transmit its data frame with length ( τ P i ) * with X * iterations (recalling the description given in the previous section) on the admitted channel ( ( J * ) ( k ) )
According to the described procedure, the negation time between two nodes, τ n , can be written as below:
τ n = t D I F S + t R T S + T s + t S I F S + t C T S + t D I F S
Due to the fact that the number of channels and the number of secondary users are limited, the CTS and RTS frames will have only a few bytes of data. On the other hand, the DIFS and SIFS frames are also very small, therefore in comparison with very large image data, it can be discarded. Subsequently, in this work, we did not consider the overhead of negation in our model.

3.9. Performance Evaluation Metric for the Proposed Image Transmission Model

There are a lot of image processing approaches to enhance quality of images and videos [32,86,87,88,89,90] but at the first, its metric should be defined. Now, well-known metrics for assessing the quality of images and videos are VQM (Video quality measurement), PVQM (Perceptual video quality measure), MPQM (Moving picture quality metrics), SSIM (Structural Similarity Index), MSSIM (Mean SSIM), FSIM (feature-similarity), PSNR (Maximum signal to noise ratio), and HVS (human visual system) [85,91,92,93]. Human Visual System (HVS) based techniques for IQ assessments (IQA) take benefit of some known characteristics of Human Visual System in order to incorporate perceptual image quality metrics (IQM). In [94], Venkata et al. developed a Distortion Measure (DM) and a Noise Quality Measure(NQM) for quantifying the effect of frequency distortion and noise injection on the HVS. Universal Quality Index (UQI) was introduced also to perform image similarity measurement successfully across distortion types. The main problem for these methods is that these are time consuming methods that strongly depend on human expert expertise and may vary from one to another.
Quality of image (IQ) is usually assessed using image quality metrics such as SSIM, HVS, MSSIM and FSIM along with PSNR and MSE but unfortunately, most of used metrics cannot describe the visual quality of the enhanced digital image adequately. Even though a number of image enhancement techniques are available, development of a quantitative enhancement measure suitable for all types of images, is still a challenging area and newer metrics are being thought of every day [93,95]. In fact, there is no universal measure, which specifies both the objective and subjective validity of the enhancement for all types of images [93].
In compression and transmission of digital images, sometimes very least changes may be desired and some famous metrics such as PSNR, MSE, and etc. are deployed widely as quantitative and public metrics for evaluating the amount of image signal distortion with respect to the given (original) image. Despite the multiplicity of quality measurements of images, the PSNR method is still used as the dominant method due to the ease of implementation and the frequency of deployment in other works [84,85]. Therefore, similarly, PSNR has been used mainly in our paper to measure the performance of the proposed system for transmitting images via cognitive radio networks but some others are also evaluated.
To calculate the PSNR, the average squared error must first be calculated. For this purpose, with the image stored in the transmitter buffer, I S e n d e r ( x , y ) , as well as the final received image at the receiver, I R e c e i v e r ( x , y ) , we can calculate the mean squared error (MSE) using the Equation (25):
M S E = 1 r × c j = 1 c i = 1 r | I S e n d e r ( i , j ) I R e c e i v e r ( i , j ) | 2
Now, with the calculated MSE, the maximum signal-to-noise ratio (PSNR) is obtained from the Equation (26):
P S N R = 10 L o g 10 ( 2 n 1 ) 2 M S E = 10 L o g 10 ( 2 n 1 ) 2 10 L o g 10 M S E = 6 N 10 L o g 10 M S E
where in the last equation, n is the depth of the bit. In this work, along with the PSNR, we also used the visual Error Energy (EE) criterion. The error energy is actually an image whose pixels are absolute difference between the pixels in corresponding channels in the transmitted and received images. This criterion provides an appropriate visual presentation of the quality of received images.

3.10. The Proposed Method to Improve the PSNR: SAFE Method

In the proposed MAC model, we urge to minimize the average time overhead due to both spectral measurement and retransmission. With this aim, the probability of successful transmission of an image within the allowed time domain ( [ 0 , D m a x ] ) can be raised. If arrival rates of the PUs increase, the probability of collision will be higher. In this condition, retransmission of packets also enlarges and consequently, the number of iterations that needed for spectral sensing goes up. This means that some parts of the image, where were saved in the sending buffer, do not get the opportunity to be sent. In this case, depending on what extent the packet loss rate (PLR) is, the amount of PSNR can be greatly reduced. Zero-padding is an approach that the receiver runs when data loss occurs in the receiving image. Although there are several methods such as filtering and smoothing the image to increase the PSNR, in this case in which multiple consecutive rows of input image were lost, they are not effective approaches. Here, conventional methods not only are not effective but also they can even lead to further reduction of the PSNR. To improve PSNR, our proposed algorithm which is called Scrambling and Filtering based Enhancement (SAFE) is added to solve the issue at the sender instead of the receiver. So, we first rearrange all the pixels within the image in the transmitter before sending it. After receiving the image in unordered pixels, we reconstruct it and apply a 3 × 3 smoothing filter to make it smoother. The proposed algorithm is as follows in Algorithm 2.
Algorithm 2. SAFE
1.   Get    an    Input    Image:
I S e n d e r = { I R e d , I G r e e n , I B l u e } w i t h r × c p i x e l s   
2. A p p l y T r a n s m i s s i o n F u n c t i o n T g ( x , y ) :
I ^ = T g ( x , y ) { I ( x , y ) }
S p l i t I ^ t o { I ^ R e d , I ^ G r e e n , I ^ B l u e }   
3. R e a r r a n g e m e n t o f I ^ t o m a k e D S :
D S = { [ I ^ R e d ( R o w 1 ) , I ^ G r e e n ( R o w 1 ) , I ^ B l u e ( R o w 1 ) ]
[ I ^ R e d ( R o w 2 ) , I ^ G r e e n ( R o w 2 ) , I ^ B l u e ( R o w 2 ) ]
[ [ I ^ R e d ( R o w r ) , I ^ G r e e n ( R o w r ) , I ^ B l u e ( R o w r ) ] }
Now, having data available to send, the transmitter runs SS and selects the best channel calling the proposed MOTS method. Then, it recalls the proposed JOPSS method to choose the optimal values for both packet length of and number of iterations, { X * , ( τ P i ) * } , simultaneously. The transmitter gets D S , splits it to multiple frames with ( τ P i ) * size and sends X * packets with this size. The procedure will be continued until the transmission of the last bit before the timeout event.
In the receiver, D S * is received and it will be ideally D S * = D S , but due to interference and the timeout, some pixels were missed. The receiver is capable to make the image ( I ^ ) * from D S * and reconstructing the image I S e n d e r * by applying the transfer function T g ( x , y ) 1 to the obtained image ( I ^ ) * :
I S e n d e r * = T g ( x , y ) 1 { ( I ^ ) * }
Ultimately, the receiver can interpolate and modify the amount of each pixel with 8 adjacent pixels by applying a 3 × 3 smoothing filter. Found on the proposed SAFE method, the consecutive rows of black pixels, which resulted from zero-padding the last sub channel of the image due to missed data, are distributed in all sub channels (instead of just one channel). As a result, a noticeable improvement can be achieved. More details are discussed in Section 4.

4. Simulations and Results

In Section 3, our constructive MAC layer was presented for streaming images in time-restricted applications. In this section, experimental results achieved in our implementations using MATLAB are demonstrated.

4.1. Simulation of the Proposed JOPSS Model

This section examines the performance of the proposed cognitive radio MAC layer for transmitting the image of a thermal camera on a wind farm. For this purpose, the parameters of the model described in Section 3 have been initialized as T S = 0.01 s, D m = 1 s, S = 1, and I b = 6 , 291 , 456 bit. Now, we increase the arrival rate from 2 arrivals per second (APC) to 40 APC ( λ i = [ 2 , 5 , 10 , 20 , 40 ] ) .
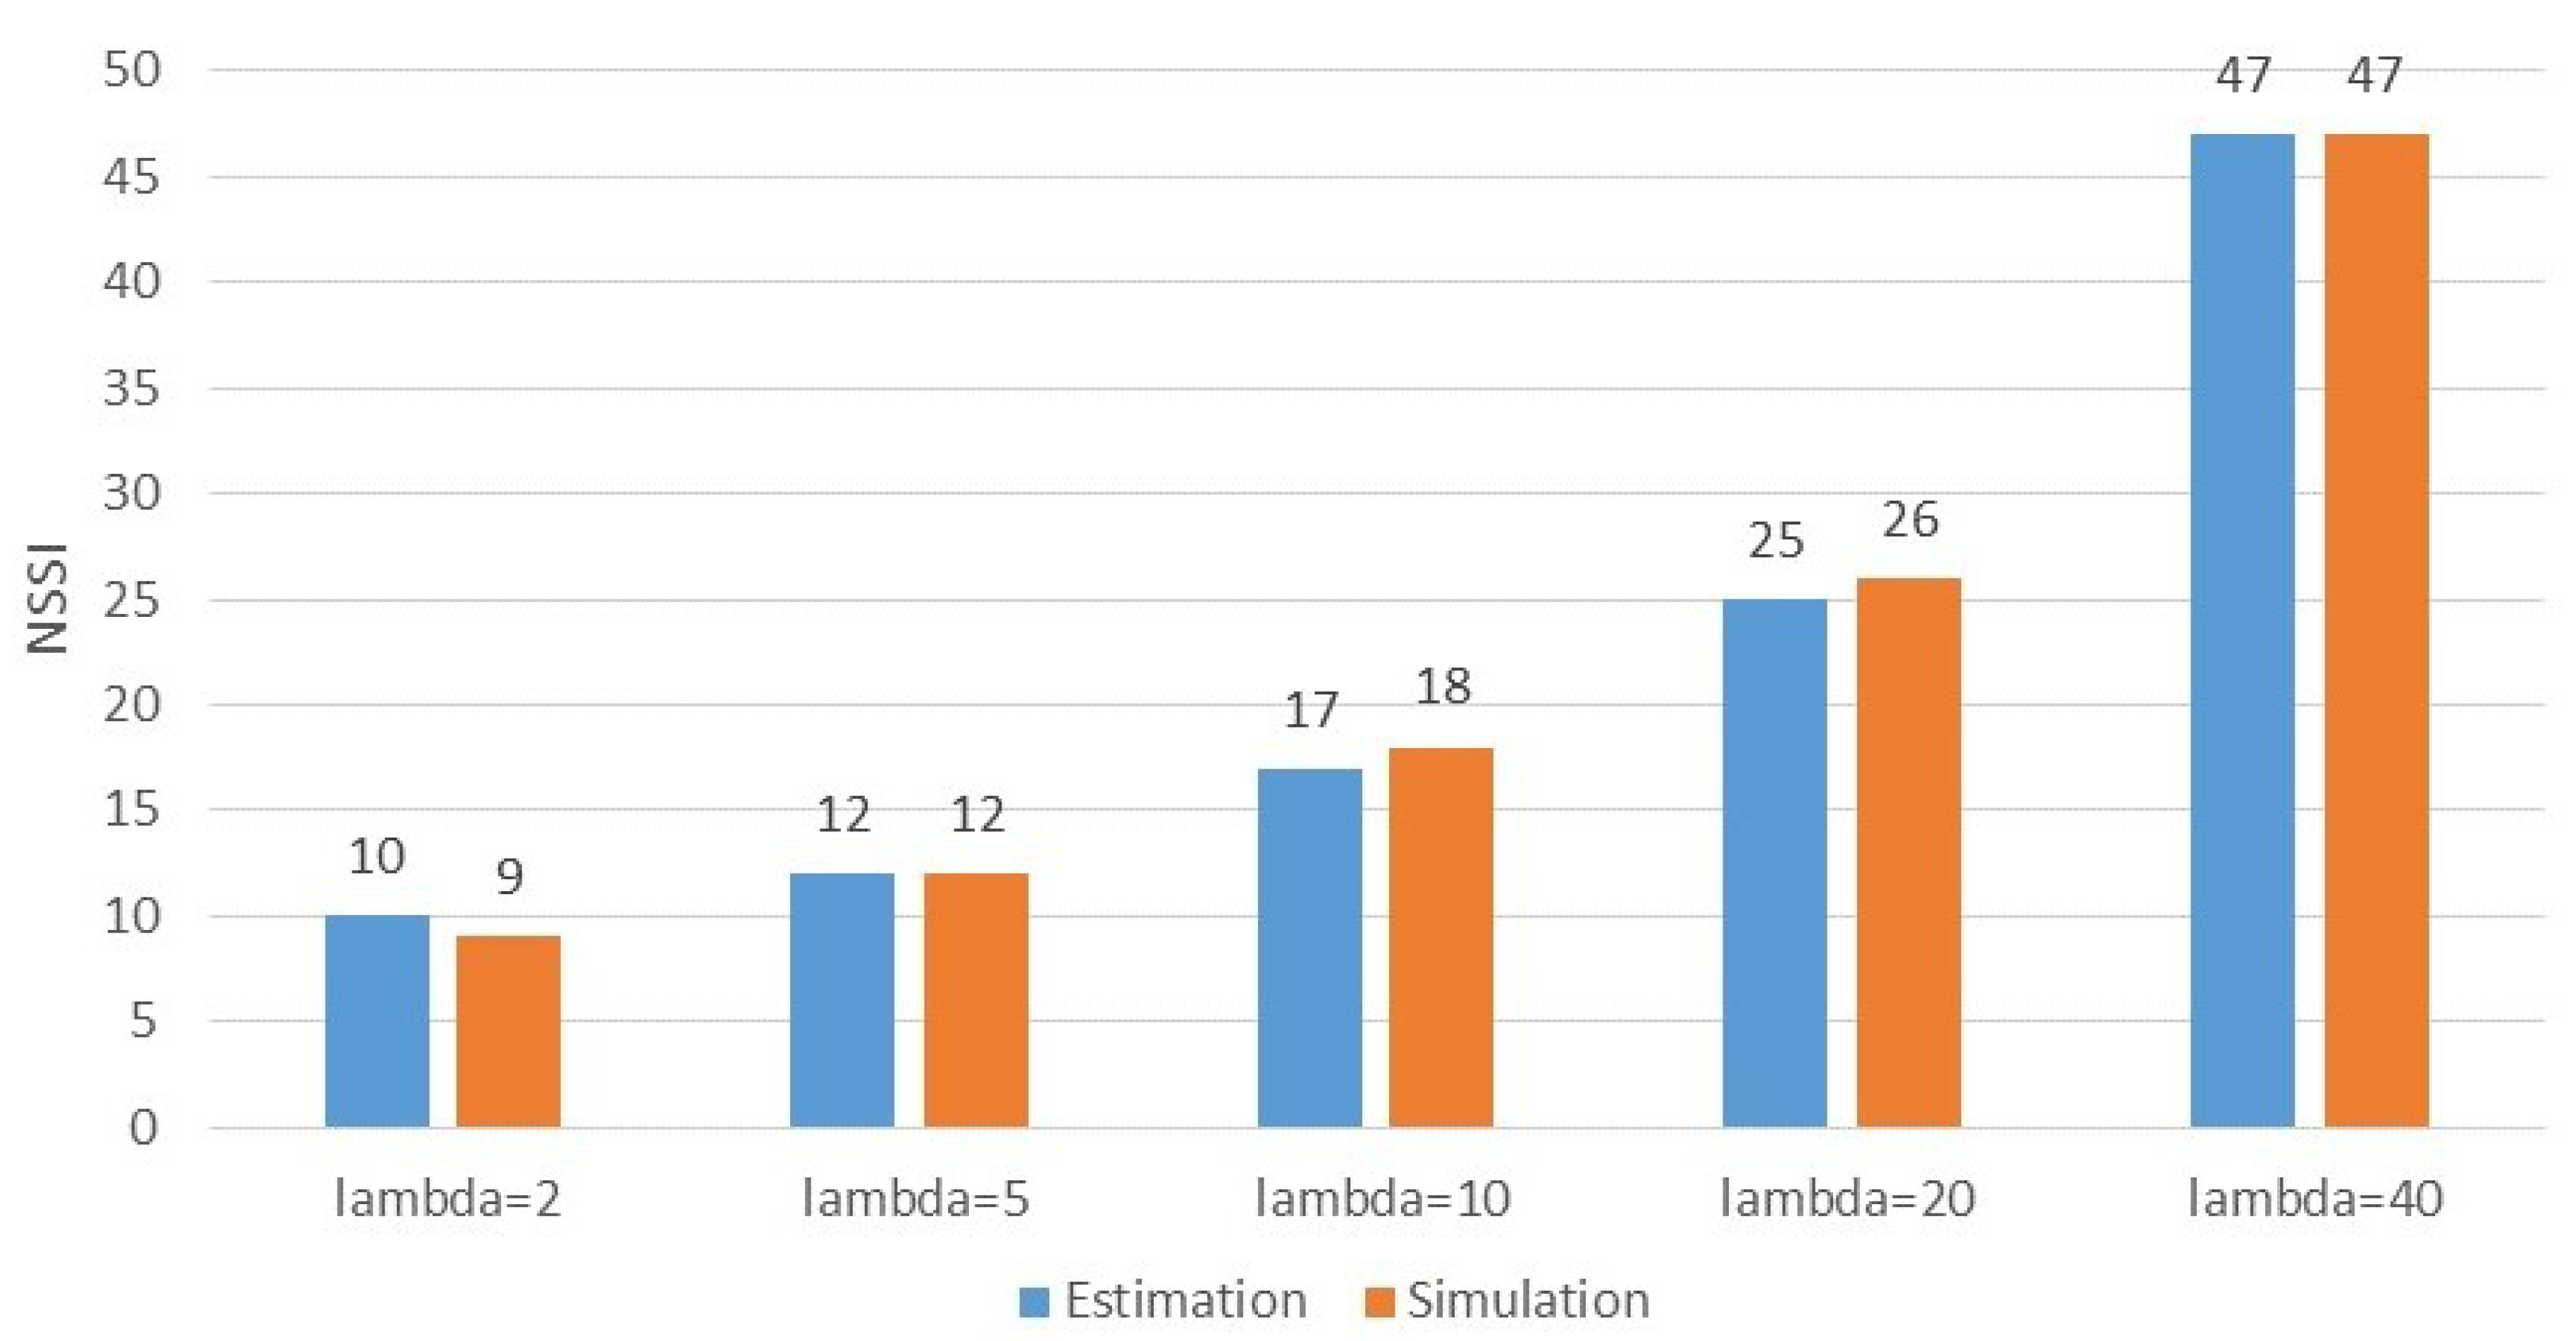
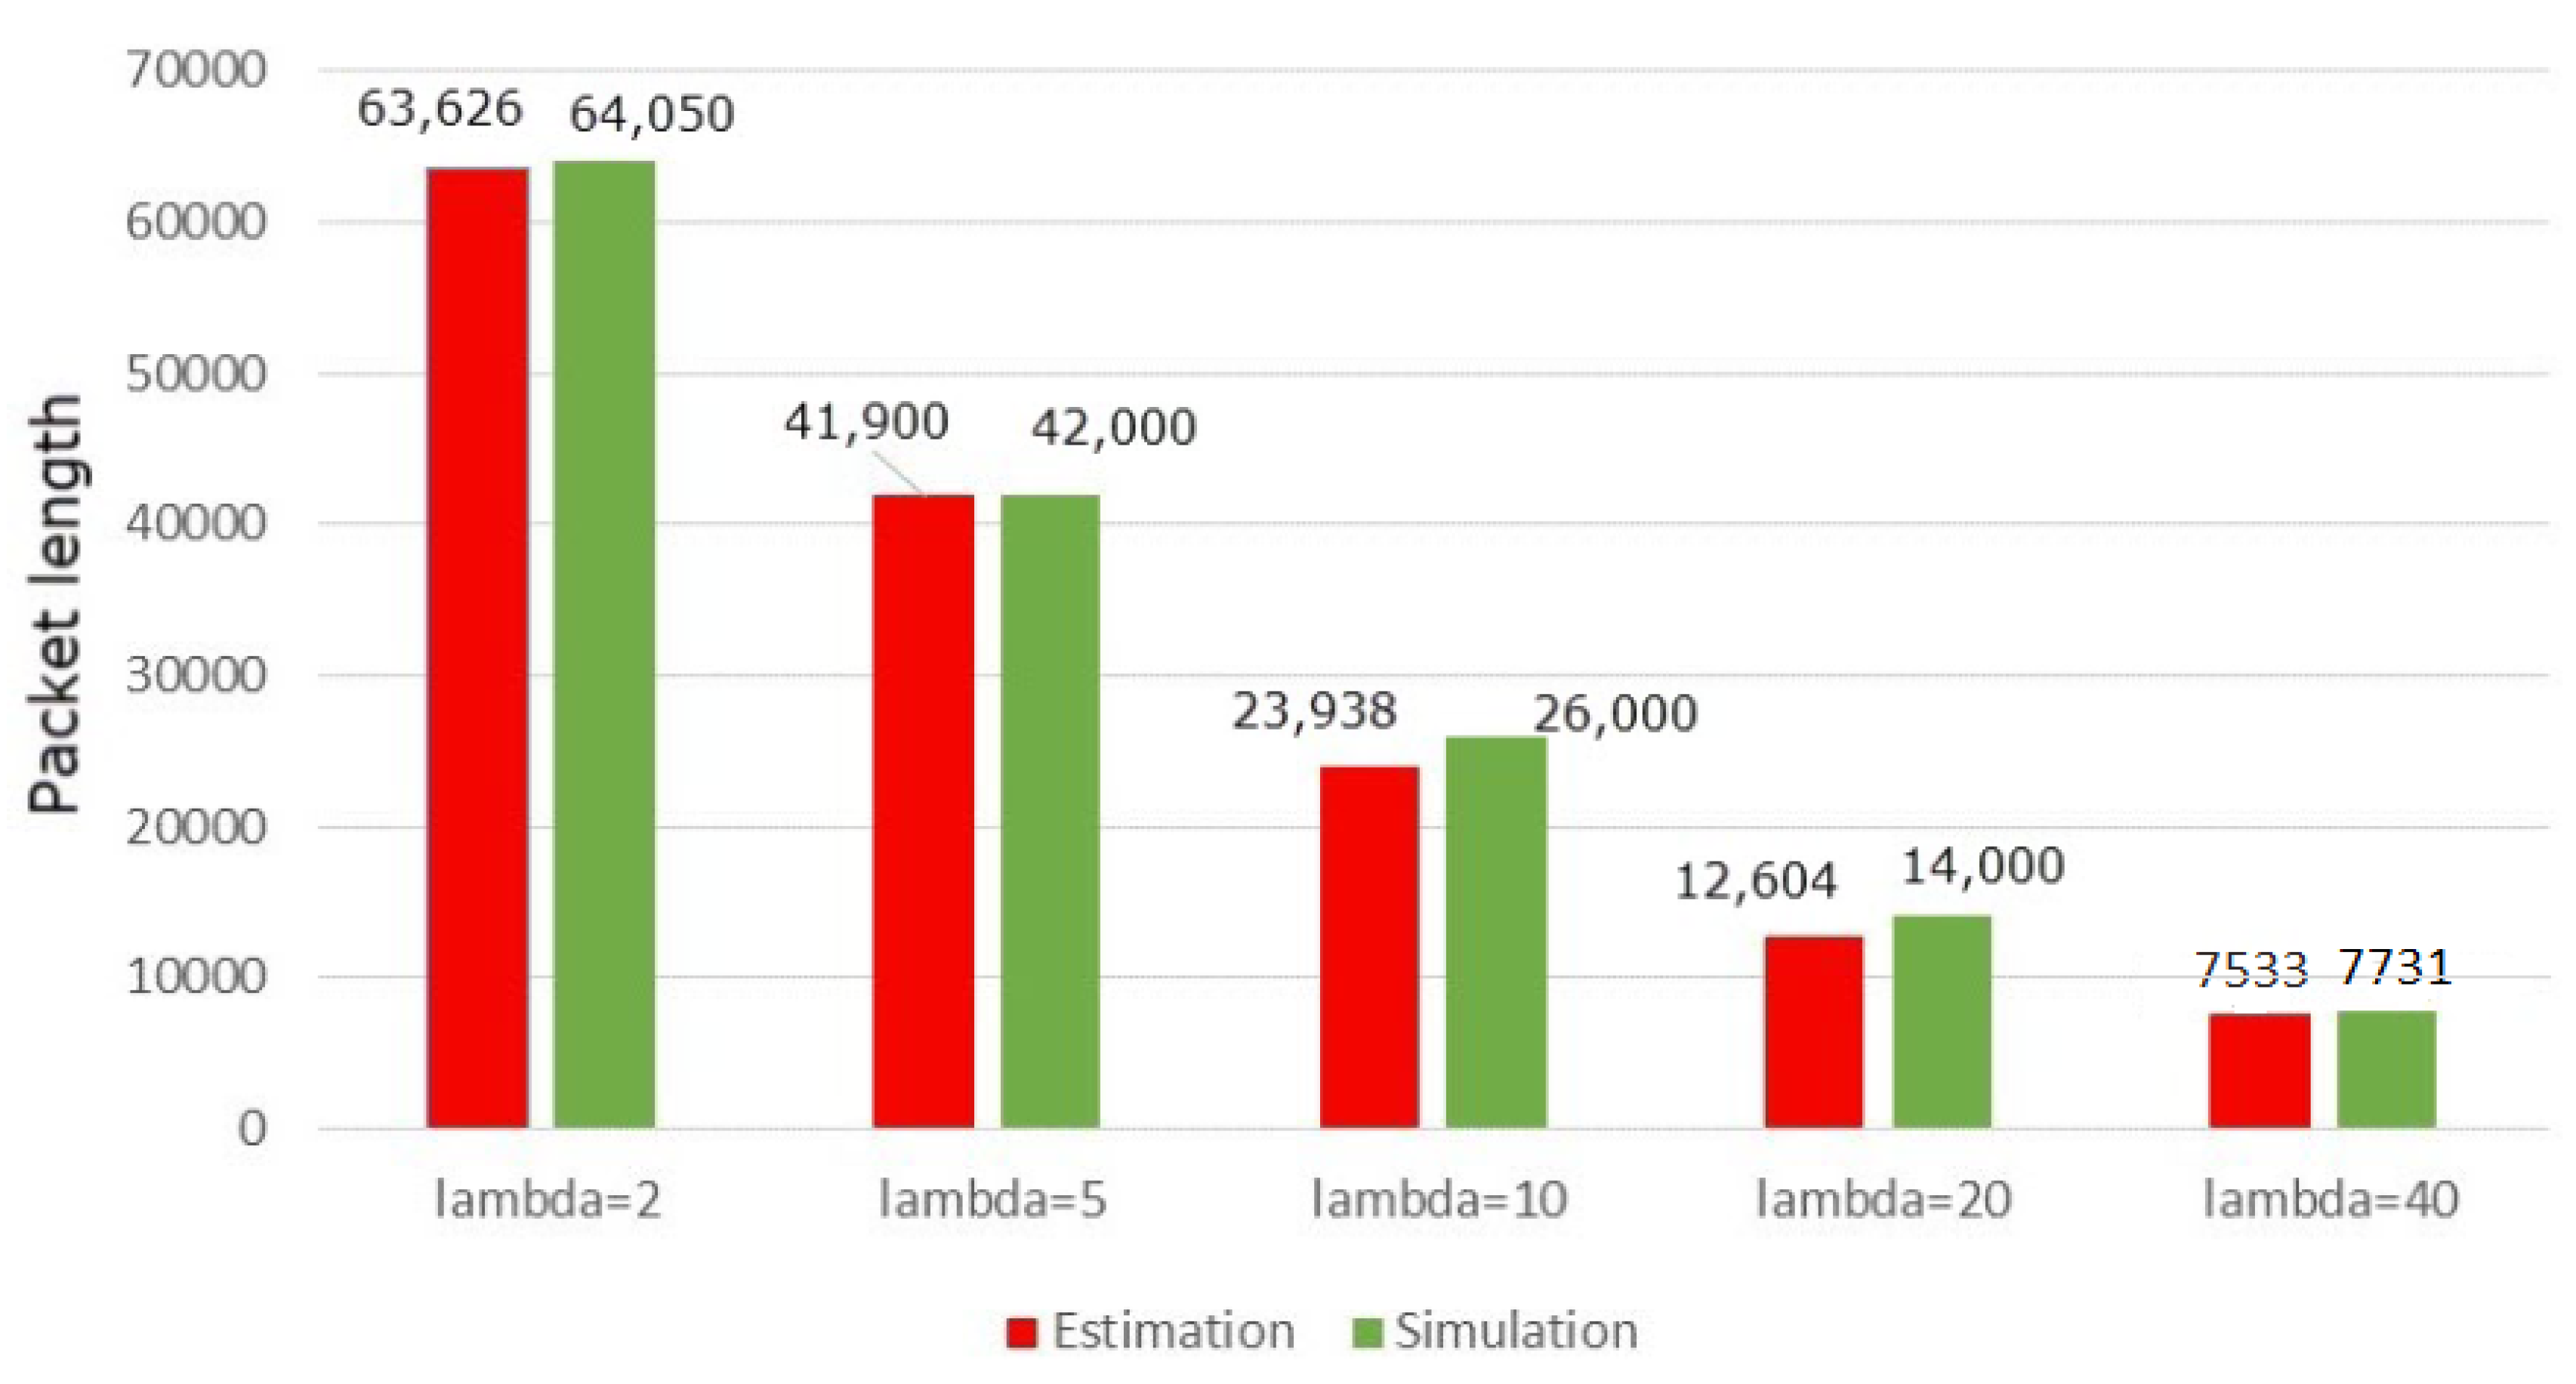
Figure 8 shows the N S S I in terms of the arrival rate while Figure 9 depicts the length of the packet. In these two figures, a comparison between the simulation and the estimation is shown. As evidenced in these figures, when the arrival rate of PUs is growing, the algorithm intelligently urges to raise the NSSI and decrease the length of the packet. In fact, the algorithm behaves well to reduce the probability of interference at higher rates.
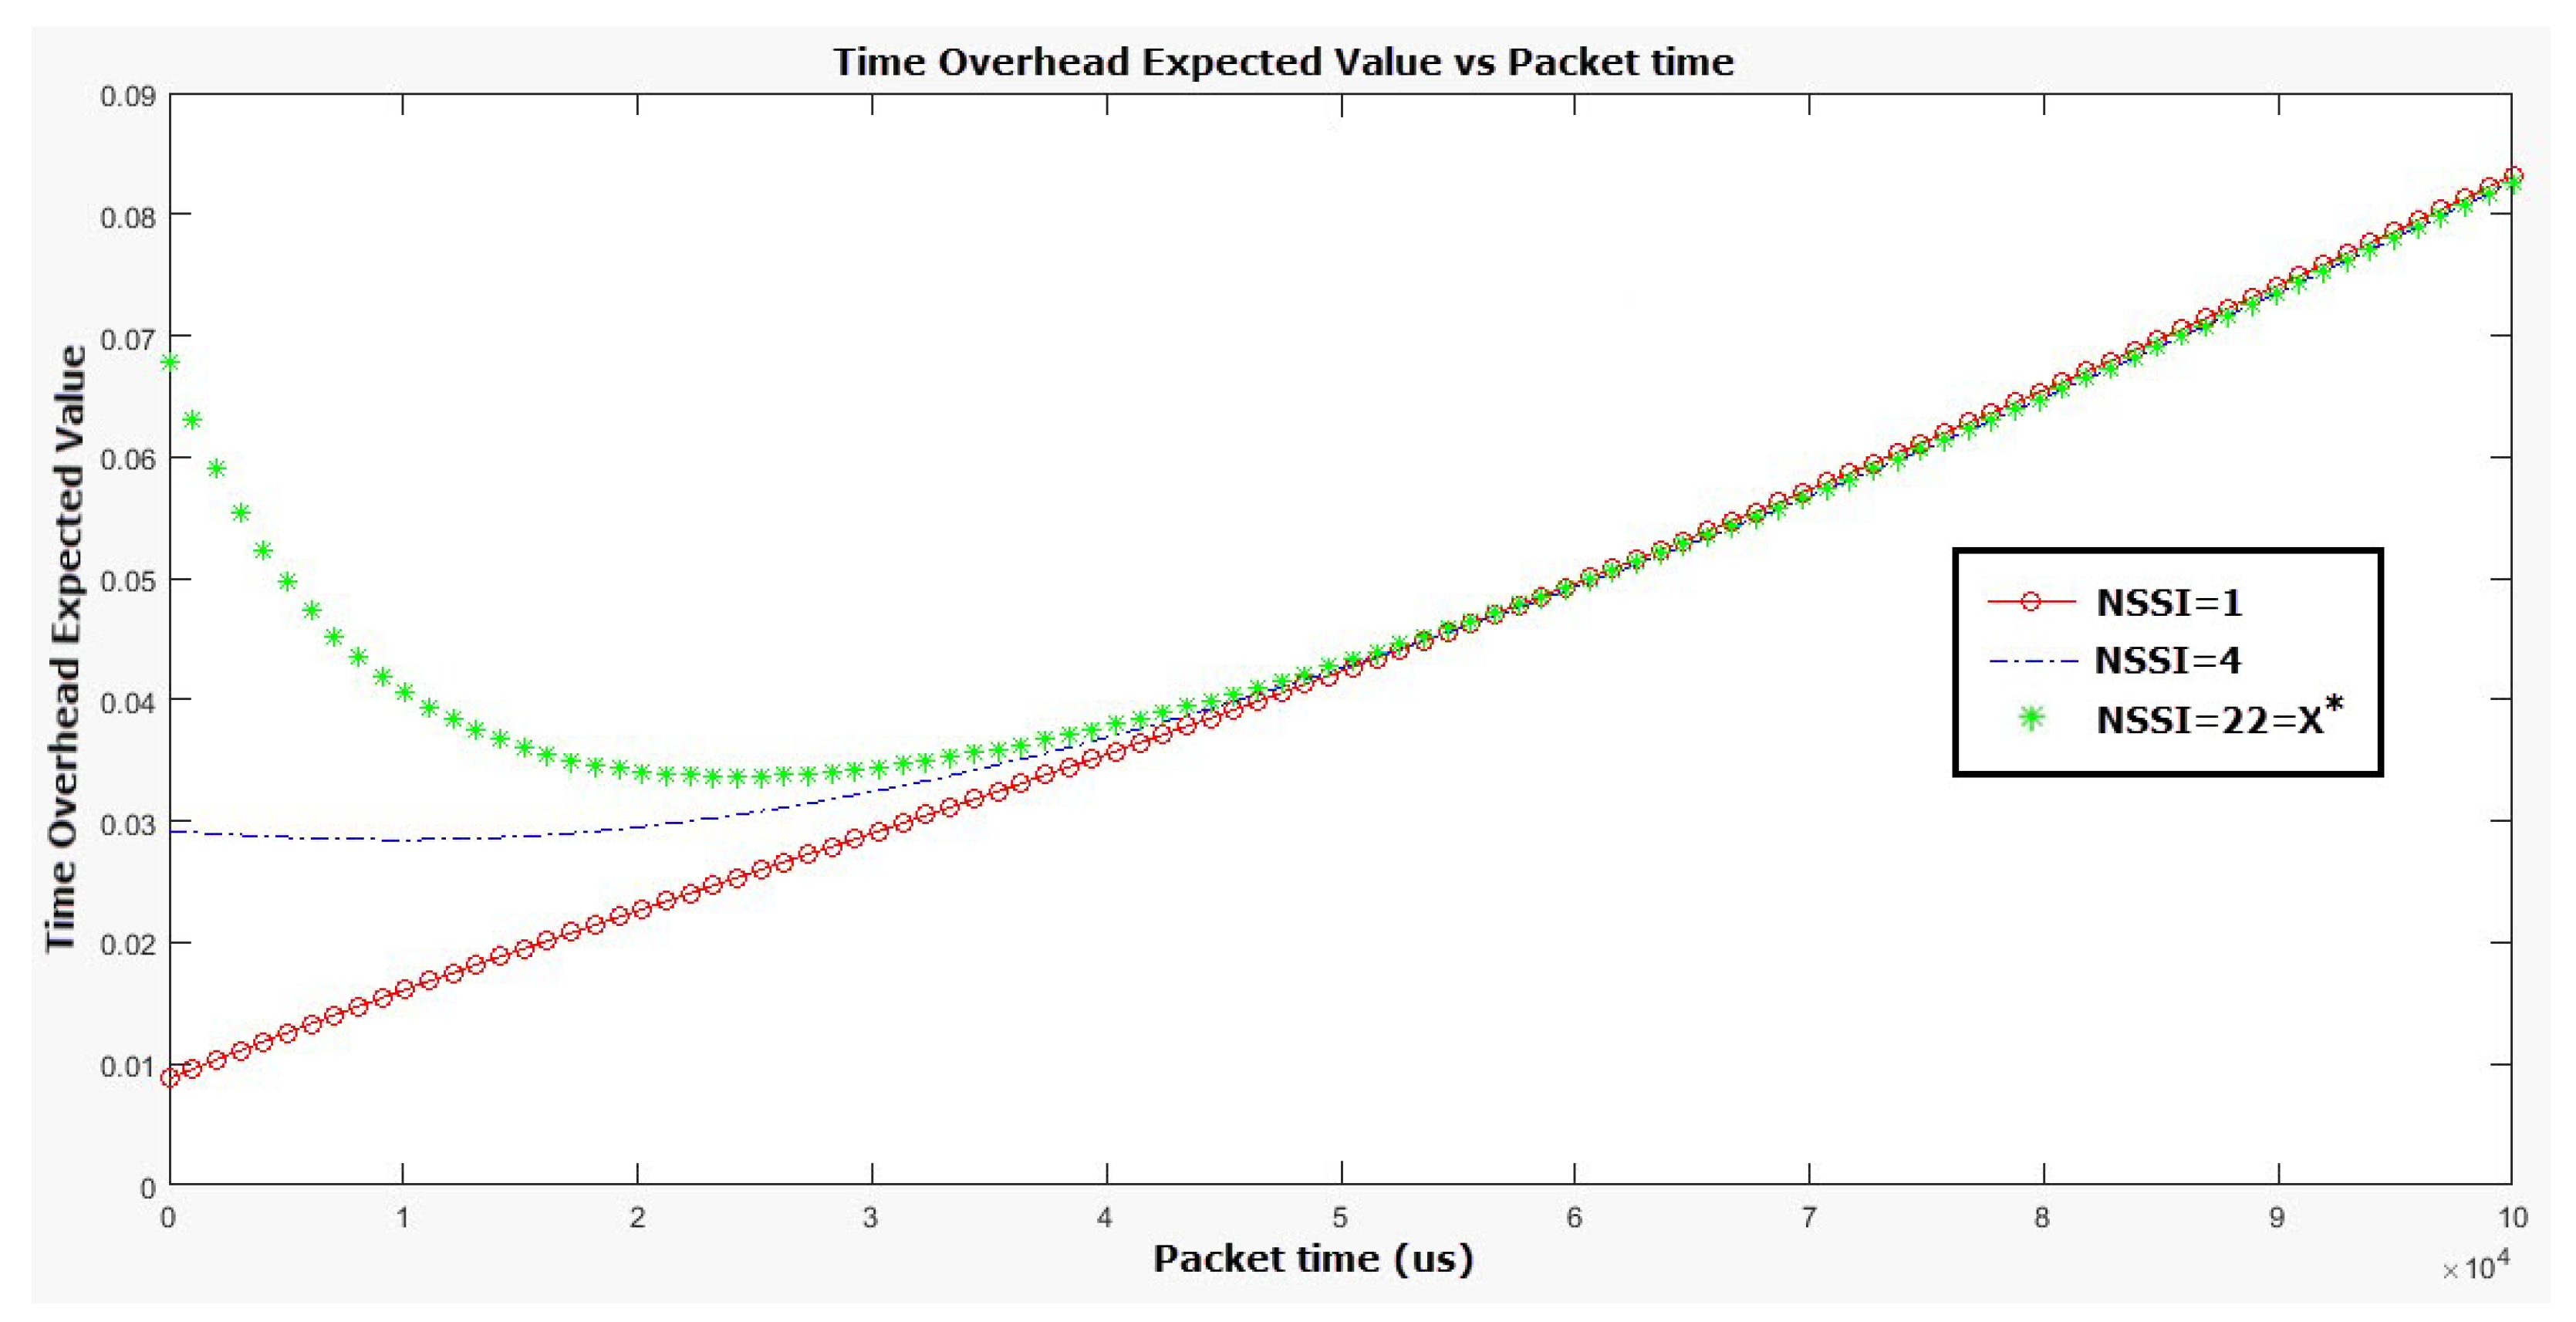
For example, at the low arrive rate λ i = 2 (arrivals per second (APS)), the algorithm selects a large packet with the length τ P i = 64,040 μs and the N S S I = 9 . With these values, 87 % of the data stored in the transmission buffer are sent in the first attempt. The remaining data only require 105,566 μs time to be sent in 9 1 = 8 available iterations while the timer overflow occurs 253,879 μs later. This means that 13% of the input image that is still waiting to send have enough time for successful transmission within the allowed time ( D m = 1). In comparison, for λ i = 40 APS, our algorithm tries to decrease the packet length to τ P i = 7731 μs and increases the N S S I from 9 APS to 47 APS to avoid overhead due to both SS and retransmission of large packets. In this condition, only 57 % of the input image was sent after the first try. In order to fulfill transmission of this image, it is required 625,969 μs time so about 33 % of pixels were missed because of the timeout. In the following, it is intended to evaluate the behavior of the function E ( τ O H i ) as a mean time overhead. For this purpose, the value of τ P i is increased from approximately 0 to 0.1 s. For this purpose, three different values are considered for the N S S I which are 1, 4, and 22. Among these values only N S S I = 22 was estimated by the proposed algorithm JOPPS, others were selected for making a comparison. In Figure 10, the comparison between the expected value of overhead time ( E ( τ O H i ) ) for different NSSIs. As it can be seen, the JOPSS suggests N S S I = 22 , and τ P i = 0.0242 s which accordingly the average time overhead will be about E ( τ O H i ) = 0.0337 s. In this figure, the values of E ( τ O H i ) for N S S I = 1 and 4 and are 0.01 s and 0.028 s, respectively. It sounds the JOPSS has suggested an inappropriate value while If we calculate the percentage of successfully sent packets for these three different values, we discover the truth that for N S S I = 1 the overhead time is much less ( E ( τ O H i ) = 0.01 s) but only 1 % of the information (an input image) were successfully sent before the first hand-off, and this number is about 8 % for N S S I = 4 . To comparison, it is about 75 % of the input image in just first try for N S S I = 22 as the optimum value that was selected by our algorithm. This is a testament to the ability of the JOPSS algorithm to select the optimum values for N S S I and τ P i values, jointly.
In the following, we plan to investigate the performance of the proposed MOTS system for channel ranking and optimal channel selection.

4.2. Performance Evaluation of the MOTS Method for Channel Rating

To check how the MOTS method works, the values D m = 1 , T s = 0.01 , P f a = 0.01 , S = 10 have been applied in simulation. In the following, three different scenarios are defined for this purpose:
λ ( 1 ) = [ 3 , 6 , 9 , 15 , 20 , 25 , 40 , 50 , 80 , 100 ] λ ( 2 ) = [ 100 , 80 , 50 , 40 , 25 , 20 , 15 , 9 , 6 , 3 ] λ ( 3 ) = [ 15 , 15 , 15 , 15 , 15 , 15 , 15 , 15 , 15 , 15 ]
In the first scenario, the PUs arrival rate vary from 3 APS (in sub-channel with channel number index (CNI) equal to 1 (CNI = 1)) to 100 APS (for CNI = 10). In Figure 11, an effectiveness evaluation of the proposed algorithm MOTS on channels contribution to data transfer in three different scenarios is presented as a histogram. In this figure, the horizontal chart contains a sub-channel number (CNI), and the vertical axis represents the number of times that a sub-channel was involved in sending data during the allowed time. As shown in Figure 11a, in the scenario (1), sub-channels 1 through 3 with 14, 12, and 6 repetitions were selected by the MOTS in the transmission of information, respectively. In this scenario, the algorithm intelligently prevents involving channels 4 through 10, which have high arrival rates. Consequently, these channels have no share in the data transmission.
In the second scenario, the channels are reversed. In this new case, the MOTS has successfully managed to share just suitable channels during the transmission. Here, sub-channels 10, 9, 8, and 7 were involved in data transmission. sub-channel 9 as the most active channels with about 30 iterations carried almost 43 % of transmission while sub-channels 10, 8, and 7 share 35 % , 19 % , and 3 % , respectively.
In the last scenario, all channels have the same arrival rate ( λ i = 15 , i = 1 , 2 , , 10 ) . In this experiment, the proposed algorithm has struggled rigidly to distribute data uniformly in a balanced way across all sub-channels. In Figure 11c, 80 % of all available channels were deployed in data transmission. The third sub-channel, as the most active channel, was repeated four times while channels 2 and 10 were idle during the transmission. Comparing the results of the three different scenarios shows that the proposed algorithm had tried to only transmit the channels that have the best conditions.

4.3. Performance Evaluation of the Proposed Model Found on PSNR Comparison

This section analyzes the result of sending images based on the proposed JOPSS MAC layer. For this purpose, at first, it is assumed that D m = 1 s and S is equal to 5. Considering the arrival rates λ = [ 1 , 6 , 12 , 18 , 100 ] for the PUs and running this scenario, the results of Figure 12 are achieved. This figure compares the thermal camera output image (in RGB) in the transmitter and receiver as a successful transmission. As shown in the figure, the error energy for the color image is zero. This means that M S E = 0 and consequently the PSNR is infinite.
Now, with a decrease of D m from 1 s to 0.7 s, we deliberately provide conditions so that the overrun of the timer occurs. Figure 13 shows the comparison of transmitted and received images in an unsuccessful transmission. In this case, the whole image is not sent within the allowed time range, and about 36 % of the image remains in the sender’s buffer (whole of a sub color channel plus some pixels of other sub-channel). This has led to PSNR about 21.5 dB.
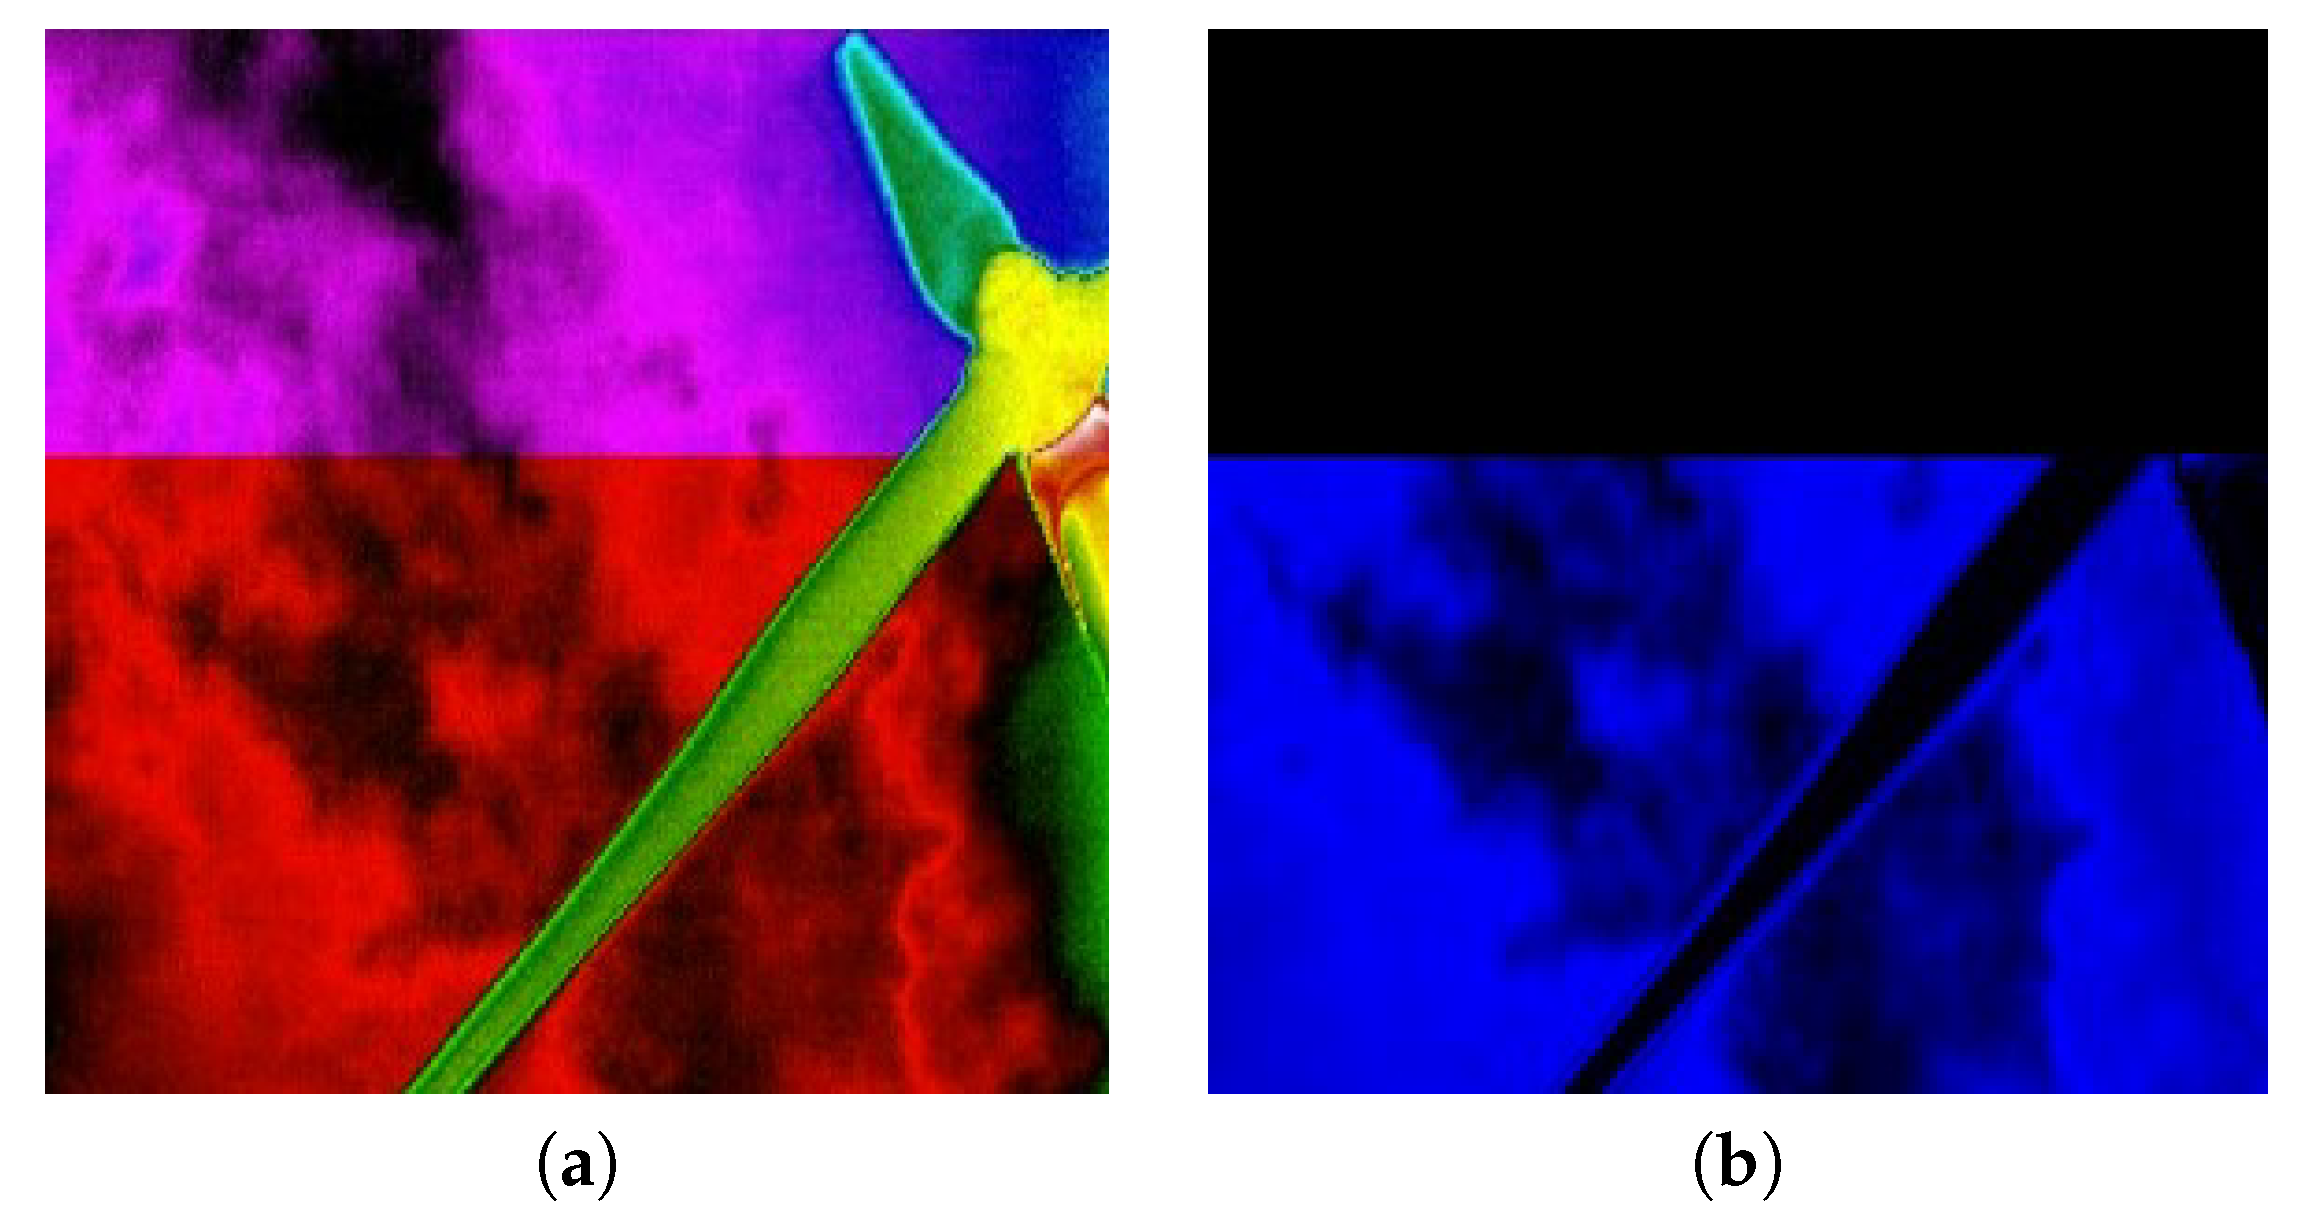
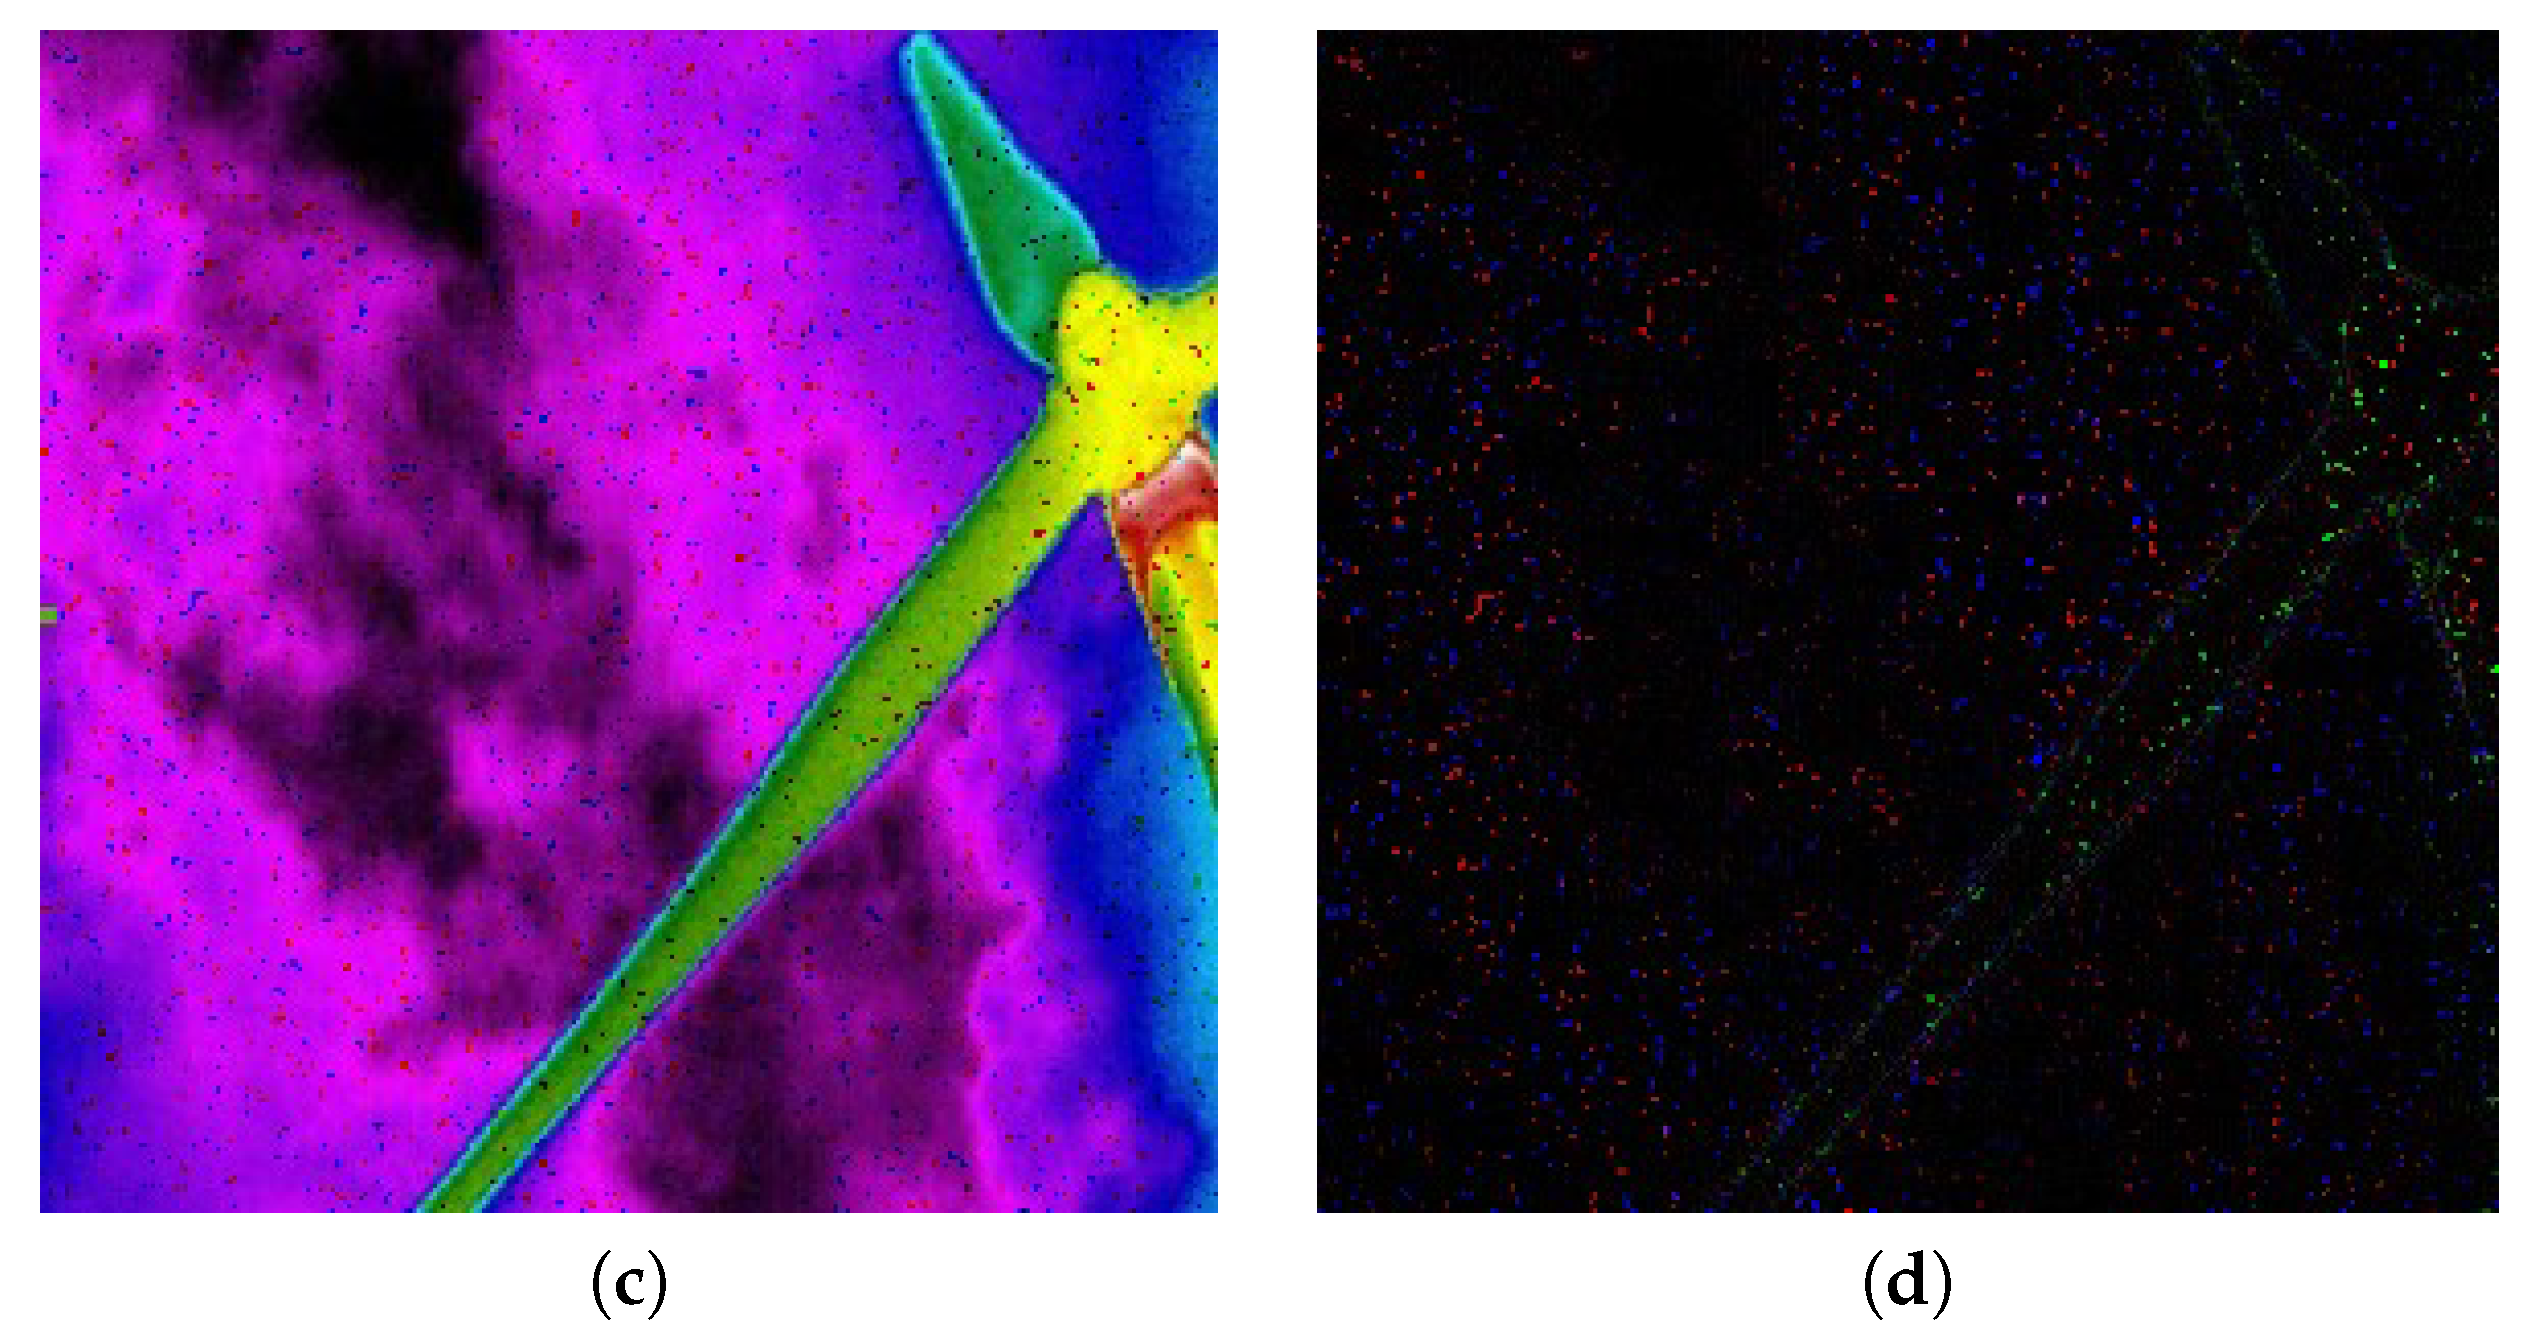
In addition, Figure 14 compares the transmitted and received color images in an unsuccessful transmission. Due to the fact that all below the blue channel image was lost, in the image restored in the receiver, there is no information about the blue background of the original image, and the error energy image is also dominated by the blue color (Figure 14c).
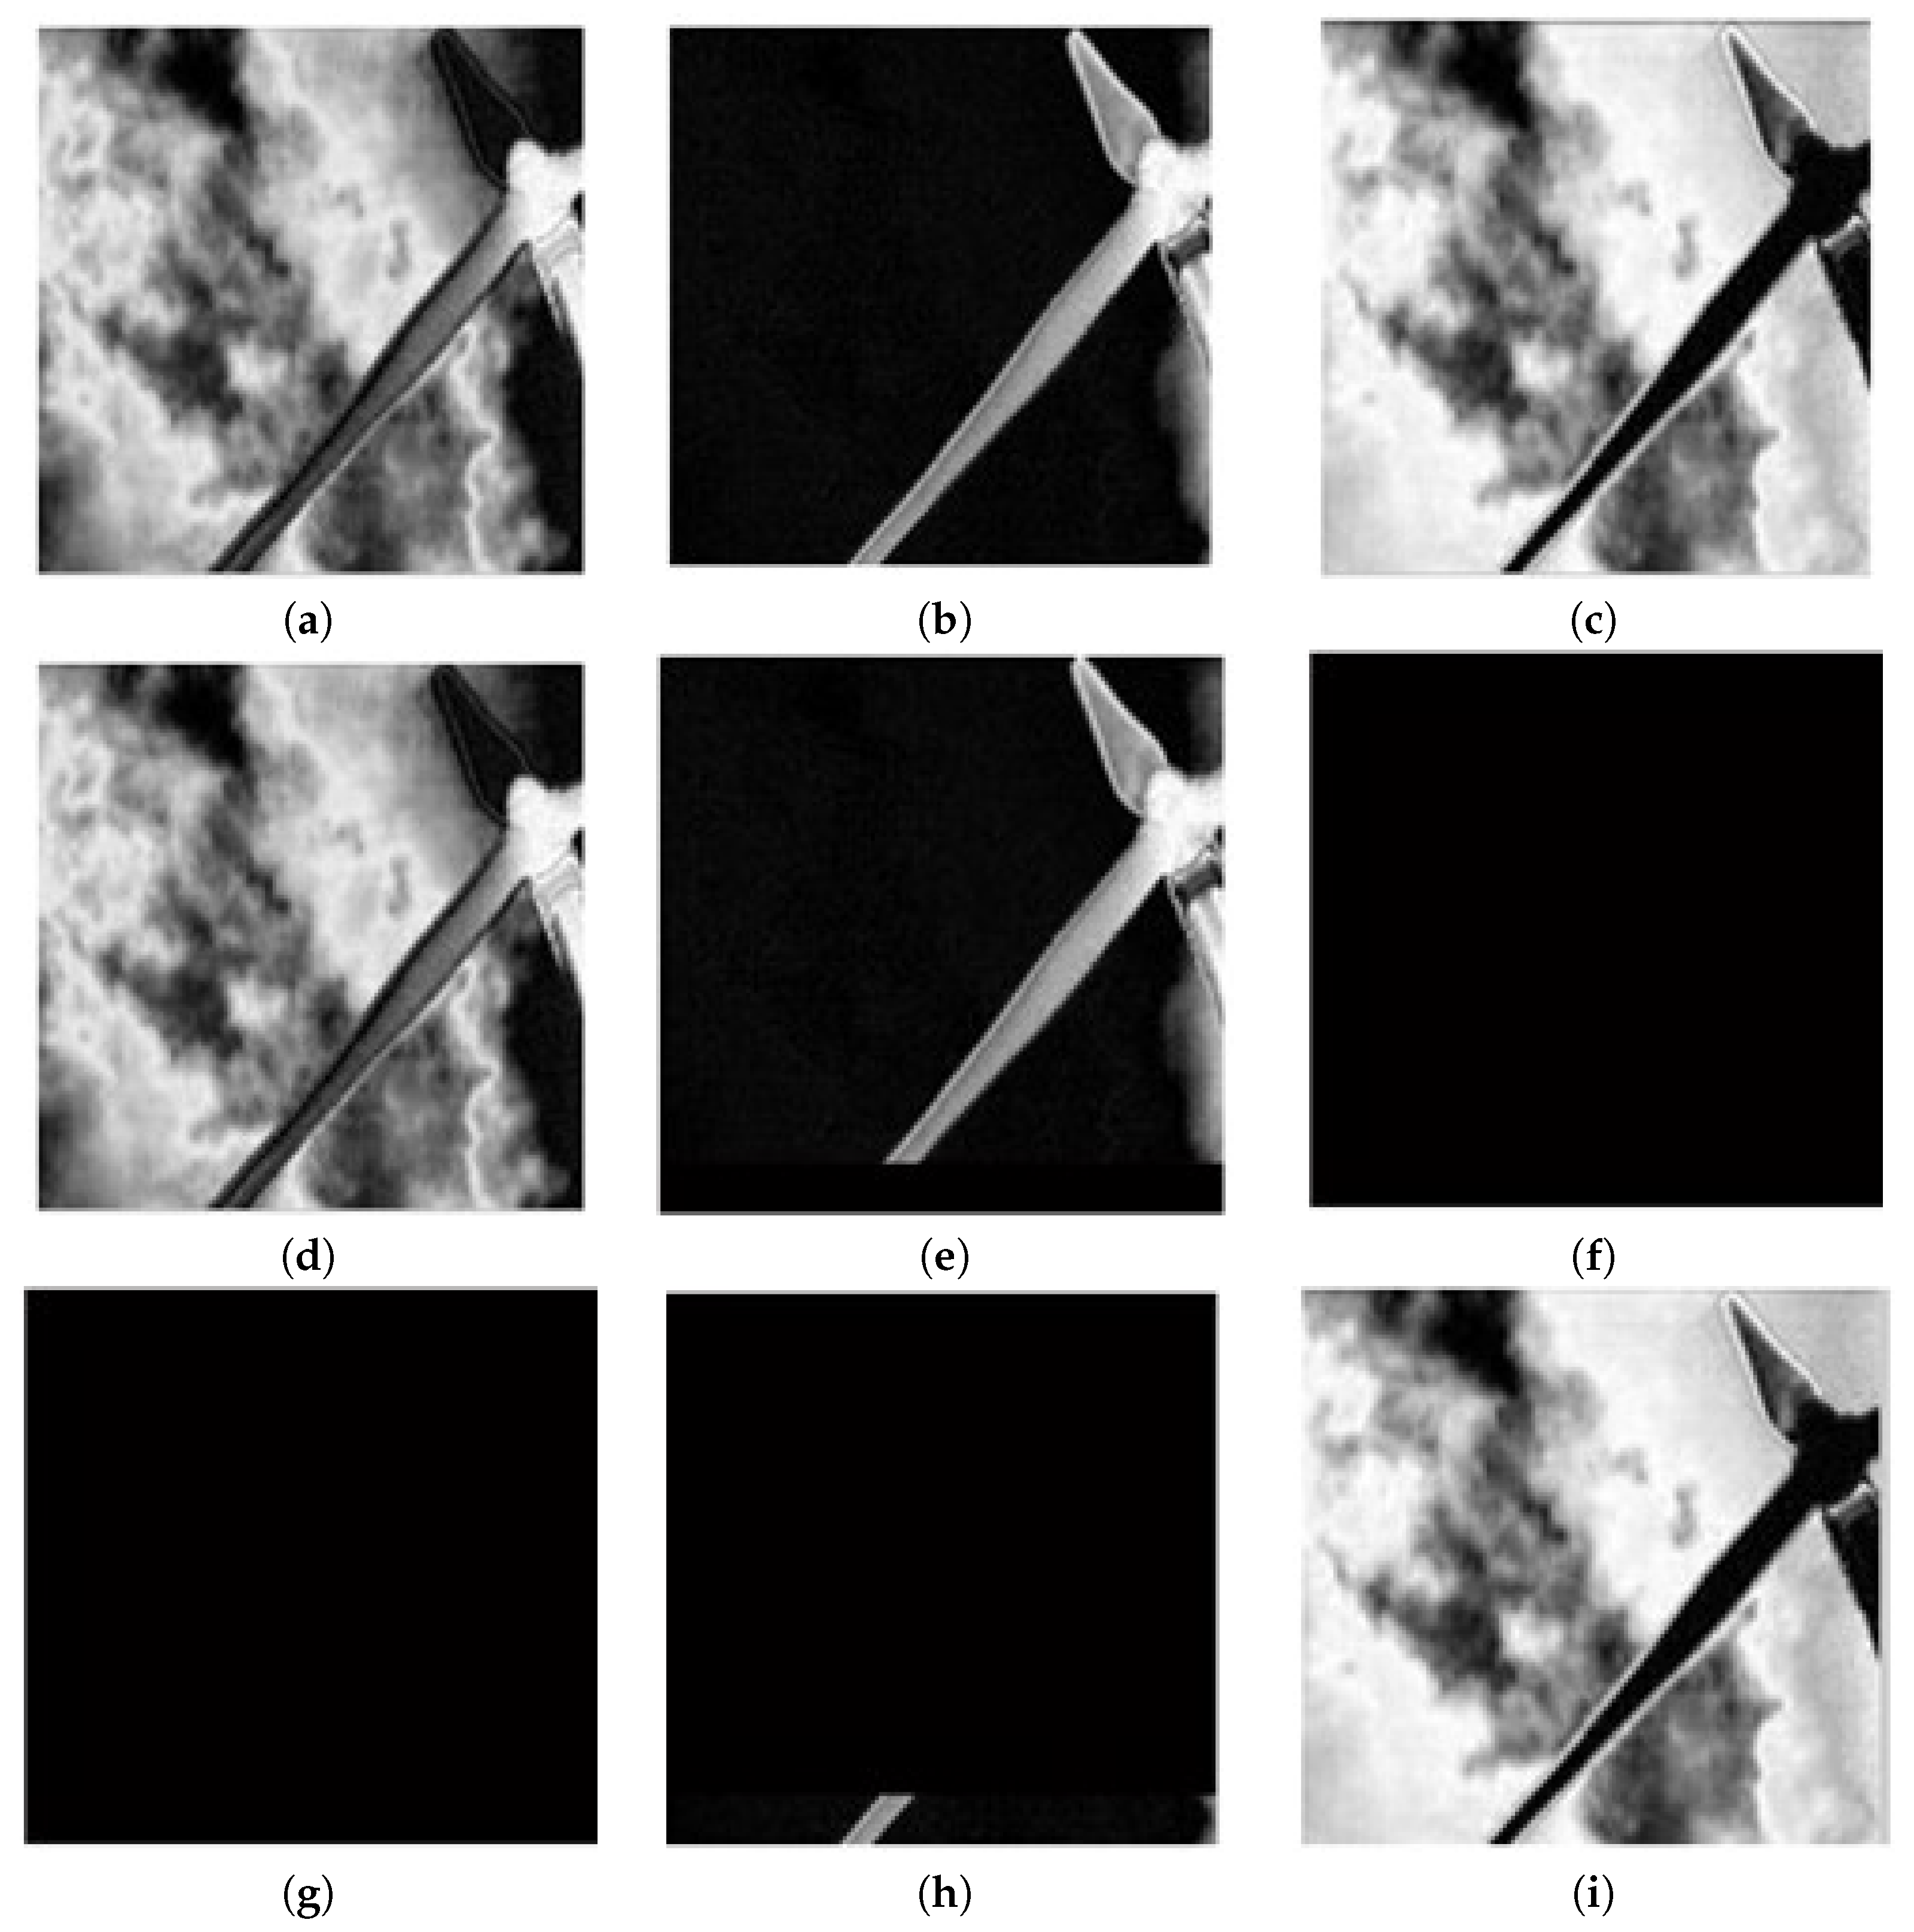
Finally, we plan to evaluate the effect of applying the proposed SAFE method on the improvement of the PSNR. We run again an unsuccessful transmission experiment with and without adding the SAFE algorithm. In Figure 15, the result of applying SAFE method can be observed. In this figure, the missing pixels which were 21 % of the image are distributed well throughout the sub images. The error energy comparison in Figure 15b shows that lost pixels are well distributed throughout the image sub channels. Accordingly, the PSNR is improved to around 27.4 dB using SAFE. Figure 16 also shows the comparison of the reconstructed color image with its error energy in normal sending (without SAFE) and sending with the SAFE algorithm.
Now, in Table 4, the comparison of PSNR is presented for the proposed method and other available techniques. It should be noted that in this table results were obtained using 1000 repetitions and finally the average PSNR were calculated for the sample image depicted in Figure 12a. The results clearly show that the proposed JOPSS model increased the image PSNR on average 3.2 dB while the JOPSS-SAFE model can even enhance it about 8.2 dB.
In order to draw a wider evaluation of our proposed algorithm, Table 5 and Table 6 are presented. In Table 5 some important IQA metrics such as SSIM, MSSIM, FSIM and PSNR are compared using our proposed JOPSS model. This table indicates that JOPSS is capable to achieve well outcomes under different performance metrics.
SSIM gives IQA from pixel based stage to a structure based stage while FSIM is used to understand images mainly according to low level features. It gives good prediction capability, higher accuracy and robust so in Table 6, we compare our algorithm with [52,72,96] based on FSIM. The obtained results show that JOPSS outperforms other existing approaches not only in PSNR but also in FSIM.

5. Conclusions

In this paper, due to the importance of intelligent monitoring, inspection and maintenance technologies in emerging smart grids, a special architecture for image streaming in wind turbine farms was presented based on cognitive radio networks (CRNs). We presented the designing of a customized cognitive radio MAC layer for bulky and delay-sensitive data transmission. In the proposed model, the idea of minimizing time overhead due to both retransmission and SS time, without reducing SS time, was presented well. The distinctive feature of our model is that unlike similar methods in the literature, we did not insist on reducing spectral sensing time. The reason is that although it seems any reduction in SS time can reduce the time overhead caused, actually it will increase the false alarms and also miss detection probability. This means lower channel efficiency and quality of service (QoS) are not avoidable. Therefore, we targeted joint optimization of number of spectrum sensing iterations ( N S S I ) and the packet size, as two main optimization parameters, using our JOPSS model for delay-sensitive communications. To this end, we defined our proposed objective function as the quotient of the Overhead Time and the Effective Transmission Time (ETT) along with Dynamic Parameter Updating Procedure (DPUP) to benefit different strategies in Mandatory and Proactive Handoffs (MHO/PHO). Furthermore, in order to increase the system efficiency, we did not count only on the time overhead reduction. We also proposed the ranking procedure, MOTS, for the optimal selection of sub-channels during the image transmission. It forces the transmitter to select only sub-channels that impose the least time overhead during the transmission. Besides, in order to enhance the PSNR while missed pixels were accumulated at the end of the image, we presented our SAFE method based on the scrambling of the image in the transmitter and reconstructing it with applying smoothing filter in the receiver. It should also be noted that we conducted our implementation according to restrictions defined for bulk and delay-sensitive data transmission over smart grids in IEEE 1646 [29] and IEC 61850 [28] standards. The amount of PSNR achieved found on proposed methods JOPSS and JOPSS-SAFE are 29.67 dB and 31.79 dB, respectively. The achieved results indicate that the proposed algorithms outperform strongly other existing approaches based on both PSNR and FSIM metrics.
Today, Deep learning (DL) techniques get more attentions in computer network applications due to their excellent achieved results. In particular in resource allocation problems, DL has shown a tremendous impact in recent years. Therefore, we are going to replace the exhaustive search method used in our study with DL to reduce time cost of parameter estimation step in the optimization problem. Besides, due to this fact that different IQA metrics perform differently for various distortion types so fusion of these metrics would be a useful and practical suggestion found on machine learning and DL methods for future works.
Author Contributions

Conceptualization, M.B., S.A.M., and Q.X.; methodology and software, M.B., and S.A.M.; validation, M.B., S.A.M., and Q.X.; formal analysis, M.B., S.A.M., and Q.X.; investigation, M.B., S.A.M. and Q.X.; writing—original draft preparation, M.B.; writing—review and editing, M.B., S.A.M., and Q.X.; visualization, M.B., S.A.M., and Q.X.; supervision, S.A.M.; project administration, M.B.; funding acquisition, Q.X.

Funding

This research received no external funding.

Conflicts of Interest

The authors declare no conflict of interest.

References

  1. Gungor, V.C.; Sahin, D.; Kocak, T.; Ergut, S.; Buccella, C.; Cecati, C.; Hancke, G.P. A survey on smart grid potential applications and communication requirements. IEEE Trans. Ind. Inform. 2012, 9, 28–42. [Google Scholar] [CrossRef] [Green Version]
  2. Nidhi, N.; Prasad, D.; Nath, V. Different aspects of smart grid: An overview. In Nanoelectronics, Circuits and Communication Systems; Springer: Heidelberg/Berlin, Germany, 2019; pp. 451–456. [Google Scholar]
  3. Kabalci, E.; Kabalci, Y. Introduction to Smart Grid Architecture. In Smart Grids and Their Communication Systems; Springer: Heidelberg/Berlin, Germany, 2019; pp. 3–45. [Google Scholar]
  4. Kumar, P.; Lin, Y.; Bai, G.; Paverd, A.; Dong, J.S.; Martin, A. Smart Grid Metering Networks: A Survey on Security, Privacy and Open Research Issues. IEEE Commun. Surv. Tutor. 2019, 21, 2886–2927. [Google Scholar] [CrossRef] [Green Version]
  5. Bahaghighat, M.; Motamedi, S.A. Vision inspection and monitoring of wind turbine farms in emerging smart grids. Facta Univ. Ser. Electron. Energ. 2018, 31, 287–301. [Google Scholar] [CrossRef] [Green Version]
  6. Bian, D.; Kuzlu, M.; Pipattanasomporn, M.; Rahman, S.; Shi, D. Performance evaluation of communication technologies and network structure for smart grid applications. IET Commun. 2019, 13, 1025–1033. [Google Scholar] [CrossRef] [Green Version]
  7. Rehmani, M.H.; Davy, A.; Jennings, B.; Assi, C. Software Defined Networks based Smart Grid Communication: A Comprehensive Survey. IEEE Commun. Surv. Tutor. 2019, 21, 2637–2670. [Google Scholar] [CrossRef]
  8. Khan, M.W.; Zeeshan, M. QoS-based dynamic channel selection algorithm for cognitive radio based smart grid communication network. Ad Hoc Netw. 2019, 87, 61–75. [Google Scholar] [CrossRef]
  9. Premkumar, S.; Susithra, M.; Saminadan, V. Performance Analysis of Smart Grid Communication Network Architecture for WAMS. In Innovations in Electronics and Communication Engineering; Springer: Heidelberg/Berlin, Germany, 2019; pp. 347–354. [Google Scholar]
  10. Huang, D.; Li, H.; Cai, G.; Huang, N.; Yu, N.; Huang, Z. An Efficient Probabilistic Approach Based on Area Grey Incidence Decision Making for Optimal Distributed Generation Planning. IEEE Access 2019, 7, 93175–93186. [Google Scholar] [CrossRef]
  11. Wilker, S.; Meisel, M.; Sauter, T. Smart grid architecture model standardization and the applicability of domain language specific modeling tools. In Proceedings of the 2017 IEEE 26th International Symposium on Industrial Electronics (ISIE), Edinburgh, UK, 19–21 June 2017; pp. 152–157. [Google Scholar]
  12. Neureiter, C.; Eibl, G.; Engel, D.; Schlegel, S.; Uslar, M. A concept for engineering smart grid security requirements based on SGAM models. Comput. Sci. Res. Dev. 2016, 31, 65–71. [Google Scholar] [CrossRef] [Green Version]
  13. Gottschalk, M.; Uslar, M.; Delfs, C. The Smart Grid Architecture Model–SGAM. In The Use Case and Smart Grid Architecture Model Approach; Springer: Heidelberg/Berlin, Germany, 2017; pp. 41–61. [Google Scholar]
  14. Framework, N. NIST Framework and Roadmap for Smart Grid Interoperability Standards, Release 1.0; National Institute Standard Technology (NIST): Gaithersburg, MD, USA, 2010; Volume 26. [Google Scholar]
  15. Li, H.; Lai, L.; Zhang, W. Communication requirement for reliable and secure state estimation and control in smart grid. IEEE Trans. Smart Grid 2011, 2, 476–486. [Google Scholar] [CrossRef]
  16. Usman, A.; Shami, S.H. Evolution of communication technologies for smart grid applications. Renew. Sustain. Energy Rev. 2013, 19, 191–199. [Google Scholar] [CrossRef]
  17. Ancillotti, E.; Bruno, R.; Conti, M. The role of communication systems in smart grids: Architectures, technical solutions and research challenges. Comput. Commun. 2013, 36, 1665–1697. [Google Scholar] [CrossRef] [Green Version]
  18. El-Hawary, M.E. The smart grid state of the art and future trends. Electr. Power Compon. Syst. 2014, 42, 239–250. [Google Scholar] [CrossRef]
  19. Kuzlu, M.; Pipattanasomporn, M.; Rahman, S. Communication network requirements for major smart grid applications in HAN, NAN and WAN. Comput. Netw. 2014, 67, 74–88. [Google Scholar] [CrossRef]
  20. Avancini, D.B.; Rodrigues, J.J.; Martins, S.G.; Rabêlo, R.A.; Al-Muhtadi, J.; Solic, P. Energy meters evolution in smart grids: A review. J. Clean. Prod. 2019, 217, 702–715. [Google Scholar] [CrossRef]
  21. Blair, S.M.; Syed, M.H.; Roscoe, A.J.; Burt, G.M.; Braun, J.P. Measurement and analysis of PMU reporting latency for smart grid protection and control applications. IEEE Access 2019, 7, 48689–48698. [Google Scholar] [CrossRef]
  22. Su, H.; Li, P.; Fu, X.; Yu, L.; Wang, C. Augmented Sensitivity Estimation Based Voltage Control Strategy of Active Distribution Networks With PMU Measurement. IEEE Access 2019, 7, 44987–44997. [Google Scholar] [CrossRef]
  23. Xue, A.; Leng, S.; Li, Y.; Xu, F.; Martin, K.E.; Xu, J. A Novel Method for Screening the PMU Phase Angle Difference Data Based on Hyperplane Clustering. IEEE Access 2019, 7, 97177–97186. [Google Scholar] [CrossRef]
  24. Chen, J.; Jin, T.; Mohamed, M.A.; Wang, M. An Adaptive TLS-ESPRIT Algorithm Based on an SG Filter for Analysis of Low Frequency Oscillation in Wide Area Measurement Systems. IEEE Access 2019, 7, 47644–47654. [Google Scholar] [CrossRef]
  25. Alsharif, A.; Nabil, M.; Mahmoud, M.M.; Abdallah, M. EPDA: Efficient and Privacy-Preserving Data Collection and Access Control Scheme for Multi-Recipient AMI Networks. IEEE Access 2019, 7, 27829–27845. [Google Scholar] [CrossRef]
  26. Saleem, Y.; Crespi, N.; Rehmani, M.H.; Copeland, R. Internet of things-aided Smart Grid: Technologies, architectures, applications, prototypes, and future research directions. IEEE Access 2019, 7, 62962–63003. [Google Scholar] [CrossRef]
  27. Martins, J.F.; Pronto, A.G.; Delgado-Gomes, V.; Sanduleac, M. Smart Meters and Advanced Metering Infrastructure. In Pathways to a Smarter Power System; Elsevier: Amsterdam, The Netherlands, 2019; pp. 89–114. [Google Scholar]
  28. SMB Smart Grid Strategic Group SG3. IEC Smart Grid Standardization Roadmap; IEC: Geneva, Switzerland, 2010. [Google Scholar]
  29. Wang, W.; Xu, Y.; Khanna, M. A survey on the communication architectures in smart grid. Comput. Netw. 2011, 55, 3604–3629. [Google Scholar] [CrossRef]
  30. Tchakoua, P.; Wamkeue, R.; Ouhrouche, M.; Slaoui-Hasnaoui, F.; Tameghe, T.; Ekemb, G. Wind turbine condition monitoring: State-of-the-art review, new trends, and future challenges. Energies 2014, 7, 2595–2630. [Google Scholar] [CrossRef] [Green Version]
  31. Lu, L.; He, Y.; Wang, T.; Shi, T.; Ruan, Y. Wind Turbine Planetary Gearbox Fault Diagnosis Based on Self-Powered Wireless Sensor and Deep Learning Approach. IEEE Access 2019, 7, 119430–119442. [Google Scholar] [CrossRef]
  32. Bahaghighat, M.; Akbari, L.; Xin, Q. A Machine Learning-Based Approach for Counting Blister Cards within Drug Packages. IEEE Access 2019, 7, 83785–83796. [Google Scholar] [CrossRef]
  33. Mohammadi, J.; Akbari, R.; Bahaghighat, M.K. Vehicle speed estimation based on the image motion blur using RADON transform. In Proceedings of the 2010 2nd International Conference on Signal Processing Systems, Dalian, China, 5–7 July 2010; Volume 1, pp. V1–V243. [Google Scholar]
  34. Keshavarz, M.; Sahba, F.; Tehrani, E. Textdependent Speaker Recognition by Combination of LBG VQ and DTW for Persian language. Int. J. Comput. Appl. 2012, 51, 23–27. [Google Scholar]
  35. Bahaghighat, M.; Mirfattahi, M.; Akbari, L.; Babaie, M. Designing quality control system based on vision inspection in pharmaceutical product lines. In Proceedings of the 2018 International Conference on Computing, Mathematics and Engineering Technologies (iCoMET), Sukkur, Pakistan, 3–4 March 2018; pp. 1–4. [Google Scholar]
  36. Sajadi, M.S.S.; Babaie, M.; Bahaghighat, M. Design and implementation of fuzzy supervisor controller on optimized DC machine driver. In Proceedings of the 2018 8th Conference of AI & Robotics and 10th RoboCup Iranopen International Symposium (IRANOPEN), Qazvin, Iran, 10 April 2018; pp. 26–31. [Google Scholar]
  37. Kwapisz, A. Utilization of the monitoring system for MV/LV transformers in smart grid application. In Proceedings of the 2016 Electric Power Networks (EPNet), Zklarska Poreba, Poland, 19–21 September 2016; pp. 1–4. [Google Scholar]
  38. Jiang, T. Power monitoring electronic/multimedia traffic scheduling in Cognitive Radio based Smart Grid. In Proceedings of the 2016 International Conference on Smart Grid and Clean Energy Technologies (ICSGCE), Chengdu, China, 19–22 October 2016; pp. 80–83. [Google Scholar]
  39. Wang, H.; Qian, Y.; Sharif, H. Multimedia communications over cognitive radio networks for smart grid applications. IEEE Wirel. Commun. 2013, 20, 125–132. [Google Scholar] [CrossRef]
  40. Bu, S.; Yu, F.R. Green cognitive mobile networks with small cells for multimedia communications in the smart grid environment. IEEE Trans. Veh. Technol. 2014, 63, 2115–2126. [Google Scholar] [CrossRef]
  41. Kayastha, N.; Niyato, D.; Hossain, E.; Han, Z. Smart grid sensor data collection, communication, and networking: A tutorial. Wirel. Commun. Mob. Comput. 2014, 14, 1055–1087. [Google Scholar] [CrossRef]
  42. Batista, N.; Melício, R.; Matias, J.; Catalão, J. Photovoltaic and wind energy systems monitoring and building/home energy management using ZigBee devices within a smart grid. Energy 2013, 49, 306–315. [Google Scholar] [CrossRef]
  43. García-Bustamante, E.; González-Rouco, J.; Jiménez, P.; Navarro, J.; Montávez, J. A comparison of methodologies for monthly wind energy estimation. Wind Energy Int. J. Prog. Appl. Wind Power Convers. Technol. 2009, 12, 640–659. [Google Scholar] [CrossRef]
  44. Tsampasis, E.; Bargiotas, D.; Elias, C.; Sarakis, L. Communication Challenges in Smart Grid; EDP Sciences: Punjab, India, 2016; Volume 41. [Google Scholar]
  45. Petersen, B.; Bindner, H.; Poulsen, B.; You, S. Smart Grid Communication Infrastructure Comparison. In Proceedings of the ICPES Conference Procedings, Pune, India, 21–23 December 2017. [Google Scholar]
  46. Khan, Z.A.; Faheem, Y. Cognitive radio sensor networks: Smart communication for smart grids—A case study of Pakistan. Renew. Sustain. Energy Rev. 2014, 40, 463–474. [Google Scholar] [CrossRef]
  47. Bahaghighat, M.; Naghdehforushha, A.; Salehifar, M.R.; Mirfattahi, M. Designing Straight Coaxial Connectors for Feeder and Jumpers in Cellular Mobile Base Stations. Acta Tech. Napocensis Electron.-Telecomunicatii 2018, 59, 1–9. [Google Scholar]
  48. Hasani, S.; Bahaghighat, M.; Mirfatahia, M. The Mediating Effect of the Brand on the Relationship Between Social Network Marketing and Consumer Behavior. Acta Tech. Napoc. 2019, 60, 1–6. [Google Scholar]
  49. Naghdehforushha, S.A.; Bahaghighat, M.; Salehifar, M.R.; Kazemi, H. Design of Planar Plate Monopole Antenna with Vertical Rectangular Cross-Sectional Plates for Ultra-Wideband Communications. Facta Univ. Ser. Electron. Energ. 2018, 31, 641–650. [Google Scholar] [CrossRef] [Green Version]
  50. Esmaeili Kelishomi, A.; Garmabaki, A.; Bahaghighat, M.; Dong, J. Mobile User Indoor-Outdoor Detection through Physical Daily Activities. Sensors 2019, 19, 511. [Google Scholar] [CrossRef] [PubMed] [Green Version]
  51. Akyol, B.A.; Kirkham, H.; Clements, S.L.; Hadley, M.D. A Survey of Wireless Communications for the Electric Power System; Technical Report; Pacific Northwest National Lab. (PNNL): Richland, WA, USA, 2010. [Google Scholar]
  52. Dasilva, C.A.; Ismael, M.A.; Zaina, C.M.; Ruiz, L.B. Towards WMSN performance using different packet size. In Proceedings of the 2016 IEEE SENSORS, Orlando, FL, USA, 30 October–3 November 2016; pp. 1–3. [Google Scholar]
  53. Greer, C.; Wollman, D.A.; Prochaska, D.E.; Boynton, P.A.; Mazer, J.A.; Nguyen, C.T.; FitzPatrick, G.J.; Nelson, T.L.; Koepke, G.H.; Hefner, A.R., Jr.; et al. Nist Framework and Roadmap for Smart Grid Interoperability Standards, Release 3.0; National Institute of Standards and Technology (NIST): Gaithersburg, MD, USA, 2014. [Google Scholar]
  54. Bressan, N.; Bazzaco, L.; Bui, N.; Casari, P.; Vangelista, L.; Zorzi, M. The deployment of a smart monitoring system using wireless sensor and actuator networks. In Proceedings of the 2010 First IEEE International Conference on Smart Grid Communications (SmartGridComm), Gaithersburg, MD, USA, 4–6 October 2010; pp. 49–54. [Google Scholar]
  55. Nikolic, A.B.; Neskovic, N.; Antic, R.; Anastasijevic, A. Industrial Wireless Sensor Networks as a Tool for Remote On-Line Management of Power Transformers’ heating and Cooling Process. Facta Univ. Ser. Electron. Energ. 2016, 30, 107–119. [Google Scholar] [CrossRef] [Green Version]
  56. Gutiérrez, J.A.; Durocher, D.B.; Lu, B.; Habetler, T.G. Applying wireless sensor networks in industrial plant energy evaluation and planning systems. In Proceedings of the Conference Record of 2006 Annual Pulp and Paper Industry Technical Conference, Appleton, WI, USA, 18–23 June 2006; pp. 1–7. [Google Scholar]
  57. Gungor, V.C.; Lu, B.; Hancke, G.P. Opportunities and challenges of wireless sensor networks in smart grid. IEEE Trans. Ind. Electron. 2010, 57, 3557–3564. [Google Scholar] [CrossRef] [Green Version]
  58. Ravindranath, N.; Singh, I.; Prasad, A.; Rao, V. Performance Evaluation of IEEE 802.11 ac and 802.11 n using NS3. Indian J. Sci. Technol. 2016, 9. [Google Scholar] [CrossRef]
  59. De Domenico, A.; Strinati, E.C.; Di Benedetto, M.G. A survey on MAC strategies for cognitive radio networks. IEEE Commun. Surv. Tutor. 2010, 14, 21–44. [Google Scholar] [CrossRef]
  60. Gao, Y.; Jiang, Y. Performance analysis of a cognitive radio network with imperfect spectrum sensing. In Proceedings of the 2010 INFOCOM IEEE Conference on Computer Communications Workshops, San Diego, CA, USA, 15–19 March 2010; pp. 1–6. [Google Scholar]
  61. Tsiropoulos, G.I.; Dobre, O.A.; Ahmed, M.H.; Baddour, K.E. Radio resource allocation techniques for efficient spectrum access in cognitive radio networks. IEEE Commun. Surv. Tutor. 2014, 18, 824–847. [Google Scholar] [CrossRef]
  62. Deng, R.; Chen, J.; Cao, X.; Zhang, Y.; Maharjan, S.; Gjessing, S. Sensing-performance tradeoff in cognitive radio enabled smart grid. IEEE Trans. Smart Grid 2013, 4, 302–310. [Google Scholar] [CrossRef]
  63. Awin, F.; Abdel-Raheem, E.; Ahmadi, M. Joint optimal transmission power and sensing time for energy efficient spectrum sensing in cognitive radio system. IEEE Sens. J. 2016, 17, 369–376. [Google Scholar] [CrossRef]
  64. Wang, S.; Shi, W.; Wang, C. Energy-efficient resource management in OFDM-based cognitive radio networks under channel uncertainty. IEEE Trans. Commun. 2015, 63, 3092–3102. [Google Scholar] [CrossRef]
  65. Bemaninejad, S. Providing Quality of Service in Cognitive Radio Sensor Networks: A Survey. Int. J. Comput. Sci. Inf. Secur. 2016, 14, 270. [Google Scholar]
  66. Bicen, A.O.; Gungor, V.C.; Akan, O.B. Delay-sensitive and multimedia communication in cognitive radio sensor networks. Ad Hoc Netw. 2012, 10, 816–830. [Google Scholar] [CrossRef] [Green Version]
  67. Akan, O.B.; Karli, O.B.; Ergul, O. Cognitive radio sensor networks. IEEE Netw. 2009, 23, 34–40. [Google Scholar] [CrossRef]
  68. Shahab, E. Impact of Spectrum Sensing and Primary User Activity on MAC Delay in Cognitive Radio Networks. Int. J. Comput. Sci. Inf. Secur. 2015, 13, 48. [Google Scholar]
  69. Ye, C.; Ozcan, G.; Gursoy, M.C.; Velipasalar, S. Multimedia transmission over cognitive radio channels under sensing uncertainty. IEEE Trans. Signal Process. 2015, 64, 726–741. [Google Scholar] [CrossRef] [Green Version]
  70. Chaoub, A.; Elhaj, E.I. Multimedia traffic transmission over cognitive radio TDMA networks under secondary collision errors. In Proceedings of the 2011 3rd International Conference on Next Generation Networks and Services (NGNS), Hammamet, Tunisia, 18–20 December 2011; pp. 72–77. [Google Scholar]
  71. Javadi, G.; Hajshirmohammadi, A.; Liang, J. JPEG2000 image transmission over OFDM-based cognitive radio network. In Proceedings of the 2015 International Conference and Workshop on Computing and Communication (IEMCON), Vancouver, BC, Canada, 15–17 October 2015; pp. 1–6. [Google Scholar]
  72. Huang, X.L.; Wang, G.; Hu, F.; Kumar, S. The impact of spectrum sensing frequency and packet-loading scheme on multimedia transmission over cognitive radio networks. IEEE Trans. Multimed. 2011, 13, 748–761. [Google Scholar] [CrossRef]
  73. Kushwaha, H.; Xing, Y.; Chandramouli, R.; Heffes, H. Reliable multimedia transmission over cognitive radio networks using fountain codes. Proc. IEEE 2007, 96, 155–165. [Google Scholar] [CrossRef]
  74. Arjoune, Y.; Kaabouch, N. A comprehensive survey on spectrum sensing in cognitive radio networks: Recent advances, new challenges, and future research directions. Sensors 2019, 19, 126. [Google Scholar] [CrossRef] [PubMed] [Green Version]
  75. Bagwari, A.; Bagwari, J.; Tomar, G.S. Sensing Techniques for Next Generation Cognitive Radio Networks; IGI Global: Hershey, PA, USA, 2019; pp. 125–132. [Google Scholar]
  76. Aneja, B.; Sharma, K.; Rana, A. Spectrum sensing techniques for a cognitive radio network. In Advances in System Optimization and Control; Springer: Heidelberg/Berlin, Germany, 2019; pp. 133–144. [Google Scholar]
  77. Sambana, B.; Reddy, L.S.; Nayak, D.R.; Rao, K.C.B. Integrative Spectrum Sensing in Cognitive Radio Using Wireless Networks. In Proceedings of International Conference on Remote Sensing for Disaster Management; Springer: Visakhapatnam, India, 2019; pp. 613–623. [Google Scholar]
  78. Tekanyi, A.; Raymond, J.; Usman, A. Optimization of Spectrum Sensing Time in a Cooperative Cognitive Radio. ATBU J. Sci. Technol. Educ. 2019, 7, 133–142. [Google Scholar]
  79. Zhang, H.; Nie, Y.; Cheng, J.; Leung, V.C.; Nallanathan, A. Sensing time optimization and power control for energy efficient cognitive small cell with imperfect hybrid spectrum sensing. IEEE Trans. Wirel. Commun. 2016, 16, 730–743. [Google Scholar] [CrossRef] [Green Version]
  80. Jin, Z.; Kong, F.; Cho, J.; Kim, C.W.; Na, S. Joint optimization of sensing period and transmission time for energy-efficient CRSNs. In Proceedings of the 11th International Conference on Ubiquitous Information Management and Communication, Beppu, Japan, 5–7 January 2017; p. 112. [Google Scholar]
  81. Cui, C.; Yang, D. Throughput optimization for dual collaborative spectrum sensing with dynamic scheduling. Mod. Phys. Lett. B 2017, 31, 1740089. [Google Scholar] [CrossRef] [Green Version]
  82. Shah, G.A.; Akan, O.B. Performance analysis of CSMA-based opportunistic medium access protocol in cognitive radio sensor networks. Ad Hoc Netw. 2014, 15, 4–13. [Google Scholar] [CrossRef]
  83. Su, H.; Zhang, X. Opportunistic MAC protocols for cognitive radio based wireless networks. In Proceedings of the 2007 41st Annual Conference on Information Sciences and Systems, Baltimore, MD, USA, 14–16 March 2007; pp. 363–368. [Google Scholar]
  84. Bahaghighat, M.; Motamedi, S.A. IT-MAC: Enhanced MAC Layer for Image Transmission Over Cognitive Radio Sensor Networks. Int. J. Comput. Sci. Inf. Secur. 2016, 14, 234. [Google Scholar]
  85. Bahaghighat, M.; Motamedi, S.A. PSNR enhancement in image streaming over cognitive radio sensor networks. ETRI J. 2017, 39, 683–694. [Google Scholar] [CrossRef] [Green Version]
  86. Karimimehr, N.; Shirazi, A.A.B.; Bahaghighat, M.K. Fingerprint image enhancement using gabor wavelet transform. In Proceedings of the 2010 18th Iranian Conference on Electrical Engineering, Isfahan, Iran, 11–13 May 2010; pp. 316–320. [Google Scholar]
  87. Akbari, R.; Keshavarz, M.; Mohammadi, J. Legendre moments for face identification based on single image per person. In Proceedings of the 2010 2nd International Conference on Signal Processing Systems, Dalian, China, 5–7 July 2010; Volume 1, pp. V1–V248. [Google Scholar]
  88. Bahaghighat, M.K.; Akbari, R.; Mohammadi, J. Fingerprint image enhancement using GWT and DMF. In Proceedings of the 2010 2nd International Conference on Signal Processing Systems, Dalian, China, 5–7 July 2010; Volume 1, pp. V1–V253. [Google Scholar]
  89. Babaie, M.; Shiri, M.E.; Bahaghighat, M. A new descriptor for UAV images mapping by applying discrete local radon. In Proceedings of the 2018 8th Conference of AI & Robotics and 10th RoboCup Iranopen International Symposium (IRANOPEN), Qazvin, Iran, 10 April 2018; pp. 52–56. [Google Scholar]
  90. Bahaghighat, M.K.; Mohammadi, J. Novel Approach for Baseline Detection and Text Line Segmentation. Int. J. Comput. Appl. 2012, 51, 9–16. [Google Scholar]
  91. Huang, Y.; Niu, B.; Guan, H.; Zhang, S. Enhancing Image Watermarking with Adaptive Embedding Parameter and PSNR Guarantee. IEEE Trans. Multimed. 2019, 21, 2447–2460. [Google Scholar] [CrossRef]
  92. Gautam, S.; Amhia, H. Improvement of PSNR in Image Denoising by using DWT Algorithm. In Proceedings of the 2019 International Conference on Communication and Signal Processing (ICCSP), Chennai, India, 4–6 April 2019; pp. 685–689. [Google Scholar]
  93. Jaya, V.; Gopikakumari, R. IEM: A new image enhancement metric for contrast and sharpness measurements. Int. J. Comput. Appl. 2013, 79, 1–9. [Google Scholar]
  94. Damera-Venkata, N.; Kite, T.D.; Geisler, W.S.; Evans, B.L.; Bovik, A.C. Image quality assessment based on a degradation model. IEEE Trans. Image Process. 2000, 9, 636–650. [Google Scholar] [CrossRef] [PubMed] [Green Version]
  95. Al-Zuky, A.A.; Salman, S.S.; Al-Saleh, A.H. Study the Quality of Image Enhancement by using Retinex Technique which Capture by different Lighting (Sun and Tungsten). Int. J. Comput. Appl. 2013, 975, 8887. [Google Scholar] [CrossRef]
  96. Baseri, M.; Motamedi, S.A. Simulation study of packet length for improving throughput of IEEE 802.15. 4 for image transmission in WSNs. In Proceedings of the 2013 The International Conference on Technological Advances in Electrical, Electronics and Computer Engineering (TAEECE), Konya, Turkey, 9–11 May 2013; pp. 6–9. [Google Scholar]
Figure 1. Communication networks and their interconnections within smart grids [28].
Applsci 09 05498 g001
Figure 2. The average amount of time overhead for the constant value of X (ETOH = E ( τ O H i ) ).
Applsci 09 05498 g002
Figure 3. The average time overhead for the constant value of packet size.
Applsci 09 05498 g003
Figure 4. The impact of the spectrum sensing time on the expected value of time overhead for a constant value of X and packet time variations.
Applsci 09 05498 g004
Figure 5. The impact of the spectrum sensing time on the expected value of time overhead for a constant value of packet time and variation of X.
Applsci 09 05498 g005
Figure 6. The objective function f vs. optimization parameters: X and packet size; (a) f vs. X; (b) f vs. τ p i ;
Applsci 09 05498 g006
Figure 7. Our proposed algorithm for delay-sensitive image transmission in cognitive radio networks (CRNs).
Applsci 09 05498 g007
Figure 8. Number of Spectrum Sensing Iterations (NSSI) vs. Arrival rates ( λ i ) of primary users (lambda).
Applsci 09 05498 g008
Figure 9. Packet length (in μs) vs. Arrival rate ( λ i ) of primary users (lambda).
Applsci 09 05498 g009
Figure 10. The comparison of time overhead expected value for N S S I = 1 , 4 and N S S I = 22 = X * (the achieved value using proposed JOPSS model).
Applsci 09 05498 g010
Figure 11. Effectiveness evaluation of the proposed channel selection algorithm Minimum of Overhead Time Channel Selection (MOTS) on channels contribution. (a) The first scenario (increasing arrival rate from CNI = 1 to 10); (b) The second scenario (decreasing arrival rate from CNI = 1 to 10); (c) The third scenario (constant arrival rate for all sub-channels).
Applsci 09 05498 g011
Figure 12. A successful transmission within the allowed time. (a) The transmitted image; (b) The received image; (c) Error Energy (EE) image.
Applsci 09 05498 g012
Figure 13. Comparing the transmitted and received images in an unsuccessful transmission. (ac) Red, Green, and Blue sub channels (Original image); (df) Red, Green, and Blue sub channels (Received image); (gi) Error Energy (EE) images for sub channels.
Applsci 09 05498 g013
Figure 14. Comparing the transmitted and received color images in an unsuccessful transmission; (a) Original image; (b) Received image; (c) Error Energy (EE) image.
Applsci 09 05498 g014
Figure 15. Results of applying the proposed JOPSS-SAFE method to improve PSNR; (a) Received image (sub channels); (b) Error Energy (EE) image (sub channels).
Applsci 09 05498 g015
Figure 16. Color image with Error Energy (EE) image based on the proposed JOPSS & JOPSS-SAFE models; (a,b) JOPSS; (c,d) JOPSS-SAFE.
Applsci 09 05498 g016aApplsci 09 05498 g016b
Table 1. IEEE 1646 standard on communication timing requirements for electric substation automation [29].
Information TypesInternal to SubstationExternal to Substation
Protection information4 ms8–12 ms
Monitoring and control16 ms1 s
Operations and maintenance1 s10 s
Text strings2 s10 s
Processed data files10 s30 s
Program files60 s600 s
Image files10 s60 s
and Video data streams1 s1 s
Table 2. IEC 61850 communication networks and systems in substations: communication requirements for functions and device models in Smart Grids (SGs) [28].
Message TypeExample ApplicationTime Constraint
Type 1Fast messages such as circuit breaker commands and states1 A: 3 ms or 10 ms, 1 B: 20 ms or 100 ms
Type 2Medium speed messages100 ms
Type 3Low speed messages such as Alarms, non-electrical measurements, configurations500 ms
Type 4Raw data messages such as Digital representation of electrical measurement (SV)3 ms or 10 ms
Type 5Large file transfer for example image, video, and files of data for recording settings1000 ms
Type 6Time synchronization messages such as IED internal clock synchronizationNone
Type 7Command messages with access controlEquivalent to Type 1 or Type 3
Table 3. List of parameters that were used in the proposed Media Access Control (MAC) layer.
SymbolDescriptionsValue/Application/Method
I b Image frame Payload I b = r c d n , r = c = 512 , d = 3
D m Maximum tolerable delayVariable parameter
T s Spectrum sensing time duration T s = 0.01 s / E n e r g y D e t e c t i o n
P M Misdetection probability P M = 0
P c Correct detection probability P c = 1
P f False alarm probability P f = 0.01
SNumber of channels in spectrum poolVariable parameter
μ i Average time arrival of primary users in ith channelVariable parameter
λ i Average time arrival of primary users in ith channelVariable parameter
τ P i Time length of the sending packet in ith channelOptimization parameter
X i Spectrum sensing iterations in ith channelOptimization parameter
τ O . H Time overhead due to spectrum sensing and retransmissionObjective function
τ E T T i Effective transmission time in ith channelObjective function
Table 4. Performance comparison among our proposed JOPSS and JOPSS-SAFE with others found on PSNR.
D [72] [52] [96]JOPSSJOPSS-SAFE
0.35 S16.8016.767.3918.8124.93
0.40 S18.9917.847.3922.527.3
0.45 S19.0118.027.3923.1229.51
1.00 S25.4924.727.4129.6731.79
195 SINFINF17.1INF32.81
Table 5. Comparing SSIM, MSSIM, FSIM, and PSNR using JOPSS method.
DSSIMMSSIMFSIMPSNR
0.35 S0.780.920.9118.81
0.40 S0.850.940.9422.50
0.45 S0.860.950.9423.12
1.00 S0.920.970.9629.67
Table 6. Performance comparison based on FSIM.
D [72] [52] [96]JOPSS
0.45 S0.920.910.830.94
1.00 S0.940.940.830.96