1. Introduction
With the exponential growth of data information, optical communication networks are becoming more and more intelligent and elastic [
1]. Optical performance monitoring (OPM), especially in optical signal-to-noise ratio (OSNR), will play an important role in optical link diagnosis, flexible bandwidth allocation, and fast network service deployment [
2]. In high-speed long-haul optical transmission systems, amplified spontaneous emission (ASE) noise from erbium-doped fiber amplifier (EDFA) is one of the main factors resulting in the degradation of the transmitted signals. Different from fiber dispersion and nonlinearity, it cannot be eliminated by some compensation methods. In this case, all-optical regeneration technology has attracted much attention [
3], especially to high-order modulation signal regeneration, such as multi-level amplitude regeneration based on nonlinear interference structure [
4,
5], multi-stage phase regeneration based on phase-sensitive four-wave mixing (FWM) [
6,
7], and several regeneration schemes of quadrature amplitude modulation (QAM) signals [
8,
9].
Just like in-line EDFAs, all-optical regenerators are usually integrated into the intermediate nodes of optical links. However, most of the previous studies paid more attention to the regeneration performance in the electrical domain, instead of the optical domain. In other words, the OSNR improvement for all-optical regenerators is seldom considered in experiments due to a lack of more accurate OSNR measurement methods in the optical domain. As is well-known, the traditional OSNR measurement method used in WDM systems is based on the spectral interpolation technique by optical spectrum analysis [
10]. Unfortunately, the use of optical filters or all-optical regenerators can give rise to the out-band distortion of the optical spectrum distribution, and then the validation of the interpolation measurement. Secondly, the coherent receivers are extensively used in high-order modulation systems such as those of quadrature phase-shift keying (QPSK) or QAM signals, so the performance of all-optical regenerators is often evaluated in the electrical domain as well. In fact, there are many reports about the in-band OSNR measurements by means of optical delay interferometer [
11], polarization-nulling method [
12], spectrum analysis techniques [
13], the nonlinear approach [
14], and data stream intensity autocorrelation [
15]. But, these electrical methods are dependent on complex measurement devices, and difficult to be applied in the intermediate transmission links. In addition, many digital signal processing (DSP) based in-band OSNR measurement methods, such as neural network algorithms [
16,
17,
18], training sequence assisted technique [
19], were also studied. Certainly, an additional photoelectric noise introduced by the coherent receiver has an influence on the accuracy of OSNR measurement. Moreover, the expensive hardware cost and high-speed sampling devices needed in digital coherent receivers hinder the practical application of the electrical method to some extent.
In this paper, we present an all-optical measurement method for the output OSNR of all-optical regenerators, which can be calculated from the signal gain and the total gain of the degraded signal, as well as the input OSNR. The proposed method is validated by simulating the all-optical QPSK regenerator consisting of a phase-sensitive amplifier (PSA) and amplitude reshaping unit. Our results show that the OSNRs obtained by this method are in agreement with the calculated data by the error vector magnitude (EVM) of received QPSK signals, and the OSNR can be improved by more than 3 dB in the input OSNR range of 10–26 dB. The remainders of this paper are organized as follows.
Section 2 explains the gain characteristics of signal and noise and puts forward the optical-domain measurement method of OSNR for all-optical regenerators. In
Section 3, an optical QPSK regenerator is taken into account to verify the feasibility of the proposed measurement method by simulation. And then, the output OSNR of the optical regenerator is simulated and compared with the calculated value by the EVM in
Section 4. The applicability of the in-band measurement method at different data rates is also investigated and discussed. Finally,
Section 5 draws the conclusions of the paper.
2. Principle of the Measurement Method for All-Regenerator
In what follows, we firstly describe the gain characteristics of signal and noise through the nonlinear power transfer function (PTF) and then put forward the optical-domain measurement method of OSNR for all-optical regenerators.
Figure 1 illustrates the power spectrum variation of the signal and noise within the same bandwidth through a device with the nonlinear PTF by the VPIphotonics
TM simulation software. The spectra of the input optical Gaussian pulse and amplified spontaneous emission (ASE) noise at the same average power are plotted in
Figure 1a, corresponding to the power distribution histograms as shown in
Figure 1b. The horizontal axis represents the probability of the instantaneous power occurrence. It is obvious that the power distributions of the optical pulse and ASE noise have a great difference. After those power components pass through a device with the nonlinear transfer as shown in
Figure 1c, the resulting output power distributions have a distinct change as shown in
Figure 1d, and then result in different gains of the signal and noise. From
Figure 1b,d, the average power ratios of the pulse signal to ASE noise are respectively 1:1 and 1.64:1 before and after the nonlinear PTF. The increase in the power ratio means the improvement of OSNR.
In the following, we take the all-optical four-wave mixing (FWM)-based regenerator as an example, to reveal the principle of the proposed in-band measurement method. Firstly, according to the PTF of the regenerator, we obtain the gain at the operating point,
, in which
is the input power. For a degraded signal, the total powers at the input and output of the regenerator can respectively be expressed as
and
, where the s and n subscripts represent the signal component and ASE noise, and the i and o subscripts indicate the input and output of the regenerator, respectively. Note that
at the operating point for the input and output signal. Thus, the average power of the output ASE noise can be expressed as
where
is the total gain for the input degraded signal. Then, the output
OSNR is deduced from Equation (1) as follows:
where
and
, corresponding to the input and output
OSNR respectively. It should be noted that the gain
is dependent on the input signal power at the operating point. For this reason, Equation (2) is applied to the cases with the same gain for each regenerative level, that is, the operating points locate on a common linear gain curve [
5].
Here, we introduce the parameter of the optical shaping figure (
OSF) in the optical domain to evaluate the measure of improving
OSNR as follows:
By substituting Equation (2) into Equation (3), the OSF parameter can then expressed as
From Equation (4), in the absence of noise,
and
OSF = 0 dB, with no
OSNR improvement. We can also deduce the condition for
OSF > 0 dB as follows:
According to the above analysis, the in-band measurement method for the OSF parameter or the OSNR output from the all-optical regenerator are described as follows: (1) Firstly, measure the PTF curve of the regenerator and choose the operating point for regeneration. At the same time, the signal gain G0 is also known. (2) Secondly, fix the input average power perfectly matching with the operating point, and adjust the input OSNRin by loading different power of ASE noise, in which the total gain G of the degraded signal can be measured by the optical power meter. (3) Finally, calculate the output OSNR and the OSF parameter of the optical regenerator from Equations (2) and (3), respectively. This in-band method is free of complex tests in the electrical domain and the limit of the out-band method in the optical domain.
3. Simulation Setup
As an example, to verify the feasibility of the proposed measurement method, we performed simulations and took the optical QPSK regenerator (similar to [
6]) into account. The corresponding block diagram is shown in
Figure 2. The detailed configuration consists of four parts, signal generation, phase-sensitive amplifier (PSA), amplitude reshaping, and coherent receiver. The PSA unit acts as the phase regeneration of the QPSK signal by the two main processes of harmonic generation and coherent superposition. And then, the FWM-based amplitude shaping unit is used to the amplitude regeneration and re-converted to the original input signal wavelength. The PSA and amplitude shaping units are combined together as the all-optical QPSK regenerator considered here, which is capable of achieving the wavelength preserving amplitude and phase regeneration for QPSK signals.
The whole simulation process is implemented by the industry-standard VPI simulation software, which is using the split-step approach to solve the Nonlinear Schrödinger Equation for pulse propagation. The signal generation unit includes two branches of QPSK signal and a coherent pump from a common continuous-wave laser at 193.22 THz for coherence. An ideal 10 Gbps QPSK signal is derived from an I/Q modulator in the lower branch, with a 215-1 pseudo-random binary sequence (PRBS), and the ASE module is used to adjust the input OSNR. Meanwhile, in the other branch, a Mach–Zehnder modulator is used to generate the optical frequency comb with a frequency bandwidth of 40 GHz, and then two coherent pumps are available at 193.26 THz and 193.1 THz output from a programmable filter.
In the PSA unit, the combination of the pumps and the degraded signal are launched to an EDFA before the non-degenerate PSA-FWM process in the first-section highly nonlinear fiber (HNLF1) with the nonlinear coefficient of
γ = 11.6 W
−1/km and the length of 0.3 km. The phase-regenerated QPSK signal is filtered out from the optical band pass filter (OBF1), with a central frequency of 193.14 THz. The input powers of the signal and the pumps (Pump1 and Pump2) are 178, 176, and 8 mW, respectively. It should be noted that two FWM processes take place in HNLF1 as shown in
Figure 2b, including third-harmonic generation (S
3) based on the cascaded FWM between Pump1 and signal S, and signal conjugation (S*) through non-degenerate FWM of Pump1, Pump2, and the signal S. In our simulation, we make use of the subsequent amplitude reshape unit to compensate the phase shift induced by the self-phase modulation and cross-phase modulation effects in the PSA unit, and then the nonlinear coefficient and fiber length of the HNLF1 are optimized to achieve the best regeneration performance.
To improve the regeneration performance of the QPSK regenerator, the amplitude noise introduced in the PSA unit may be suppressed by using an extra degenerate FWM-based amplitude reshaping unit, as shown in
Figure 2c. The nonlinear coefficient and fiber length of the second-section highly nonlinear fiber (HNLF2) used here are 10.8 W
−1/km and 2 km, respectively. The input power of the corresponding signal and Pump3 are 5 and 100 mW, respectively. The central frequencies of Pump3 and the optical band pass filter (OBF2) are set at 193.18 and 193.22 THz, respectively.
In our simulation, the bandwidth of OBPF1 and OBPF2 is double that of the QPSK signal, and an ideal coherent receiver is used here, that is, the additional O/E conversion noise is neglected. In
Figure 2a, the three 10:90 splitters are used to measure the input and output average optical power by the corresponding power meters.
4. Results and Discussion
In the PSA unit, the total power input to HNLF1 in PSA is fixed at 25 dBm by adjusting the gain of EDFA1. According to the parameters mentioned above, we first simulate the OSNR output from the PSA unit dependent on the input power ratio of Pump1 to the QPSK signal, in which the Pump2 power is always optimized for the best regeneration performance in each case. The simulation results are shown in
Figure 3, and the OSNR values are normalized to the 0.1 nm bandwidth. It can be seen from
Figure 3 that, when the input power ratio between Pump1 and the QPSK signal
= 2 dB, the output OSNR reaches the maximum of about 26 dB, in agreement with the experimental value presented in [
6], which indicates the validity of our simulation setup.
Next, we use the continuous wave to measure the PTF curve of the all-optical QPSK regenerator, as shown in
Figure 4. It can be seen that the output power is at saturation in the input signal power range from 0.15 to 0.2 W, in which the regenerator has a good noise suppression performance. Here, the center of the saturation region is selected as the input operating point of the QPSK regenerator, with the input power of 0.16 W corresponding to the gain of
G0 = 0.2059.
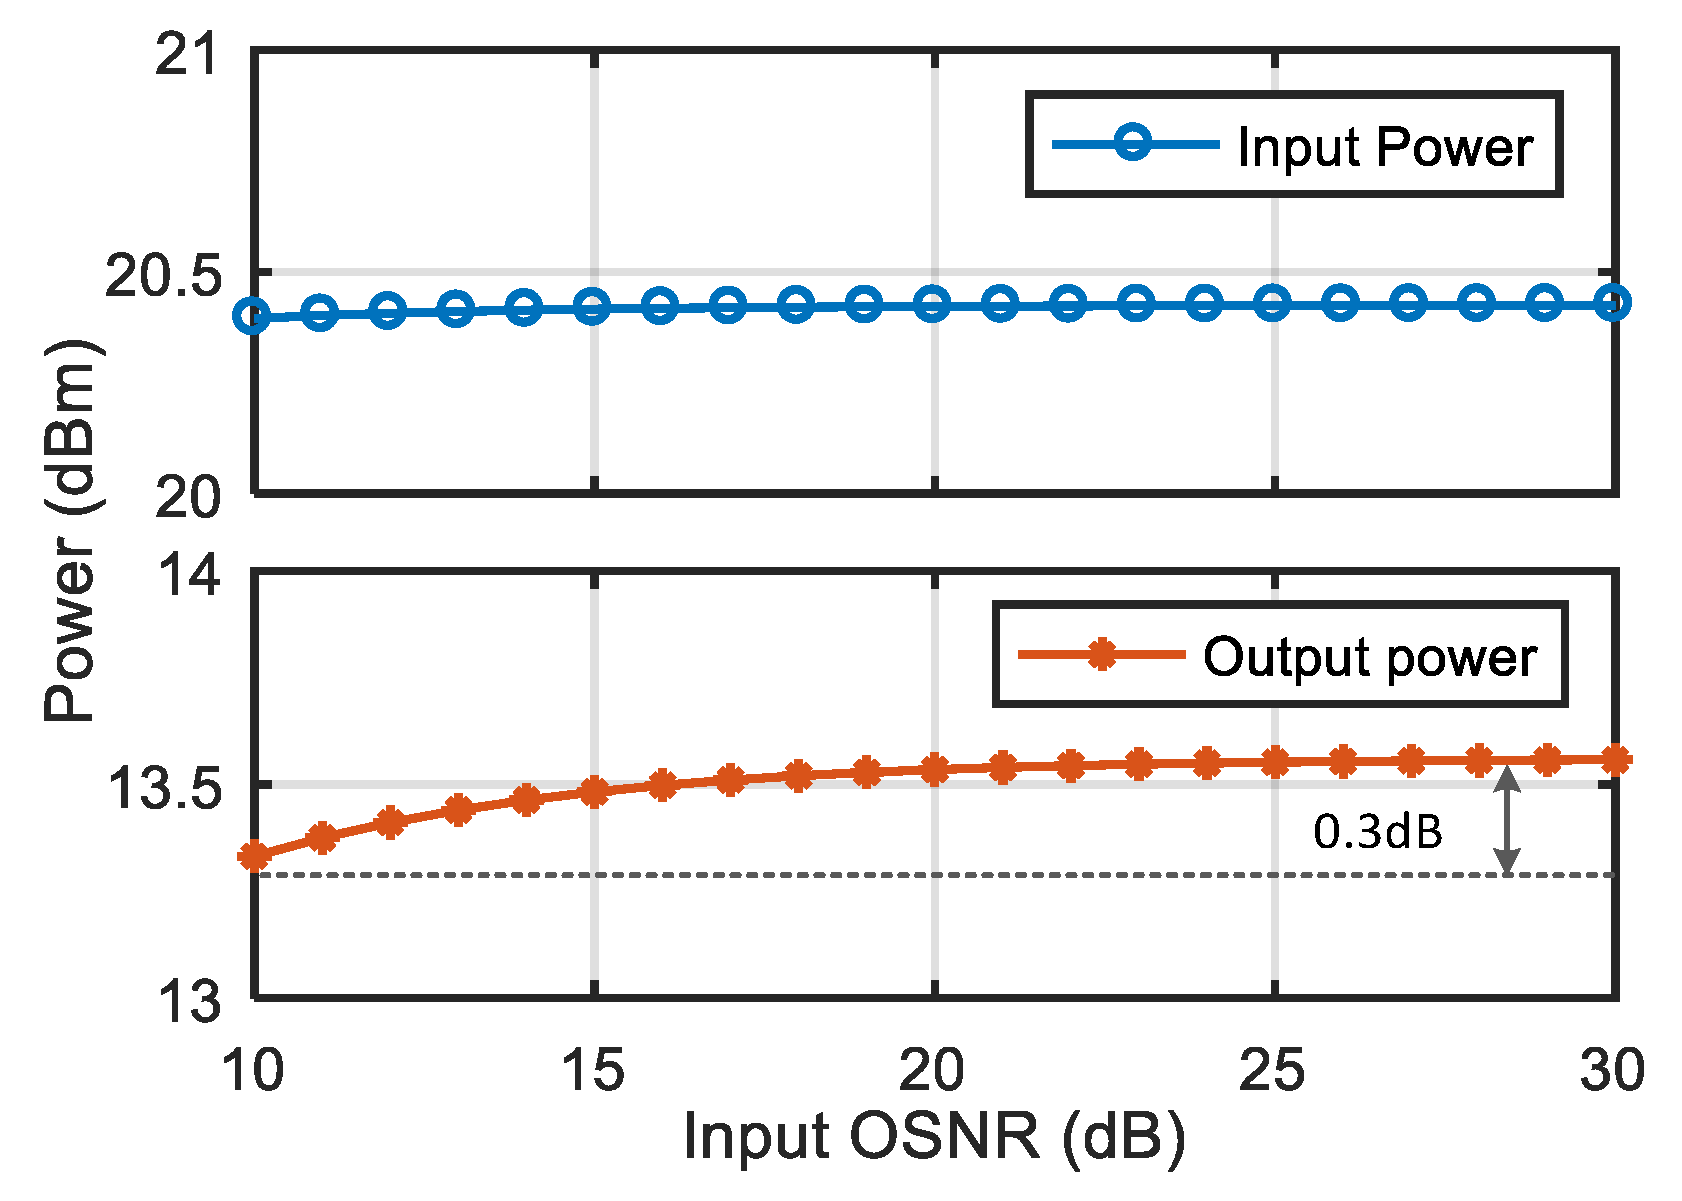
Further, under the case with the above optimal parameters, we simulate the variation of the average output power of the whole QPSK regenerator with the input
OSNR. The regenerator input and output average power are shown in
Figure 5. It can be seen from
Figure 5 that, in the calculation range of
OSNRin = 10–30 dB, the input power is approximately fixed at 20.46 dBm and the output power has a saturation value of about 13.6 dBm. From
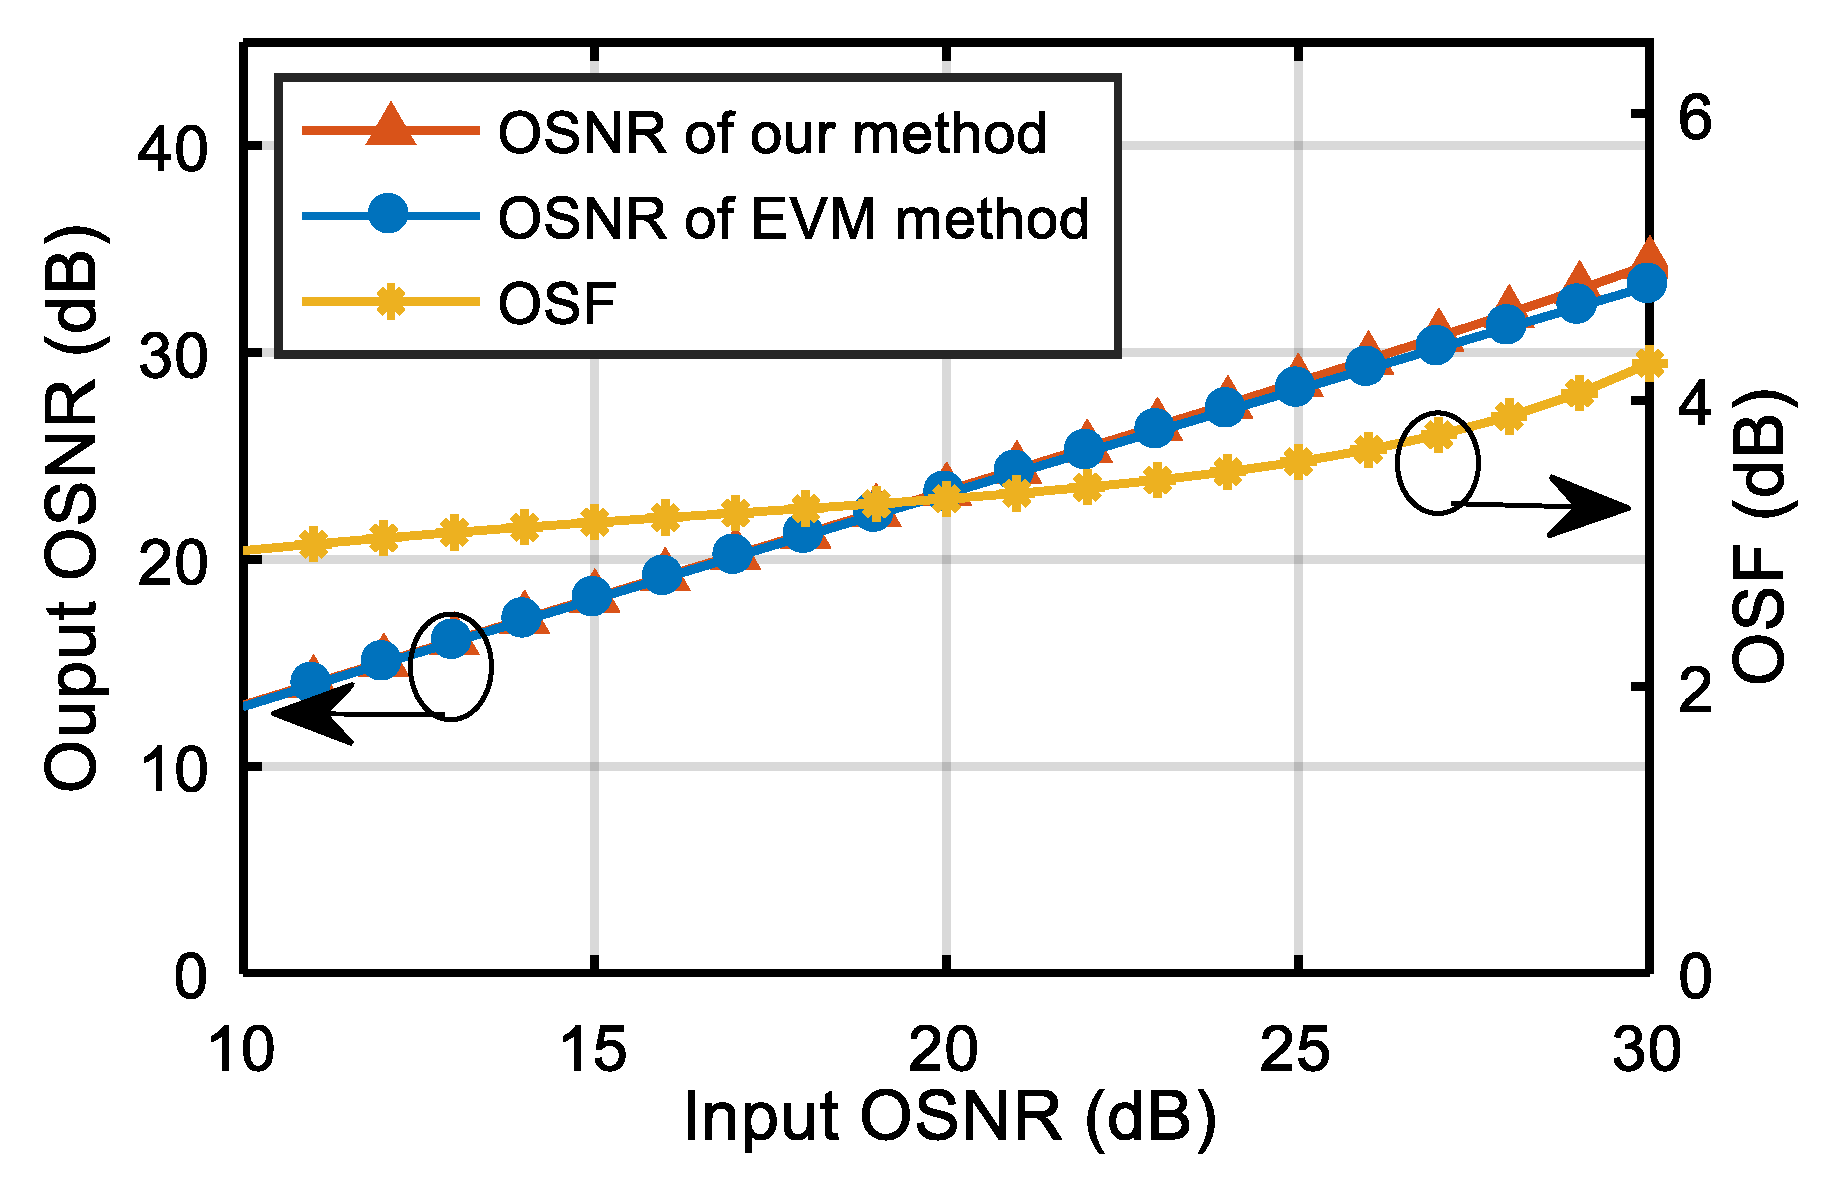
Figure 5 we can further get the total gain
G of the degraded signals, and then the output
OSNR and OSF for the QPSK regenerator can respectively be calculated from Equations (2) and (3), as shown in
Figure 6. As a comparison, we also plot the
OSNR curve calculated from the
EVM of the regenerated QPSK signal in
Figure 6, and the
OSNR formula in terms of
EVM used here is as follows [
20]:
From
Figure 6, the results obtained from the two methods are basically identical with each other, with a slight difference of less than 0.5 dB in the range of interest. The OSF of the QPSK regenerator is more than 3 dB in the input
OSNR range of 10 to 26 dB.
Finally, we investigate the applicability of the in-band measurement method at different data rates. In the above section, the 10 Gb/s QPSK signals are used to simulate the output OSNR of the optical regenerator. In the following, two additional cases at the data rates of 5 Gb/s and 20 Gb/s are taken into account and other calculation parameters are the same as used in
Figure 6. The output OSNR differences between our method and the EVM calculation at three data rates are still less than 0.5 dB as shown in
Figure 7. Therefore, the proposed OSNR measurement method can be applied to the various QPSK regenerators in spite of data rates.
From the above analysis, our method can be well applied to the QPSK signals with a single amplitude level. In fact, it can also be used to evaluate the output OSNR of multilevel signals only if each level of the multilevel signals have an identical linear gain at each operating point [
5]. In principle, for the case with different gain at each operating point, a similar analysis process may also be used in spite of complexity. In addition, it should be seen that our method can not only be useful for measuring the output OSNR of the all-optical regenerator but also applied to estimate the OSNR degradation induced by other nonlinear devices in optical communication links, such as all-optical modulation format conversion [
21,
22], all-optical wavelength conversion [
23], etc. To summarize, the in-band measurement method proposed here has advantages in cost and adaptability over the traditional OSNR measurement in the optical domain.


