Figure 1.
Research framework.
Figure 1.
Research framework.
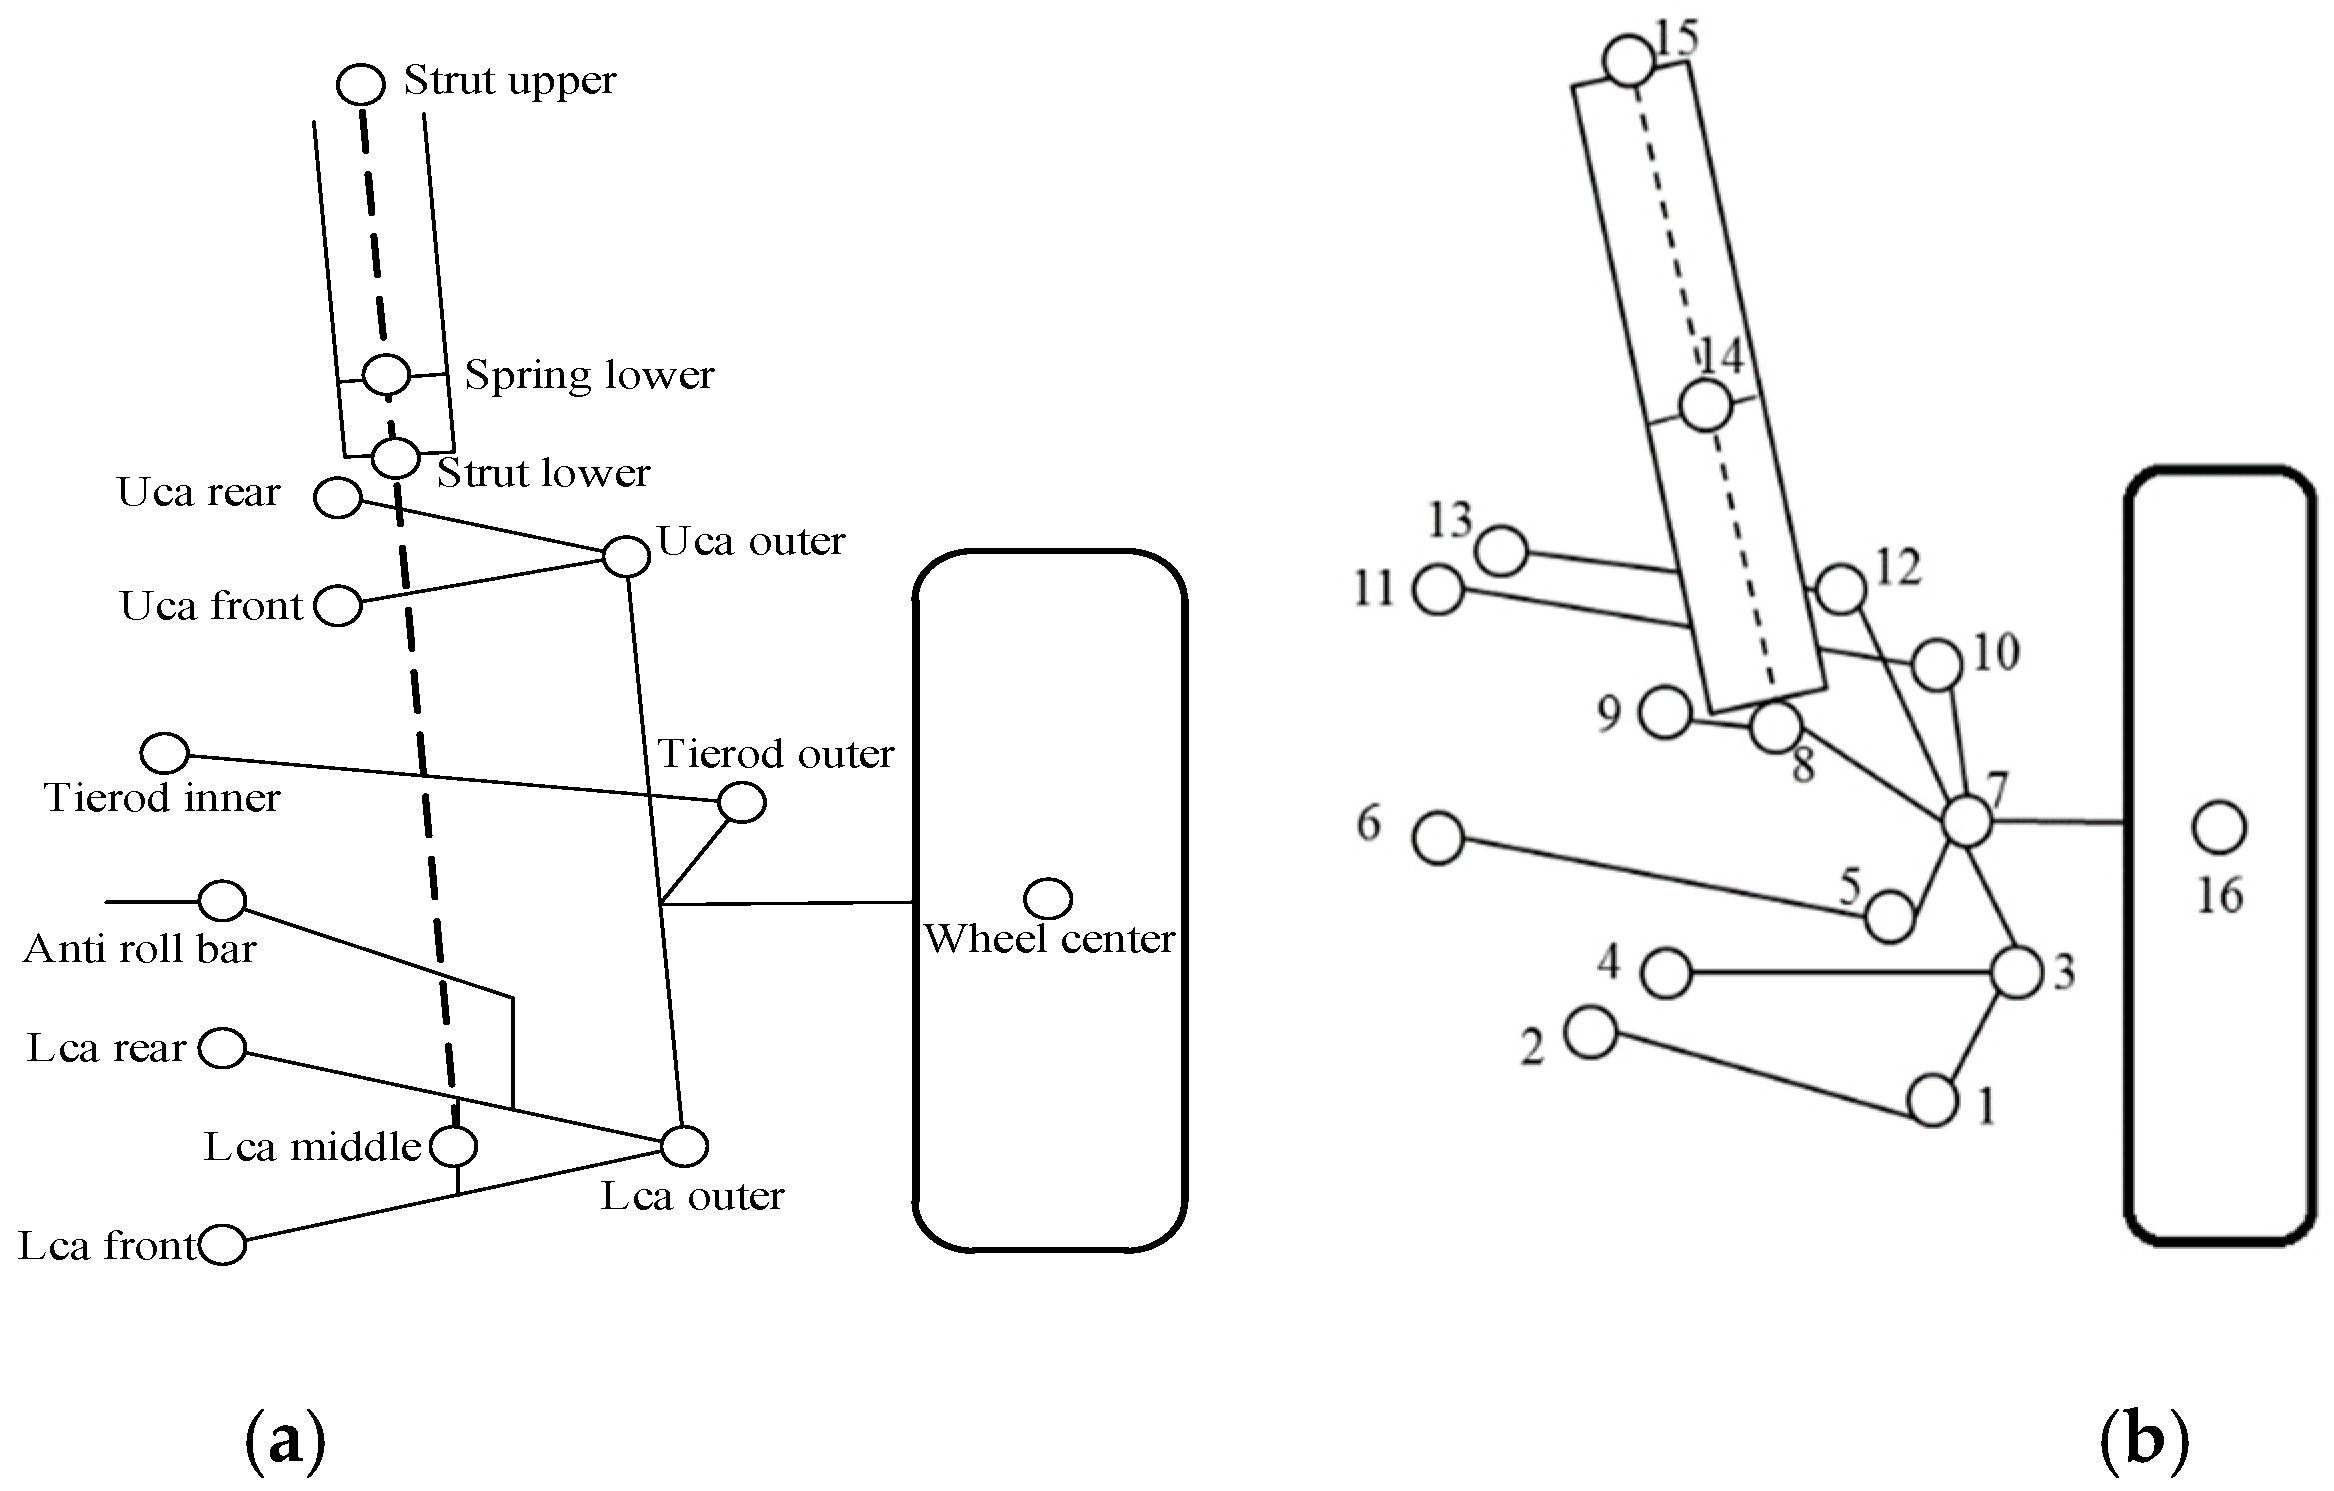
Figure 2.
Hardpoint positions in the front and rear suspension systems. (a) Hardpoint positions in the SLA strut suspension; (b) hardpoint positions in the multi-link suspension.
Figure 2.
Hardpoint positions in the front and rear suspension systems. (a) Hardpoint positions in the SLA strut suspension; (b) hardpoint positions in the multi-link suspension.
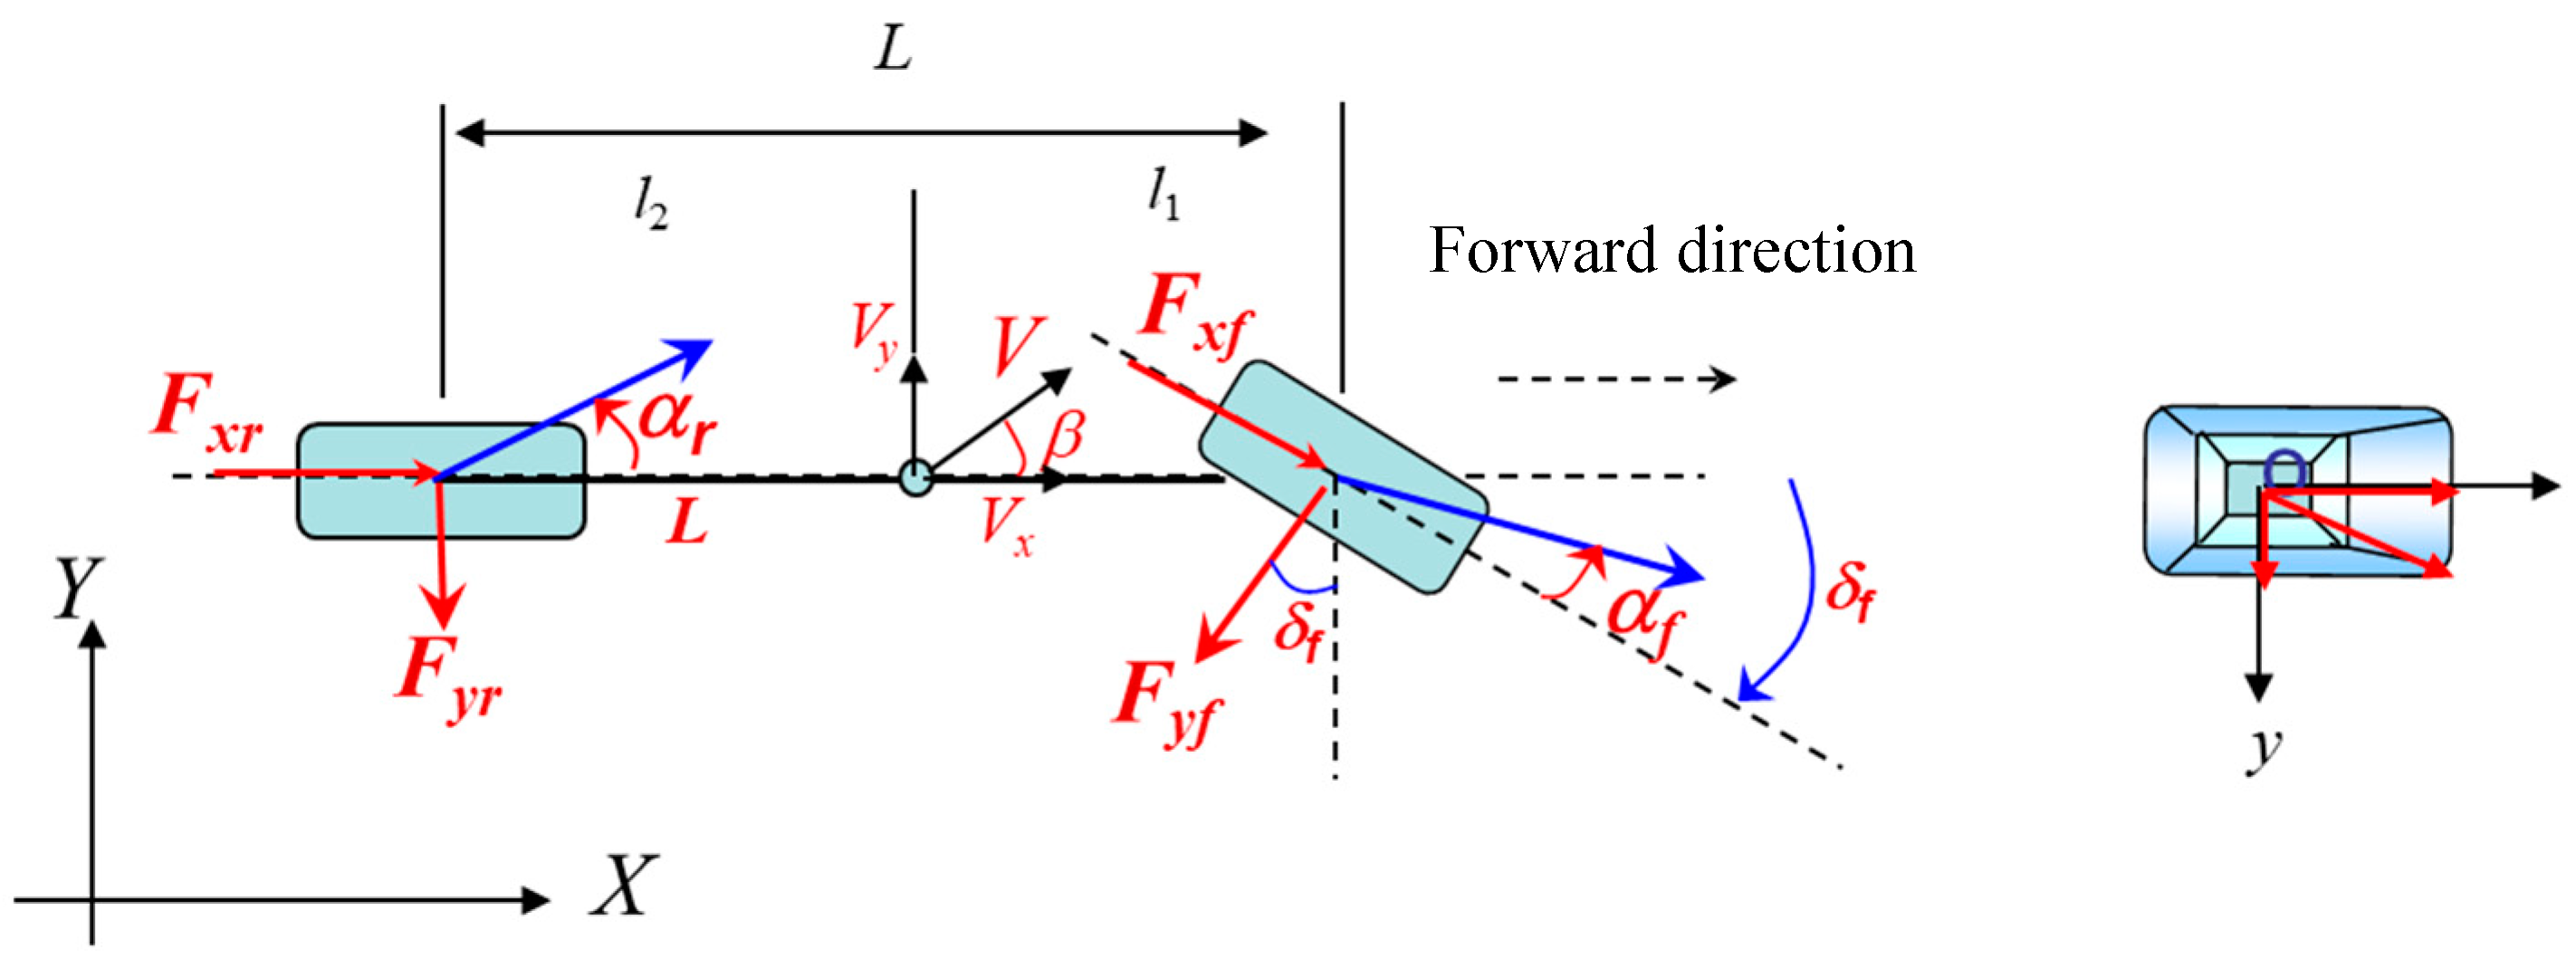
Figure 3.
Body-centered axis model.
Figure 3.
Body-centered axis model.
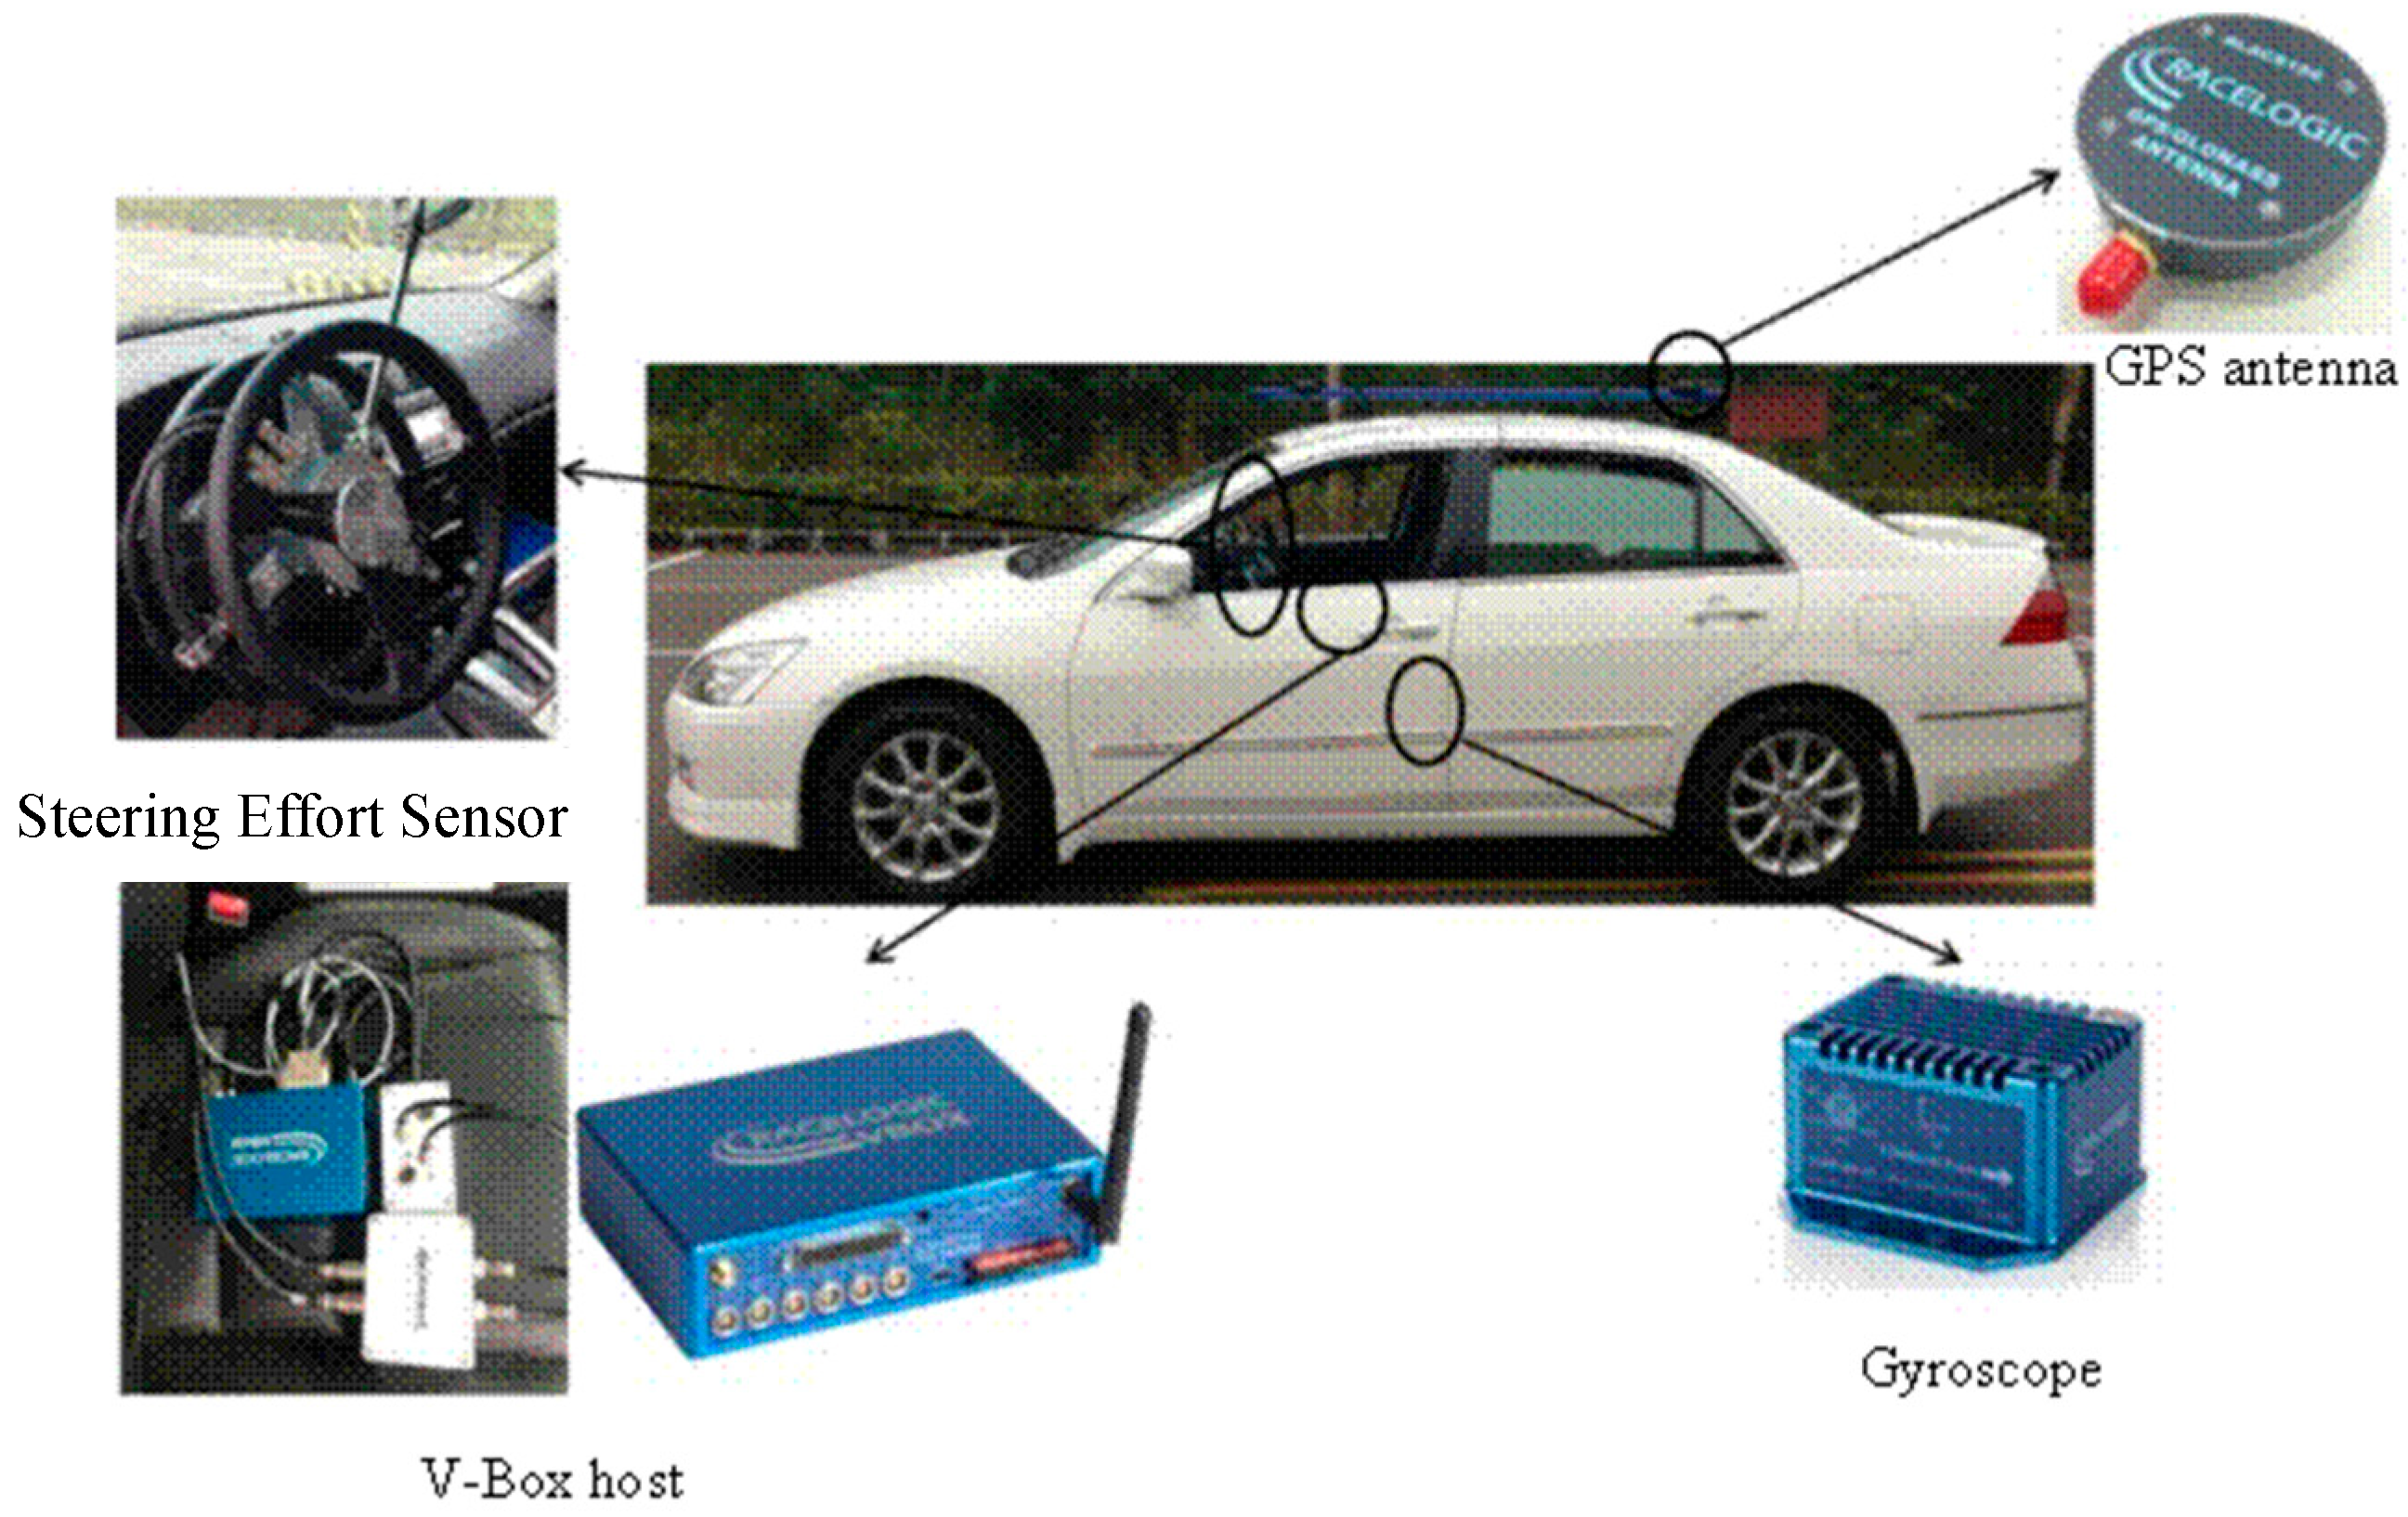
Figure 4.
Experimental platform for full vehicle dynamics.
Figure 4.
Experimental platform for full vehicle dynamics.
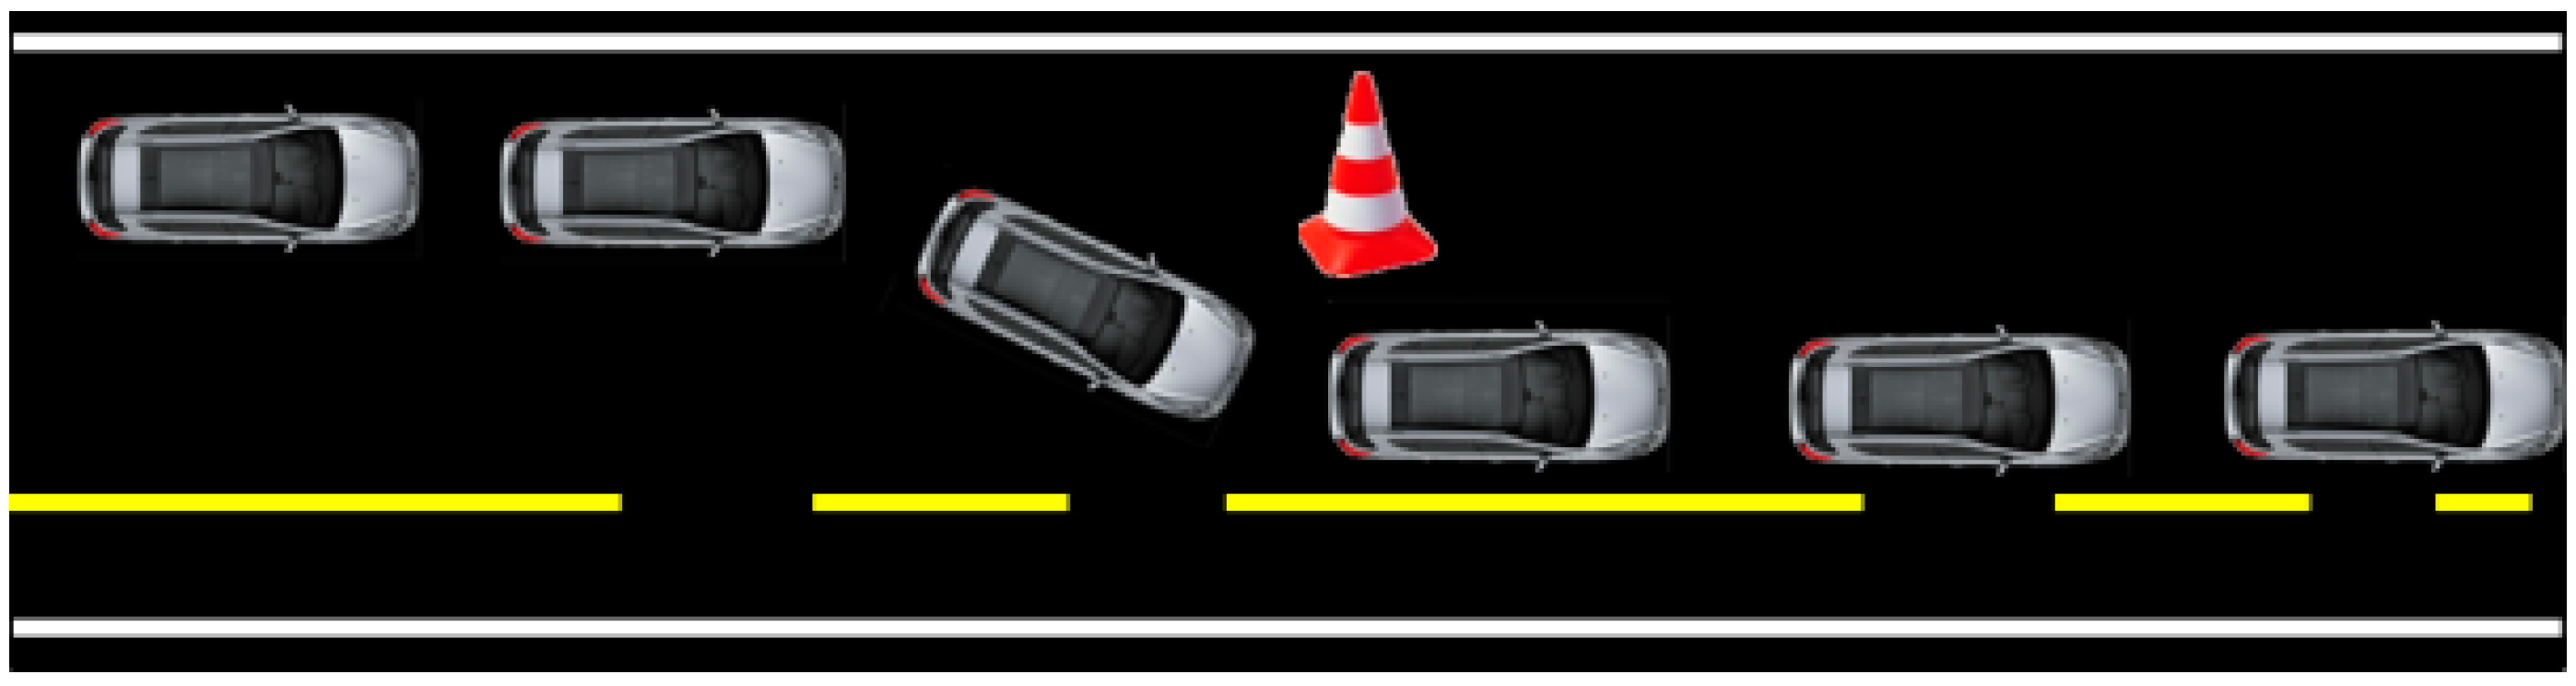
Figure 5.
Schematic illustration of impulse steering test.
Figure 5.
Schematic illustration of impulse steering test.
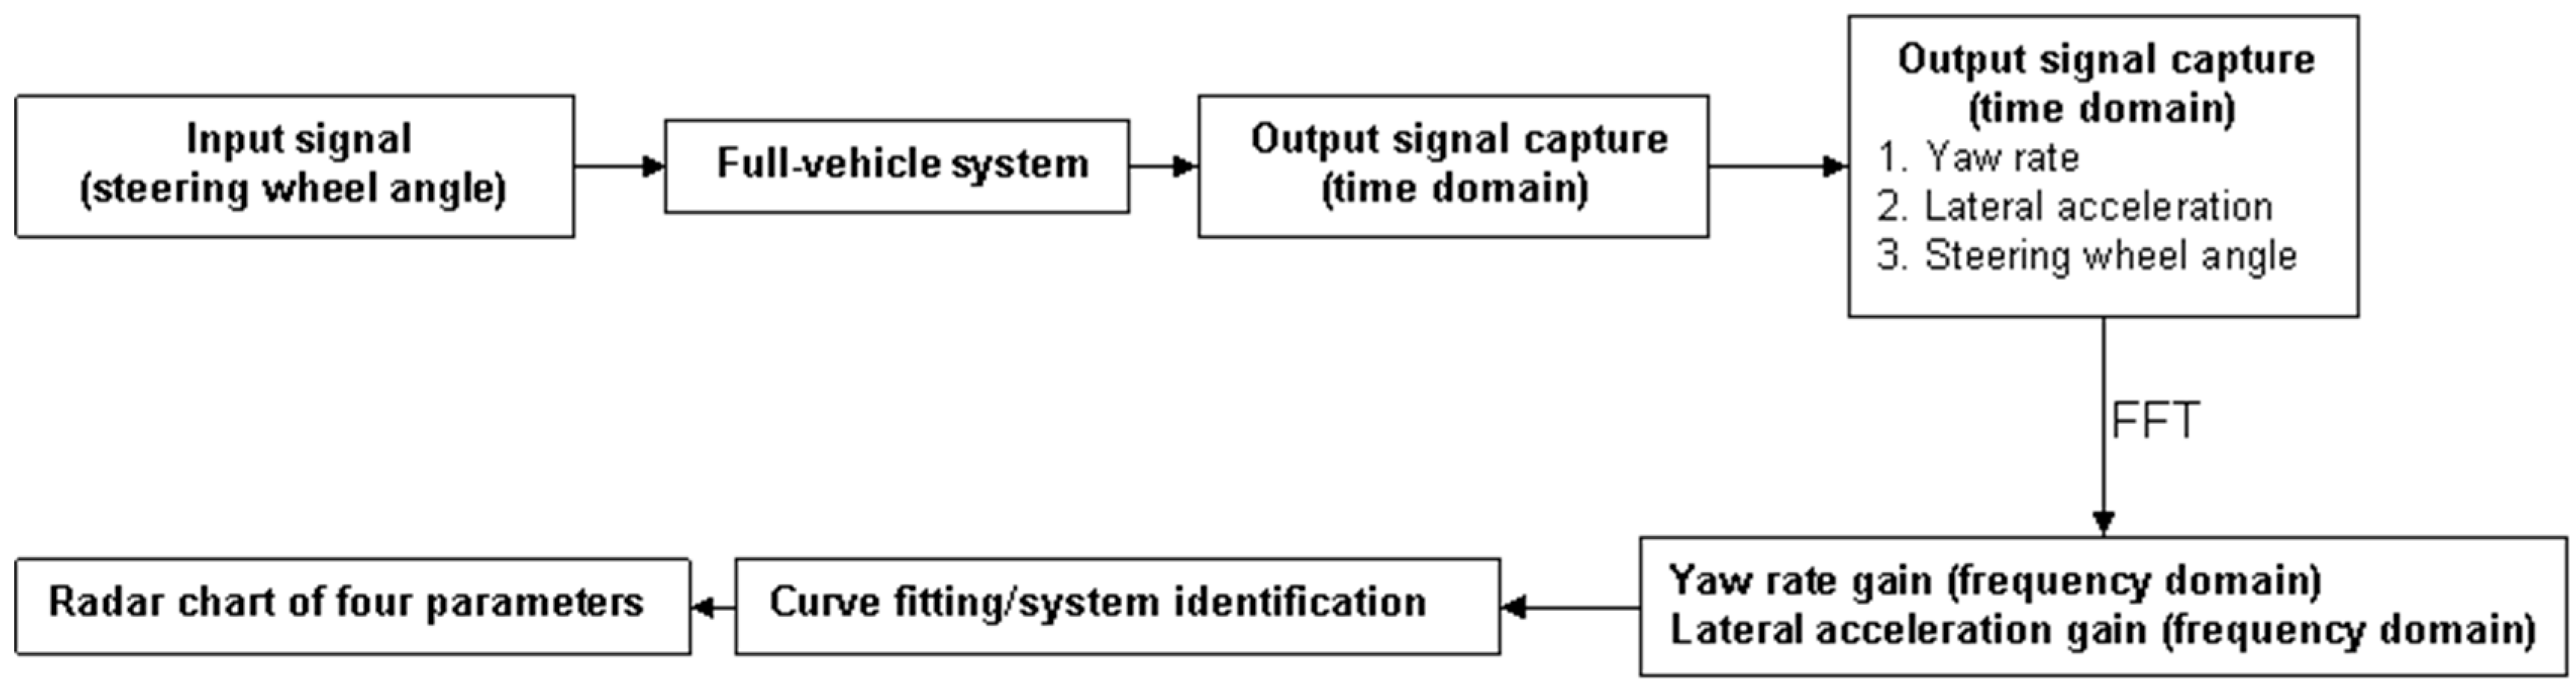
Figure 6.
Impulse steering test measurement and analysis process. (FFT: Fast Fourier Transform).
Figure 6.
Impulse steering test measurement and analysis process. (FFT: Fast Fourier Transform).
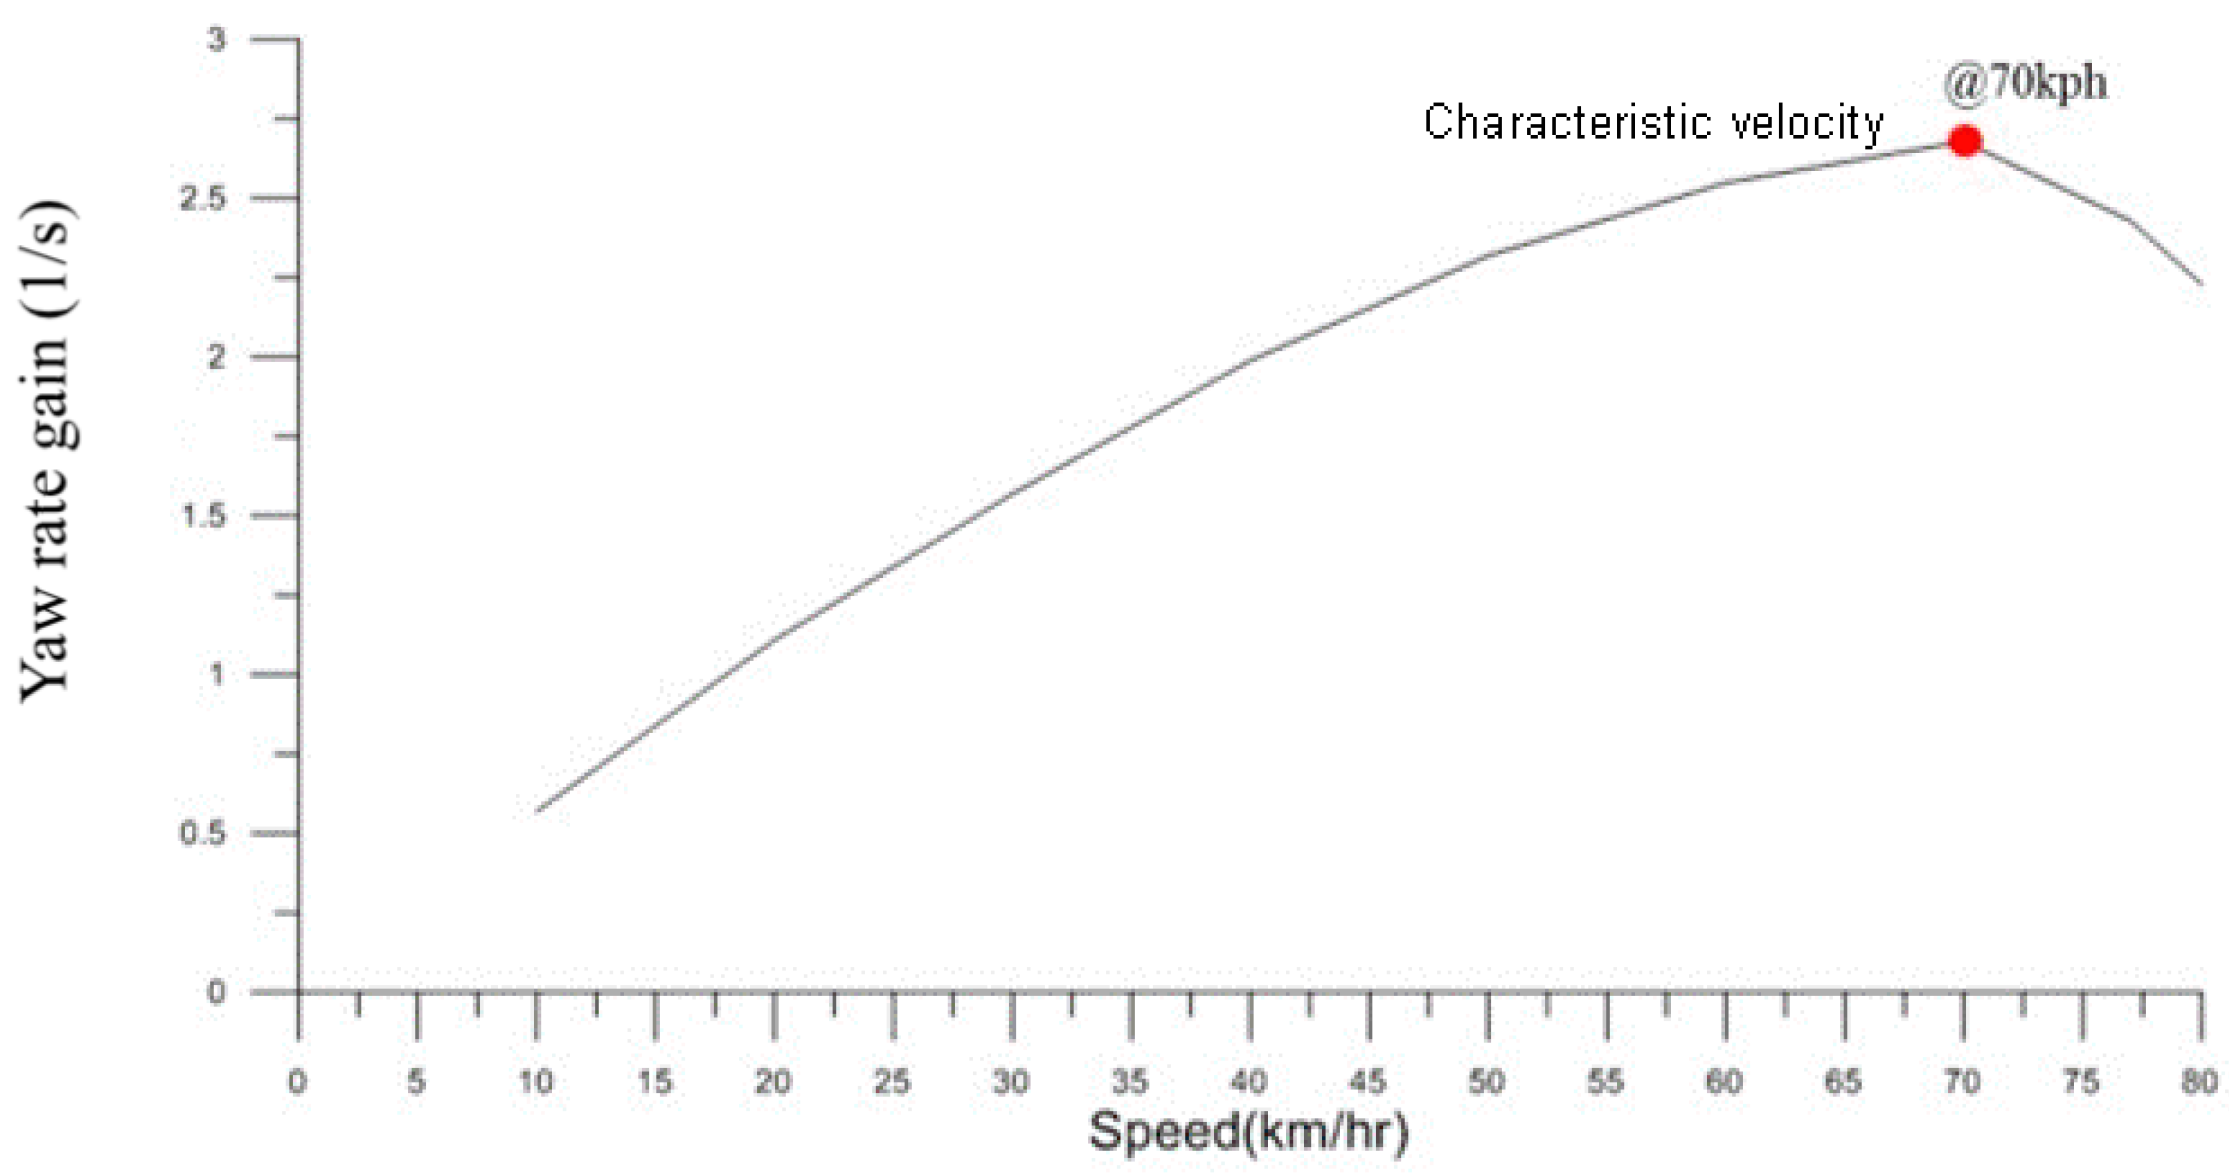
Figure 7.
Relationship between yaw rate gain and cornering speed for target vehicle.
Figure 7.
Relationship between yaw rate gain and cornering speed for target vehicle.
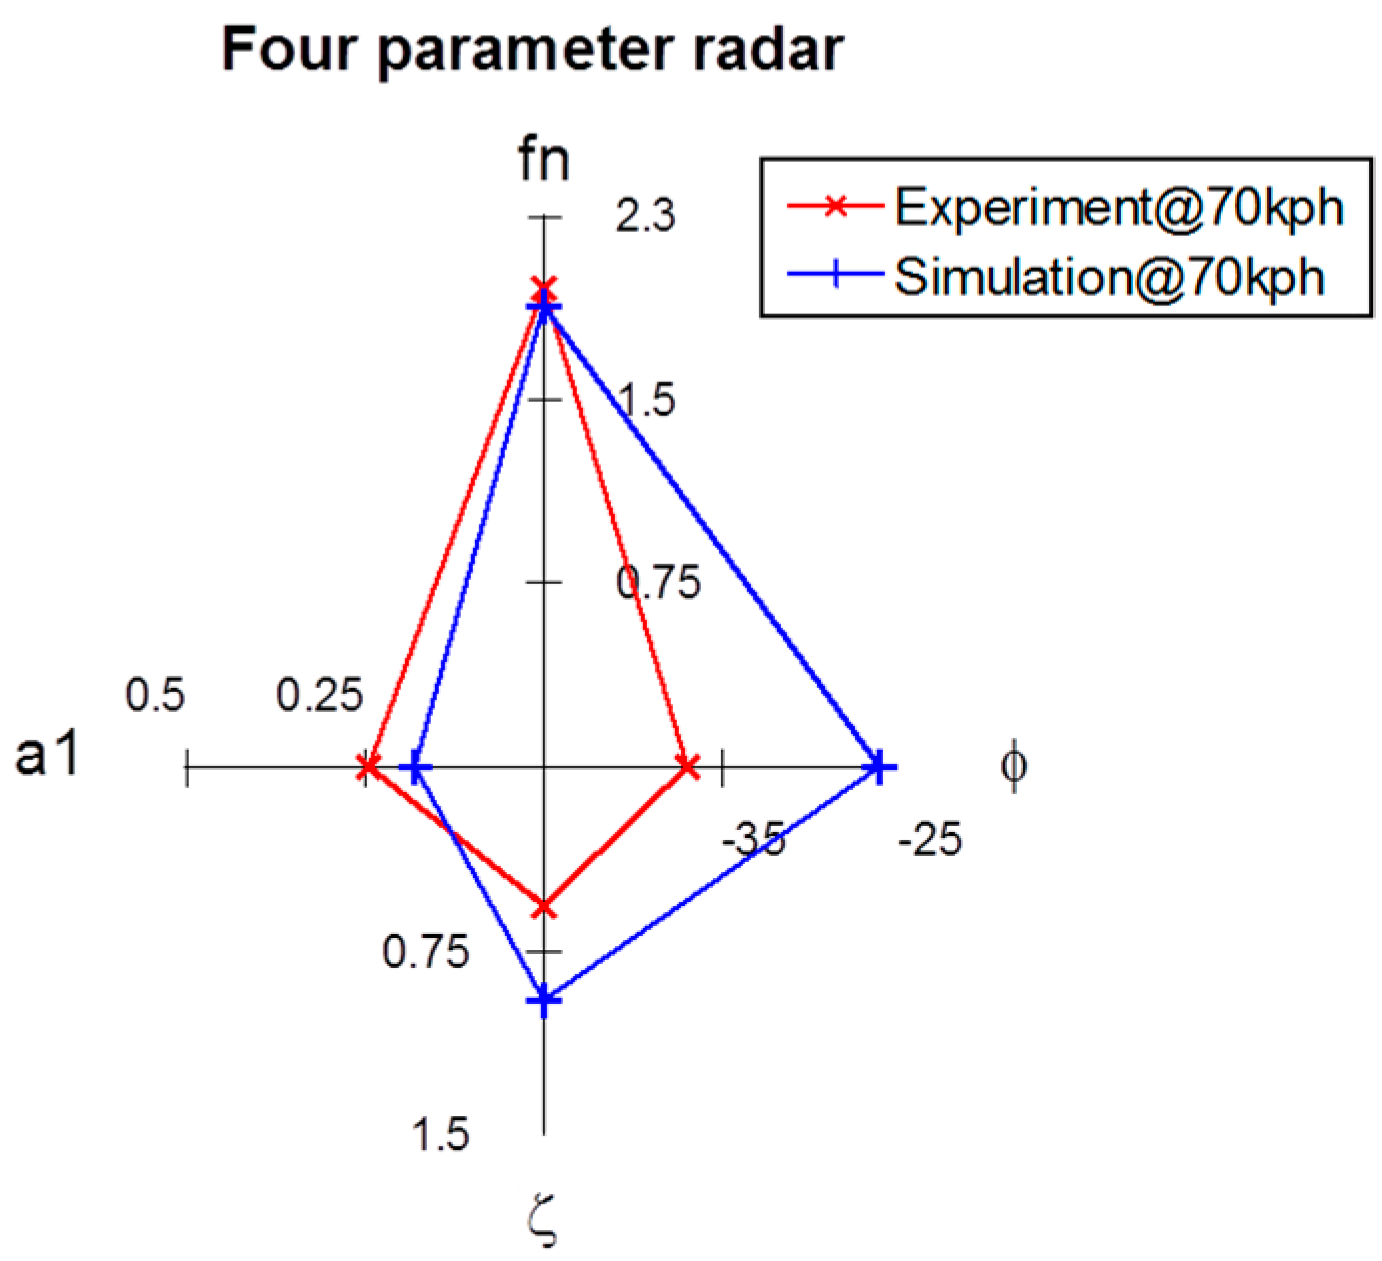
Figure 8.
Experimental and simulated four-parameter radar charts for the impulse steering tests.
Figure 8.
Experimental and simulated four-parameter radar charts for the impulse steering tests.
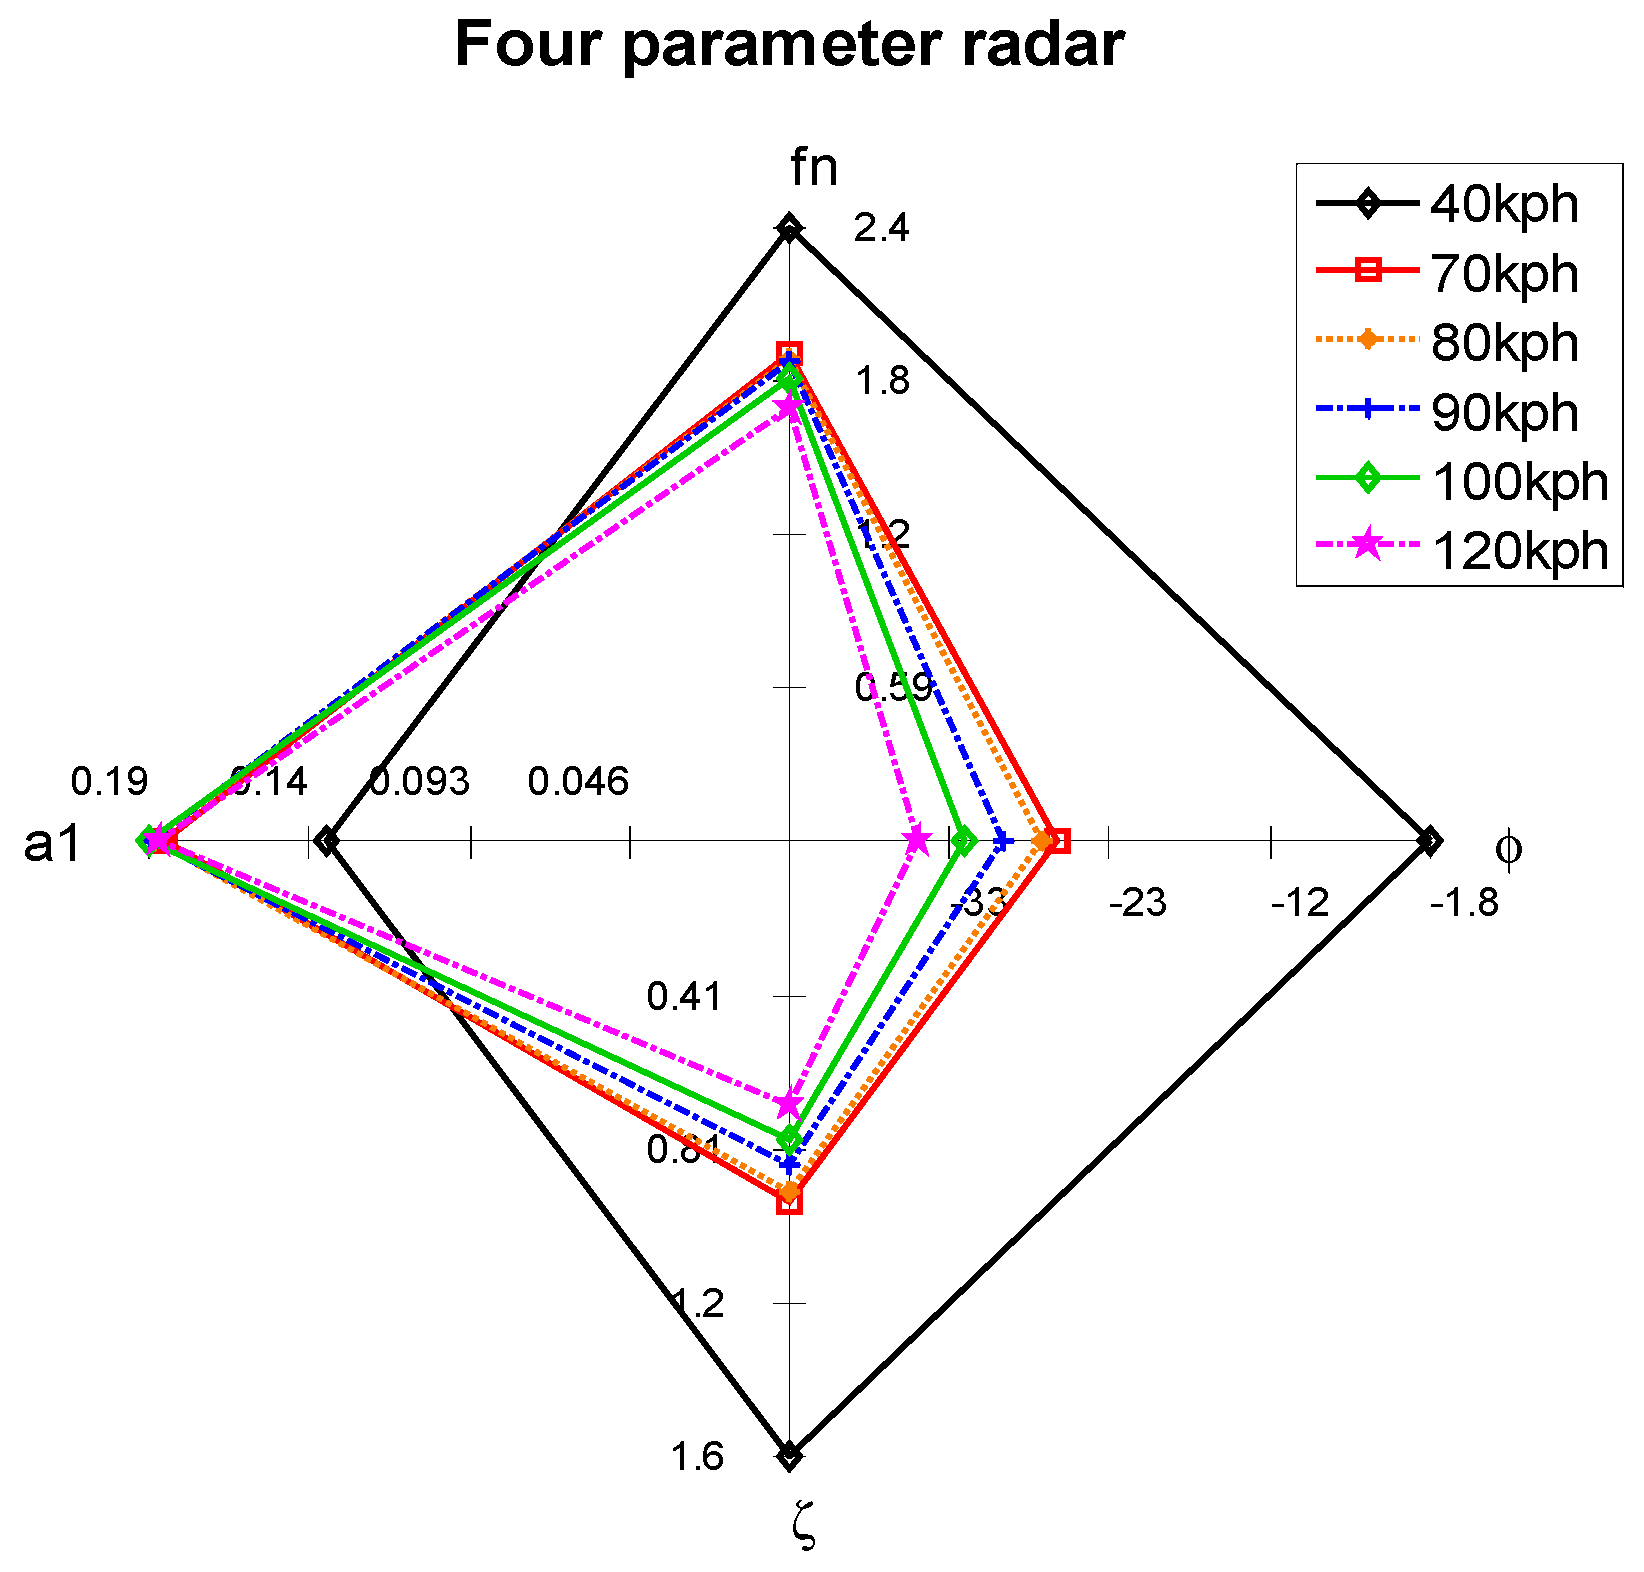
Figure 9.
Simulated four-parameter radar charts for impulse steering tests performed at different speeds.
Figure 9.
Simulated four-parameter radar charts for impulse steering tests performed at different speeds.
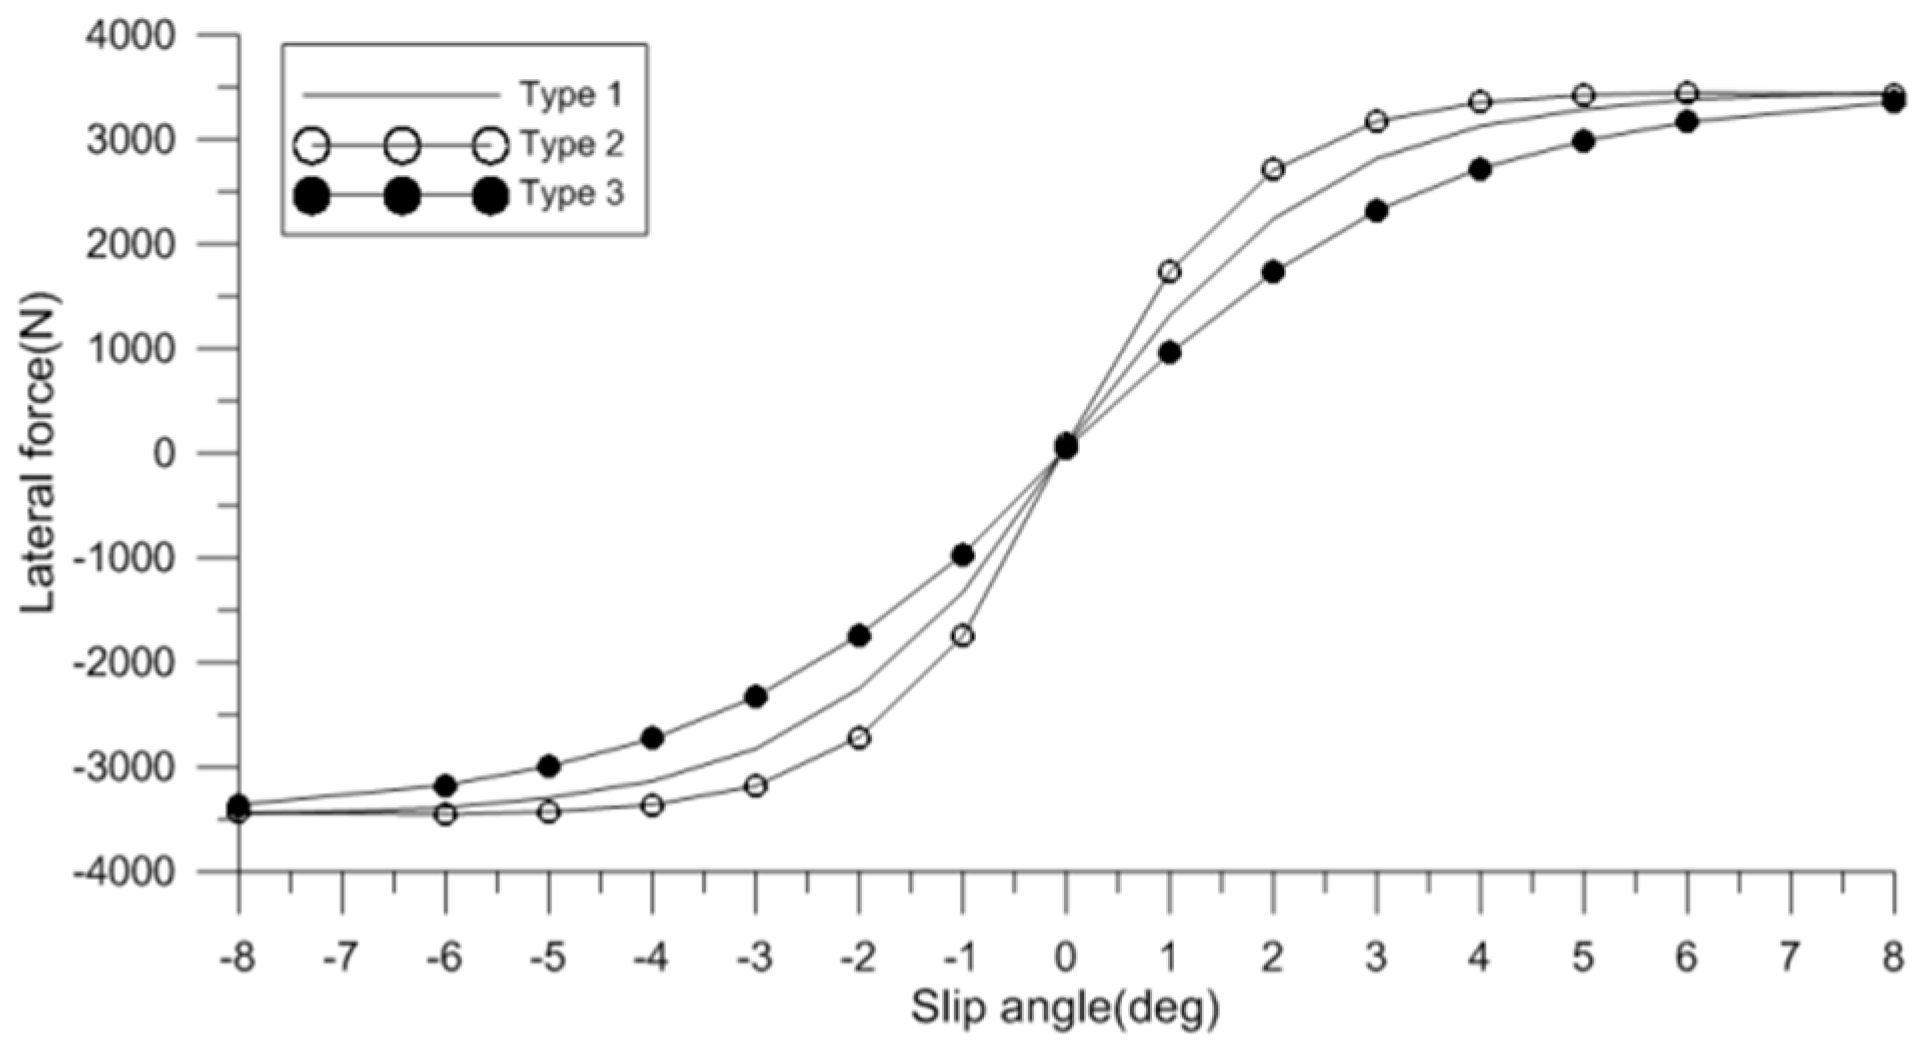
Figure 10.
Variation of lateral force with tire slip angle for three different cornering stiffness values.
Figure 10.
Variation of lateral force with tire slip angle for three different cornering stiffness values.
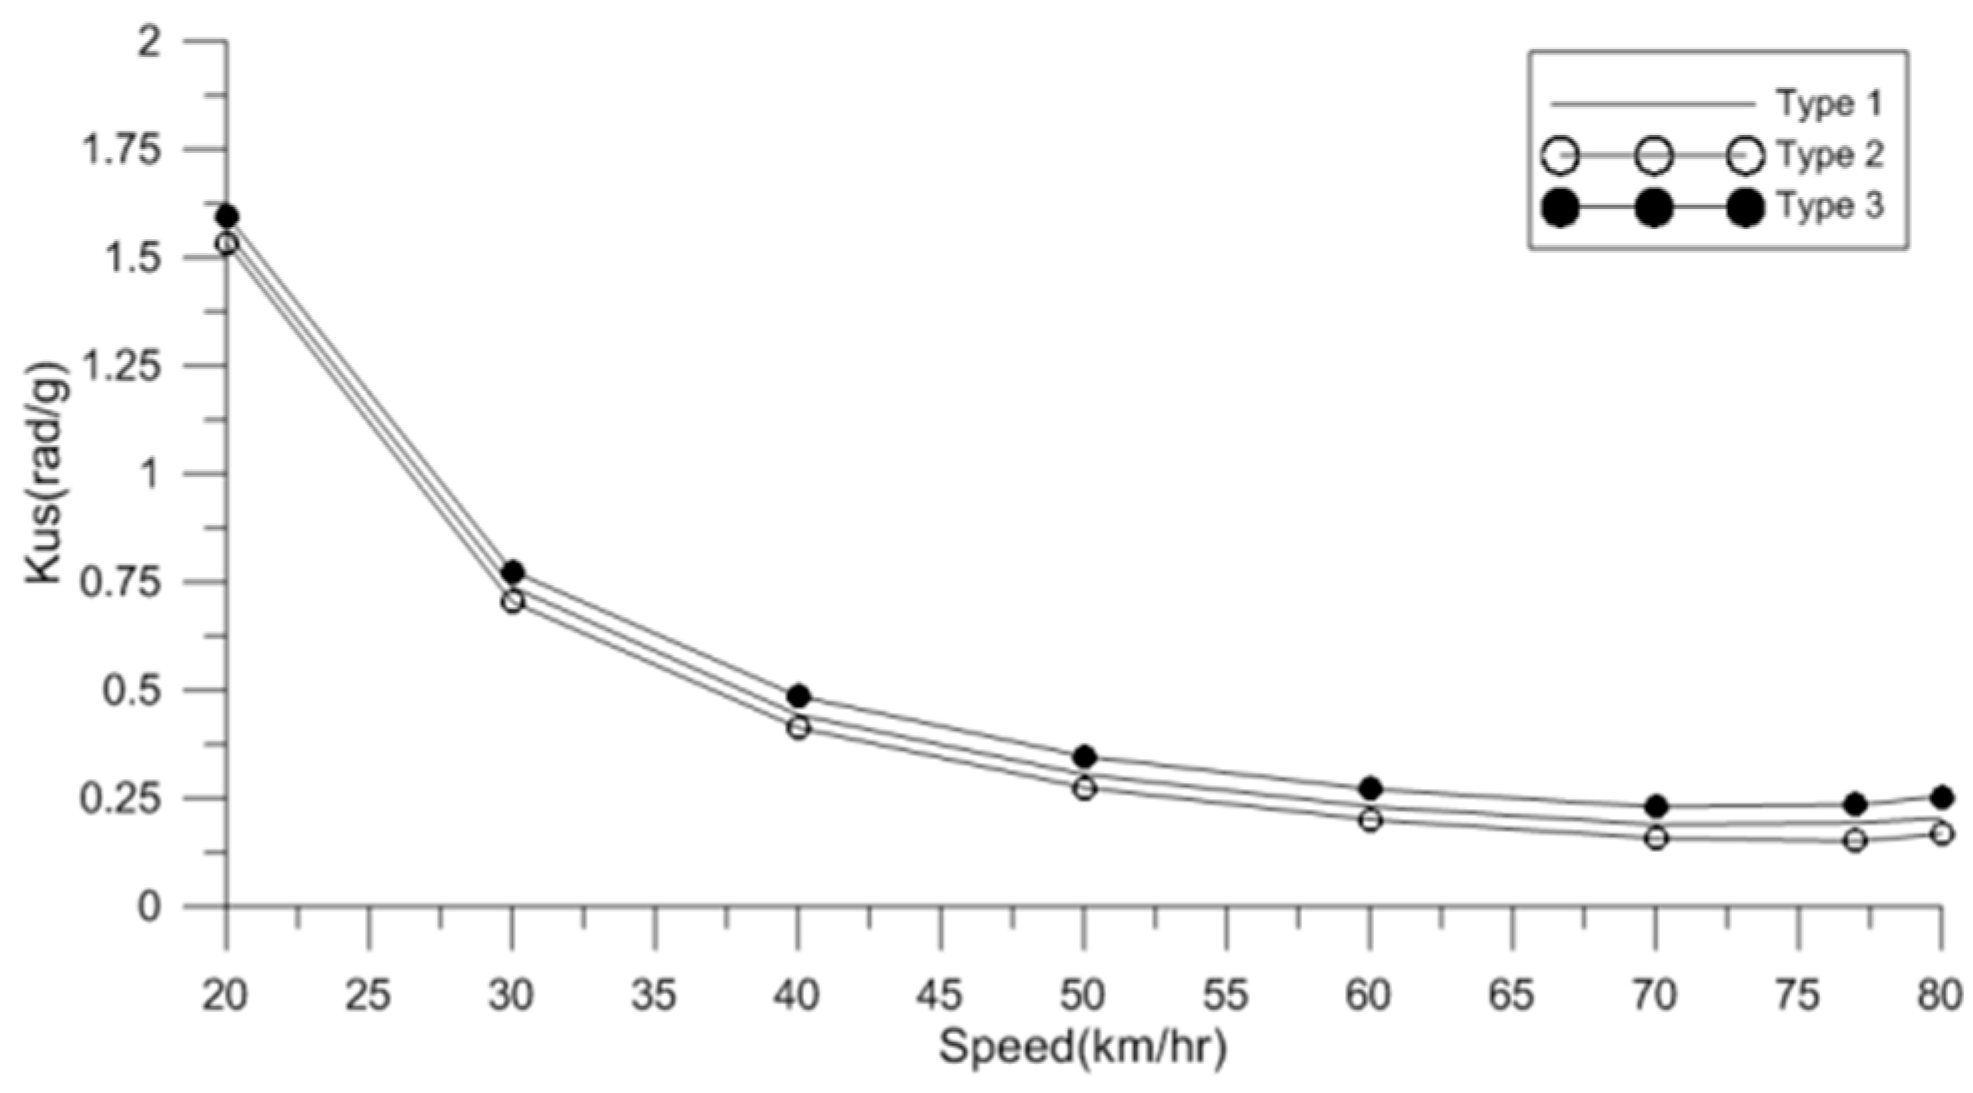
Figure 11.
Variation of understeer coefficient with vehicle speed for three different cornering stiffness values.
Figure 11.
Variation of understeer coefficient with vehicle speed for three different cornering stiffness values.
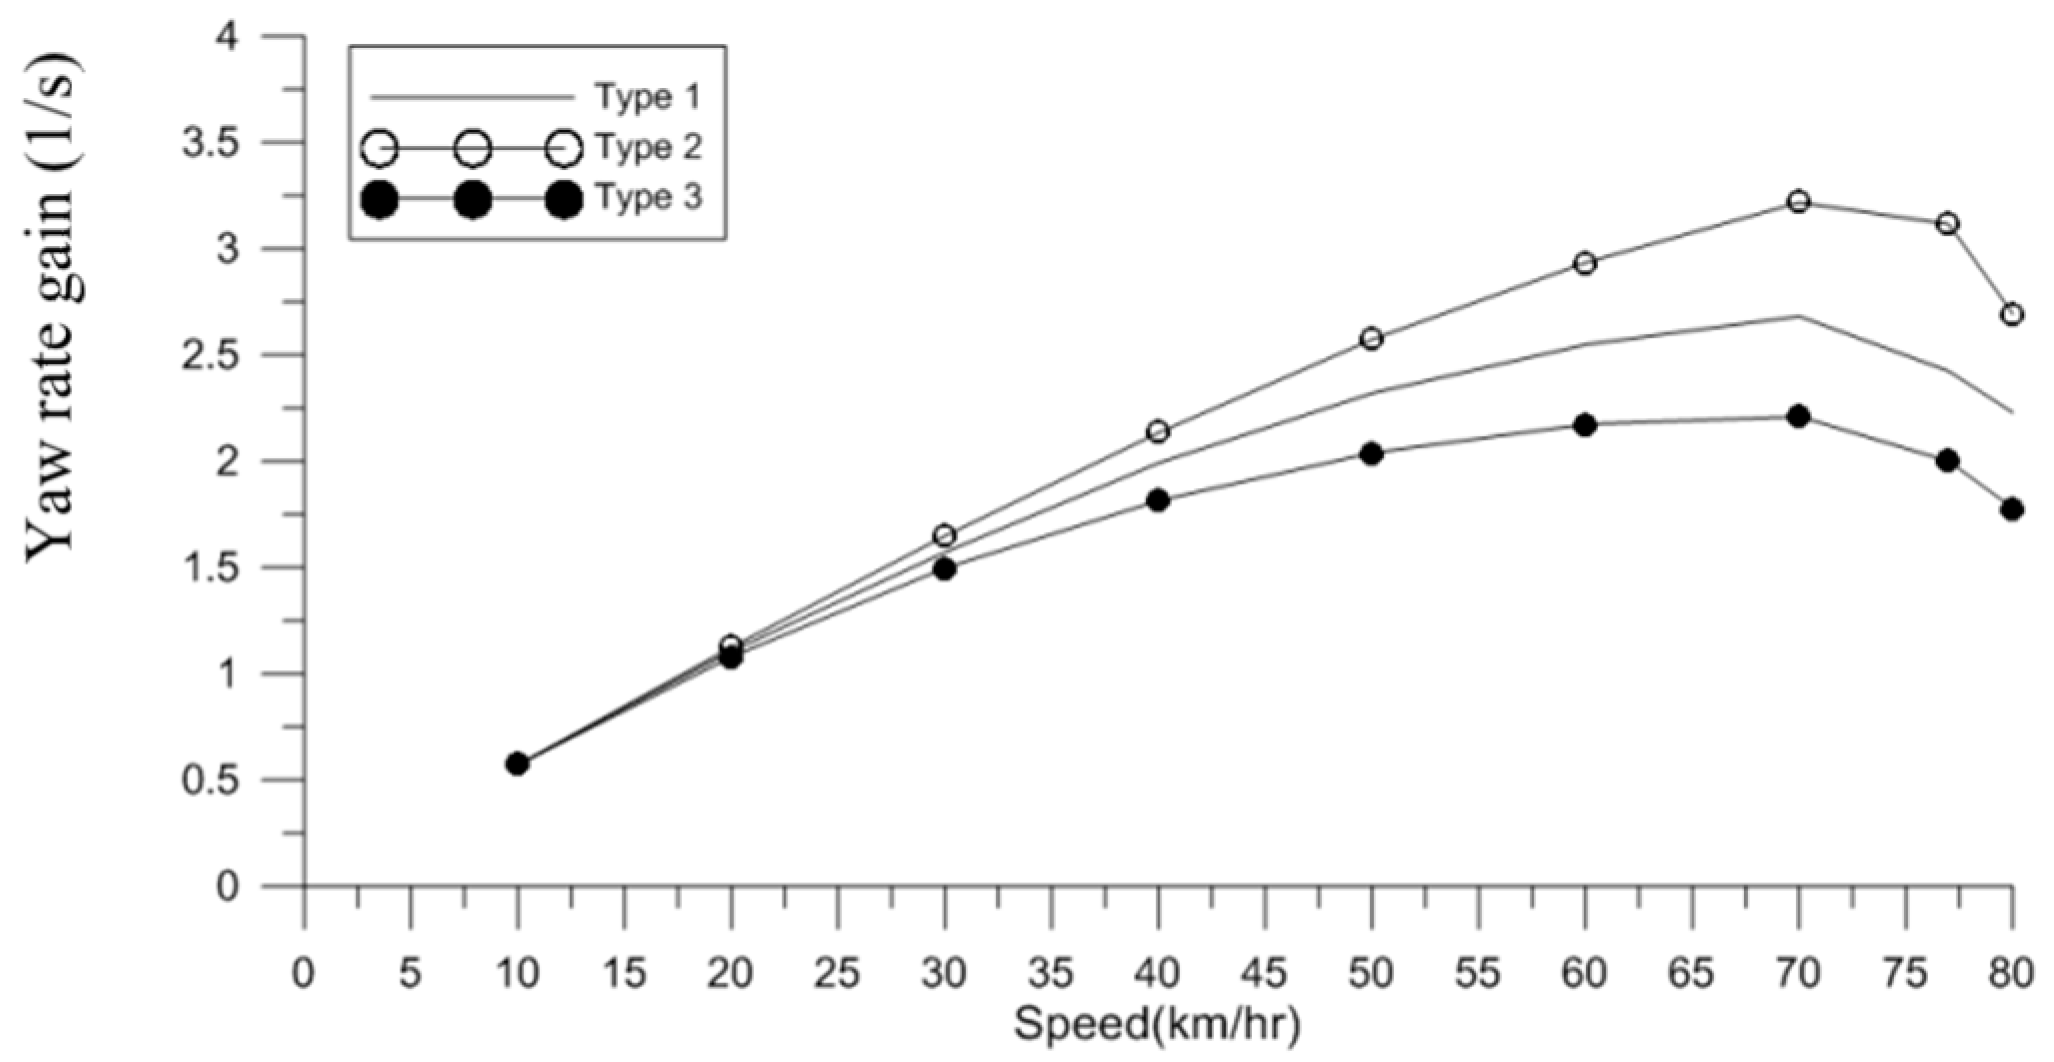
Figure 12.
Variation of yaw rate gain with vehicle speed for three different cornering stiffness values.
Figure 12.
Variation of yaw rate gain with vehicle speed for three different cornering stiffness values.
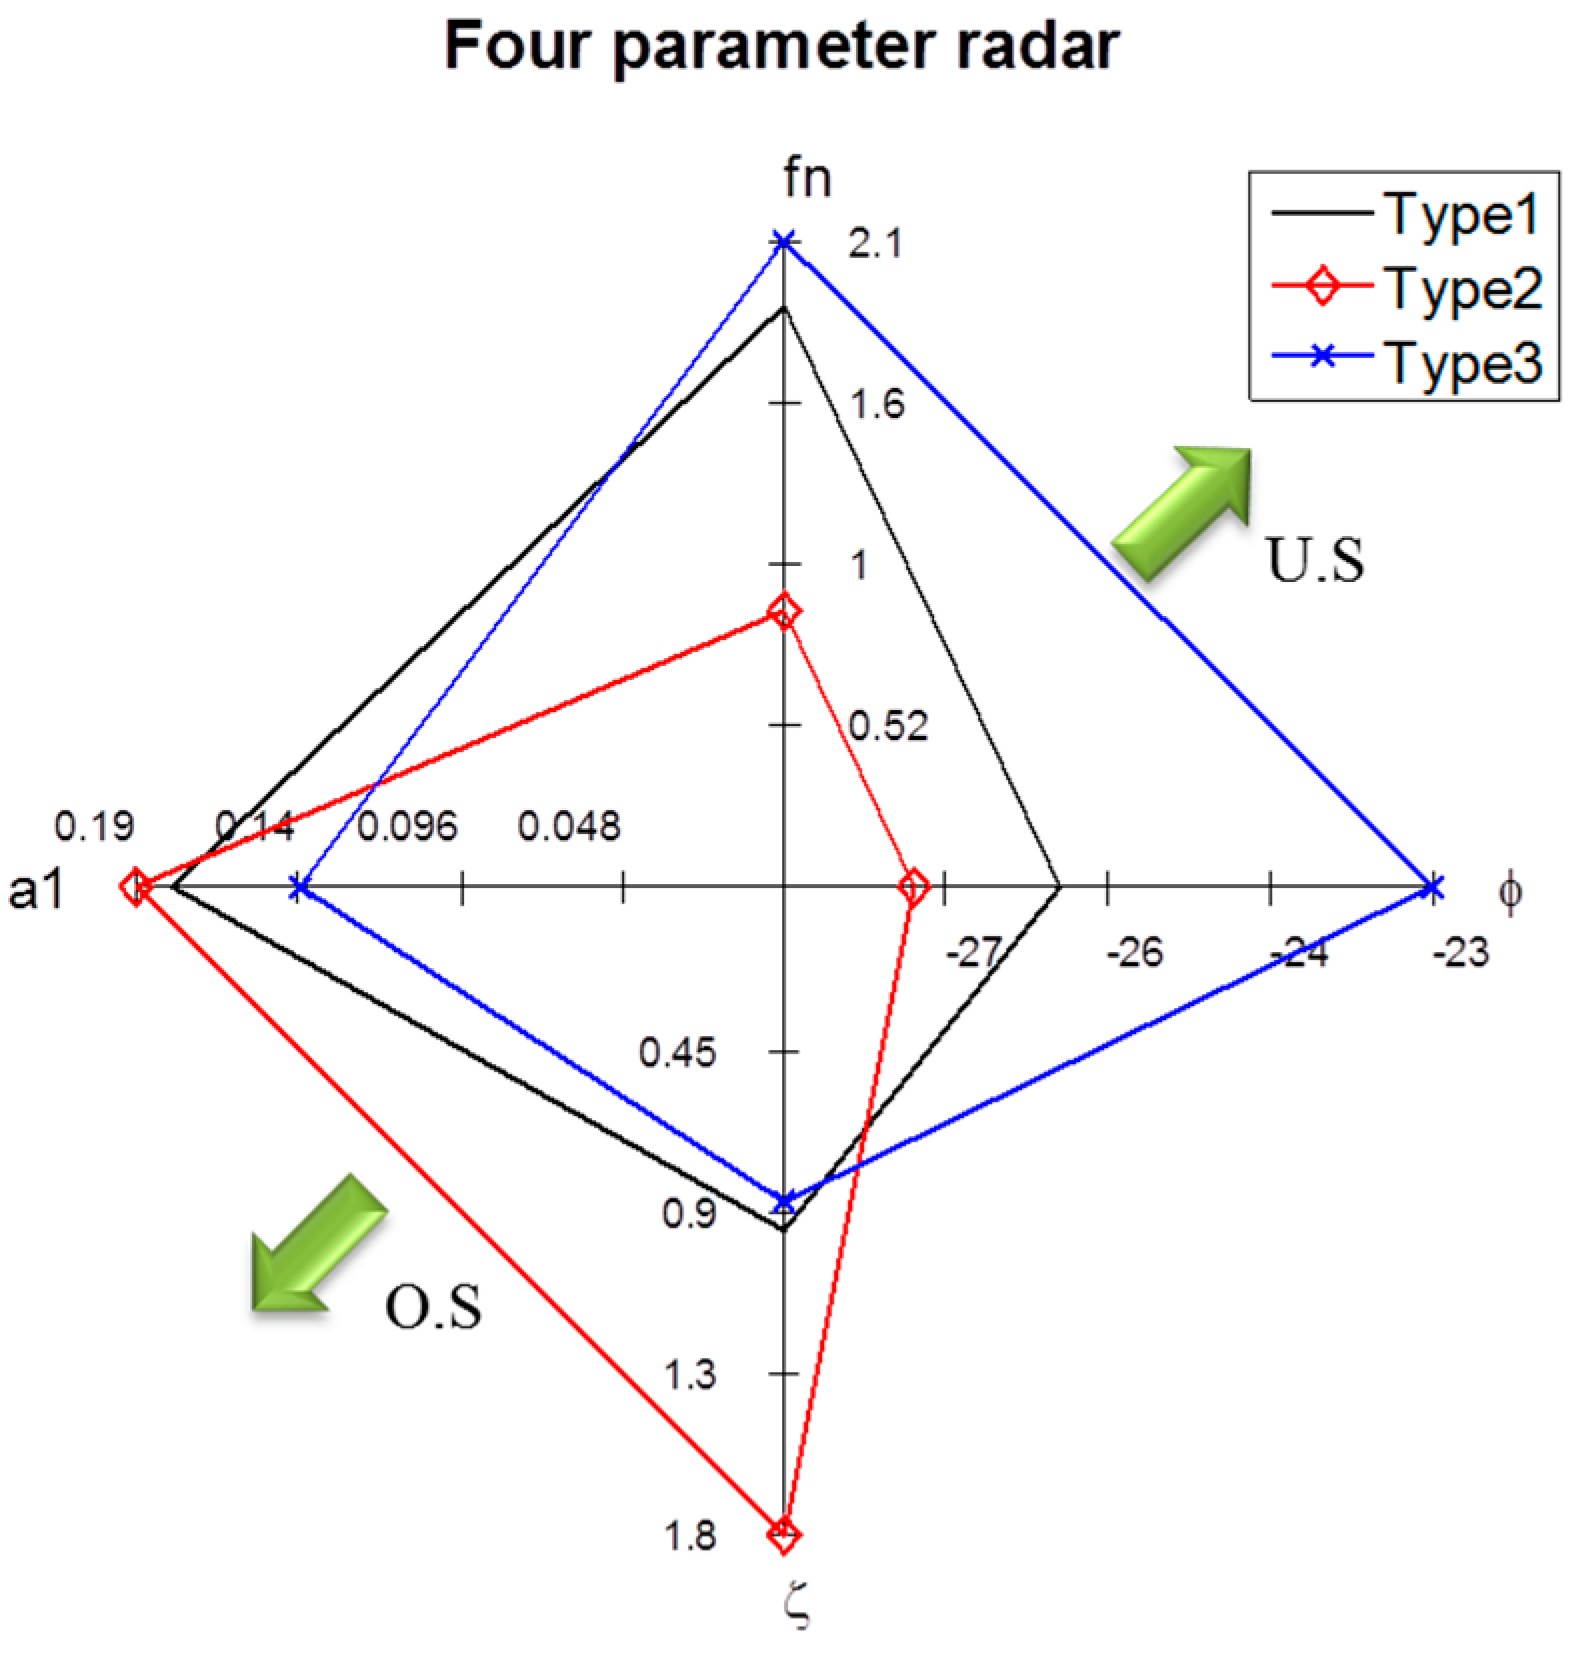
Figure 13.
Simulated four-parameter radar charts for impulse steering tests performed using different cornering stiffness values.
Figure 13.
Simulated four-parameter radar charts for impulse steering tests performed using different cornering stiffness values.
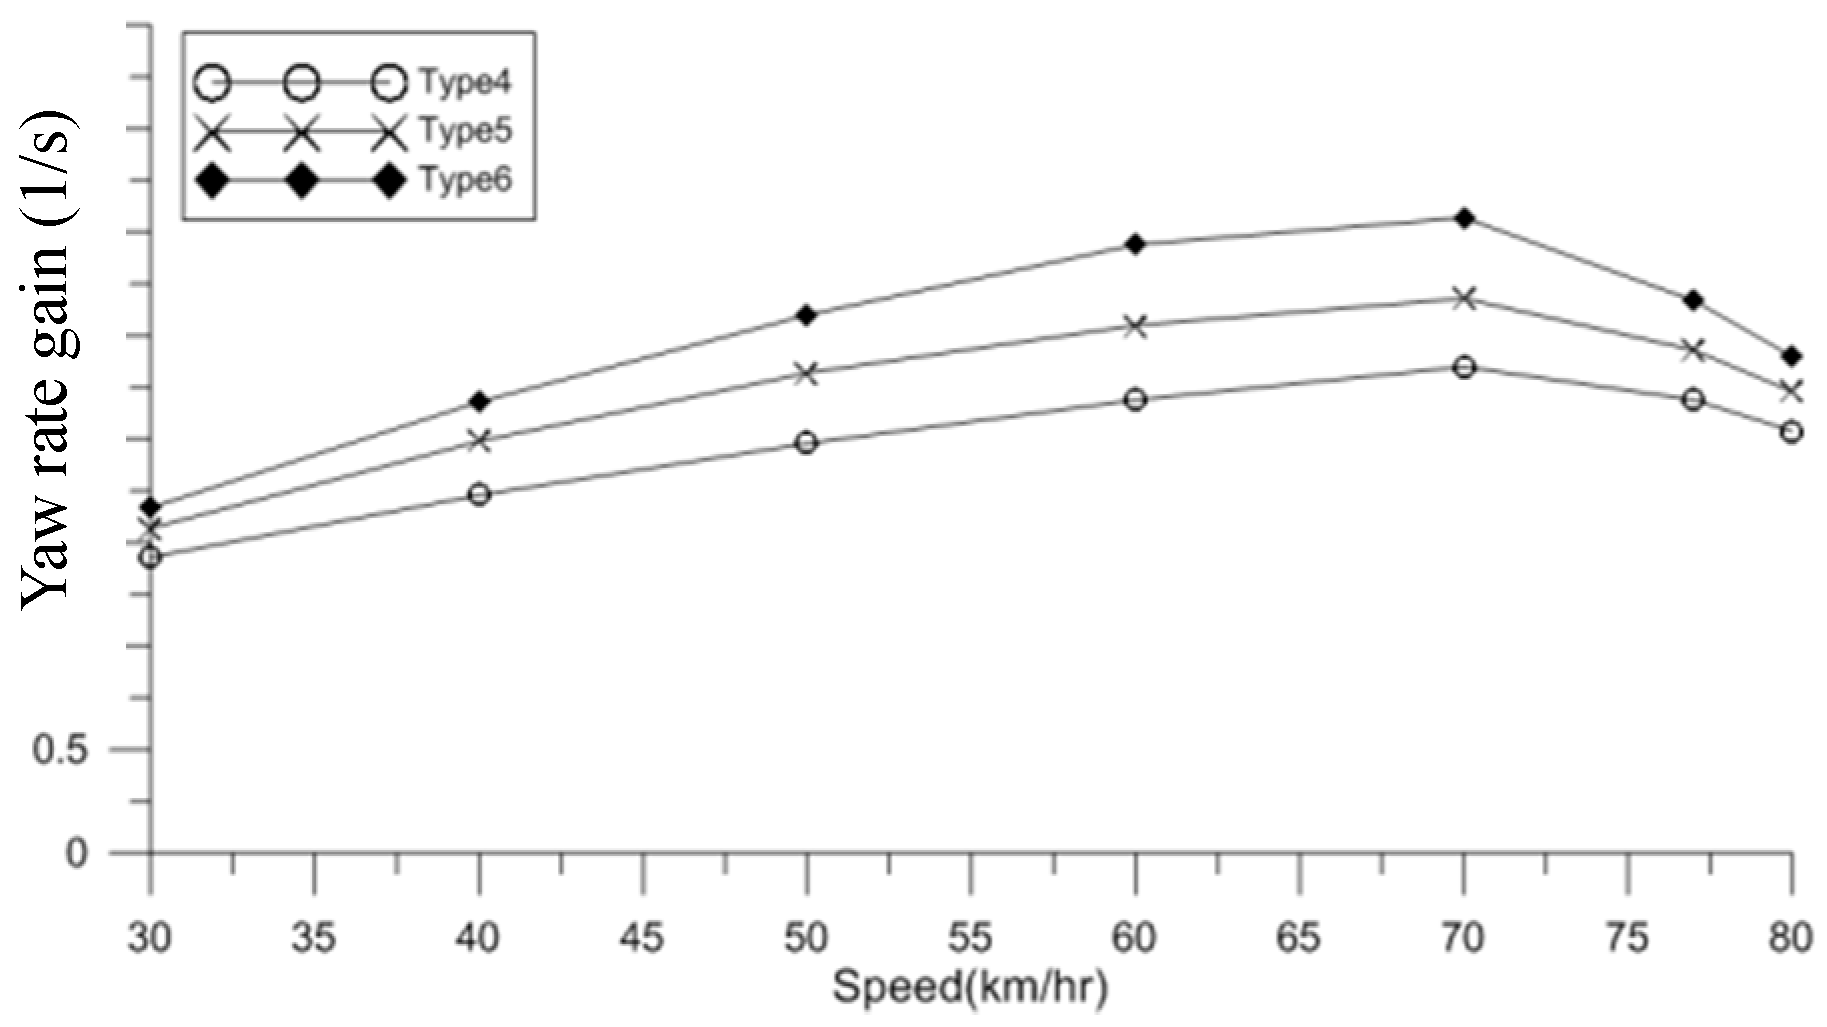
Figure 14.
Variation of yaw rate gain with vehicle speed for different initial toe-in angles.
Figure 14.
Variation of yaw rate gain with vehicle speed for different initial toe-in angles.
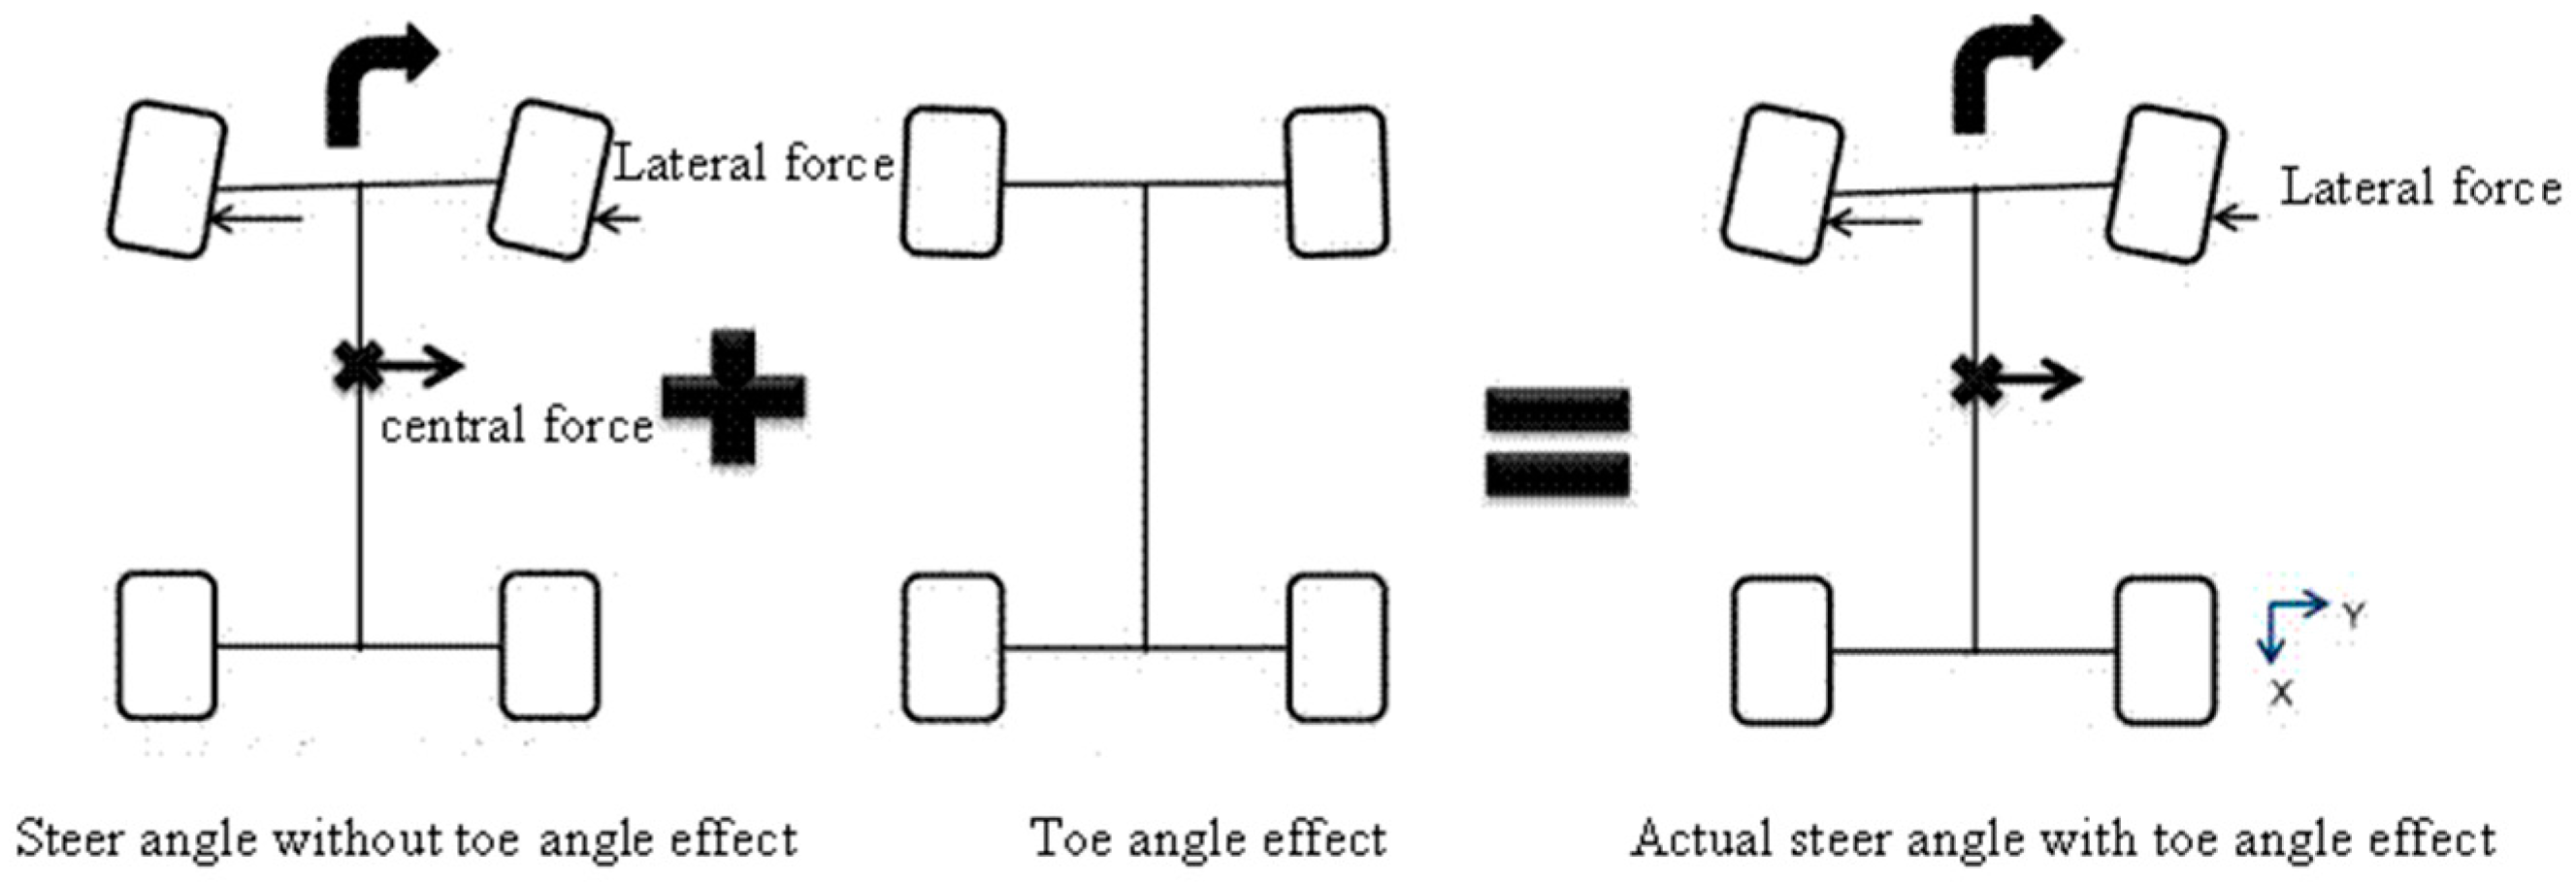
Figure 15.
Schematic illustration showing the relationship between toe-in angle and lateral force.
Figure 15.
Schematic illustration showing the relationship between toe-in angle and lateral force.
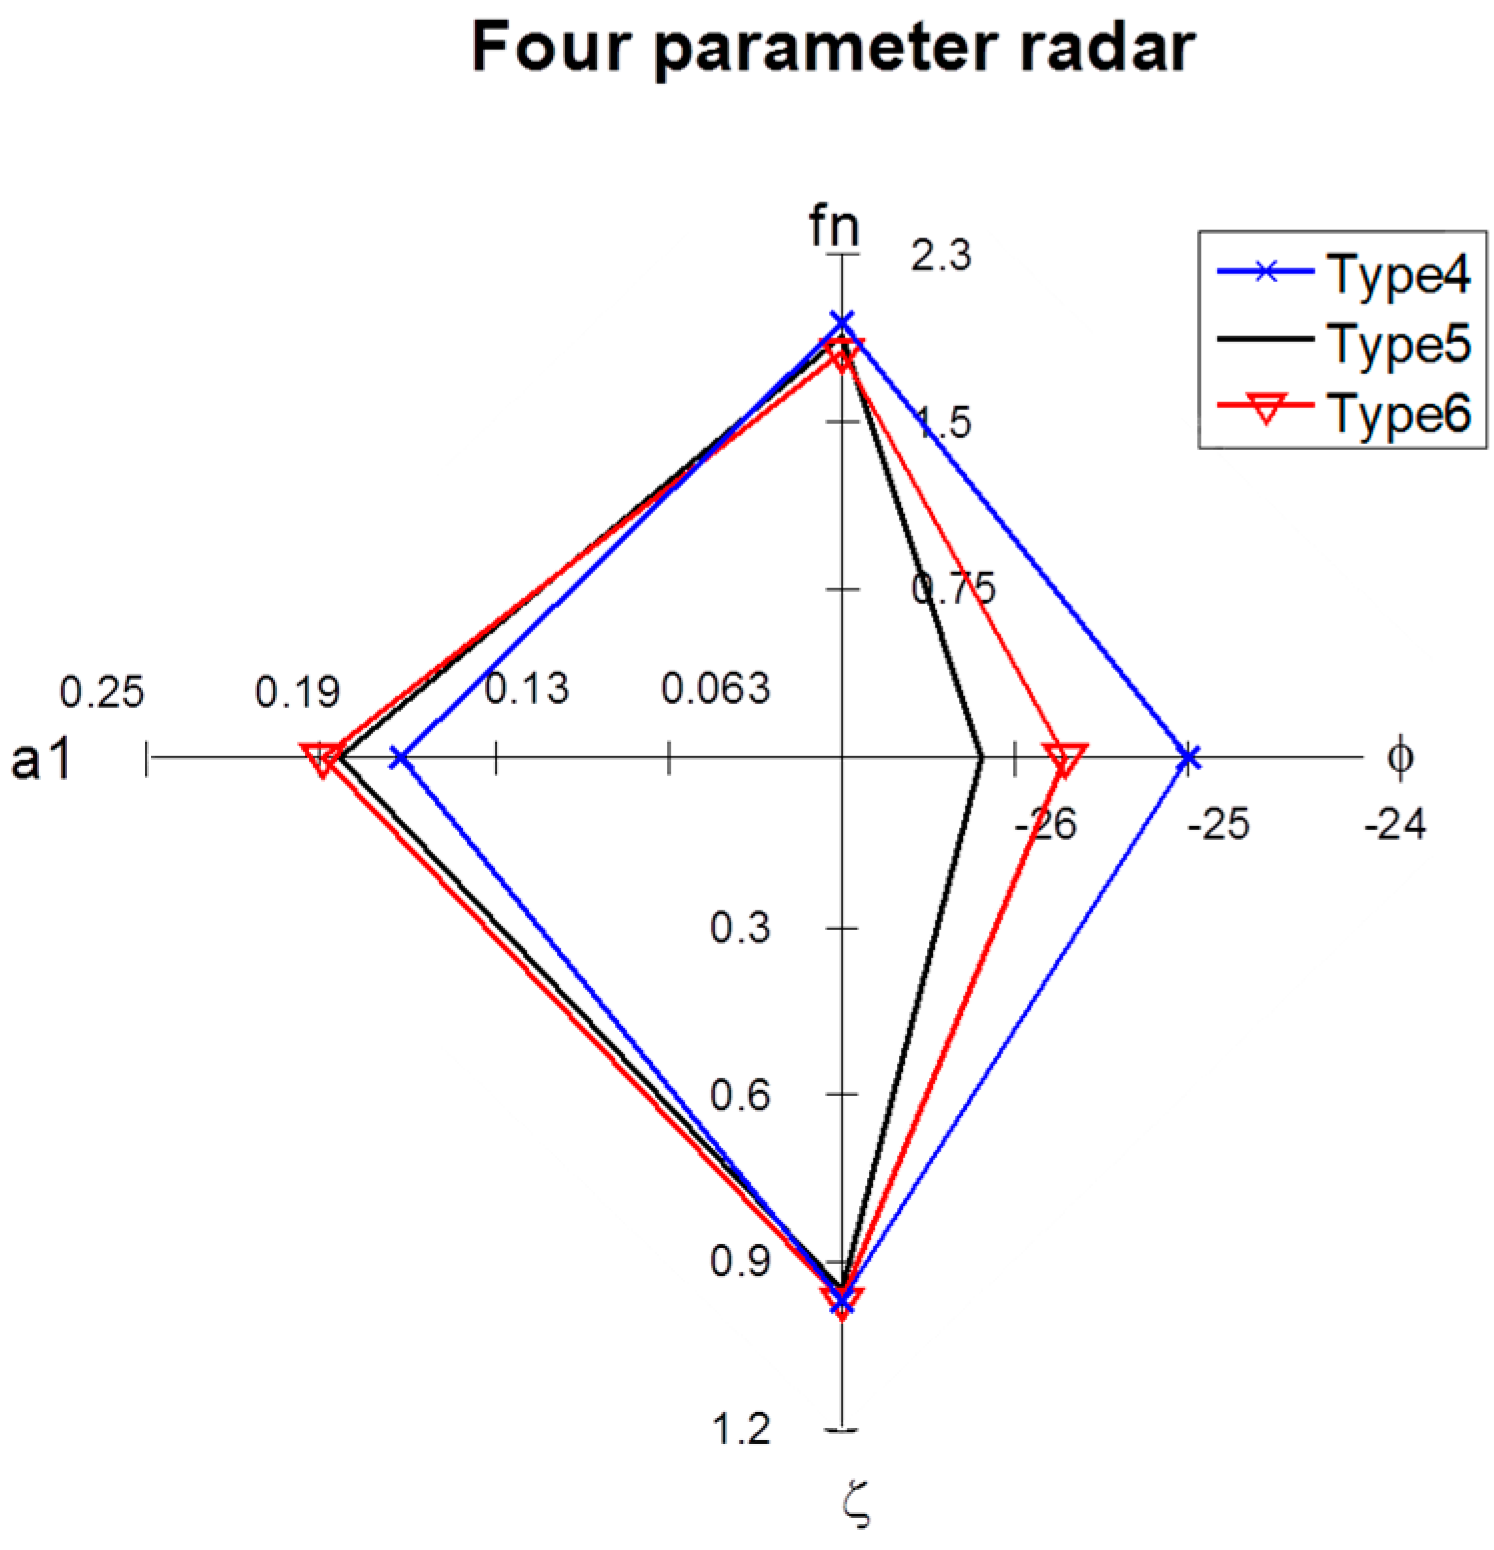
Figure 16.
Simulated four-parameter radar charts for impulse steering tests performed using different toe-in angle values.
Figure 16.
Simulated four-parameter radar charts for impulse steering tests performed using different toe-in angle values.
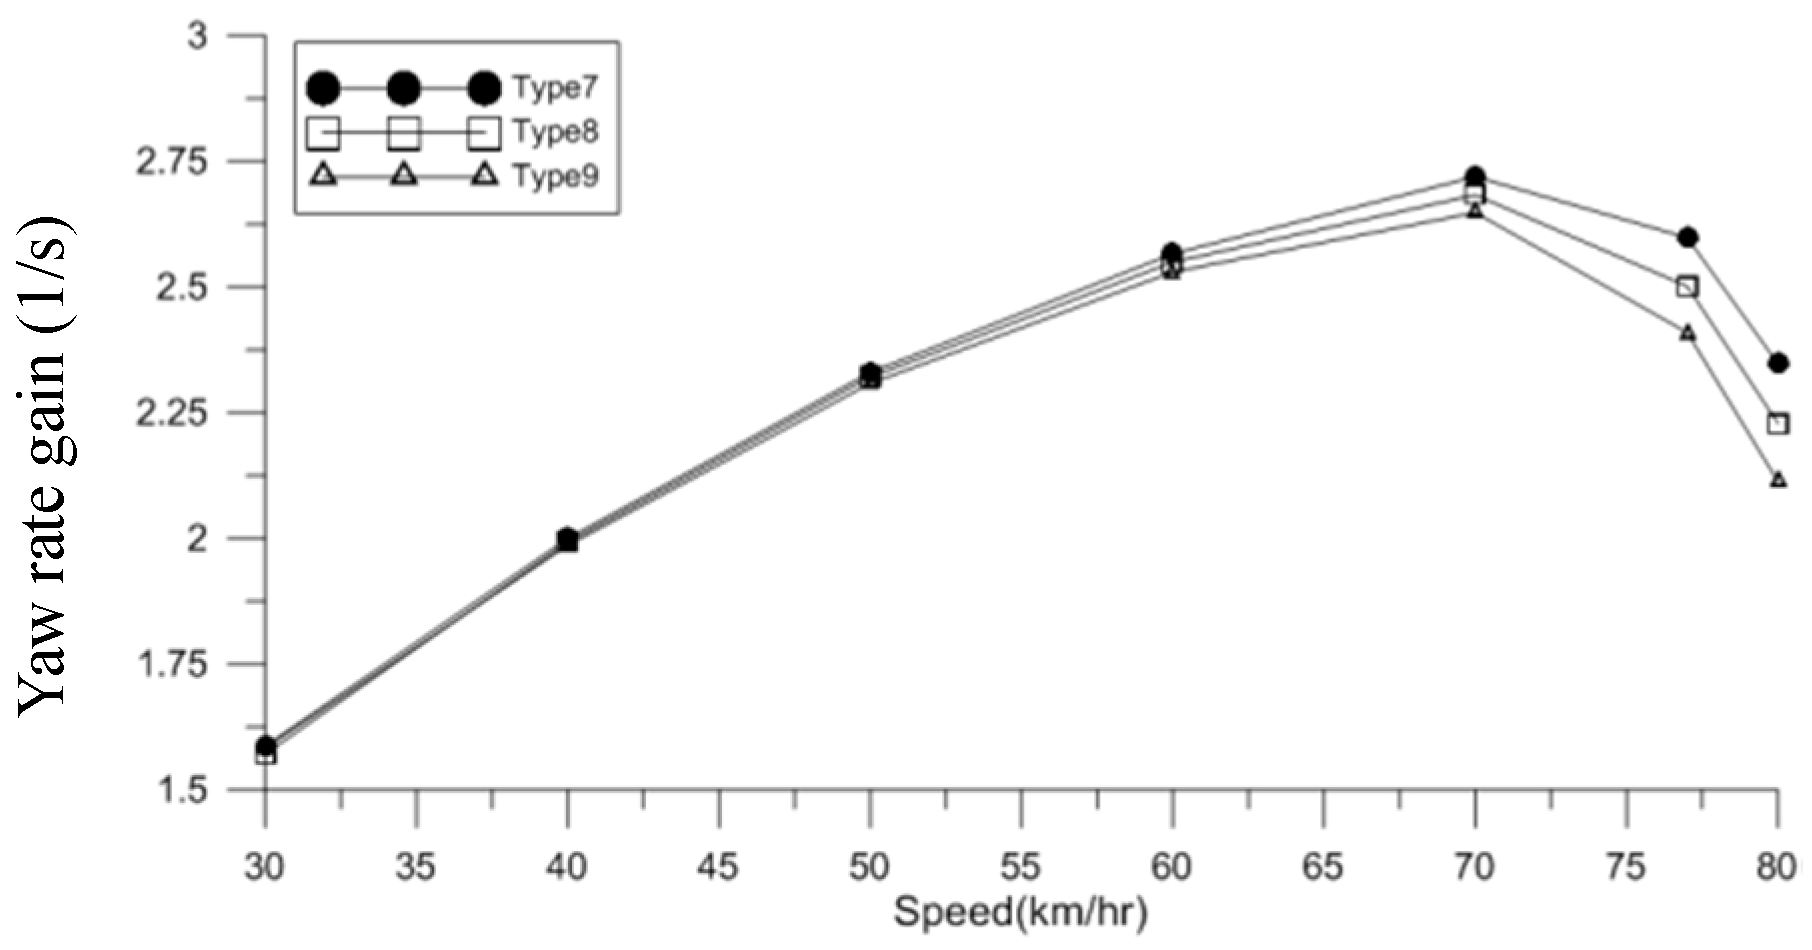
Figure 17.
Variation of yaw rate gain with vehicle speed for different initial camber angles.
Figure 17.
Variation of yaw rate gain with vehicle speed for different initial camber angles.
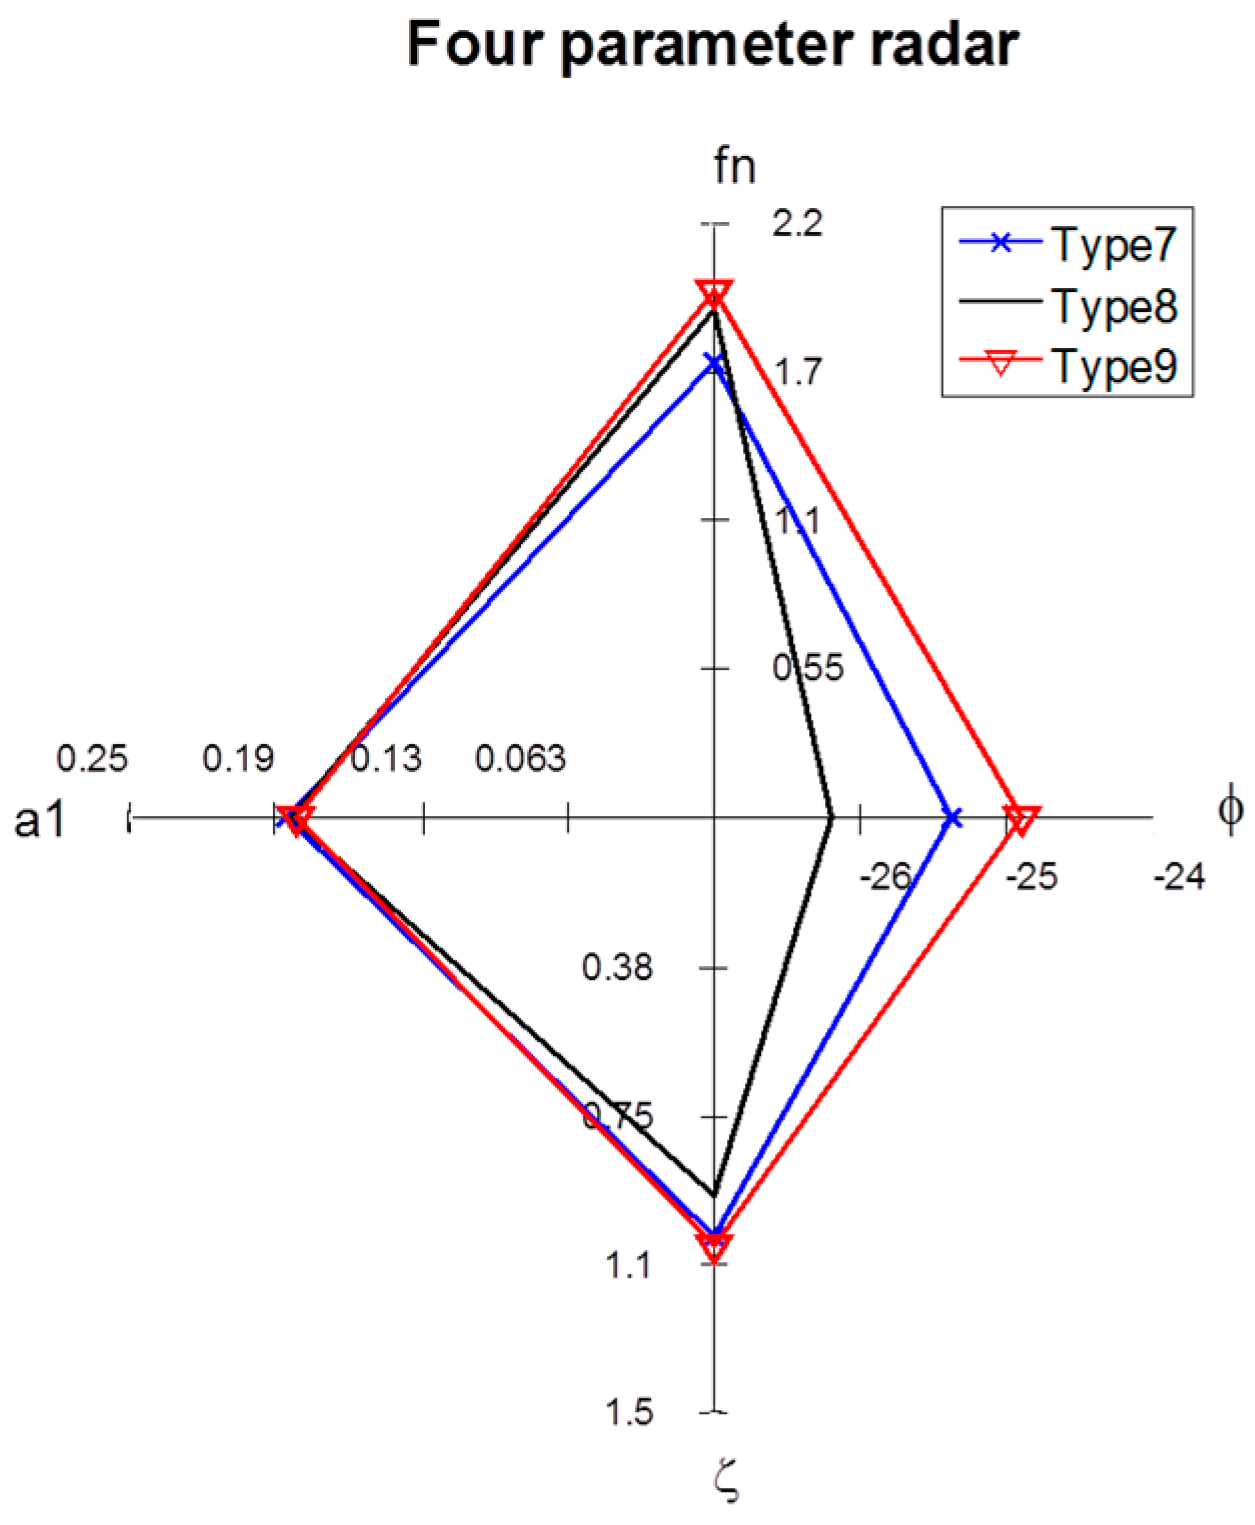
Figure 18.
Simulated four-parameter radar charts for impulse steering tests performed using different camber angles.
Figure 18.
Simulated four-parameter radar charts for impulse steering tests performed using different camber angles.
Table 1.
Experimental and simulation results for Kus in constant radius cornering tests.
Table 1.
Experimental and simulation results for Kus in constant radius cornering tests.
| Experimental Data |
| Speed (km/h) | Tire steering angle (degree) | Lateral acceleration (G) | Kus (rad/g) |
| 10 | 12.9 | 0.048 | 4.68 |
| CAE model Data |
| Speed (km/h) | Tire steering angle (degree) | Lateral acceleration (G) | Kus (rad/g) |
| 10 | 9.47 | 0.032 | 5.15 |
Table 2.
Simulation results for roll gradient at different speeds.
Table 2.
Simulation results for roll gradient at different speeds.
| Velocity (km/h) | Lateral Acceleration (G) | Roll Angle (°) | Roll Gradient (°/g) |
|---|
| 10 | 0.018 | 0.046 | 2.56 |
| 20 | 0.064 | 0.17 | 2.65 |
| 30 | 0.165 | 0.45 | 2.72 |
| 40 | 0.252 | 0.7 | 2.78 |
| 50 | 0.393 | 1.13 | 2.87 |
Table 3.
Full-vehicle parameters.
Table 3.
Full-vehicle parameters.
| Designation | Symbol | Unit | Value |
|---|
| Front axle weight | Wf | N | 8829 |
| Rear axle weight | Wr | N | 5886 |
| Front wheel cornering stiffness | Cαf | N/rad | 78,855.7 |
| Rear wheel cornering stiffness | Cαr | N/rad | 71,687 |
| Pneumatic trail | P | m | 0.018754 |
| Wheelbase | L | m | 2.8 |
| Steering angle per unit lateral force | q | °/N | 1.194 × 10⁻⁴(f)/1.0498 × 10−4(r) |
| Roll steer coefficient | ε | °/° | −0.117213(f)/0.02272(r) |
| Roll angle | ∅ | ° | 0.7047 |
| Lateral acceleration | Ay | G | 0.2521 |
| Camber stiffness | Cγ | N/rad | 7885.57(f)/7168.7(r) |
Table 4.
Experimental and simulation results for the impulse steering tests.
Table 4.
Experimental and simulation results for the impulse steering tests.
| Experimental Data |
| Speed (km/h) | Phase lag (ϕ) (deg) | Natural frequency (fn) (Hz) | Yaw rate gain (a1) (1/s) | Damping ratio (ζ) |
| 70 | −36.81 | 1.9567 | 0.24618 | 0.5581 |
| CAE model Data |
| Speed (km/h) | Phase lag (ϕ) (deg) | Natural frequency (fn) (Hz) | Yaw rate gain (a1) (1/s) | Damping ratio (ζ) |
| 70 | −26 | 1.8825 | 0.18099 | 0.94961 |
Table 5.
Simulation results for impulse steering tests performed at different speeds.
Table 5.
Simulation results for impulse steering tests performed at different speeds.
| Speed (km/h) | Phase Lag (ϕ) (deg) | Natural Frequency (fn) (Hz) | Yaw Rate Gain (a1) (1/s) | Damping Ratio (ζ) |
|---|
| 40 | −1.849 | 2.3739 | 0.134 | 1.62 |
| 70 | −26 | 1.8825 | 0.18099 | 0.94961 |
| 80 | −26.9 | 1.8624 | 0.18402 | 0.91857 |
| 90 | −29.49 | 1.8544 | 0.18454 | 0.84993 |
| 100 | −31.98 | 1.7871 | 0.1854 | 0.7842 |
| 120 | −34.96 | 1.6747 | 0.18278 | 0.69063 |
Table 6.
Cornering stiffness values.
Table 6.
Cornering stiffness values.
| Item | Cornering Stiffness (N/rad) |
|---|
| Type 1 (original) | 71,687 |
| Type 2 (increased by 30%) | 93,193.1 |
| Type 3 (decreased by 30%) | 50,180.9 |
Table 7.
Understeer coefficients computed at different vehicle speeds using different cornering stiffness values.
Table 7.
Understeer coefficients computed at different vehicle speeds using different cornering stiffness values.
| Velocity (km/h) | Kus (Type 1) (rad/g) | Kus (Type 2) (rad/g) | Kus (Type 3) (rad/g) |
|---|
| 20 | 1.560 | 1.534 | 1.598 |
| 30 | 0.734 | 0.705 | 0.776 |
| 40 | 0.443 | 0.414 | 0.486 |
| 50 | 0.306 | 0.275 | 0.348 |
| 60 | 0.232 | 0.201 | 0.272 |
| 70 | 0.190 | 0.158 | 0.230 |
| 77 | 0.194 | 0.151 | 0.235 |
| 80 | 0.204 | 0.168 | 0.255 |
Table 8.
Yaw rate gain computed at different vehicle speeds using three different cornering stiffness values.
Table 8.
Yaw rate gain computed at different vehicle speeds using three different cornering stiffness values.
| Velocity (km/h) | Yaw Rate Gain (Type 1) (1/s) | Yaw Rate Gain (Type 2) (1/s) | Yaw Rate Gain (Type 3) (1/s) |
|---|
| 10 | 0.57 | 0.57 | 0.57 |
| 20 | 1.11 | 1.13 | 1.08 |
| 30 | 1.57 | 1.65 | 1.50 |
| 40 | 1.99 | 2.14 | 1.82 |
| 50 | 2.32 | 2.57 | 2.04 |
| 60 | 2.55 | 2.93 | 2.17 |
| 70 | 2.68 | 3.22 | 2.21 |
| 77 | 2.43 | 3.12 | 2.00 |
| 80 | 2.23 | 2.69 | 1.78 |
Table 9.
Simulation results for impulse steering tests performed using different cornering stiffness values.
Table 9.
Simulation results for impulse steering tests performed using different cornering stiffness values.
| Item | Phase Lag (ϕ) (deg) | Natural Frequency (fn) (Hz) | Yaw Rate Gain (a1) (1/s) | Damping Ratio (ζ) |
|---|
| Type 1 | −26 | 1.8825 | 0.18099 | 0.94961 |
| Type 2 | −27.1621 | 0.89756 | 0.19171 | 1.7917 |
| Type 3 | −23.08 | 2.0994 | 0.14356 | 0.86539 |
Table 10.
Toe-in angle design variables.
Table 10.
Toe-in angle design variables.
| Item | Type 4 | Type 5 | Type 6 |
|---|
| Toe angle (°) | −1 | 0 | 1 |
Table 11.
Yaw rate gain computed at various vehicle speeds using three different toe-in angles.
Table 11.
Yaw rate gain computed at various vehicle speeds using three different toe-in angles.
| Velocity (km/h) | Yaw Rate Gain (Type 4) (1/s) | Yaw Rate Gain (Type 5) (1/s) | Yaw Rate Gain (Type 6) (1/s) |
|---|
| 30 | 1.43 | 1.57 | 1.67 |
| 40 | 1.73 | 1.99 | 2.18 |
| 50 | 1.98 | 2.32 | 2.6 |
| 60 | 2.19 | 2.55 | 2.94 |
| 70 | 2.35 | 2.68 | 3.07 |
| 77 | 2.18 | 2.43 | 2.67 |
| 80 | 2.04 | 2.23 | 2.40 |
Table 12.
Simulation results for impulse steering tests performed using different toe-in angles.
Table 12.
Simulation results for impulse steering tests performed using different toe-in angles.
| Item | Phase Lag (ϕ) (°) | Natural Frequency (fn) (Hz) | Steady-State Gain (a1) (1/s) | Damping Ratio (ζ) |
|---|
| Type 4 | −24.88 | 1.9432 | 0.15898 | 0.9656 |
| Type 5 | −26 | 1.8825 | 0.18099 | 0.94961 |
| Type 6 | −25.5408 | 1.8106 | 0.1871 | 0.96911 |
Table 13.
Camber angle design variables.
Table 13.
Camber angle design variables.
| Item | Type 7 | Type 8 | Type 9 |
|---|
| Camber angle (°) | −1 | 0 | 1 |
Table 14.
Simulation results for yaw rate gain given different vehicle speeds and camber angles.
Table 14.
Simulation results for yaw rate gain given different vehicle speeds and camber angles.
| Velocity (km/h) | Yaw Rate Gain (Type 7) (1/s) | Yaw Rate Gain (Type 8) (1/s) | Yaw Rate Gain (Type 9) (1/s) |
|---|
| 30 | 1.59 | 1.57 | 1.58 |
| 40 | 2.00 | 1.99 | 1.98 |
| 50 | 2.33 | 2.32 | 2.31 |
| 60 | 2.57 | 2.55 | 2.53 |
| 70 | 2.72 | 2.68 | 2.65 |
| 77 | 2.60 | 2.50 | 2.51 |
| 80 | 2.35 | 2.23 | 2.11 |
Table 15.
Simulation results for impulse steering tests performed using different camber angles.
Table 15.
Simulation results for impulse steering tests performed using different camber angles.
| Item | Phase Lag (ϕ) (°) | Natural Frequency (fn) (Hz) | Steady-State Gain (a1) (1/s) | Damping Ratio (ζ) |
|---|
| Type 7 | −25.2334 | 1.686 | 0.18309 | 1.0531 |
| Type 8 | −26 | 1.8825 | 0.18099 | 0.9496 |
| Type 9 | −24.7735 | 1.9505 | 0.17871 | 1.0775 |
Table 16.
Effects of changes in steady-state design variables on vehicle handling performance.
Table 16.
Effects of changes in steady-state design variables on vehicle handling performance.
| Item | Design Variable | Yaw Rate Gain (Steady State) | Percentage (Steady State) |
|---|
| Type 1 (original) | Cornering stiffness (original value) | 2.68 | 0% |
| Type 2 | Cornering stiffness (increased by 30%) | 3.22 | 20% |
| Type 3 | Cornering stiffness (decreased by 30%) | 2.21 | −17% |
| Type 4 | Initial toe-in angle (−1°) | 2.35 | −12.3% |
| Type 5 (original) | Initial toe-in angle (0°) | 2.68 | 0% |
| Type 6 | Initial toe-in angle (1°) | 3.07 | 9.7% |
| Type 7 | Initial camber angle (−1°) | 2.72 | 1.47% |
| Type 8 (original) | Initial camber angle (0°) | 2.68 | 0% |
| Type 9 | Initial camber angle (1°) | 2.65 | −1.11% |
Table 17.
Effects of changes in transient-state design variables on vehicle handling performance.
Table 17.
Effects of changes in transient-state design variables on vehicle handling performance.
| Item | Design Variable | Yaw Rate Gain (Transient) | Percentage (Transient) |
|---|
| Type 1 (original) | Cornering stiffness (original value) | 0.18099 | 0% |
| Type 2 | Cornering stiffness (increased by 30%) | 0.19171 | 5.92% |
| Type 3 | Cornering stiffness (decreased by 30%) | 0.14356 | −20.7% |
| Type 4 | Initial toe-in angle (−1°) | 0.15898 | −12.2% |
| Type 5 (original) | Initial toe-in angle (0°) | 0.18099 | 0% |
| Type 6 | Initial toe-in angle (1°) | 0.1871 | 3.38% |
| Type 7 | Initial camber angle (−1°) | 0.18309 | 1.16% |
| Type 8 (original) | Initial camber angle (0°) | 0.18099 | 0% |
| Type 9 | Initial camber angle (1°) | 0.17871 | −1.26% |


