Article

Research on Accelerating Single-Frequency Precise Point Positioning Convergence with Atmospheric Constraint

1
NASG Key Laboratory of Land Environment and Disaster Monitoring, China University of Mining and Technology, Xuzhou 221116, China
2
School of Environment Science and Spatial Informatics, China University of Mining and Technology, Xuzhou 221116, China
3
College of Water Resources and Architectural Engineering, Northwest A&F University, Yangling 712100, China
*
Authors to whom correspondence should be addressed.
Appl. Sci. 2019, 9(24), 5407; https://doi.org/10.3390/app9245407
Submission received: 23 November 2019 / Revised: 6 December 2019 / Accepted: 6 December 2019 / Published: 10 December 2019

Abstract

:
An increasing number of researchers have conducted in-depth research on the advantages of low-cost single-frequency (SF) receivers, which can effectively use ionospheric information when compared to dual-frequency ionospheric-free combination. However, SF observations are bound to increase the unknown parameters and prolong the convergence time. It is desirable if the convergence time can be reduced by external information constraints, for example atmospheric constraints, which include ionosphere- or troposphere constraints. In this study, ionospheric delay constraints, tropospheric delay constraints, and their dual constraints were considered. Additionally, a total of 18,720 test experiments were performed. First, the nearest-neighbor extrapolation (NENE), bilinear- (BILI), bicubic- (BICU), and Junkins weighted-interpolation (JUNK) method of Global Ionospheric Map (GIM) grid products were analyzed. The statistically verified BILI in the percentage of convergence time, average convergence time, and computation time consumption of them shows a good advantage. Next, the influences of global troposphere- and ionosphere-constrained on the convergence time of SF Precise Point Positioning (PPP) were analyzed. It is verified that the ionosphere-constrained (TIC2) has significant influence on the convergence time in the horizontal and vertical components, while the troposphere-constrained (TIC1) has better effect on the convergence time in the vertical components within some thresholds. Of course, the dual constraint (TIC3) has the shortest average convergence time, which is at least 46.5% shorter in static mode and 5.4% in kinematic mode than standard SF PPP (TIC0).

1. Introduction

The concept and technology of Precise Point Positioning (PPP) were first proposed and implemented for the Global Positioning System (GPS) by the American Jet Propulsion Laboratory (JPL) in the late 1990s [1]. PPP has attracted significant interest over the intervening years due to its high accuracy without needing a specific reference station, providing correctional information, simple operations, and cost effectiveness due to reductions in labor and equipment costs. Therefore, it has been extensively used in the areas, for instance, determines the precise orbit, surface ice flow speed, as well as positioning, navigation and timing (PNT) applications [2,3,4]. The traditional PPP models are based on Ionosphere-Free (IF) combinations with dual-frequency raw phase and code observations for the removal of the first-order effect of ionospheric refraction [5]. However, the second- and third-order ionospheric effects still exist and they may cause measurements errors of sub-centimeters in GPS [6,7]. Therefore, traditional PPP technology based on IF combinations cannot obtain ionospheric information, and the ionospheric error is not completely eliminated. In the last few years, PPP used raw observations has received an increasing amount of research attention because of its several advantages as compared to traditional IF PPP, particularly the development of new multi-frequency GNSS [8].
The ionosphere refers to the atmospheric space starting at 60 km above the ground and extending to the magnetosphere. The Global Navigation Satellite System (GNSS) signal will generate ionospheric delay after passing through the ionosphere. A large number of models are currently being used to describe the delay that the ionosphere produces for electromagnetic signals propagating from satellites to receivers. If the delay is not corrected, it can have an important impact on the positioning accuracy of GNSS [9], especially for single-frequency PPP (SF PPP). Shi et al. proposed an improved method in which the deterministic representation is further refined by a stochastic process for each satellite with an empirical model for its power density [10]. The results of this method show that the single- and dual-frequency PPP exhibited enhanced convergence time, and the positioning accuracy of SF data is only improved by 25% [11]. Abd Rabbou et al. [12] developed an SF PPP model, and the improved model uses between-satellite-single-difference quasi-phase constrained GNSS observations. The GRoup and PHase Ionospheric Correction (GRAPHIC) method uses an SF code and carrier phase data to form an IF combined observation [13]. The positioning accuracy can reach several centimeters based on the GRAPHIC method, but the method requires two hours of convergence time [14].
The International GNSS Service (IGS) Ionosphere Working Group (IWG) was created in 1998. Several analysis centers (CODE (Center for Orbit Determination in Europe), ESA (European Space Agency), JPL (Jet Propulsion Laboratory), UPC (Universitat Politecnica de Catalunya), CAS (Chinese Academy of Sciences), and WHU (Wuhan University)) produce and release the post-processed Global Ionospheric Map (GIM) products, where the format is IONosphere EXchange (IONEX) [15,16]. The data portion of the GIM products utilized contain a total of 25 maps, with the latitude variation ranging from 87.5° to −87.5° with an interval −2.5° and the longitude ranging from −180° to 180° at 5° intervals. The accuracy of the GIM is improved based on the Spherical Harmonic (SH) expansion model [17]. The VTEC of each ionospheric grid point is obtained while using different interpolation methods, such as bilinear interpolation [18], inverse distance weighted function [19], and Kriging interpolation [20]. Lanyi and Roth [21] proposed a polynomial model for single-station TEC derivation, and a single-station receiver bias can be estimated while using this model [22]. This method was used by Lu et al. [23] to study the effects of ionospheric shell height on GPS-based TEC derivation by a single station, while Kao et al. [24] applied this method to multi-stations. Chen et al. [25] analyzed the applicability of the sophisticated Klobuchar model for VTEC in China. Liu et al. [26] had based on GPS to observe and analyze the fluctuation characteristics of TEC over China.
In GNSS data processing, the slant tropospheric delay on the signal propagation path between the satellite and the receiver is usually mapped to the zenith direction via a mapping function. The Zenith Tropospheric Delay (ZTD) consists of the Zenith Hydrostatic Delay (ZHD) and the Zenith Wet Delay (ZWD, i.e., the zenith non-hydrostatic delay). The models of tropospheric delay estimation usually adopt the Hopfield model and Saastamoinen model. There are roughly two types of mapping functions. The first type are empirical models, which merely require the epoch time and the approximate coordinates of the receiver station, such as the Niell Mapping Function (NMF) [27] and the Global Mapping Function (GMF) [28]. The second type of mapping function is based on a large number of weather model analyses at the epoch of the observations, such as Isobaric Mapping Functions (IMF) [29] and Vienna Mapping Functions (VMF1) [28]. Huang et al. [30] proposes a new Asian single site tropospheric correction model, called the Single Site Improved European Geostationary Navigation Overlay Service model (SSIEGNOS).
SF PPP cannot be combined or differenced to be eliminated or attenuated by a part of the error, like dual-frequency PPP. If there are some information related to the parameters, and this information is accurate enough, the precision of traditional SF PPP can be largely improved and the convergence time can be shortened. Zhang et al. [31] studied real-time GIM and its application in SF positioning, Aggrey and Bisnath [32] studied the effect of atmospheric-constrained on the convergence time of dual- and triple-frequency PPP, and Gao et al. [33] applied the Inertial Navigation System (INS) to the ionosphere-constrained PPP to overcome the drawbacks that accompany unexpected and unavoidable substandard observation environments.
This study uses the GIM products and the tropospheric zenith path delays from the IGS as the constrained information for SF PPP. The organization of this study is as follows: the next step details the methods for mathematical models of standard SF GPS PPP, troposphere-constrained SF GPS PPP, and ionosphere-constrained SF GPS PPP, and the details of the four interpolation methods of GIM products. Afterwards, in Section 3 we compare and analysis the influence of interpolation methods and constraint methods on SF GPS PPP convergence time, and finally in Section 4 we draw conclusions. Later, we will study ionospheric delay and tropospheric delay prediction models to provide virtual atmospheric delay observations for real-time PPP and also provide a priori information for the constraint processing.

2. Methods

The GPS PPP observation models are first derived. Afterwards, different interpolation methods for GIM products are introduced.

2.1. GPS PPP Observation Models

This study uses an undifferenced and uncombined GPS PPP model as compared with the traditionally used IF-PPP model. These models include a standard SF GPS PPP model, troposphere-constrained SF GPS PPP models, ionosphere-constrained SF GPS PPP models, and SF GPS PPP models with troposphere- and ionosphere-constrained.

2.1.1. Standard Single-frequency GPS PPP Observation Model

The distance from the satellite to the receiver can be measured while using pseudorange and carrier phase observations, with the following expression [34]:
{ P r s = ρ r s + c ( d t r d t s ) + I r s + M w Z w + M h Z h + d r d s + ε r s L r s = λ 1 Φ r s = ρ r s + c ( d t r d t s ) I r s + M w Z w + M h Z h + λ 1 ( N r s + b r b s ) + ξ r s .
where, P r s and L r s are the original pseudorange and the carrier phase Φ r s is multiplied by wavelength λ 1 for the specific receiver r and satellite s ; ρ r s is the geometric distance from the satellite to the receiver; c is the speed of light in vacuum; d t r and d t s are the clock error of the receiver and satellite; I r s is the slant ionospheric delay on the first frequency f 1 ; M w is the wet mapping function; Z w is the zenith wet delay; M h is the hydrostatic mapping function; Z h is the zenith hydrostatic delay; d r is the frequency-dependent receiver uncalibrated code delay (UCD) with respect to satellite s ; d s is the frequency-dependent satellite UCD; N r s is the integer phase ambiguity; b r and b s are the uncalibrated phase delays (UPDs) for the receiver and satellite, which is frequency-dependent; and, ε r s and ξ r s are the sum of measurement noise caused by the pseudorange and carrier phase observations and the error caused by the multipath effect. Other errors have been modeled in advance.
The original pseudorange and carrier phase observations equations are linearized, and the receiver clock offset only absorbs common part of frequency dependent receiver UCDs. Supposing that m satellites are tracked simultaneously at a certain epoch by the receiver r , the standard SF PPP model can be written, as follows [35]:
[ p r 1 l r 1 p r m l r m ] = [ μ r I t M w K R ] [ x d t ¯ r Z w I r s N ¯ r s ] + [ ε r ξ r ] , Q L ,
with
{ d t ¯ r = d t r + d r N ¯ r s = λ 1 ( N r s + b r b s ) + d I F s d r ,
where μ r is the unit vector of the coordinate component between the receiver and the satellite; x is the vector of the receiver position increments relative to the priori position; and, I t is a unit vector of 2 m rows and one column, corresponding to the receiver clock parameter d t ¯ r . In matrix K , the elements for the corresponding p r s and l r s are 1 and −1, respectively, corresponding to the ionospheric parameter I r s . R is the matrix corresponding to the ambiguity parameters N ¯ r s , and the elements for the corresponding p r s and l r s are 0 and 1, respectively. Q L is the stochastic model of the observed minus computed (OMC) observables. IGS precise satellite clock was calculated by the IF combination observables and the IF combination of satellite UCDs was absorbed by the satellite clock offsets, as follows [2]:
d t I F 12 s = d t s + d I F 12 s ,
d I F 12 s = α 12 d 1 s + β 12 d 2 s ,
α 12 = ( f 1 s ) 2 ( f 1 s ) 2 ( f 2 s ) 2 ,
β 12 = ( f 2 s ) 2 ( f 1 s ) 2 ( f 2 s ) 2 .

2.1.2. Troposphere-Constrained Single-Frequency GPS PPP Observation Model

According to the tropospheric delay product published by IGS, a virtual observation is used in the observation equation, and a troposphere-constrained SF GPS PPP is then constructed. The observation equation is expressed, as follows:
[ p r 1 l r 1 p r m l r m T r ] = [ μ r I t M w K R 0 0 I T 0 0 ] [ x d t ¯ r Z w I r 1 N ¯ r s ] + [ ε r ξ r ε r , t r o p ] , Q L , Q T .
where I T is a unit vector of m rows and one column, corresponding to the zenith wet delay parameter Z w ; T r is derived from external tropospheric products, the products for each IGS station at 5 min intervals provided by the IGS Analysis Center; ε r , t r o p is the corresponding noise; Q T denotes the stochastic model of virtual troposphere observables; and, 0 is a zero matrix.

2.1.3. Ionosphere-Constrained Single-Frequency GPS PPP Observation Model

The ionosphere-constrained SF GPS PPP can add the GIM product as a virtual observation to constrain the ionospheric parameters as compared with the standard SF GPS PPP. The constraint equation for the observation is as follows [35]:
[ p r 1 l r 1 p r m l r m I r 1 I r m ] = [ μ r I t M w K R 0 0 0 I I 0 ] [ x d t ¯ r Z w I r 1 N ¯ r s ] + [ ε r ξ r ε r , i o n ] , Q L , Q I .
where I r s is derived from external ionospheric products with the corresponding noise ε r , i o n ; I I is a unit vector of m rows and one column; and, Q I denotes the stochastic model of virtual ionospheric observables.

2.1.4. Troposphere- and Ionosphere-Constrained Single-Frequency GPS PPP Observation Model

If the external troposphere and ionospheric products are both used as virtual observations to constrain the observation equation, the following observation equation is obtained:
[ p r 1 l r 1 p r m l r m T r I r 1 I r m ] = [ μ r I t M w K R 0 0 I T 0 0 0 0 0 I I 0 ] [ x d t ¯ r Z w I r 1 N ¯ r s ] + [ ε r ξ r ε r , t r o p ε r , i o n ] , Q L , Q T , Q I .

2.2. Different Interpolation Methods for GIM Products

It is necessary to interpolate the ionospheric grid point from GIM products to obtain the observation station VTEC before performing the ionosphere-constrained modeling. In this study, a comparative analysis of four interpolation methods is performed. These methods include nearest-neighbor extrapolation [36], bilinear interpolation [18], Junkins weighted interpolation, and bicubic interpolation. The principles of the Junkins weighted and bicubic interpolation methods are described below.

2.2.1. Junkins Weighted Interpolation

Figure 1 shows the schematic of Junkins interpolation. In Figure 1, the latitude and longitude of the interpolation point are b and l , that is, p ( b , l ) , and the values of the four GIM grid points adjacent to it are p 11 ( b 1 , l 1 ) , p 12 ( b 1 , l 2 ) , p 21 ( b 2 , l 1 ) , and p 22 ( b 2 , l 2 ) . It is assumed that the TEC values at p 11 , p 12 , p 21 , and p 22 are T E C 11 , T E C 12 , T E C 21 , and T E C 22 , respectively. The VTEC of point p can be interpolated according to the VTEC of the surrounding four grid points. The interpolation formula used is as follows:
f ( b , l ) = w 1 ( x , y ) T E C 11 + w 2 ( x , y ) T E C 12 + w 3 ( x , y ) T E C 21 + w 4 ( x , y ) T E C 22 ,
The weighted function w n ( x , y ) , n = 1 , 2 , 3 , 4 is as follows:
w 1 ( x , y ) = ω ( 1 x p , 1 y p ) ,
w 2 ( x , y ) = ω ( x p , 1 y p ) ,
w 3 ( x , y ) = ω ( x p , y p ) ,
w 4 ( x , y ) = ω ( 1 x p , y p ) ,
where
ω ( A , B ) = A 2 B 2 ( 9 6 A 6 B + 4 A B ) ,
x p = l l 1 l 2 l 1 , y p = b b 1 b 2 b 1 .
We can use nearest-neighbor extrapolation when the p point only has two proximate GIM grid points.

2.2.2. Bicubic Interpolation

The bicubic interpolation [37] method uses 16 adjacent points for interpolation (Figure 2). Bicubic interpolation is an extension of cubic interpolation in a two-dimensional space. The cubic interpolation kernel is an approximation of the convolution interpolation of the ideal sampling sinc function at [−2,2] that is based on the cubic polynomial [38]. Typically, cubic interpolation produces interpolation coefficients that are based on a third-order polynomial:
h ( q ) = { 1 ( w + 3 ) | q | 2 + ( w + 2 ) | q | 3 , 0 | q | 1 4 w + 8 w | q | 5 w | q | 2 + w | q | 3 , 1 | q | 2 0 , 2 | q | ,
where q represents the distance between the interpolation point and the reference point, w is a tunable parameter, and the best result is obtained by verifying w = 0.5 [38] with a large amount of data. Under these conditions, Equation (18) is simplified to:
h ( q ) = { 1 2.5 | q | 2 + 1.5 | q | 3 , 0 | q | 1 2 4 | q | + 2.5 | q | 2 0.5 | q | 3 , 1 | q | 2 0 , 2 | q | ,
Bicubic interpolation is similar to bilinear interpolation. It is also decomposed into two one-dimensional interpolations: horizontal interpolation and vertical interpolation. Figure 2 shows the interpolation process. First, vertical interpolation is performed to obtain four virtual values, and then the values of the p point are obtained via interpolating based on the four virtual values. The calculation process is as follows:
{ P 1 = C 1 P 11 + C 2 P 21 + C 3 P 31 + C 4 P 41 P 2 = C 1 P 12 + C 2 P 22 + C 3 P 32 + C 4 P 42 P 3 = C 1 P 13 + C 2 P 23 + C 3 P 33 + C 4 P 43 P 4 = C 1 P 14 + C 2 P 24 + C 3 P 34 + C 4 P 44 ,
namely
[ P 1 P 2 P 3 P 4 ] = [ C 1 C 2 C 3 C 4 ] [ P 11 P 12 P 13 P 14 P 21 P 22 P 23 P 24 P 31 P 32 P 33 P 34 P 41 P 42 P 43 P 44 ] ,
F = L 1 P 1 + L 2 P 2 + L 3 P 3 + L 4 P 4 = [ P 1 P 2 P 3 P 4 ] [ L 1 L 2 L 3 L 4 ] = [ C 1 C 2 C 3 C 4 ] [ P 11 P 12 P 13 P 14 P 21 P 22 P 23 P 24 P 31 P 32 P 33 P 34 P 41 P 42 P 43 P 44 ] [ L 1 L 2 L 3 L 4 ] ,
where
C 1 = h ( b b 1 ) , C 2 = h ( b b 2 ) , C 3 = h ( b 3 b ) , C 4 = h ( b 4 b ) L 1 = h ( l l 1 ) , L 2 = h ( l l 2 ) , L 3 = h ( l 3 l ) , L 4 = h ( l 4 l ) [ P 11 P 12 P 13 P 14 P 21 P 22 P 23 P 24 P 31 P 32 P 33 P 34 P 41 P 42 P 43 P 44 ] = [ T E C 11 T E C 12 T E C 13 T E C 14 T E C 21 T E C 22 T E C 23 T E C 24 T E C 31 T E C 32 T E C 33 T E C 34 T E C 41 T E C 42 T E C 43 T E C 44 ]
then
f ( b , l ) = [ h ( b b 1 ) h ( b b 2 ) h ( b 3 b ) h ( b 4 b ) ] [ T E C 11 T E C 12 T E C 13 T E C 14 T E C 21 T E C 22 T E C 23 T E C 24 T E C 31 T E C 32 T E C 33 T E C 34 T E C 41 T E C 42 T E C 43 T E C 44 ] [ h ( l l 1 ) h ( l l 2 ) h ( l 3 l ) h ( l 4 l ) ] .
We can use bilinear interpolation when the number of GIM grid points around point p is less than 16.
Tropospheric delay interpolation is similar to inverse distance-weighted interpolation [19], and it is performed according to the relationship between the tropospheric delay value and time in the tropospheric products.

3. Experimental Data Set and Analysis

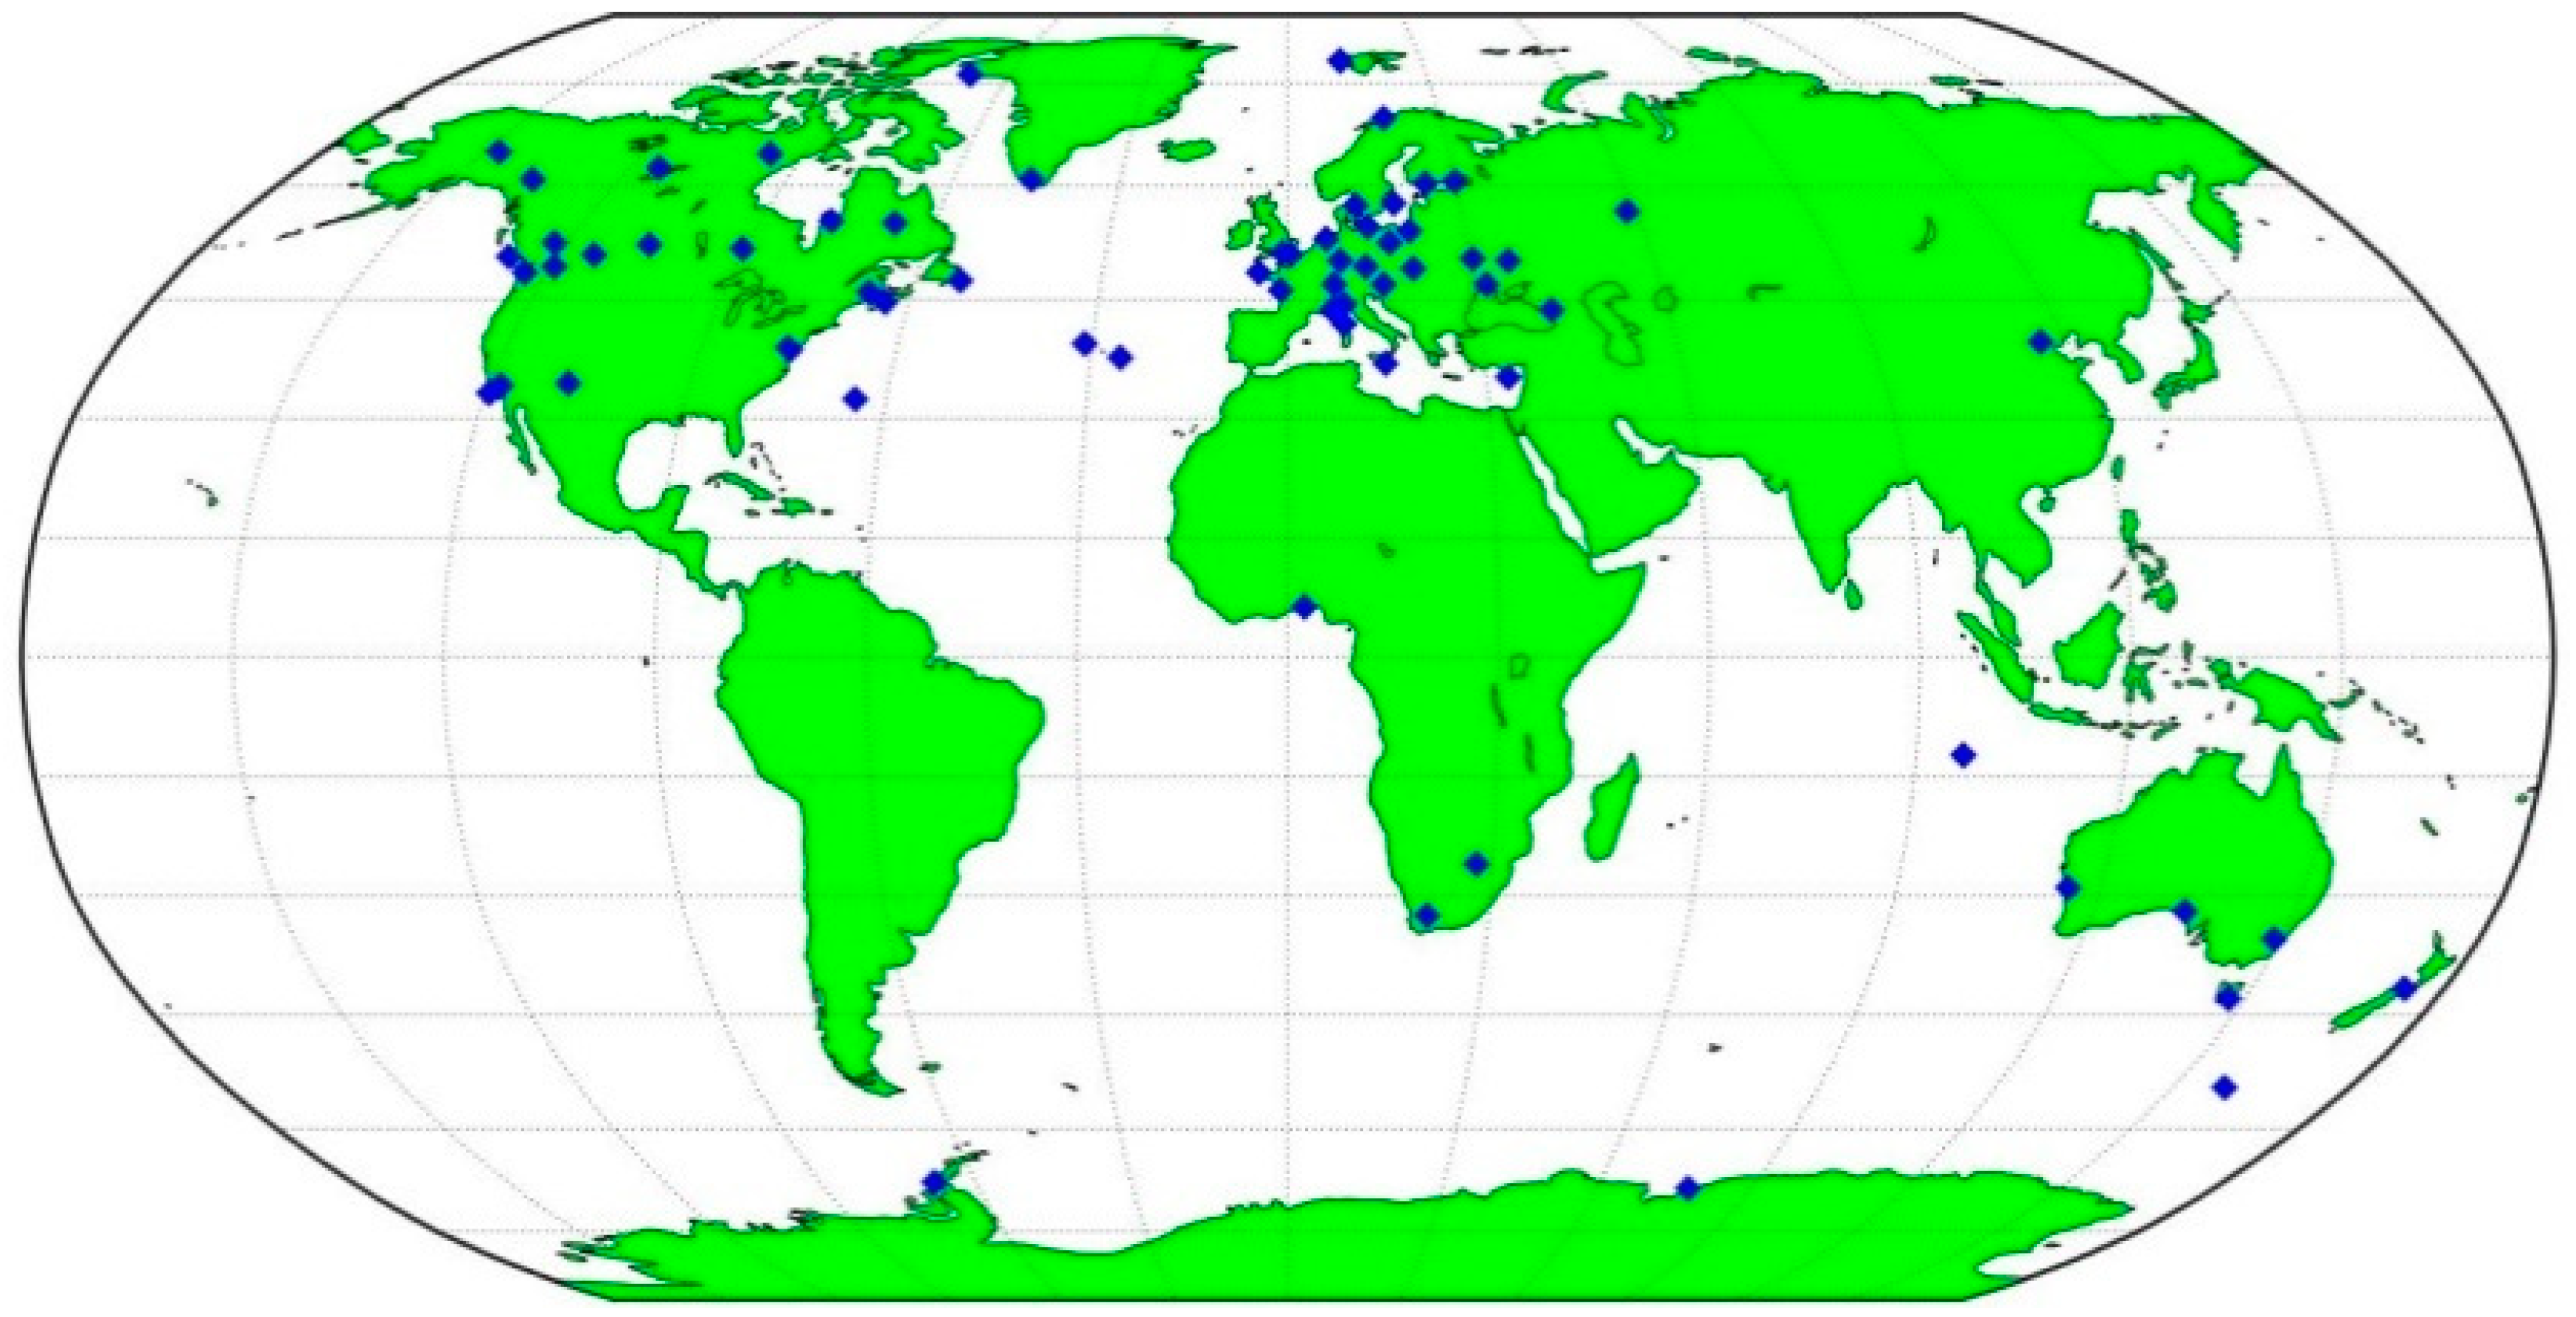
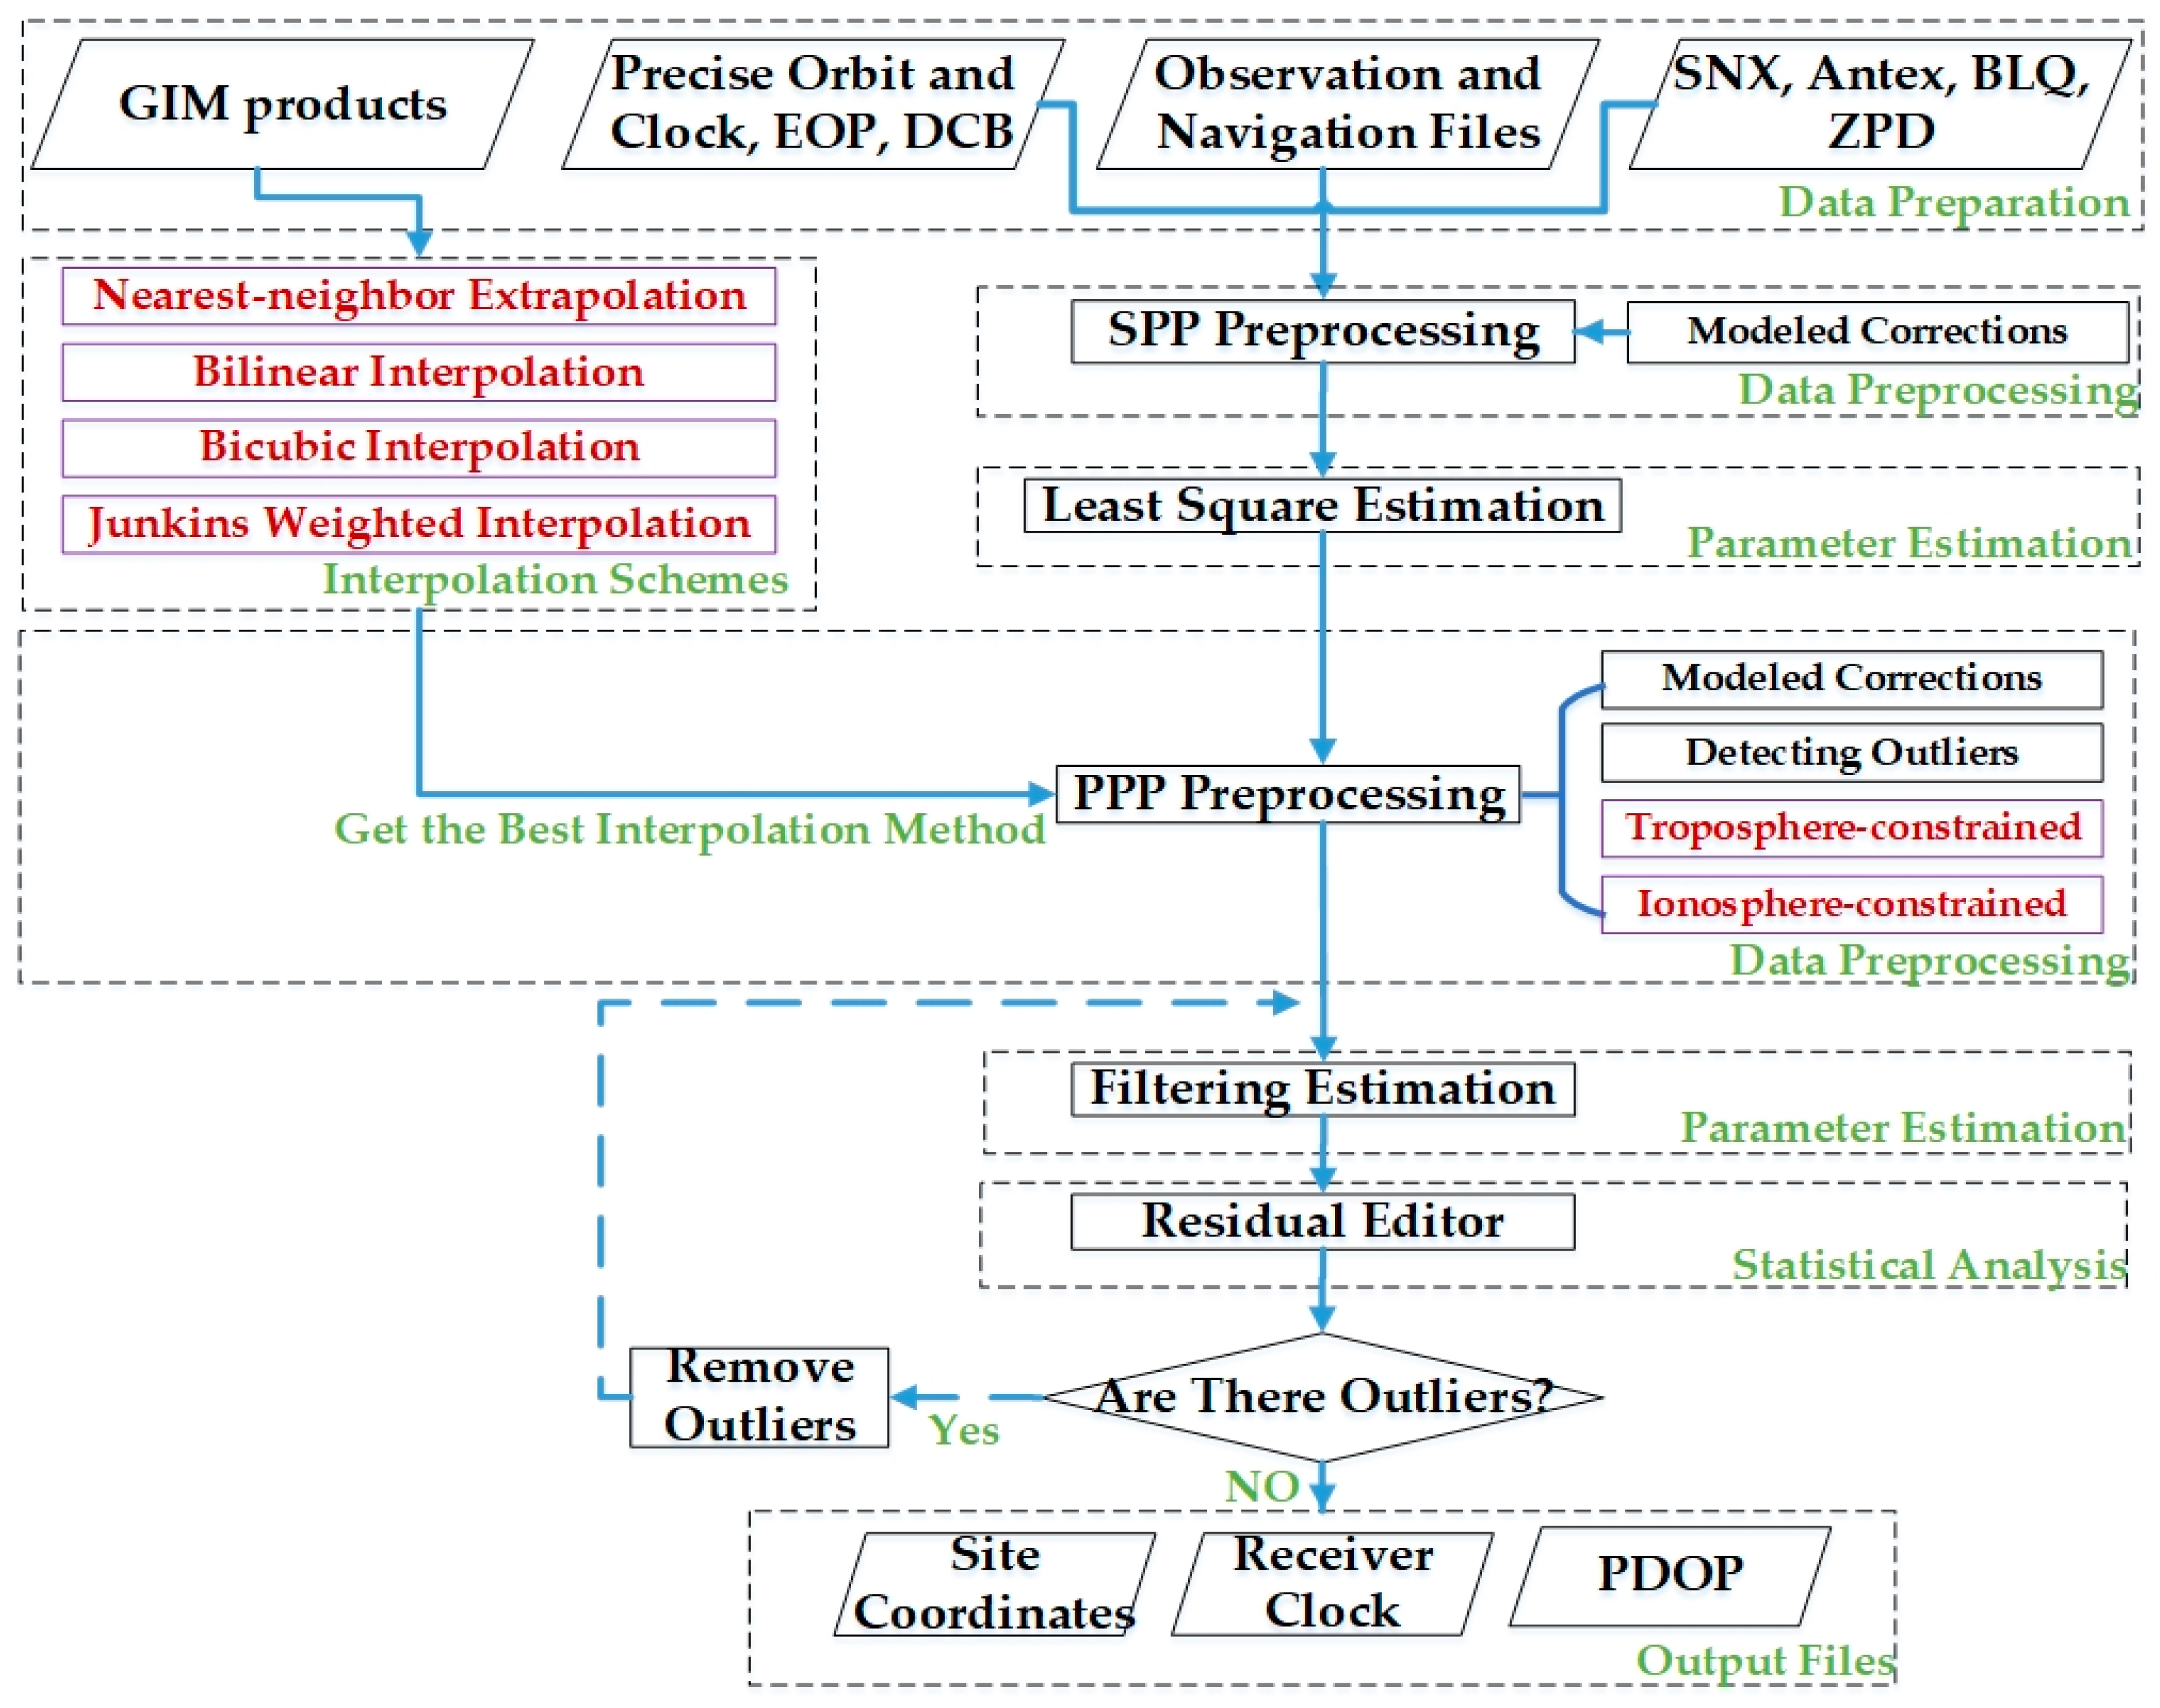
The PPP results based on raw observations are evaluated with 78 global IGS stations for the whole month of September 2017 to verify the improved troposphere- and ionosphere-constrained for GPS SF PPP performance. For every station, the 24-h observations were divided into eight 3-h sessions to evaluate the performance of PPP. Therefore, a total of 18720 experiments were tested and compared. Figure 3 shows the distribution of these stations in the world. Figure 4 show a flowchart of our study procedure, while Table 1 lists the models and strategies that were used in this study.
The PPP performance in terms of convergence time in the horizontal and vertical components is evaluated at a different confidence level (the 68% and 95%) in two modes (static and kinematic). The criterion for judging convergence is when the positioning error in the horizontal and vertical components is less than 0.5 m (95% level) and 0.3 m (68% level), respectively [11].

3.1. The Effect of Interpolation Method on Ionosphere-constrained GPS Single-frequency PPP

For the convenience of description, Table 2 shows the abbreviations, according to the four interpolation methods that were introduced above. For GIM grid products, this study discuss the convergence time of the four interpolation methods under ionosphere-constrained and the average time of calculation of 78 stations.
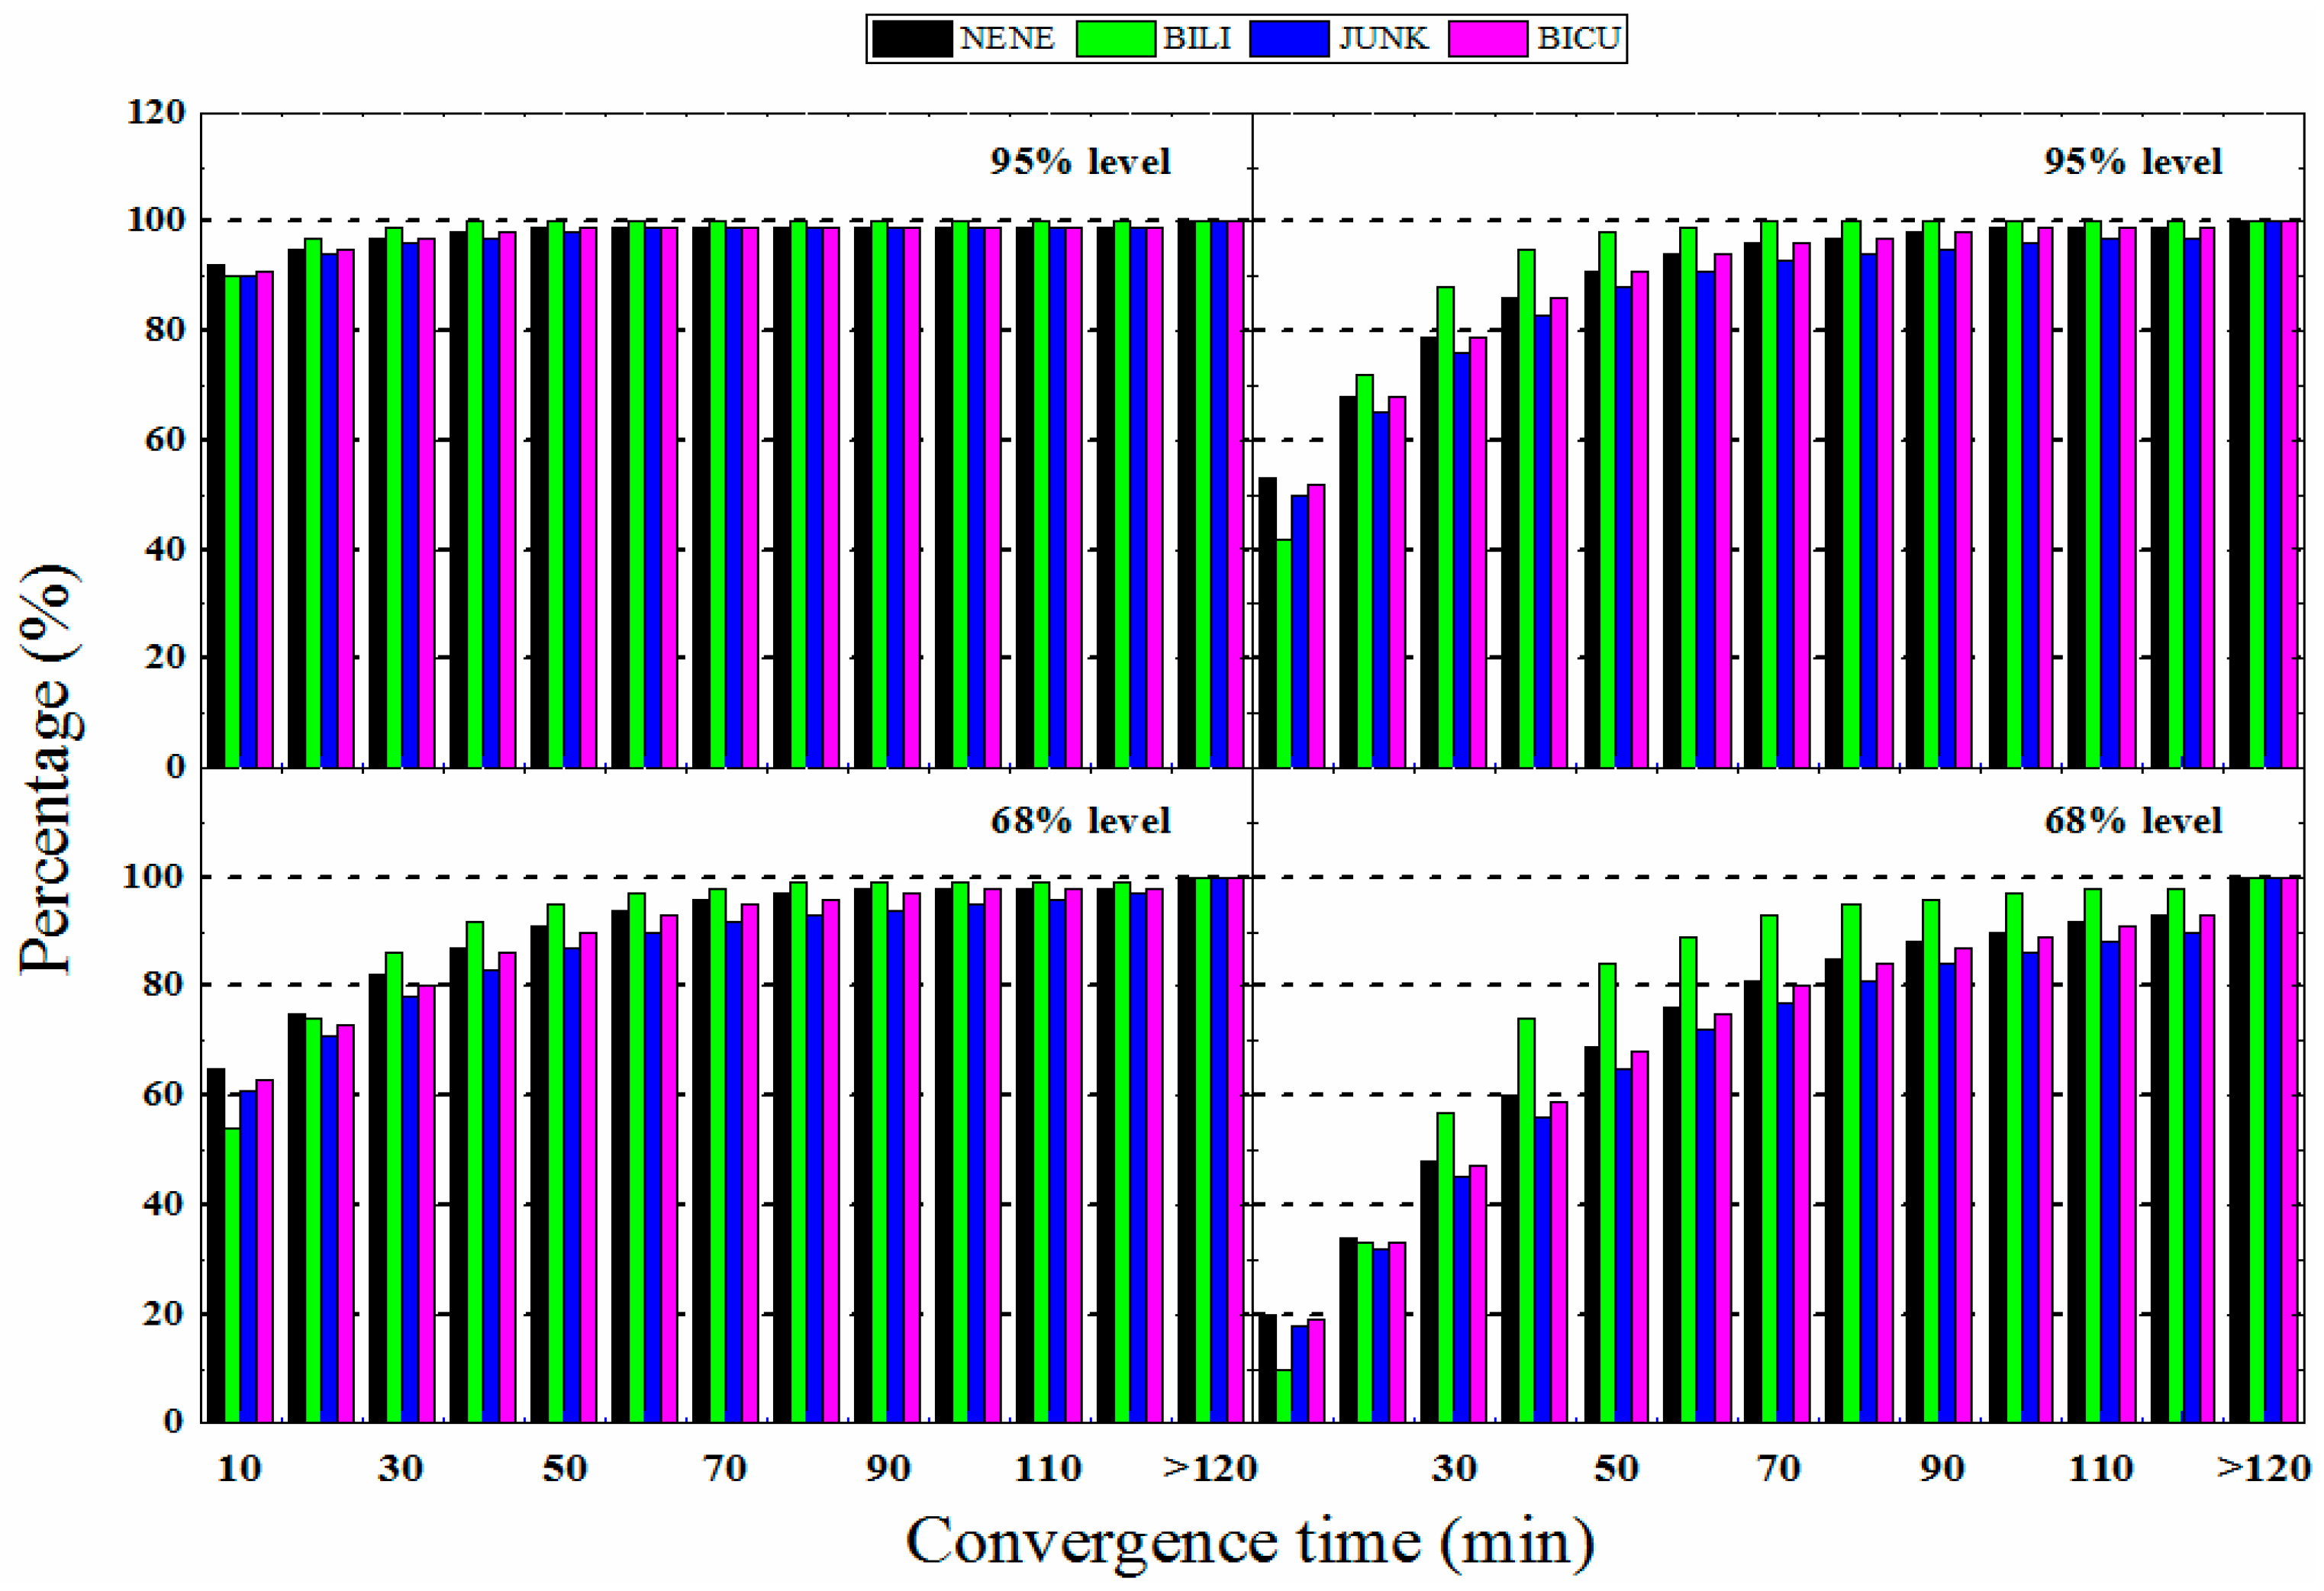
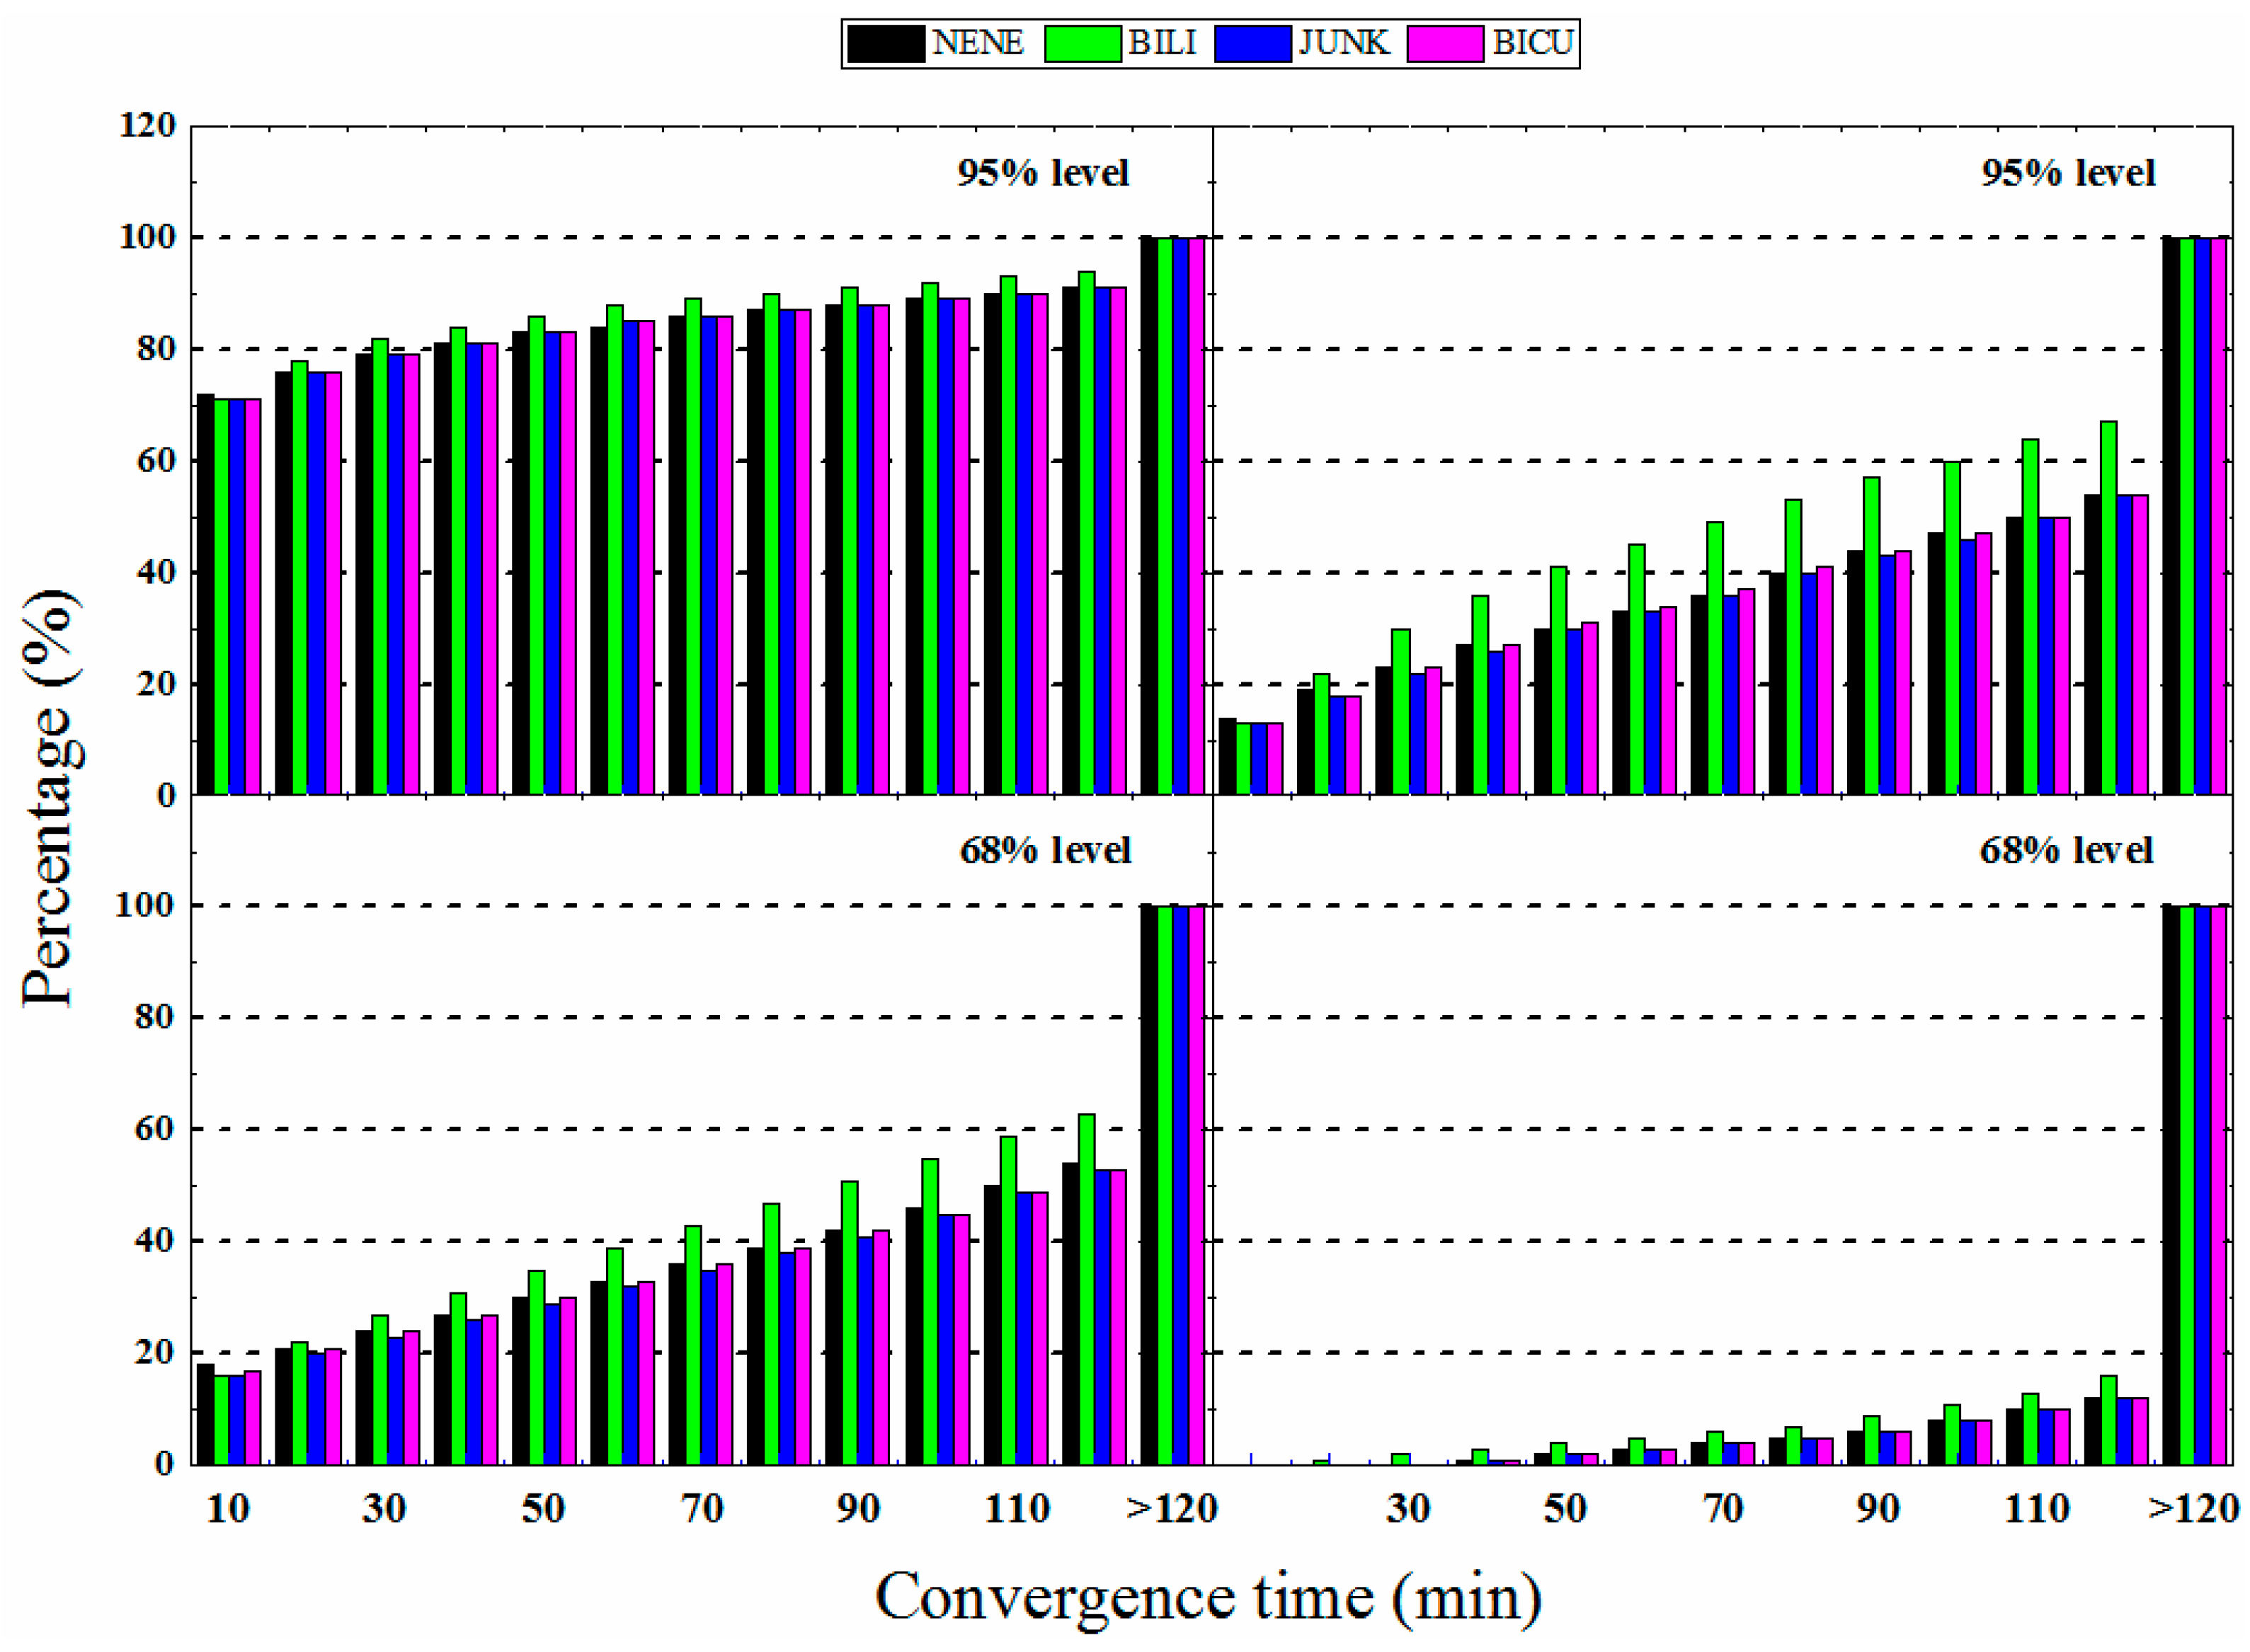
Figure 5 and Figure 6 show the percentage of convergence time. From these two pictures, whether in the 95% or 68% level, and whether it is static mode or kinematic mode, the convergence time is less than 10 min, the percentage of the BILI method calculation result is slightly lower than the other three methods, and in the subsequent convergence time less than 20 min, 30 min, etc., the percentage of BILI method calculation results has been higher than the other three methods, as shown in the green histogram. That is to say, the convergence time of the BILI interpolation method is the shortest when compared to the other three methods. Figure 7 shows the statistical results of the root mean square (RMS) error in the horizontal and vertical components in the static and kinematic mode, respectively. The RMS errors are based on the statistics of the last 15 min of the position solution error [44]. In the static mode, the percentage of BILI method calculations exceeds 40% in the horizontal and vertical components when the RMS is less than 5 cm, and the other three methods are lower than 40% and, in the subsequent statistical stages, the percentage of the BILI method is higher than the other three methods to reach 100%. In the kinematic mode, the percentage of BILI method calculation results in the horizontal component is 60% when the RMS is less than 15 cm, and the other three methods are lower than this value; while, in the vertical component, the BILI method exceeds 40%, and the other three methods not reaching 40%, and the percentage of BILI methods in other statistical stages is higher than the other three methods. In summary, the BILI method has higher final positioning accuracy than the other three methods in both the static and kinematic modes in the horizontal or vertical component.
The average convergence time (removed the data that the convergence time is equal to 180 min, that is, the data that does not convergence within three hours) is shown in Table 3, as compared to the JUNK method with the longest average convergence time, the average convergence time of BILI method at the 95% level is improved from 3.87 to 3.14 min (18.9%) in horizontal (H(95%)) and by from 19.44 to 15.18 min (21.9%) in the vertical components (V(95%)) in the static mode, while, in the kinematic mode, it increased by 15.3% in the horizontal component and 13.2% in the vertical component. At the 68% level, the average convergence time in the horizontal component (H(68%)) significantly reduced by 17.9% from 17.55 to 14.40 min and by 23.6% from 42.92 to 32.81 min in the vertical component (V(68%)) in the static mode, and in the kinematic mode, lessened by 6.8% and 2.3% in the horizontal component and vertical component, respectively. The calculation time of these 18720 tests was normalized to FLRS station (Table 4). We used a Lenovo computer, which is configured with Windows 8.1 professional computer with an i5-3470 Central Processing Unit (CPU) and 4GB of installed Random Access Memory (RAM). From Table 4, it can be concluded that the BILI interpolation method calculation time is almost the same as the Junkins weighted interpolation method, which takes the shortest time. According to all of the above analysis, the interpolation method that is adopted for GIM products in the following ionosphere-constrained model is bilinear interpolation.

3.2. Single-Frequency PPP with the Constraints

In this section, we analyse the effects of single-frequency GPS on unconstrained, troposphere-constrained, ionosphere-constrained, and their dual constrains on convergence time. Table 5 summarizes the four constraint schemes.
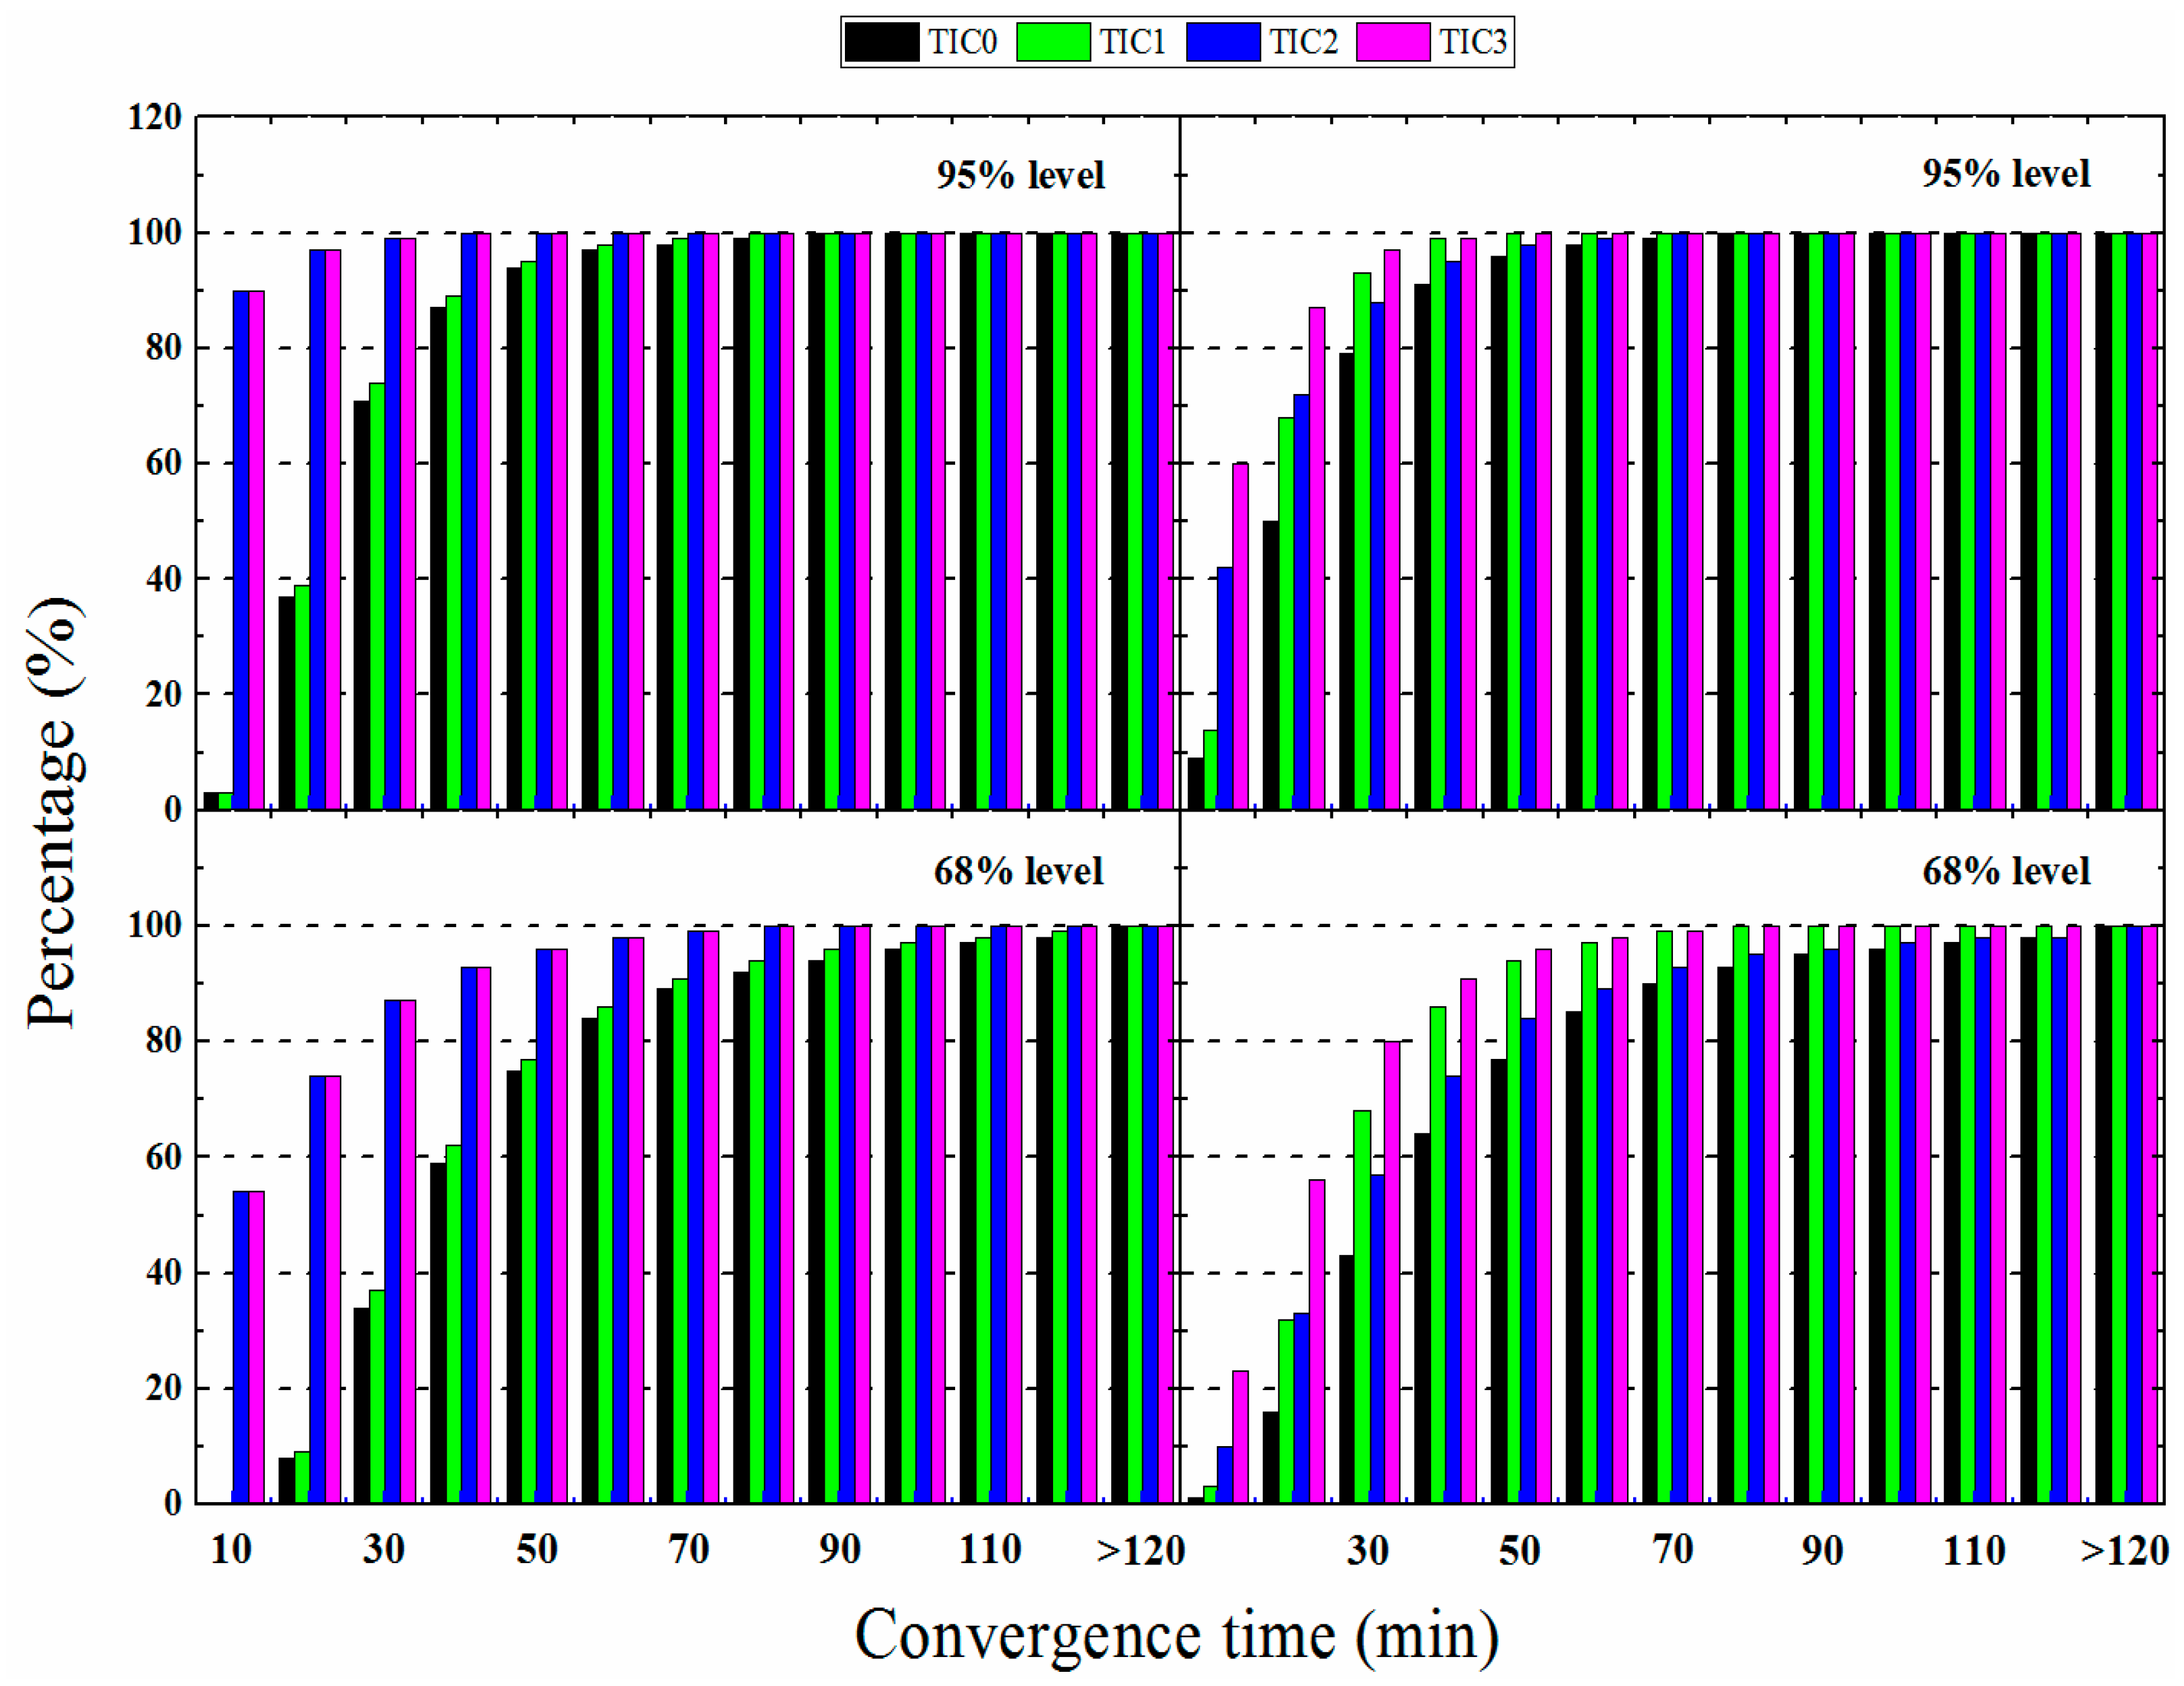
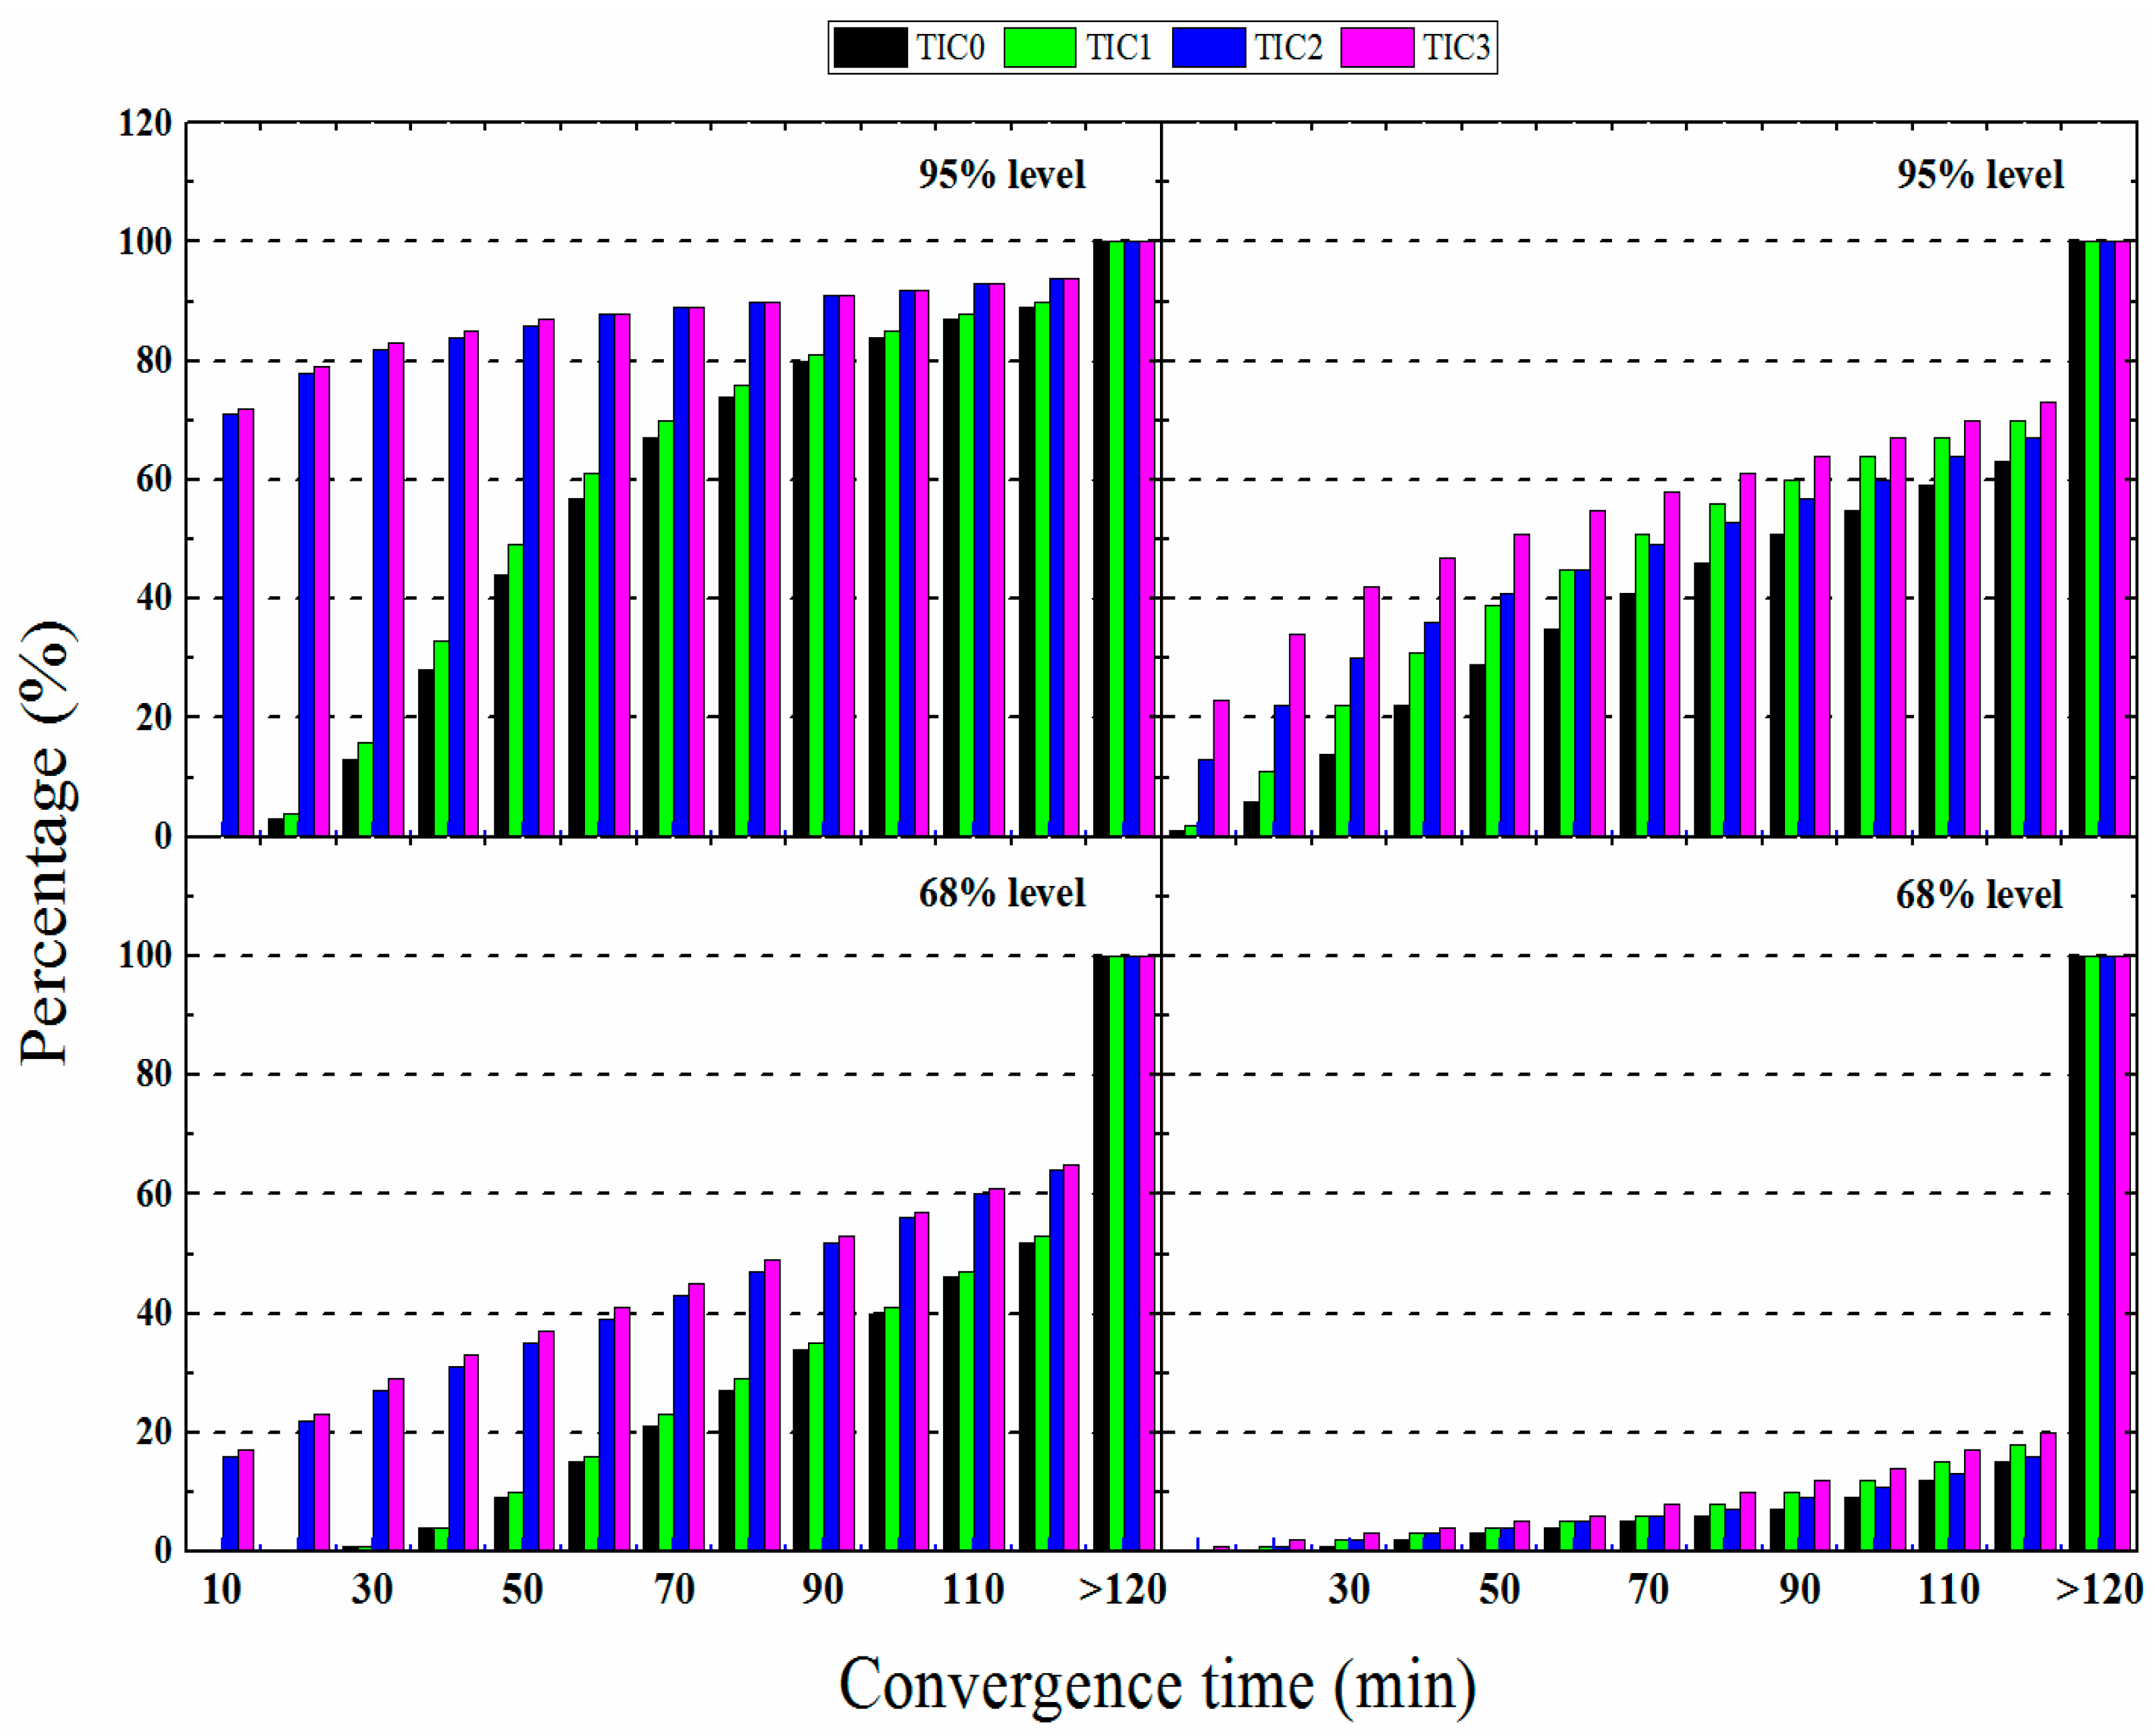
Figure 8 and Figure 9 show the percentage statistics of the effects of different constraint methods on the convergence time of GPS. It can be concluded from these two figures that in the horizontal component, the convergence time of the TIC3 has the largest percentage in the same range, and the TIC1 has less influence on the convergence time. In the vertical component, the percentage of convergence time of the TIC3 in the same range is still the largest, but the influence of TIC1 on the convergence time is higher than the percentage of TIC2 in a certain range. On the whole, the convergence performance of TIC0 is worse in both components when not using GIM products or tropospheric products as constraints. The convergence performance is improved as compared to TIC0 after considering TIC1 or (and) TIC2 in GPS SF PPP processing.
At the same time, Table 6 shows that TIC1 performs a notably better than TIC0 in the vertical component and marginally better than TIC0 in the horizontal component. TIC2 performs notably better than TIC0 and TIC1 in the horizontal component, while, in the vertical component, TIC2 is better than TIC0 and worse than TIC1 only in 68% level static mode. TIC3 performs best among the handling schemes. Compared with TIC0, the average convergence time of TIC1 at the 95% level is improved from 27.17 to 26.07 min (4.0%) in horizontal and by from 23.21 to 18.17 min (21.7%) in the vertical components. At the 68% level, the convergence time in the horizontal component reduced by 4.3% from 42.11 to 40.29 min and by 28.8% from 39.34 to 27.98 min in the vertical component. However, in kinematic mode, the average convergence time of TIC1 is not much higher than that of TIC0, with a maximum increase of 11.7% and a minimum increase of 2.1%. TIC2 has a larger boost when compared with TIC0. In static mode, it is increased by 16.6% in the vertical component by 68% level, and the maximum increase is 88.4% in the horizontal component of 95% level; in kinematic mode, they are 2.5% and 73.9%, respectively. TIC3 has the largest boost as compared with the other two methods. In static mode, it reaches 88.8% from 27.17 to 3.04 min and the lowest is 46.5% from 39.34 to 21.05 min In the kinematic mode, the minimum increase is 5.4%, and the maximum increase is 74.5%.
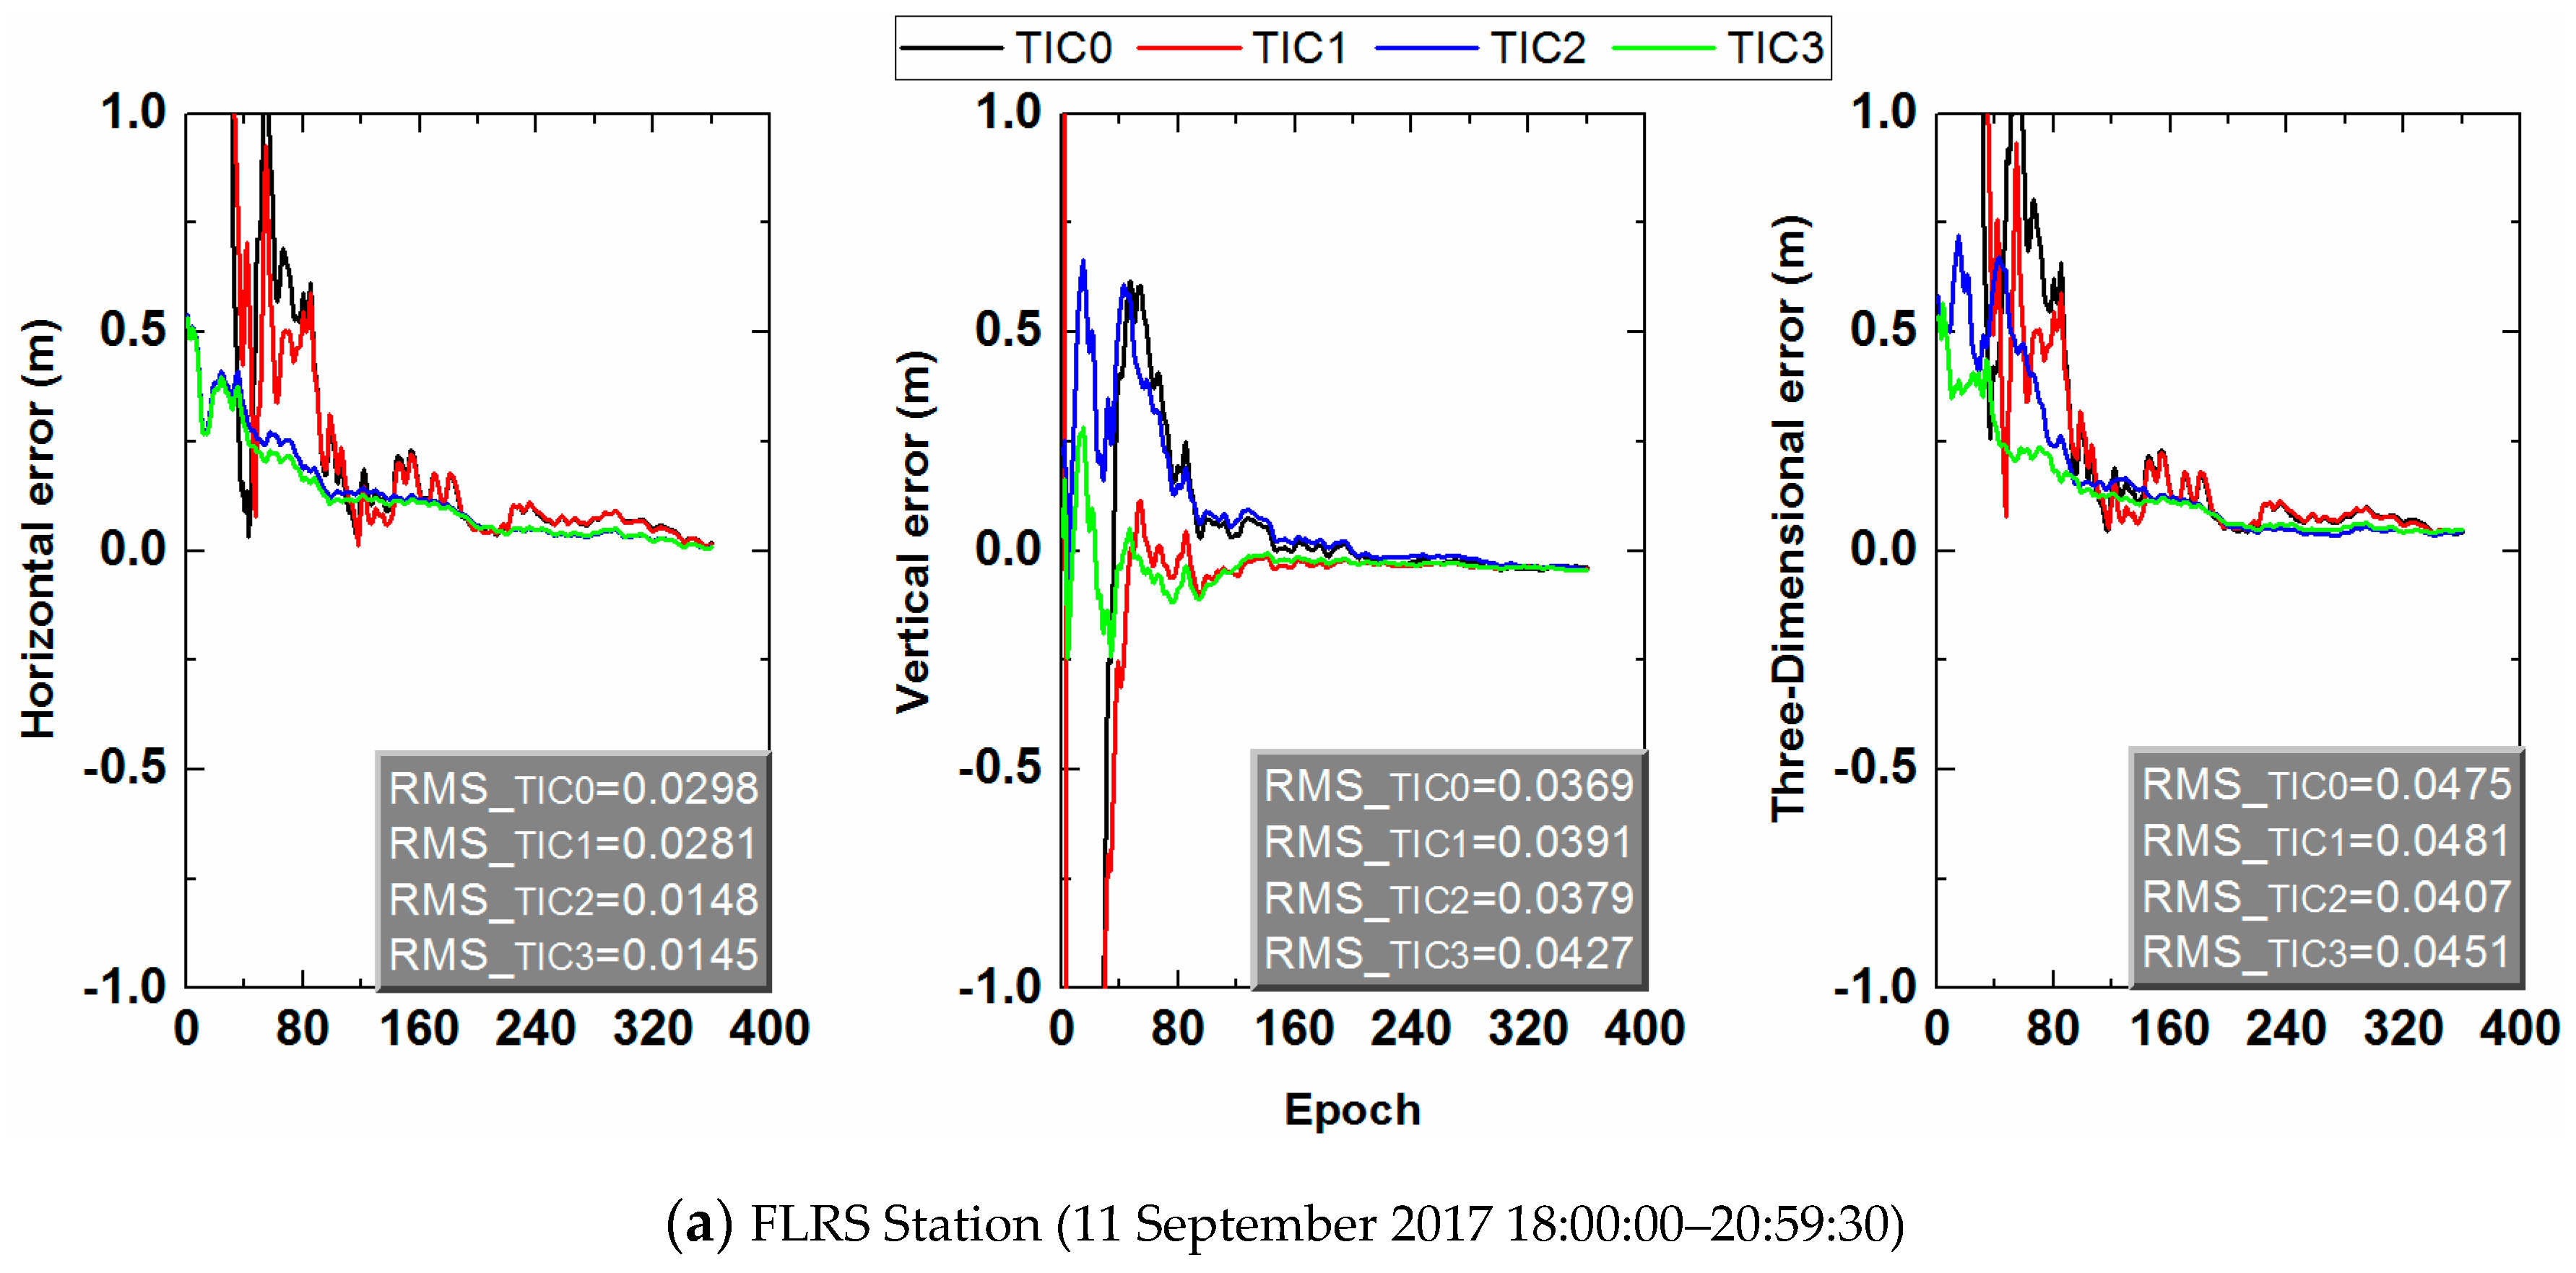
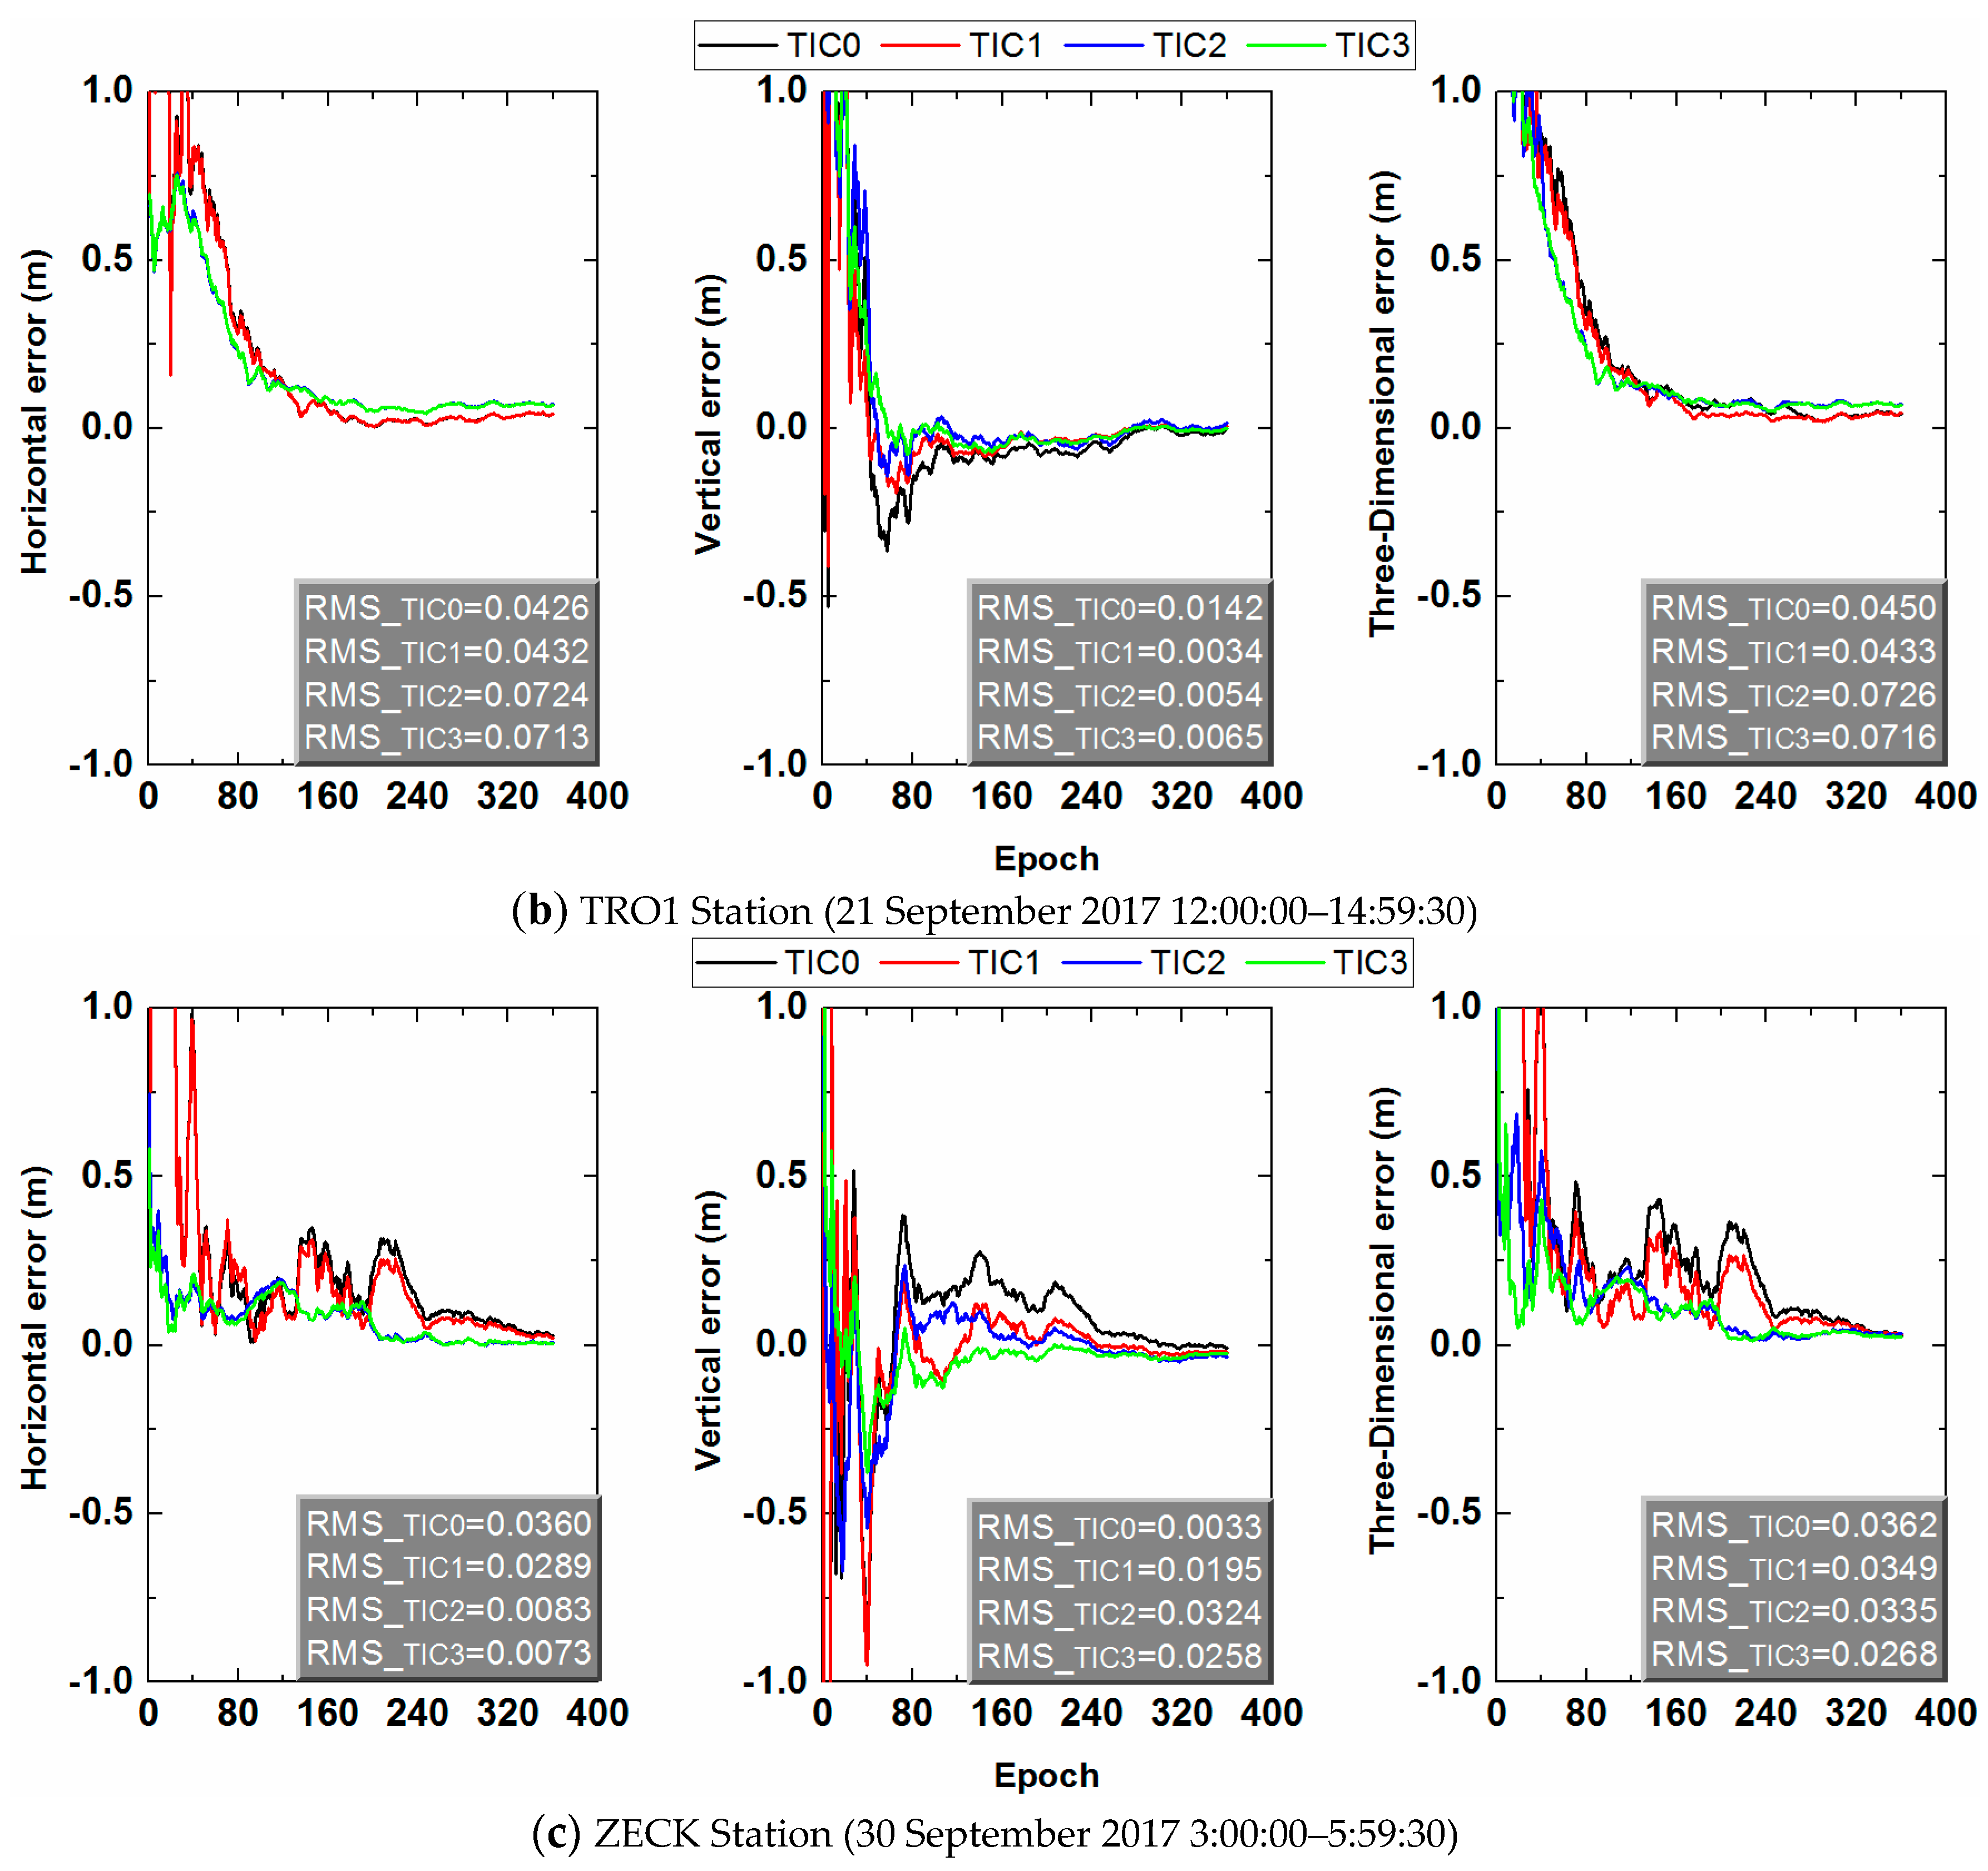
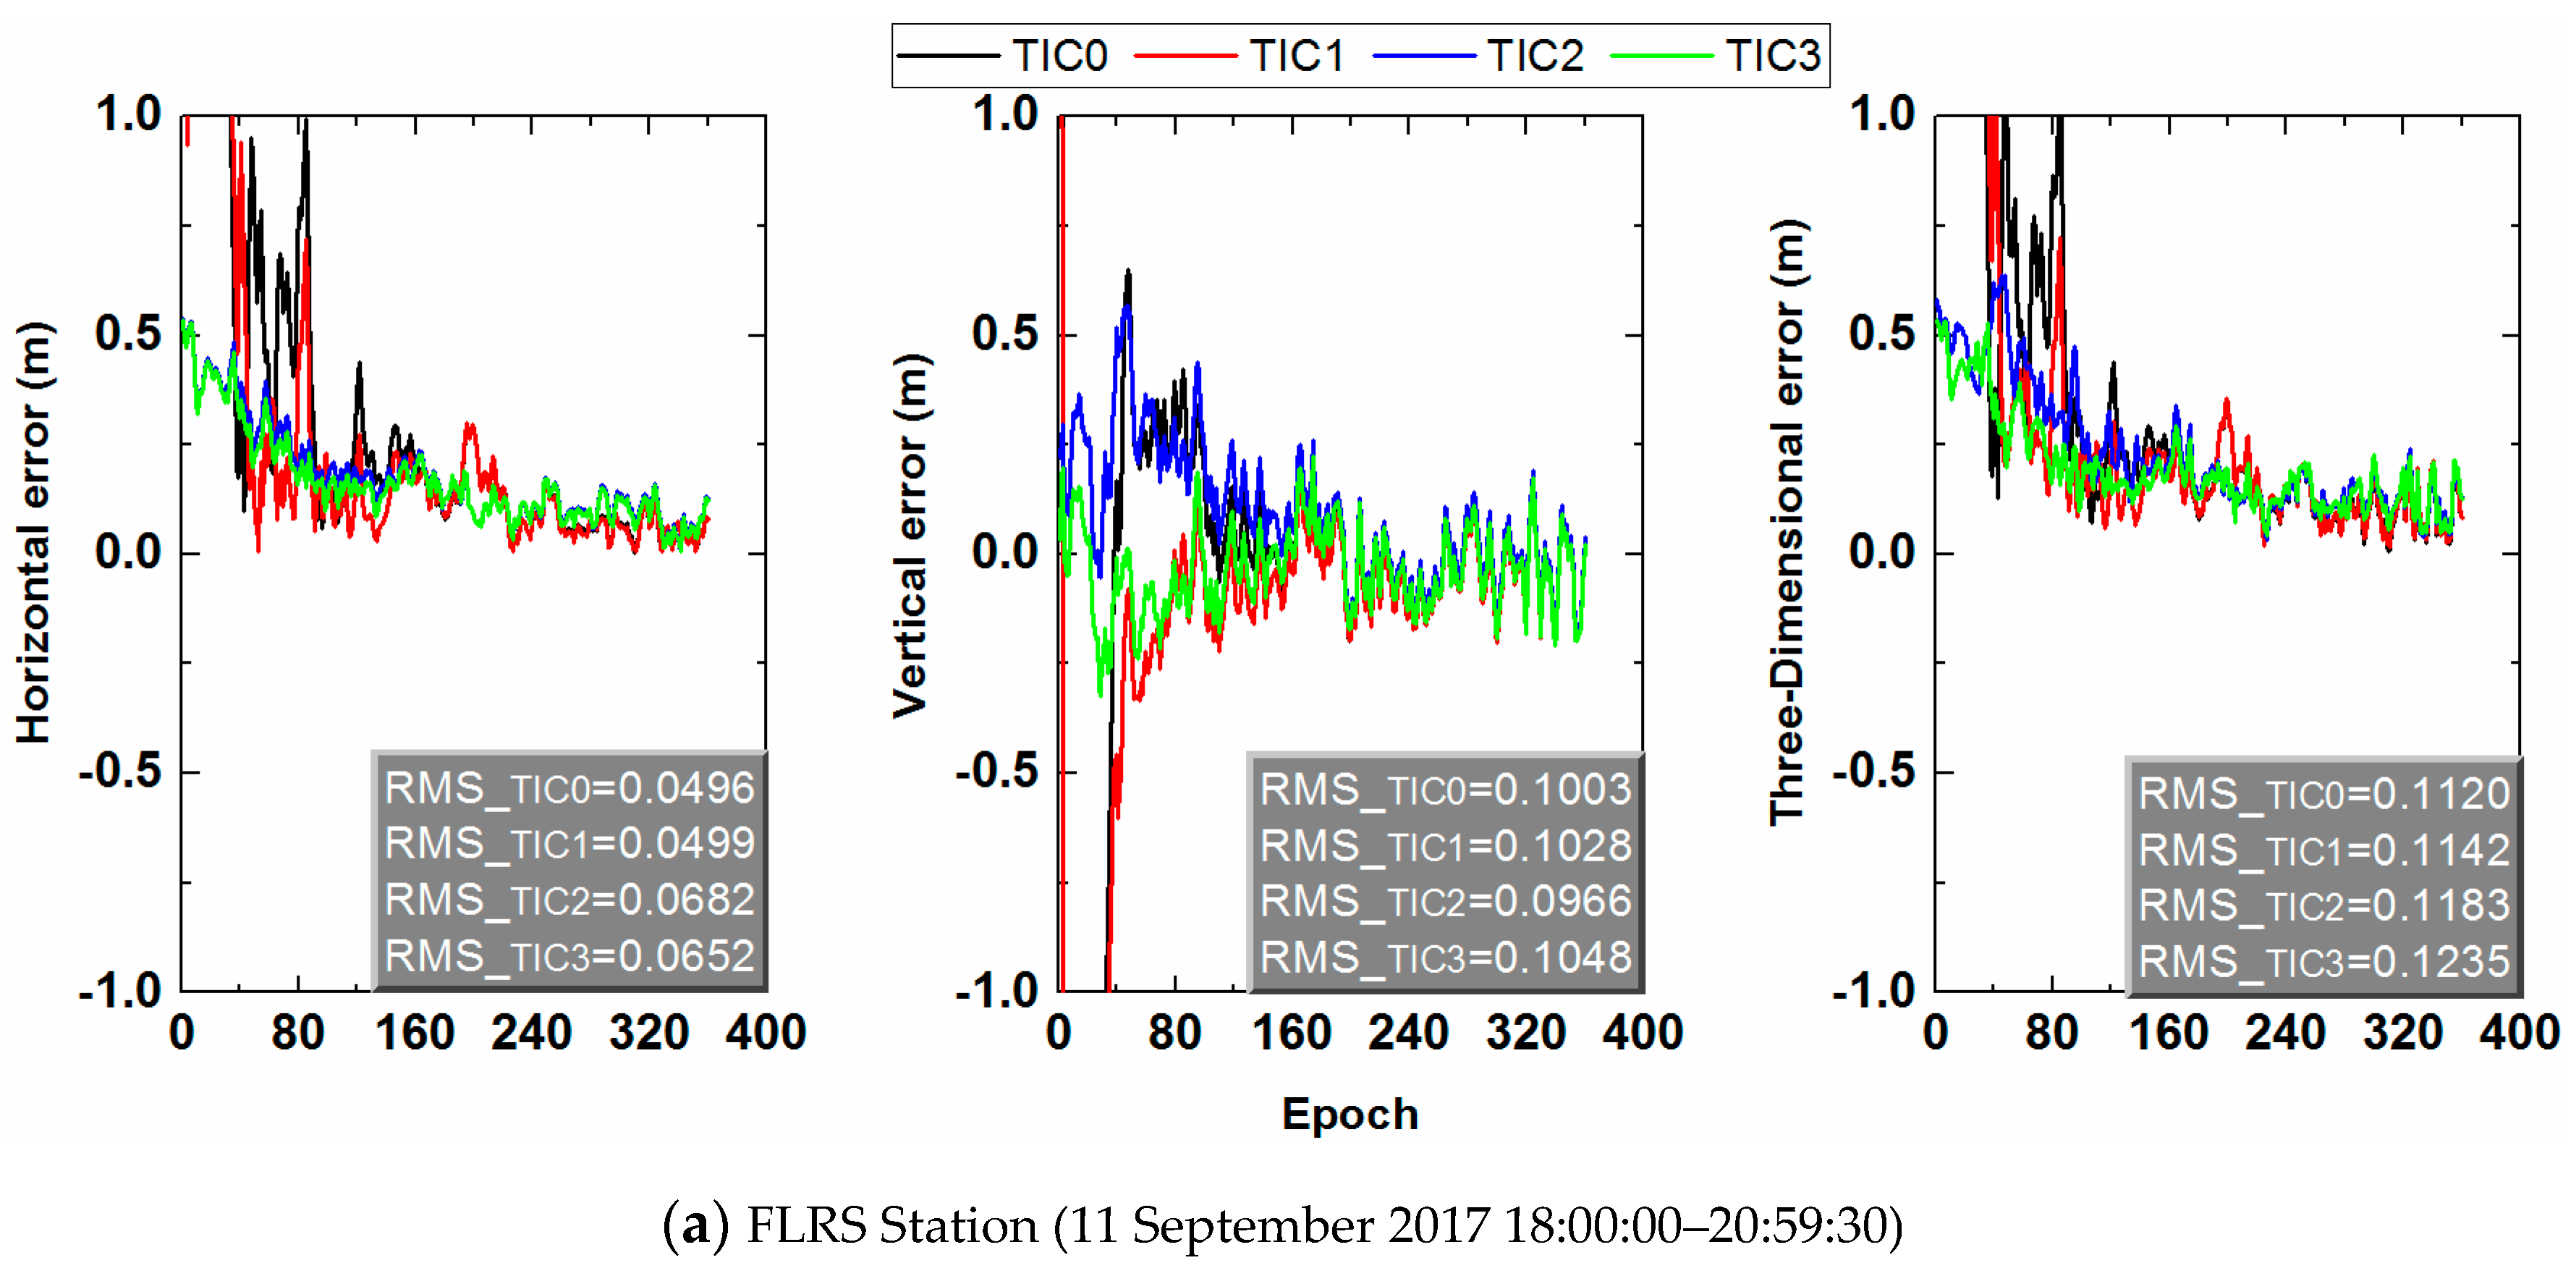
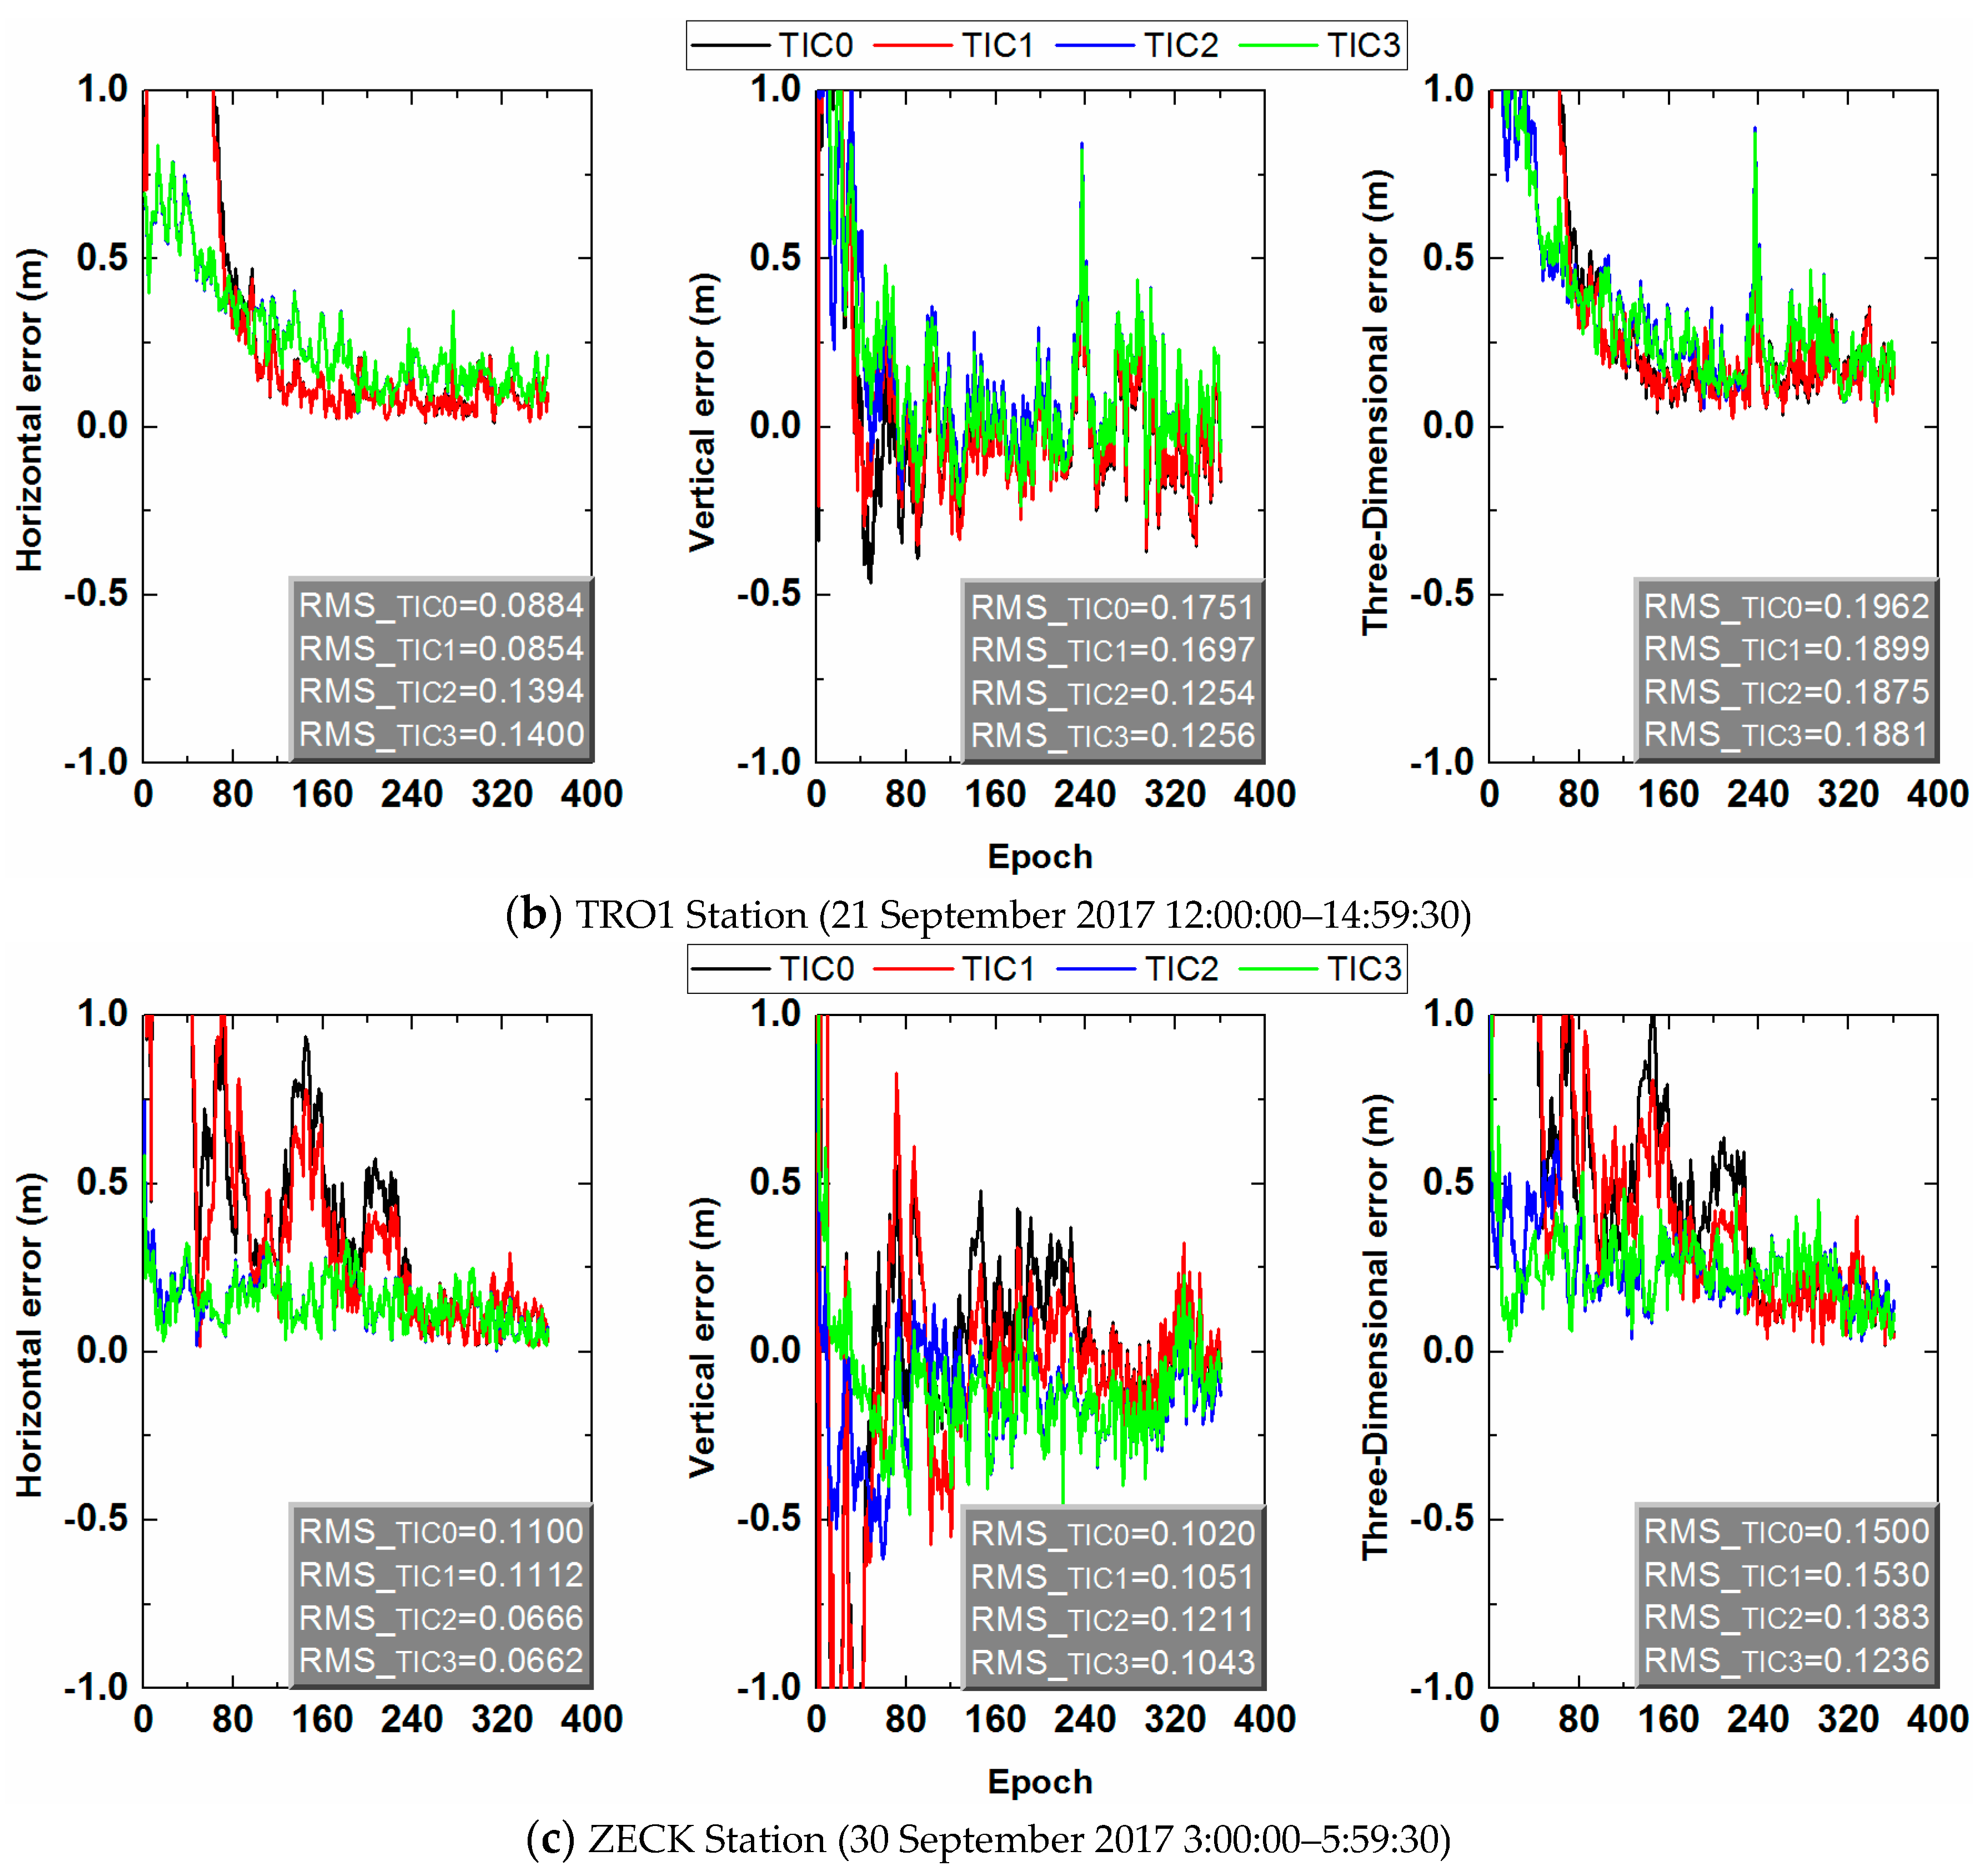
Three stations (FLRS, TRO1, and ZECK station) were randomly selected from 78 IGS stations to measure RMS error in the horizontal component, vertical component, and three-dimensional. It can be seen from Figure 10 and Figure 11 that the final positioning error reaches the sub-decimetre level in the kinematic mode, and it reaches the centimetre level in the static mode. However, the final positioning errors are substantially close in the four schemes.

4. Conclusions

In this study, we discussed the effects of four methods, including NENE, BILI, BICU, and JUNK, for the percentage of convergence time, the average convergence time and the calculation time of single station of SF TIC2 PPP. The numerical results show that: (1) the percentage of the convergence time of the estimated parameters through the BILI method is the shortest in every condition; and, (2) in the static mode, when the RMS is less than 5 cm, only the percentage of the BILI method calculation exceeds 40%. While in the kinematic mode, when the RMS is less than 15 cm, only the BILI method is more than 60% and 40% in the horizontal and vertical component, respectively. Under the other identical thresholds of the RMS, the percentage of the convergence time of the estimated parameters through BILI method is higher than the other three methods; (3) in the static mode, the average convergence time of the estimated parameters through BILI method is reduced by at least 2.2% when compared to the other three methods and the maximum is shortened by 23.6%; while, in the kinematic mode, they are 1.9% and 16.6%, respectively; and, (4) for the average computation time of a station, the BILI method has 0.121 s more than the shortest calculation time in the static mode and 0.038 s in the kinematic mode. Therefore, we chose the BILI method for calculating the TEC at the required time when using the TIC2 or TIC3 calculation based on the GIM grid products.
In order to verify the different constraint methods, a total of 18,720 tests were performed with 78 stations. The experimental results revealed the following findings: (1) the TIC1 convergence time percentage is slightly higher than the TIC0 in each convergence time threshold, while the TIC2 is larger and the TIC3 is the largest. That is to say, the convergence can be accelerated under the constraint conditions; (2) as compared with TIC0 method, the average convergence time of the TIC1 method is shortened by at least 4.0% and, at most, 28.9% in static mode. The TIC2 method has a larger percentage of shortening, at least up to 16.6%, the maximum up to 88.4%. However, in the vertical component, the TIC1 method is larger than the TIC2 method at the 68% level. Compared with TIC0, the TIC3 method is shortened by 46.5% at least and 88.8% at most. Additionally TIC3 method is better than TIC1 method and TIC2 method. In kinematic mode, the percentage of time that is shortened after the constraint is less than in static mode. The average convergence time of the TIC1 method is at least 2.1% shorter than the TIC0 method, and the maximum is shortened by 11.7%. The TIC2 method has a larger percentage of shortening compared to the TIC1 method, with a minimum of 2.5% and a maximum of 73.9%. The TIC3 method is superior to the TIC1 method and the TIC2 method, with a minimum of 5.4% reduction and a maximum reduction of 74.5% as compared to TIC0; and, (3) through comparative analysis, it is concluded that, the final positioning error of TIC0, TIC1, TIC2 and TIC3 methods are basically the same, no method is better. After the above analysis and conclusions, under the constraints of atmospheric error products, convergence can be accelerated, and there is no impact on the final accuracy improvement.

Author Contributions

R.W., J.G., N.Z. and Z.L. conceived and designed the experiments; R.W. and Y.Y. performed the experiments and analyzed the data; L.Z. drew pictures; R.W. and Y.W. wrote the paper; all authors reviewed the paper.

Funding

The research was supported by the Fundamental Research Funds for the Central Universities (grant number: 2018BSCXC25), partially sponsored by Postgraduate Research & Practice Innovation Program of Jiangsu Province (grant number: KYCX18_1952).

Acknowledgments

The authors thank the anonymous reviewer for their valuable comments. Thanks also go to IGS for data and GIM provision. Of course, thanks also to the open-source software GAMP from the team of Feng Zhou of Shandong University of Science and Technology.

Conflicts of Interest

The authors declare no conflict of interest.

References

  1. Zumberge, J.; Heflin, M.; Jefferson, D.; Watkins, M.; Webb, F. Precise point positioning for the efficient and robust analysis of GPS data from large network. J. Geophys. Res. 1997, 102, 5005–5017. [Google Scholar] [CrossRef] [Green Version]
  2. Kouba, J.; Héroux, P. Precise point positioning using IGS orbit and clock products. GPS Solut. 2001, 5, 12–28. [Google Scholar] [CrossRef]
  3. Zhang, X.H.; Andersen, O.B. Surface ice flow velocity and tide retrieval of the Amery ice shelf using precise point positioning. J. Geod. 2006, 80, 171–176. [Google Scholar] [CrossRef]
  4. Choy, S.; Bisnath, S.; Rizos, C. Uncovering common misconceptions in GNSS Precise Point Positioning and its future prospect. GPS Solut. 2017, 21, 13–22. [Google Scholar] [CrossRef]
  5. Bisnath, S.; Gao, Y. Current state of Precise Point Positioning and future prospects and limitations. In Observing Our Changing Earth, Proceedings of the International Association of Geodesy Symposia, Perugia, Italy, 2–13 July 2007; Springer Link: Berlin, Heidelberg, 2009; Volume 133, pp. 615–624. [Google Scholar]
  6. Marques, H.A.; Monico, J.F.G.; Aquino, M. RINEX_HO: Second- and third-order ionospheric corrections for RINEX observation files. GPS Solut. 2011, 15, 305–314. [Google Scholar] [CrossRef]
  7. Banville, S.; Sieradzki, R.; Hoque, M.; Wezka, K.; Hadas, T. On the estimation of higher-order ionospheric effects in precise point positioning. GPS Solut. 2017, 21, 1817–1828. [Google Scholar] [CrossRef]
  8. Odijk, D.; Zhang, B.C.; Khodabandeh, A.; Odolinski, R.; Teunissen, P.J.G. On the estimability of parameters in undifferenced, uncombined GNSS network and PPP-RTK user models by means of S-system theory. J. Geod. 2016, 90, 15–44. [Google Scholar] [CrossRef]
  9. Rovira-Garcia, A.; Juan, J.M.; Sanz, J.; Gonzalez-Casado, G.; Ibanez, D. Accuracy of ionospheric models used in GNSS and SBAS: Methodology and analysis. J. Geod. 2016, 90, 229–240. [Google Scholar] [CrossRef]
  10. Shi, C.; Gu, S.F.; Lou, Y.D.; Ge, M.R. An improved approach to model ionospheric delays for single-frequency precise point positioning. Adv. Space Res. 2012, 49, 1698–1708. [Google Scholar] [CrossRef]
  11. Lou, Y.D.; Zheng, F.; Gu, S.F.; Wang, C.; Guo, H.L.; Feng, Y.M. Multi-GNSS precise point positioning with raw single-frequency and dual-frequency measurement models. GPS Solut. 2016, 20, 849–862. [Google Scholar] [CrossRef]
  12. Abd Rabbou, M.; El-Shazly, A.; Ahmed, K. Comparative analysis of multi-constellation GNSS single-frequency precise point positioning. Surv. Rev. 2018, 50, 373–382. [Google Scholar] [CrossRef]
  13. Choy, S.; Silcock, D. Single frequency ionosphere-free precise point positioning: A cross-correlation problem? J. Geod. Sci. 2011, 1, 314–323. [Google Scholar] [CrossRef]
  14. Heroux, P.; Gao, Y.; Kouba, J.; Lahaye, F.; Mireault, Y.; Collins, P.; Macleod, K.; Tetreault, P.; Chen, K. Products and applications for precise point positioning-Moving towards real-time. In Proceedings of the ION GNSS 2004, Long Beach, CA, USA, 21–24 September 2004. [Google Scholar]
  15. Hernandez-Pajares, M.; Juan, J.M.; Sanz, J.; Orus, R.; Garcia-Rigo, A.; Feltens, J.; Komjathy, A.; Schaer, S.C.; Krankowski, A. The IGS VTEC maps: A reliable source of ionospheric information since 1998. J. Geod. 2009, 83, 263–275. [Google Scholar] [CrossRef]
  16. Liu, A.; Wang, N.B.; Li, Z.S.; Zhou, K.; Yuan, H. Validation of CAS’s final global ionospheric maps during different geomagnetic activities from 2015 to 2017. Results Phys. 2018, 10, 481–486. [Google Scholar] [CrossRef]
  17. Brunini, C.; Van Zele, M.A.; Meza, A.; Gende, M. Quiet and perturbed ionospheric representation according to the electron content from GPS signals. J. Geophys. Res. Space Phys. 2003, 108, 1056. [Google Scholar] [CrossRef] [Green Version]
  18. Bakry El-Arini, M.; Conker, R.S.; Albertson, T.W.; Reagan, J.K.; Klobuchar, J.A.; Doherty, P.H. Comparison of real-time ionospheric algorithms for a GPS Wide-Area Augmentation System (WAAS). Navigation 1994, 41, 393–414. [Google Scholar] [CrossRef]
  19. Chao, Y. Real Time Implementation of the Wide Area Augmentation System for the Global Positioning System with an Emphasis on Ionospheric Modeling. Ph.D. Thesis, Stanford University, Stanford, CA, USA, 1997. [Google Scholar]
  20. Orus, R.; Hernandez-Pajares, M.; Juan, J.M.; Sanz, J. Improvement of global ionospheric VTEC maps by using kriging interpolation technique. J. Atmos. Sol. Terres. Phys. 2005, 67, 1598–1609. [Google Scholar] [CrossRef]
  21. Lanyi, G.E.; Roth, T. A comparison of mapped and measured total ionospheric electron content using Global Positioning System and beacon satellite observations. Radio Sci. 1988, 23, 483–492. [Google Scholar] [CrossRef]
  22. Arikan, F.; Nayir, H.; Sezen, U.; Arikan, O. Estimation of single station interfrequency receiver bias using GPS-TEC. Radio Sci. 2008, 43, RS4004. [Google Scholar] [CrossRef]
  23. Lu, W.J.; Ma, G.Y.; Wang, X.L.; Wan, Q.T.; Li, J.H. Evaluation of ionospheric height assumption for single station GPS-TEC derivation. Adv. Space Res. 2017, 60, 286–294. [Google Scholar] [CrossRef]
  24. Kao, S.; Tu, Y.; Chen, W.; Weng, D.J.; Ji, S.Y. Factors affecting the estimation of GPS receiver instrumental bias. Surv. Rev. 2013, 44, 59–67. [Google Scholar] [CrossRef]
  25. Chen, J.; Huang, L.K.; Liu, L.L.; Wu, P.T.; Qin, X.Y. Applicability analysis of VTEC derived from the sophisticated Klobuchar model in China. ISPRS Int. J. Geo. Inf. 2017, 6, 75. [Google Scholar] [CrossRef] [Green Version]
  26. Liu, X.F.; Yuan, Y.B.; Tan, B.F.; Li, M. Observational analysis of variation characteristics of GPS-based TEC fluctuation over China. ISPRS Int. J. Geo. Inf. 2016, 5, 237. [Google Scholar] [CrossRef] [Green Version]
  27. Niell, A.E. Global mapping functions for the atmosphere delay at radio wavelengths. J. Geophys. Res. 1996, 101, 3227–3246. [Google Scholar] [CrossRef]
  28. Boehm, J.; Moller, G.; Schindelegger, M.; Pain, G.; Weber, R. Development of an improved empirical model for slant delays in the troposphere (GPT2w). GPS Solut. 2006, 19, 433–441. [Google Scholar] [CrossRef] [Green Version]
  29. Niell, A.E. Preliminary evaluation of atmospheric mapping functions based on numerical weather models. Phys. Chem. Earth 2001, 26, 475–480. [Google Scholar] [CrossRef]
  30. Huang, L.K.; Xie, S.F.; Liu, L.L.; Li, J.Y.; Chen, J.; Kang, C.L. SSIEGNOS: A new Asian single site tropospheric correction model. ISPRS Int. J. Geo. Inf. 2017, 6, 20. [Google Scholar] [CrossRef] [Green Version]
  31. Zhang, L.; Yao, Y.B.; Peng, W.J.; Shan, L.L.; He, Y.L.; Kong, J. Real-time global ionospheric map and its application in single-frequency positioning. Sensors 2019, 19, 1138. [Google Scholar] [CrossRef] [Green Version]
  32. Aggrey, J.; Bisnath, S. Improving GNSS PPP convergence: The case of atmospheric-constrained, multi-GNSS PPP-AR. Sensors 2019, 19, 587. [Google Scholar] [CrossRef] [Green Version]
  33. Gao, Z.Z.; Shen, W.B.; Zhang, H.P.; Niu, X.J.; Ge, M.R. Real-time kinematic positioning of INS tightly aided multi-GNSS ionospheric constrained PPP. Sci. Rep. 2016, 6, 30488. [Google Scholar] [CrossRef] [Green Version]
  34. Zhou, F.; Dong, D.N.; Ge, M.R.; Li, P.; Wickert, J.; Schuh, H. Simultaneous estimation of GLONASS pseudorange inter-frequency biases in precise point positioning using undifferenced and uncombined observations. GPS Solut. 2018, 22, 19. [Google Scholar] [CrossRef]
  35. Zhou, F.; Dong, D.N.; Li, W.W.; Jiang, X.Y.; Wickert, J.; Schuh, H. GAMP: An open-source software of multi-GNSS precise point positioning using undifferenced and uncombined observations. GPS Solut. 2018, 22, 33. [Google Scholar] [CrossRef]
  36. Jayapal, V.; Zain, A.F.M. Interpolation and extrapolation techniques based neural network in estimating the missing ionospheric TEC data. In Proceedings of the Progress in Electromagnetic Research Symposium (PIERS), Shanghai, China, 9–11 August 2016; pp. 695–699. [Google Scholar]
  37. Pang, Z.; Tan, H.; Chen, D. An Improved Low-cost Adaptive Bicubic Interpolation Arithmetic and VLSI Implementation. Acta Autom. Sin. 2013, 39, 407–417. [Google Scholar] [CrossRef]
  38. Keys, R.G. Cubic convolution interpolation for digital image processing. IEEE Trans. Acoust. Speech Signal Process. 1981, 29, 1153–1160. [Google Scholar] [CrossRef] [Green Version]
  39. Dach, R.; Hugentobler, U.; Fridez, P.; Meindl, M. Bernese GPS Software Version 5.0; Astronomical Institute, University of Bern: Bern, Switzerland, 2007. [Google Scholar]
  40. Yun, D.H.; Kee, C. Single-frequency differential GPS accuracy improvement via local area ionospheric time delay model development. Telecommun. Rev. 1999, 9, 33–49. [Google Scholar]
  41. Lwano, S.; Fukuda, Y.; Sato, T.; Tamura, Y.; Matsumoto, K.; Shibuya, K. Long-period tidal factors at Antarctica Syowa Station determined from 10 years of superconducting gravimeter data. J. Geophys. Res. Solid Earth 2005, 110, B10403. [Google Scholar]
  42. Bidikar, B.; Rao, G.S.; Ganesh, L. Sagnac effect and SET error based pseudorange modeling for GPS applications. In Proceedings of the Fourth International Conference on Recent Trends in Computer Science & Engineering (ICRTCSE 2016), Chennai, India, 29–30 April 2016; Volume 87, pp. 172–177. [Google Scholar]
  43. Han, C.H.; Cai, Z.W. Relativistic effects to the onboard BeiDou satellite clocks. Navig. J. Inst. Navig. 2019, 66, 49–53. [Google Scholar] [CrossRef] [Green Version]
  44. Cai, C.S.; Gong, Y.Z.; Gao, Y.; Kuang, C.L. An approach to speed up single-frequency PPP convergence with quad-constellation GNSS and GIM. Sensors 2017, 17, 1302. [Google Scholar] [CrossRef] [Green Version]
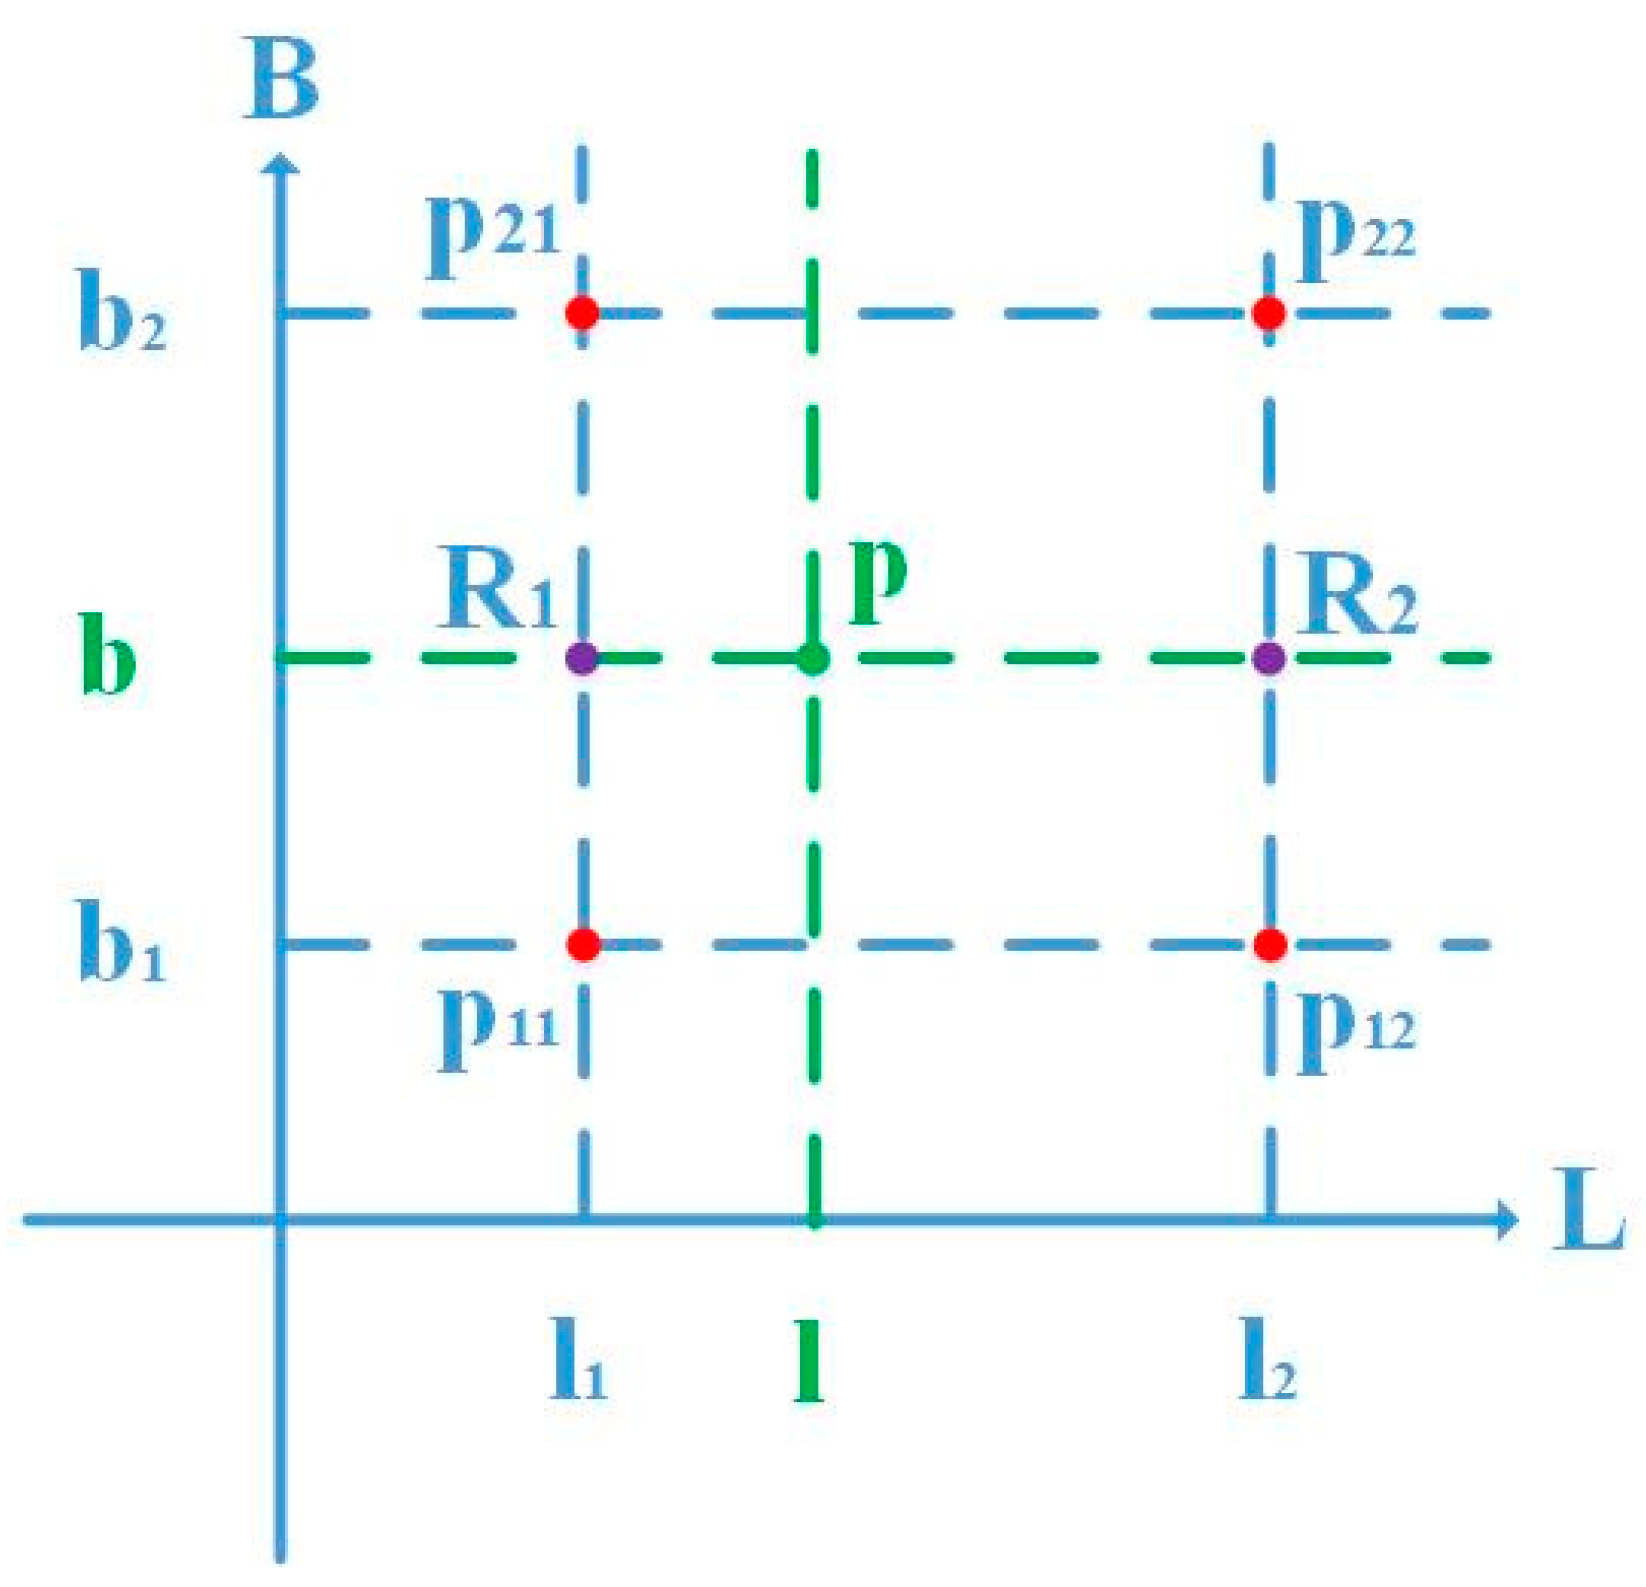
Figure 1. Schematic illustrating Junkins weighted interpolation.
Applsci 09 05407 g001
Figure 2. Schematic illustrating Bicubic interpolation.
Applsci 09 05407 g002
Figure 3. Geographical distribution of the selected 78 global IGS tracking stations.
Applsci 09 05407 g003
Figure 4. The flowchart of our study procedure.
Applsci 09 05407 g004
Figure 5. The percentage of Global Positioning System (GPS) SF PPP convergence time in different interpolation schemes in the static mode (horizontal component (left panel) and vertical component (right panel)).
Applsci 09 05407 g005
Figure 6. The percentage of GPS SF PPP convergence time in different interpolation schemes in the kinematic mode (horizontal component (left panel) and vertical component (right panel)).
Applsci 09 05407 g006
Figure 7. The percentage of GPS SF PPP root mean square (RMS) in different ranges in the static and kinematic mode.
Applsci 09 05407 g007
Figure 8. The percentage of GPS static SF PPP convergence performance in different constrain schemes (horizontal component (left panel) and vertical component (right panel)).
Applsci 09 05407 g008
Figure 9. The percentage of GPS kinematic SF PPP convergence performance in different constrain schemes (horizontal component (left panel) and vertical component (right panel)).
Applsci 09 05407 g009
Figure 10. (a) FLRS station, (b) TRO1 station, and (c) ZECK station SF PPP coordinate deviation RMS statistics in static mode.
Applsci 09 05407 g010aApplsci 09 05407 g010b
Figure 11. (a) FLRS station, (b) TRO1 station and (c) ZECK station SF PPP coordinate deviation RMS statistics in kinematic mode.
Applsci 09 05407 g011aApplsci 09 05407 g011b
Table 1. Models and strategies used in single-frequency Precise Point Positioning (SF PPP).
Item.Models/Strategies
ConstellationGPS
Data span1–30 Sep 2017
ObservationsGPS raw code and phase observations
Frequency selectionL1
Sampling rate30 s
Satellite cut-off elevation
Positioning modeStatic/kinematic (simulated kinematic)
EstimatorKalman filter
Satellite orbit and clockFinal by IGS orbit and clock products
Weighing strategyA priori precision of 0.003 and 0.3 m for raw phase and code [35]
Satellite DCBCorrect using CODE Differential Code Bias (DCB) products
Ionospheric delayKlobuchar model [39] (priori) or GIM products from IGS (constrains)
Ionospheric noiseRandom walk [10]
Tropospheric delaySaastamoinen model [40] (priori) or products from IGS (constrains)
Tide displacementSolid Earth, pole and ocean tide were corrected [41]
Sagnac effectCorrected model [42]
Relativistic effectCorrected model [43]
Satellite and receiver antennaPhase Center Offset (PCO) and Variations (PCVs) values from igs14.atx
Reference coordinatesIGS SINEX files
Phase ambiguitiesFloat values
Table 2. The four interpolation schemes.
AbbreviationItemAbbreviationItem
NENENearest-neighbor extrapolationBILIBilinear interpolation
BICUBicubic interpolationJUNKJunkins weighted interpolation
Table 3. Average convergence time of GPS static and kinematic SF PPP in different interpolation schemes.
SchemeStatic SF PPP (min)Kinematic SF PPP (min)
H(95%)H(68%)V(95%)V(68%)H(95%)H(68%)V(95%)V(68%)
NENE3.2115.1017.2040.6018.4577.3478.46134.10
BILI3.1414.4015.1832.8116.1073.0068.95131.50
JUNK3.8717.5519.4442.9219.0078.3079.44134.60
BICU3.4215.7017.6841.3019.3078.3079.01134.30
Table 4. Calculation time of FLRS station in SF PPP in different interpolation schemes.
Interpolation MethodStatic (sec)Kinematic (sec)
NENE6.9056.821
BILI6.5506.512
BICU6.7756.797
JUNK6.4296.474
Table 5. The four constraint schemes.
AbbreviationItem
TIC0Standard single-frequency PPP model
TIC1Troposphere-constrained single-frequency PPP model
TIC2Ionosphere-constrained single-frequency PPP model
TIC3Troposphere- and ionosphere-constrained single-frequency PPP model
Table 6. Average convergence time of GPS static and kinematic SF PPP in different constrained schemes.
SchemeStatic SF PPP (min)Kinematic SF PPP (min)
H(95%)H(68%)V(95%)V(68%)H(95%)H(68%)V(95%)V(68%)
TIC027.1742.1123.2139.3461.63103.0781.84134.81
TIC126.0740.2918.1727.9858.99100.9072.28131.58
TIC23.1514.3915.1832.8216.0673.2969.01131.40
TIC33.0414.089.5721.0515.7071.5357.41127.59