Article

Ecological Suitability Evaluation for Conservation and Development in Bac Kan Province, Vietnam

1
School of Geoinformatics, Institute of Science, Suranaree University of Technology, Nakhon Ratchasima 30000, Thailand
2
Institute of Geography, Vietnam Academy of Science and Technology, 18 Hoang Quoc Viet, Hanoi 100000, Vietnam
*
Author to whom correspondence should be addressed.
Appl. Sci. 2019, 9(24), 5351; https://doi.org/10.3390/app9245351
Submission received: 14 October 2019 / Revised: 23 November 2019 / Accepted: 5 December 2019 / Published: 7 December 2019
(This article belongs to the Special Issue Sustainable Use of Natural Resources)

Abstract

:
Ecological suitability assessment is an effective approach to identify and locate the most suitable territories for future development in order to reduce the negative impacts of human activities on the ecosystem for ensuring sustainable development. The study aimed to propose a future direction for sustainable use of natural resources at the district level in Bac Kan province based on the ecological suitability evaluation approach and the trade-off technique. This study firstly applied the Delphi method to identify significant ecological resistance indicators for assessing ecological elements, importance, and resilience, which characterize the resistance of ecological structures, ecological functions, and ecological dynamics to construction and development, respectively. Then, an integrated ecological resistance model was applied to classify ecological suitability for construction and development. Moreover, spatial analysis and trade-off technique were applied to assign a development zone and propose future directions at provincial and district levels in Bac Kan province. The results revealed that the most dominant ecological suitability class for construction and development is the moderately suitable class, and it accounts for about 1948 km2 or 40.30% of the total area. In addition, five development zones were assigned at the provincial level, whereas three future directions for sustainable use of natural resources were proposed at the district level. In a nutshell, the research methodology framework in this study can be used as a guideline to land managers and planners for ecological suitability assessment in Vietnam.

1. Introduction

Sustainable development is currently one of the most critical tasks in many countries. However, sustainable development in Vietnam faces many obstacles due to the difficulty of socio-economic conditions and policies as well as the limitation of qualified managers and lack of awareness from local people [1]. In addition, the pressure of population growth and the exploitation of natural resources for socio-economic development towards industrialization and modernization also affect the sustainable development goal [2].
Vietnam was one of the top nations for gross tree cover loss at the beginning of the 21st century [3]. According to a report of the Food and Agriculture Organization of the United Nations in 2005, Vietnam has the second highest rate of deforestation of primary forests [4]. Although reforestation/afforestation has increased in Vietnam, deforestation and forest degradation continue [5]. Many areas after deforestation have been converted to construction sites and agriculture land for perennial trees or food crops [6,7]. These activities mostly do not take into account the suitability with natural conditions and the ecosystem. Consequently, these economic development activities have considerably increased environmental pressures and decreased natural resources [8,9]. In addition, natural disasters frequently occur more and cause more serious consequences such as soil erosion, landslide, flash floods, etc. Many studies indicate that natural disasters in developing countries cause more human losses than in developed countries [10,11,12]. In general, natural resource utilization and development activities have been threats to ecological security and human society [10,13]. Thus, it is necessary to study the ecological suitability for economic development and conservation in order to provide directions for rational planning in accordance with natural resource conditions and to minimize the negative impacts of development activities. Peng et al. [14] stated that minimizing the ecological impact of land development is an important principle of sustainable development.
Currently, ecological suitability evaluation, which is an effective approach to identify and locate the most suitable territories for future development, has been focused on by many researchers [15]. This approach identifies the location of suitable areas for development, particularly construction and also builds the suitability hierarchy based on the planning principles and quantitative evaluations of factors influencing construction [16,17]. Ecological suitability evaluation for economic development was successfully conducted in different countries such as China [18,19,20,21,22,23], Greece [24], Indonesia [25], Kosovo [26], United States [27], and Vietnam [28]. These studies showed that ecological suitability evaluation is important for optimizing spatial patterns of territorial development. Additionally, it is a key to realizing sustainability [14], and it is particularly crucial and urgent for urban planning and the proper utilization of natural resources [29].
In addition, zoning, which is a process of dividing a municipality into zones in which land uses are prohibited or permitted [30], is the most important method of land use regulation taken on by local governments [31]. Zoning is an instructive and reasonable approach to arrange and guide the land use for regional sustainable development. Liu, Liu, and Peng [13] stated that zoning can significantly solve the conflict between regional development and environmental protection and therefore forms a safe ecological pattern. Consequently, zoning regulation and ordinances are frequently used as the instrument of land use control [32], and planners can also apply zoning ordinance and regulation to achieve sustainable development [33].
Bac Kan province was chosen as a case study to balance land utilization for economic development and conservation. Bac Kan is a mountainous province located in the hinterland of the northeastern part of Vietnam, but it has a significant position in terms of economic and national security, particularly tourism and mineral resources. In addition, it has been developed by the industrialization and urbanization process [34]. However, there are more and more houses that have been illegally constructed in unsuitable areas due to urbanization and tourism activities [35,36,37]. At the same time, environmental problems (water pollution) and natural disasters (landslide and land degradation) have been dramatically increasing in the last decade, and they threaten the health and property of citizens [38]. These issues had been mentioned by many researchers. Ha [39] stated that if a landslide occurred over an area of 1000 m2 in Bac Kan’s capital city, there might be a risk of life loss of 1.7 persons and asset loss would be approximately 65,000 USD per household. Additionally, BKPC [40] and Vu [41] reported about land degradation due to soil erosion and landslide on the steep hills and mountains. Giang [38], Ha [42], and Them [43] also mentioned about water pollution in the area. To some extent, these studies do not provide any suggestions on how to mitigate these existing problems, although the provincial authorities are increasingly becoming aware of these problems. Therefore, the sustainable use of natural resources for development and conservation in Bac Kan is very important and challenging.
The ultimate goal of this study is to provide the direction for sustainable use of natural resources in Bac Kan province by applying the ecological suitability evaluation approach with the trade-off technique. The specific objectives of the study are (1) to identify significant indicators of ecological resistance for construction and development, (2) to evaluate ecological suitability for construction and development, and (3) to define the development zone at the provincial level and to propose the future direction for sustainable use of natural resources at the district level in Bac Kan province. The result of this study provides important information to support decision-makers, policymakers, and land use planners for sustainable use of natural resources.

2. Materials and Methods

2.1. Study Area

The study area is Bac Kan province, Vietnam. It is situated in the northeastern part of the country and lies between 21°48′N to 22°44′N and 105°26′E to 106°15′E. It covers an area of 4859.4 km2, and its elevation varies between 30 and 1600 m above mean sea level (Figure 1). Nature gives the Bac Kan province numerous mountains, rivers, and lakes that are very scenic and have become well-known sights, such as Ba Be Lake, Puong Cave, Dau Dang Waterfall. In addition, it is a center of plentiful primitive forest resources with the fullness of flora and fauna. In 2011, Ba Be National Park located inside Bac Kan had Ramsar site recognized as No. 1938 in the world [44]. In addition, it is known as a center of mineral resources (lead, zinc, iron, and gold) formed by different geological processes and activities from the Cambrian era through the Quaternary period [45]. Moreover, with seven ethnic groups living together, Bac Kan has a vibrant and diverse culture with a variety of unique customs and habits. The integration of natural resources and social characteristics has formed a richness in the mixture of the Bac Kan landscape.

2.2. Research Methodology

The research methodology workflow (input, process, and output) consisted of 3 components: (1) identification of significant ecological resistance indicators for construction and development, (2) ecological suitability evaluation for construction and development, and (3) development zonation and direction for sustainable use of natural resources (Figure 2). Details of each component are described in the following sections.

2.2.1. Identification of Significant Ecological Resistance Indicators for Construction and Development

Under this component, the significant indicators include ecological elements, importance, and resilience that describe the ecological resistance to construction and development in mountainous areas, as suggested by Peng, Ma, Du, Zhang, and Hu [14], were investigated using the Delphi method. In general, the Delphi method is a method in which the intuitive idea of the participant was used based on a structural survey [46]. This method is an iterative process that is designed to achieve a consensus among a group of experts on a specific issue, and it is one of the most effective means for participants (experts) to identify criteria or indicators. Barzekar et al. [47] claimed that the Delphi method is an excellent way to generate a consensus of experts’ opinions when solid scientific data are unavailable. It carries quantitative and qualitative results and has underneath its explorative, predictive, even normative elements [48].
To implement the Delphi method, a variety of indicators that represent ecological elements, importance, and resilience under three criteria (ecological structural, functional, and dynamics resistance) for construction and development in mountainous areas was first reviewed from a wide range of sources, particularly research papers (Table 1) and a questionnaire was then prepared for expert interviewing. In this study, 10 experts from the Institute of Geography, Vietnam Academy of Science and Technology, University of Science, Vietnam National University, and Thai Nguyen University of Education were invited to participate in identifying indicators. The selected experts are experienced in different fields of their areas of interest. Dalkey and Helmer [49] mentioned that a Delphi group possesses the largest confidence when the number of experts is at least 10.
In practice, the prepared first-round questionnaire was sent to all experts for ecological resistance indicators identification and weighting. Each expert was asked to indicate a degree (scale of 1 to 5) to which they agree with indicators as follows:
  • Indicator is highly irrelevant to the selected criteria,
  • Indicator is likely irrelevant to the selected criteria,
  • Indicator is more or less relevant to the selected criteria,
  • Indicator is likely relevant to the selected criteria, and
  • Indicator is highly relevant to the selected criteria.
After receiving the first-round response, the information was summarized, collated, categorized, and tabulated into the second questionnaire for the second round. Then, the second questionnaire that incorporated a feedback report was redistributed to experts. They were asked again to give their ratings. The goal of the second round is to attain stability or consensus of experts’ responses. The Delphi procedure is completed when the consensus or stability is reached. The Delphi method finishes when all questionnaire items are either accepted or rejected or over 75% of the questionnaire items have their rating variant values being less than 15% [61]. The rules for conducting the Delphi method are given in Table 2.
Where, rating mean (qi) represents the mean of the ratings for questionnaire item qi, rating variant (qi) represents the ratio of experts who change their ratings for qi, and Q is the quartile range.

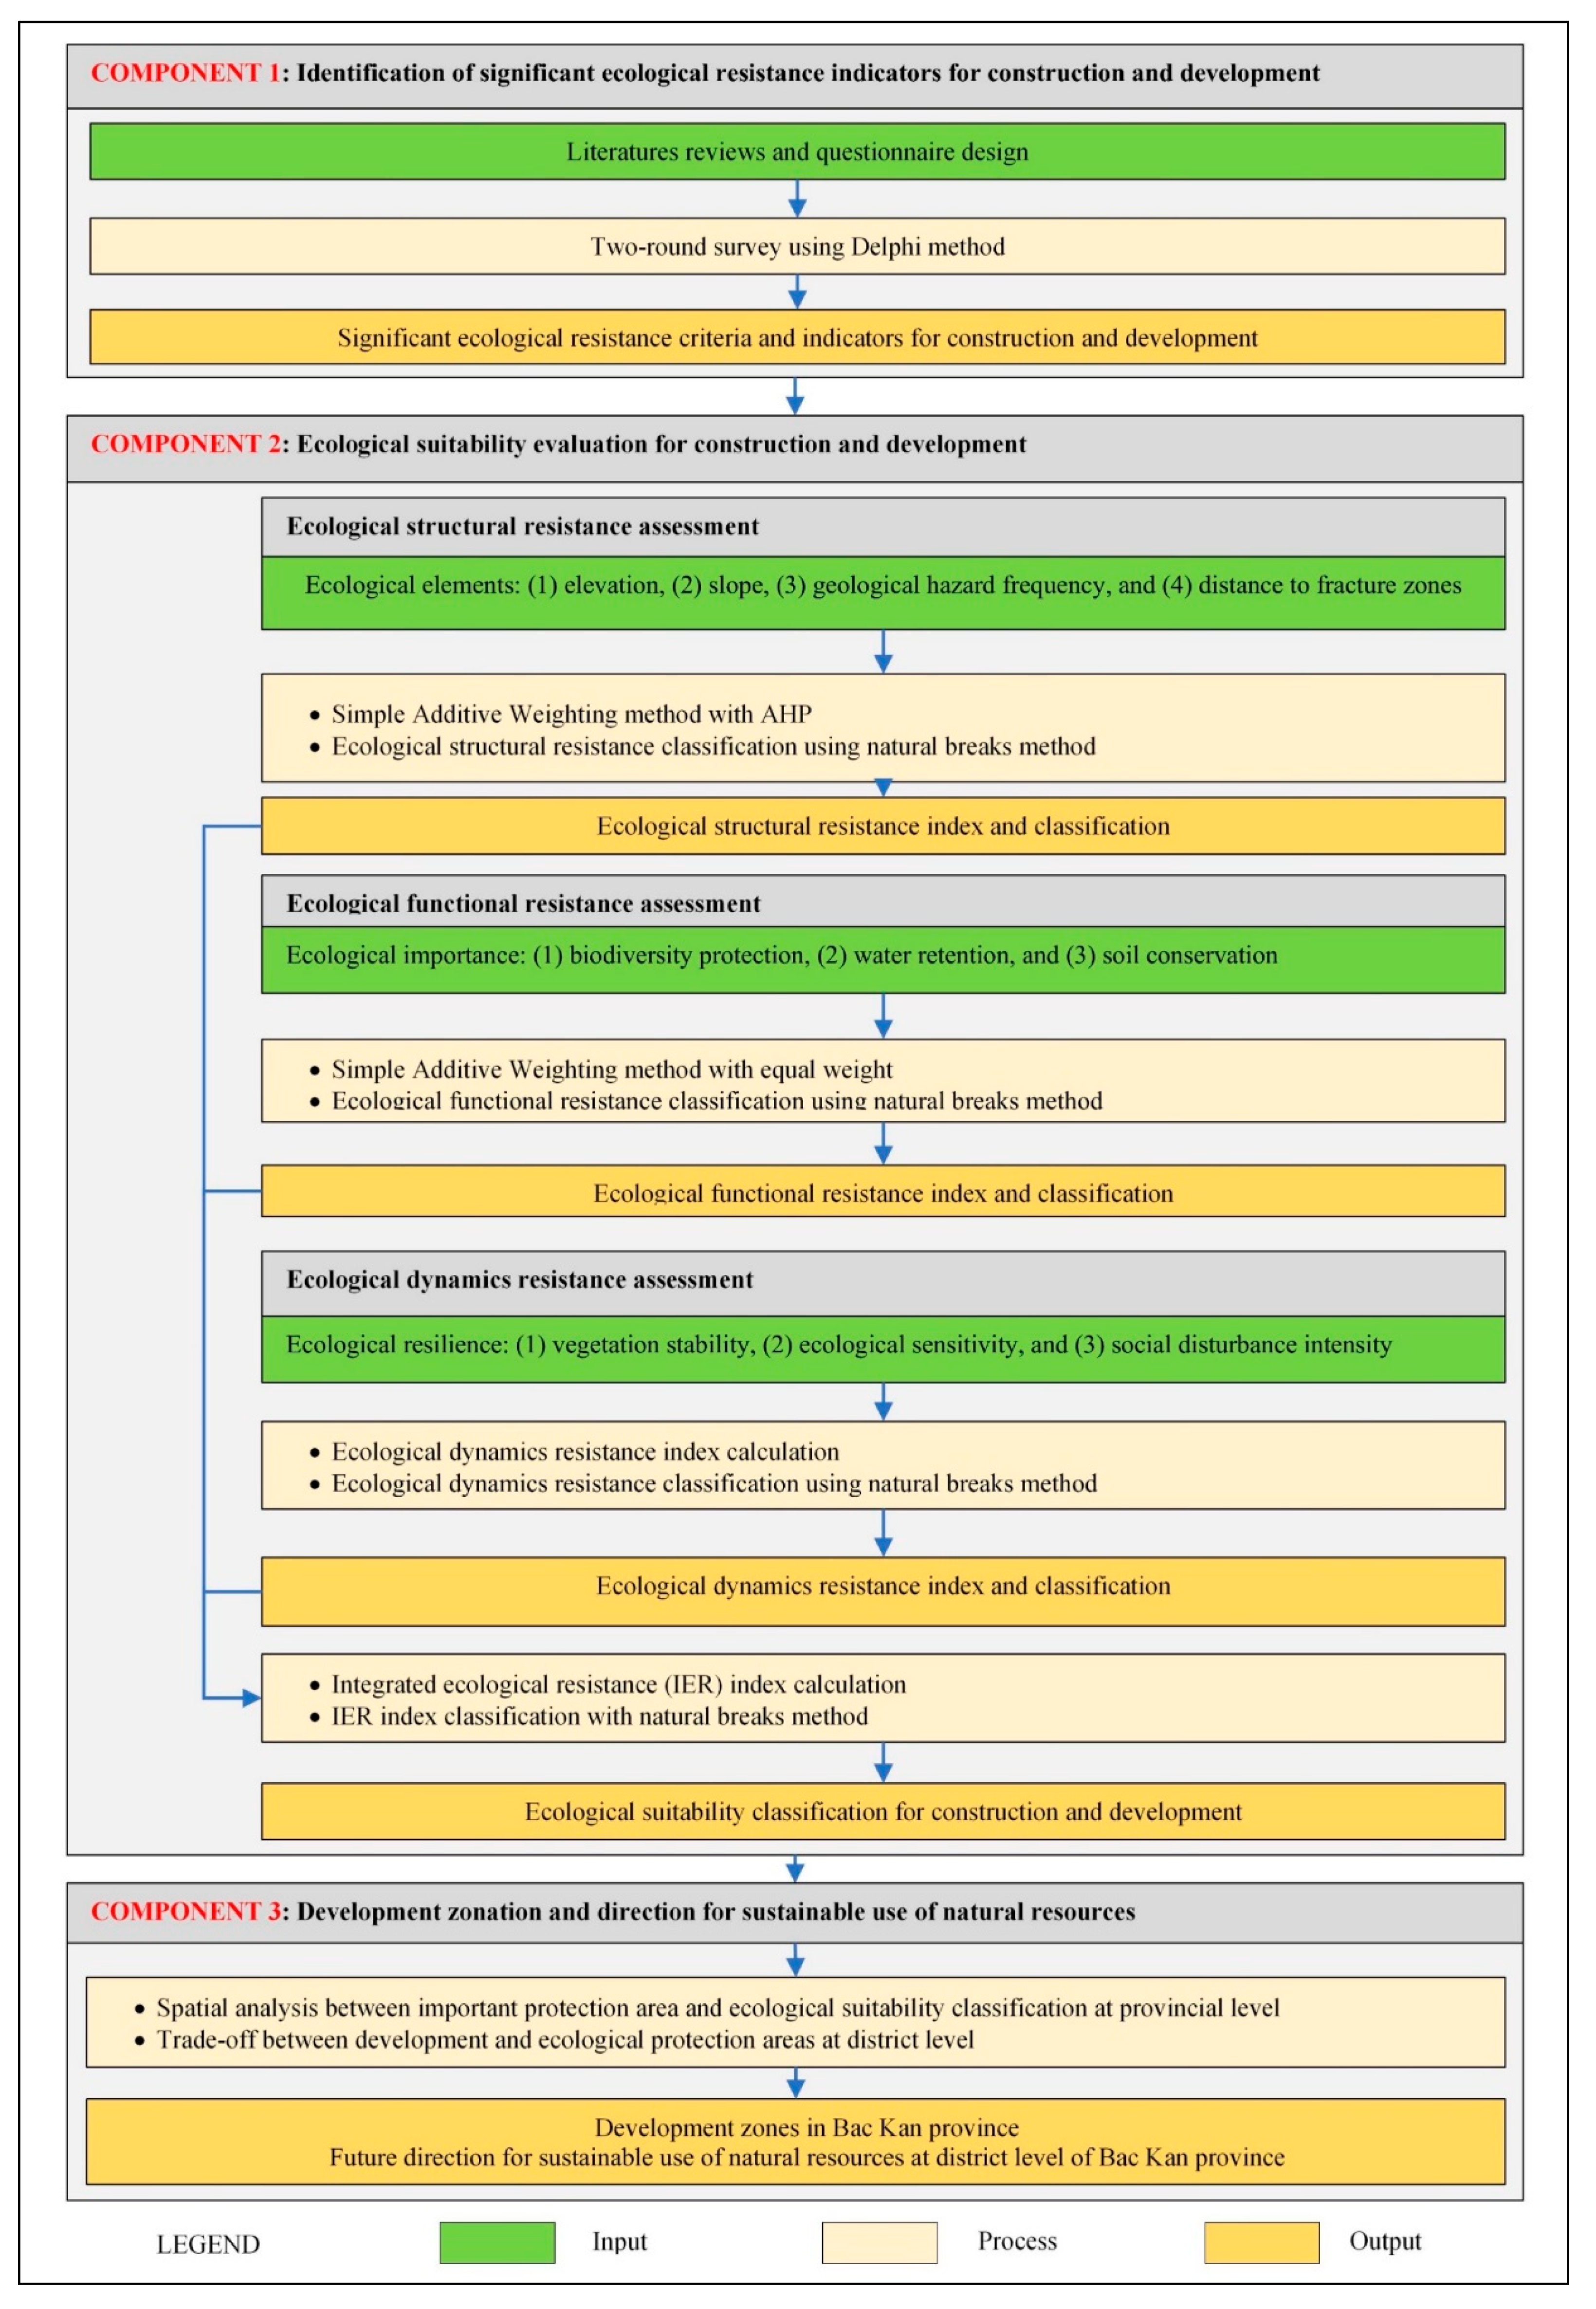
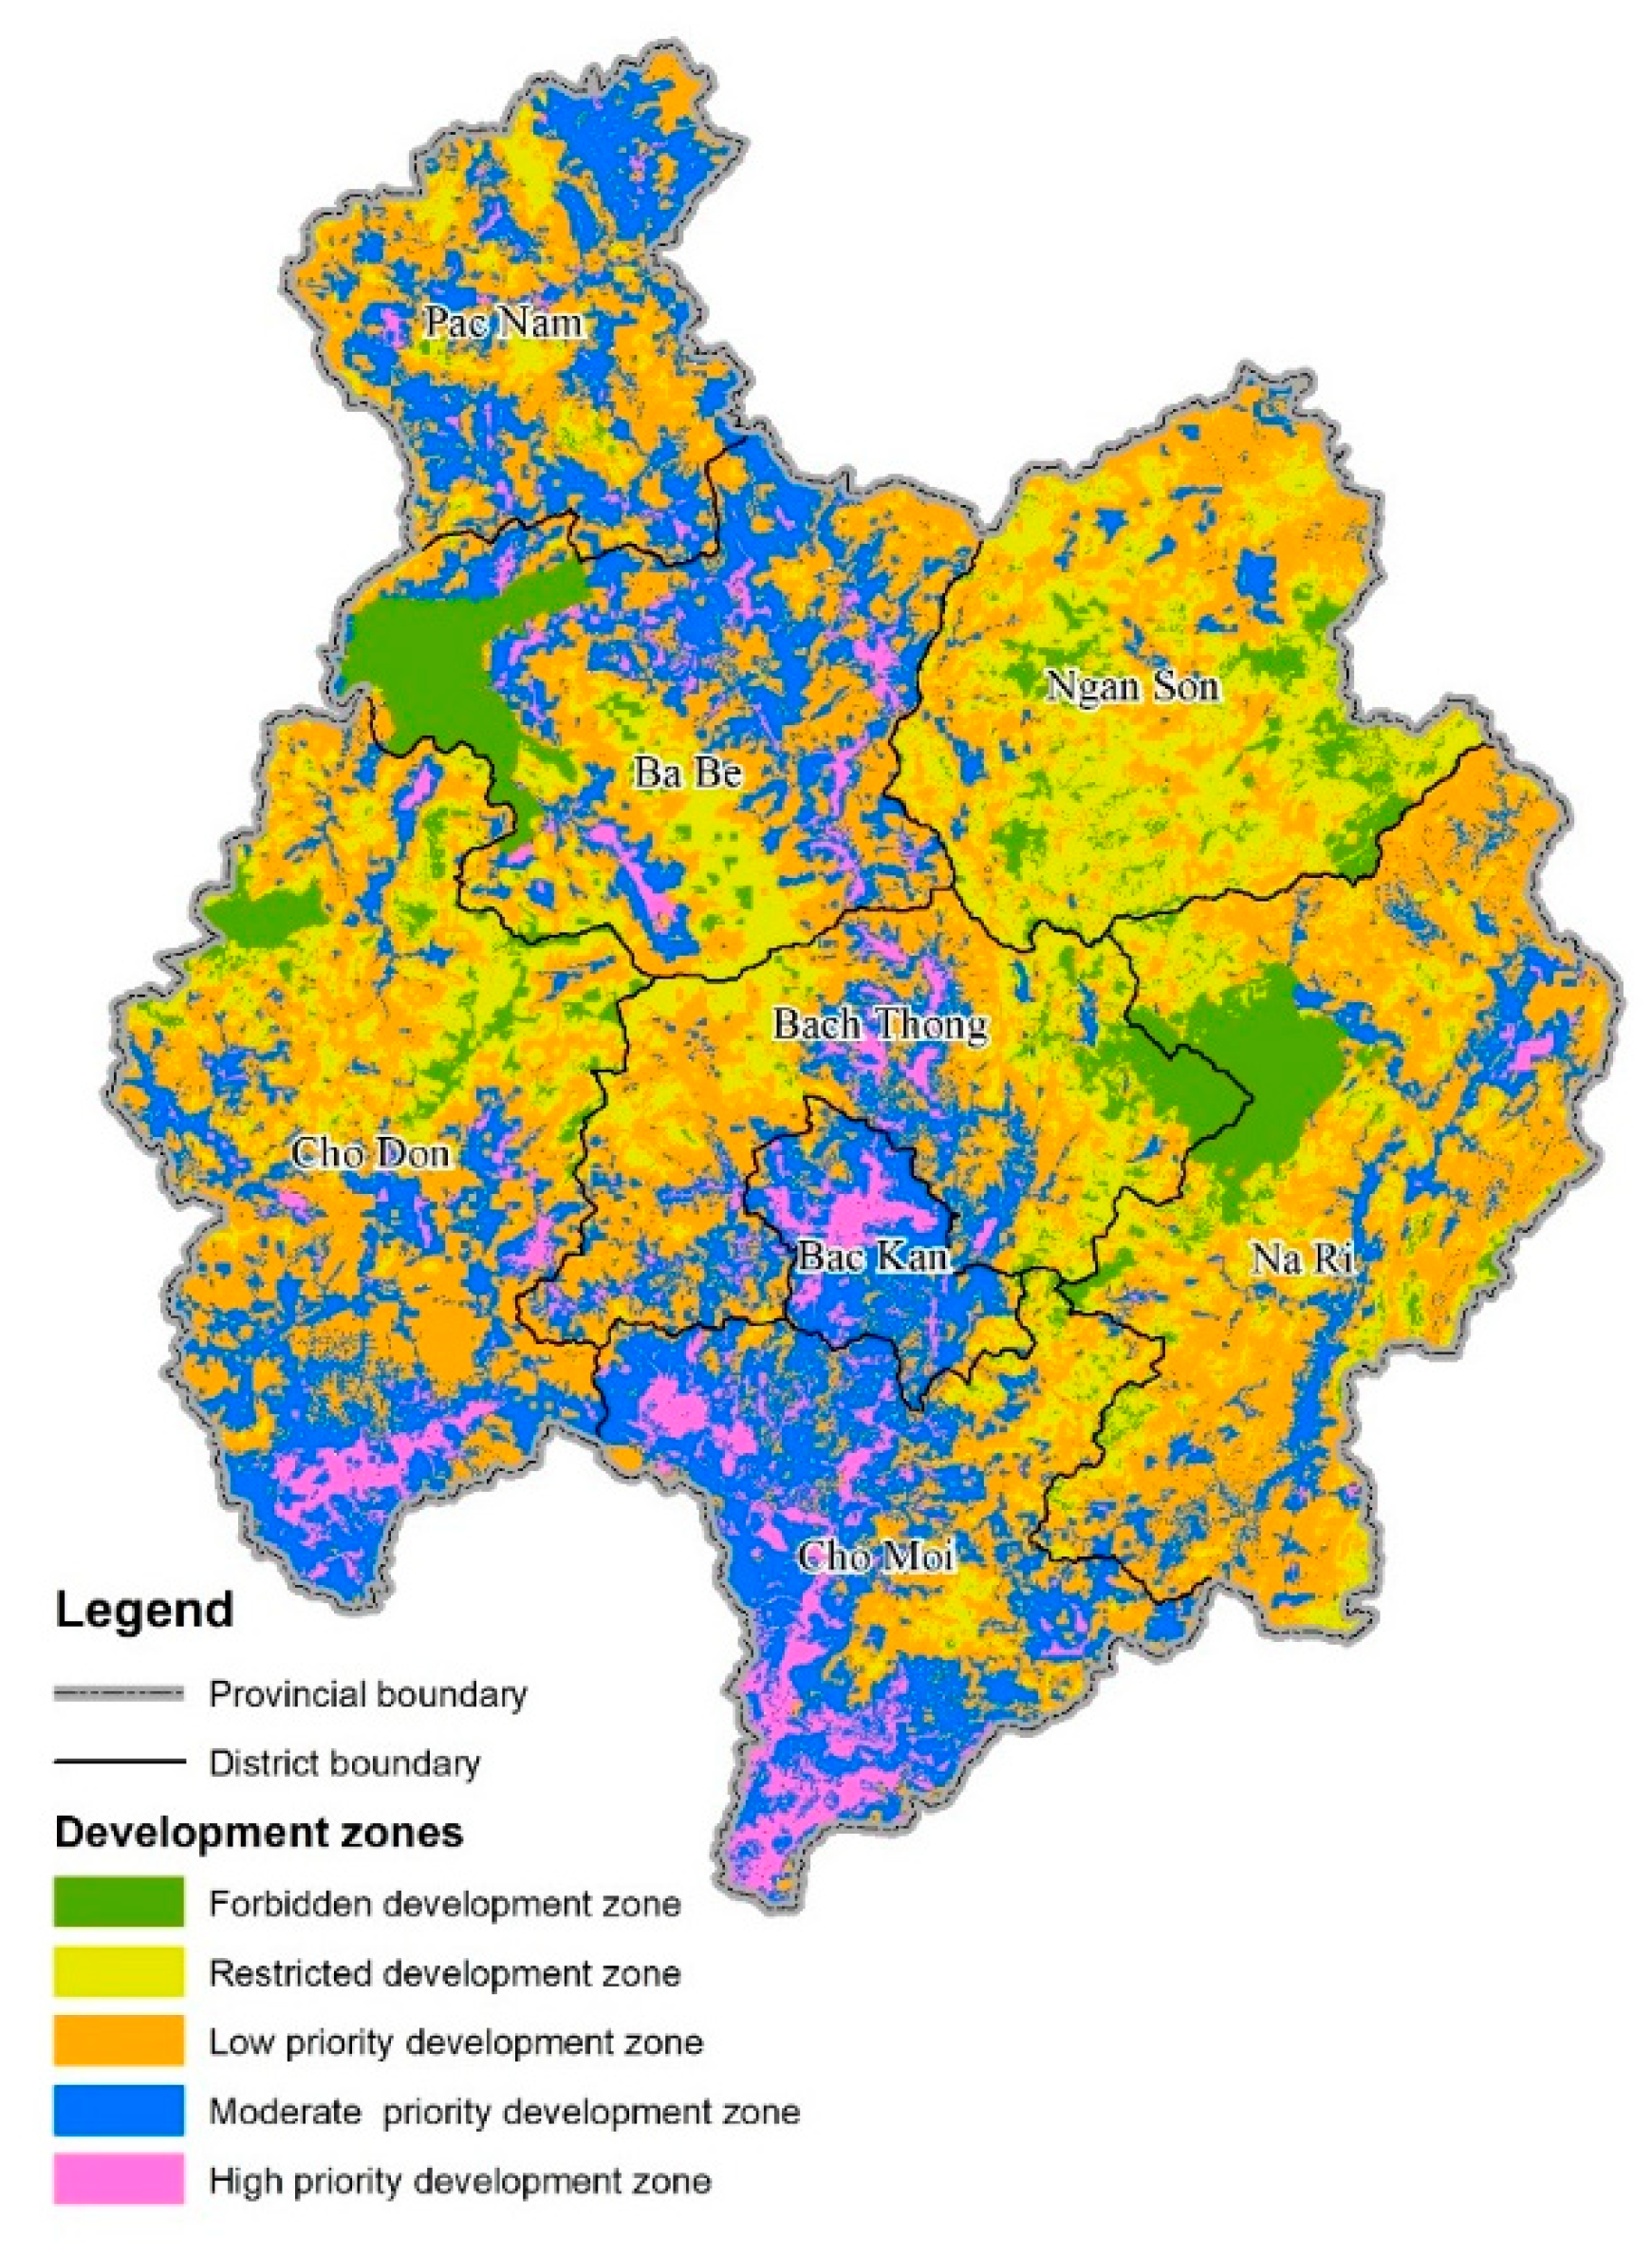
2.2.2. Ecological Suitability Evaluation for Construction and Development

An integrated ecological resistance (IER) model was used to produce the ecological suitability map for construction and development in this study. The IER model, which is based on the spatial ecology in landscape ecology, was proposed by Peng, Ma, Du, Zhang, and Hu [14]. Under the IER model, ecological elements, importance, and resilience are used to characterize the resistance of the ecological structure, function, and dynamics for construction and development, respectively, then an IER index is calculated using these three resistances. Actually, the IER index has a negative relationship with the level of ecological suitability, and the highest ecological suitability implies the lowest IER index.
The IER index was calculated using the following equation:
IER   =   ω s   S   +   ω i   I   +   ω r     R ,
where S is the ecological structural resistance measured by ecological elements, I refers to the ecological functional resistance characterized by ecological importance, and R is the ecological dynamics resistance represented by ecological resilience. In addition, ωs, ωi, and ωr are the weights of three components. Assuming that structure, function, and dynamics are interdependent for the entire ecological environment, equal weight values were applied here to these resistances. The derived IER index was then applied to classify ecological suitability for construction and development into 5 levels using the natural breaks method.
In this study, ecological structural, functional, and dynamics resistances were separately assessed based on the identified indicators from experts as mentioned in Section 2.2.1. Details of three ecological resistances are summarized below.
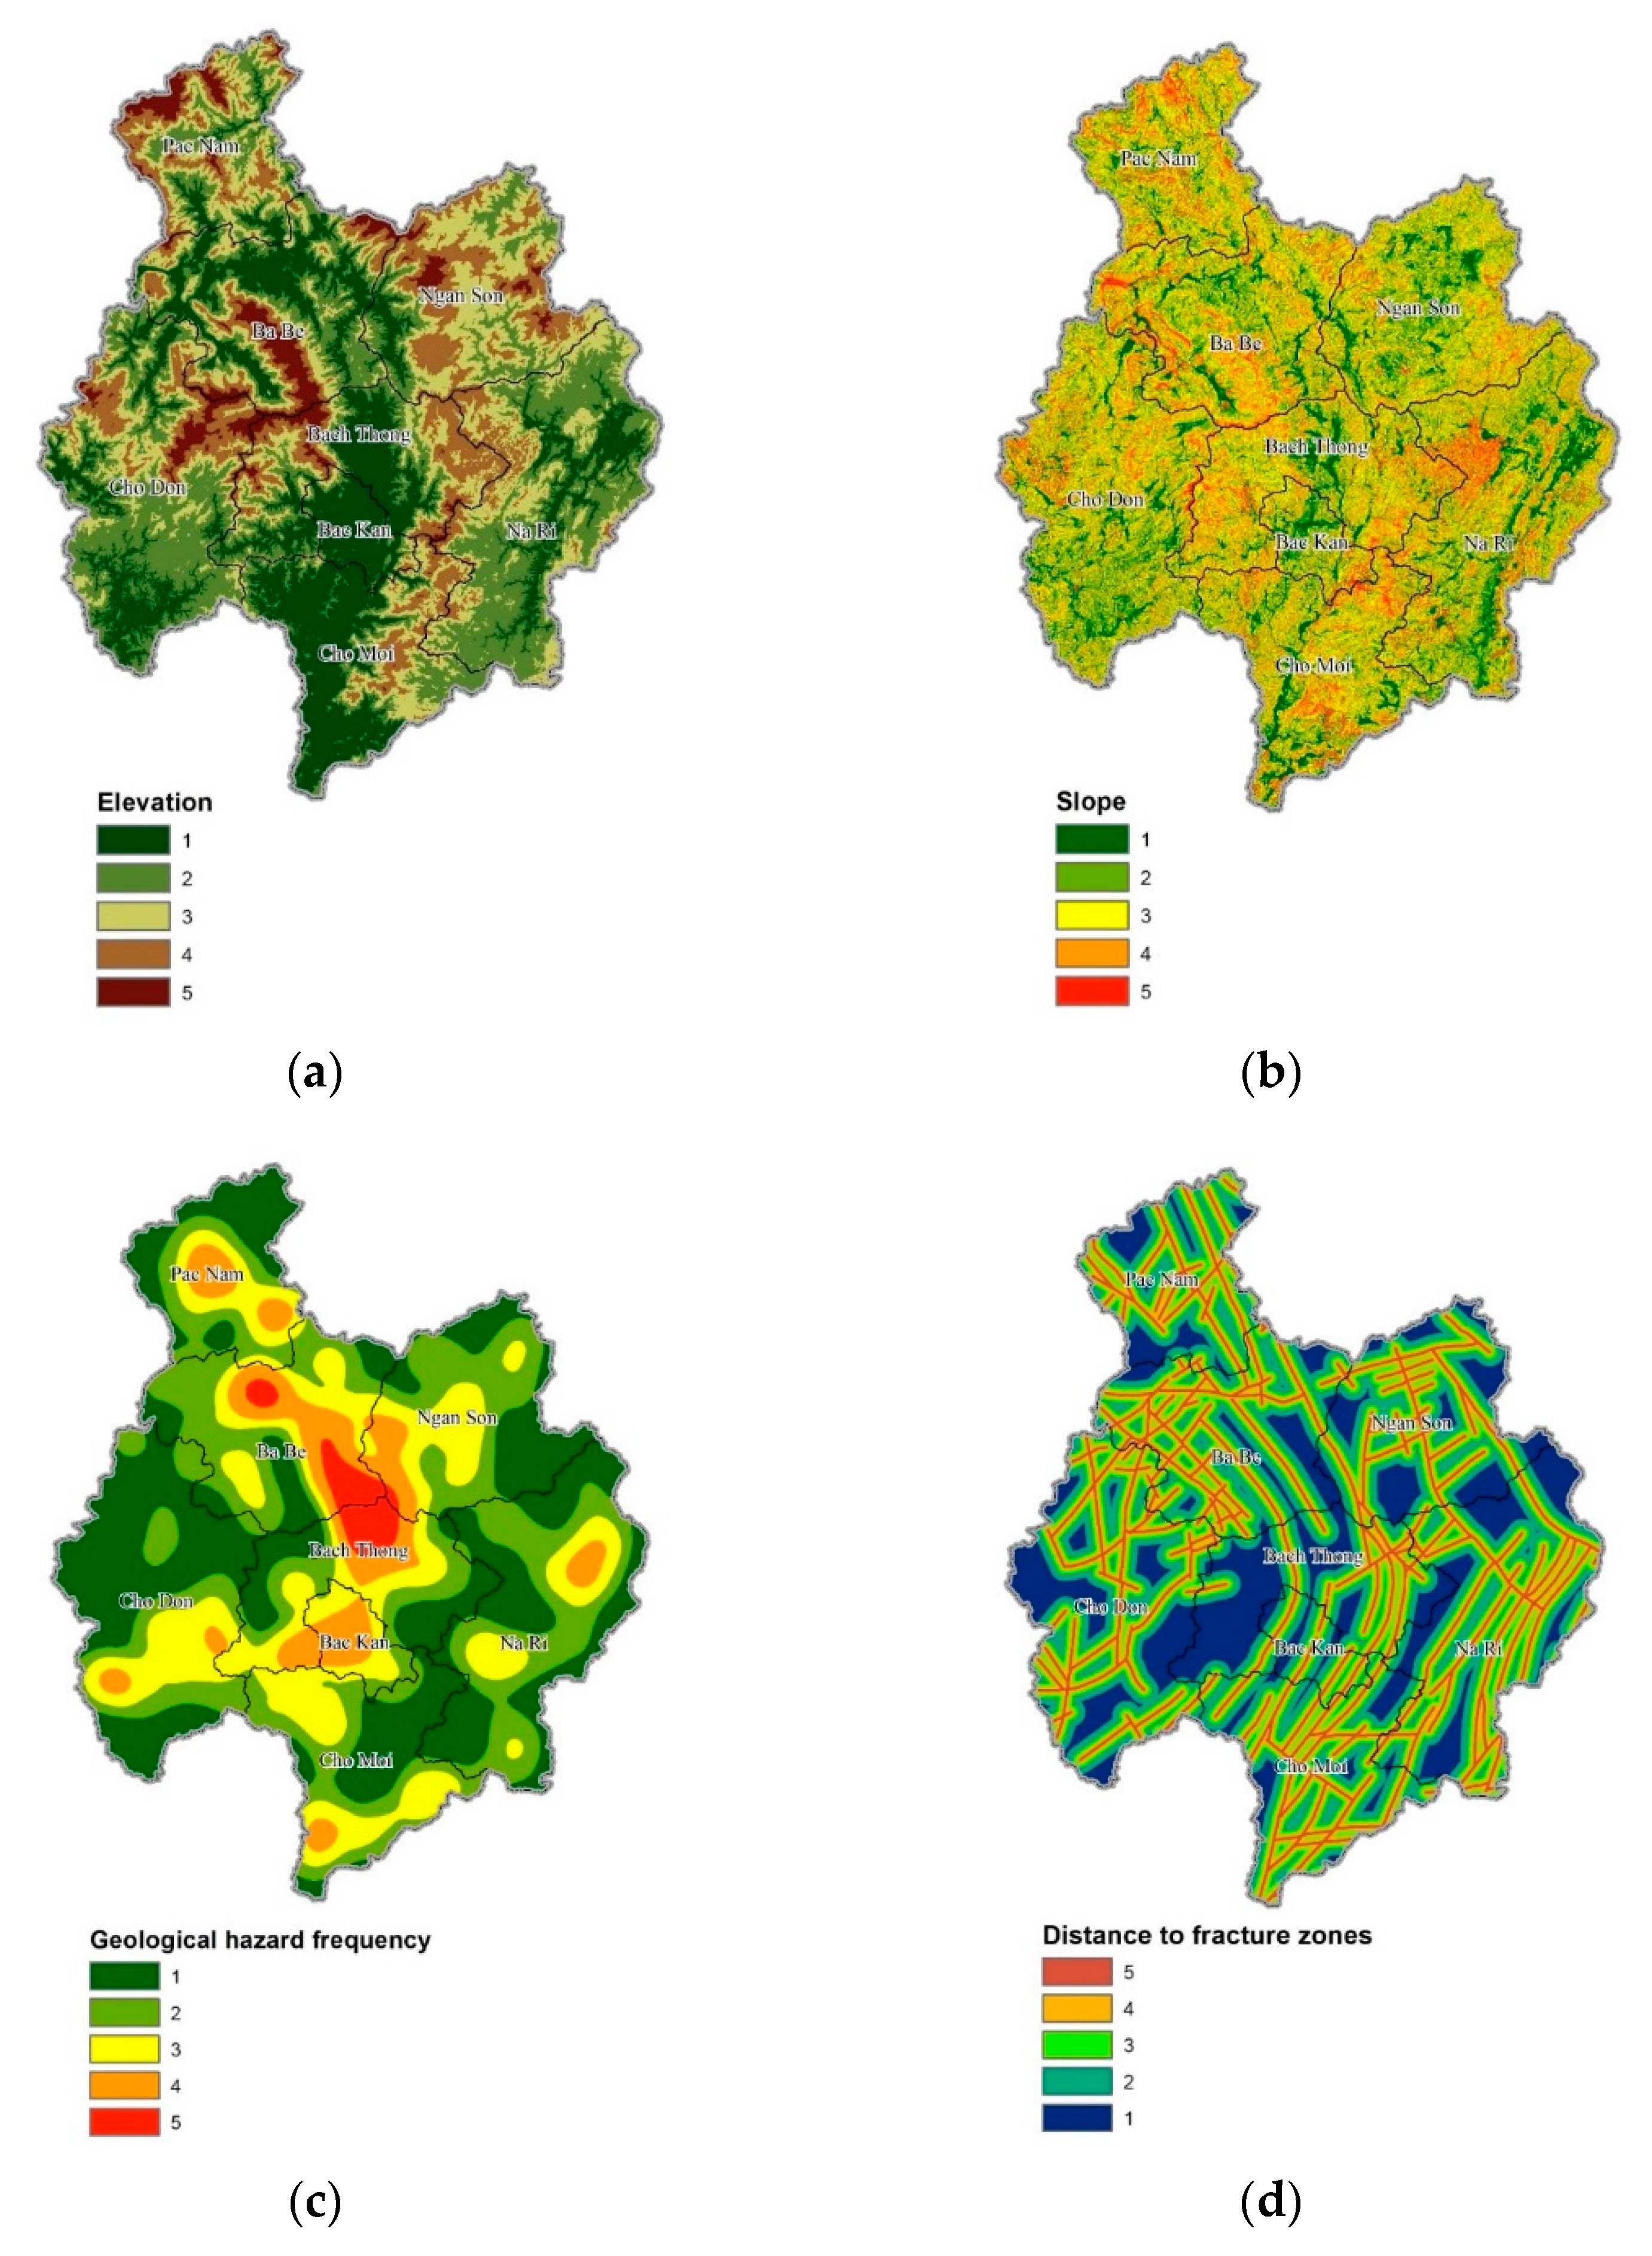
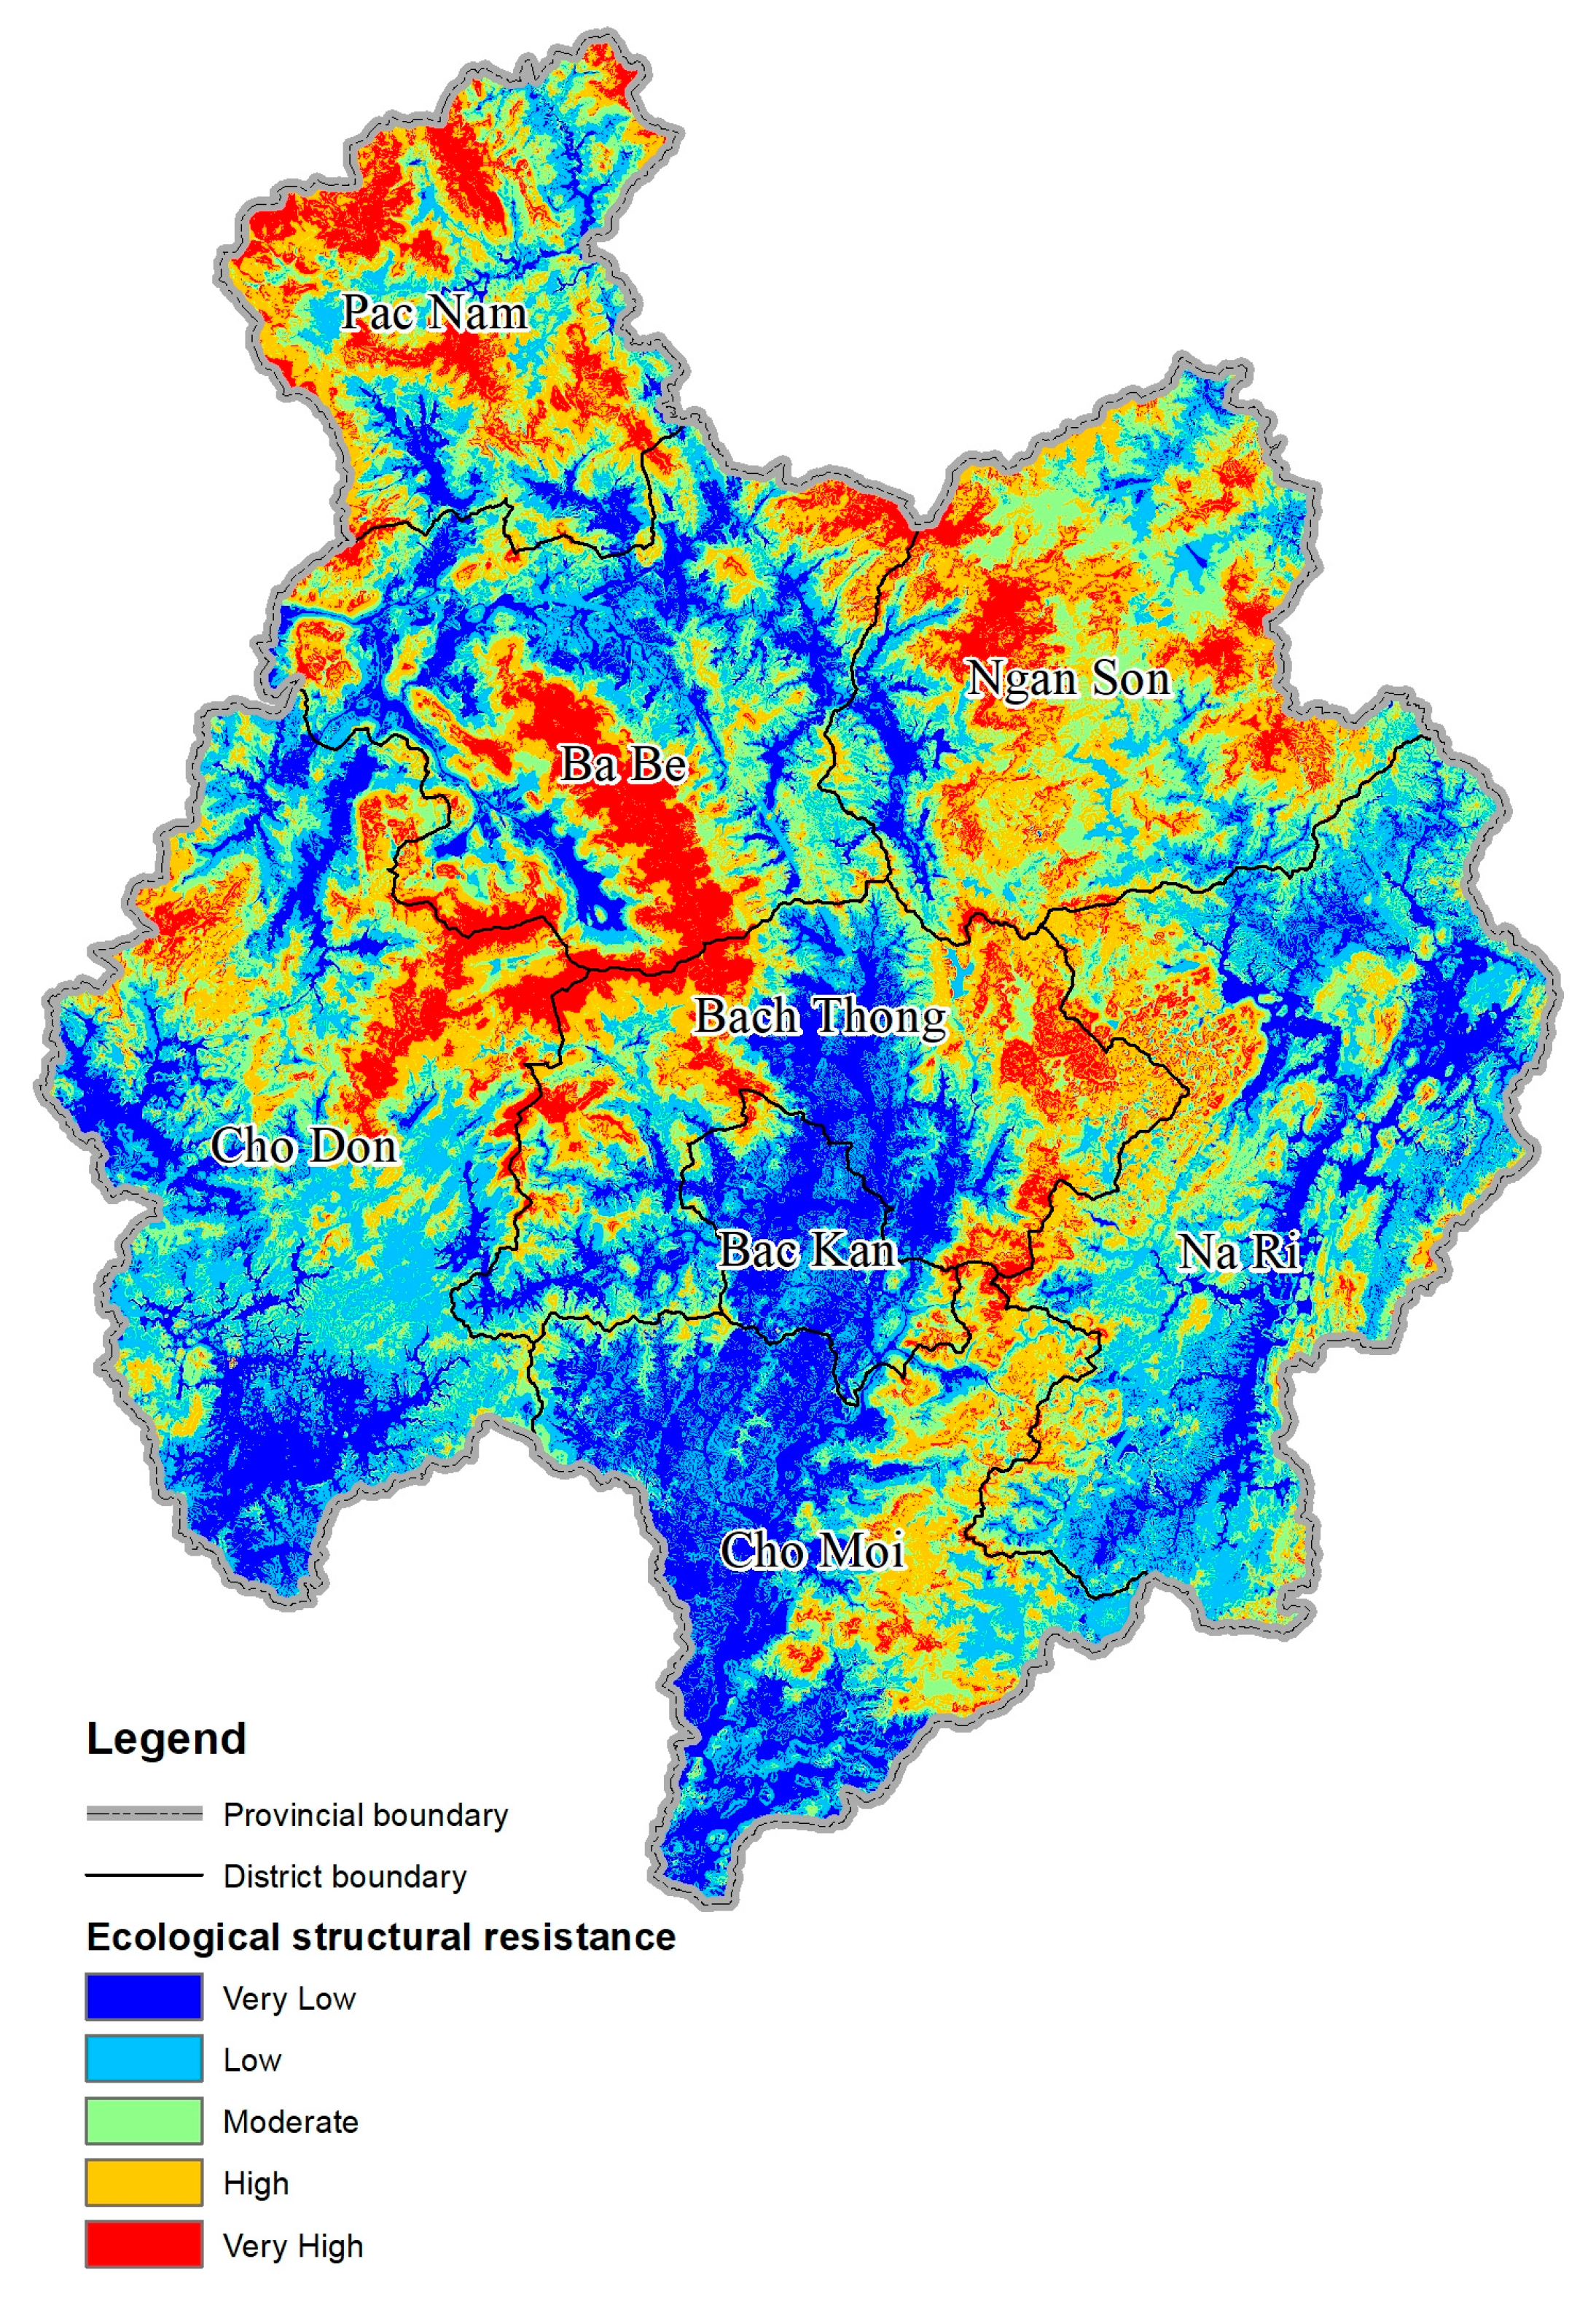
(1) Ecological structural resistance assessment
Ecological elements create the ecological structural resistance included (1) elevation, (2) slope, (3) geological hazard frequency, and (4) distance to fracture zones. The weight of each element was determined using the analytical hierarchy process (AHP) from 10 experts. This method is useful for obtaining a single assessment value based on different indicators or criteria [63]. Herein, the standard numeric scale used for the AHP is on a 1–9 scale that lies between “equal importance” to “extreme importance”, the value 1 indicates equal importance, while value 9 indicates that one indicator is extremely important than others [64]. To implement the AHP, the Super Decisions software (version, Manufacturer, City, US State abbrev. if applicable, Country) was used to calculate the weight and the inconsistency index. If the inconsistency index is less than 0.10, no correction of judgments is needed [65].
To prepare ecological elements for ecological structural assessment, elevation and slope were first extracted from DEM and then reclassified into 5 classes using the natural breaks method. By using the natural breaks method, similar values are grouped and therefore the differences between classes are maximized [66]. The resistance level has a positive relationship with elevation and slope classification. Meanwhile, the spatial characteristics of the geological hazard frequency, which was represented by historical landslides and flash flood records of Hung [67], was first extracted using the kernel method for surface interpolation under ESRI ArcMap software and reclassified into 5 classes using the natural breaks method. The resistance level of this indicator has a positive relationship with its classification. In the meantime, the distance to fracture zones, which are in crustal strata along where adjacent rocks have been displaced, was extracted based on a Bac Kan geological map using the Euclidean distance method under ESRI ArcMap software (version, Manufacturer, City, US State abbrev. if applicable, Country) and reclassified into 5 zones (0–200 m, 200–500 m, 500–1000 m, 1000–2000 m, and greater than 2000 m). The resistance level of this indicator has a negative relationship with its classifications.
Finally, the ecological structural resistance was assessed using the simple additive weighting (SAW) method (Equation (2)), and it was classified into 5 levels using the natural breaks method. The SAW method is one of the most widely used models for creating composite maps in GIS [68]:
S =   i w i x i ,
where S is the total score, w i is a normalized weight of ith indicator, and x i is the score of the ith indicator (i = 1, 2, …, n).
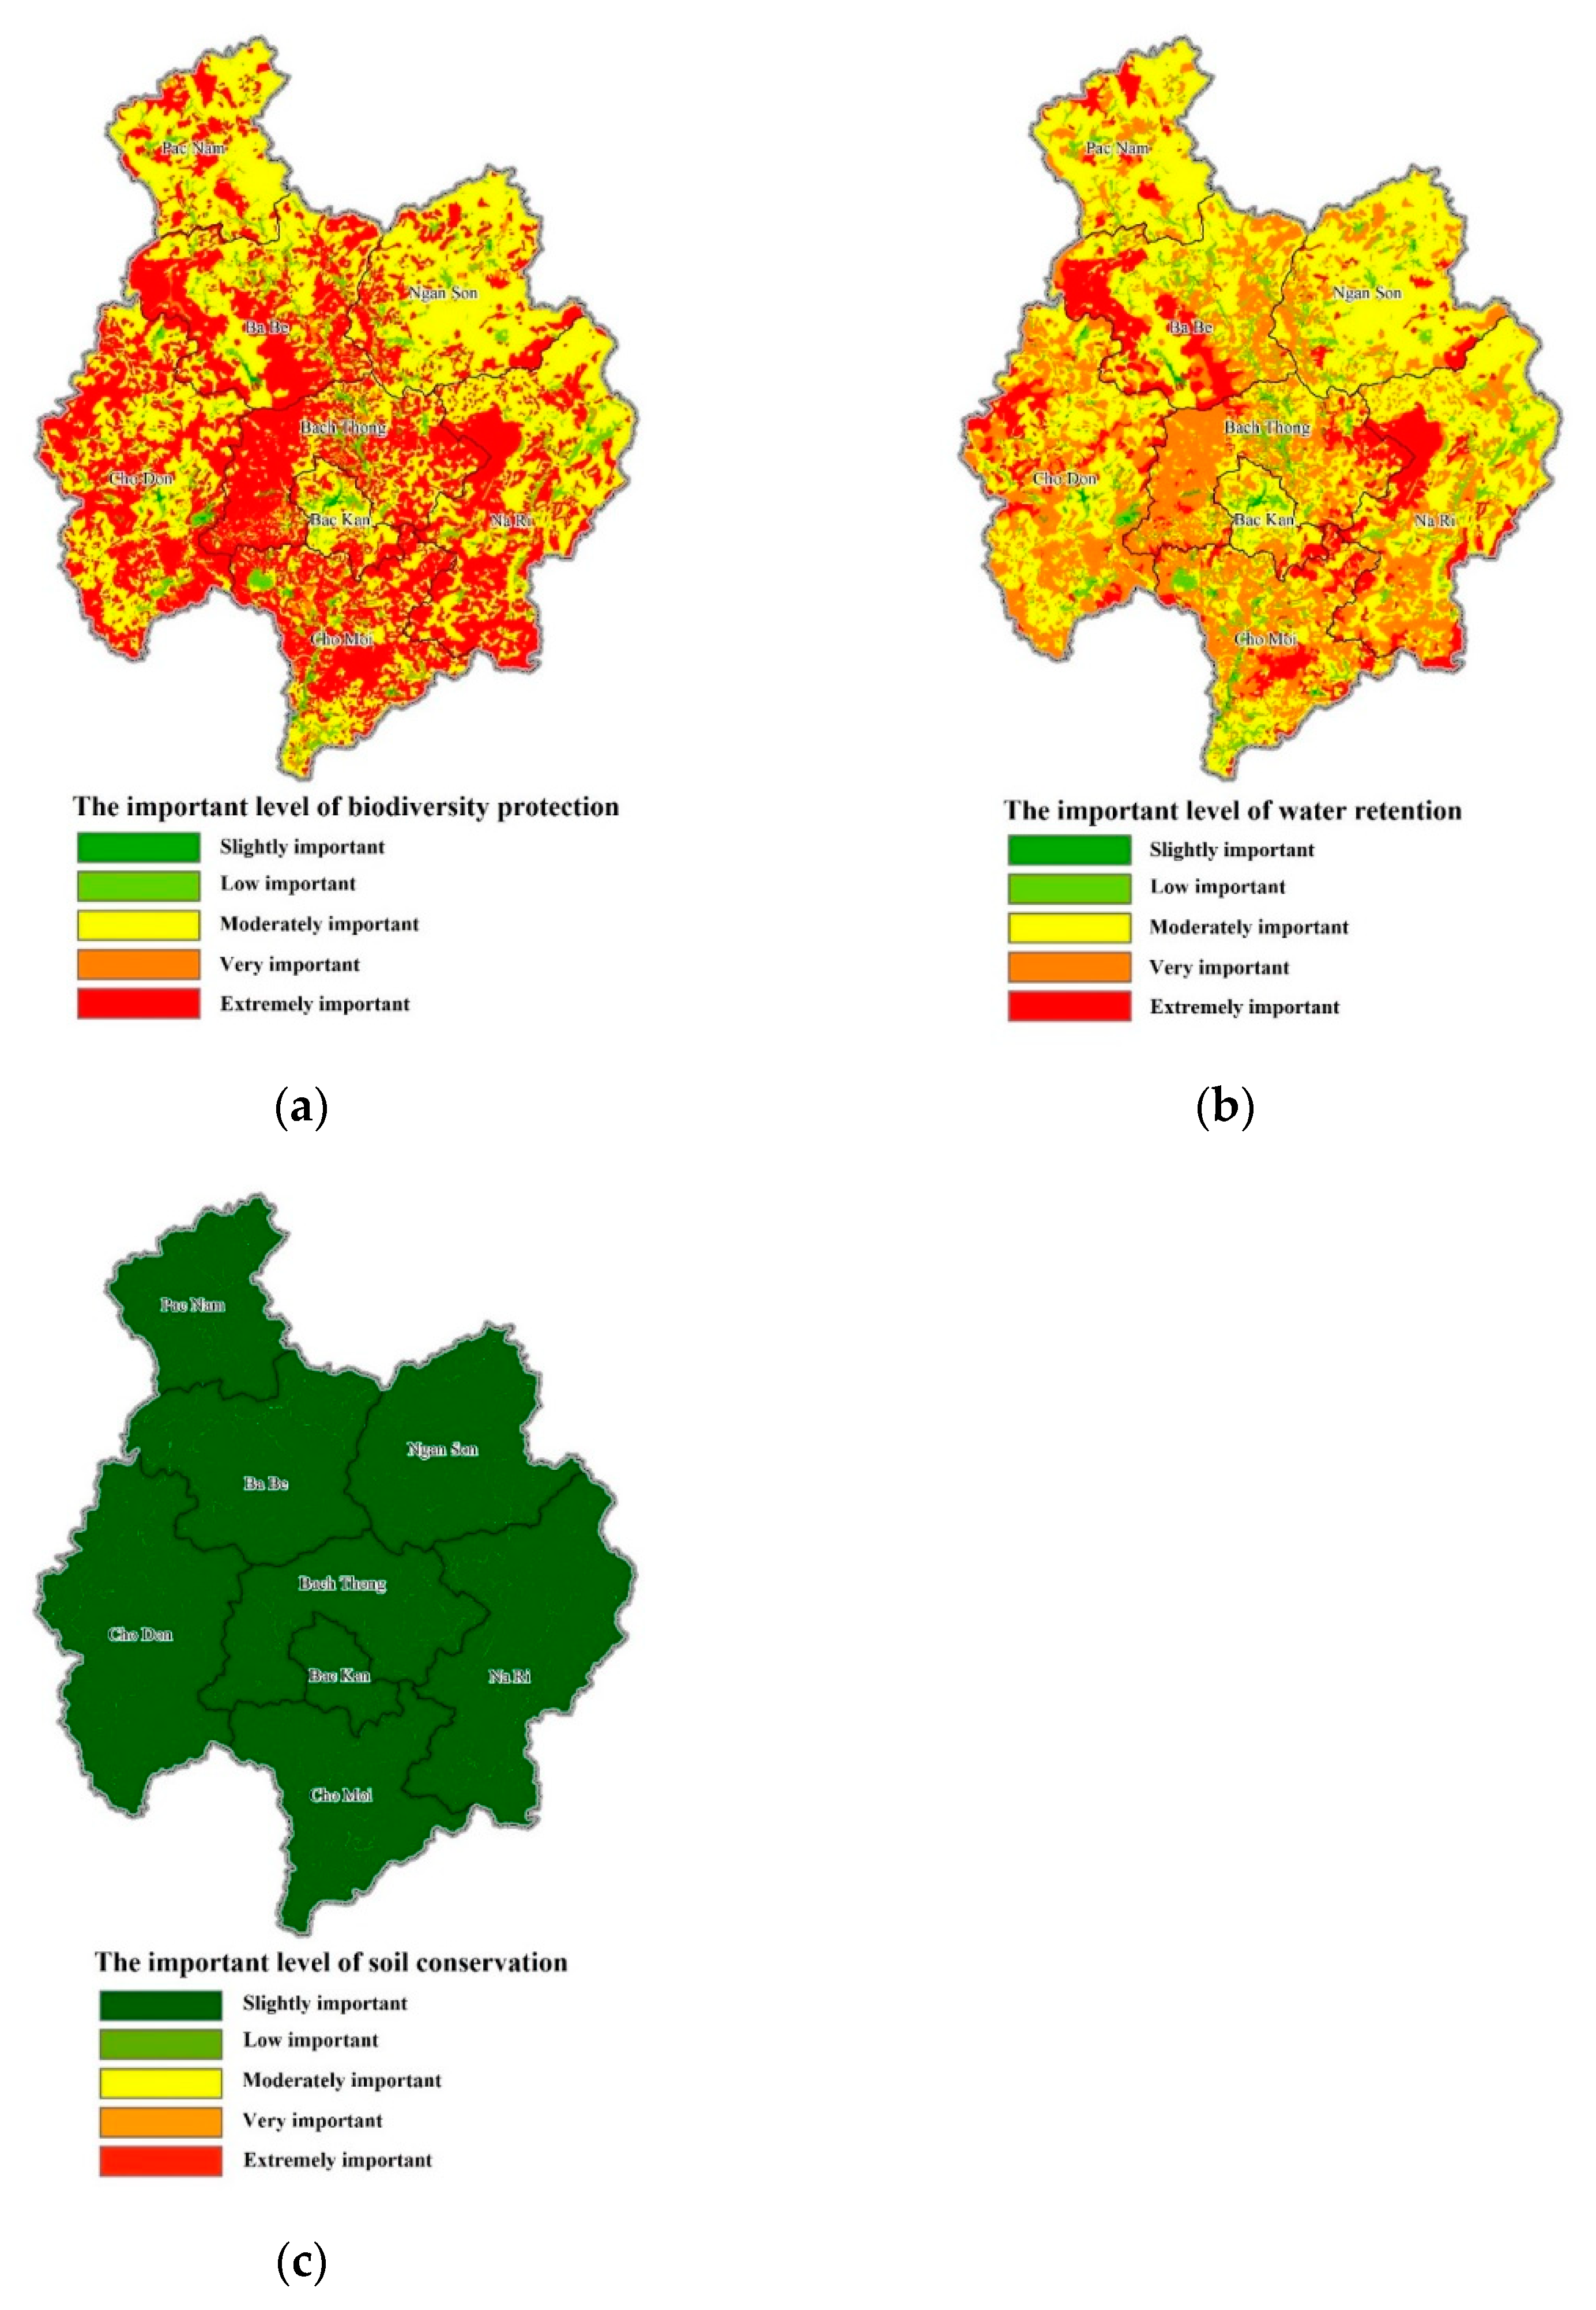
(2) Ecological functional resistance assessment
The ecological functional resistance is described by different ecological processes, as well as the relationship between human demands and the natural ecosystem [69]. The ecological functional resistance for construction and development that was assessed through ecological importance included (1) biodiversity protection, (2) water retention, and (3) soil conservation.
To assess ecological importance for ecological functional resistance assessment, the relative importance of biodiversity protection was classified into 5 levels according to land use types and associated ecosystem services (Table 3). The functional resistance level caused by this indicator has a positive relationship with its important classification. Meanwhile, the relative importance of water retention was classified based on the experiment result of Hai [70], which focused on the ability of water retention from different vegetation types and structures. The ability of water retention was assessed through a variety of indicators including soil humidity at different soil depths (Table 4) and rainfall interception capacity (Table 5). The final relative importance of water retention that links with vegetation types was classified into 5 levels (Table 6). Like the previous indicator, the functional resistance level caused by this indicator has a positive relationship with its important classification.
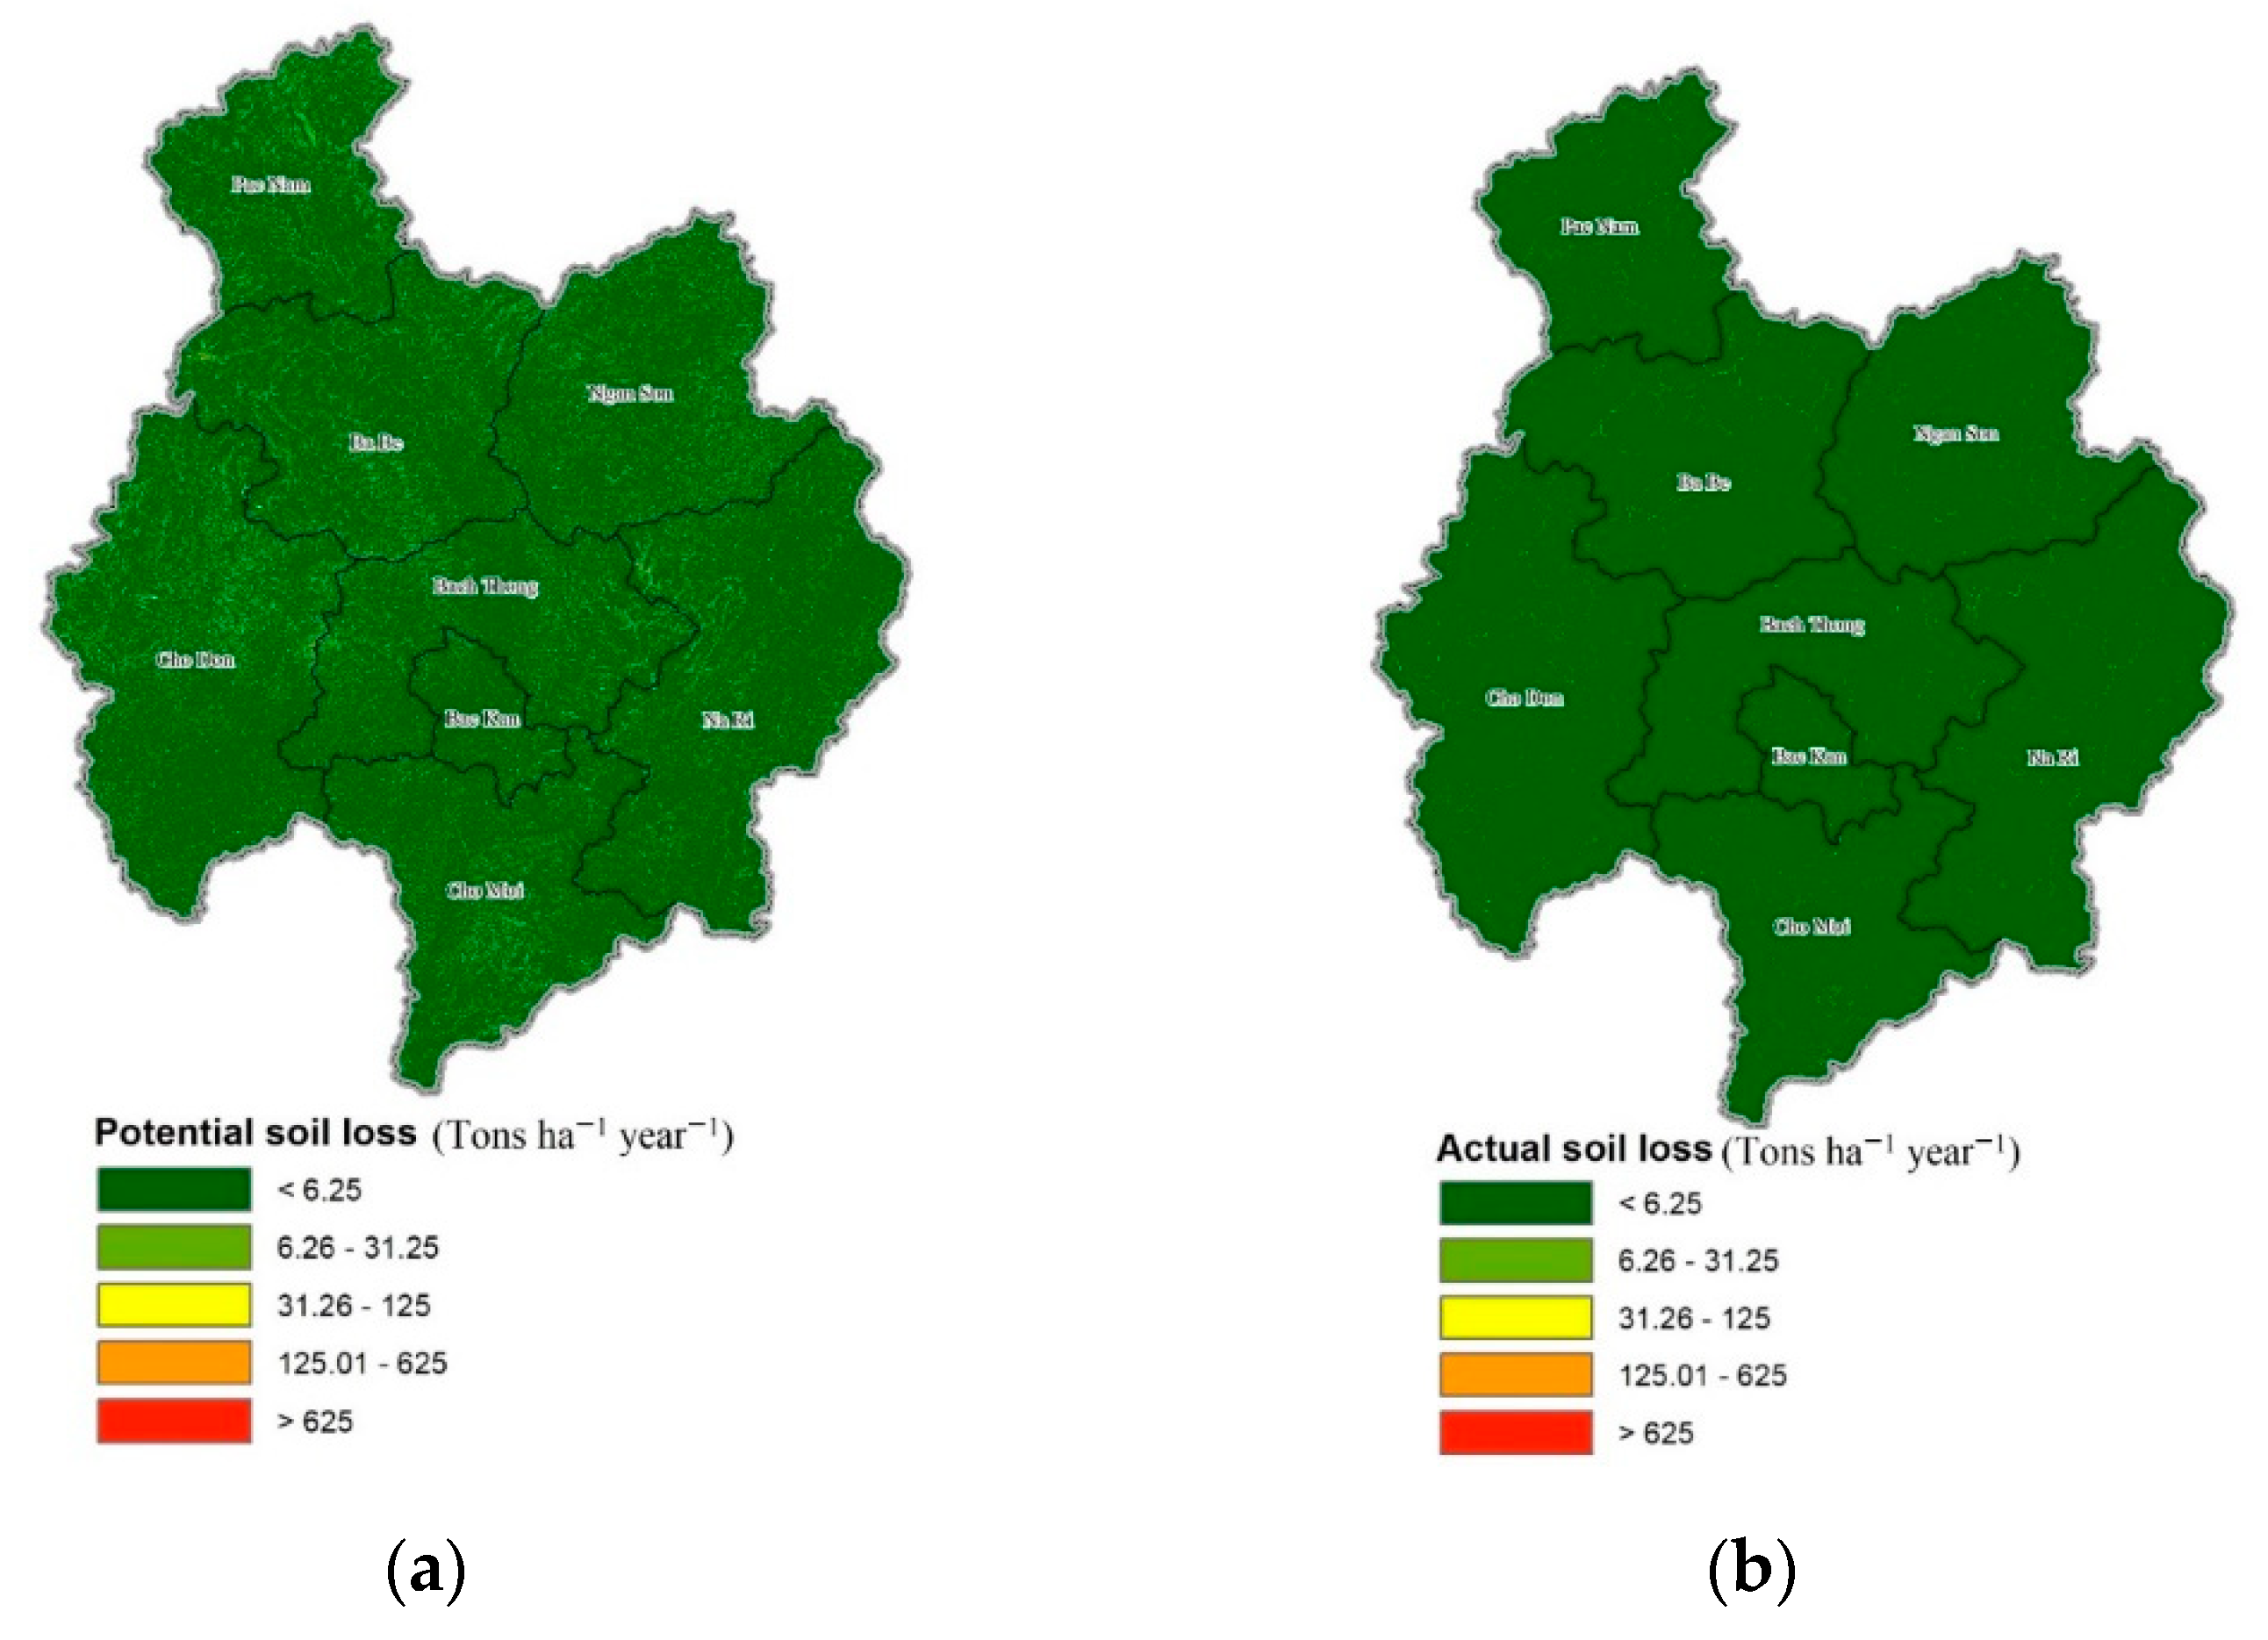
In the meantime, soil conservation was assessed based on the difference between potential and actual soil loss as suggested by [14,57]. As the amount of soil conservation increases, the relative importance increases. In this study, actual soil loss was assessed using the universal soil loss equation (USLE) [71] as:
A   =   R     K     LS     C     P ,
where:
  • A is actual soil loss (tons ha−1 year−1),
  • R is rainfall erosivity (MJ mm ha−1 h−1 year−1),
  • K is soil erodibility factor (tons h (MJ mm)−1),
  • LS is topographic factor (dimensionless),
  • C is cropping management factors (dimensionless), and
  • P is supporting practice factor (dimensionless).
Brief information on relevant USLE factors was separately summarized below.
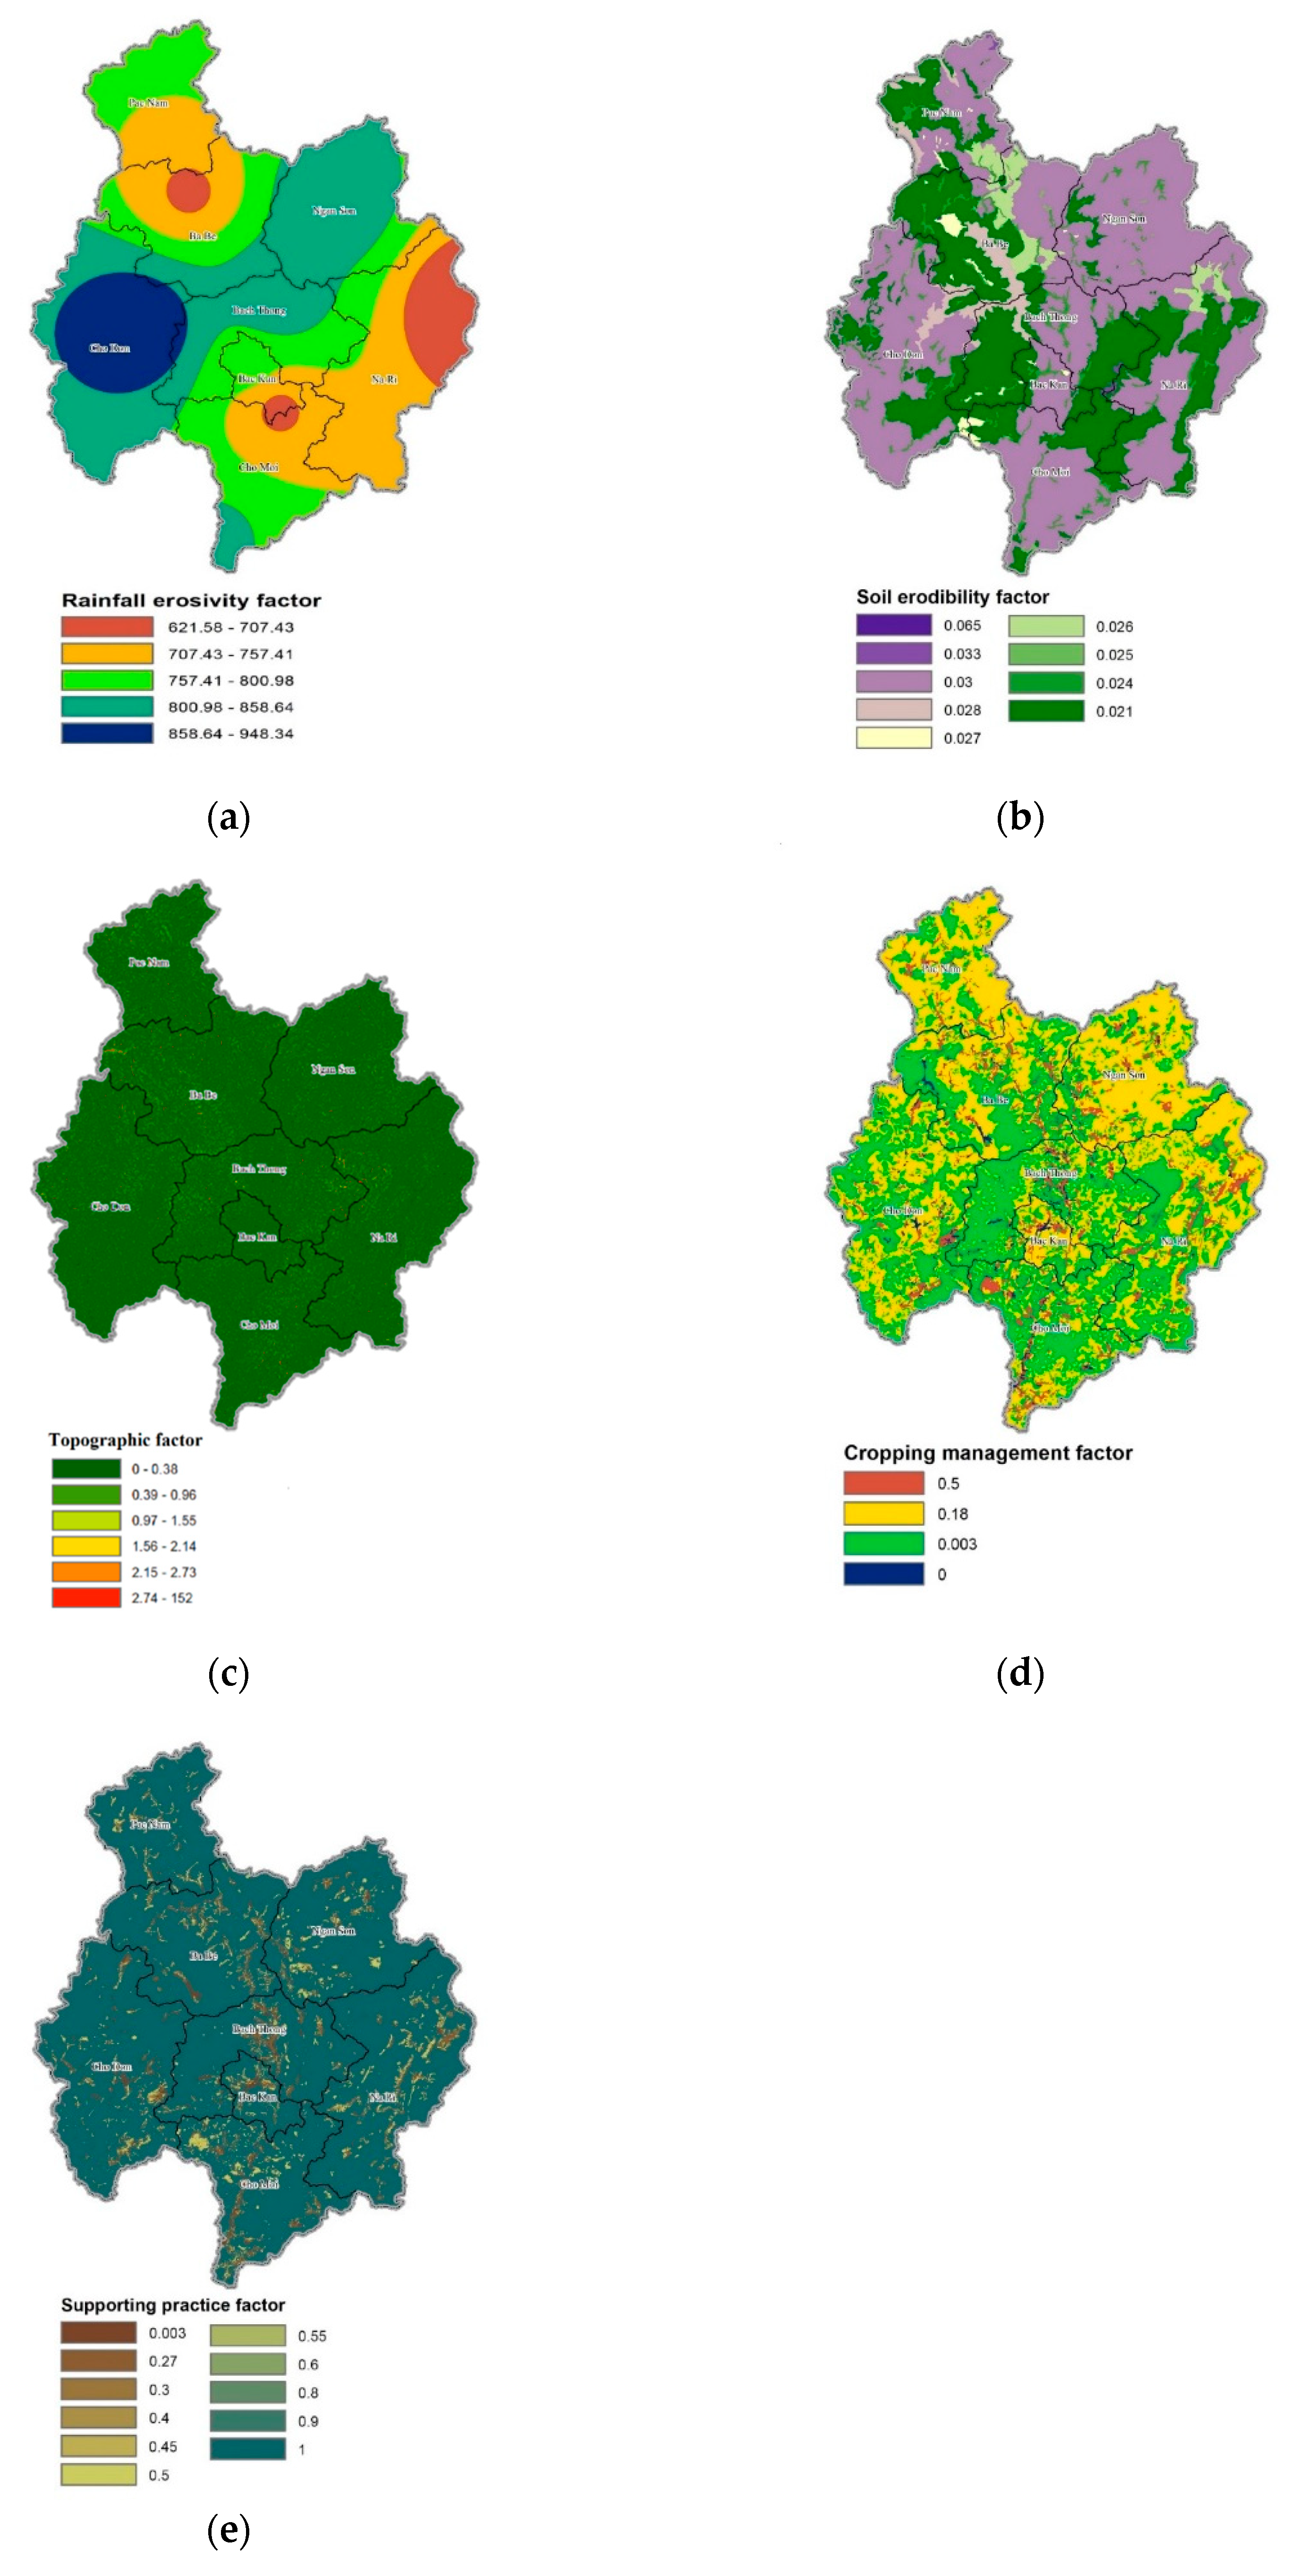
(a) Rainfall erosivity factor (R). Rainfall erosivity is defined as the product of the total kinetic energy of the rain and the maximum 30 min rainfall intensity [71]. Many methods can be used to calculate the annual rainfall erosivity factor [72,73,74]. The process to calculate the R factor is rather complex and requires long-term data collection. In this study, the R factor was estimated based on a local equation that was introduced by Nguyen [75] using analysis of the rainfall data over 54 years from 253 meteorological stations throughout Vietnam as follows:
R   =   0 . 548257     P     59 . 9 ,
where P is the annual precipitation (mm).
In practice, spatial interpolation of annual precipitation based on the existing datasets from 1958 to 2018 was carried out using the inverse distance weighted (IDW) technique to generate the rainfall distribution layer and the derived result was used as the input data to produce rainfall erosivity using Equation (4) as shown in Figure 3a.
(b) Soil erodibility factor (K). Soil erodibility represents the effect of soil properties and soil profile characteristics on soil loss. Erodibility is a function of soil texture, organic matter content, and permeability [76]. In this study, K values from different soil types in northern highlands of Vietnam [77] and Ba Be Lake basin [78] as a summary in Table 7 were applied to generate the soil erodibility (Figure 3b).
(c) Topographic factor (LS). The topographic factor includes slope length (L) and slope steepness (S). The slope has a major effect on soil erosion rate. The higher the slope, the higher the velocity of overland flow, thus increasing the shear stresses on the soil particles. As slope length increases, the overland flow and flow velocity also steadily increase, leading to greater erosion forces applied to the soil surface [76]. In this study, the equation of Moore and Burch [79], which was adopted and developed by [80], was used to calculate the LS factor (Figure 3c) as:
L S   = ( F A C e l l s i z e 22.13 ) m   ( sin ( s l o p e   a n g l e ) 0.01745 0.09 ) n ,
where FA is flow accumulation, cell size is the size of the DEM data, slope angle is in degrees (°), and 0.01745 is a parameter to convert degrees to radians. m and n are assigned 0.5 and 1.3 respectively as recommended by [80].
(d) Cropping management factor (C). This factor is the second most important factor that controls soil erosion risk [81], and it reflects the effect of cropping and management practices on the soil erosion rate [82]. Generally, the C factor ranges from 0 to 1. The C value equals to 1, it indicates no cover present and the surface is treated as barren land, whereas the C value is close to zero (0), which indicates high plant cover. The C factors were adapted to the Bac Kan land use map from literature reviews for northern Vietnam [76,77,78] (Table 8 and Figure 3d).
(e) Supporting practice factor (P). This factor represents the effects of practices to the amount and rate of the water runoff and thus influence the amount of erosion when the supporting practice is high, the value of the P factor is low. It also expresses the agricultural practice in areas such as contour cultivation and arable land terrace [76]. In this study, the supporting practice factor for A Sap basin [83] was applied for Bac Kan province, and it was calculated based on group of land use types and the slope as suggested by [84] (Table 9 and Figure 3e).
Meanwhile, the potential soil loss of the landscape was computed as the product of R, K, and LS [77], and soil conservation was then extracted by subtraction operation between the derived potential and actual soil loss estimation (Figure 4).
Finally, the ecological functional resistance was assessed using the SAW method with equal weights and then was classified into 5 levels using the natural breaks method.
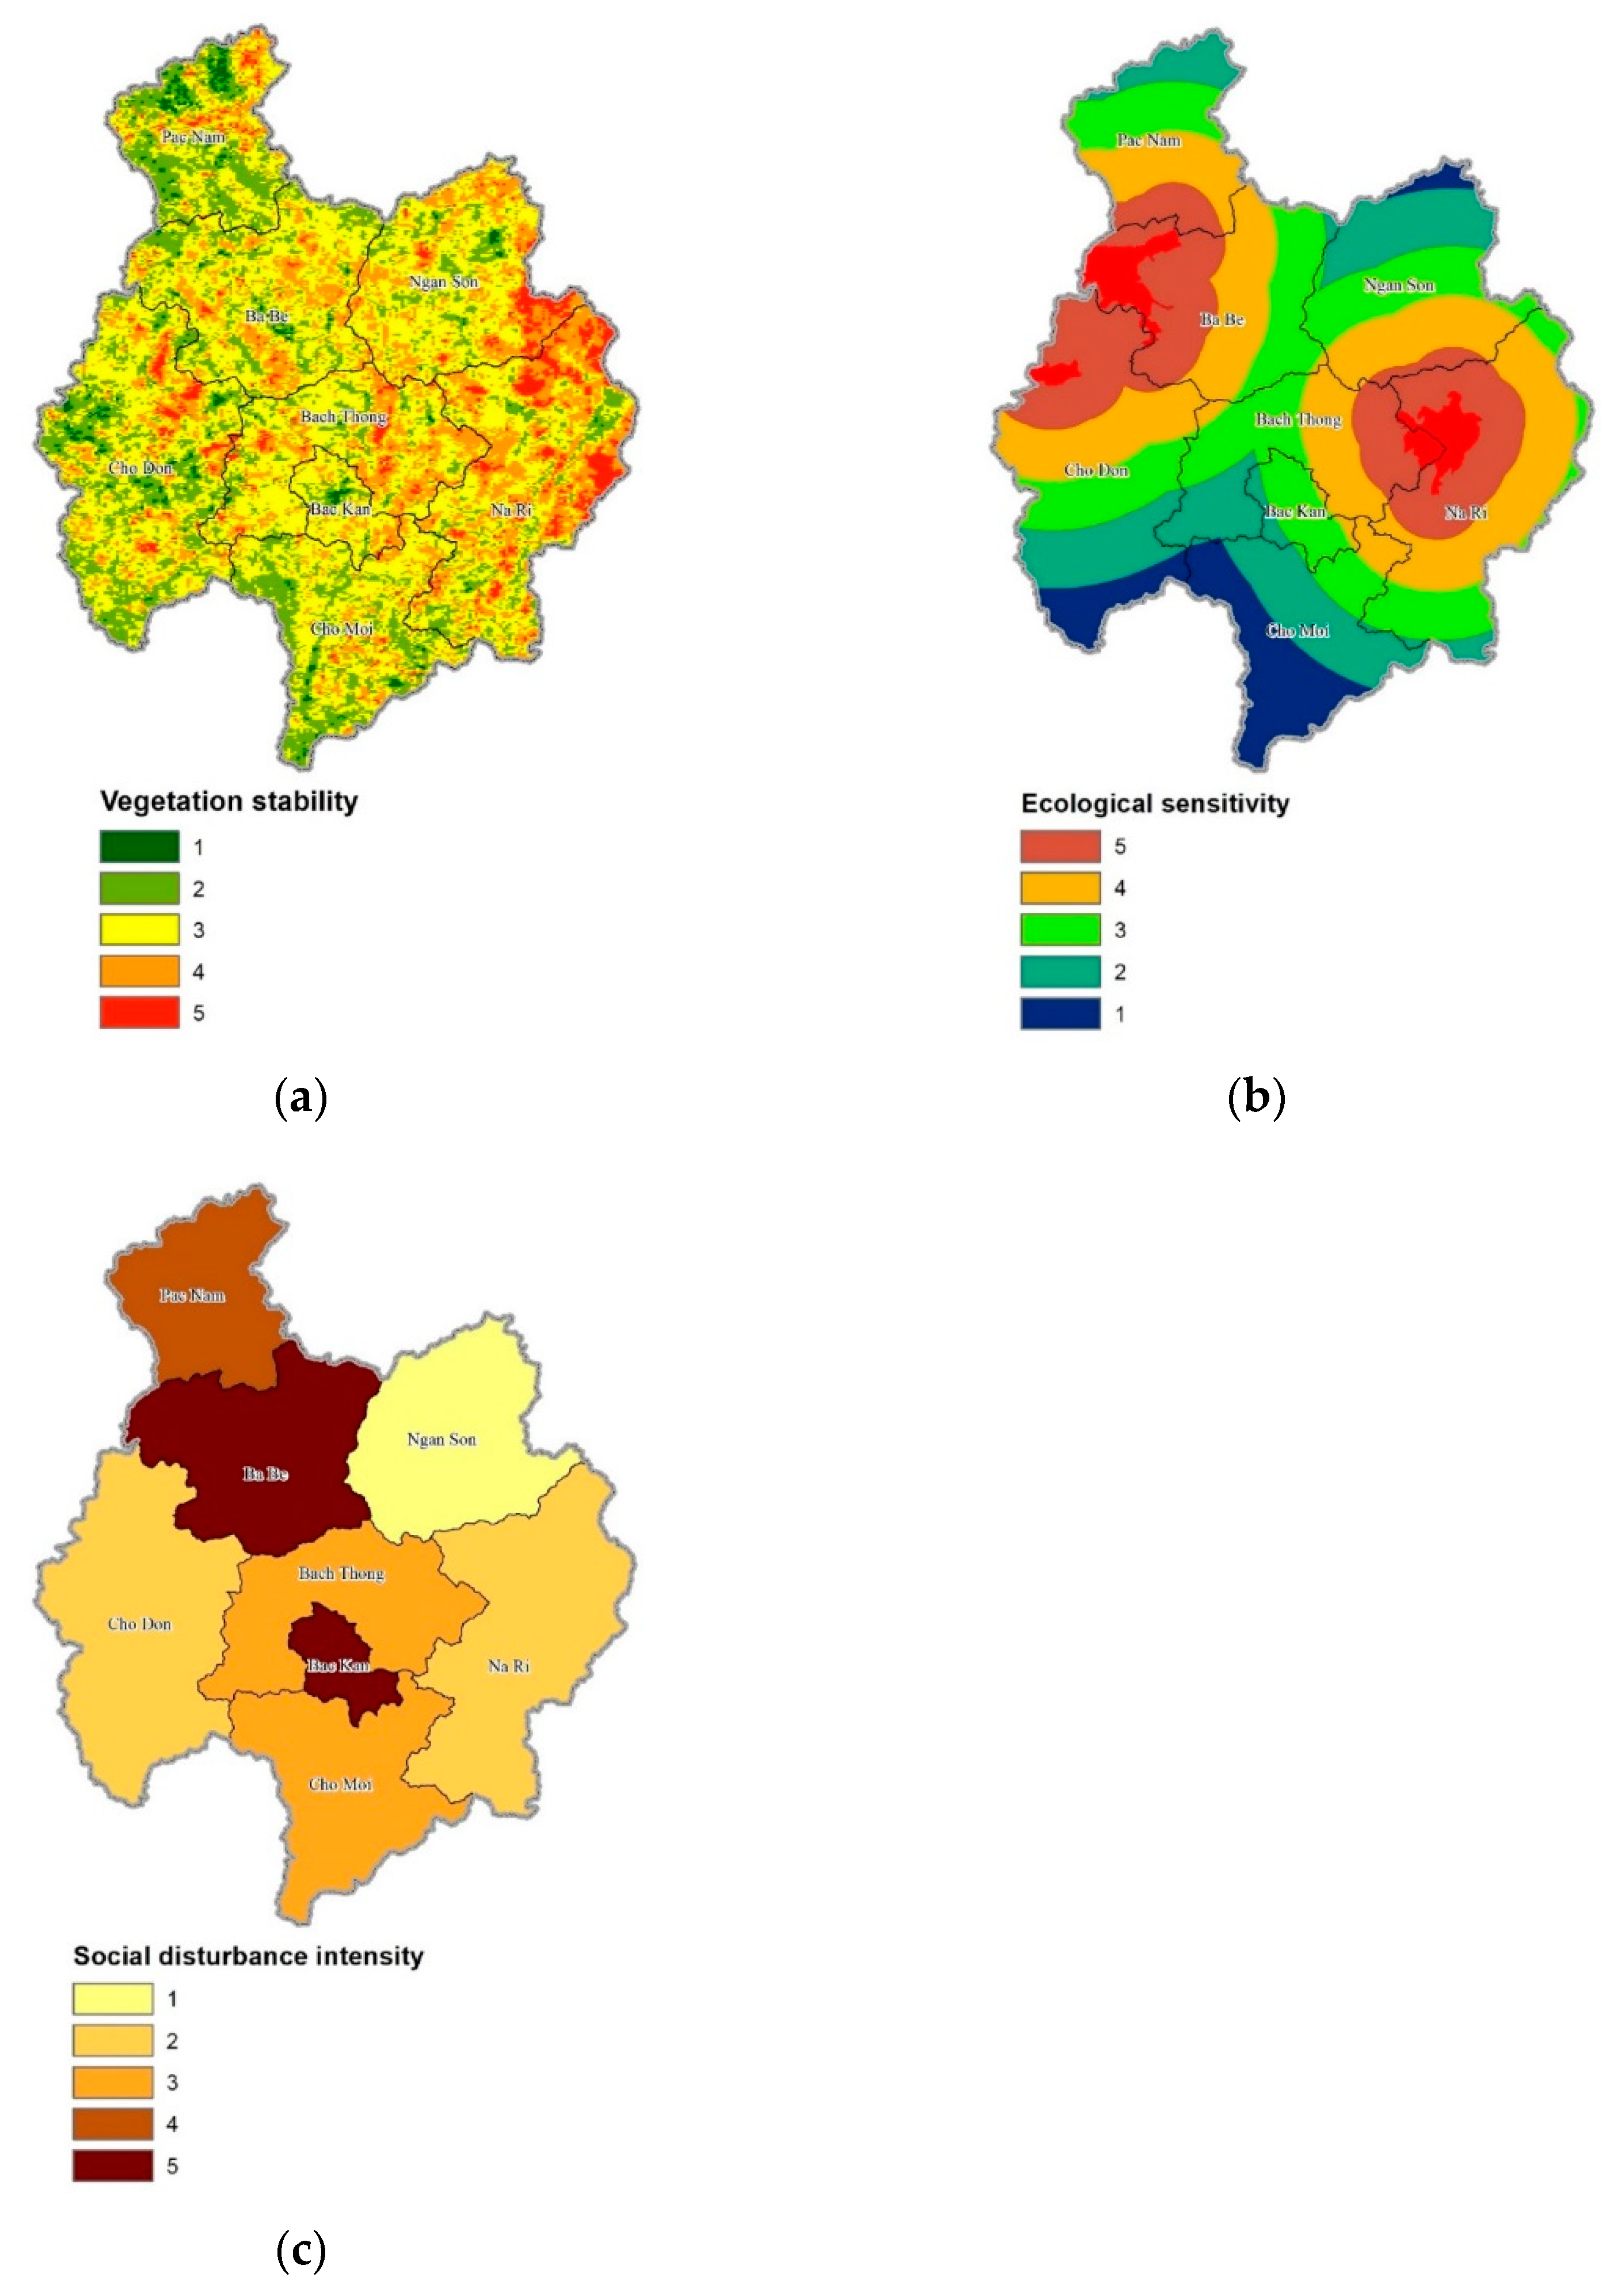
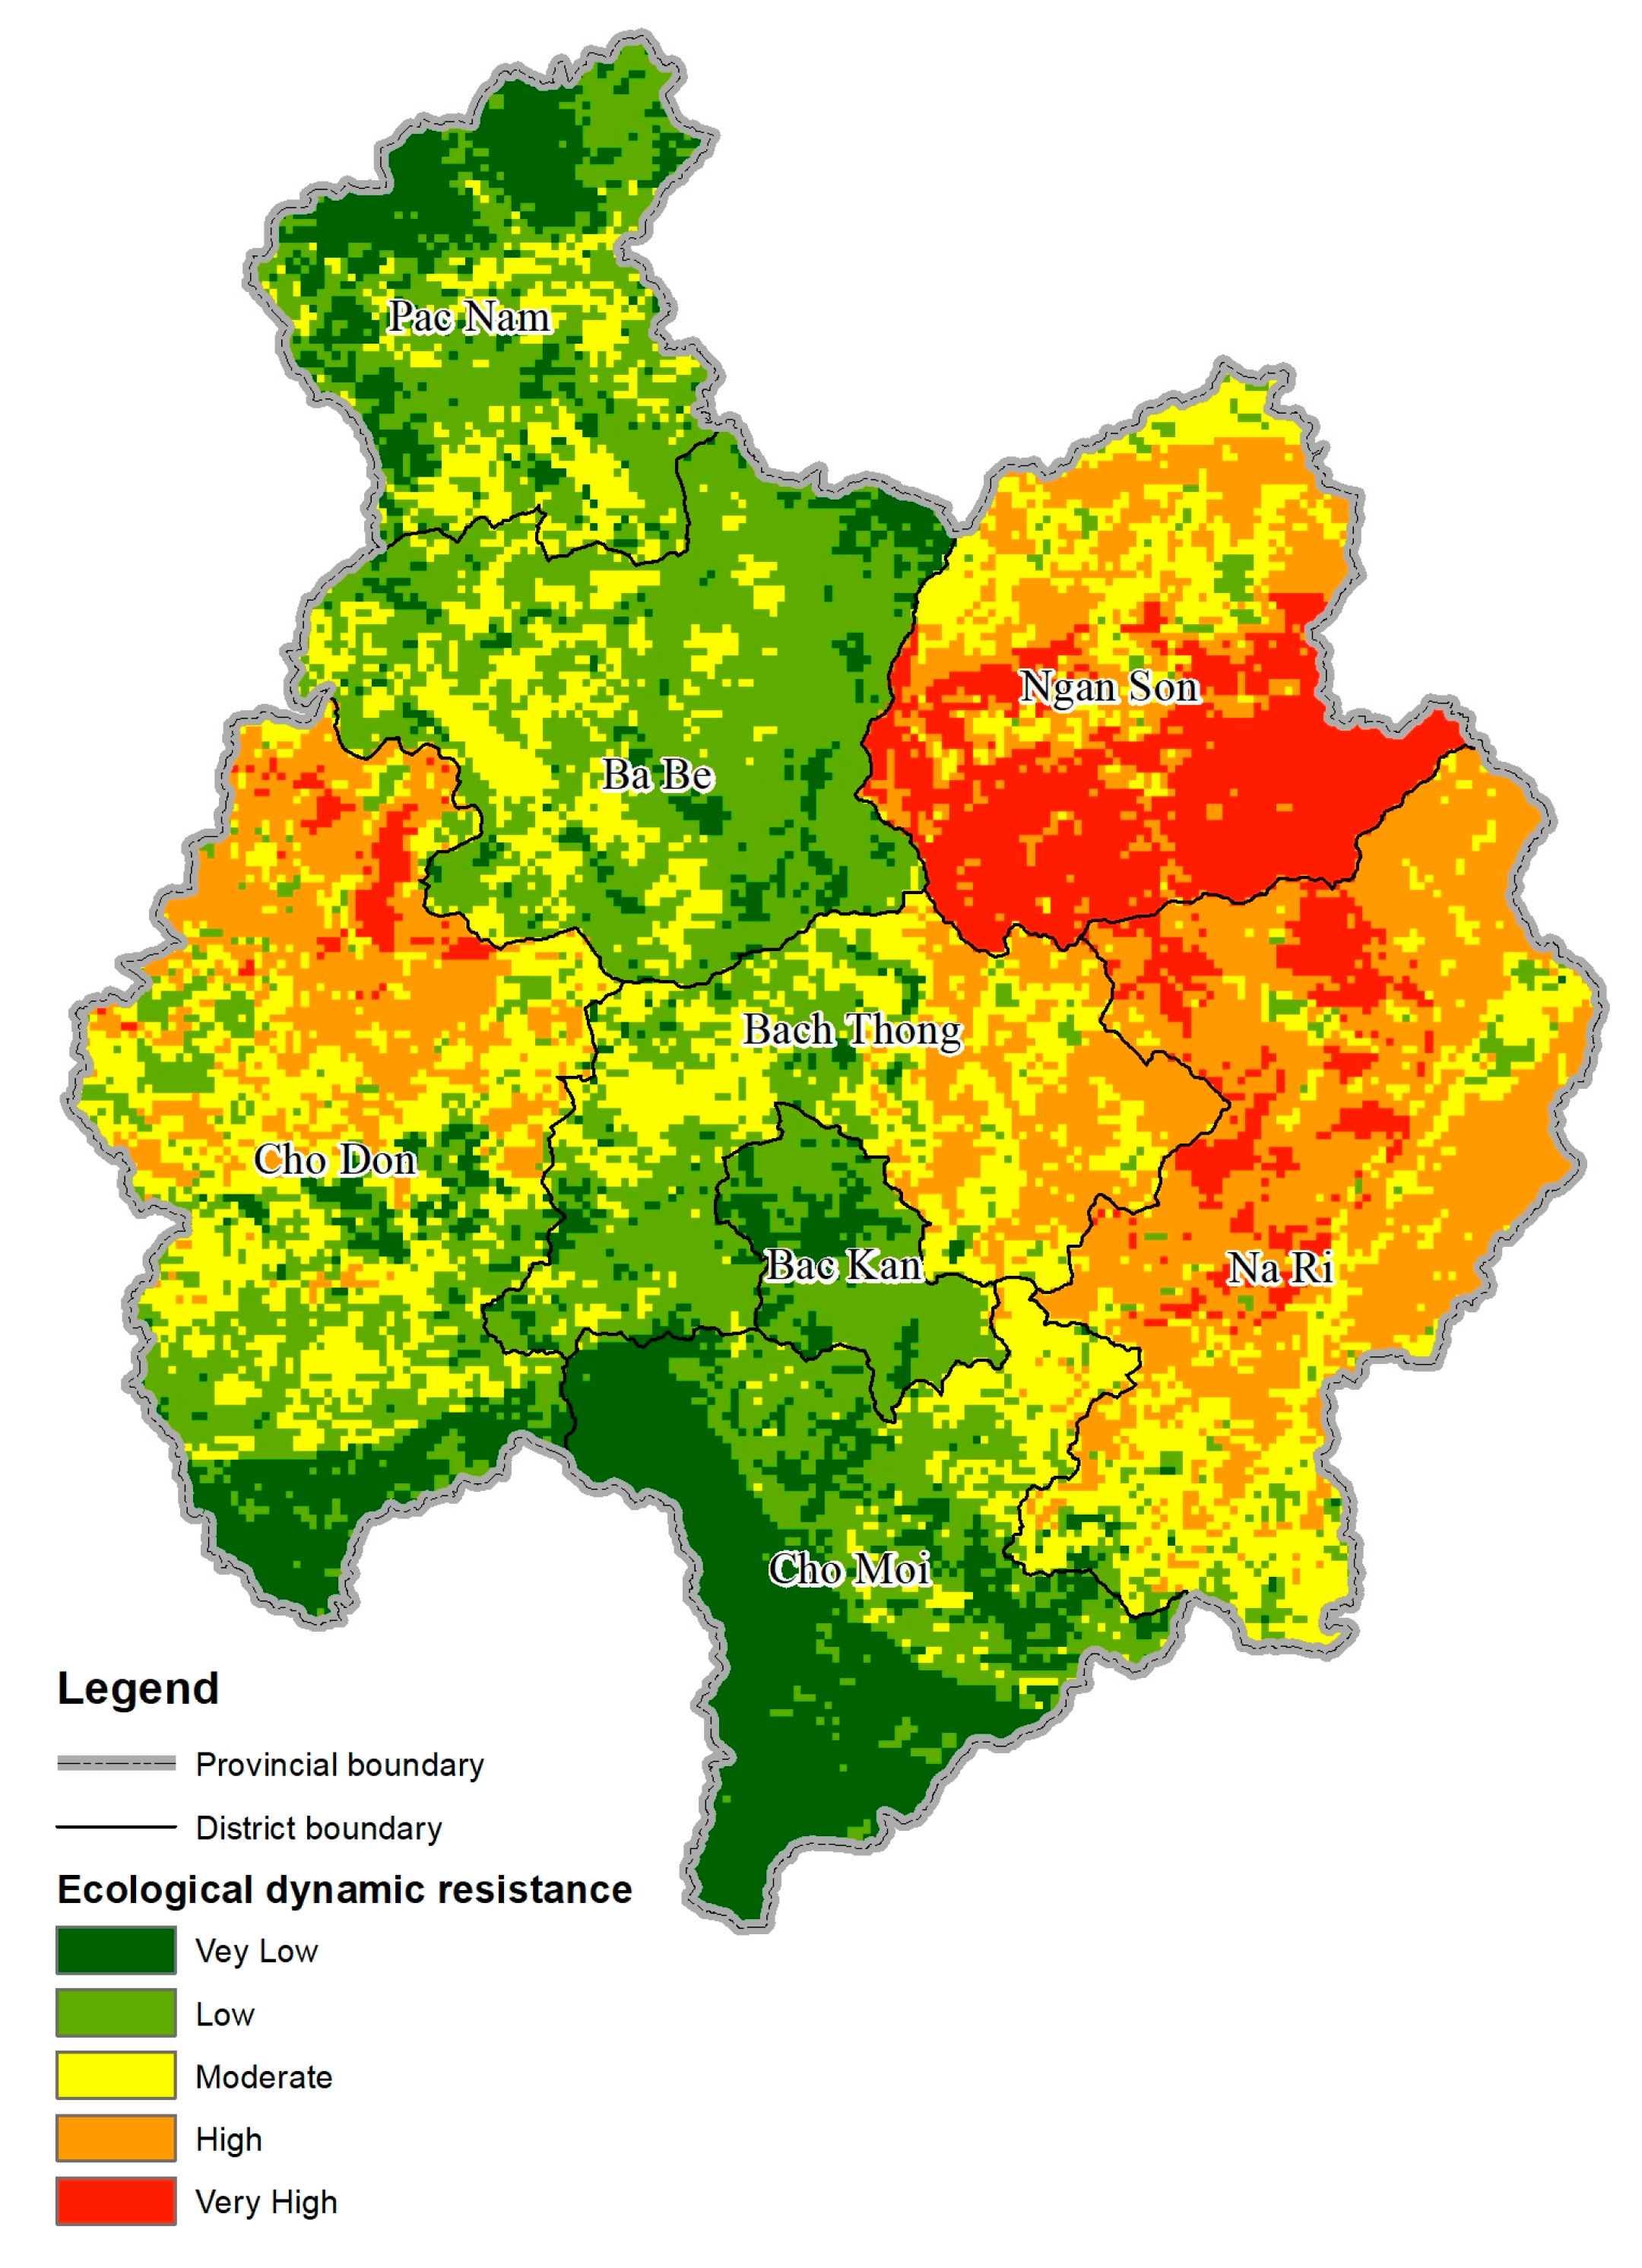
(3) Ecological dynamics resistance assessment
The ecological dynamics resistance applies the concept of ecological resilience based on ecological circulation theory and taking great human disturbance into account for representing the temporal dynamic characteristics of a natural ecosystem’s self-organization and self-update using the three aspects of resistance, exposure, and interference [14]. These three aspects correspond to specific indicators include (1) vegetation stability (S1), (2) ecological sensitivity (S2), and (3) social disturbance intensity (S3), respectively. Thus, the ecological dynamics resistance (R) can be expressed as:
R   =   S 1     S 2 S 3 .
Brief information about relevant indicators of ecological resilience for ecological dynamics resistance assessment was separately summarized below.
(a) Vegetation stability (S1). Vegetation stability shows the vegetation capacity to resist interfering and sustain its condition with environmental variations [14]. In this study, vegetation stability was quantified through the variation amplitude of vegetation using the normalized difference vegetation index (NDVI) from MODIS product (MOD13Q1) with support of the TIMESAT 3.3 software (Manufacturer, City, US State abbrev. if applicable, Country). Actually, vegetation stability is the reciprocal of variation amplitude of vegetation. The lower the variation amplitude, the greater the vegetation stability, and therefore the higher the resistance to development activities [14]. In practice, the NDVI dataset of 207 scenes (23 scenes/year) between 2009 and 2018 was used to quantify the variation amplitude of vegetation. The quality of vegetation data was here used to assign the weight for adjusting the NDVI dataset based on the pixel reliability index (Table 10).
After weighting vegetation data quality, the Savitsky–Golay filtering algorithm [86] was applied to enhance the quality of the NDVI dataset. At the last step, the variation amplitude of vegetation was extracted from seasonality data and the amplitude value was then classified into 5 classes to represent the vegetation stability using a natural breaks method. The dynamic resistance level caused by this indicator has a positive relationship with its classification.
(b) Ecological sensitivity (S2). Ecological sensitivity reflects the degree to which human activities and natural changes impact on the ecosystem, as well as the degree to which regional ecological and environmental problems can possibly occur [87]. In general, ecological sensitivity is assessed using distance from important ecological functional areas or key ecological patches [88]. A shorter distance from such areas will increase the higher risk for ecosystem degradation when disturbances happen.
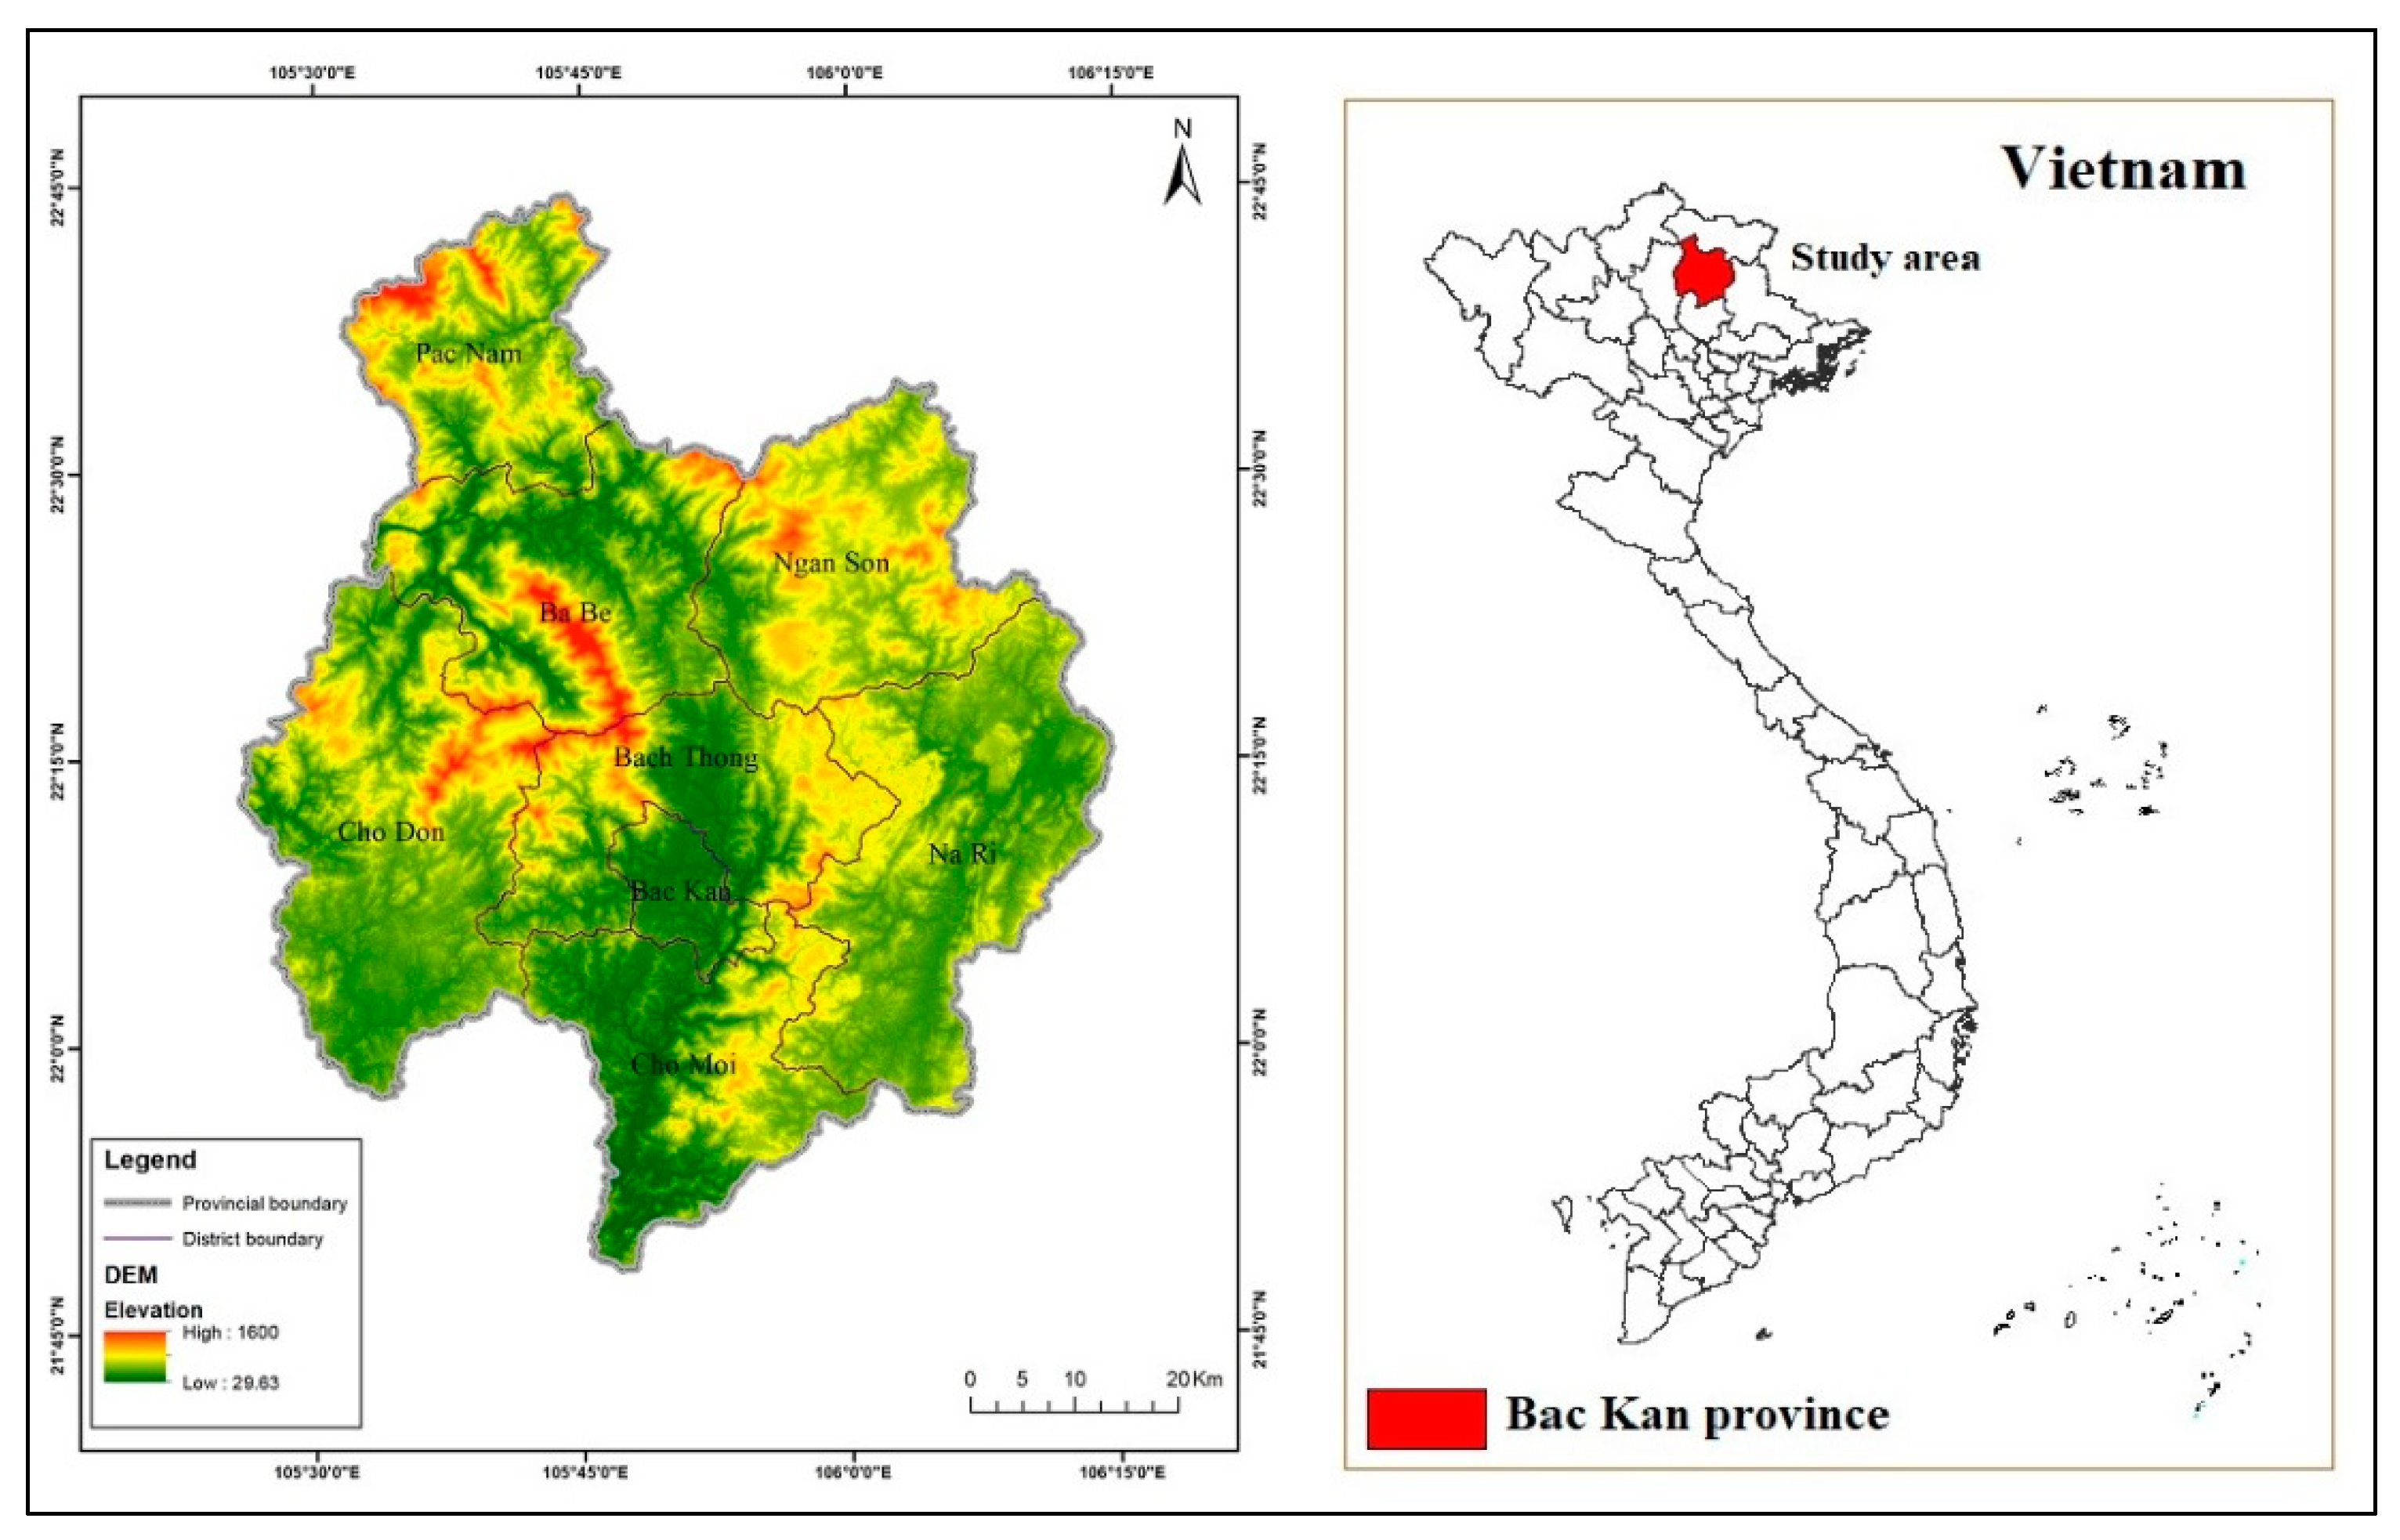
In this study, the important ecological function area in Bac Kan province that includes Ba Be National Park, Kim Hy Natural Reserve, and Nam Xuan Lac Species and Habitat Conservation Area from Bac Kan Department of Natural Resources and Environment in 2017 were first chosen to create distance surface data using the Euclidean distance method under ESRI ArcMap software (Manufacturer, City, US State abbrev. if applicable, Country), and it was then classified into 5 levels using the natural breaks method. The dynamic resistance level caused by this indicator has a positive relationship with its classification.
(c) Social disturbance intensity (S3). Social disturbance intensity refers to the spatial differentiation in the intensity of human activity in the study area, as expressed by spatial population density [14]. It was generated at the district level using the population data obtained from the People’s Committee of Bac Kan Province in 2018, and it was further classified into 5 classes using the natural breaks method. The dynamic resistance level caused by this indicator has a negative relationship with its classification.
Finally, the ecological dynamics resistance was assessed using Equation (6) and was classified into 5 levels using the natural breaks method.

2.2.3. Development Zonation and Direction for Sustainable Use of Natural Resources

The ecological suitability classification for construction and development is created based on basis of landscape ecology; it is necessary to integrate the derived ecological suitability result with the related regulations of the government in order to meet the specific condition of the province for ensuring the sustainable use of natural resources in the future. According to the construction law of Vietnam [89] and the law on the cultural heritage of Vietnam [90], the new construction and development in the protected areas including the national park, nature reserve, and species and habitat conservation areas are prohibited.
In this study, the spatial analysis was applied to assign the development zone at the provincial level while the ratio between development and ecological protection areas with the trade-off technique was used to propose a future direction for sustainable use of natural resources at the district level in Bac Kan province.
For development zonation at provincial level, the important ecological function area in Bac Kan province (Ba Be National Park, Kim Hy Nature Reserve, and Nam Xuan Lac Species and Habitat Conservation Areas) was superimposed on the ecological suitability classification map to quantify their relationships using a spatial analysis tool of ESRI ArcMap software, and the derived result was applied to define development zone into 5 categories: forbidden development zone, restricted development zone, low priority development zone, moderate priority development zone, and high priority development zone.
To propose a future direction for the sustainable use of natural resources at the district level, it is necessary to integrate development zonation with current administrative units. In this study, the moderate and high priority development zone were merged as a development area, whereas the forbidden and restricted development zone were grouped as ecological protection area. Herein, the low priority development zone was not merged into the development area or ecological protection area since this zone cannot be clearly assigned as a development area or ecological protection area. By using the trade-off technique, the percentage of development and ecological protection areas in each district was extracted, and they were used to calculate a ratio for assigning the future direction for sustainable use of natural resources of 8 districts into three categories: prior areas for conservation, comprehensive development areas, and prior areas for development.

3. Results

3.1. Significant Ecological Resistance Indicators for Construction and Development

The results of the first-round survey by using the Delphi method from 10 experts show that the rating means of 13 of 14 ecological resistance indicators for construction and development are higher than or equal to 3.5 except soil depth. To achieve a consensus among experts’ responses, the second-round survey was implemented again with all 14 indicators.
After analyzing the second-round responses, the rating mean of 12 indicators including vegetation type, soil type, elevation, slope, geological hazard frequency, distance to fracture zones, importance of biodiversity protection, importance of water retention, importance of soil conservation, vegetation stability, ecological sensitivity, and social disturbance intensity are higher than or equal to 3.5, their quartile deviations (range) are less than or equal to 0.5, and their rating variants less than 15%. Hence, 12 indicators are significant for construction and development. On the contrary, the rating means of soil depth and rock type are lower than 3.5, their quartile deviations less than or equal to 0.5, and their rating variants less than 15%, so these indicators are insignificant for construction and development.
In addition, it is not necessary to conduct the third-round survey since the consensus among experts is reached based on the rule in Table 2. Details of rating analysis from the Delphi method by 10 experts from two rounds are summarized in Table A1.
As a result, 12 ecological resistance indicators for construction and development are significant; however, vegetation type and soil type, which are the ecological elements for ecological structural resistance, are related to other indicators of ecological function and dynamics resistance. Thus, vegetation type and soil type are not applied under ecological structural resistance assessment.
In the case of vegetation type, it is used as a major input to assess ecological importance including biodiversity protection, water retention, and soil conservation under ecological functional resistance, which characterize the relationship between human demands and natural ecosystem [69]. In addition, the vegetation type is applied to assess vegetation stability and ecological sensitivity of ecological dynamics resistance, which represents the temporal dynamic characteristics of the natural ecosystem [14]. Accordingly, the vegetation type is not applied as an ecological element of ecological structural resistance assessment.
Similarly, soil type is used to estimate the potential and actual soil loss for soil conservation as an indicator of ecological functional resistance assessment. Regarding the ecological resistance evaluation for construction and development, soil conservation is more important than soil type. Therefore, soil type is not to be applied as an ecological element of ecological structural resistance assessment.
In summary, 10 indicators, which are used for ecological resistance evaluation for construction and development in this study, are elevation, slope, geological hazard frequency, distance to fracture zones, importance of biodiversity protection, importance of water retention, importance of soil conservation, ecological sensitivity, vegetation stability, and social disturbance intensity.

3.2. Ecological Structural Resistance Assessment

The final weights of four indicators for ecological structural resistance assessment include elevation, slope, geological hazard frequency, and distance to fracture zones (Figure 5) are 0.562, 0.227, 0.138, and 0.073, respectively (Table 11). The AHP provides an inconsistency value of 0.029, which is less than 0.10. This value indicates that no correction of judgments from experts is needed as suggested by [65]. In addition, the elevation is determined as the most important indicator of the ecological structural resistance, followed by slope and geological hazard frequency, whereas the distance to fracture zones is considered to be the least important indicator.
The classification of ecological structural resistance for construction and development is displayed in Figure 6 and Table 12. The high ecological structural resistance indicates areas that are unsuitable for construction and development. As a result, the spatial pattern of ecological structural resistance for construction and development is considerably dominated by low and moderate classes that cover an area of about 2524 km2 or 51.95% of the total area. In addition, the spatial pattern of the ecological structural resistance is considerably similar to elevation since it is affected by its weight under the SAW operation.

3.3. Ecological Functional Resistance Assessment

The classification of ecological functional resistance for construction and development, which was assessed based on ecological importance including (1) biodiversity protection, (2) water retention, and (3) soil conservation (Figure 7), is displayed in Figure 8 and Table 13. The high ecological functional resistance indicates areas that are unsuitable for construction and development. As a result, the spatial pattern of ecological functional resistance is considerably dominated by low and moderate classes that cover an area of about 3785 km2 or 77.91% of the total area.
In addition, the spatial pattern of the ecological functional resistance is considerably similar to biodiversity protection and water retention, whereas it is obviously different from soil conservation. Land use and land cover (LULC) types, particularly vegetation types, play an important role in biodiversity protection and water retention extraction while soil conservation is estimated by the difference of potential and actual soil losses from the USLE model. In fact, the USLE model applies five factors: rainfall erosivity, soil erodibility, topographic, cropping management, and supporting practice factors, only cropping management and supporting practice factors are directly related to LULC types. Additionally, the important level of biodiversity protection and water retention classification clearly presents the difference among their classes, whereas the important level of soil conservation classification is only dominated by one level; therefore, this indicator has the least influence under the SAW operation.

3.4. Ecological Dynamics Resistance Assessment

The classification of ecological dynamics resistance, which was assessed by ecological resilience including vegetation stability, ecological sensitivity, and social disturbance intensity (Figure 9), is displayed in Figure 10 and Table 14. The high ecological dynamics resistance indicates areas that are unsuitable for construction and development. The spatial pattern of ecological dynamics resistance is considerably dominated by low and moderate classes that cover an area of about 2604 km2 or 53.85% of the total area.
In principle, ecological dynamic resistance has a direct relationship with vegetation stability and ecological sensitivity, whereas it has an inverse relationship with social disturbance intensity (see Equation (6)). In this study, ecological sensitivity, which was extracted using distance from the important ecological function areas, clearly differentiate among their classes. On the contrary, vegetation stability classes, which were extracted using the NDVI dataset, are randomly distributed in the whole study area, while social disturbance intensity classes, which were classified using population density at the district level, are distributed based on district boundary. Therefore, the pattern of the ecological dynamic resistance is noticeably similar to ecological sensitivity, whereas it is clearly different from vegetation stability and social disturbance intensity.

3.5. Ecological Suitability Classification for Construction and Development

The classification of ecological suitability for construction and development, which was evaluated by the integration of derived resistances of ecological structure, function, and dynamics (Figure 6, Figure 8 and Figure 10, respectively) under the IER model, is displayed in Figure 11 and Table 15. The high IER index indicates areas that are unsuitable for construction and development. As a result, the most dominant ecological suitability class for construction and development is the moderately suitable class, and it accounts for about 1948 km2 or 40.30% of the total area. In addition, the spatial pattern of the ecological suitability map is considerably similar to the ecological functional resistance map. Meanwhile, the most suitable areas for construction and development in Bac Kan province according to ecological suitability classification are located in lowland areas, which are classified as very suitable and suitable classes, and they cover an area of about 1288 km2 or 26.65% of the total area. In the meantime, at the district level, suitable and very suitable classes obviously dominate in Bac Kan’s capital city and Cho Moi district.

3.6. Development Zones in Bac Kan Province

The zonation of development at the provincial level is displayed in Figure 12 and Table 16. As a result, the most dominant zone in Bac Kan province is low priority development, and it covers an area of about 1906 km2 or 39.41% of the total area while the least dominant zone is a high priority development zone, and it accounts for about 258 km2 or 5.33% of the total area.
According to zonation and ecological suitability classification, the forbidden development zone is not suitable for construction and development, and it also includes the important ecological function areas. Likewise, the restricted development zone is slightly suitable for construction and development while the low priority development zone is moderately suitable for construction and development, so development and construction activities in these areas should be strictly controlled by the local government. On the contrary, the moderate priority development zone is suitable for construction and development, whereas the high priority development zone is very suitable for construction and development. These areas cover an area of about 1573 km2 or 32.55% of the total area, and they mostly allocate in Bac Kan’s capital city, Cho Moi, and Pac Nam.

3.7. Future Direction for Sustainable Use of Natural Resources at the District Level of Bac Kan Province

Table 17 showed three future direction categories for sustainable use of natural resources of eight districts in Bac Kan province according to the ratio between development area and ecological protection area. Herein, any districts with a ratio of less than 2.0 were assigned as prior areas for conservation, and any districts with the ratio between 2.0 and 4.0 were assigned as comprehensive development areas, whereas any districts with the ratio more than 4.0 were assigned as prior areas for development. The proposed future direction map at the district level in Bac Kan province is displayed in Figure 13.
As a result, the prior areas for conservation in Bac Kan province allocate in Ngan Son, Na Ri, and Bach Thong districts, and they account for about 2045 km2 or 42.09% of the total area. The percentage of ecological protection areas in these districts is obviously higher than the percentage of the development area and the ratios of three districts vary from 0.09 to 1.02.
On the contrary, Bac Kan’s capital city and Cho Moi district belong to prior areas for development and they cover an area of about 742 km2 or 15.28% of the total area. In fact, the ratio between development area and ecological protection area in Bac Kan’s capital city and Cho Moi district are 22.73 and 10.17, respectively.
Meanwhile, Ba Be, Cho Don, and Pac Nam districts belong to comprehensive development areas and they cover an area of about 2071 km2 or 42.63% of the total area. The percentage of the development area in these districts is rather higher than the percentage of the ecological protection area and the ratios of three districts vary from 2.19 to 3.77.

4. Discussion

The IER model applied in this study focuses on the internal logic of a landscape entity that is composed of its structure, function and dynamics resistance to construction and development activities. By considering the structural stability, functional importance, and dynamic adaptability of natural ecosystems under the IER model, this study provides a comprehensive framework to identify significant ecological indicators and to evaluate the ecological resistance for construction and development in Bac Kan province. However, the study confronts some limitations because of the specific condition of the study area as well as data availability.
In principle, three fundamentals of landscape ecology, namely, structure, function, and dynamics applied in the IER model are considered to be sufficient for studying landscape ecology; however, the indicators for characterizing them have not been yet given with common agreement among researchers. In this study, only population density at the district level was applied to characterize social disturbance intensity in the whole study area. However, gross domestic product (GDP), which is a monetary measure of the market value of all the final goods and services produced in a specific time period, is another important indicator for describing social disturbance intensity is not used here due to unavailable GDP data at the district level. If this data is available, it will be useful for enhancing the result. Additionally, the spatial resolution of the collected data is not totally consistent since these data are usually produced for different purposes. However, to minimize the effect of the difference of spatial resolution, the resampling technique is applied to standardize the input data with a cell size of 30 m, the same as DEM. These data provide the highest spatial resolution in the raster dataset.
In addition, the weight assignment might introduce uncertainty into the results, since the evaluation itself was a subjective process [91,92]. However, this quantitative evaluation provides a relatively objective with scientific visualization to understand the ecological impact of construction and development and their constraints. In the future, the weight settings should be adjusted in different scenarios to obtain the optimum choice for the objective of the development plan for decision makers or policy makers.

5. Conclusions

This study showed that it is possible to select a set of indicators to characterize ecological elements, importance, and resilience using the Delphi method. This method was effectively implemented within two rounds by consulting 10 experts. As a result, 10 indicators are applied in the study include elevation, slope, geological hazard frequency, distance to fracture zones, the importance of biodiversity protection, importance of water retention, importance of soil conservation, vegetation stability, ecological sensitivity, and social disturbance intensity.
By applying the IER model, three characteristics of a landscape, which are ecological structure, function, and dynamic, were successfully assessed using ecological elements, importance, and resilience, respectively, and ecological suitability classification for construction and development in Bac Kan province was achieved with five categories based on the IER index ranging from high to low. Moreover, the zonation of development at the provincial level was conducted to classify the whole study area into five zones: high priority development, moderate priority development, low priority development, restricted development, and forbidden development. Finally, three future directions—prior areas for conservation, comprehensive development areas, and prior areas for development—were proposed for future overall planning at the district level.
In conclusion, the results of this study can be used to support decision-makers, policymakers, land use planners, and land managers. In the meantime, the presented framework of the research methodology can be used as a guideline for ecological suitability evaluation in Vietnam.

Author Contributions

Conceptualization, T.D.L. and S.O.; methodology, T.D.L. and S.O.; software, T.D.L.; validation, T.D.L. and S.O.; formal analysis, T.D.L.; investigation, T.D.L.; data curation, T.D.L.; writing—original draft preparation, T.D.L.; writing—review and editing, S.O.; supervision, S.O.

Funding

This research received no external funding.

Acknowledgments

Ph.D. scholarship under the SUT-PhD Scholarship Program for ASEAN has been granted to Trong Dai Ly and facilities support from the Suranaree University of Technology is gratefully acknowledged by the authors.

Conflicts of Interest

The authors declare no conflict of interest.

Appendix A

Table A1. The result of rating analysis in two rounds.
No.IndicatorsQuestionnaire RoundRating by Each ExpertRating MedianQuartile DeviationRating MeanRating Variant (%)
12345678910
1Vegetation typeRound 1545554455550.54.710
Round 2545544455550.54.6
2Soil typeRound 145455344554.50.54.410
Round 2454543445540.54.3
3Soil depthRound 1323343333430.1253.110
Round 2323343433430.53.2
4ElevationRound 1554445455550.54.60
Round 2554445455550.54.6
5SlopeRound 1545545455550.54.710
Round 2545545455450.54.6
6Geological hazard frequencyRound 1455545445550.54.610
Round 2555545445550.54.7
7Rock typeRound 143344343433.50.53.510
Round 2433343434330.53.4
8Distance to fracture zonesRound 1555545445550.54.70
Round 2555545445550.54.7
9Importance of biodiversity protectionRound 1454555455450.54.60
Round 2454555455450.54.6
10Importance of water retentionRound 14444444544404.110
Round 2544444454440.1254.2
11Importance of soil conservationRound 1555455445550.54.710
Round 2555555445550.1254.8
12Vegetation stabilityRound 1554555555450.1254.80
Round 2554555555450.1254.8
13Ecological sensitivityRound 1555444555550.54.70
Round 2555444555550.54.7
14Social disturbance intensityRound 1434443344440.53.710
Round 2444443344440.1253.8

References

  1. MPIV. Implementation of Sustainable Development in Vietnam; Ministry of Planning and Investment of Vietnam: Hanoi, Vietnam, 2012.
  2. MPIV. Vietnam’s Voluntary National Review on the Implementation of the Sustainable Development Goals; Ministry of Planning and Investment of Vietnam: Hanoi, Vietnam, 2018.
  3. Hansen, M.C.; Potapov, P.V.; Moore, R.; Hancher, M.; Turubanova, S.A.; Tyukavina, A.; Thau, D.; Stehman, S.V.; Goetz, S.J.; Loveland, T.R.; et al. High-Resolution Global Maps of 21st-Century Forest Cover Change. Science 2013, 342, 850. [Google Scholar] [CrossRef] [Green Version]
  4. Butler, R.A. Nigeria Has the Worst Deforestation Rate, FAO Revises Figures; mongabay.com: Menlo Park, CA, USA, 2005; p. 2006. [Google Scholar]
  5. JICA. Potential Forests and Land Related to Climate Change and Forest in Vietnam; Vietnam National University of Forestry: Hanoi, Vietnam, 2012.
  6. Khuc, Q.V.; Tran, B.Q.; Meyfroidt, P.; Paschke, M.W. Drivers of deforestation and forest degradation in Vietnam: An exploratory analysis at the national level. For. Policy Econ. 2018, 90, 128–141. [Google Scholar] [CrossRef]
  7. Van Suu, N. Industrialization and Urbanization in Vietnam: How Appropriation of Agricultural Land Use Rights Transformed Farmers’ Livelihoods in a Peri-Urban Hanoi Village? Final Rep. Eadn Individ. Res. Grant Proj. Eadn Work. Pap. 2009, 38, 1–42. [Google Scholar]
  8. Shahbaz, M.; Haouas, I.; Hoang, T.H.V. Economic growth and environmental degradation in Vietnam: Is the environmental Kuznets curve a complete picture? Emerg. Mark. Rev. 2019, 38, 197–218. [Google Scholar] [CrossRef]
  9. Zingerli, C.; Castella, J.-C.; Manh, P.; Van Cu, P. Contesting Policies: Rural Development Versus Biodiversity Conservation in the Ba Be National Park Area, Viet Nam; Agricultural Publishing House: Hanoi, Vietnam, 2002; pp. 249–275. [Google Scholar]
  10. Arouri, M.; Nguyen, C.; Youssef, A.B. Natural Disasters, Household Welfare, and Resilience: Evidence from Rural Vietnam. World Dev. 2015, 70, 59–77. [Google Scholar] [CrossRef] [Green Version]
  11. De Haen, H.; Hemrich, G. The economics of natural disasters: Implications and challenges for food security. Agric. Econ. 2007, 37, 31–45. [Google Scholar] [CrossRef] [Green Version]
  12. Ludwig, F.; Van Scheltinga, C.T.; Verhagen, J.; Kruijt, B.; van Ierland, E.C.; Dellink, R.B.; De Bruin, K.; de Bruin, K.C.; Kabat, P. Climate Change Impacts on Developing Countries-EU Accountability; European Parliament: Brussels, Belgium, 2007. [Google Scholar]
  13. Liu, X.; Liu, L.; Peng, Y. Ecological zoning for regional sustainable development using an integrated modeling approach in the Bohai Rim, China. Ecol. Model. 2017, 353, 158–166. [Google Scholar] [CrossRef]
  14. Peng, J.; Ma, J.; Du, Y.; Zhang, L.; Hu, X. Ecological suitability evaluation for mountainous area development based on conceptual model of landscape structure, function, and dynamics. Ecol. Indic. 2016, 61, 500–511. [Google Scholar] [CrossRef]
  15. Collins, M.G.; Steiner, F.R.; Rushman, M.J. Land-use suitability analysis in the United States: Historical development and promising technological achievements. Env. Manag. 2001, 28, 611–621. [Google Scholar] [CrossRef]
  16. Liu, X.; Shu, J.; Zhang, L. Research on applying minimal cumulative resistance model in urban land ecological suitability assessment: As an example of Xiamen City. Acta Ecol. Sin 2010, 30, 421–428. [Google Scholar]
  17. Zong, Y.G.; Wang, R.; Wang, C.G.; Wang, H.Y.; Zhang, L. Ecological suitability assessment on land use based on potential-constrain approach: The case of urbanized areas in Dalian city, China. Geogr. Res. 2007, 26, 1117–1127. [Google Scholar]
  18. Han, K.-T. A proposed landscape assessment framework: A connection of theories and practical techniques. J. Archit. Plan. Res. 1999, 16, 313–327. [Google Scholar]
  19. Li, B.; Zhang, F.; Zhang, L.-W.; Huang, J.-F.; Jin, Z.-F.; Gupta, D.K. Comprehensive Suitability Evaluation of Tea Crops Using GIS and a Modified Land Ecological Suitability Evaluation Model. Pedosphere 2012, 22, 122–130. [Google Scholar] [CrossRef]
  20. Yu, Z.; Xudong, C. A Study on the Choices of Construction Land Suitability Evaluation of Ecological Index. Procedia Comput. Sci. 2016, 91, 180–183. [Google Scholar] [CrossRef] [Green Version]
  21. Xu, L.; Huang, Q.; Ding, D.; Mei, M.; Qin, H. Modelling urban expansion guided by land ecological suitability: A case study of Changzhou City, China. Habitat Int. 2018, 75, 12–24. [Google Scholar] [CrossRef]
  22. Wang, C.G.; Zong, Y.G. GIS-based ecological suitability evaluation for town development used-land in Da lian city. J. Zhejiang Norm. Univ. (Nat. Sci.) 2007, 1, 109–115. [Google Scholar]
  23. Bin, Q.; He-Jian, Z.; Song-Lin, C.; Römkens, M.J.M.; Bi-Cheng, L. Land suitability assessment and land use change in Fujian Province, China. Pedosphere 2007, 17, 493–504. [Google Scholar]
  24. Kalogirou, S. Expert systems and GIS: An application of land suitability evaluation. Comput. Environ. Urban Syst. 2002, 26, 89–112. [Google Scholar] [CrossRef]
  25. Rusdi, M.; Roosli, R.; Ahamad, M.S.S. Land evaluation suitability for settlement based on soil permeability, topography and geology ten years after tsunami in Banda Aceh, Indonesia. Egypt. J. Remote Sens. Space Sci. 2015, 18, 207–215. [Google Scholar] [CrossRef] [Green Version]
  26. Ristić, V.; Maksin, M.; Nenković-Riznić, M.; Basarić, J. Land-use evaluation for sustainable construction in a protected area: A case of Sara mountain national park. J. Environ. Manag. 2018, 206, 430–445. [Google Scholar] [CrossRef]
  27. Miller, W.; Collins, M.G.; Steiner, F.R.; Cook, E. An approach for greenway suitability analysis. Landsc. Urban Plan. 1998, 42, 91–105. [Google Scholar] [CrossRef]
  28. Uy, P.D.; Nakagoshi, N. Application of land suitability analysis and landscape ecology to urban greenspace planning in Hanoi, Vietnam. Urban For. Urban Green. 2008, 7, 25–40. [Google Scholar] [CrossRef]
  29. Yan, Y.; Zhou, R.; ye, X.; Zhang, H.; Wang, X. Suitability Evaluation of Urban Construction Land Based on an Approach of Vertical-Horizontal Processes. Isprs Int. J. Geo-Inf. 2018, 7, 198. [Google Scholar] [CrossRef] [Green Version]
  30. Lemar, A.S. Zoning as taxidermy: Neighborhood conservation districts and the regulation of aesthetics. Ind. Lj 2015, 90, 1525. [Google Scholar]
  31. Fischel, W.A. Zoning and land use regulation. Encycl. Law Econ. 2000, 2, 403–423. [Google Scholar]
  32. Korlena, K.; Djunaedi, A.; Probosubanu, L.; Ismail, N. Zoning Regulation as Land Use Control Instrument: Lesson Learned from United States of America and Singapore; Forum teknik: Yogyakarta, Indonesia, 2010. [Google Scholar]
  33. Jepson, E.J.; Haines, A.L. Zoning for Sustainability: A Review and Analysis of the Zoning Ordinances of 32 Cities in the United States. J. Am. Plan. Assoc. 2014, 80, 239–252. [Google Scholar] [CrossRef] [Green Version]
  34. BKPC. Bac Kan Annual Development Report; Bac Kan People’s Committee: Bac Kan, Vietnam, 2016.
  35. Luan, C. Difficulties in Construction Management of Spontaneous Residential Areas in Bac Kan (in Vietnamese). Available online: https://vov.vn/kinh-te/dia-oc/kho-khan-trong-quan-ly-xay-dung-cac-khu-dan-cu-tu-phat-o-bac-kan-892270.vov (accessed on 30 March 2019).
  36. Tue, C. Landslide Killed Two Siblings in Bac Kan (in Vietnamese). Available online: https://tuoitre.vn/sat-lo-dat-lam-hai-chi-em-ruot-tu-vong-o-bac-kan-20190315092134798.htm (accessed on 15 March 2019).
  37. ANTV. Rampant Illegal Construction in Ba Be National Park (in Vietnamese). Available online: http://www.antv.gov.vn/tin-tuc/xa-hoi/xay-dung-trai-phep-tran-lan-tai-vuon-quoc-gia-ba-be-280454.html (accessed on 16 May 2019).
  38. Giang, P.H. Environment pollution in Bac Kan: Status, causes, and solutions for overcoming. J. Sci. Technol. Thai Nguyen Univ. 2011, 87, 107–110. [Google Scholar]
  39. Ha, N.T.V. Valuing the Economic Risk of Loss in People and Assets Due to a Landslide in Bắc Kạn Town. Vnu Univ. Econ. Bus. 2014, 30, 26–35. [Google Scholar]
  40. BKPC. Land Degradation Investigation Report; Bac Kan People‘s Committee: Bac Kan, Vietnam, 2015.
  41. Vu, D.T. Application of Remote Sensing and GIS in Soil Erosion Study in Bac Kan Province; Vietnam National University: Hanoi, Vietnam, 2011. [Google Scholar]
  42. Ha, N.M. Survey and Assess the Actual Water Pollution in Cau River in Bac Kan Province; Thai Nguyen University of Agriculture and Forestry: Thai Nguyen, Vietnam, 2011. [Google Scholar]
  43. Them, N.T. Study on the Impact of Gold Mining on Water Environment in Bac Giang River Flowing through Na Ri District, Bac Kan Province; Thai Nguyen University of Agriculture and Forestry: Thai Nguyen, Vietnam, 2013. [Google Scholar]
  44. Secretariat, R. The list of wetlands of international importance. In Proceedings of Secretariat of the Convention on Wetlands; RAMSAR Secretariat: Gland, Switzerland, 2013. [Google Scholar]
  45. BKPC. Annual Report on Mineral Resources; Bac Kan Department of Natural Resourses and Environment, Bac Kan People’s Committee: Bac Kan, Vietnam, 2017.
  46. Cuhls, K. Delphi surveys. In Teaching Material for UNIDO Foresight Seminars; United Nations Industrial Development Organization: Vienna, Austria, 2005. [Google Scholar]
  47. Barzekar, G.; Aziz, A.; Mariapan, M.; Ismail, M.H. Delphi technique for generating criteria and indicators in monitoring ecotourism sustainability in Northern forests of Iran: Case study on Dohezar and Sehezar Watersheds. Folia For. Pol. 2011, 53, 130–141. [Google Scholar]
  48. Doruk, Ö.T.; Gönüllü, O.; Hacıefendioğlu, Ş.; Duran, M.; Kanbak, A.; Kenan Lopcu, S.Ç.; Kayhan, A.; Duygu Şenbel Eser, G.G.; Tuncay Bilecen, M.S.A.; Murat Aydın, H.E.Ç. “Logic” of Our Age: The Individual and Society in the Market’s Grasp; IJOPEC Publication: London, UK, 2015. [Google Scholar]
  49. Dalkey, N.; Helmer, O. An experimental application of the Delphi method to the use of experts. Manag. Sci. 1963, 9, 458–467. [Google Scholar] [CrossRef]
  50. Schutsky, K.; Kaufman, S.; Signell, S. The ABCs of Ecology: An Educator’s Guide to Learning Outside; Ecology Education: Simpson Road Saco, ME, USA, 2006. [Google Scholar]
  51. Coleman, D.C.; Callaham, M.A.; Crossley, D.A. Chapter 7—Soil Biodiversity and Linkages to Soil Processes. In Fundamentals of Soil Ecology, 3rd ed.; Coleman, D.C., Callaham, M.A., Crossley, D.A., Eds.; Academic Press: London, UK, 2018; pp. 233–253. [Google Scholar] [CrossRef]
  52. John, B. Chapter 2—Importance of Geological Studies in Earthquake Hazard Assessment. In Integrating Disaster Science and Management; Samui, P., Kim, D., Ghosh, C., Eds.; Elsevier: Amsterdam, The Netherlands, 2018; pp. 27–40. [Google Scholar] [CrossRef]
  53. DiPietro, J.A. Chapter 3—Component: The Rock/Sediment Type. In Geology and Landscape Evolution, 2nd ed.; DiPietro, J.A., Ed.; Elsevier: Amsterdam, The Netherlands, 2018; pp. 23–40. [Google Scholar] [CrossRef]
  54. Indra, P.; Nikhil, D. Engineering Significance of Fault—A Geotechnical Review of Narmada Dam Base Fault. In Proceedings of the Indian Geotechnical Conference, Allahabad, India, 20–22 December 2002. [Google Scholar]
  55. McDonald, R.I. Implications of Urbanization for Conservation and Biodiversity Protection. In Encyclopedia of Biodiversity, 2nd ed.; Levin, S.A., Ed.; Academic Press: Waltham, MA, USA, 2013; pp. 231–244. [Google Scholar] [CrossRef]
  56. Peili, S.; Bo, W.; Genwei, C.; Ji, L. Water retention capacity evaluation of main forest vegetation types in the upper Yangtze basin. J. Nat. Resour. 2004, 19, 351–360. [Google Scholar]
  57. Peng, J.; Li, D.; Zhang, Y. Analysis of spatial characteristics of soil erosion in mountain areas of northwestern Yunnan based on GIS and RUSLE. J. Mt. Sci. 2007, 25, 548. [Google Scholar]
  58. Gunderson, L.H. Ecological Resilience--In Theory and Application. Annu. Rev. Ecol. Syst. 2000, 31, 425–439. [Google Scholar] [CrossRef] [Green Version]
  59. Belov, A.V.; Sokolova, L.P. Vegetation stability in the system of geobotanical forecasting. Geogr. Nat. Resour. 2008, 29, 124–131. [Google Scholar] [CrossRef]
  60. Chi, Y.; Zhang, Z.; Gao, J.; Xie, Z.; Zhao, M.; Wang, E. Evaluating landscape ecological sensitivity of an estuarine island based on landscape pattern across temporal and spatial scales. Ecol. Indic. 2019, 101, 221–237. [Google Scholar] [CrossRef]
  61. Hai, L.T.; Hai, P.H.; Khoa, N.T.; Hens, L. Indicators for sustainable development in the Quang Tri province, Vietnam. J. Hum. Ecol. 2009, 27, 217–227. [Google Scholar] [CrossRef]
  62. Chu, H.-C.; Hwang, G.-J. A Delphi-based approach to developing expert systems with the cooperation of multiple experts. Expert Syst. Appl. 2008, 34, 2826–2840. [Google Scholar] [CrossRef]
  63. Benmouss, K.; Laaziri, M.; Khoulji, S.; Kerkeb, M.L.; El Yamami, A. AHP-based Approach for Evaluating Ergonomic Criteria. Procedia Manuf. 2019, 32, 856–863. [Google Scholar] [CrossRef]
  64. Wind, Y.; Saaty, T.L. Marketing applications of the analytic hierarchy process. Manag. Sci. 1980, 26, 641–658. [Google Scholar] [CrossRef]
  65. Adams, W.; Saaty, R. Super decisions software guide. Super Decis. 2003, 9, 43. [Google Scholar]
  66. Allen, D.W. GIS Tutorial 2: Spatial Analysis Workbook; Esri Press: Redlands, CA, USA, 2010; p. 450. [Google Scholar]
  67. Hung, L.Q. Landslide Inventory and Mapping at 1:50.000 Scale in Bac Kan Province; Vietnam Institute of Geosciences and Mineral Resources: Hanoi, Vietnam, 2014; p. 138. [Google Scholar]
  68. Malczewski, J. GIS and Multicriteria Decision Analysis; John Wiley & Sons, Inc.: Hoboken, NJ, USA, 1999. [Google Scholar]
  69. Xiao, D.; Chen, W. On the basic concepts and contents of ecological security. Chin. J. Appl. Ecol. 2002, 13, 354–358. [Google Scholar]
  70. Hai, V.D. Effect of forests on water regulation and soil erosion control. In Proceedings of the International Expert Meeting on Forests and Water, Shiga, Japan, 20–22 November 2002. [Google Scholar]
  71. Wischmeier, W.H.; Smith, D.D. Predicting Rainfall Erosion Losses-A Guide to Conservation Planning; United States Department of Agricultural: Washington, DC, USA, 1978.
  72. Gitas, I.Z.; Douros, K.; Minakou, C.; Silleos, G.N.; Karydas, C.G. Multi-temporal soil erosion risk assessment in N. Chalkidiki using a modified USLE raster model. Earsel Eproceedings 2009, 8, 40–52. [Google Scholar]
  73. Parveen, R.; Kumar, U. Integrated approach of universal soil loss equation (USLE) and geographical information system (GIS) for soil loss risk assessment in Upper South Koel Basin, Jharkhand. J. Geogr. Inf. Syst. 2012, 4, 588. [Google Scholar] [CrossRef] [Green Version]
  74. Yu, B.; Rosewell, C.J. Technical notes: A robust estimator of the R-factor for the universal soil loss equation. Trans. Asae 1996, 39, 559–561. [Google Scholar] [CrossRef]
  75. Nguyen, T.H. Identify the Factors Effect to Soil Erosion and Forecast Soil Erosion on Slope Land. Ph.D. Dissertation, Water Resources University of Vietnam, Hanoi, Vietnam, 1996. [Google Scholar]
  76. Ranzi, R.; Le, T.H.; Rulli, M.C. A RUSLE approach to model suspended sediment load in the Lo River (Vietnam): Effects of reservoirs and land use changes. J. Hydrol. 2012, 422–423, 17–29. [Google Scholar] [CrossRef]
  77. Vezina, K.; Bonn, F.; Van, C.P. Agricultural land-use patterns and soil erosion vulnerability of watershed units in Vietnam’s northern highlands. Landsc. Ecol. 2006, 21, 1311–1325. [Google Scholar] [CrossRef]
  78. Pham, H. Evaluating potential of soil loss erosion in the Ba Be lake basin in Vietnam. Proj. Hanoi-Vietnam 2007, 3, 15–58. (In Vietnamese) [Google Scholar]
  79. Moore, I.D.; Burch, G.J. Physical Basis of the Length-slope Factor in the Universal Soil Loss Equation1. Soil Sci. Soc. Am. J. 1986, 50, 1294–1298. [Google Scholar] [CrossRef]
  80. Mitasova, H.; Mitas, L. Multiscale soil erosion simulations for land use management. In Landscape Erosion and Evolution Modeling; Springer: Boston, MA, USA, 2001; pp. 321–347. [Google Scholar]
  81. Van der Knijff, J.M.; Jones, R.J.A.; Montanarella, L. Soil Erosion Risk: Assessment in Europe; European Soil Bureau, European Commission Brussels: Bruxelles, Luxembourg, 2000. [Google Scholar]
  82. Biesemans, J.; Van Meirvenne, M.; Gabriels, D. Extending the RUSLE with the Monte Carlo error propagation technique to predict long-term average off-site sediment accumulation. J. Soil Water Conserv. 2000, 55, 35–42. [Google Scholar]
  83. Pham, T.G.; Degener, J.; Kappas, M. Integrated universal soil loss equation (USLE) and Geographical Information System (GIS) for soil erosion estimation in A Sap basin: Central Vietnam. Int. Soil Water Conserv. Res. 2018, 6, 99–110. [Google Scholar] [CrossRef]
  84. Shin, G.J. The Analysis of Soil Erosion Analysis in Watershed Using GIS; Gang-won National University: Chuncheon-si, Gangwon-do, Korea, 1999. [Google Scholar]
  85. Didan, K.; Munoz, A.B.; Solano, R.; Huete, A. MODIS Vegetation Index User’s Guide (MOD13 Series); Vegetation Index and Phenology Lab, The University of Arizona: Tucson, AZ, USA, 2015; pp. 1–38. [Google Scholar]
  86. Eklundh, L.; Per, J. TIMESAT 3.3 With Seasonal Trend Decomposition and Parallel Processing Software Manual; Lund and Malmö University: Lund, Sweden, 2017. [Google Scholar]
  87. Ouyang Zhi Yun, W.; Ke, X.; Hong, M. China’s eco-environmental sensitivity and its spatial heterogeneity. Acta Ecol. Sin. 2000, 1, 9–12. [Google Scholar]
  88. Li, Y.; Shi, Y.; Qureshi, S.; Bruns, A.; Zhu, X. Applying the concept of spatial resilience to socio-ecological systems in the urban wetland interface. Ecol. Indic. 2014, 42, 135–146. [Google Scholar] [CrossRef]
  89. NAV. The construction law. In 50/2014/QH13; Assembly, T.N., Ed.; The National Assembly: Hanoi, Vietnam, 2014. [Google Scholar]
  90. NAV. The law on cultural heritage. In 28/2001/QH10; Assembly, T.N., Ed.; The National Assembly: Hanoi, Vietnam, 2001. [Google Scholar]
  91. Chen, Y.; Yu, J.; Khan, S. Spatial sensitivity analysis of multi-criteria weights in GIS-based land suitability evaluation. Environ. Model. Softw. 2010, 25, 1582–1591. [Google Scholar] [CrossRef]
  92. Liu, Y.; Peng, J.; Han, Y.; Wei, H.; Du, Y. Suitability assessment for building land consolidation on gentle hillside based on OWA operator: A case in dali bai nationality borough in Yunnan, China. Shengtai Xuebao/Acta Ecol. Sin. 2014, 34, 3188–3197. [Google Scholar] [CrossRef] [Green Version]
Figure 1. Location of the study area.
Applsci 09 05351 g001
Figure 2. The workflow of research methodology.
Applsci 09 05351 g002
Figure 3. Spatial distribution of USLE factor maps: (a) rainfall erosivity factor (R), (b) soil erodibility factor (K), (c) topographic factor (LS), (d) cropping management factor (C), and (e) supporting practice factor (P).
Applsci 09 05351 g003
Figure 4. Spatial distribution of potential soil loss (a) and actual soil loss (b) for soil conservation extraction.
Applsci 09 05351 g004
Figure 5. Spatial distribution of ecological elements for ecological structural resistance assessment: (a) elevation, (b) slope, (c) geological hazard frequency, and (d) distance to fracture zones.
Applsci 09 05351 g005
Figure 6. Spatial distribution of ecological structural resistance for construction and development.
Applsci 09 05351 g006
Figure 7. Spatial distribution of ecological importance for ecological functional resistance assessment: (a) biodiversity protection, (b) water retention, and (c) soil conservation.
Applsci 09 05351 g007
Figure 8. Spatial distribution of ecological functional resistance for construction and development.
Applsci 09 05351 g008
Figure 9. Spatial distribution of ecological resilience for ecological dynamics resistance assessment: (a) vegetation stability, (b) ecological sensitivity, and (c) social disturbance intensity.
Applsci 09 05351 g009
Figure 10. Spatial distribution of ecological dynamic resistance for construction and development.
Applsci 09 05351 g010
Figure 11. The ecological suitability map for construction and development.
Applsci 09 05351 g011
Figure 12. The development zonation map of Bac Kan province.
Applsci 09 05351 g012
Figure 13. The proposed future direction at the district level in Bac Kan province.
Applsci 09 05351 g013
Table 1. Criteria and indicators of ecological resistance for construction and development.
CriteriaIndicatorReference
Ecological elements1. Vegetation type[50]
2. Soil type[51]
3. Soil depth[51]
4. Elevation[14]
5. Slope[14]
6. Geological hazard frequency[52]
7. Rock type[53]
8. Distance to fracture zones[54]
Ecological importance9. Importance of biodiversity protection[55]
10. Importance of water retention[56]
11. Importance of soil conservation[57]
Ecological resilience12. Vegetation stability[58,59]
13. Ecological sensitivity[58,60]
14. Social disturbance intensity[14,58]
Table 2. Rules to analyze the ratings from multiple experts using a Delphi method.
Round t for Delphi QuestionnaireRound t + 1Round t + 2
Rating mean (qi) ≥ 3.5If rating mean (qi) ≥ 3.5 and Q ≤ 0.5 and rating variant (qi) < 15%, then, qi is accepted, and no further discussion concerning qi is needed.
Rating mean (qi) < 3.5Rating mean (qi) ≥ 3.5 or rating variant (qi) > 15%If rating mean (qi) ≥ 3.5 and Q ≤ 0.5 and rating variant (qi) ≤ 15%, then qi is accepted, and no further discussion concerning qi is needed
Rating mean (qi) < 3.5If rating mean (qi) < 3.5 and Q ≤ 0.5 and rating variant (qi) ≤ 15%, then qi is rejected, and no further discussion concerning qi is needed
From: [62].
Table 3. The relative important classification of biodiversity protection.
The Important Level of Biodiversity ProtectionDescriptionLand Use Types
1Slightly importantConstruction land and unused land
2Low importantFarmland
3Moderately importantShrub and grassland
4Very importantPlantation forest
5Extremely importantNatural forest
Table 4. Vegetation types and soil humidity at different soil depth levels.
Vegetation TypeSoil Humidity (%) at the Soil Depth (cm)
0–520–2540–4560–65
1. Bare land6.8314.2125.5727.32
2. Savanna and bushes23.5227.5930.8631.16
3. Rehabilitated forest after slash and burn cultivation with a crown cover of 70–80%24.7529.0630.2432.55
4. Three-stories forest with a crown cover of 70–80%29.5632.7434.7933.58
5. One-story forest without ground vegetative with a crown cover of 70–80%26.2128.1928.6127.42
6. Three-stories forest with a crown cover of 70–80%33.7935.9435.9834.37
7. Two-stories forest with a crown cover of 70–80%31.9833.5934.1234.21
8. Bamboo forest with a crown cover of 70–80%18.8220.2021.7822.60
9. Imperata cylindrica savanna8.1615.2212.8312.98
Source: [70].
Table 5. The capability of rainfall interception and forest types.
Forest Structural TypesForest Cover (%)Number of StoriesRainfall Intercepted by the Canopy (%)
1. Forest after rational selective logging with enough rehabilitation time.70–80311.67
2. Depleted forest 30–4015.72
3. Young forest with enough rehabilitation time70–80210.34
4. Young forest after tending by the old way (total clearance of ground vegetation cover)70–8016.91
5. Forest rehabilitated after slash and burn cultivation70–8029.51
6. Bamboo forest 70–8018.96
Source: [70].
Table 6. Classification of the relative importance of water retention.
The Important Level of Water RetentionDescriptionVegetation Types
1Slightly importantNon-forested land
2Low importantYoung afforested land, non-stumpage forests, nurseries, grazing land, agricultural land, and land suitable for afforestation
3Moderately importantShrubland, economic forests, and thin forests
4Very importantNeedle forests
5Extremely importantBroadleaf forests and bamboo
Table 7. Soil erodibility K factor.
No.Soil TypesK FactorSource
1Fluvisols0.055[77]
2Regosols0.025[77]
3Leptosols0.028[77]
4Cambisols0.050[77]
5Alisols0.045[77]
6Phaozems0.065[77]
7Ferralitic humus from limestone0.033[78]
8Ferralitic yellow-red from limestone0.021[78]
9Ferralitic humus from acid stone0.030[78]
10Ferralitic humus yellow-red from granite stone0.028[78]
12Ferralitic yellow-red from acid stone0.027[78]
13Silt0.024[78]
14Ferralitic red-brown from gabbro stone0.027[78]
15Ferralitic from typical limestone0.026[78]
Table 8. Cropping management factor (C).
No.Land Use TypesC Factor
1Evergreen broadleaf forest 0.003
2Bamboo and wood mixed forest0.003
3Shrub and grassland0.18
4Plantation forest0.003
5Perennial tree and orchard0.5
6Paddy field and field crop0.5
7Residential area0.0
8Water surface0.0
Table 9. Supporting practice factor (P).
Group of Land Use TypesSlope (Degree)
0–55–88–1010–15>15
Evergreen broadleaf forest, bamboo, and wood mixed forest, shrub and grassland, and water surface1.001.001.001.001.00
Plantation forest, perennial tree and orchard0.550.600.800.901.00
Paddy field and field crop0.270.300.400.450.50
Residential area0.0030.0030.0030.0030.003
Table 10. Details of the pixel reliability data and weighting.
Pixel ReliabilityWeight
Rank KeyImage Quality Assessment (QA)
1Good Data1.0
2Marginal data0.5
3Cloud0.1
Sources: [85].
Table 11. Comparison matrix and weight for four indicators.
IndicatorsElevationSlopeGeological Hazard FrequencyDistance to Fracture ZonesWeight
Elevation13.24.45.50.562
Slope 123.40.227
Geological hazard frequency 12.50.138
Distance to fracture zones 10.073
Inconsistency value: 0.029.
Table 12. Area and percentage of ecological structural resistance for construction and development.
Resistance ClassDescriptionResistance ValueArea (km2)Area (%)
1Very low1–1.817898.21918.49
2Low1.817–2.3631254.63925.82
3Moderate2.363–2.9081269.60026.13
4High2.908–3.483962.15819.80
5Very high3.483–4.861473.9989.76
Table 13. Area and percentage of ecological functional resistance for construction and development.
ClassClass NameResistance ValueArea (km2)Area (%)
1Very low3–5383.6777.90
2Low5–82296.99047.27
3Moderate8–10 1488.71330.64
4High10–11680.14914.00
5Very high11–159.0810.19
Table 14. Area and percentage of ecological dynamic resistance for construction and development.
ClassClass NameResistance ValueArea (km2)Area (%)
1Very Low0.333–1.592747.59115.46
2Low1.592–3.3321443.55629.85
3Moderate3.332–6.6211160.49224.00
4High6.621–10.0271062.17021.97
5Very High10.027–25.226421.6928.72
Table 15. Area and percentage of ecological suitability for construction and development.
ClassClass NameIER IndexArea (km2)Area (%)
1Not Suitable3.63–4.95259.8635.37
2Slightly Suitable2.98–3.631338.52127.68
3Moderately Suitable2.31–2.981948.28640.30
4Suitable1.64–2.311022.49421.15
5Very Suitable0.99–1.64265.7195.50
Table 16. Area and percentage of development zones of Bac Kan province.
Zone NameArea (km2)Area (%)
Forbidden development zone 389.678.06
Restricted development zone 966.0119.98
Low priority development zone1905.5339.41
Moderate priority development zone1315.9527.22
High priority development zone257.535.33
Table 17. Future direction at the district level in Bac Kan province.
Future DirectionDistrictArea (km2)Development Area (%)Ecological Protection Area (%)Ratio 1
Prior areas for conservationNgan Son645.365.2858.880.09
Na Ri853.1516.2630.640.53
Bach Thong546.3925.9825.361.02
Comprehensive development areasBa Be683.2436.1916.512.19
Cho Don911.0332.8614.532.26
Pac Nam476.7343.8611.623.77
Prior areas for developmentCho Moi605.4164.816.3710.17
Bac Kan 137.0280.643.5522.73
1 The ratio of the development area to the ecological protection area.

