Article

The Conundrum of Relaxation Volumes in First-Principles Calculations of Charged Defects in UO2

by
Anuj Goyal
1,†,
Kiran Mathew
1,
Richard G. Hennig
1,
Aleksandr Chernatynskiy
2,
Christopher R. Stanek
3,
Samuel T. Murphy
4,
David A. Andersson
3,
Simon R. Phillpot
1 and
Blas P. Uberuaga
3,*
1
Department of Materials Science and Engineering, University of Florida, Gainesville, FL 32611, USA
2
Department of Physics, Missouri University of Science and Technology, Missouri University of Science and Technology, Rolla, MO 65409, USA
3
Materials Science and Technology Division, Los Alamos National Laboratory, Los Alamos, NM 87545, USA
4
Engineering Department, Lancaster University, Bailrigg, Lancaster LA1 4YW, UK
*
Author to whom correspondence should be addressed.
Current Address: Metallurgical and Materials Engineering, Colorado School of Mines, Golden, CO 80401, USA.
Appl. Sci. 2019, 9(24), 5276; https://doi.org/10.3390/app9245276
Submission received: 12 November 2019 / Revised: 29 November 2019 / Accepted: 1 December 2019 / Published: 4 December 2019

Abstract

:
The defect relaxation volumes obtained from density-functional theory (DFT) calculations of charged vacancies and interstitials are much larger than their neutral counterparts, seemingly unphysically large. We focus on UO2 as our primary material of interest, but also consider Si and GaAs to reveal the generality of our results. In this work, we investigate the possible reasons for this and revisit the methods that address the calculation of charged defects in periodic DFT. We probe the dependence of the proposed energy corrections to charged defect formation energies on relaxation volumes and find that corrections such as potential alignment remain ambiguous with regards to its contribution to the charged defect relaxation volume. We also investigate the volume for the net neutral defect reactions comprising individual charged defects, and find that the aggregate formation volumes have reasonable magnitudes. This work highlights the issue that, as is well-known for defect formation energies, the defect formation volumes depend on the choice of reservoir. We show that considering the change in volume of the electron reservoir in the formation reaction of the charged defects, analogous to how volumes of atoms are accounted for in defect formation volumes, can renormalize the formation volumes of charged defects such that they are comparable to neutral defects. This approach enables the description of the elastic properties of isolated charged defects within an overall neutral material.

1. Introduction

Charged defects in non-metals, such as semiconductors and insulators, play a central role in determining electronic and electrical behavior of materials for semiconductor and battery applications [1]. Point defects are also very relevant to actinide materials such as UO2 under extreme conditions of temperature, pressure, and irradiation, as they play a major role in accommodating stoichiometry variations [2]. In addition, defects induce lattice distortions in the perfect crystal, leading to changes in volume which can, at least in principle, be measured experimentally [3,4] and compared to theoretical calculations [4,5,6,7,8,9]. These lattice distortions are particularly important in determining the interaction of defects with external strains, dislocations, and grain boundaries [10,11], and play a central role in the evolution of microstructures in materials.
The defect formation volume is an intrinsic property of the defect; theory for computing the volume change due to point defects gained attention in the early 1980s with a focus on point defects in ionic crystals [5,6]. It is important to note that experimental measurements of the volume change associated with point defects yield the defect-averaged response of a mass and charge balanced system [3,4,5,6]; as a result there is little understanding of the volume change or lattice distortion associated with individual charged defects. Investigations of the formation volume of charged point defects in UO2 [9], Si [12,13,14,15], ZnO [16], In2O3 [17], CeO2 [18], SrTiO3 [4,19] indicate that the defect formation volume is a strong function of the charge state of the defect, and as electrons are added (or removed) to the system the formation volume increases (or decreases) linearly with charge.
Defect formation and relaxation volumes are closely related concepts. The defect relaxation volume is simply the change in volume of a computational cell due to relaxation of the crystal lattice around the defect site. By contrast, the defect formation volume is calculated as the change in the volume associated with the formation reaction for the defect; it, therefore, accounts for the reference volume associated with the reservoir to or from which atom(s) are moved in order to create the defect in the simulation. We describe defect relaxation and formation volume and the differences between the two in more detail in Section 2.2.
The theory of relaxation volume and lattice relaxation around the defect site can be used to obtain the so-called defect elastic dipole tensor [20,21], which relates the atomic structure of the point defect with its elastic distortion of the lattice. The elastic dipole tensor [7,20,22], Gij, captures the symmetry of the point defect and is given as:
G i j = C i j k l Δ Ω k l r
where C i j k l is the elastic constant tensor, and Δ Ω k l r is the relaxation volume tensor of the defect [23]. The elastic dipole tensor describes the change in formation energy of the defect, to first order, in the presence of external strains [10]. Therefore, computation of the defect relaxation volume tensor quantifies the lattice distortion around the defect and thus the elastic interaction with other defects and strain fields [11,24].
An accurate description of the dipole tensor is critical for developing models of transport in complex microstructures. Real materials contain dislocations, grain boundaries, and other defect structures that can be described by elastic strain fields. The dipole tensor provides a means for relating changes in energy of a given point defect as its position varies in that strain field. Thus, the dipole tensor provides a link between atomistic calculations of defects in an ideal bulk environment and in the more realistic microstructure of the material during application, allowing one to up-scale results to more applied studies, such as irradiation-induced creep which relies on the treatment of defects interacting with the existing microstructure. To establish this link, one must be able to calculate quantitatively accurate values for the dipole tensor or, related to this, the relaxation volume of defects.
Building on our previous work on point defect behavior in the presence of external strain [11], here we find the relaxation volumes of individual charged point defects in uranium dioxide (UO2) to be much larger than those of the corresponding neutral defects. Furthermore, when we calculate the corresponding elastic dipole tensor, the predicted changes in energy of the defect under elastic strain fields are extremely large; indeed, they are so large that they seem to be unphysical. As the dipole tensor is directly related to defect relaxation volumes, this result motivates us to examine this issue in greater depth. The issue of large DFT relaxation volumes of charged defects as well as discrepancies between theory and experiments on the topic has been recognized in the past [4,9,14,15,25]. However, we argue that the issue is not completely resolved. We suggest that by considering the change in volume of the electron reservoir in the formation reaction of the charged defects, we can renormalize the formation volumes of charged defects, and this approach represents one possible route for resolving the issue, in addition to using a net neutral defect reaction model to determine relaxation volumes.
In this work we focus on the issue of the relaxation volume of charged defects, focusing on the actinide material UO2, both because of its complex electronic structure and because its fluorite crystal structure is common to many technologically important materials. Defect calculations [26,27,28,29] in UO2 have established that defects such as Frenkel pairs and Schottky trios and fission product complexes are likely to consist of individual components that are charged. The individual volume change depends not only on the size mismatch of the defect species, but also on the more complex charge transfer mechanisms occurring in the presence of the defect. In addition to UO2, we present results and comparisons for relaxation volumes of charged defects in Si and GaAs, for the purpose of validating against existing data in these systems and uncovering behavior that applies to charged systems more generally.
The paper is arranged as follows. Section 2.1 presents the density-functional theory (DFT) methodology used in calculating defect properties. In Section 2.2, we discuss the definitions of defect formation and relaxation volumes. Various schemes to correct the total energy of charged supercells simulated using DFT and their relation to defect relaxation volumes are investigated in Section 3.1. Our results on the details of the lattice distortion around individual charged and neutral defects are presented in Section 3.2. In Section 3.3, we discuss the defect reaction approach for calculating the defect relaxation and formation volumes for complete defect formation reactions. In Section 4, we discuss the significance of our results and present our conclusions in Section 5.

2. Theoretical Framework

2.1. Density Functional Theory

Here, we summarize the details of the first-principles based DFT calculations used in this study. The DFT calculations are performed with the Vienna Ab Initio Simulation Package (VASP) [30,31] using the projector-augmented-wave (PAW) method [32,33]. For UO2 the electron exchange and correlation potential is described by the local density approximation (LDA) [34] and the Hubbard +U model is used for the strongly-correlated U 5f electrons [35]. To be in accordance with our earlier studies [11,36], we employ the LDA functional for UO2, and the U and J values are set to U = 4.5 eV and J = 0.51 eV; i.e., UJ = 3.99 eV. We adopt the Perdew-Burke-Ernzerhof generalized gradient approximation (PBE-GGA) functional [37] for silicon and LDA for GaAs to be consistent with reference literature [38,39]. The energy cut-offs employed are 500 eV for UO2, 520 eV for Si and 275 eV for GaAs. Defect properties in UO2 are calculated using 2 × 2 × 2 and 2 × 2 × 3 supercells with 2 × 2 × 2 and 2 × 2 × 1 k-point meshes, respectively. Defect calculations are performed at both constant volume and fully relaxed (both in cell volume, shape, and atomic coordinates) conditions. Defects in silicon are simulated in a 2 × 2 × 2 and 3 × 3 × 3 size supercells with k-point meshes of 4 × 4 × 4 and 3 × 3 × 3, respectively, while those in GaAs are simulated in a 3 × 3 × 3 supercell with a k-point mesh of 2 × 2 × 2. The dielectric tensors are important for the correction schemes for the defect formation energies of charged systems and are calculated using density functional perturbation theory [40,41] as implemented in VASP. The computed bulk properties of interest for UO2, Si and GaAs are summarized in Table 1.
We perform convergence tests of the final total energy with respect to the energy cut-off and k-point mesh sizes. The convergence tolerance for forces on each ion is 0.01 eV/Å, resulting in total energies converged to less than 10−5 eV. To ensure there are no issues associated with the change in plane wave basis and k-point density due to changing cell size, we also calculate the defect relaxation volume of point defects for higher energy cut-off and denser k-point mesh; we find that the relaxation volumes of neutral and charged defects are converged to 0.3–1.8 Å3 (which is within 5% of the relaxation volume) depending on the type of defect. Energy vs. volume calculations of defects are performed starting from the converged wave functions for the minimized defect structure. This is done to avoid the system becoming stuck in the metastable energy state associated with the possible configurations of the localized uranium f-electrons [42].
Finally, to verify that our results are consistent across DFT codes, we performed calculations of the relaxation volume for defects in GaAs and Si with CASTEP [43], again using GGA-PBE with “on the fly” ultrasoft pseudopotentials with a cutoff energy of 450 eV. To ensure similarity with VASP simulations the same k-point grids are employed. The defect relaxation volumes as determined with CASTEP agree with those found with VASP, indicating that the behavior described here is not a consequence of a particular implementation of DFT.

2.2. Defect Formation and Relaxation Volumes

The formation volume of a defect ΔΩf is given by the change in Gibbs free energy, ΔGf (p, T), for the defect formation reaction at constant pressure and temperature via [5]:
Δ G f ( p , T ) = Δ E f ( p , T ) + p Δ Ω f T Δ S ( p , T )
where ΔEf denotes the change in the internal energy, ΔΩf the formation volume, and ΔS the change in entropy due to the formation of the defect at constant pressure and temperature. The defect formation volume is the difference in volume across the defect formation reaction and is related to the Gibbs free energy of defect formation by:
Δ Ω f = ( Δ G f ( p , T ) P ) T , n i
At T = 0 K, the change in Gibbs free energy, ΔGf (p, 0) reduces to the change in enthalpy, ΔHf. However, at higher temperatures, the entropy contribution can also become relevant [52]. The defect formation enthalpy, ΔHf, from DFT calculations for a defect X, in charge state q is given as [52,53]:
Δ H f ( X , q ) = [ E t o t D F T ( X , q ) + E c o r r I m a g e + q Δ V ] E t o t D F T ( b u l k ) i n i μ i + q ( ε V + ε F ) + p Δ Ω f
where, E t o t D F T (X, q) is the total energy of the DFT supercell with the charged defect, E t o t D F T (bulk) is the total energy of the defect-free bulk supercell, and ni and μi are the number and chemical potential of each element contributing to the defect, εv is the energy of the valence band maximum (VBM) calculated in the defect free bulk supercell [49], and εF is the Fermi energy with respect to the VBM. The term q(εv + εF) is the chemical potential of electrons, i.e., it accounts for exchange of electrons with the reservoir. The ΔΩf contribution to the enthalpy in Equation (4), is usually very small at ambient conditions (~10−5 eV per defect at p = 1 atm) and often neglected. The terms E c o r r I m a g e and ΔV are the charged image interaction and potential alignment corrections, respectively. These corrections are needed to correct for finite-size artifacts within the DFT supercell approach to calculate the defect formation energies.
The expression for computing formation volume from DFT calculations is often given as [23,54]:
Δ Ω f ( X ,   q ) = Δ Ω r ( X ,   q ) ± Ω 0
where,
Δ Ω r = Ω ( d e f e c t ) Ω ( b u l k )
Here, ΔΩr is the relaxation volume, and Ω(defect) and Ω(bulk) are the volumes of the supercell with a defect X in charge state q, and the perfect bulk supercell, respectively, both relaxed to zero stress. The + and − signs in Equation (5) denote vacancy and interstitial defects, respectively. The defect relaxation volume can be understood as the change in volume due to relaxation of the crystal lattice around the defect site, or the direct volume change in the system upon introducing the defect in a constant pressure calculation. By contrast, the formation volume also accounts for the reference volume (or the choice of reservoir) associated with the origin or placement of the species comprising the defect, Ω0. The relaxation and formation volume are actually tensor quantities, e.g., Δ Ω i j r is given as [23]:
Δ Ω i j r = Ω b u l k [ ε i j ]
where εij is the strain tensor (strain between supercells computed from DFT calculations) due to the defect. This definition holds for any anisotropy, shape or size of the supercell. The magnitude of the volume change is then given as, ΔΩr = 1/3 × tr( Δ Ω i j r ), and is consistent with that computed using Equation (6). This description of the relaxation volume accounts for changes in cell shape upon introduction of the defect. It is important to note that the relaxation volume is a finite converged value even for very large simulation cell size. Finally, the elastic dipole tensor Gij is related to Δ Ω i j r (Equation (1)) and thus, in order to describe the response of charged defects to strain, it is imperative to be able to accurately determine the relaxation volumes.

2.3. Volume of Individual Species Comprising the Defect

As described in Equation (5), computation of the defect formation volume needs to take into account the reference volume, Ω0, of the individual atomic species constituting the defect reaction. For a single-component system like silicon, Ω0 is equal to the cohesive volume of an atom in bulk silicon. However, for a multicomponent system, Ω0 is given by the partial molar volume, which measures the variation of volume as chemical components are added or removed from the reservoir during the defect reaction. The choice of reservoir for partial molar volume is exactly analogous to the atomic chemical potential in the definition of defect formation energy. In a multicomponent system, defect reactions can be of two types:
(1)
Stoichiometric reactions comprising of defects like the Schottky trio. In this case, Ω0 is the volume per formula unit of the multicomponent system or, analogous to the monoatomic case, the cohesive volume of a formula unit. For example, in UO2 this is computed to be Ω UO 2 = 40.3 Å3 (40.9 Å3 in experiment [55]) and in GaAs it is Ω GaAs = 44.5 Å3;
(2)
Non-stoichiometric reactions comprised of defects such as vacancies and interstitials. Here Ω0 is the volume per unit of the reference. For example, in GaAs where solid bulk Ga and As can be considered as the reference (or atomic reservoir) for respective defects, the computed volumes per atom are Ω Ga = 20.3 Å3 (19.3 Å3 in experiment [56]) and Ω As = 22.4 Å3 (21.3 Å3 in experiment [57]), respectively. That is, a reference is defined for each species that depends on the experimental conditions of interest. In this example, we chose bulk solids for each element. However, other reference states are possible or desired depending on the materials system and what experimental conditions are being matched. For example, in UO2, bulk U metal in the orthorhombic structure (α-phase) is considered as a reference for U vacancy and interstitial, with computed volume of 19.9 Å3 (20.6 Å3 in experiment [58]). For O defects, we choose orthorhombic α-U3O8 as reference, with a computed volume Ω U 3 O 8 = 56.9 Å3 per U atom; this is close to the experimental value of 55.5 Å3 per U atom [59]. From this, we derive the reference volume for O atom to be 22.6 Å3 from Ω UO 2 and Ω U 3 O 8 as discussed in detail in Section 3.3. In all of these cases, the reference explicitly depends on the experimental conditions and is not something directly computable from electronic structure methods. That is, once a reference is chosen, the relevant thermodynamics properties can be calculated, but the reference itself is not something that can be determined solely from the calculations; it must be asserted or assumed.
We use Equations (5) and (6) to calculate the defect formation and relaxation volumes. In compounds this calculation is complicated by the fact that the stoichiometry of the system changes when individual point defects such as vacancies or interstitials are formed. For charged defects, the issue is further exacerbated as the electrons or holes added to the defect system also contribute to both the defect formation energy and volume. While the contribution of net charge to the defect formation energy has been well studied in the past and several correction terms have been developed, the contribution of the net charge to the defect formation volume has only recently been recognized [14,15]. Indeed, in those seminal works, the authors have shown that defect formation volumes are large, and propose various approaches for considering artificial effects of net charge on formation volume. However, there are still important and unanswered questions about the magnitude of the predicted formation volumes of charged defects as calculated within DFT, and the physical reasonableness of those volumes. In this work, motivated by the work of those authors, we further their efforts by detailed examination of how approaches proposed for correcting energy impact volumes. We conclude that to appropriately compute defect relaxation volumes requires accounting for the volume associated with the charge reservoir just as is done for the energies.
In the following discussion, we explicitly focus on the defect relaxation rather than the formation volume as the latter can be obtained by properly accounting for Ω 0 . Here we show that the contribution of the change in charge to defect relaxation volumes is surprisingly large. By studying point defects in three different systems, we estimate for a given system the contribution of the charge to the defect relaxation volume.

3. Results

The computed values of the relaxation volumes of point defects in both neutral and fully charged states are listed in Table 2. The lattice relaxation and its symmetry around a defect are quantified by the relaxation volume tensor, Δ Ω i j r (Equation (7)), which in turn determines the defect dipole tensor, G i j (Equation (1)), listed in Table 3. The relaxation volumes are relatively large for charged defects compared to their neutral counterpart and, interestingly, the sign of the relaxation volume is sensitive to the charge state of the defect. The relaxation volumes are computed using Equation (6) (when relaxing cell shape, volume and ionic positions), and Equation (7) (when keeping volume and cell shape fixed, relaxing only ionic positions). The agreement in computed relaxation volumes calculated through the two approaches is between 0.5–2 Å3; the differences in total energies is 50–100 meV, a similar range to that reported by Freysoldt et al. [52].
As discussed above, the dipole tensor is used to compute the change in defect formation energy upon interaction with strains in the material [11,24]. We find that the changes in the formation energy differ significantly between the charged and neutral states for a given defect. For example, for a fully charged (2−) oxygen interstitial under 1% compressive strain the change in formation energy is about 277.4 meV, which is 6 times larger than the −46.4 meV change in energy for a neutral oxygen interstitial under the same strain state. Similarly, the segregation energy of a fully charged oxygen interstitial in UO2 under the strain field of edge dislocation [60] is computed to be ~−8.3 eV, much larger than the ~−1.2 eV segregation energy of the neutral oxygen interstitial. The differences in formation energies [29] and the analyzed local lattice distortions (see Section 3.2) between the neutral and charged defects are, however, not so large. Therefore, this extremely large change in segregation energies (which depend on the value of the relaxation volumes) between a charged and a neutral defect interacting with the same strain field seems unphysical and suggests that something is amiss with the volumes calculated for the charged defects.
Figure 1 shows the dependence of the defect relaxation volume on the simulation cell size for charged and neutral vacancies. These results indicate that the large charged defect relaxation volumes are not a consequence of the finite system size limitation of DFT. In the next section, we investigate in detail the dependence of relaxation volumes on the various finite size charge corrections schemes to charge supercell calculations, which have been suspected [14] to have large volume dependence.

3.1. Finite Size Correction Schemes to Energy for Charged Supercell

As discussed in the Section 2.2, the defect formation volume follows thermodynamically from the defect formation energy (Equation (3)). Therefore, it is important to investigate any possible connection between the corrections to the defect formation energy of charged defects and their defect formation volumes.
Charged supercell calculations in DFT require an artificial background charge density (opposite in sign to the net charge of the supercell) to ensure global charge neutrality and convergence of the total energy of the charged system within the supercell approach. The genesis of this background charge is related to the DFT convention of setting the average electrostatic potential over the entire volume of the supercell to zero in order to evaluate the electrostatic Coulomb energy [61]. We note that the same convention is typically applied to calculations of charged defects using ionic potentials. The total energy of charged supercells must account for the chemical potential of the electrons, q(εv + εF) in Equation (4), and needs to be corrected for finite size errors associated with the periodic supercell approach [39,52,61,62]. There are two specific effects. The first is the interaction between a charged defect and its periodically repeated charged images, adding a spurious electrostatic energy; this is referred to as the image charge correction, E c o r r I m a g e . The second is the electrostatic potential between the defect and bulk system that needs to be aligned in order to accurately define the reference energy (chemical potential) of electrons, added or removed in charged supercell calculations. This is termed as the potential alignment correction, qΔV. We adopt the method by Freysoldt et al. [39] to correct for finite size errors as it has been shown to achieve good convergence [49] for defect formation energies with system size.
In the next subsections, we systematically investigate the relation between these finite-size energy corrections and the charged defect relaxation volumes. Any change in total energy that depends on the volume of the simulation cell affects the computed forces, pressure/stress tensors, and relaxation volumes in DFT simulations. Therefore, both volume and stresses need to be corrected in the same manner as the total energy.

3.1.1. Image Charge Correction

The image charge correction is needed because, in periodic supercell calculations, a charged defect (in the presence of the homogeneous background charge density) has long-range electrostatic interactions with its periodic images. If the dimensions of the unit cell were infinite, this electrostatic interaction would be zero. However, in periodic DFT calculations the supercell dimensions are finite; therefore we need to correct the total energy of the charged system to account for this spurious Coulomb interaction. This correction is referred to as the monopole correction by Leslie and Gillan [63], and is designed to transform the electrostatic energy of a periodic lattice of point charges in a neutralizing background into the electrostatic energy of single point charge. As such, it is not unique to DFT, but occurs whenever the energetics of a system with net charge is considered. The correction term is given as [39,63]:
Δ E c o r r I m a g e = E i s o l a t e d E p e r i o d i c = α q 2 2 ε Ω 1 / 3
where α is the Madelung constant, Ω is the volume of the bulk supercell in which the defect is created, and ε represents the electronic and ionic low frequency dielectric constant of the material, computed from DFT calculations (Table 1). In our calculations, we use the average value [38,64], 1 3 t r ( ϵ i j ) of the dielectric tensor as the effective value for dielectric constant in Equation (8).
The energy correction given by Equation (8) is computed directly from VASP, and the corresponding correction to the pressure Δ P c o r r i m a g e can either be calculated directly from the slope of the image-charge correction ( Δ E c o r r I m a g e ) as a function of volume or via the relation as derived in Reference [13]:
Δ P c o r r i m a g e = E c o r r i m a g e Ω = 1 3 ( α q 2 2 ε Ω 4 3 )
with the corresponding volume correction given as,
Δ Ω c o r r i m a g e = Ω B u l k ( Δ P c o r r i m a g e B )
The computed image charge corrections to energy, pressure and volume are summarized in Table 4 for charged defects in UO2, GaAs and Si. The corrections to volume are very small compared to the corrections in the total energy and to the corresponding defect relaxation volumes: Δ Ω c o r r i m a g e ~0.01–0.02 Δ Ω r , for the three systems studied here. Thus, the correction to the relaxation volumes due to the image charges is only a 1%–2% effect.
Our computed value of Δ Ω c o r r i m a g e for the charged (2+) Si vacancy is 0.02 ΩSi, which is similar to that reported by Bruneval and co-workers [14]. We note that the correction to the relaxation volume and pressure (or stresses) decreases with the increasing size of the simulation supercell and is independent of the sign of the charge on the defect, depending only on the magnitude of the charge. For example, for the U vacancy, the energy and volume corrections are 0.82 eV, and 0.2 Å3 in a 3 × 3 × 3 supercell, compared to 1.23 eV, and 0.32 Å3 in 2 × 2 × 2 supercell.
The above changes in the pressure and volume are computed based on two assumptions. The first assumption is that the value of the bulk modulus, B, does not change significantly due to the presence of defects. The second assumption is that the charge is localized at the defect site within the simulated supercell size. Our computed value of the bulk modulus of UO2 with a U vacancy (in a 144 atom supercell) is 203.3 GPa compared to the bulk value of 220.5 GPa. This difference gives an error of 0.01–0.03 Å3 in the estimation of Δ Ω c o r r i m a g e . We also computed the difference in planar averaged charge density of the charged defect (averaged over planes of atoms) from its bulk structure, as shown in Figure 2a, for the charged uranium vacancy in UO2. The charge density is fairly localized at the defect site and saturates to the screened [65] charge value of ( 1 1 ϵ ) q Ω , as indicated by the dashed red line in Figure 2a.

3.1.2. Alignment Correction

Among the various procedures [39,52,62,66] outlined in the literature to align the average electrostatic potential in the defect supercell with that in the bulk supercell, we use the scheme provided by Freysoldt et al. [39]. The key advantage of this scheme (referred to in the literature as the FNV scheme [49]) is that the long-range 1/r potential is removed before the alignment is determined for the remaining short-range potential. If the size of the simulation cell is big enough to fully localize the defect charge density within a sub-region of the supercell, the short range potential reaches a plateau (Figure 2b) far from the defect, which yields the alignment as a well-defined quantity [52].
The short-range potential away from the defect site is obtained by taking the difference between the electrostatic potential from a model charge density Vmodel and the DFT electrostatic potential from the charged defect V q D F T and the perfect bulk V b D F T :
Δ V = Δ V q / b = ( V q DFT V b DFT ) | far V model | far
The model charge density is the charge distribution used to capture the localized defect charge (as shown in Figure 2a). In the FNV alignment correction scheme, we use a Gaussian charge distribution for the model charge density, with width equal to 1 Bohr. The DFT electrostatic potential (blue curve), and the potential due to model charge density (red curve) are shown in Figure 2b. The difference is the short-range electrostatic potential (green curve) which reaches a plateau away from the defect site (centered at origin), thereby giving the alignment correction ΔV (highlighted as a dashed line in the plots). The computed value of ΔV for V U 4 is −0.17 eV, and it is computed in a similar manner for all other charged defect studied. For defects with large atomic relaxations the charge density and potential can show strong variation close to the defect site, resulting in uncertainty in extracting the exact value of the alignment correction. Recent reviews [38,49] of charged defect correction schemes highlight similar issues with relaxed geometries. While this source of error in potential alignment correction needs to be quantified, the results from Reference [46] suggest that the changes are relatively small, i.e., within 40–100 meV, and unlikely to make a significant change to the defect’s volume dependence.
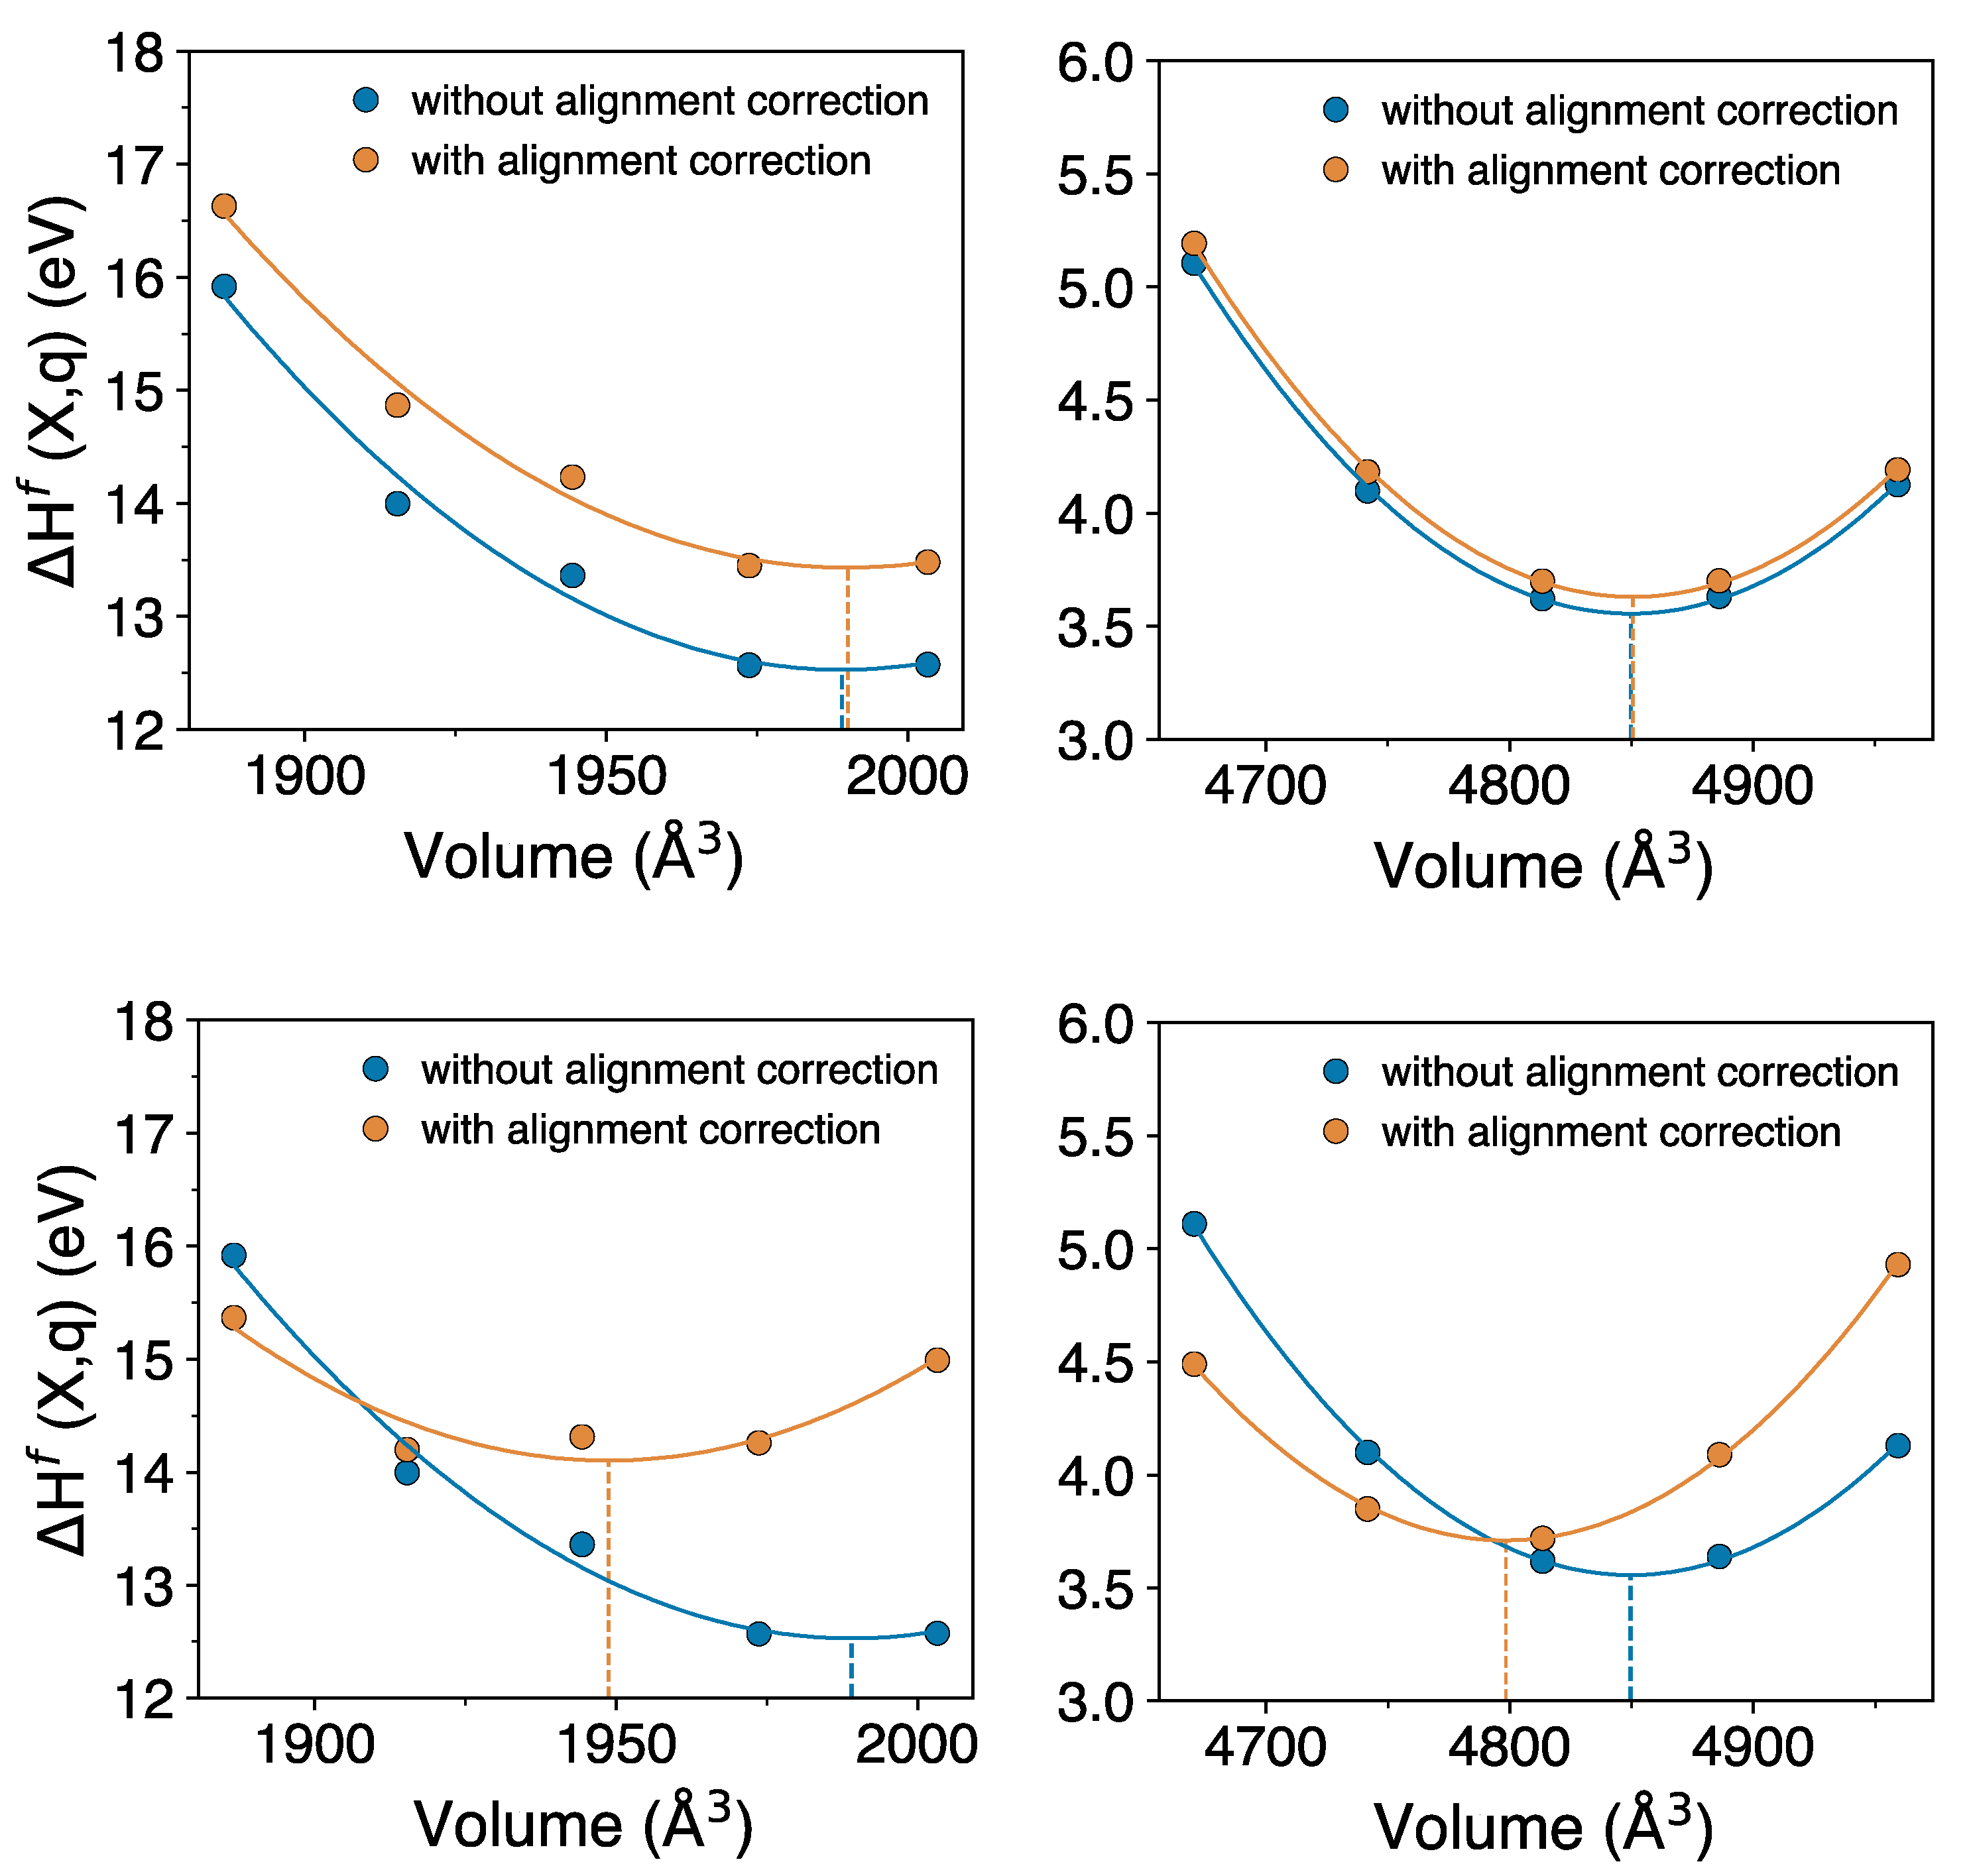
To obtain the corrections to pressure and volume due to potential alignment correction, we compute the defect formation energy with and without the alignment correction for a set of isotropically-scaled volumes. Figure 3 shows the defect formation energy as function of volume; from the fit to the energy-volume data we compute the volume corresponding to the energy minima, calculated with two approaches. In approach (1), the potential alignment is computed between defect and bulk, with volume change (isotropic-scaling) applied to both the defect and the bulk supercell, such that the defect and bulk have the same volume. In approach (2), the potential alignment is computed such that volume change is applied only to the defect supercell and bulk is kept fixed to its pristine volume. For approach (2) we have employed the LZ scheme [62] because the FNV scheme cannot be applied when the defect and bulk have different volume. That is, the difference in the two approaches is the volume at which the bulk is kept when computing the potential alignment correction of the defective cell.
Comparing the volumes corresponding to the minimum defect formation energies with and without the alignment correction gives an estimate of the correction to the relaxation volume due to the alignment correction. Based on approach (1), top panels in Figure 3, we find that this correction is small. For V U 4 in a 144 atom supercell, the volume correction is 1.09 Å3 (0.03 ΩUO2), while that for V Ga 3 in a 216 atom supercell it is about 0.81 Å3 (0.02 ΩGaAs). However, based on approach (2), bottom panels in Figure 3, the correction is very significant; for V U 4 the volume correction is −40.33 Å3 (−1.001 ΩUO2), while that for V Ga 3 it is −51.2 Å3 (−1.2 ΩGaAs). This gives final relaxation volumes of V U 4 to be 0.05 Å3 and that of V Ga 3 to be −19.9 Å3.
Approach (1) computes the alignment correction by aligning the common reference (average electrostatic potential) in the defect and bulk supercells, as volumes are kept same, as in References [36,59]. Based on the analytical expression derived using FNV scheme by Komsa et al. [49], the potential alignment follows a 1/Ω (where Ω is supercell volume) dependence, and converges much faster (Ω−2) than the image charge correction (Ω−4/3) with increasing cell size. This suggests that the potential alignment has a weak volume dependence, which falls in line with the results obtained using approach (1), as shown in Figure 3a.
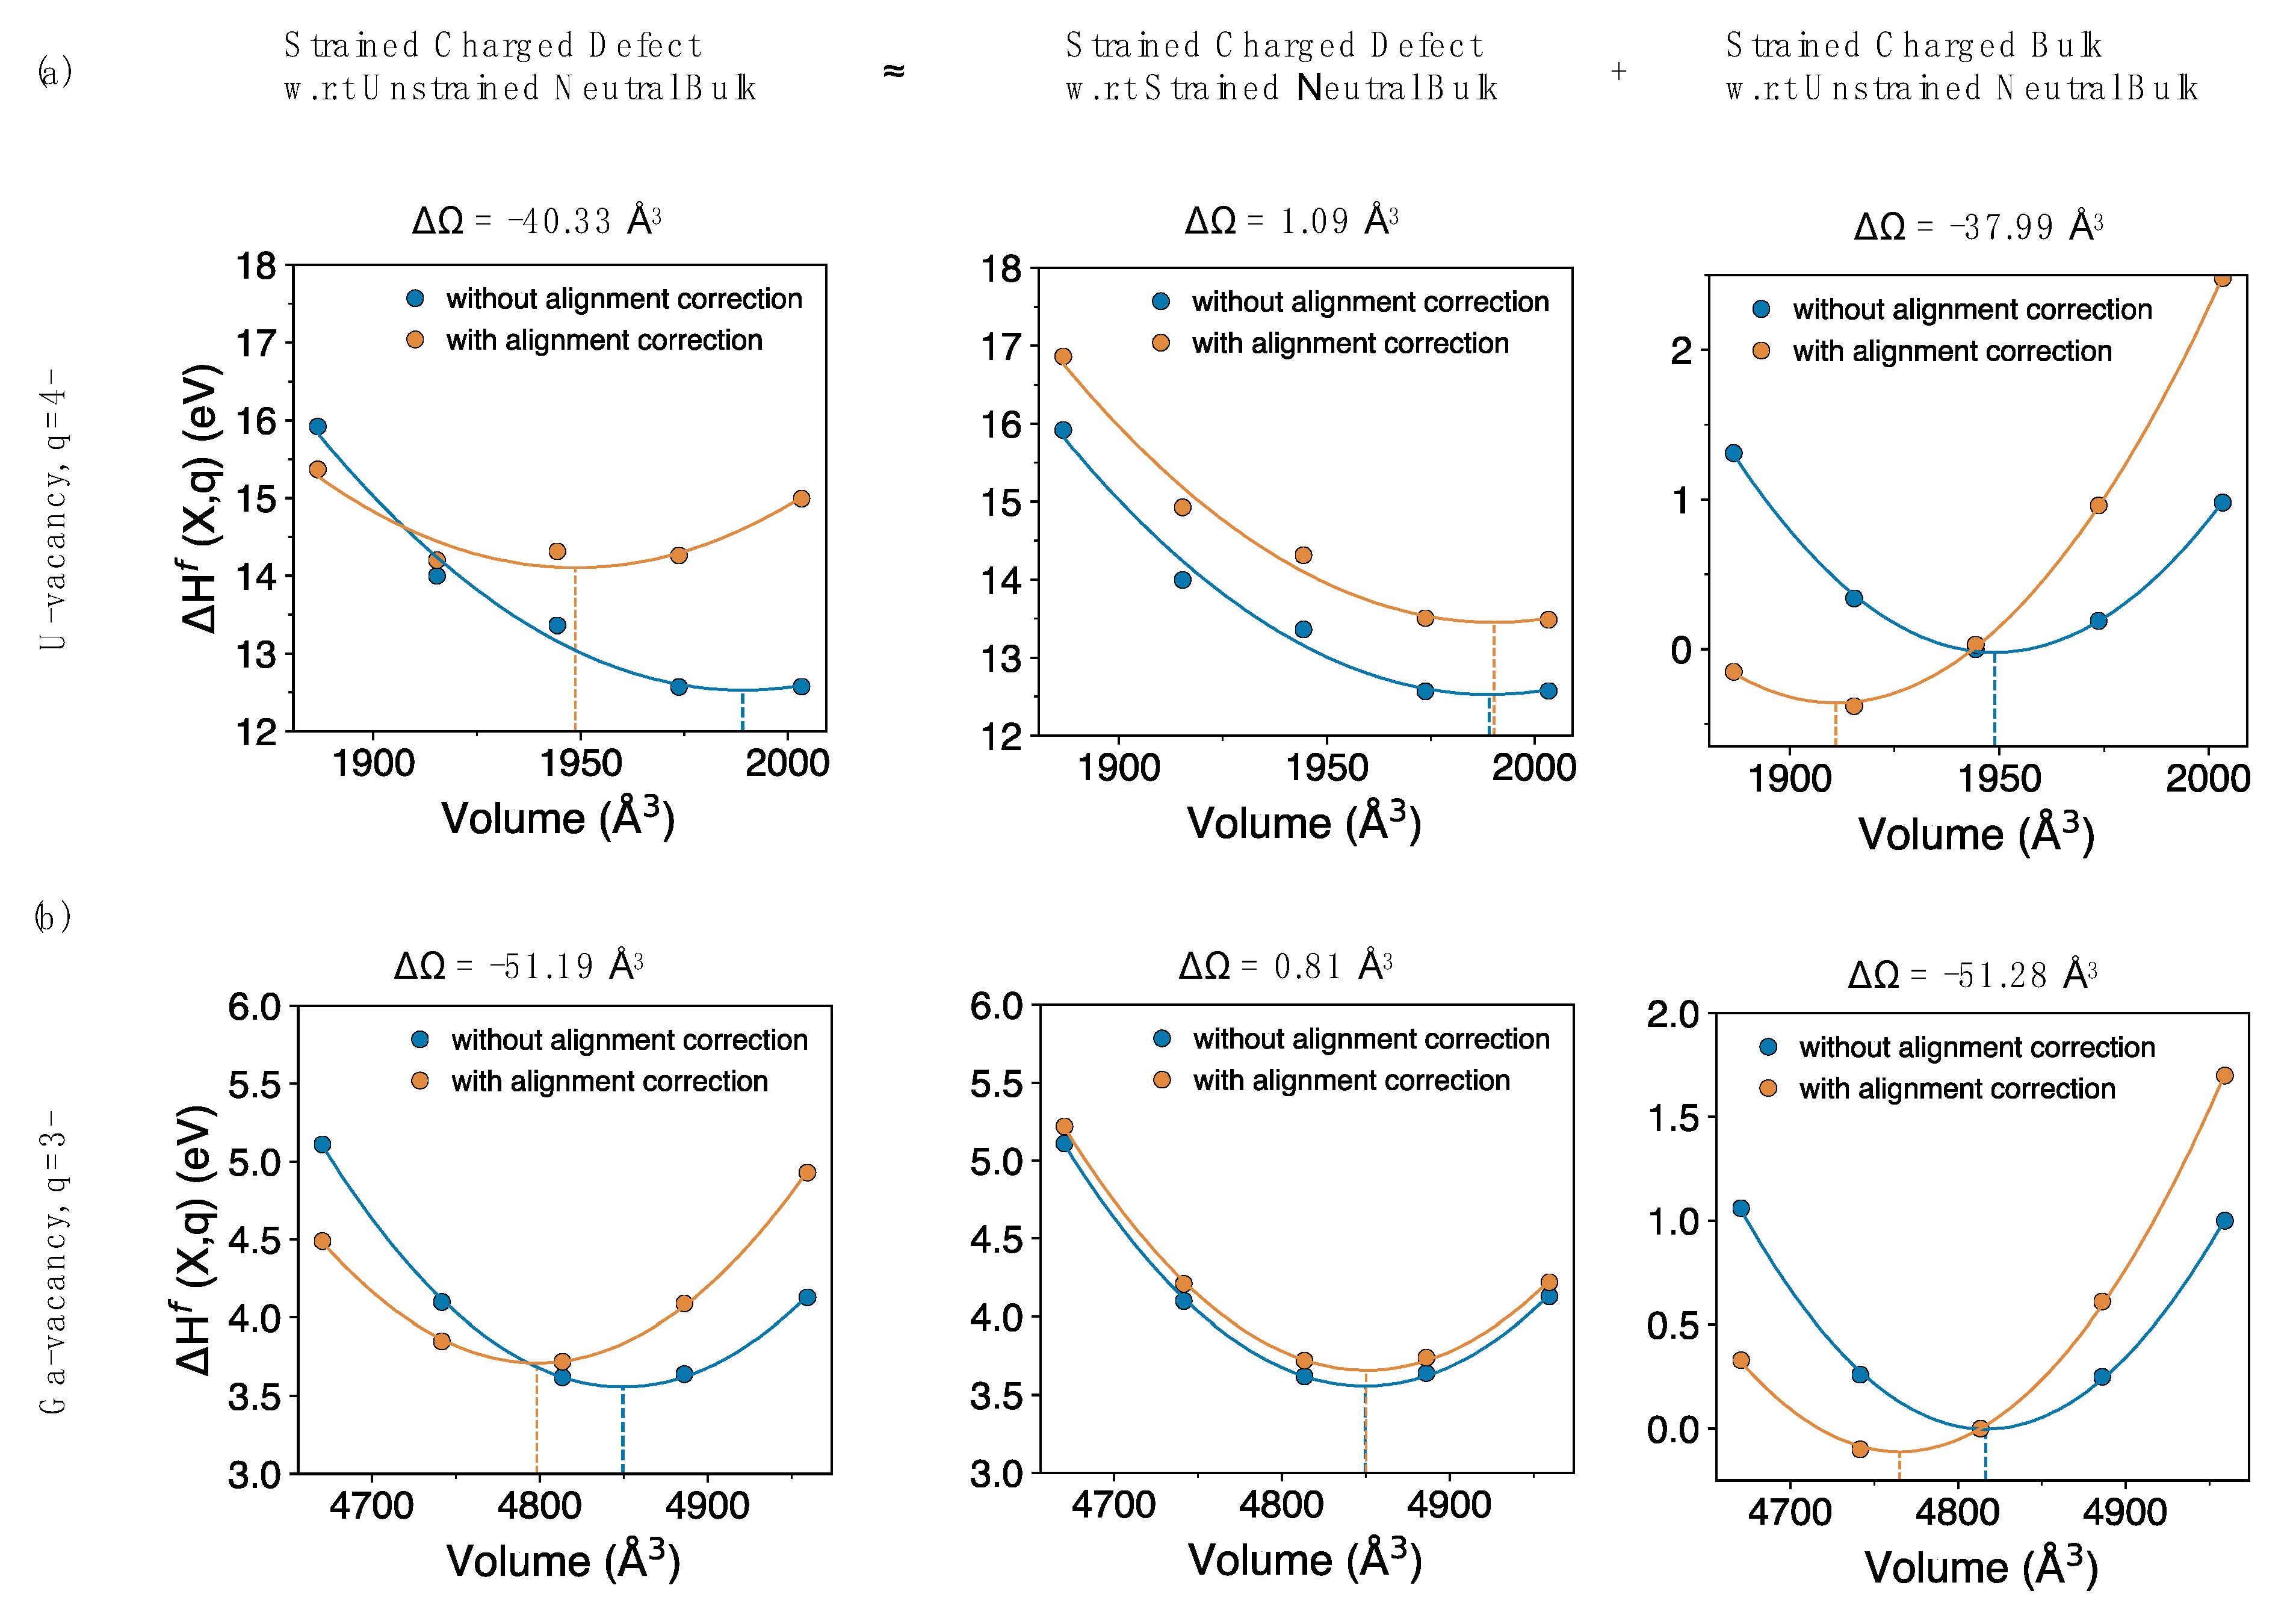
The large volume change as calculated from approach (2) can be broken down into two independent components. As shown in Figure 4, the first component (very small) is actually the same as approach (1), while the second (much larger) component aligns strained bulk (in the same charge state as the defect) with the pristine bulk. Clearly, the volume change of the second component is as large as that of the strained defect with respect to the pristine bulk, as shown for both charged uranium and gallium vacancies. This suggests that one probably does not need to introduce a defect to calculate the volume dependence of the potential alignment correction, instead it can, to a good approximation, be computed by just using the strained bulk (in same charge state as the defect). The correction to the volume Δ Ω c o r r P A , based on just the dominant bulk contribution per unit charge (the last term in Figure 4), for the systems studied are calculated as −9.5 Å3, −17.0 Å3 and −19.9 Å3 for UO2, GaAs and Si, respectively. Results from approach (2) (Figure 3, bottom panels) agree with the conclusions from Reference [13], which reported that the alignment correction gives a large contribution to the charged defects relaxation volumes.
Our results and the defect literature thus present a difficulty in identifying the correct approach and resolving the ambiguity about the volume dependence determined from potential alignment correction. Schemes addressing the potential alignment correction assume localized defects and aim at determining the change in average electrostatic potential, perturbed by the presence of a defect, by keeping the volume in bulk and defect calculations the same. In Figure 4, we show that the origins of the large volume change due to potential alignment is related to the charged bulk and different references (average electrostatic potential) because of the comparison between the strained bulk and the pristine bulk. That is, the large correction in the volume induced by introducing the charged defect is not due to the atomic defect (or very little), but is almost entirely due to the effect of the charge in the system. Here, we have treated potential alignment using the conventional schemes, based on References [36,59] and at present we cannot determine which of the two approaches in Figure 3 is correct, if either. We discuss the volume contribution of charged bulk and potential alignment results explicitly in the discussion section.

3.2. Structure of Charged Defects

In this section, we investigate in detail the atomic structure of charged defects, to gain insight into the differences in local lattice relaxation around the neutral and charged defects, and thus understand the origin of the anomalously large relaxation volumes of charged defects.

3.2.1. Lattice Relaxation around an Electron and Hole

An electron or hole is simulated in DFT calculation by changing the total number of electrons by +1 or −1, in the optimized bulk structures. The relaxation volumes of electrons and holes in bulk Si, GaAs, and UO2, obtained after relaxing (p = 0) the charged bulk structures, are summarized in Table 5. Addition and removal of an electron results in expansion and contraction of the lattice, respectively. These volume changes (~12 to 22 Å3 or 0.3 to 0.7Ω0, depending on the system) are large and result in about 1% change in their respective lattice parameters for the current supercell sizes. There is not much data in the literature on the relaxation volumes of electrons and holes to compare our results to. However, a few DFT studies [12,25] on defects in Si report the relaxation volumes of an electron of 0.68ΩSi to 0.72ΩSi and a hole of −0.78ΩSi, where ΩSi is the volume per Si atom in a perfect supercell. Our computed values for the relaxation volume of an electron and hole in Si are in a similar range: 0.74ΩSi and −0.84ΩSi, respectively.
A DFT calculation of an electron or hole generally yields a delocalized electron, as it represents the exchange of electron or hole with the bulk conduction band or the valence band edge, unless the added (or removed) extra charge has a preference to localize on a specific atomic site. To verify this, we performed Bader charge analysis [67,68] and looked at the difference in charge density (planar averaged) between the electron (or hole) and bulk for both UO2 and GaAs.
For GaAs, the difference in charge density (Figure 5) between the charged and uncharged systems is periodic across the As and Ga atomic planes normal to the z-axis, with no evidence of charge localization. In contrast, for UO2, the difference in charge density is not uniform (Figure 5), indicating localization of the additional electrons within the supercell. A 2D slice (Figure 6) of the difference in charge density between the excess electron and bulk shows large variations in charge density across specific U and O sites. Furthermore, a Bader charge analysis on the structure with an extra electron in UO2 confirms a U site having an effective Bader charge of +2.18, less than that of +2.54 on a U site in the bulk (or perfect) lattice, and neighboring O sites with Bader charge of −1.30, larger than of −1.27 on O site in bulk. A similar Bader charge analysis of the hole suggests partial localization at a U site with an effective Bader charge of +2.77. Such partial localization of an extra electron ( e or UUδ) or hole ( h ˙ or UUδ+) has previously been seen in DFT + U studies of UO2 [69].
To gauge the local atomic relaxations due to the presence of an excess electron or hole, we analyze the change in distances of the neighboring atoms for all the sites in the perfect and defective (electron or hole) structure. Figure 7 shows the relative change in nearest neighbor distances ( Δ d d 0 ) for all the sites in the defect structure, plotted as the function of distance (d0) of the given site from the defect. The change in the neighbor distance (Δd = dd0) is calculated by taking the average difference of distances for each set of neighbors at a given distance from the defect site between the bulk and defect structures.
In UO2 with a partially localized extra electron on a U site ( e or U U δ ) (Figure 7a), the local defect structure is complex. Neighboring atoms for any given site in the structure show outward relaxation, independent of the position of the site from the defect. For those sites at a distance of ~5 Å and beyond from the defect, the relative change in neighboring distance saturates to a constant value. This constant value is approximately equal to the fractional volume change ( Δ Ω r Ω ( b u l k ) = 11.52 1936.76 ) due to the addition of an electron in bulk UO2, which is about ~0.006 (or 0.6%). That is, it is what would be expected from an isotropic expansion of the cell. However, for the sites that are close to the defect (distance < 5 Å) the change in neighboring distances is much larger than 0.6%. Similarly, for a partially localized hole on U site ( h ˙ or UUδ+) (Figure 7b), the structure exhibits a large inward relaxation of the lattice close to the defect site, and a constant inward relaxation far away from the defect site, equal to the fractional volume change (−0.6%) due to removal of an electron from bulk UO2. This is expected in UO2 since charges are known to form small polarons (known both experimentally and using higher levels of theory like DFT+U or hybrid-DFT), which by definition carry local lattice distortions [70].
By contrast, for GaAs and Si the electron (or hole) is completely delocalized and does not reside on any specific atomic site; therefore, the change in the neighboring distance is independent of the site considered: an electron (or a hole) induces a constant expansion in the lattice that is uniform over all atoms. Structure analysis of an electron or hole in GaAs (Figure 7c,d) shows that the change in neighboring distances between the defect and bulk structures is approximately a constant value. The structure with an extra electron shows a homogeneous expansion of ~0.49% (Figure 7c) while that with an extra hole shows a homogeneous contraction of ~0.40% of the lattice (Figure 7d), resulting in roughly ±1% change respectively, in the lattice parameter.
These calculations show that the addition or removal of an electron to or from a bulk lattice can result in delocalized or localized charge depending on the system. It is intriguing that independent of the behavior (localized or delocalized) of the charge, there is an expansion (or contraction) of the bulk lattice, resulting in significant relaxation volumes for electrons and holes determined within the DFT framework. Whether such an effect is real or a behavior particular to DFT calculations is not clear at present. However, a detailed examination like this of electrons and holes in bulk structures helps us to establish the dependence of relaxation volume and corresponding elastic dipole tensor purely on the behavior of the charged bulk system.

3.2.2. U Vacancy in UO2

The U vacancy in the fluorite structure resides at the center of the cube formed by the first eight neighboring oxygen atoms. The difference between neutral and charged supercell calculations lies in the presence or absence of local charge compensation mechanisms around the defect site [27,28]. We examine these differences by explicitly analyzing the difference in charge density and Bader charge in neutral and charged supercell calculations. The neutral uranium vacancy is charge compensated by four U sites ( h ˙ or UUδ+) with Bader charges of 2.79–2.81 (much larger than Bader charge of 2.54 on U site in bulk UO2) located at 2nd (3.86 Å) and 4th (5.44 Å) neighboring distances from the defect site. However, for the charged (4−) uranium vacancy there is no local charge compensation from neighboring U sites.
The changes in nearest neighbor distances (Figure 8) for the both the neutral and charged U vacancy clearly reveal the differences in the short- and long-range atomic relaxation around the defect site. The lattice distortion around the neutral vacancy extends to a relatively larger distance (~6–7 Å) compared to the charged vacancy (~4–5 Å), because of the presence of neighboring UUδ+, which are absent for the charged vacancy. For both the neutral and charged supercell, the relative change in neighboring distances saturates away from the defect site. The fractional volume change for neutral and charged U vacancy are −0.46% and 2.1%, respectively, in a 144-atom supercell. Analysis in a larger 324-atom supercell yields similar trends in the local and long-range defect structure of neutral and charged U vacancies.
In corresponding investigations of charged vacancies in GaAs and Si we find that vacancies show short-ranged local distortion around the localized defect sites. However, changes in nearest neighbor distances away from the localized defect site are manifestations of the overall volume change, which depend on the charge state of the defect.

3.3. Defect Reactions versus Individual Defects

In the preceding discussion, we have focused on the properties of isolated point defects. However, in reality, charged defects are never created in isolation, but by means of a series of reactions involving multiple defects; this is typically described via Kröger–Vink notation [71]. These reactions obey strict conservation rules of mass, charge, and site (maintenance of constant ratio of cationic to anionic sites in the structure) balance. There have been several theoretical studies [9,27,28,72] that develop a point defect reaction model for UO2 in order to predict defect concentration, formation energies, lattice constant, and transport properties under thermodynamic conditions prevailing in experiments [26]. In this section, we employ a similar approach based on a point defect model to compute defect reaction volumes of the net reaction, as opposed to the individual constituents. We illustrate this by using the example of the oxygen interstitial and the uranium vacancy, which are more likely to form in UO2 under oxidizing/transmutation conditions.
The reaction for incorporating oxygen at an interstitial site is given as
1 2 U 3 O 8 ( s ) + V i × O i + 2 h ˙ + 3 2 UO 2 ( s )
where V i × is a vacant octahedral interstitial site, in the fluorite structure, O i is the oxygen ion at the interstitial site, and h ˙ represents an U5+ ion (hole) not bounded to the oxygen interstitial O i . The volume change, Δ Ω r x n , for the reaction (Equation (12)) is then given as the sum of the individual relaxation volumes (as listed in Table 2, without any corrections to volumes), Δ Ω r , obtained from separate DFT supercell calculations of the charged (2−) oxygen interstitial and the U5+ ion,
Δ Ω O i r x n = Δ Ω r ( O i ) + 2 Δ Ω r ( h ˙ ) + 3 2 Ω UO 2 1 2 Ω U 3 O 8
The reaction volume Δ Ω O i r x n for the oxygen interstitial reaction is computed to be −25.8 Å3, implying contraction of the lattice due to formation of this overall neutral collection of defects (note that, in this calculation, the interstitial and the holes are assumed to be infinitely far apart). The sum of the relaxation volumes of charged oxygen interstitial and holes is −3.2 Å3, similar to the relaxation volume, Δ Ω r ( O i × ) of a neutral oxygen interstitial (−3.38 Å3) calculated within a DFT supercell, which is not surprising if the neutral O interstitial can be understood as a charged oxygen interstitial with two bound holes.
Similarly, a defect reaction for the formation of a uranium vacancy, is given as:
U U × +   U 3 O 8 ( s )   V U + 4 h ˙ + 4 ( UO 2 ) S R G
where point defects V U and h ˙ are the fully charged uranium and U5+ ion (hole), respectively, and ( UO 2 ) S R G represents the corresponding lattice atoms present at a site of repeatable growth (SRG) such as a surface, dislocation or grain boundary. The volume change for the reaction (Equation (14)) is then given as:
Δ Ω V U r x n = Δ Ω r ( V U ) + 4 Δ Ω r ( h ˙ ) + 4 Ω UO 2 Ω U 3 O 8
involving individual charged-defect relaxation volumes Δ Ω r ( V U ) and Δ Ω r ( h ˙ ) , calculated again from separate supercell calculations. The overall computed reaction volume Δ Ω V U r x n is −10.8 Å3, which again corresponds to contraction of the lattice due to the formation of uranium vacancies. These findings are in good agreement with the experimental results [73] and with theoretical prediction [74] for the contraction of the UO2 lattice due to the formation of the hyper-stoichiometric phase UO2+x (with x < 0.5). The sum of the relaxation volumes of individual charge defects (first two terms in Equation (15)) is about −6.26 Å3, similar but not exactly equal to that predicted by the relaxation of neutral U vacancy ( Δ Ω r ( V U × ) = −9.07 Å3) in a DFT supercell calculation.
Our results comparing the relaxation volume of the neutral defects with the summed relaxation volumes of the charged defects calculated from separate supercells calculations are shown in Table 6. There is good agreement with regards to the sign of the lattice relaxation (expansion or contraction) due to the formation of an overall neutral defect reaction with the two approaches. The difference in the predicted magnitude can be attributed to the interaction (both elastic and electrostatic) between the individual charged defects. Thus, while the relaxation volumes of the charged defects have large magnitudes, they to a great extent cancel when summed, leading to values that are in reasonable agreement with corresponding neutral defects. Similarly, while defect reactions, such as those in Equations (12) and (14), contain components corresponding to charged defects, once these are summed in a net neutral reaction, the large volumes of the charged defects cancel, leading to relatively small volumes for the reaction itself. In a recent study by Bruneval et al. [9], similar conclusions were also reached, where authors showed that, using a net neutral defect reactions model, relaxation volumes can reproduce the experimental observed lattice-constant variation with stoichiometry.

4. Discussion

We have found that the magnitude of the dipole tensors of individual charged defects leads to seemingly unphysical behavior. For example, combined with elasticity theory, the dipole tensors calculated here lead to segregation energies of charge defects to dislocations that are extremely large. In an effort to understand the origin of this behavior for charged point defects, we have applied volume correction schemes that are analogous to those proposed for correcting the energetics of charged defects. Our results indicate that the corresponding changes to defect volumes (and thus to dipole tensors) can either be relatively very small or quite large depending on how the corrections are applied, presenting an uncertainty as to which, if either, approach is correct.
In contrast, if one considers a full defect reaction and the associated relaxation volume, while the individual contributions correspond to charged defects and thus have large relaxation volumes, the volume change of the overall reactions are physically reasonable and are similar to those of neutral defects. Thus, the large relaxation volumes of negative defects are essentially canceled out by large, but oppositely signed, relaxation volumes of positive defects. This suggests that one cannot think of a charged defect in isolation but only in the context of the overall defect reactions that produce the defect in the bulk phase. However, in numerous fields, we are accustomed to thinking of the properties of isolated charged defects as entities that migrate and interact in the material. For example, in fast ion conductors, we consider the transport of charged carriers in the material as specific entities. Thus, it seems reasonable that one should be able to describe the elastic response of the medium due to a charged defect and, thus, determine how it interacts with, for example, dislocations.
Therefore, the above discussion suggests that, perhaps, the problem lies with the reference state reservoir. The defect formation volume depends on the choice of reservoir, just as does the defect formation energy. Considering a neutral defect, the atoms removed or added from the perfect bulk material have to be placed in a reservoir and the volume of both the material and the reservoir changes. Analogously, for charged defects, the electrons or holes added to the defect system also contribute to both the defect formation energy and volume. While the contribution to the defect formation energy has been well studied and several correction terms have been developed, the contribution of the change in charge to the volume of the reservoir has not been considered.
From our results for three different materials systems, we can estimate the contribution of the net charge to the defect formation volume, as shown in Figure 9. We see a linear relationship between the electron count and the defect relaxation volume in all three systems, similar to that observed in previous DFT studies [12,13,14]. Defect formation volumes, as defined in Equation (5), require Ω 0 to be added or subtracted to the defect relaxation volume to account for the volume of the individual species added or removed from the reservoir to maintain overall mass balance. However, in Equation (5), the contribution of the change in charge to the volume of the electron reservoir is missing. The change in the volume of the bulk with charge can be attributed to the volume contribution per electron as coming from the change in volume of the electron reservoir, Δ Ω r e f . Therefore, a complete definition of defect formation volume should be given as:
Δ Ω f ( X ,   q ) = Δ Ω r ( X ,   q ) q Δ Ω r e f ± Ω 0
Δ Ω r e f is determined by the slope of the bulk relaxation volume as a function of charge. Values of Δ Ω r e f are system dependent and for UO2, GaAs, and Si we find −11.6 Å3, −23.6 Å3 and −16.14 Å3 per unit charge, respectively. For Si, Windl and Daw [13] reported a value of about −15 Å3 from the slope of the change in volume of the bulk with net charge, similar to the value we have obtained. One can then recompute defect formation volumes by accounting for Δ Ω r e f in all three systems, as summarized in Table 7. Reaction volumes are not affected by Δ Ω r e f as the reaction is overall charge neutral and, hence, the change in volume of the electronic reservoir due to charge cancels out exactly.
In our discussion so far we have assumed negligible contribution to volume from the potential alignment correction, consistent with the results described in Figure 3a. However, as discussed in Section 3.1.2, the volume correction from potential alignment can be significant, depending on the adopted approach. As mentioned above, the difference in the two potential alignment approaches (Figure 4) comes down to how the volume of the reference bulk calculation is treated. That is, when considering the volume change induced by a charged defect and the associated corrections, do we compare to the original neutral bulk or a bulk cell expanded to the same volume as the defective state? Figure 4 indicates that the major contribution to the correction is associated with adding charge to the bulk. Comparing the change in volume of the electron reservoir Δ Ω r e f from Figure 9 with the volume correction from potential alignment correction Δ Ω c o r r P A , we find that both are large (c.f. Figure 4) and significantly affect the final defect relaxation volumes. Corrections based on potential alignment with respect to pristine bulk (Figure 3b) agree with the conclusions made in Reference [13], where potential alignment correction was shown to have a huge volume contribution to the charged defects relaxation volumes and likely provide a different viewpoint of correcting charged defect relaxation volumes.
The charged defect elastic dipole tensor is theoretically computed from its relaxation volume (Equation (1)), and experimental works often report it as chemical strain [7,22,75], estimated by measuring the change in the lattice parameter as a function of deviation from the stoichiometric chemical formula. The apparent question that comes next is should the charged defect relaxation volume be corrected to account for the volume associated with the electron/hole reservoir.
The change in the volume of the bulk with charge (volume associated with the electron/hole reservoir) as given by Δ Ω r e f can be understood as the lattice perturbation associated with excess electron and/or holes in the bulk, as described in Section 3.2.1. We reason that charged defects are individual entities that are present in an overall charge neutral system. Both their elastic dipole tensor and relaxation volumes are meaningful when defined with respect to the electron/hole reservoir in order to keep the overall system charge neutral, as one would expect when measuring these defect properties from experiments. Traditionally, when one calculates the elastic dipole tensor and relaxation volume of a charged defect, it is relative to the neutral bulk. Perhaps the correct reference for a charged atomic defect in a lattice is not the neutral bulk, but the charged bulk, so that the defect represents a perturbation of the charged lattice only, and not the neutral lattice.
The elastic dipole tensor Gij for a charged defect when defined in an overall neutral (with respect to the electron or hole reservoir) but locally charged lattice is then given as:
G i j = C i j k l [ Δ Ω k l r q Δ Ω r e f ]
where, [ Δ Ω k l r q Δ Ω r e f ] represents the corrected relaxation volume. As listed in Table 8, the corrected relaxation volumes of charged defects are more reasonable in magnitude when compared to relaxation volumes for both the neutral individual defects and those of defect reactions. For example, the corrected relaxation volume of −3.28 Å3 for the charged (2−) oxygen interstitial (overall neutral i.e., the oxygen interstitial with respect to doubly charged bulk UO2) compares very well with the volume of −3.20 Å3 of the reaction involving charged (2−) oxygen interstitial with two holes. Similar comparisons for other point defects in UO2 are also very good, because as can be seen in Figure 9, the slopes of change in volume of defects with charge are almost parallel to the slope of change in volume of bulk with charge. However, for Si and GaAs we observe that different defects have different slopes, suggesting that the effect of electrons and holes present in different defects leads to different strains and volume changes. We also acknowledge that the difference in the dependence of the change in volume on charge between different charged defects can originate due to the deep (localized) vs. the shallow (delocalized) nature of the defect [15]. However, in this work we do not assess the impact of deep vs. shallow nature of the defect on defect relaxation volumes because in both cases the relaxation volumes show strong sensitivity to the charged state.
Computing the dipole tensor (Equation (17)) of charged defects from the corrected relaxation volumes does result in physically reasonable magnitudes in the change in defect formation energy of the charged point defect upon interaction with external strains. Accounting for the change in volume of the electron reservoir with net charge in the definition of the defect formation volume and elastic dipole tensor allows us to reconcile these two perspectives: that defect behavior not only has meaning via reactions but that isolated defects in an overall neutral lattice (which requires the reservoir) also have unique properties that determine how they behave within the lattice.
Finally, returning to Figure 4 and the associated discussion, there is an interesting parallel in the concept of the charge reservoir highlighted in Figure 9 and the corrections described in Figure 4. In Figure 4, we decomposed the potential alignment correction into two parts, one due to the net charge introduced into the cell and another due to the defect itself. On the other hand, as highlighted by Figure 9 and Table 8, the largest component of the absolute relaxation volume is due to the net charge, not the defect. That is, the biggest contributor to both the relaxation volume and the corrections to the relaxation volume is the net charge, not the atomic relaxations due to the atomic defect. This highlights the importance of a physically meaningful description of how net charge impacts the volume of a system. Thus, the conclusion seems clear: to calculate the volume of a charged defect, one must be careful in how the source of the net charge is accounted for, in the same way one does for energy. This implies that the relaxation volumes associated with the defect depend on that reference or reservoir. We note that this choice is less important when considering defect reactions as the volume of the reservoir largely cancels out in these cases, unless one is exchanging charge with the environment.

5. Conclusions

To conclude, we have shown that point defect relaxation volumes, and the associated defect elastic dipole tensors which measure the elastic distortion of the bulk lattice caused by the presence of the defect, are unexpectedly large for charged defects in UO2. Defect relaxation volumes have a finite measure even for infinitely large system sizes, and we show that the large relaxation volume of charged defects is not due to finite-size artifacts within the DFT supercell approach, as previously suspected. Relaxation volumes using an overall neutral defect reaction model based on DFT calculations of isolated charged defects agree reasonably well in terms of the overall nature of lattice relaxation and magnitude when compared with the individual neutral defects simulated within a single DFT supercell. We conclude that, similar to the defect formation energies, the defect formation volumes also depend on the choice of reservoir. We show that by taking into account the contribution of change in charge to the volume of the electron reservoir, the recomputed charged defect formation volumes and elastic dipole tensors are reasonable in magnitude, and that it is possible to describe the elastic properties of isolated charge defects within the material, not only in the context of the overall defect reactions that produce the defect but also as individual species in an overall neutral lattice. This provides a route for using atomistic studies to determine a key property—the dipole tensor—for use in more applied studies that account for the interaction of defects with microstructure, including irradiation-induced creep, long-term radiation damage evolution, and mass transport in complex microstructures.

Author Contributions

A.G. performed the majority of the calculations and led the writing of the paper. K.M., R.G.H., A.C., and C.R.S. aided in interpreting the results. S.T.M. performed the CASTEP calculations. A.G., D.A.A., S.R.P. and B.P.U. conceived of the study, developed the research plan for the study, and were extensively involved in the discussion and analysis of the results. All authors contributed to editing the manuscript.

Funding

This research was funded by Department of Energy, Office of Nuclear Energy, Nuclear Energy University Program, grant number 10-2258, and the Department of Energy Nuclear Energy Advanced Modeling and Simulation (NEAMS) program.

Acknowledgments

A.G. is happy to acknowledge the Materials Science and Technology Division at Los Alamos National Laboratory for hospitality during this project. We also like to thank George Kresse and Christoph Freysoldt for their guidance and useful discussion on the charged defect correction schemes. The work of A.G. and S.R.P. was supported by the DOE-NE Nuclear Energy University Program 10-2258. This work was also funded by the Department of Energy Nuclear Energy Advanced Modeling and Simulation (NEAMS) program.

Conflicts of Interest

The authors declare no conflict of interest.

Data Availability

The data required to reproduce these finding will be made available to the journal.

References

  1. Seebauer, E.G.; Kratzer, M.C. Charged point defects in semiconductors. Mater. Sci. Eng. R Rep. 2006, 55, 57–149. [Google Scholar] [CrossRef]
  2. Was, G.S. Fundamentals of Radiation Materials Science; Springer: Berlin, Germany, 2007; ISBN 9783540494720. [Google Scholar]
  3. Cargill, G.S.; Angilello, J.; Kavanagh, K.L. Lattice Compression from Conduction Electrons in Heavily Doped Si:As. Phys. Rev. Lett. 1988, 61, 1748–1751. [Google Scholar] [CrossRef] [PubMed]
  4. Janotti, A.; Jalan, B.; Stemmer, S.; Van De Walle, C.G. Effects of doping on the lattice parameter of SrTiO3. Appl. Phys. Lett. 2012, 100, 262104. [Google Scholar] [CrossRef]
  5. Gillan, M.J. The volume of formation of defects in ionic crystals. Philos. Mag. A 1981, 43, 301–312. [Google Scholar] [CrossRef]
  6. Lidiard, A. The volume of formation of Schottky defects in ionic crystals. Philos. Mag. A 1981, 43, 291–300. [Google Scholar] [CrossRef]
  7. Nazarov, R.; Majevadia, J.S.; Patel, M.; Wenman, M.R.; Balint, D.S.; Neugebauer, J.; Sutton, A.P. First-principles calculation of the elastic dipole tensor of a point defect: Application to hydrogen in α-zirconium. Phys. Rev. B 2016, 94, 241112. [Google Scholar] [CrossRef] [Green Version]
  8. Van de Walle, C.G. Effects of impurities on the lattice parameters of GaN. Phys. Rev. B Condens. Matter Mater. Phys. 2003, 68, 165209. [Google Scholar] [CrossRef] [Green Version]
  9. Bruneval, F.; Freyss, M.; Crocombette, J.-P. Lattice constant in nonstoichiometric uranium dioxide from first principles. Phys. Rev. Mater. 2018, 2, 023801. [Google Scholar] [CrossRef] [Green Version]
  10. Clouet, E.; Garruchet, S.; Nguyen, H.; Perez, M.; Becquart, C.S. Dislocation interaction with C in α-Fe: A comparison between atomic simulations and elasticity theory. Acta Mater. 2008, 56, 3450–3460. [Google Scholar] [CrossRef] [Green Version]
  11. Goyal, A.; Phillpot, S.R.; Subramanian, G.; Andersson, D.A.; Stanek, C.R.; Uberuaga, B.P. Impact of homogeneous strain on uranium vacancy diffusion in uranium dioxide. Phys. Rev. B 2015, 91, 094103. [Google Scholar] [CrossRef] [Green Version]
  12. Centoni, S.; Sadigh, B.; Gilmer, G.; Lenosky, T.; Díaz de la Rubia, T.; Musgrave, C. First-principles calculation of intrinsic defect formation volumes in silicon. Phys. Rev. B 2005, 72, 195206. [Google Scholar] [CrossRef] [Green Version]
  13. Windl, W.; Daw, M. International Conference on Modeling and SImulatuion of Microsystems—MSM 2002; Laudon, M., Romanowicz, B., Eds.; Computational Publications: Cambridge, MA, USA, 2002; pp. 494–497. [Google Scholar]
  14. Bruneval, F.; Crocombette, J.-P. Ab initio formation volume of charged defects. Phys. Rev. B 2012, 86, 140103. [Google Scholar] [CrossRef]
  15. Bruneval, F.; Varvenne, C.; Crocombette, J.-P.; Clouet, E. Pressure, relaxation volume, and elastic interactions in charged simulation cells. Phys. Rev. B 2015, 91, 024107. [Google Scholar] [CrossRef] [Green Version]
  16. Erhart, P.; Albe, K.; Klein, A. First-principles study of intrinsic point defects in ZnO: Role of band structure, volume relaxation, and finite-size effects. Phys. Rev. B 2006, 73, 205203. [Google Scholar] [CrossRef] [Green Version]
  17. Ágoston, P.; Albe, K. Formation entropies of intrinsic point defects in cubic In2O3 from first-principles density functional theory calculations. Phys. Chem. Chem. Phys. 2009, 11, 3226–3232. [Google Scholar] [CrossRef]
  18. Grieshammer, S.; Zacherle, T.; Martin, M. Entropies of defect formation in ceria from first principles. Phys. Chem. Chem. Phys. 2013, 15, 15935–15942. [Google Scholar] [CrossRef]
  19. Kim, H.; Trinkle, D.R. Effect of charge on point defect size misfits from ab initio: Aliovalently doped SrTiO3. Comput. Mater. Sci. 2016, 119, 41–45. [Google Scholar] [CrossRef] [Green Version]
  20. Gillan, M.J. The elastic dipole tensor for point defects in ionic crystals. J. Phys. C Solid State Phys. 1984, 17, 1473. [Google Scholar] [CrossRef]
  21. Nowick, A.; Berry, B. Anelastic Relaxation in Crystalline Solids; Academic Press: New York, NY, USA, 1972. [Google Scholar]
  22. Freedman, D.A.; Roundy, D.; Arias, T.A. Elastic effects of vacancies in strontium titanate: Short- and long-range strain fields, elastic dipole tensors, and chemical strain. Phys. Rev. B 2009, 80, 064108. [Google Scholar] [CrossRef] [Green Version]
  23. Puchala, B.; Falk, M.L.; Garikipati, K. Elastic effects on relaxation volume tensor calculations. Phys. Rev. B 2008, 77, 174116. [Google Scholar] [CrossRef] [Green Version]
  24. Hinterberg, J.; Zacherle, T.; De Souza, R.A. Activation Volume Tensor for Oxygen-Vacancy Migration in Strained CeO2 Electrolytes. Phys. Rev. Lett. 2013, 110, 205901. [Google Scholar] [CrossRef] [PubMed]
  25. Windl, W.; Daw, M. Predictive Process Simulation and Ab-initio Calculation of the Physical Volume of Electrons in Silicon. Nanotech 2002, 2, 197–200. [Google Scholar]
  26. Dorado, B.; Garcia, P.; Carlot, G.; Davoisne, C.; Fraczkiewicz, M.; Pasquet, B.; Freyss, M.; Valot, C.; Baldinozzi, G.; Siméone, D.; et al. First-principles calculation and experimental study of oxygen diffusion in uranium dioxide. Phys. Rev. B 2011, 83, 035126. [Google Scholar] [CrossRef]
  27. Andersson, D.A.; Uberuaga, B.P.; Nerikar, P.V.; Unal, C.; Stanek, C.R. U and Xe transport in UO2±x: Density functional theory calculations. Phys. Rev. B 2011, 84, 054105. [Google Scholar] [CrossRef] [Green Version]
  28. Dorado, B.; Andersson, D.A.; Stanek, C.R.; Bertolus, M.; Uberuaga, B.P.; Martin, G.; Freyss, M.; Garcia, P. First-principles calculations of uranium diffusion in uranium dioxide. Phys. Rev. B 2012, 86, 035110. [Google Scholar] [CrossRef] [Green Version]
  29. Nerikar, P.; Watanabe, T.; Tulenko, J.S.; Phillpot, S.R.; Sinnott, S.B. Energetics of intrinsic point defects in uranium dioxide from electronic-structure calculations. J. Nucl. Mater. 2009, 384, 61–69. [Google Scholar] [CrossRef]
  30. Kresse, G.; Hafner, J. Ab initio molecular dynamics for liquid metals. Phys. Rev. B 1993, 47, 558. [Google Scholar] [CrossRef]
  31. Kresse, G.; Furthmüller, J. Efficient iterative schemes for ab initio total-energy calculations using a plane-wave basis set. Phys. Rev. B 1996, 54, 11169. [Google Scholar] [CrossRef]
  32. Blöchl, P.E. Projector augmented-wave method. Phys. Rev. B 1994, 50, 17953. [Google Scholar] [CrossRef] [Green Version]
  33. Kresse, G. From ultrasoft pseudopotentials to the projector augmented-wave method. Phys. Rev. B 1999, 59, 1758. [Google Scholar] [CrossRef]
  34. Perdew, J.P.; Zunger, A. Self-interaction correction to density-functional approximations for many-electron systems. Phys. Rev. B 1981, 23, 5048. [Google Scholar] [CrossRef] [Green Version]
  35. Liechtenstein, A.I.; Zaanen, J. Density-functional theory and strong interactions: Orbital ordering in Mott-Hubbard insulators. Phys. Rev. B 1995, 52, R5467. [Google Scholar] [CrossRef] [PubMed] [Green Version]
  36. Andersson, D.; Garcia, P.; Liu, X.; Pastore, G.; Tonks, M.; Millett, P.; Dorado, B.; Gaston, D.R.; Andrs, D.; Williamson, R.L.; et al. Atomistic modeling of intrinsic and radiation-enhanced fission gas (Xe) diffusion in: Implications for nuclear fuel performance modeling. J. Nucl. Mater. 2014, 451, 225–242. [Google Scholar] [CrossRef]
  37. Perdew, J.P.; Burke, K.; Ernzerhof, M. Generalized Gradient Approximation Made Simple. Phys. Rev. Lett. 1996, 77, 3865. [Google Scholar] [CrossRef] [PubMed] [Green Version]
  38. Kumagai, Y.; Oba, F. Electrostatics-based finite-size corrections for first-principles point defect calculations. Phys. Rev. B 2014, 89, 195205. [Google Scholar] [CrossRef] [Green Version]
  39. Freysoldt, C.; Neugebauer, J.; Van de Walle, C.G. Electrostatic interactions between charged defects in supercells. Phys. Status Solidi 2011, 248, 1067–1076. [Google Scholar] [CrossRef]
  40. Baroni, S.; Resta, R. Ab initio calculation of the macroscopic dielectric constant in silicon. Phys. Rev. B 1986, 33, 7017. [Google Scholar] [CrossRef]
  41. Gajdoš, M.; Hummer, K.; Kresse, G.; Furthmüller, J.; Bechstedt, F. Linear optical properties in the projector-augmented wave methodology. Phys. Rev. B 2006, 73, 045112. [Google Scholar] [CrossRef] [Green Version]
  42. Dorado, B.; Freyss, M.; Amadon, B.; Bertolus, M.; Jomard, G.; Garcia, P. Advances in first-principles modelling of point defects in UO2: F electron correlations and the issue of local energy minima. J. Phys. Condens. Matter 2013, 25, 333201. [Google Scholar] [CrossRef]
  43. Clark, S.J.; Segall, M.D.; Pickard, C.J.; Hasnip, P.J.; Probert, M.I.J.; Refson, K.; Payne, M.C. First principles methods using CASTEP. Z. Krist. Cryst. Mater. 2005, 220, 567–570. [Google Scholar] [CrossRef] [Green Version]
  44. Sanati, M.; Albers, R.C.; Lookman, T.; Saxena, A. Elastic constants, phonon density of states, and thermal properties of UO2. Phys. Rev. B 2011, 84, 014116. [Google Scholar] [CrossRef]
  45. Hampton, N.; Saunders, G.A.; Harding, J.H.; Stoneham, A.M. The dielectric constant of UO2 below the Ne’el point. J. Nucl. Mater. 1987, 149, 18–20. [Google Scholar] [CrossRef] [Green Version]
  46. Lee, B.; Rudd, R.E. First-principles calculation of mechanical properties of Si<001> nanowires and comparison to nanomechanical theory. Phys. Rev. B 2007, 75, 195328. [Google Scholar] [CrossRef] [Green Version]
  47. McSkimin, H.J. Measurement of Elastic Constants at Low Temperatures by Means of Ultrasonic Waves–Data for Silicon and Germanium Single Crystals, and for Fused Silica. J. Appl. Phys. 1953, 24, 988–997. [Google Scholar] [CrossRef]
  48. Madelung, O. Semiconductors; Springer: Berlin, Heidelberg, 1991; ISBN 978-3-540-53150-0. [Google Scholar]
  49. Komsa, H.-P.; Rantala, T.T.; Pasquarello, A. Finite-size supercell correction schemes for charged defect calculations. Phys. Rev. B 2012, 86, 045112. [Google Scholar] [CrossRef] [Green Version]
  50. Cooper, A.S. Precise lattice constants of germanium, aluminum, gallium arsenide, uranium, sulphur, quartz and sapphire. Acta Crystallogr. 1962, 15, 578–582. [Google Scholar] [CrossRef] [Green Version]
  51. Garland, C.W.; Park, K.C. Low-Temperature Elastic Constants of Gallium Arsenide. J. Appl. Phys. 1962, 33, 759–760. [Google Scholar] [CrossRef]
  52. Freysoldt, C.; Grabowski, B.; Hickel, T.; Neugebauer, J.; Kresse, G.; Janotti, A.; Van de Walle, C.G. First-principles calculations for point defects in solids. Rev. Mod. Phys. 2014, 86, 253. [Google Scholar] [CrossRef]
  53. Freysoldt, C.; Neugebauer, J.; Walle, C. Van de Fully ab initio finite-size corrections for charged-defect supercell calculations. Phys. Rev. Lett. 2009, 102, 016402. [Google Scholar] [CrossRef] [Green Version]
  54. Garikipati, K.; Falk, M.; Bouville, M.; Puchala, B.; Narayanan, H. The continuum elastic and atomistic viewpoints on the formation volume and strain energy of a point defect. J. Mech. Phys. Solids 2006, 54, 1929–1951. [Google Scholar] [CrossRef] [Green Version]
  55. Desgranges, L.; Baldinozzi, G.; Rousseau, G.; Nièpce, J.-C.; Calvarin, G. Neutron Diffraction Study of the in Situ Oxidation of UO2. Inorg. Chem. 2009, 48, 7585–7592. [Google Scholar] [CrossRef] [PubMed]
  56. Heine, V. Crystal structure of gallium metal. J. Phys. C Solid State Phys. 1968, 1, 222. [Google Scholar] [CrossRef]
  57. Schiferl, D.; Barrett, C.S. The crystal structure of arsenic at 4.2, 78 and 299 °K. J. Appl. Crystallogr. 1969, 2, 30–36. [Google Scholar] [CrossRef]
  58. Barrett, C.S.; Mueller, M.H.; Hitterman, R.L. Crystal Structure Variations in Alpha Uranium at Low Temperatures. Phys. Rev. 1963, 129, 625. [Google Scholar] [CrossRef]
  59. Allen, G.C.; Holmes, N.R. A mechanism for the UO2 to α-U3O8 phase transformation. J. Nucl. Mater. 1995, 223, 231–237. [Google Scholar] [CrossRef]
  60. Goyal, A.; Rudzik, T.; Deng, B.; Hong, M.; Chernatynskiy, A.; Sinnott, S.B.; Phillpot, S.R. Segregation of ruthenium to edge dislocations in uranium dioxide. J. Nucl. Mater. 2013, 441, 96–102. [Google Scholar] [CrossRef]
  61. Makov, G.; Payne, M. Periodic boundary conditions in ab initio calculations. Phys. Rev. B 1995, 51, 4014. [Google Scholar] [CrossRef] [Green Version]
  62. Lany, S.; Zunger, A. Assessment of correction methods for the band-gap problem and for finite-size effects in supercell defect calculations: Case studies for ZnO and GaAs. Phys. Rev. B 2008, 78, 235104. [Google Scholar] [CrossRef] [Green Version]
  63. Leslie, M.; Gillan, N.J. The energy and elastic dipole tensor of defects in ionic crystals calculated by the supercell method. J. Phys. C Solid State Phys. 1985, 18, 973. [Google Scholar] [CrossRef]
  64. Murphy, S.T.; Hine, N.D.M. Anisotropic charge screening and supercell size convergence of defect formation energies. Phys. Rev. B 2013, 87, 094111. [Google Scholar] [CrossRef] [Green Version]
  65. Lany, S.; Zunger, A. Accurate prediction of defect properties in density functional supercell calculations. Model. Simul. Mater. Sci. Eng. 2009, 17, 084002. [Google Scholar] [CrossRef] [Green Version]
  66. Taylor, S.E.; Bruneval, F. Understanding and correcting the spurious interactions in charged supercells. Phys. Rev. B 2011, 84, 075155. [Google Scholar] [CrossRef]
  67. Bader, R.F.W. Atoms in Molecules: A Quantum Theory; International Series of Monographs on Chemistry; Clarendon Press: Oxford, UK, 1990; ISBN 9780198551683. [Google Scholar]
  68. Henkelman, G.; Arnaldsson, A.; Jónsson, H. A fast and robust algorithm for Bader decomposition of charge density. Comput. Mater. Sci. 2006, 36, 354–360. [Google Scholar] [CrossRef]
  69. Dorado, B.; Jomard, G.; Freyss, M.; Bertolus, M. Stability of oxygen point defects in UO2 by first-principles DFT+U calculations: Occupation matrix control and Jahn-Teller distortion. Phys. Rev. B 2010, 82, 035114. [Google Scholar] [CrossRef]
  70. Stoneham, A.M.; Gavartin, J.; Shluger, A.L.; Kimmel, A.V.; Ramo, D.M.; Rønnow, H.M.; Aeppli, G.; Renner, C. Trapping, self-trapping and the polaron family. J. Phys. Condens. Matter 2007, 19, 255208. [Google Scholar] [CrossRef]
  71. Kröger, F.A.; Vink, H.J. Relations between the Concentrations of Imperfections in Crystalline Solids. Solid State Phys. Adv. Res. Appl. 1956, 3, 307–435. [Google Scholar]
  72. Crocombette, J.; Jollet, F.; Nga, L.; Petit, T. Plane-wave pseudopotential study of point defects in uranium dioxide. Phys. Rev. B 2001, 64, 104107. [Google Scholar] [CrossRef] [Green Version]
  73. Kutty, T.R.; Hegde, P.; Khan, K.; Basak, U.; Pillai, S.; Sengupta, A.; Jain, G.; Majumdar, S.; Kamath, H.; Purushotham, D.S. Densification behaviour of UO2 in six different atmospheres. J. Nucl. Mater. 2002, 305, 159–168. [Google Scholar] [CrossRef]
  74. Andersson, D.A.; Baldinozzi, G.; Desgranges, L.; Conradson, D.R.; Conradson, S.D. Density Functional Theory Calculations of UO2 Oxidation: Evolution of UO2+x, U4O9−y, U3O7, and U3O8. Inorg. Chem. 2013, 52, 2769–2778. [Google Scholar] [CrossRef]
  75. Jedvik, E.; Lindman, A.; Benediktsson, M.Þ.; Wahnström, G. Size and shape of oxygen vacancies and protons in acceptor-doped barium zirconate. Solid State Ion. 2015, 275, 2–8. [Google Scholar] [CrossRef] [Green Version]
Figure 1. Relaxation volume of a single neutral and charged (a) uranium vacancy in UO2, (b) Ga vacancy in GaAs, and (c) Si vacancy as function of the inverse of the supercell size (the corresponding number of atoms in the cell is provided on the upper x-axis).
Applsci 09 05276 g001
Figure 2. (a) Planar-averaged charge density difference across the supercell for V U 4 as obtained from static (non-relaxed) DFT calculations. The difference is taken between the charge densities of the charged defect and bulk. (b) Planar-averaged potential difference ( V q DFT V b DFT ) across the supercell for V U 4 , as obtained from DFT calculations (blue curve). The model potential (Vmodel) from the Gaussian charge is shown in red, and the difference potential Δ V q b is shown in green. The z-axis distance is measured from the location of the defect. The potential falls off again at a distance of ~16 Å as that is the size of the cell and where the periodic image of the defect is located. Results are shown for a 144 atom UO2 supercell with volume of 1936.76 Å3.
Applsci 09 05276 g002
Figure 3. Formation energy of strained charged defects (a) ( V U 4 ) and (b) ( V Ga 3 ) with and without potential alignment correction. (top panels) The potential alignment is computed with respect to the strained bulk of same volume, and (bottom panels) the potential alignment is computed with respect to the pristine unstrained bulk. The dashed lines indicate the corresponding relaxation volumes extracted from these calculations.
Applsci 09 05276 g003
Figure 4. Formation energy of charged (a) uranium and (b) gallium vacancy with and without alignment correction, when computed for the strained defect with respect to the unstrained (pristine) bulk. The contributions to the large volume change due to the potential alignment correction (left most figures) is broken into two parts: the volume change associated with computing the potential alignment correction of the strained defect with strained and neutral bulk (middle panels), and strained bulk (in the same charge state as the defect) with respect to the pristine neutral bulk (right panels).
Applsci 09 05276 g004
Figure 5. Difference in charge density (xy-planar averaged) between supercells containing an extra electron and bulk along the z-axis in UO2 (top) and GaAs (bottom). The difference in charge density is normalized by the maximum value of the difference.
Applsci 09 05276 g005
Figure 6. (a) Charge density (slice along a (110) plane containing both U and O atoms) for bulk UO2; (b) difference in charge density (within the same (110) plane) between the supercell with the extra electron and bulk UO2, and (c) between the supercell containing a hole and bulk UO2.
Applsci 09 05276 g006
Figure 7. Relative change (Δd/d0) in average nearest neighbor distances (in %) between the structures with an extra electron (or hole) and the bulk: (a) electron, and (b) hole in UO2; (c) electron, and (d) hole in GaAs. The red dashed line marks the % fraction volume change in the entire supercell (which is supercell size dependent), to show the overall expansion or contraction of the lattice, relative to a neutral system, in the respective cases. The black dashed line indicates zero change, for reference. In both materials, addition of an extra electron leads to a net expansion of the cell while a hole induces a contraction. In the case of UO2, because the charge localizes, there is an extra distortion in the neighborhood of the localized charge.
Applsci 09 05276 g007
Figure 8. Relative change (Δd/d0) in nearest neighbor distances (solid circles) induced by the uranium vacancy in the neutral (blue) and charged (4−) (red) state in: (a) 2 × 2 × 3 and (b) 3 × 3 × 3 DFT supercells. The dashed lines mark the % fraction volume change of the entire supercell, relative to a defect-free neutral system, to show the overall expansion or contraction of the lattice in the respective cases.
Applsci 09 05276 g008
Figure 9. Defect relaxation volume as a function of the overall charge on the DFT supercell for point defects and bulk in (a) UO2, (b) GaAs, and (c) Si.
Applsci 09 05276 g009
Table 1. Calculated lattice parameters, a0 in Å, elastic constants, Cij, and bulk modulus, B, in GPa and the static (electronic + ionic contribution) dielectric constant, ε, from density-functional theory (DFT) calculations in UO2 (local spin density approximation; LSDA + U), Si (GGA) and GaAs (local density approximation, LDA). Our results are indicated in italics while literature values are provided for comparison.
System a 0 C 11 C 12 C 44 Bε
U O 2 5.451377.8133.278.2220.521.53
DFT [44]5.448380.9140.463.2220.620.9
Expt. [45] 5.473389.3118.759.7209.023.6
S i 5.468153.156.874.688.913.1
DFT [40,46]5.47154.658.174.490.212.98
Expt. [47,48]5.431167.765.080.499.211.17
G a A s 5.628117.454.156.075.218.7
DFT [38,49]5.627124.251.463.475.617.9
Expt. [50,51]5.654121.754.661.676.913.1
Table 2. Computed defect relaxation volumes, Δ Ω r 3), normalized relaxation volume, ΔΩr/Ωunit, for charged and neutral point defects calculated from DFT calculations. For reference, for UO2 and GaAs, the volume per formula unit (Ωunit) is 40.3 Å3 (ΩUO2), and 44.6 Å3 (ΩGaAs) respectively, and for Si the atomic volume is 20.4 Å3 (ΩSi). The values are obtained from 144 atom supercells for UO2, and 216 atom supercells for Si and GaAs.
SystemDefect Δ Ω r Δ Ω r Ω u n i t
UO2 V U 0 −9.1−0.22
V U 4 40.51.05
V O 0 0.560.01
V O 2 + −16.7−0.41
O i 0 −3.38−0.08
O i 2 20.00.49
GaAs V Ga 0 −26.3−1.12
V Ga 3 31.21.42
V As 0 −24.4−1.09
V As 3 + −73.5−3.3
Si V Si 0 −14.7−0.72
V Si 2 + −42.8−2.1
V Si 2 28.11.38
Table 3. Computed defect dipole tensors, for fully charged and neutral point defects calculated from DFT calculations.
DefectChargeG11G22G22G12G13G23
V U 4−56.0855.1856.970.320.190.11
0−10.52−16.86−9.04−0.163.06−1.48
V O 2+−22.12−24.01−22.69−0.140.020.05
00.241.021.060.02−0.010.0
O i 2−27.8726.8128.56−0.08−0.37−0.33
0−4.83−4.82−4.29−0.320.150.0
Table 4. Calculated energy correction ( Δ E c o r r I m a g e ) to the defect formation energy (in eV) due to image interaction between charged defects, and the corresponding correction to pressure (in GPa) (1 eV/Å3 = 160.2 GPa) and volume (in Å3) for representative charged defects in 144 atom supercells for UO2 supercell, and 216 atom supercells for Si and GaAs.
Defect E c o r r i m a g e Δ P c o r r i m a g e Δ Ω c o r r i m a g e Δ Ω r
V U 4 1.07−0.030.2840.2
V G a 3 0.65−0.010.3931.2
V S i 2 0.57−0.020.3416.5
Table 5. Relaxation volume, Δ Ω r 3), of an electron and a hole from DFT calculations in Si, GaAs, and UO2. All volumes are given relative to the volume of one formula unit in the perfect supercell. These are ΩSi = 20.4 Å3, ΩGaAs = 44.56 Å3, and ΩUO2 = 40.35 Å3.
DefectSiGaAsUO2
Electron0.74ΩSi0.53ΩGaAs0.28ΩUO2
Hole−0.84ΩSi−0.48ΩGaAs−0.28ΩUO2
Table 6. Comparison of the defect relaxation volume (Å3) of neutral individual defects computed within a single (one) supercell (labeled OS) or via a sum of defect relaxation volumes of individual charge defects computed in separate supercells.
Defects Σ   Δ Ω r Defect Δ Ω r
V O ¨ + O i 3.26 V O ¨ + O i (OS)3.63
V U + 4 h ˙ −6.26 V U × −9.07
O i + 2 h ˙ −3.20 O i × −3.38
V O ¨ + 2 e 6.52 V O × 0.56
V Ga + 3 h ˙ −33.83 V Ga × −26.29
V Si ¨ + 2 e −12.39 V Si × −14.69
Table 7. Comparison of the corrected defect formation volumes Δ Ω f 3) of neutral and charged individual defects, with the defect relaxation volumes Δ Ω r x n .
Defect ReactionIndividual Defects
Defects Δ Ω r x n Defect Δ Ω f Defect Δ Ω f
V U (Equation (14))−10.84 V U −10.8 V U × −13.97
O i (Equation (12))−25.8 O i −25.83 O i × −26.01
V O ¨ 29.15 V O ¨ 29.13 V O × 23.19
V Ga −13.49 V Ga −16.26 V Ga × −5.95
V Si ¨ 8.05 V Si ¨ 9.92 V Si × 5.75
Table 8. Comparison of the corrected defect relaxation volume [ Δ Ω r q Δ Ω r e f ] 3) of neutral and charged individual defects, with the sum of defect relaxation volumes of individual charge defects computed in separate supercells under the defect reaction approach. Some of these values appeared in Table 6 but are reproduced here for convenience.
Defect ReactionIndividual Defect
Defects Σ   Δ Ω r Defect Δ Ω r q Δ Ω r e f Defect Δ Ω r q Δ Ω r e f
V U + 4 h ˙ −6.26 V U −6.02 V U × -9.07
O i + 2 h Δ −3.20 O i −3.28 O i × −3.38
V O ¨ + 2 e 6.52 V O ¨ 6.54 V O × 0.56
V Ga + 3 h Δ −33.83 V Ga −36.07 V Ga × −26.29
V Si ¨ + 2 e −12.39 V Si ¨ −10.57 V Si × −14.69

