Article

Shear Load-Displacement Curves of PVA Fiber-Reinforced Engineered Cementitious Composite Expansion Joints in Steel Bridges

1
School of Mining and Technology, Inner Mongolia University of Technology, Hohhot 010051, China
2
School of Materials Science and Engineering, Inner Mongolia University of Technology, Hohhot 010051, China
*
Authors to whom correspondence should be addressed.
Appl. Sci. 2019, 9(24), 5275; https://doi.org/10.3390/app9245275
Submission received: 11 November 2019 / Revised: 29 November 2019 / Accepted: 30 November 2019 / Published: 4 December 2019
(This article belongs to the Special Issue Assessment of High-Performance Fiber-Reinforced Concrete Properties)

Abstract

:

Featured Application

Authors are encouraged to provide a concise description of the specific application or a potential application of the work. This section is not mandatory.

Abstract

The concrete in the transition strips of expansion joints can become damaged prematurely during the service period. Polyvinyl alcohol (PVA) fiber-reinforced engineered cementitious composite (ECC) is a kind of high ductility concrete material, and its ultimate uniaxial tensile strain is more than 3%. It can be used to improve the damage status of expansion joints. Based on previous research results, ECCs were used in the pilot project of bridge expansion joints. Under this engineering background, the shear load-displacement curves of ECC expansion joints were studied through 27 groups of compression-shear tests of ECC/steel composite structures. The shear failure characteristics of ECC expansion joints were analyzed by the digital image correlation method. A shear load-displacement curve model of the composite structures was proposed based on the equivalent strain assumption and Weibull distribution theory. The results show that the failure mode of the composite structure specimens was ECC shear cracking. Stress and strain field nephograms were used to explain the failure characteristics of the composite structure specimens. The calculated curves of the shear load-displacement model of the composite structures were in good agreement with the experimental curves. The work is of great importance to the shear design of ECC expansion joints and their further engineering applications.

1. Introduction

In the design of bridge structures, the function of expansion joints is to provide a good connection between the bridge deck and pavement or bridge deck and bridge deck during free expansion [1,2]. The expansion joint is the weak part of a bridge structure [3]. For steel box girder bridges, the concrete in the transition strips of expansion joints bears the worst wheel load shear load along the layered points between the pavement and the steel deck under a driving load, especially under acceleration/braking loads [4].
Cracking occurs in most of the concrete in the transition zone of expansion joints in operating bridges, which has a negative impact on the service life of bridges [5,6]. Quinn et al. [7] investigated bridge expansion joints in northeastern Massachusetts, USA, and evaluated their performances. It was found that most expansion joints had service lives of less than four years, and the concrete cracking in the transition zone was severe. The Su-Tong Yangtze River Highway Bridge in China was completed and opened to traffic in May 2008. During the past 10 years, its expansion joints have been repaired many times. In July 2015, due to the damage of the expansion joint of the north–south approach bridge, its maintenance and construction period was 40 days, which was the longest construction period since the bridge was opened to traffic. Lachinger et al. [8] investigated the damage of expansion joints of bridges in Australia. The conclusion was that the cracking of expansion joint concrete was severe. The cracking problem of bridge expansion joints has become one of the most significant structural defects of these systems [9,10].
To solve the problem of frequent cracking of the expansion joint concrete, the feasibility of applying different kinds of high-performance concretes in expansion joints from the perspective of the material properties was studied by researchers [11]. Yu et al. [12] studied the feasibility of the application of a polymer-modified asphalt mixture in expansion joints. Four polymer-modified asphalt mixture expansion joints were installed in two bridges. Ultra-high performance concrete, with high compressive strengths, high tensile strengths, low creep, and good durability, provided one of the solutions for the connection design and construction of prefabricated bridge systems. Zhou et al. [13] reported the engineering application of ultra-high performance concrete in bridge expansion joints in the United States, Canada, and other countries.
These studies provide some choices for improving the damage of bridge expansion joints. However, the occurrence of cracks cannot be fundamentally eliminated, and the problem of premature occurrence of diseases of the concrete in transition zones still exists [14].
Engineered cementitious composite (ECC) possesses a tensile strain capacity of more than 3% (300–500-fold higher than that of ordinary concrete) during the uniaxial tension phase due to closely spaced multiple cracks with crack widths that are usually no more than 100 μm. Under severe flexural loading, the deformation capacity of ECC plates is similar to that of metal material. It exhibits excellent application potential [15,16]. At present, ECC has been initially applied to bridge deck repairs, steel deck pavements, and bridge reinforcement engineering with good results [17,18].
Based on the excellent performance of ECC and the previous research of our team, ECC was used as the material of the expansion joint transition zone in this study. Considering the worst-case-scenario shear action, the shear behavior of the ECC in the transition zone was studied. This study will promote the research results of new ECC materials in practical engineering applications.

2. Engineering Application and Experimental Design

Engineering Application

The Second Ring Viaduct Expressway Project in Hohhot, China, has required an investment of about 300 million dollars, with a total length of 65.31 km. It was completed and opened to traffic in August 2015. In the construction of this project, advanced construction methods, excellent structural forms, and new building materials were applied.
In collaboration with the China First Highway Engineering Co., Ltd. and Hohhot Urban and Rural Construction Committee, we applied ECC to the pilot project of expansion joints of a steel box girder bridge of the expressway to improve the status of frequent destruction of expansion joints during service. The steel box girder of the ECC expansion joint pilot project consisted of a single box, double chamber, and fully welded steel box girder, which were made from Q345q-E steel. The main line was a six-lane dual carriageway viaduct with a design speed of 80 km/h and a standard cross section of 13 + 3 + 13 m. The expansion joint structure of the pilot project is shown in Figure 1a. The expansion joint device was a modular bridge expansion device. The section form of the expansion joint area and the stress in the transition zone of the expansion joint under vehicular wheel load are shown in Figure 1b.
The transitions strip material of the expansion joint was originally designed as steel fiber-reinforced concrete (SFRC). The upper part (thickness of 150 mm) of the expansion joint in the demonstration section was replaced by ECC, and the lower part was poured with the SFRC. The process of the ECC expansion joint pouring, vibration, and surface treatment is shown in Figure 2. In this project, four ECC expansion joints were completed, and the amount of ECC material used was about 10 m3.
The viaduct expressway has been in operation for four years. During this period, our team conducted many investigations and collected relevant data on the ECC expansion joints of the experimental demonstration section. As shown in Figure 3a,b, it was a steel fiber-reinforced concrete expansion joint. During the curing period, as shown in Figure 3b, many microcracks appeared prematurely on the concrete surface of the expansion joints, and the cracking phenomenon of the concrete was further aggravated under long-term vehicle loading. In less than one year, as shown in Figure 3a, a large area of visible cracks appeared. Relevant departments have made several repairs to the cracks in the SFRC expansion joints. The ECC expansion joint after four years of operation is shown in Figure 3c,d. Compared with the SFRC expansion joints, there were no visible cracks in the ECC expansion joints. Thus, the ECC expansion joint performed excellently.
ECC/steel composite structure specimens were used in shear tests. As shown in Figure 4a,b, the specimens were composed of 50 mm-thick ECC and a 10 mm-thick alveolar steel plate, and the shear sections were 100 × 100 mm.
The test parameters were as follows: S was related to the width of the post-poured ECC, W was related to the cross-layer width between the pavement and steel plate, and H was related to the thickness of steel bridge deck. S was 30, 40, and 50 mm; W was 10, 15, and 20 mm; and H was 5, 10, and 20 mm. T is the thickness of the pavement, which is related to H. The sample names of all the specimens for each set of parameters are shown in Table 1. The naming convention of the specimens was in the form of “s (spacing of teeth) w (width of teeth) h (height of teeth)”.
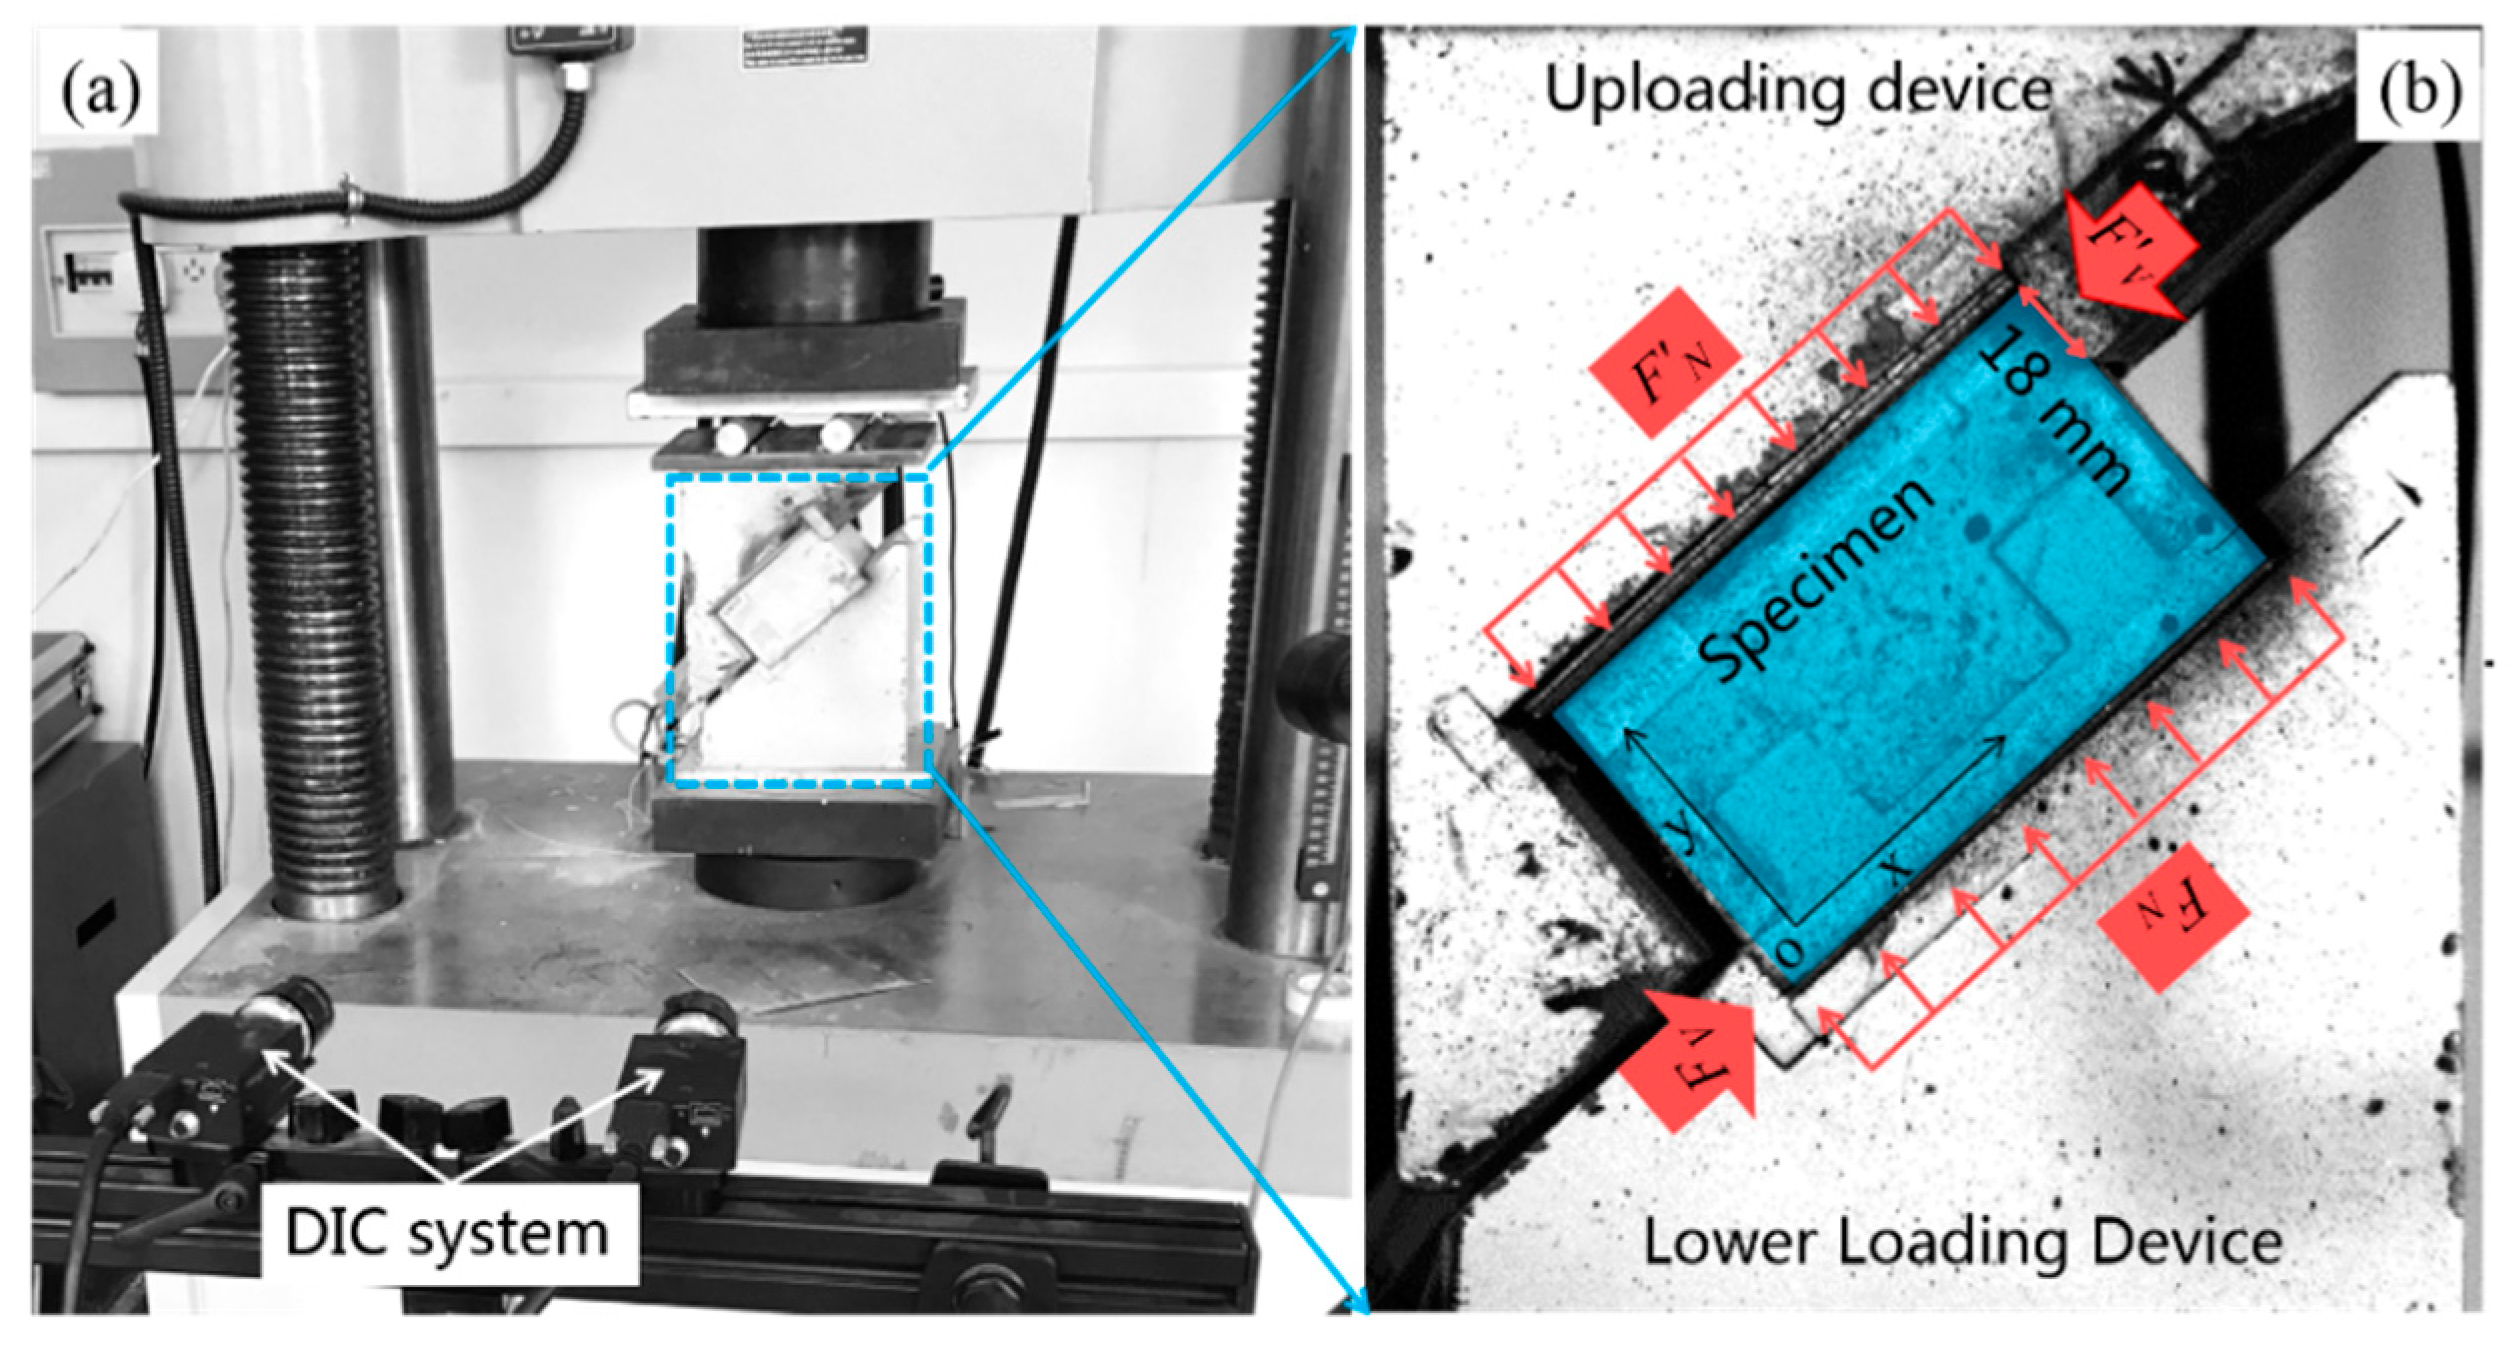
As shown in Figure 5a, the compression-shear test was carried out using a universal testing machine. The loading rate was 2 mm/min. The angle of compression-shear was α = 45°. Two linear variable differential transformer sensors were installed at the ECC materials and steel plate to measure the shear displacement. The shear load was measured by an external load sensor and continuously collected using a DH3820 acquisition system. The loading details are shown in Figure 5b. Based on the digital image correlation (DIC) method, the deformation fields of the composite structure specimens during the loading process were continuously measured using a VIC-3D non-contact full-field strain measurement and analysis system, as shown in Figure 5a.
The raw materials used to prepare the ECC were as follows: 42.5 R ordinary Portland cement; Fly ash; Sika-III superplasticizer; 70–140 mesh quartz sand, used as fine aggregate; and polymer fiber: K-II PVA fiber. The properties of the fibers are shown in Table 2. Table 3 shows the proportion of each material. Common domestic water was used.
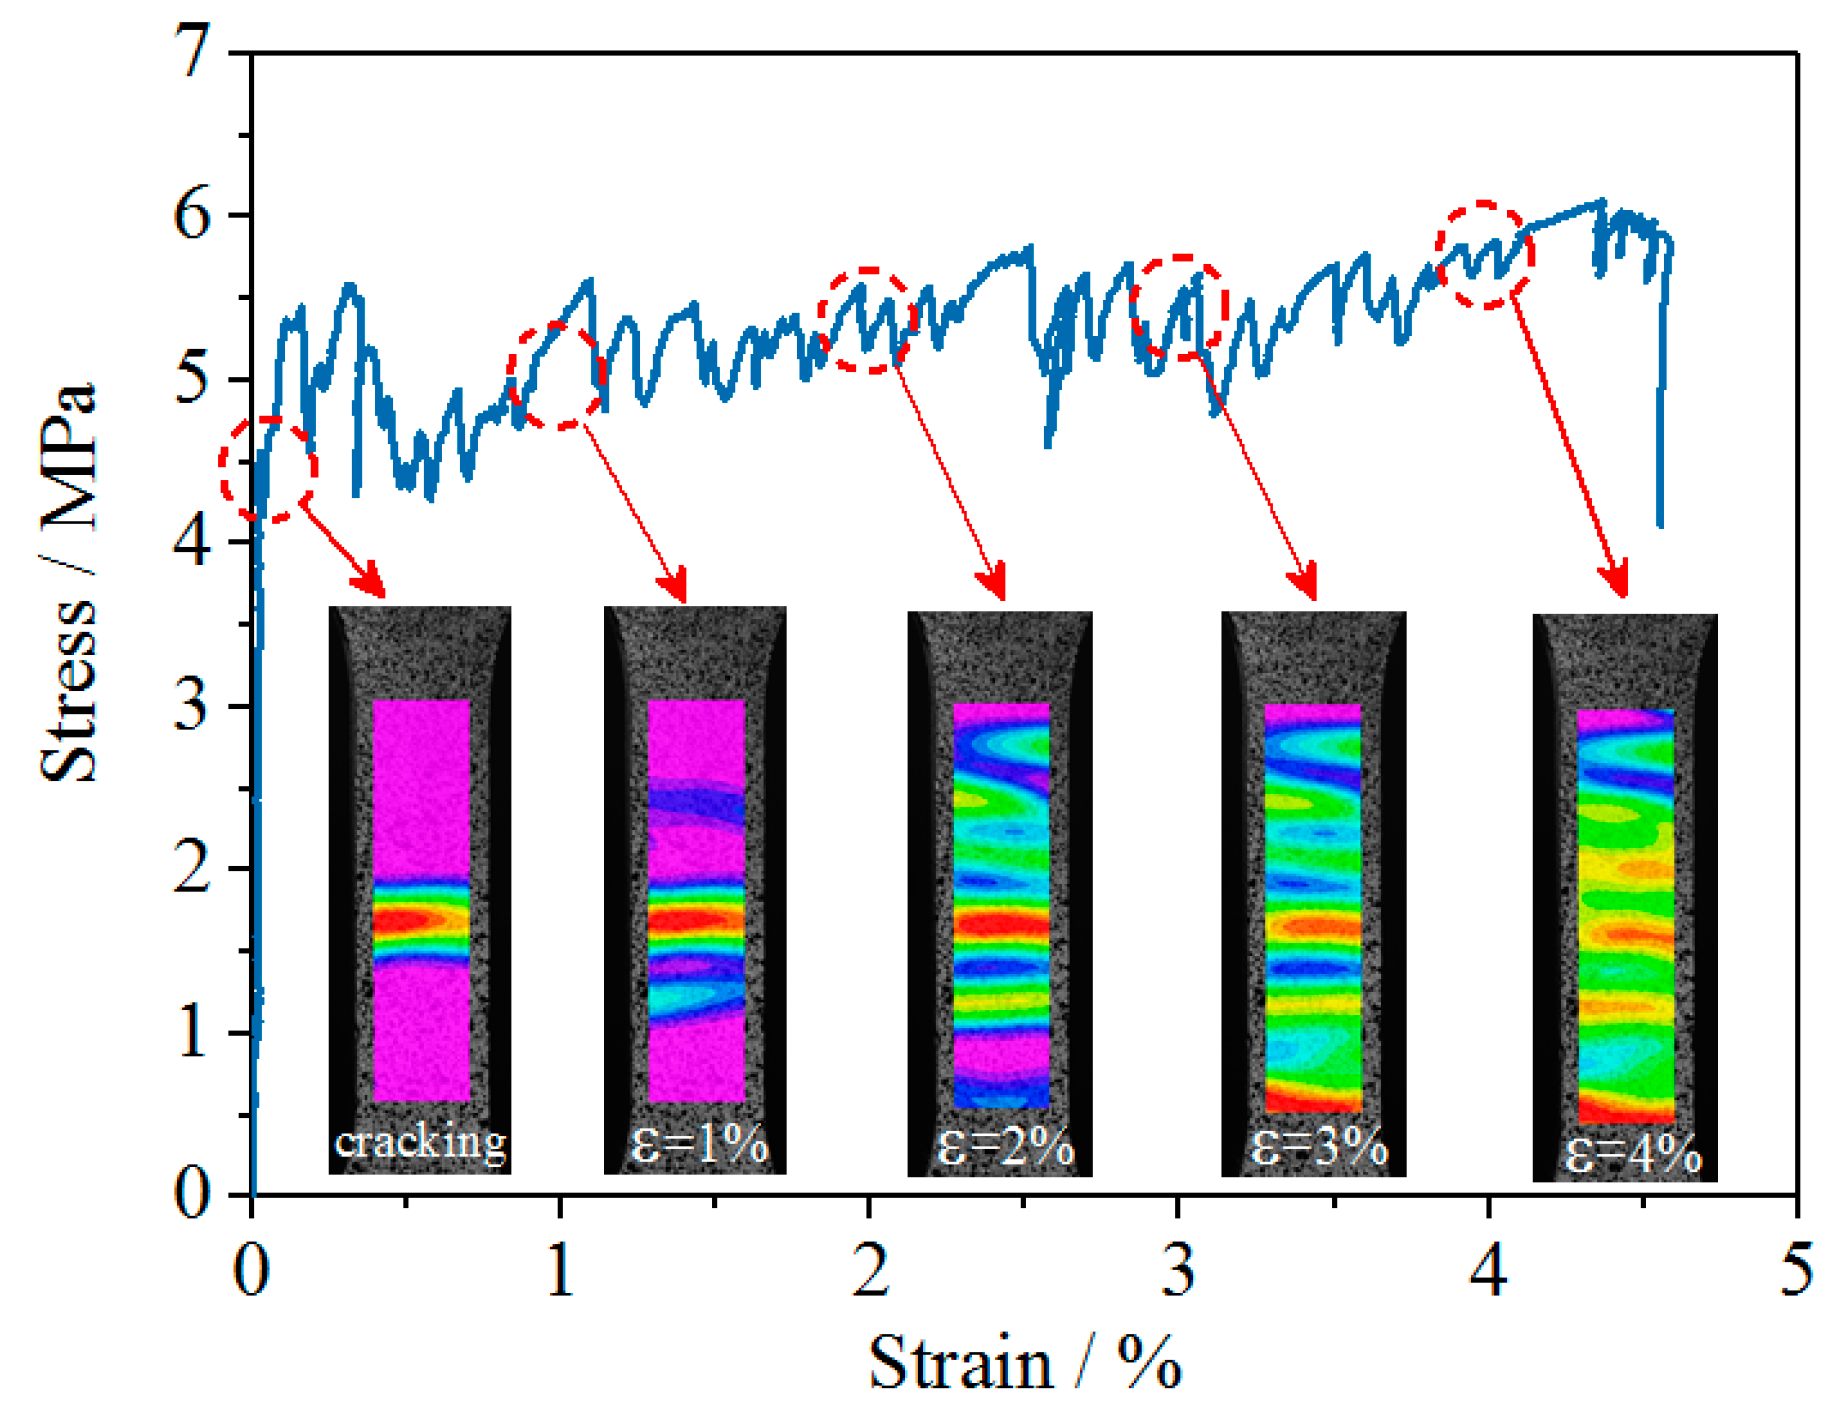
The preparation process of the ECC materials was described elsewhere [19]. Dumbbell thin plate specimens were used in the uniaxial tension tests. Tensile stress–strain curves and strain field nephograms based on the DIC are shown in Figure 6. With an increase in the strain level, many cracks in the calculation region saturated. Most importantly, even at high stress levels of 4%, cracks were not confined to local areas.

3. Mathematical Problem and Numerical Analysis Models

3.1. Shear Failure Characteristics

The stress diagram of the ECC expansion joint under a braking/accelerating wheel load is shown in Figure 7a. The analysis showed that the ECC was subjected to shear loads along the delamination point of the steel deck and pavement and the direction of the wheel load action point. Near the red line was the weak shear zone of the ECC. As shown in Figure 7b, the strain field εx nephogram of the ECC/steel composite structures under a critical failure load was measured using the DIC technique. According to the εx nephogram of the typical specimens under critical shear failure, when the shear load reached the critical failure value, the local tension strain concentration area of the ECC in the upper right part of the tooth showed an extreme deep red elliptical strip (tensile strain ranges from 0.0221 to 0.0238) with discontinuity points. The other parts were basically in a compressive stress state, and the strain nephogram showed a blue or purple distribution with a compressive strain range from −0.0022 to 0. This indicated that cracks appeared in the ultimate deep red elliptical strip area of the tension strain concentration. However, the micro-cracks did not lose stability rapidly but grew relatively steadily in a very short time due to the excellent crack resistance of the PVA fibers. The principal stress field σx nephogram of the ECC/steel composite structures at corresponding times is presented in Figure 7c. Comparing the σx nephogram in Figure 7c with the εx nephogram in Figure 7b, the shear weak zone of the ECC was completely consistent. The experimental failure mode of the composite structures is shown in Figure 7d. The ECC was shear cracked along the oblique region of the upper right part of the steel teeth and the shear action point (shear angle of about 45°). The failure mode was consistent with those shown in Figure 7a–c.

3.2. Shear Load-Displacement Curve

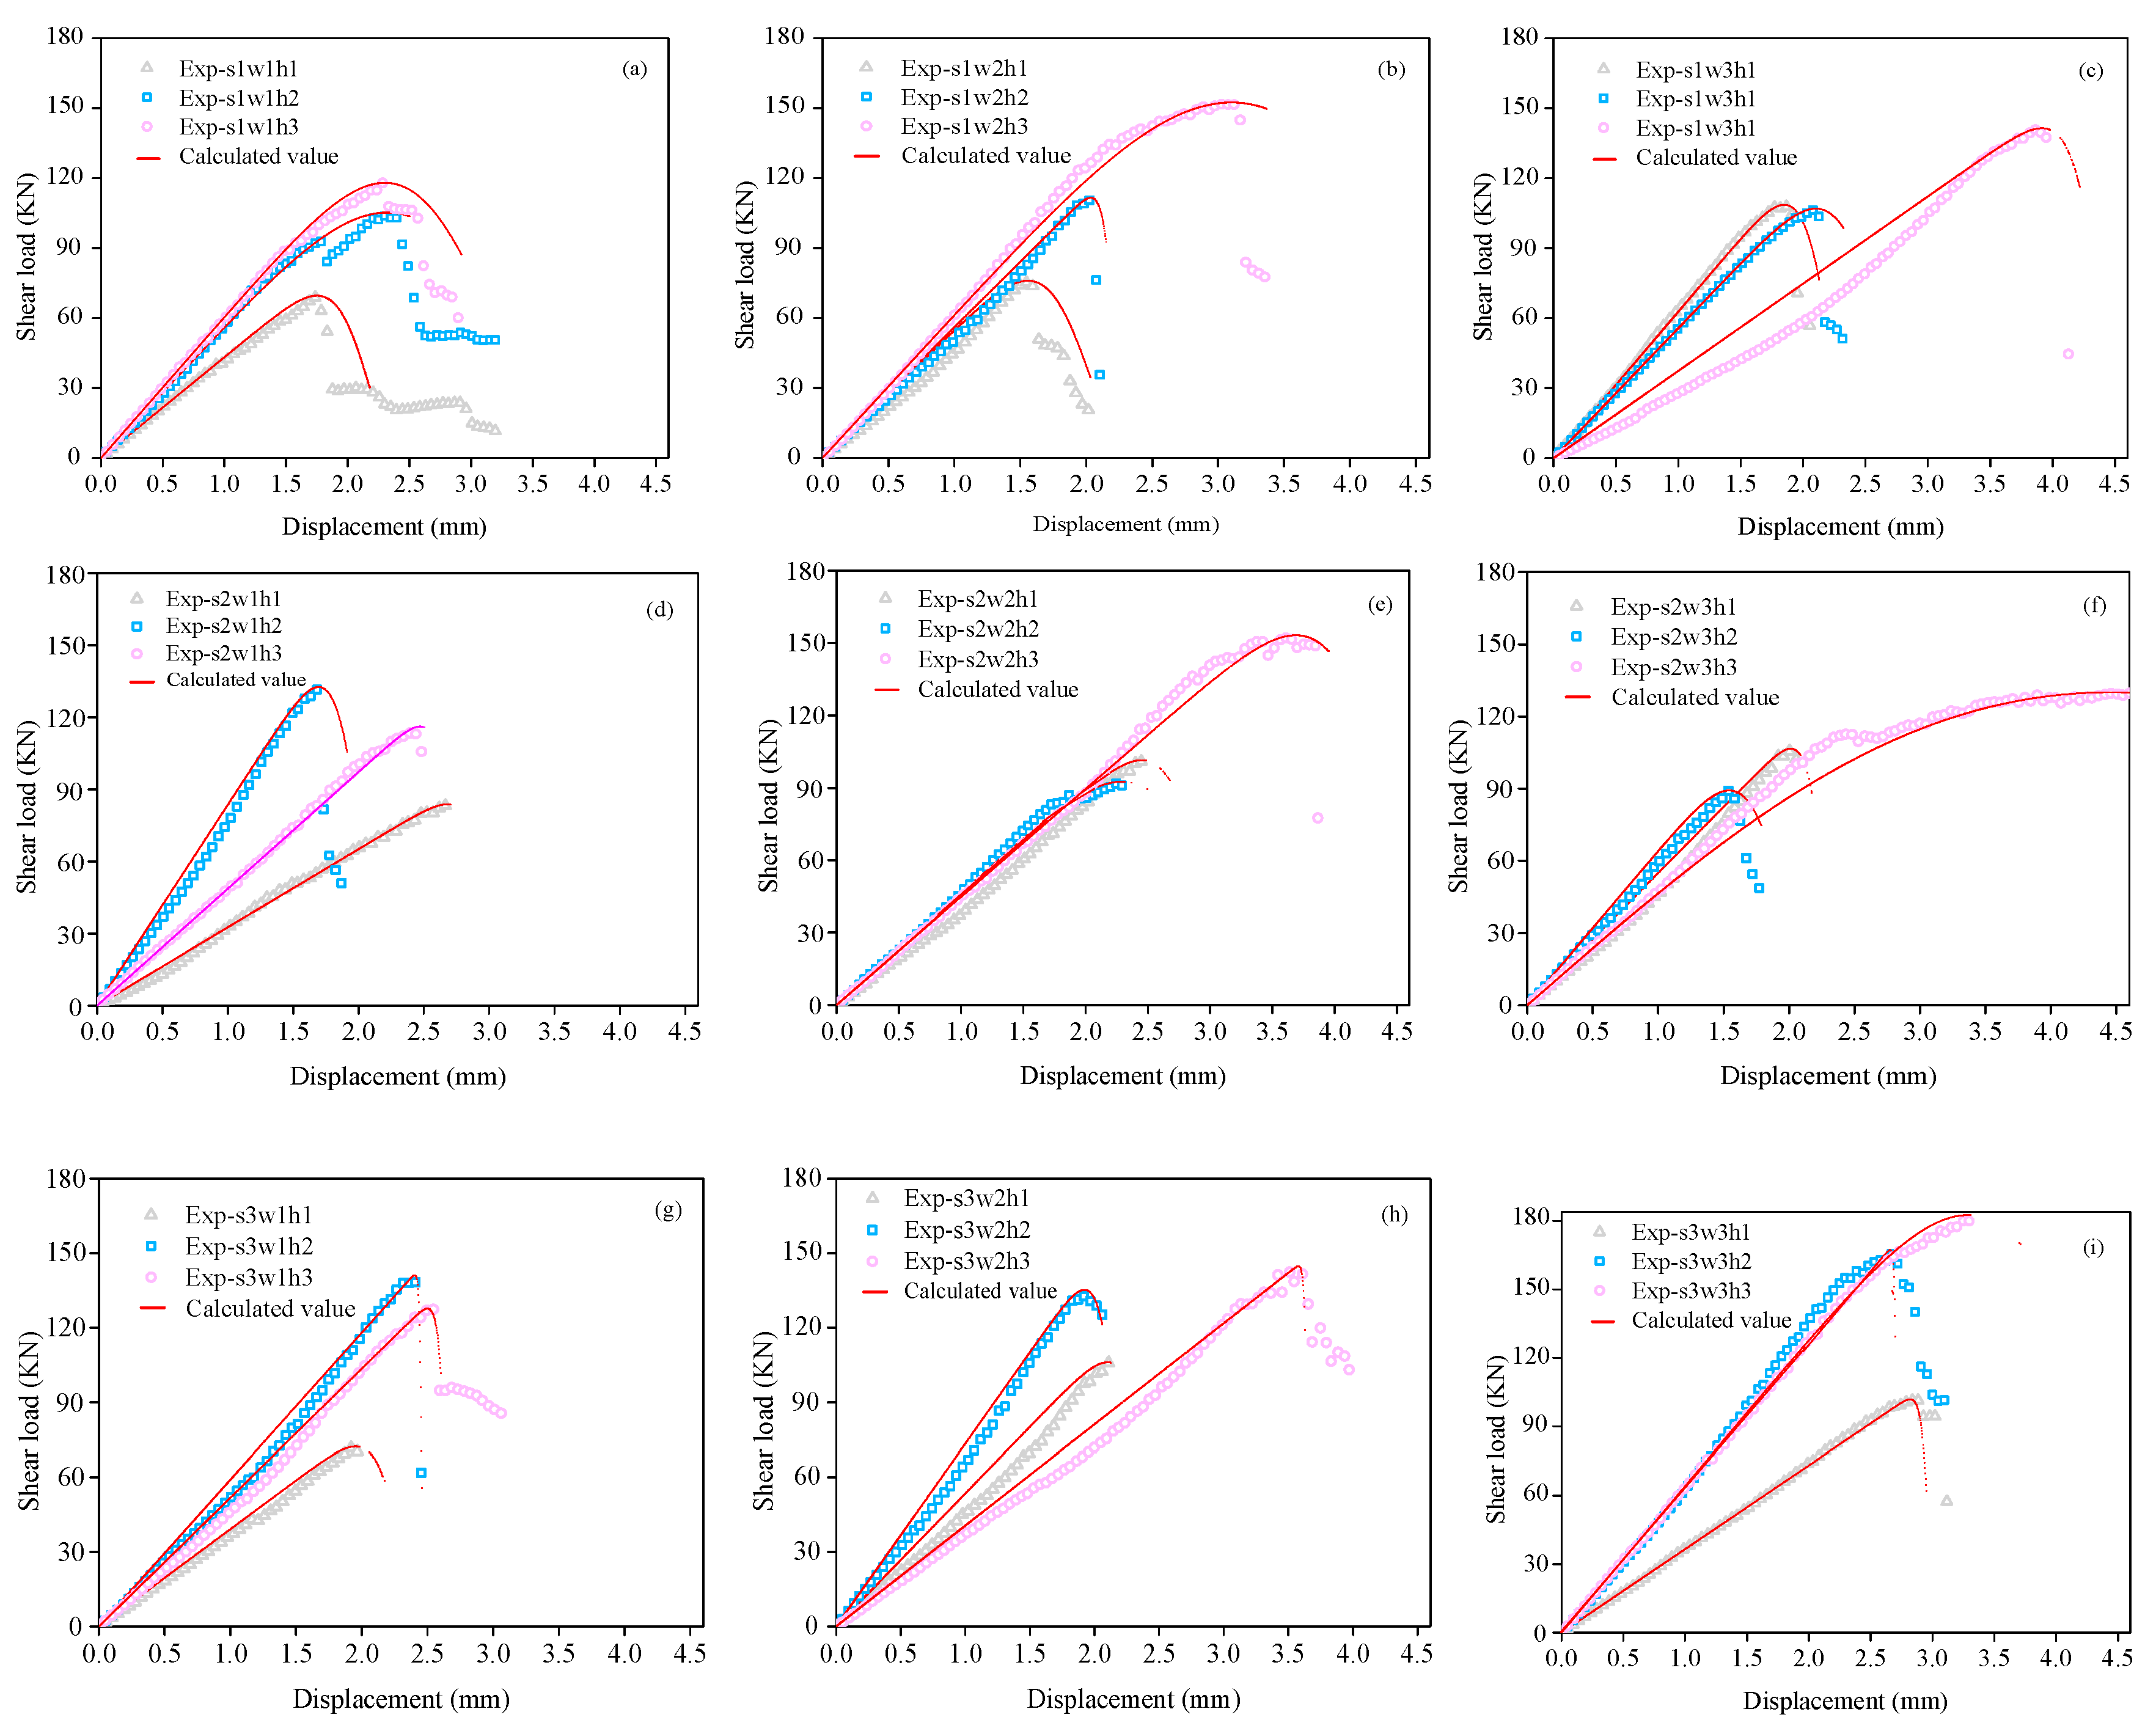
As shown in Figure 8a–i, there were 27 sets of shear load-displacement (Fv-δ) curves of the ECC/steel composite structure specimens with three factors and three parameters. In the three curves of each graph, S and W were fixed, and the values of T were 5, 10, and 20 mm. The shear load Fv was obtained by shear angle calculations and conversion of the load value collected by the DH3820 test system. δ is the tangential relative slip value between the steel plate and the ECC. The typical failure modes of all of the groups of specimens are listed in Figure 8a–i. The failure modes of the specimens were generally consistent with those of the failure modes of Section 3.1.

3.3. Peak Shear Load Fvp

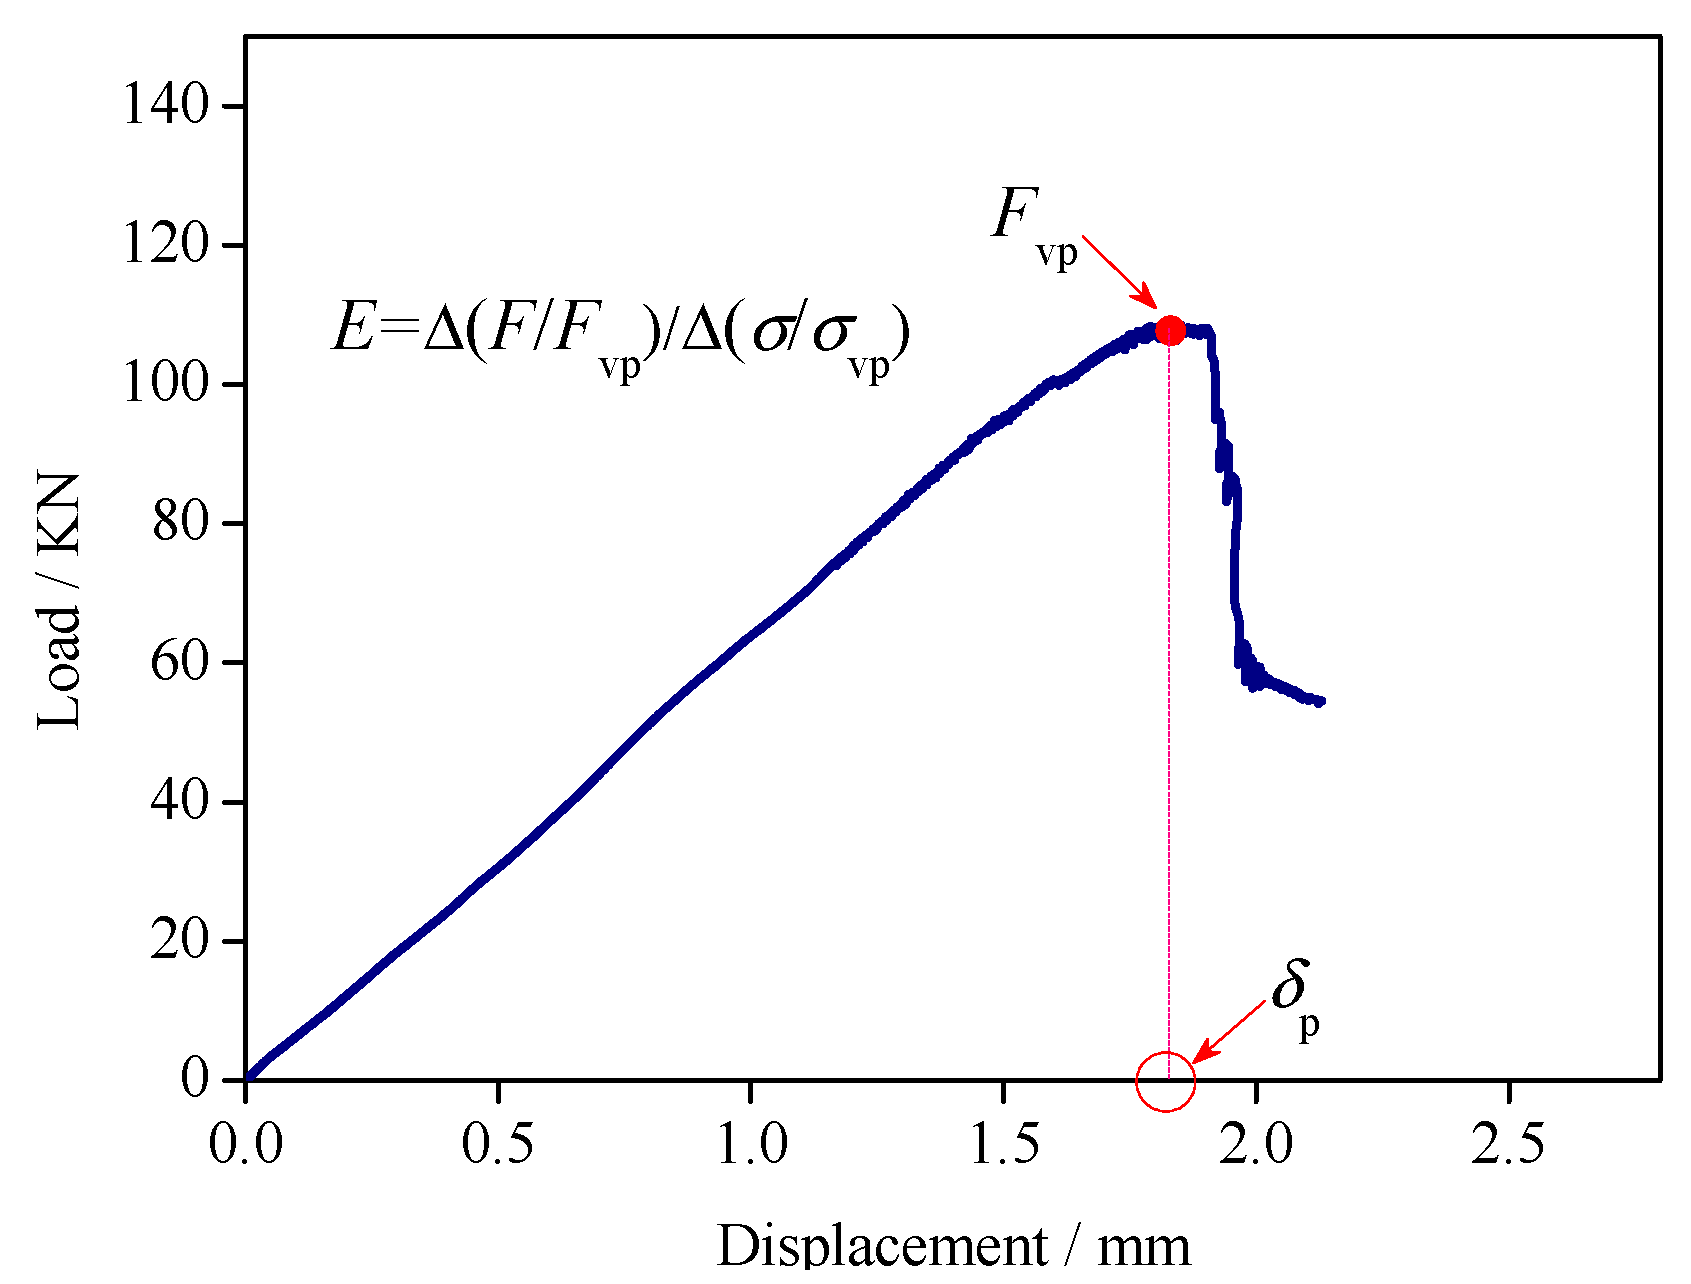
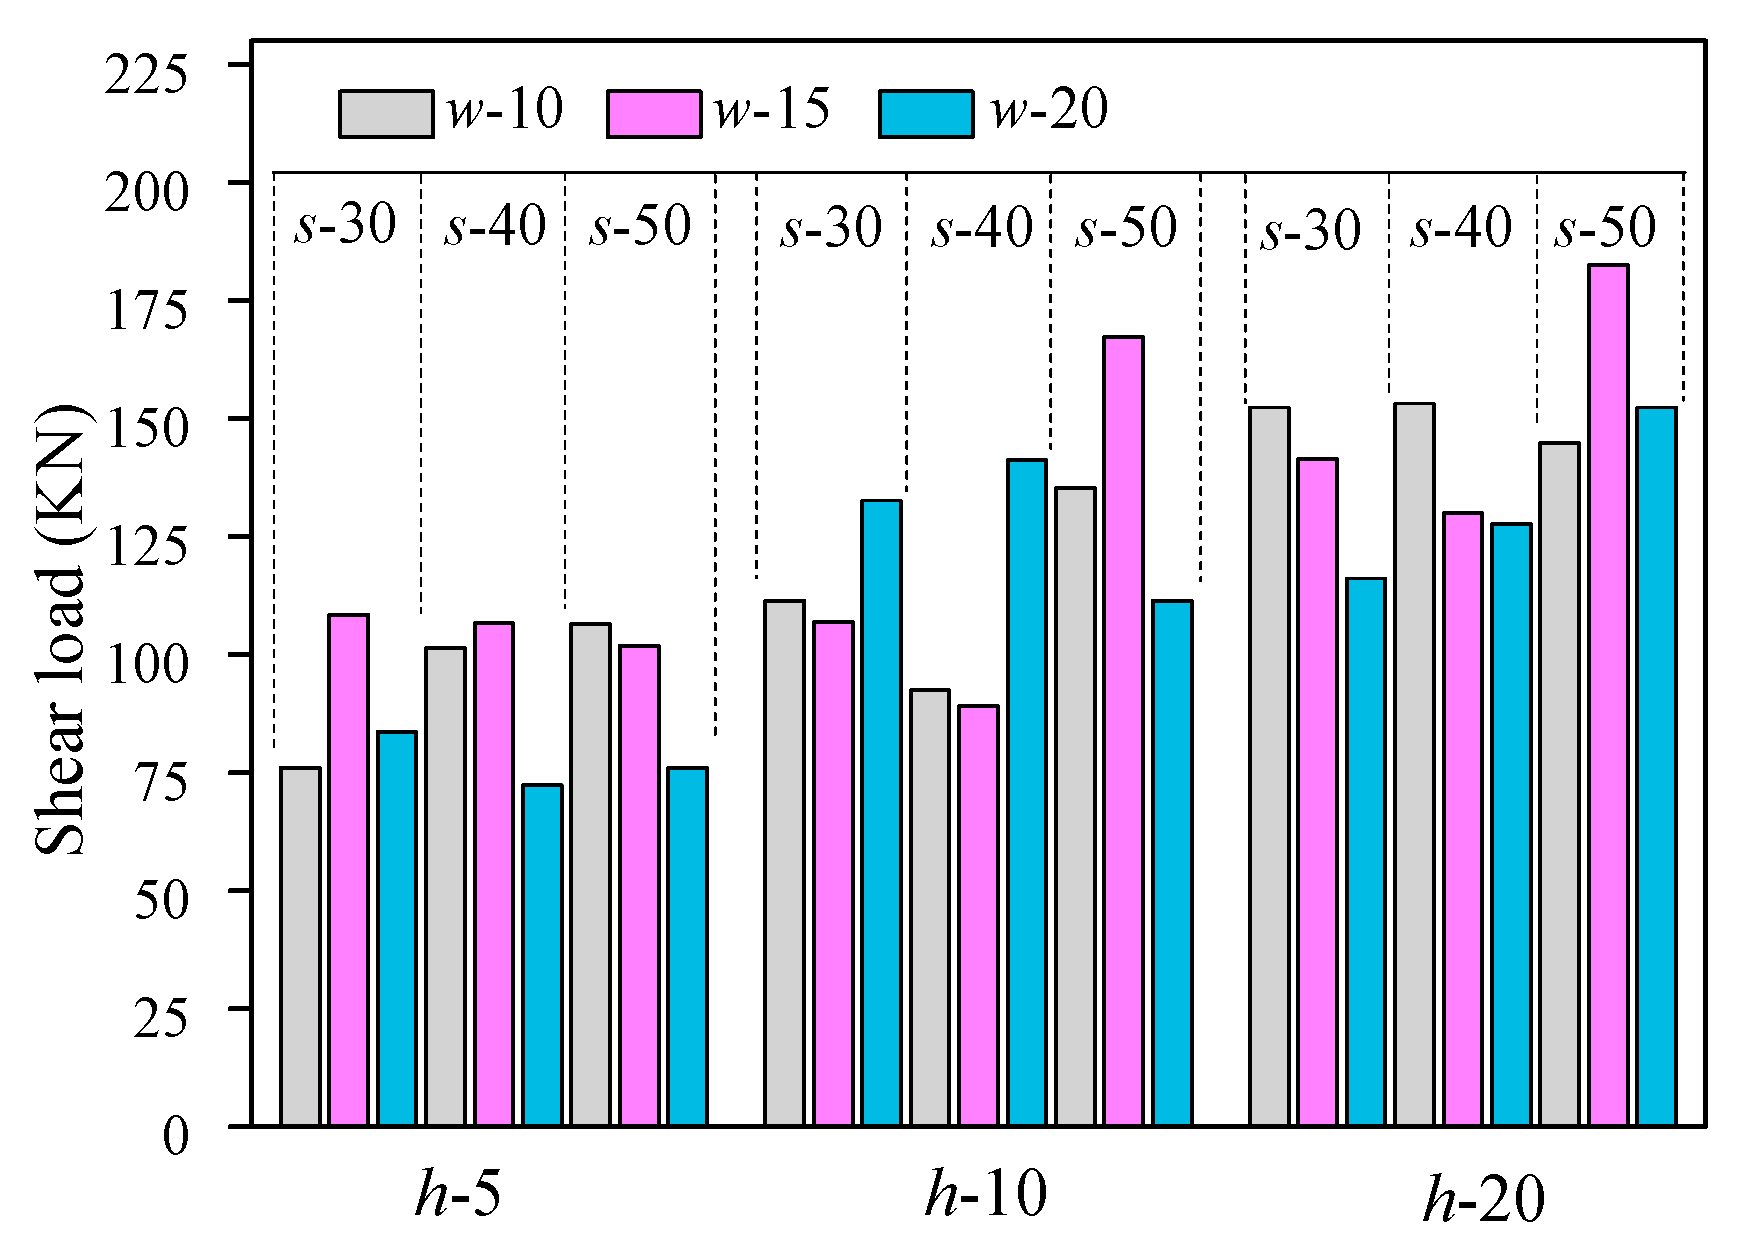
The typical shear load-displacement curve and mechanical properties of the ECC/steel composite structural specimens are shown in Figure 9. The peak shear load of the 27 groups of composite structural specimens ranged from 70 to 180 kN and was mainly concentrated in the 90–130 kN range, as shown in Figure 10. The influence of S and W on the peak shear load exhibited no clear regularity. When H was constant, no matter how S and W changed in a certain range, their influence on the peak shear load was not evident. However, with the increase of H from 5 to 20 mm, the peak shear load exhibited an upward trend overall. Thus, the higher the tooth height, the greater the peak shear load.

3.4. Peak Shear Displacement δp

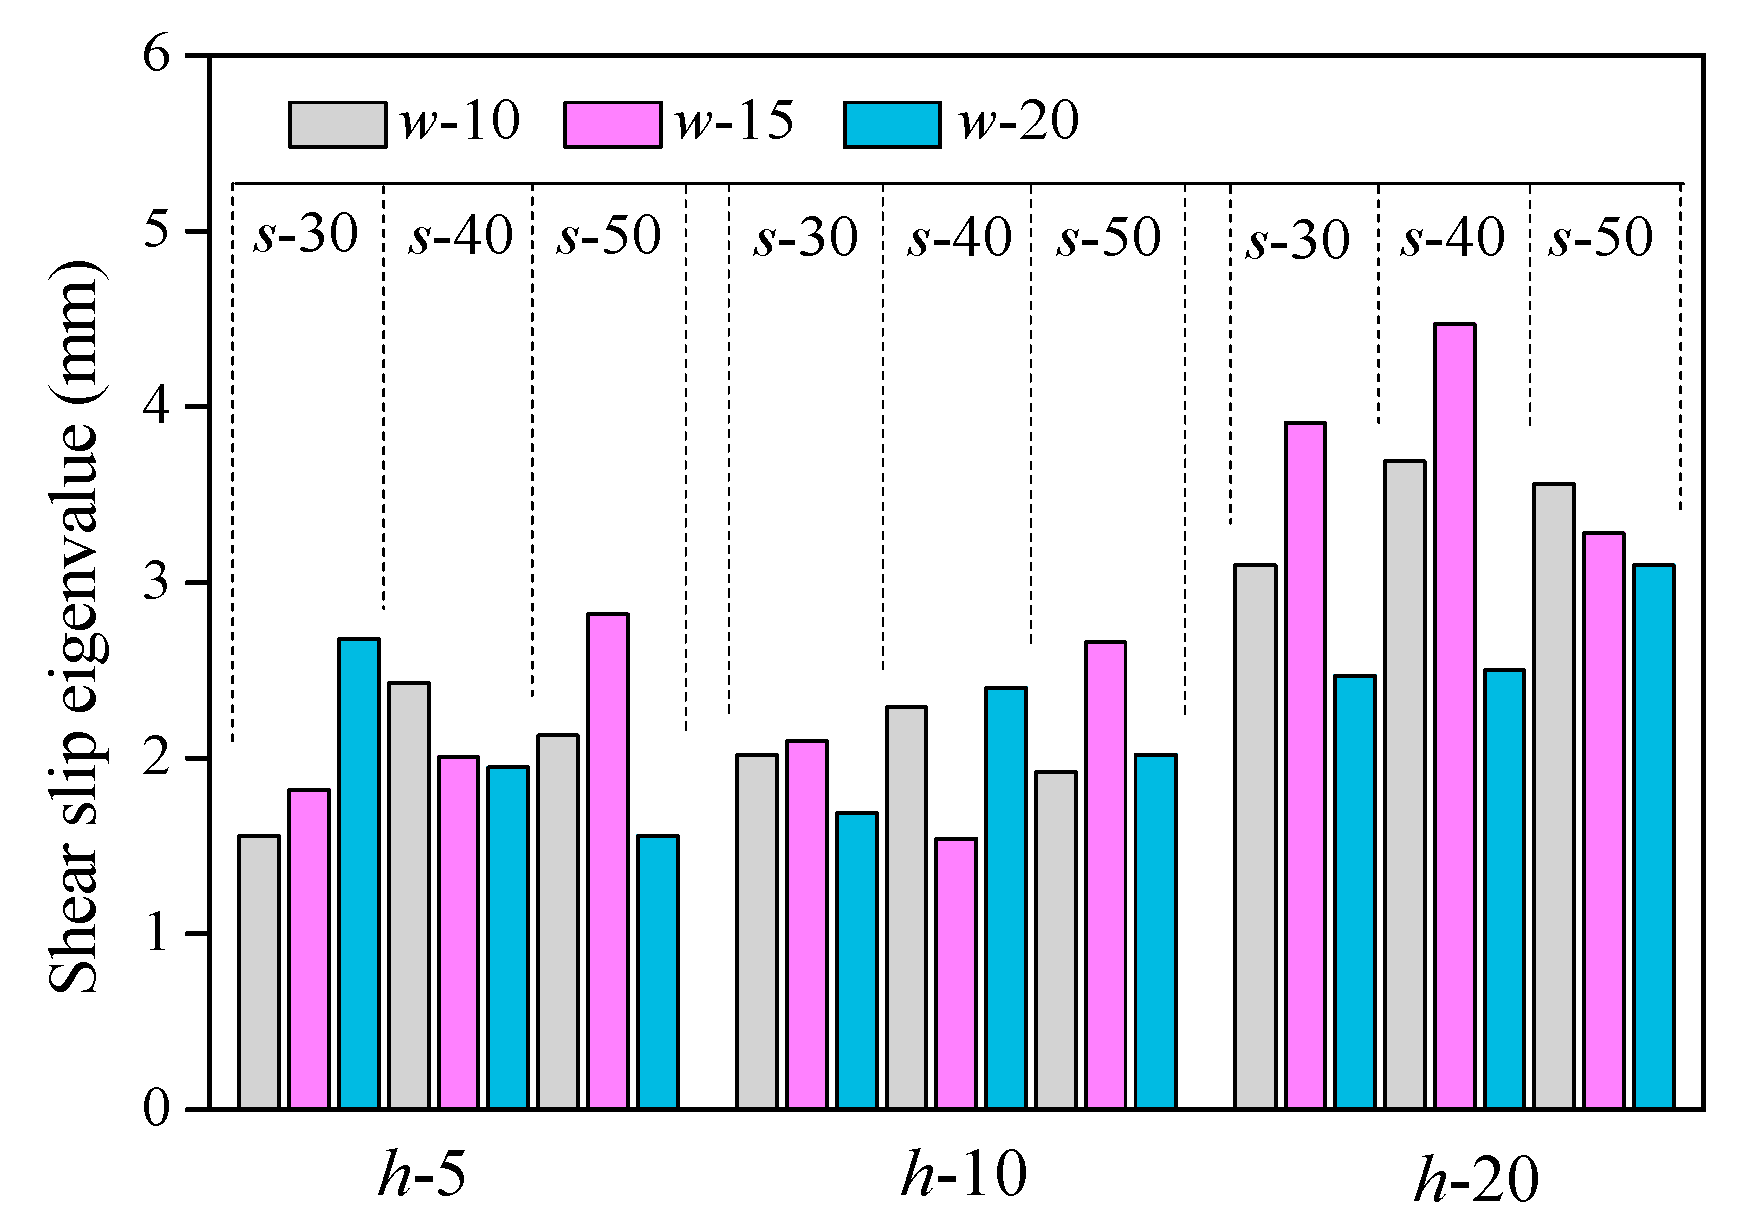
The peak shear displacement δp was the displacement value corresponding to Fvp on the shear load-displacement curve (see Figure 9). The peak shear displacements of the 27 groups of the composite structure specimens are shown in Figure 11. There was no clear trend in the effect of S and W on the peak displacement value. When H was 5 and 10 mm, the relative variation of the peak shear displacement of each group of specimens was not significant, ranging from 1.54 to 2.82 mm. With the increase in H to 20 mm, the peak shear displacement of all the groups of specimens increased overall. In general, a larger tooth height of the composite structure specimens corresponded to a larger δp.

3.5. Shear Modulus

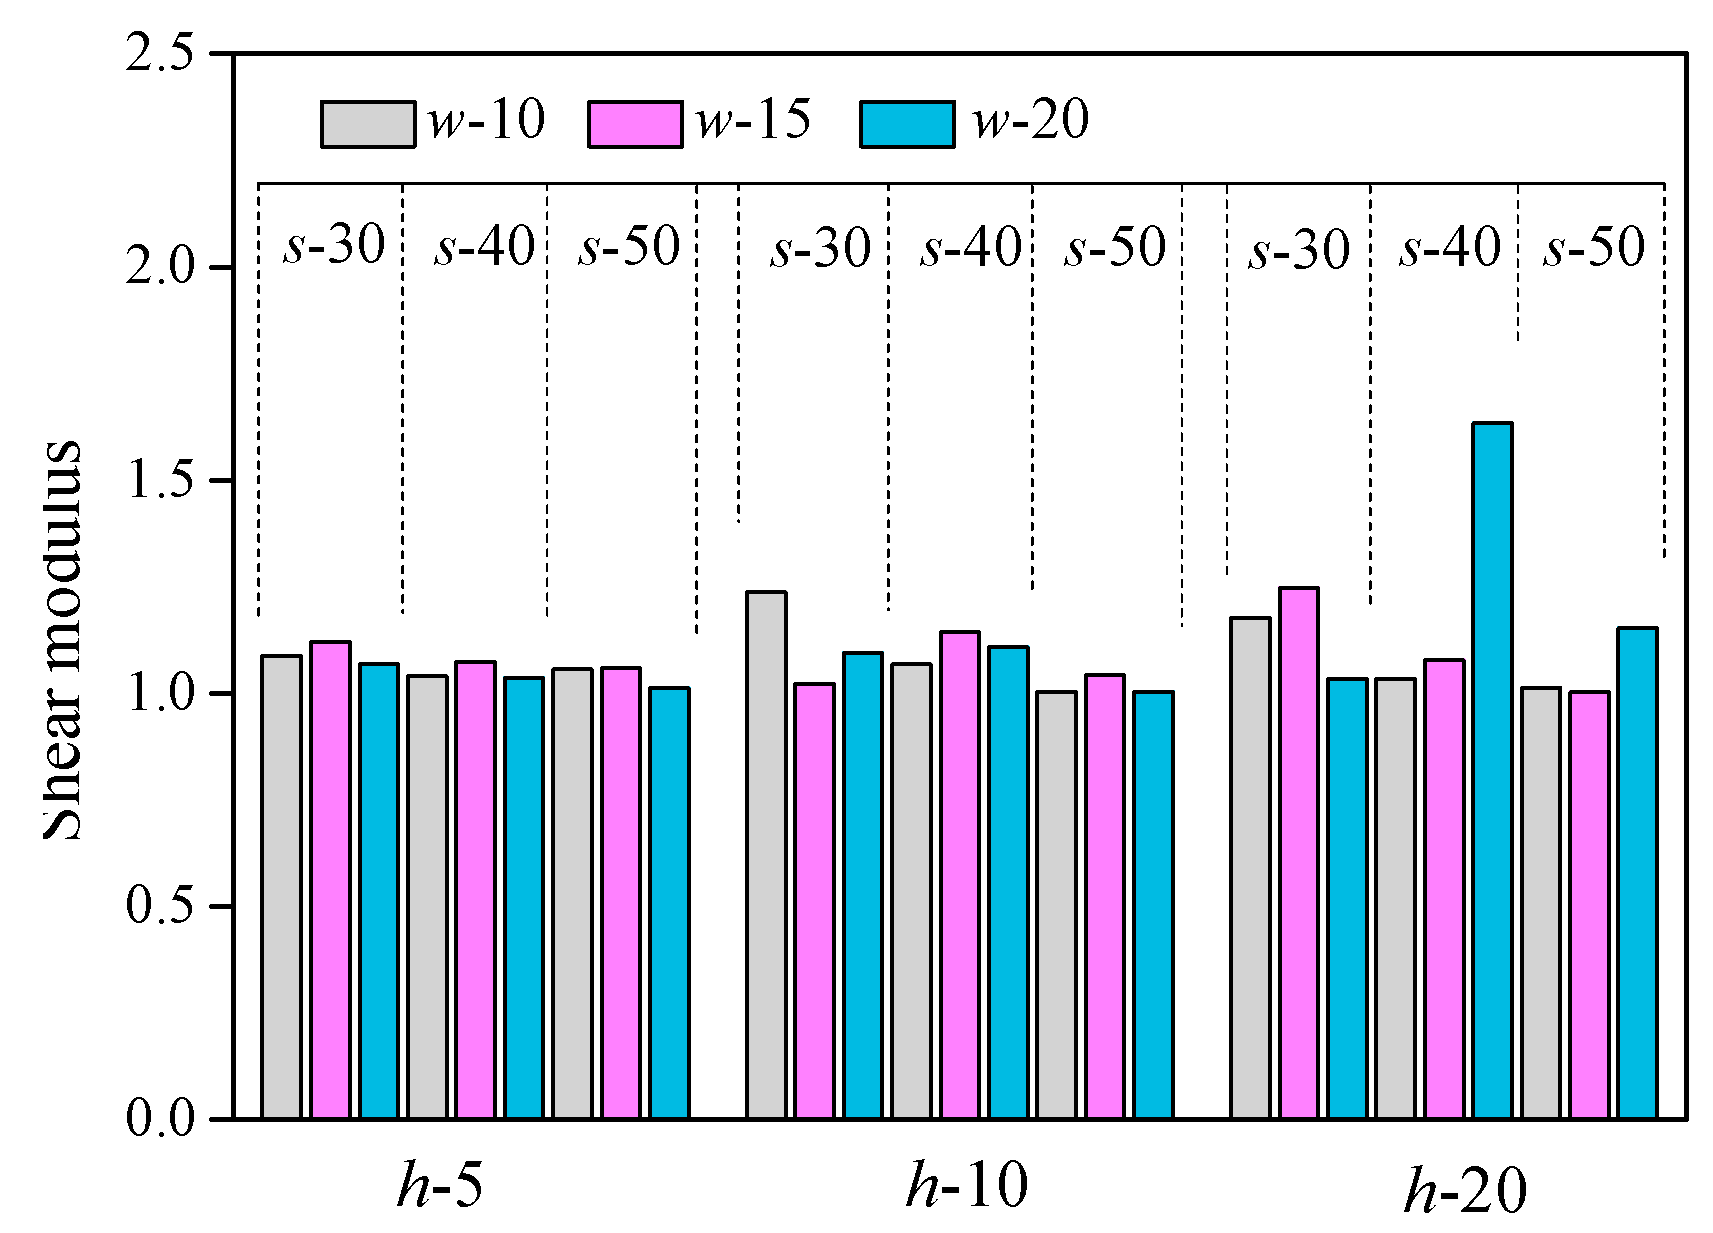
The initial modulus of elasticity E was obtained by normalizing the Fv-δ curve. The formula is shown in Figure 9, which is the tangent value of the linear region of the normalized curve. The calculated values of the modulus of elasticity for all groups of specimens are shown in Figure 12. The elastic modulus E concentrated near 1, and the relative change was very small. It was less sensitive to the test parameters.

4. Shear Load-Displacement Curves Model and Analysis

4.1. Curve Model

Based on the strain equivalence hypothesis proposed by Lemaitre [20], the damage constitutive relation of materials can be expressed as follows:
σ ˜ = σ 1 D = E ε 1 D  
where σ is the nominal stress, ε is the material strain, E is the initial elastic modulus, σ ˜ is the effective stress, and D is the damage variable.
According to Equation (1), the constitutive relationship can be obtained by knowing the damage evolution equation of the materials, i.e., the shear deformation damage constitutive relationship of the composite structure specimens in this paper.
In the damage analysis of quasi-brittle materials, the strain of the material under loading is often used as the damage parameter [21,22], and thus, the damage evolution law can be defined as follows:
d D = { f ( ε ) d ε   ( ε = ξ ,   d ε = d ξ > 0 ) 0   ( ε < ξ   o r   d ε < 0 )
where ξ > 0 is a variable threshold and f is a hypothetical function. If f ( ε ) is considered to be the density function of strain ε in the random damage probability model and the initial damage condition is assumed to be D = ε = ξ = 0 , the damage variable D is the distribution function F ( ε ) of the strain is as follows:
D = F ( ε ) = 0 ε f ( x ) d x .
In the literature [23,24], the strength and stress–strain curves of materials are assumed to obey a Weibull statistical distribution. Based on the characteristics of the Fv-δ curve and normalized curve of the ECC expansion joints found in this study, the shear deformation damage parameter D was also assumed to obey this statistical distribution. The Weibull distribution expression of the two parameters is as follows:
D = 1 exp [ ( ε η ) m ]
where m and η are shape and scale parameters, m > 0 , and η > 0 .
According to the continuum damage mechanics theory [25,26], the stress–strain relationship is
σ = ( 1 D ) E ε = E ε   exp [ ( ε η ) m ] .
Referring to the characteristics of the Fv-δ curve of the ECC expansion joint and combining with the results in the literature [27,28], the distribution parameters m and η were determined by the key points on the test curves. The following boundary conditions were determined: ε = ε vp ,   σ = σ vp   and   ε = ε vp ,   d σ d ε = 0 , where σ vp is the equivalent ultimate shear stress and ε vp is the equivalent ultimate shear strain.
Calculating the derivative of the strain ε at both ends of Equation (5) yields the following:
d σ d ε = E · exp [ ( ε η ) m ] · [ 1 m ( ε η ) m ] .
By substituting the boundary conditions into Equation (6):
E · exp [ ( ε vp η ) m ] · [ 1 m ( ε vp η ) m ] = 0 .
Because E ≠ 0, exp [ ( ε vp η ) m ] 0 and
1 m ( ε vp η ) m = 0 .
Equation (8) can be rearranged as follows:
η = ε vp ( 1 m ) 1 m .
By substituting Equation (9) into Equation (5) and using the boundary conditions, the following can be obtained:
m = 1 ln ( E vp ε vp σ vp ) .
Equation (10) can be substituted into Equation (4), yielding the following:
D = 1 exp [ 1 m ( ε ε vp ) m ] .
Equation (11) is considered to be the damage evolution equation of the ECC expansion joint composite structure under a shear load.
Equations (9) and (10) show that D is related to the peak stress, peak load strain, and initial modulus of elasticity of the current material. In this study, the shear load-displacement curve was measured instead of the stress–strain curve. Therefore, when calculating the damage, the shear load-displacement curve was normalized. The normalized dimensionless stress value was σ = F / F vp ,   σ vp = 1.0 , and the normalized strain value was ε = δ / δ vp ,   ε vp = 1.0 . The initial modulus of elasticity E was obtained by normalizing the shear load-displacement curve.
By substituting Equation (11) into Equation (5), the damage constitutive model can be obtained:
σ = E ε   exp [ 1 m ( ε ε vp ) m ] .
Equation (12) is considered to be the deformation damage constitutive model of the ECC expansion joint composite structure under a shear load. The initial elastic modulus, peak load strain, and m can be calculated by the tests conducted in this study.

4.2. Calculation Results and Analysis

Table 4 shows the calculated values of the model shape parameter m. As shown in Figure 13, the shear load-displacement model calculation curve of the ECC expansion joint composite structure was compared with the test curve. The values calculated using the model were in good agreement with the experimental values. Because the shear failure of the composite structure specimens was quasi-brittle failure with a sudden drop in the curve in the descending stage, most of the descending curve could not be obtained in the tests. The shortcomings of the model are apparent in the descending region of the curve.

5. Conclusions

The Fv-δ curves of the ECC bridge expansion joints were studied based on compression-shear tests, the DIC technique, continuous damage mechanics, and the Weibull distribution theory. The following conclusions can be drawn:
  • The failure mode of the specimens was diagonal shear failure, and the ultimate failure mode was diagonal shear crack of the ECC material. The strain field εx and stress field σx nephogram based on the DIC could well describe the failure mode of the composite structure specimens, which was consistent with the experimental results.
  • Based on the calculation of the Fv-δ curves of 27 groups of composite structure specimens, the test parameter H had a significant influence on the curve mechanical properties. When H was 20 mm (the maximum value of test), the characteristic values of shear displacement and the peak shear load were the largest. The effect of W and S on the shear mechanical properties exhibited no clear regularity.
  • The Fv-δ curve model of the ECC/steel composite structure specimens based on continuous damage mechanics and the Weibull distribution theory was in good agreement with the experimental values. It can be used for the shear design of ECC expansion joints.
  • After four years of operation, the ECC bridge expansion joint demonstration project completed by our team in the early stage achieved good results. This promotes the application of ECC in engineering.

Author Contributions

C.Y. designed and performed the experimental work; S.L. made positive suggestions about the work; L.Y. wrote the original draft; J.Z. supervised the experiments and interpreted the data; X.W. and L.Y. performed the experimental work.

Funding

The work was supported by the National Natural Science Foundation of China [51768051, 51968056]; the Natural Science Foundation of the Inner Mongolia Autonomous Region of China [2017MS0505]; the Science and Technology Innovation Project of Inner Mongolia Autonomous Region of China [KCBJ2018016]; and the scientific and technological achievements transformation project of Inner Mongolia Autonomous Region of China, 2019.

Conflicts of Interest

The authors declare no conflicts of interest.

References

  1. Guo, T.; Huang, L.Y.; Liu, J.; Zou, Y. Damage mechanism of control springs in modular expansion joints of long-span bridge. J. Bridge Eng. 2018, 23, 04018038. [Google Scholar] [CrossRef]
  2. Ma, J.; Sun, S.Z.; Qi, Y. Review on China’s bridge engineering research. China J. Highw. Transp. 2014, 27, 1–96. [Google Scholar]
  3. Mascio, P.D.; Loprencipe, G.; Moretti, L.; Puzzo, L.; Zoccali, P. Bridge expansion joint in road transition curve: Effects assessment on heavy vehicles. Appl. Sci. Basel. 2017, 7, 599. [Google Scholar] [CrossRef] [Green Version]
  4. Yang, Y. Research of Rapid Repair Materials for Bridge Expansion Joints Rehabilitation. Doctoral Dissertation, Chongqing Jiaotong University, Chongqing, China, 2017. [Google Scholar]
  5. Ajwad, A.; Qureshi, L.A.; Tahir, F.; Hussain, J. Investigation regarding bridge expansion joints deterioration in pakistan and its remedial measures. Tech. J. UET Taxila. 2014, 19, 34–39. [Google Scholar]
  6. Deng, L.; Yan, W.; Zhu, Q. Vehicle impact on the deck slab of concrete box-girder bridges due to damaged expansion joints. J. Bridge Eng. 2015, 21, 06015006. [Google Scholar] [CrossRef]
  7. Quinn, B.H.; Civjan, S.A. Assessment of bridge joint performance in the northeastern states. Transport. Res. Rec. 2016, 2550, 46–53. [Google Scholar] [CrossRef]
  8. Lachinger, S.; Strauss, A.; Kwapisz, M.; Zimmermann, T. Evaluation of expansion joints in Austria. In Proceedings of the 37th IABSE Madrid Symposium Report, Madrid, Spain, September 2014; pp. 2961–2968. [Google Scholar]
  9. Lima, J.M.; Brito, J. Inspection survey of 150 expansion joints in road bridges. Eng. Struct. 2009, 31, 1077–1084. [Google Scholar] [CrossRef]
  10. Chang, L.M.; Lee, Y.J. Evaluation of performance of bridge deck expansion joints. J. Perform. Constr. Fac. 2002, 16, 3–9. [Google Scholar] [CrossRef]
  11. Balakumaran, S.S.G.; O’Neill, K.; Springer, T.C.; Adam, M.A. Elastomeric concrete plug joints: A new durable bridge expansion joint design. Transp. Res. Rec. 2017, 2642, 18–25. [Google Scholar] [CrossRef] [Green Version]
  12. Yu, T.L.; Li, C.Y.; Wu, S.G. Performance of polymer modified asphalt bridge expansion joints in low-temperature regions. J. Perform. Constr. Fac. 2009, 23, 227–233. [Google Scholar] [CrossRef]
  13. Zhou, M.; Lu, W.; Song, J.W.; Lee, G.C. Application of ultra-high performance concrete in bridge engineering. Constr. Build. Mater. 2018, 186, 1256–1267. [Google Scholar] [CrossRef]
  14. Ren, L.; Liang, M.Y.; Wang, K.; He, Y.; Zhao, G.G. Key performance and application of ultra-high-performance concrete in bridge expansion joint. Bull. Chin. Ceramic. Soc. 2018, 37, 2048–2052. [Google Scholar]
  15. Li, V.C. High-Performance and multifunctional cement-based composite material. Engineering 2019, 5, 250–260. [Google Scholar] [CrossRef]
  16. Kang, S.B.; Tan, K.H.; Zhou, X.H.; Yang, B. Experimental investigation on shear strength of engineered cementitious composites. Eng. Struct. 2017, 143, 141–151. [Google Scholar] [CrossRef]
  17. Hou, M.J.; Hu, K.X.; Yu, J.T.; Dong, S.W.; Xu, S.L. Experimental study on ultra-high ductility cementitious composites applied to link slabs for jointless bridge decks. Compos. Struct. 2018, 204, 167–177. [Google Scholar] [CrossRef]
  18. Kim, M.J.; Kim, S.; Yoo, D.Y. Hybrid effect of twisted steel and polyethylene fibers on the tensile performance of ultra-high-performance cementitious composites. Polymers 2018, 10, 879. [Google Scholar] [CrossRef] [PubMed] [Green Version]
  19. Liu, S.G.; Zhang, D.X.; Yan, C.W.; Deng, Y.H. Experimental study on the tensile properties of PVA-ECC with high-calcium fly ash. Bull Chin Ceramic Soc. 2016, 35, 52–60. [Google Scholar]
  20. Lemaitre, J. How to use damage mechanics. Nucl. Eng. Des. 1984, 80, 233–245. [Google Scholar] [CrossRef]
  21. Chen, L.; Wang, C.P.; Liu, J.F.; Liu, J.; Wang, J.; Jia, Y.; Shao, J.F. Damage and plastic deformation modeling of Beishan granite under compressive stress conditions. Rock Mech. Rock Eng. 2015, 48, 1623–1633. [Google Scholar] [CrossRef]
  22. Chi, Y.; Xu, L.H.; Yu, H.S. Constitutive modeling of steel-polypropylene hybrid fiber reinforced concrete using a non-associated plasticity and its numerical implementation. Compos. Struct. 2014, 111, 497–509. [Google Scholar] [CrossRef]
  23. Lai, Y.M.; Li, J.B.; Li, Q.Z. Study on damage statistical constitutive model and stochastic simulation for warm ice-rich frozen silt. Cold Reg. Sci. Technol. 2012, 71, 102–110. [Google Scholar] [CrossRef]
  24. Li, Y.; Jia, D.; Rui, Z.; Peng, J.; Fu, C.; Zhang, J. Evaluation method of rock brittleness based on statistical constitutive relations for rock damage. J. Petrol. Sci. Eng. 2017, 153, 123–132. [Google Scholar] [CrossRef]
  25. Hosseini, E.; Holdsworth, S.; Mazza, E. Stress regime-dependent creep constitutive model considerations in finite element continuum damage mechanics. Int. J. Damage Mech. 2013, 22, 1186–1205. [Google Scholar] [CrossRef]
  26. Darabi Masoud, K.; Abu Al-Rub Rashid, K.; Masad Eyad, A.; Little Dallas, N. Constitutive modeling of fatigue damage response of asphalt concrete materials with consideration of micro-damage healing. Int. J. Solids Struct. 2013, 50, 2901–2913. [Google Scholar] [CrossRef] [Green Version]
  27. Zhao, H.; Shi, C.J.; Zhao, M.H.; Li, X.B. Statistical damage constitutive model for rocks considering residual strength. Int. J. Geomech. 2016, 17, 04016033. [Google Scholar] [CrossRef]
  28. Yu, T.T. Statistical damage constitutive model of quasi-brittle materials. J. Aerosp. Eng. 2009, 22, 95–100. [Google Scholar] [CrossRef]
Figure 1. Details of expansion joint: (a) structural form and (b) section and force diagram. Engineered cementitious composite (ECC): engineered cementitious composite.
Applsci 09 05275 g001
Figure 2. Construction process of ECC expansion joint pouring: (a) pouring, (b) self-leveling after pouring, (c) vibrating, and (d) surface treatment.
Applsci 09 05275 g002
Figure 3. Investigation and comparison: (a) steel fiber-reinforced concrete (SFRC) expansion joints after 8 months; (b) cracking during period in SFRC; (c) ECC expansion joints after 4 years; (d) no crack in ECC.2.2. Experimental Design
Applsci 09 05275 g003
Figure 4. Model specimens: (a) front elevation and (b) side elevation.
Applsci 09 05275 g004
Figure 5. Compression-shear test: (a) digital image correlation (DIC) system; (b) loading details.2.3. ECC Materials and Properties
Applsci 09 05275 g005
Figure 6. Uniaxial tensile stress–strain curves and DIC pictures of ECC.
Applsci 09 05275 g006
Figure 7. Shear stress analysis and failure mode (s2w2h2): (a) force analysis, (b) shear strain field based on DIC, (c) shear stress field, and (d) experimental failure mode.
Applsci 09 05275 g007
Figure 8. Shear load-displacement curves and failure modes.
Applsci 09 05275 g008
Figure 9. Typical shear load-displacement curve and its mechanical parameters.
Applsci 09 05275 g009
Figure 10. Peak shear load of composite structures.
Applsci 09 05275 g010
Figure 11. Peak shear displacement of composite structures.
Applsci 09 05275 g011
Figure 12. Shear modulus of composite structures.
Applsci 09 05275 g012
Figure 13. Comparisons between model calculations and test curves.
Applsci 09 05275 g013
Table 1. Test parameters and sample number (unit: mm).
No.SWHNo.SWHNo.SWH
s1w1h130105s1w2h130155s1w3h130205
s1w1h2301010s1w2h2301510s1w3h2302010
s1w1h3301020s1w2h3301520s1w3h3302020
s2w1h140105s2w2h140155s2w3h140205
s2w1h2401010s2w2h2401510s2w3h2402010
s2w1h3401020s2w2h3401520s2w3h3402020
s3w1h150105s3w2h150155s3w3h150205
s3w1h2501010s3w2h2501510s3w3h2502010
s3w1h3501020s3w2h3501520s3w3h3502020
Table 2. Properties of Polyvinyl alcohol (PVA) fiber.
Tensile Strength (MPa)Young’s Modulus (GPa)Diameter (μm)Length (mm)Elongation (%)
16004040126
Table 3. Mixed proportions of engineered cementitious composite (ECC)
Cement (kg/m3)Fly Ash (kg/m3)Silica Sand (kg/m3)Water (kg/m3)Water-RAE (kg/m3)mw/mb (-)PVA Fiber (vol %)
37888045730216.370.242
Table 4. Model shape parameter m.
SpecimensmSpecimensmSpecimensm
s1w1h111.89s2w1h125.26s3w1h117.89
s1w1h24.68s2w1h215.21s3w1h2246.33
s1w1h36.11s2w1h329.32s3w1h376.75
s1w2h18.70s2w2h113.85s3w2h117.60
s1w2h244.25s2w2h27.46s3w2h223.82
s1w2h34.52s2w2h313.30s3w2h3291.12
s1w3h115.02s2w3h127.45s3w3h185.23
s1w3h210.96s2w3h29.68s3w3h2271.54
s1w3h329.30s2w3h32.04s3w3h37.03