Calibration Factor for ASCE 41-17 Modeling Parameters for Stocky Rectangular RC Columns


Abstract
Featured Application
Abstract
1. Introduction
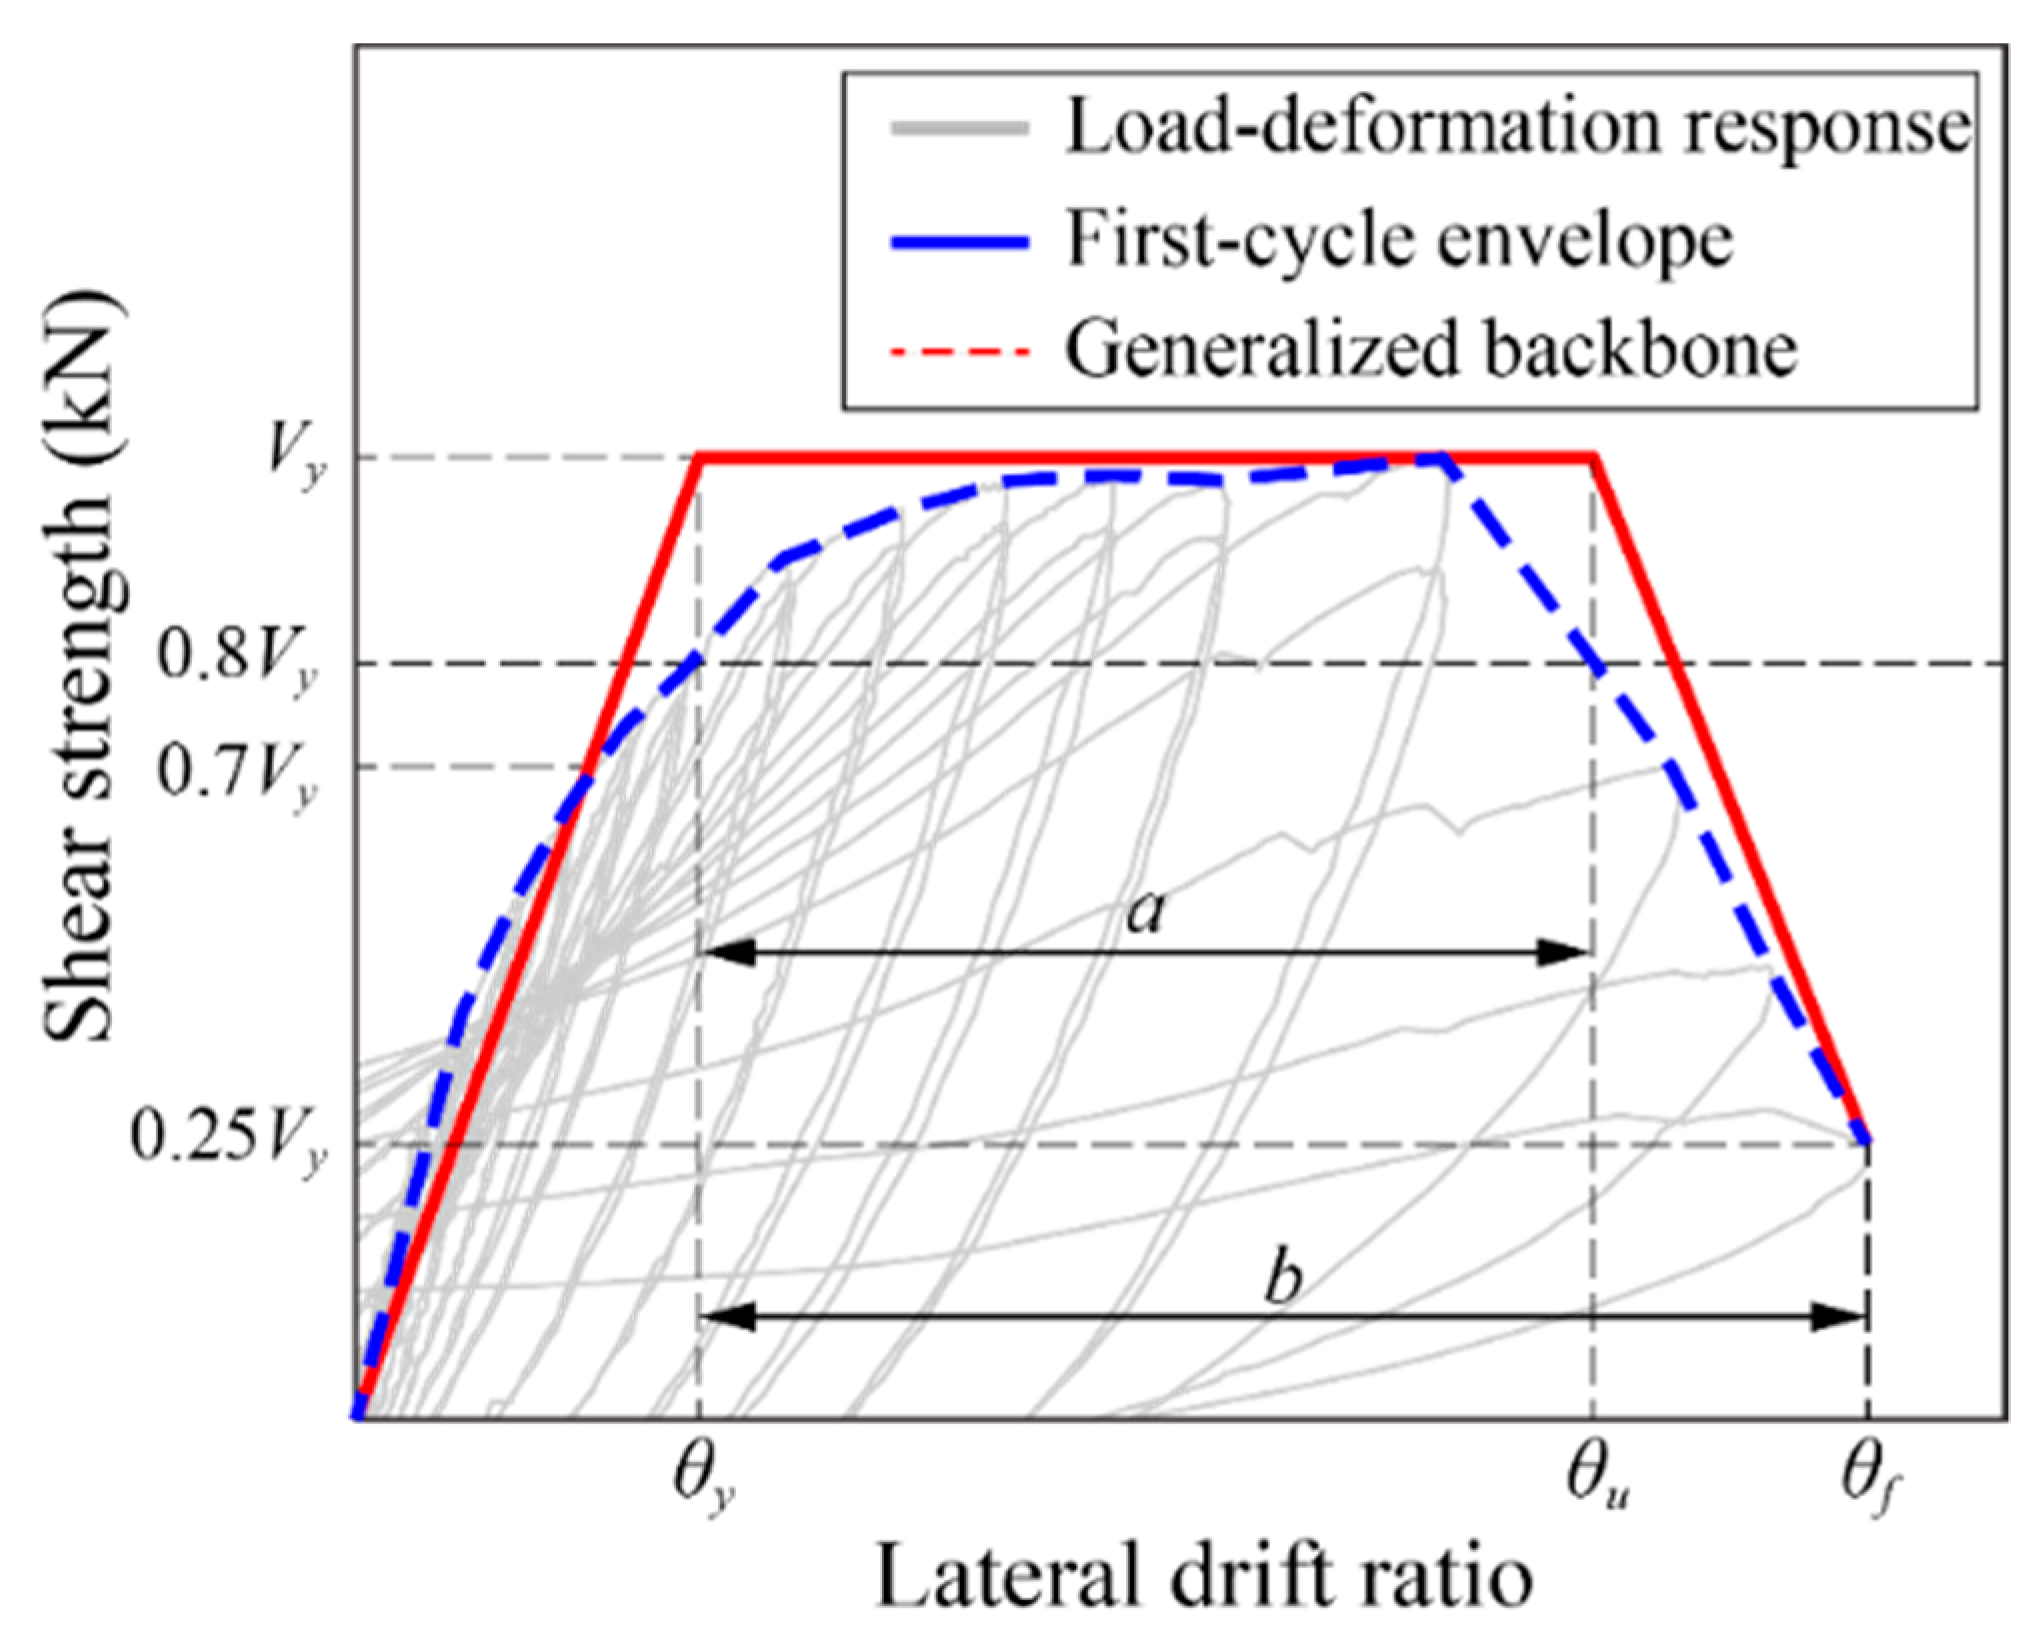
2. Backbone Curve for RC Columns in ASCE 41-17
3. Estimating the Values of Modeling Parameters from the Measured Cyclic Curves
4. Stocky RC Column Database
| Height-to-depth ratio | 1.0 ≤ ≤ 2.0 |
| Section width (mm) | 160 ≤ ≤ 500 |
| Section height (mm) | 160 ≤ ≤ 914 |
| Center-to-center spacing of a transverse reinforcement (mm) | 20 ≤ ≤ 406 |
| Longitudinal reinforcement ratio (%) | 1.27 ≤ ≤ 6.94 |
| Transverse reinforcement ratio (%) | 0.08 ≤ ≤ 1.64 |
| Measured compressive strength of concrete | 14 ≤ ≤ 118 |
| Measured yield strength of longitudinal reinforcement | 323 ≤ ≤ 510 |
| Measured yield strength of transverse reinforcement | 258 ≤ ≤ 1424 |
| Axial load ratio (%) | 0 ≤ ≤ 80.1; |
5. Regression Analysis
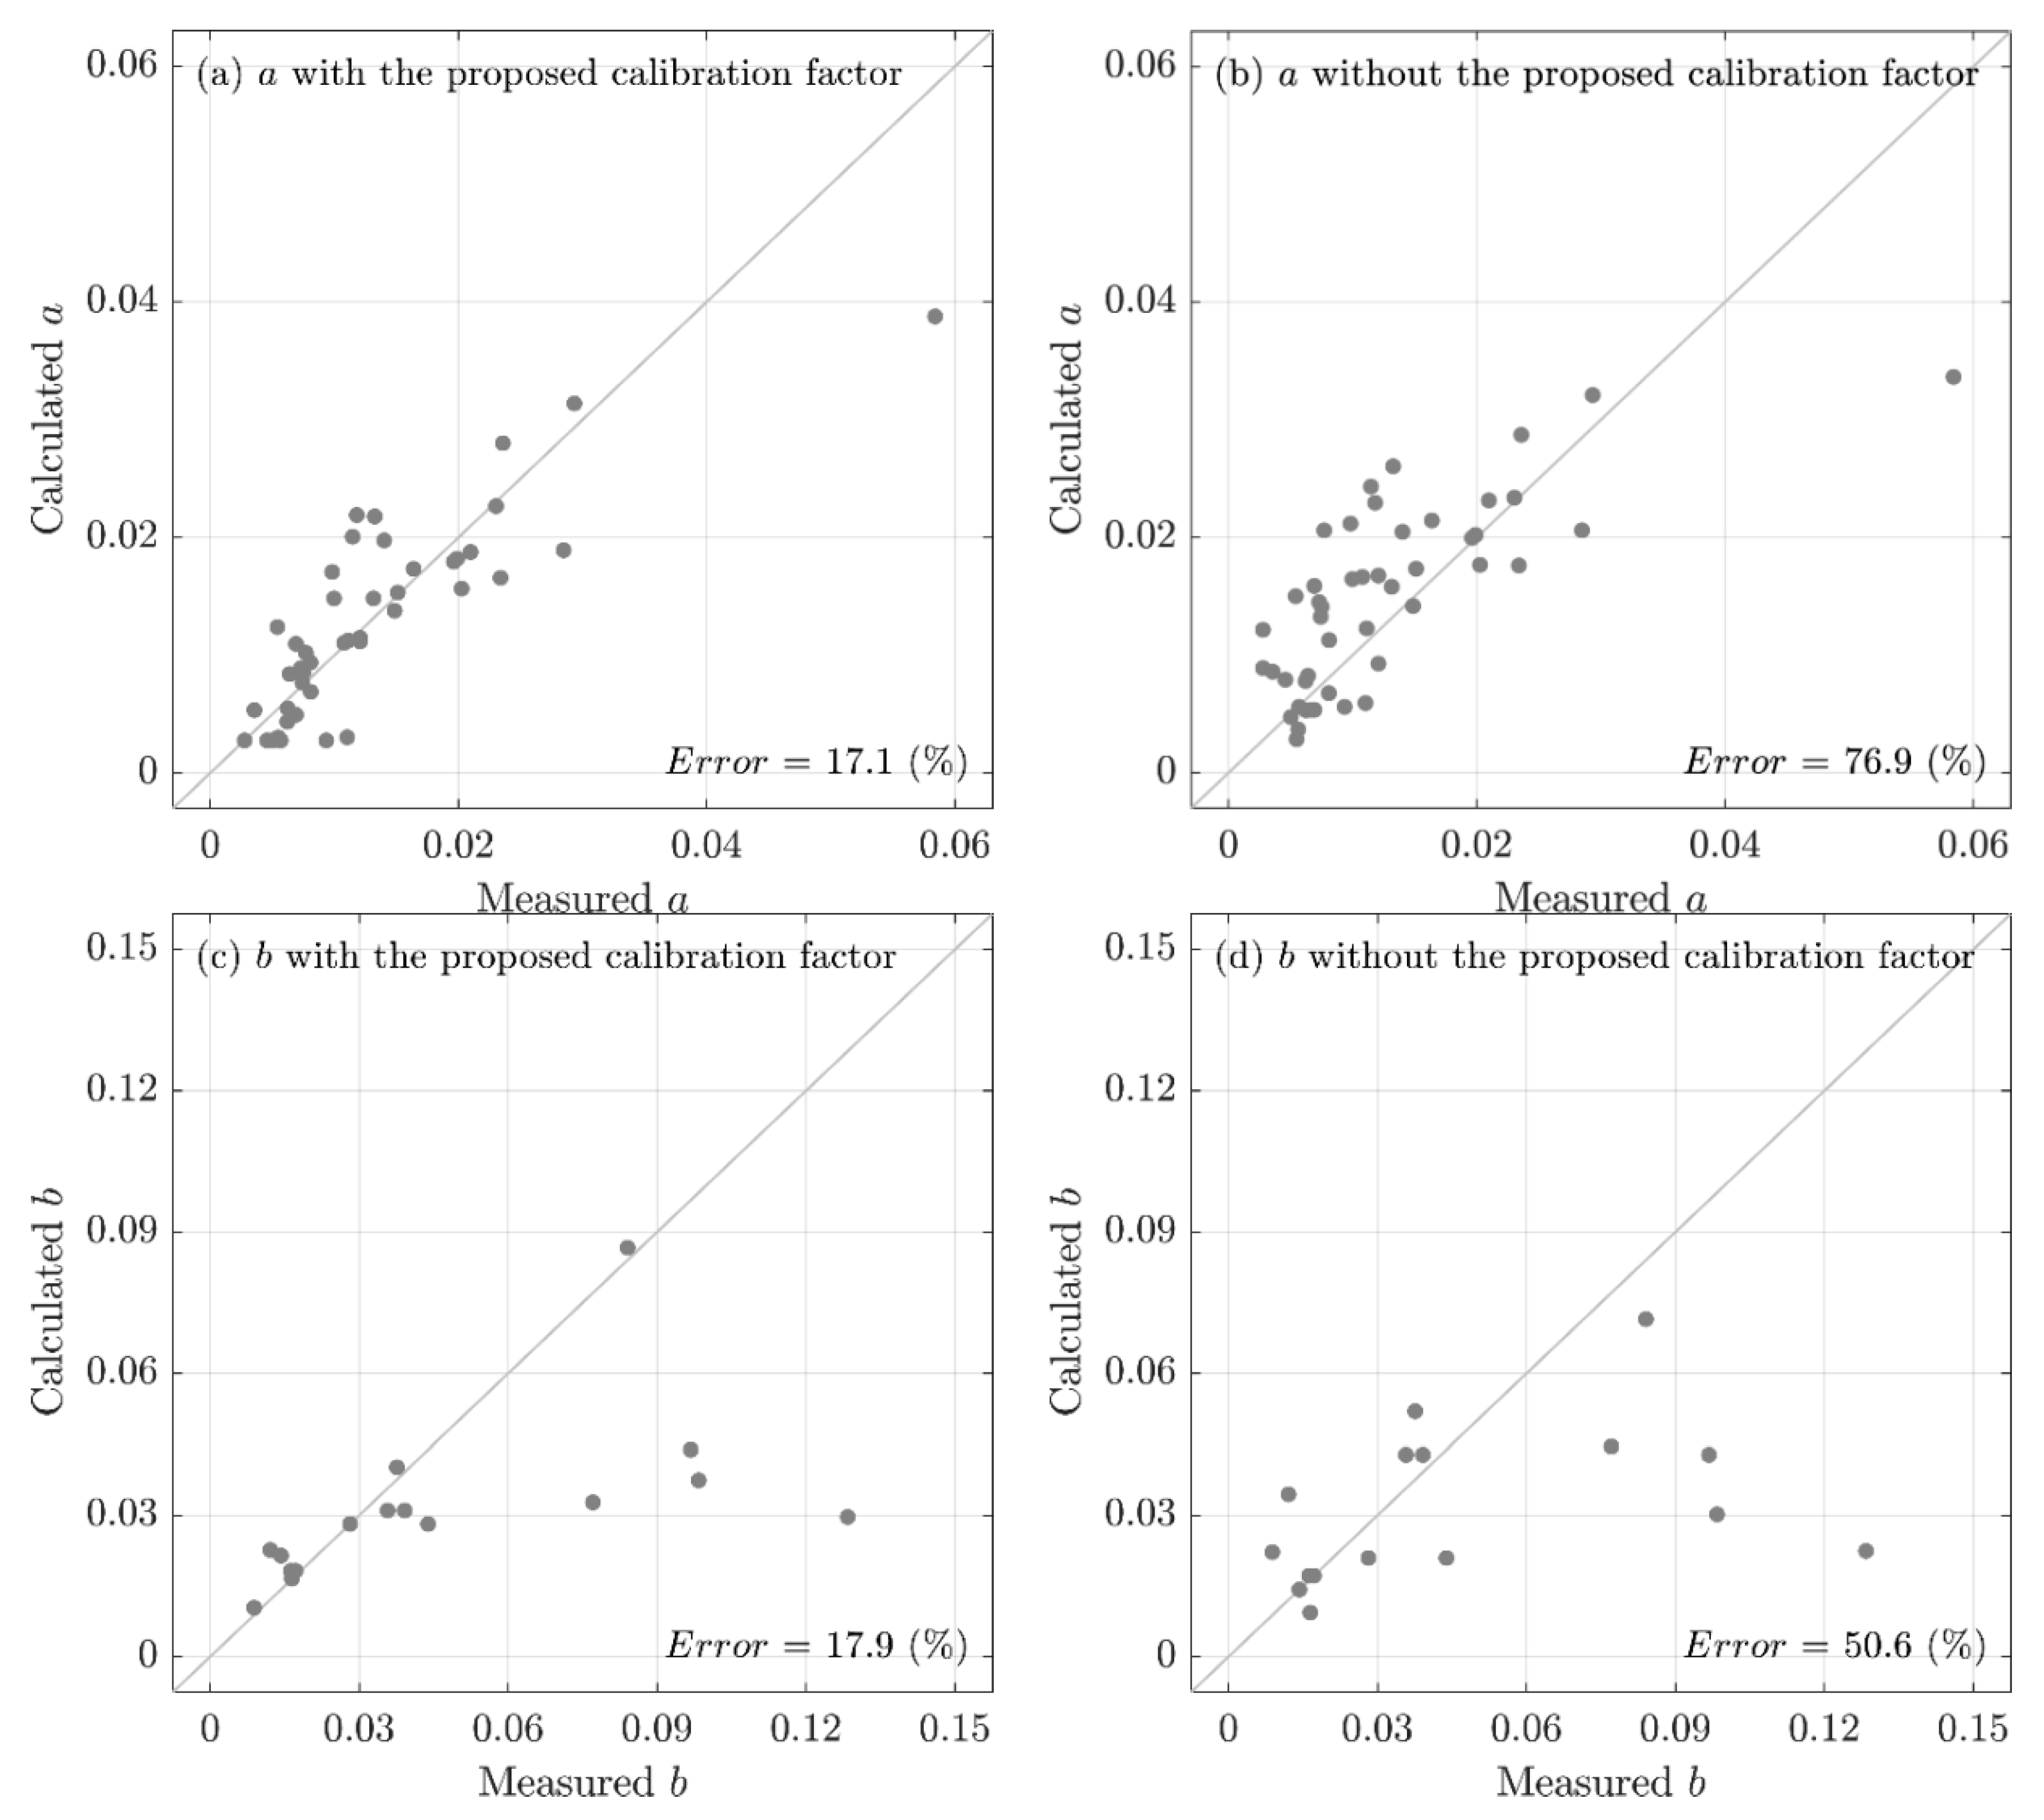
6. Validation of the Proposed Calibration Factor
7. Conclusions
- 1.
- The ASCE 41-17 equations for deformation modeling parameters produce erroneous predictions for stocky RC columns, because these equations do not consider the effect of of RC columns. The application of the proposed calibration factor significantly improved the accuracy of the calculated values of modeling parameters and for columns with less than 2.0.
- 2.
- After applying the calibration factor to the ASCE 41-17 equations, errors in the calculated values of modeling parameters and significantly decreased. For parameter , the error reduced from 87.7% to 41.4%, and for parameter , the error reduced from 71.1% to 42.3%.
- 3.
- The envelope curves for the stocky RC columns were accurately constructed using the modeling parameters with the proposed calibration factor, which match the measured cyclic curves.
Author Contributions
Funding
Acknowledgments
Conflicts of Interest
References
- Lynn, A.C.; Moehle, J.P.; Mahin, S.A.; Holmes, W.T. Seismic evaluation of existing reinforced concrete building columns. Earthq. Spectra 1996, 12, 715–739. [Google Scholar] [CrossRef]
- Sezen, H.; Whittaker, A.S.; Elwood, K.J.; Mosalam, K.M. Performance of reinforced concrete buildings during the August 17, 1999 Kocaeli, Turkey earthquake, and seismic design and construction practise in Turkey. Eng. Struct. 2003, 25, 103–114. [Google Scholar] [CrossRef]
- Humar, J.M.; Lau, D.; Pierre, J.-R. Performance of buildings during the 2001 Bhuj earthquake. Can. J. Civ. Eng. 2001, 28, 979–991. [Google Scholar] [CrossRef]
- Kam, W.Y.; Pampanin, S.; Dhakal, R.; Gavin, H.P.; Roeder, C. Seismic performance of reinforced concrete buildings in the September 2010 Darfield (Canterbury) earthquake. Bull. N. Z. Soc. Earthq. Eng. 2010, 43, 340–350. [Google Scholar] [CrossRef]
- Galal, K.; Arafa, A.; Ghobarah, A. Retrofit of RC square short columns. Eng. Struct. 2005, 27, 801–813. [Google Scholar] [CrossRef]
- Liel, A.B.; Haselton, C.B.; Deierlein, G.G. Seismic collapse safety of reinforced concrete buildings. II: Comparative assessment of nonductile and ductile moment frames. J. Struct. Eng. 2011, 137, 492–502. [Google Scholar] [CrossRef]
- Lee, C.S.; Han, S.W. Cyclic behaviour of lightly-reinforced concrete columns with short lap splices subjected to unidirectional and bidirectional loadings. Eng. Struct. 2019, 189, 373–384. [Google Scholar] [CrossRef]
- Harries, K.A.; Ricles, J.M.; Pessiki, S.; Sause, R. Seismic retrofit of lap splices in nonductile columns using CFRP jackets. ACI Struct. J. 2006, 103, 874–884. [Google Scholar] [CrossRef]
- Melek, M.; Wallace, J. Performance of columns with short lap splices. In Proceedings of the 13th World Conference on Earthquake Engineering, Vancouver, BC, Canada, 1–6 August 2004. [Google Scholar]
- Cho, J.-Y.; Pincheira, J.A. Nonlinear modeling of RC columns with short lap splices. In Proceedings of the 13th World Conference on Earthquake Engineering, Vancouver, BC, Canada, 1–6 August 2004. [Google Scholar]
- Kim, C.-G.; Park, H.-G.; Eom, T.-S. Seismic performance of reinforced concrete columns with lap splices in plastic hinge region. ACI Struct. J. 2018, 115, 235–245. [Google Scholar] [CrossRef]
- Sezen, H.; Moehle, J.P. Shear strength model for lightly reinforced concrete columns. J. Struct. Eng. 2004, 130, 1692–1703. [Google Scholar] [CrossRef]
- Sezen, H.; Moehle, J.R. Seismic tests of concrete columns with light transverse reinforcement. ACI Struct. J. 2006, 103, 842–849. [Google Scholar] [CrossRef]
- Elwood, K.J.; Moehle, J.P. Drift capacity of reinforced concrete columns with light transverse reinforcement. Earthq. Spectra 2005, 21, 71–89. [Google Scholar] [CrossRef]
- Elwood, K.J.; Moehle, J.P. Axial capacity model for shear-damaged columns. ACI Struct. J. 2005, 102, 578–587. [Google Scholar] [CrossRef]
- Baradaran Shoraka, M.; Elwood, K.J. Mechanical model for non ductile reinforced concrete columns. J. Earthq. Eng. 2013, 17, 937–957. [Google Scholar] [CrossRef]
- Elwood, K.J.; Moehle, J.P. Dynamic collapse analysis for a reinforced concrete frame sustaining shear and axial failures. Earthq. Eng. Struct. Dyn. 2008, 37, 991–1012. [Google Scholar] [CrossRef]
- Moehle, J.P.; Mahin, S.A. Observations on the behavior of reinforced concrete buildings during earthquakes. ACI Symp. Publ. 1991, 127, 67–90. [Google Scholar] [CrossRef]
- Haselton, C.B.; Liel, A.B.; Taylor-Lange, S.C.; Deierlein, G.G. Calibration of model to simulate response of reinforced concrete beam-columns to collapse. ACI Struct. J. 2016, 113, 1141–1152. [Google Scholar] [CrossRef]
- Sezen, H.; Chowdhury, T. Hysteretic model for reinforced concrete columns including the effect of shear and axial load failure. J. Struct. Eng. 2009, 135, 139–146. [Google Scholar] [CrossRef]
- Ghannoum, W.M.; Moehle, J.P. Rotation-based shear failure model for lightly confined RC columns. J. Struct. Eng. 2012, 138, 1267–1278. [Google Scholar] [CrossRef]
- Elwood, K.J.; Eberhard, M.O. Effective stiffness of reinforced concrete columns. ACI Struct. J. 2009, 106, 476–484. [Google Scholar] [CrossRef]
- ASCE 41-17. Seismic Evaluation and Retrofit of Existing Buildings; American Society of Civil Engineers: Reston, VA, USA, 2017. [Google Scholar] [CrossRef]
- Ghannoum, W.M.; Matamoros, A.B. Nonlinear modeling parameters and acceptance criteria for concrete columns. ACI Spec. Publ. 2014, 297, 1–24. [Google Scholar]
- ASCE 41-13. Seismic Evaluation and Retrofit of Existing Buildings; American Society of Civil Engineers: Reston, VA, USA, 2014. [Google Scholar] [CrossRef]
- Wen, Y.K.; Collins, K.R.; Han, S.W.; Elwood, K.J. Dual-level designs of buildings under seismic loads. Struct. Saf. 1996, 18, 195–224. [Google Scholar] [CrossRef]
- Lee, L.H.; Lee, H.H.; Han, S.W. Method of selecting design earthquake ground motions for tall buildings. Struct. Des. Tall Build. 2000, 9, 201–213. [Google Scholar] [CrossRef]
- Elwood, K.J.; Matamoros, A.B.; Wallace, J.W.; Lehman, D.E.; Heintz, J.A.; Mitchell, A.D.; Moore, M.A.; Valley, M.T.; Lowes, L.N.; Comartin, C.D.; et al. Update to ASCE/SEI 41 concrete provisions. Earthq. Spectra 2007, 23, 493–523. [Google Scholar] [CrossRef]
- Zhou, X.; Satoh, T.; Jiang, W.; Ono, A.; Shimizu, Y. Behavior of reinforced concrete short column under high axial load. Trans. Jpn. Concr. Inst. 1987, 9, 541–548. [Google Scholar]
- Han, S.W.; Lee, C.S.; Shin, M.; Lee, K. Cyclic performance of precast coupling beams with bundled diagonal reinforcement. Eng. Struct. 2015, 93, 142–151. [Google Scholar] [CrossRef]
- Chen, Z.; Ding, Y.; Shi, Y.; Li, Z. A vertical isolation device with variable stiffness for long-span spatial structures. Soil Dyn. Earthq. Eng. 2019, 123, 543–558. [Google Scholar] [CrossRef]
- Moretti, M.; Tassios, T.P. Behaviour of short columns subjected to cyclic shear displacements: Experimental results. Eng. Struct. 2007, 29, 2018–2029. [Google Scholar] [CrossRef]
- FEMA P440A. Effects of Strength and Stiffness Degradation on Seismic Response; 440A; Department of Homeland Security: Washington, DC, USA, 2009. [Google Scholar]
- Berry, M.P.; Eberhard, M.O. Performance Models for Flexural Damage in Reinforced Concrete Columns; Pacific Earthquake Engineering Research Center: Berkeley, CA, USA, 2004. [Google Scholar]
- Berry, M.; Parrish, M.; Eberhard, M. PEER Structural Performance Database User’s Manual; University of California, Berkeley: Berkeley, CA, USA, 2004. [Google Scholar]
- Aboutaha, R.S.; Engelhardt, M.D.; Jirsa, J.O.; Kreger, M.E. Rehabilitation of shear critical concrete columns by use of rectangular steel jackets. ACI Struct. J. 1999, 96, 68–78. [Google Scholar] [CrossRef][Green Version]
- Amitsu, S.; Shirai, N.; Adachi, H.; Ono, A. Deformation of reinforced concrete column with high or fluctuating axial force. Trans. Jpn. Concr. Inst. 1991, 13, 355–362. [Google Scholar]
- Esaki, F. Reinforcing effect of steel plate hoops on ductility of R/C square columns. In Proceedings of the 11th World Conference on Earthquake Engineering, Acapulco, Mexico, 23–28 June 1996. [Google Scholar]
- Iwasaki, T.; Kawasima, K.; Hagiwara, R.; Koyama, T.; Yoshida, T. Experimental Investigation on Hysteretic Behavior of Reinforced Concrete Bridge Pier Columns; Public Works Research Institute: Tsukuba, Japan, 1985. [Google Scholar]
- Nagasaka, T. Effectiveness of steel fiber as web reinforcement in reinforced concrete columns. Trans. Jpn. Concr. Inst. 1982, 4, 493–500. [Google Scholar]
- Nakamura, T.; Yoshimura, M. Gravity load collapse of reinforced concrete columns with brittle failure modes. J. Asian Arch. Build. Eng. 2002, 1, 21–27. [Google Scholar] [CrossRef]
- Ohue, M.; Morimoto, H.; Fujii, S.; Morita, S. The behavior of RC short columns failing in splitting bond-shear under dynamic lateral loading. Trans. Jpn. Concr. Inst. 1985, 7, 293–300. [Google Scholar]
- Ono, A.; Shirai, N.; Adachi, H.; Sakamaki, Y. Elasto-plastic behavior of reinforced concrete column with fluctuating axial force. Trans. Jpn. Concr. Inst. 1989, 11, 239–246. [Google Scholar]
- Ousalem, H.; Kabeyasawa, T.; Tasai, A.; Ohsugi, Y. Experimental study on seismic behavior of reinforced concrete columns under constant and variable axial loadings. In Proceedings of the Japan Concrete Institute, Tsukuba, Japan, June 2002. [Google Scholar]
- Ousalem, H.; Kabeyasawa, T.; Tasai, A. Effect of hysteretic reversals on lateral and axial capacities of reinforced concrete columns. In Proceedings of the Fifth U.S.-Japan Workshop on Performance-Based Earthquake Engineering Methodology for Reinforced Concrete Structures, Hakone, Japan, 10–11 September 2003. [Google Scholar]
- Sakai, Y.; Hibi, J.; Otani, S.; Aoyama, H. Experimental study on flexural behavior of reinforced concrete columns using high-strength concrete. Trans. Jpn. Concr. Inst. 1990, 12, 323–330. [Google Scholar]
- Sugano, S. Seismic behavior of reinforced concrete columns which used ultra-high-strength concrete. In Proceedings of the 11th World Conference on Earthquake Engineering, Acapulco, Mexico, 23–28 June 1996. [Google Scholar]
- Umehara, H.; Jirsa, J.O. Shear Strength and Deterioration of Short Reinforced Concrete Columns Under Cyclic Deformations; PMFSEL Report No. 82-3; University of Texas at Austin: Austin, TX, USA, 1982. [Google Scholar]
- Xiao, Y.; Martirossyan, A. Seismic performance of high-strength concrete columns. J. Struct. Eng. 1998, 124, 241–251. [Google Scholar] [CrossRef]
- Takaine, Y.; Yoshimura, M.; Nakamura, T. Collapse drift of reinforced concrete columns. J. Struct. Constr. Eng. (Trans. AIJ) 2003, 68, 153–160. [Google Scholar] [CrossRef]
- Yoshimura, K.; Kikcuri, K.; Kuroki, M. Seismic shear strengthening method for existing R/C short columns. ACI Spec. Publ. 1991, 128, 1065–1080. [Google Scholar] [CrossRef]
- LeBorgne, M.R.; Ghannoum, W.M. Calibrated analytical element for lateral-strength degradation of reinforced concrete columns. Eng. Struct. 2014, 81, 35–48. [Google Scholar] [CrossRef]
- Han, S.W.; Koh, H.; Lee, C.S. Accurate and efficient simulation of cyclic behavior of diagonally reinforced concrete coupling beams. Earthq. Spectra 2019, 35, 361–381. [Google Scholar] [CrossRef]
- Lee, C.S.; Han, S.W. Computationally effective and accurate simulation of cyclic behaviour of old reinforced concrete columns. Eng. Struct. 2018, 173, 892–907. [Google Scholar] [CrossRef]
- Elwood, K.J. Modelling failures in existing reinforced concrete columns. Can. J. Civ. Eng. 2004, 31, 846–859. [Google Scholar] [CrossRef]
- Chatterjee, S.; Hadi, A.S. Regression Analysis by Example, 4th ed.; Wiley Series in Probability and Statistics; Wiley: Hoboken, NJ, USA, 2006. [Google Scholar] [CrossRef]
- Shin, M.; Gwon, S.-W.; Lee, K.; Han, S.W.; Jo, Y.W. Effectiveness of high performance fiber-reinforced cement composites in slender coupling beams. Constr. Build. Mater. 2014, 68, 476–490. [Google Scholar] [CrossRef]
- Barney, G.B.; Shiu, K.N.; Rabbat, B.G.; Fiorato, A.E.; Russell, H.G.; Corley, W.G. Behavior of Coupling Beams Under Load Reversals (RD068.01B); Portland Cement Association: Skokie, IL, USA, 1980. [Google Scholar]
- Breña, S.F.; Ihtiyar, O. Performance of conventionally reinforced coupling beams subjected to cyclic loading. J. Struct. Eng. 2011, 137, 665–676. [Google Scholar] [CrossRef]
- Ding, R.; Tao, M.-X.; Nie, J.-G.; Mo, Y.L. Shear deformation and sliding-based fiber beam-column model for seismic analysis of reinforced concrete coupling beams. J. Struct. Eng. 2016, 142, 04016032. [Google Scholar] [CrossRef]


| Component | Flexural Rigidity | Shear Rigidity | Axial Rigidity |
|---|---|---|---|
| Columns with compression caused by design gravity loads | |||
| Columns with compression caused by design gravity loads or with tension |
| No. | ID | (mm) | (mm) | (mm) | (%) | (%) | (MPa) | (MPa) | (%) | (%) | Reference | |
|---|---|---|---|---|---|---|---|---|---|---|---|---|
| 1 | SC9 | 1.33 | 457 | 914 | 406 | 1.88 | 0.08 | 16 | 400 | 0.36 | - | [36] |
| 2 | CB060C | 1.16 | 278 | 278 | 52 | 2.75 | 0.78 | 46 | 414 | 0.50 | - | [37] |
| 3 | H-2-1_3 | 2.00 | 200 | 200 | 40 | 2.65 | 0.71 | 23 | 364 | 1.51 | - | [38] |
| 4 | H-2-1_5 | 2.00 | 200 | 200 | 50 | 2.65 | 0.57 | 23 | 364 | 1.96 | - | |
| 5 | HT-2-1_3 | 2.00 | 200 | 200 | 60 | 2.65 | 0.71 | 20 | 364 | 2.03 | - | |
| 6 | HT-2-1_5 | 2.00 | 200 | 200 | 75 | 2.65 | 0.57 | 20 | 364 | 1.99 | - | |
| 7 | I18 | 2.00 | 500 | 500 | 254 | 2.12 | 0.20 | 33 | 258 | 1.64 | - | [39] |
| 8 | I21 | 2.00 | 500 | 500 | 254 | 2.12 | 0.20 | 32 | 258 | 0.98 | - | |
| 9 | HPRC10-63 | 1.50 | 200 | 200 | 35 | 1.27 | 0.68 | 22 | 344 | 1.33 | - | [40] |
| 10 | HPRC19-32 | 1.50 | 200 | 200 | 20 | 1.27 | 1.19 | 21 | 344 | 1.15 | - | |
| 11 | N-18M | 1.50 | 300 | 300 | 100 | 2.68 | 0.21 | 27 | 380 | 0.62 | 10.16 | [41] |
| 12 | N-27C | 1.50 | 300 | 300 | 100 | 2.68 | 0.21 | 27 | 380 | 0.57 | 3.00 | |
| 13 | N-27M | 1.50 | 300 | 300 | 100 | 2.68 | 0.21 | 27 | 380 | 0.94 | 4.70 | |
| 14 | 2D16RS | 2.00 | 200 | 200 | 50 | 2.01 | 0.48 | 32 | 316 | 2.85 | - | [42] |
| 15 | 4D13RS | 2.00 | 200 | 200 | 50 | 2.65 | 0.48 | 30 | 316 | 1.00 | - | |
| 16 | CA025C | 1.50 | 200 | 200 | 70 | 2.13 | 0.81 | 26 | 426 | 2.10 | - | [43] |
| 17 | CA060C | 1.50 | 200 | 200 | 70 | 2.13 | 0.81 | 26 | 426 | 0.81 | - | |
| 18 | C1 | 1.50 | 300 | 300 | 160 | 1.69 | 0.08 | 14 | 587 | 0.46 | 2.33 | [44] |
| 19 | C12 | 1.50 | 300 | 300 | 75 | 1.69 | 0.28 | 18 | 384 | 1.21 | 8.15 | |
| 20 | C4 | 1.50 | 300 | 300 | 75 | 1.69 | 0.28 | 14 | 587 | 1.08 | 5.57 | |
| 21 | C8 | 1.50 | 300 | 300 | 75 | 1.69 | 0.28 | 18 | 384 | 0.74 | 2.21 | |
| 22 | D1 | 1.00 | 300 | 300 | 50 | 1.69 | 0.42 | 28 | 398 | 0.73 | 3.96 | [45] |
| 23 | D11 | 1.50 | 300 | 300 | 150 | 2.25 | 0.14 | 28 | 398 | 0.66 | 1.89 | |
| 24 | D12 | 1.50 | 300 | 300 | 150 | 2.25 | 0.14 | 28 | 398 | 0.69 | 1.98 | |
| 25 | D14 | 1.50 | 300 | 300 | 50 | 2.25 | 0.42 | 26 | 398 | 1.49 | 17.98 | |
| 26 | D16 | 1.00 | 300 | 300 | 50 | 1.69 | 0.42 | 26 | 398 | 0.75 | 8.45 | |
| 27 | B3 | 2.00 | 250 | 250 | 60 | 2.43 | 0.63 | 100 | 344 | 1.11 | - | [46] |
| 28 | B4 | 2.00 | 250 | 250 | 60 | 2.43 | 0.52 | 100 | 1126 | 2.34 | - | |
| 29 | B5 | 2.00 | 250 | 250 | 30 | 2.43 | 1.05 | 100 | 774 | 1.18 | - | |
| 30 | B6 | 2.00 | 250 | 250 | 60 | 2.43 | 0.52 | 100 | 857 | 1.32 | - | |
| 31 | B7 | 2.00 | 250 | 250 | 30 | 1.81 | 0.52 | 100 | 774 | 0.54 | - | |
| 32 | UC15H | 2.00 | 225 | 225 | 45 | 1.86 | 1.27 | 118 | 1424 | 1.40 | - | [47] |
| 33 | UC15L | 2.00 | 225 | 225 | 45 | 1.86 | 1.27 | 118 | 1424 | 2.36 | - | |
| 34 | UC20H | 2.00 | 225 | 225 | 35 | 1.86 | 1.63 | 118 | 1424 | 2.30 | - | |
| 35 | UC20L | 2.00 | 225 | 225 | 35 | 1.86 | 1.63 | 118 | 1424 | 2.93 | - | |
| 36 | CUS | 1.11 | 230 | 410 | 89 | 3.01 | 0.55 | 35 | 414 | 0.69 | - | [48] |
| 37 | CUW | 1.98 | 410 | 230 | 89 | 3.01 | 0.15 | 35 | 414 | 1.21 | - | |
| 38 | UM207 | 2.00 | 200 | 200 | 100 | 1.99 | 0.28 | 18 | 324 | 0.81 | - | |
| 39 | HC4-8L16-T10-0.2P | 2.00 | 254 | 254 | 51 | 2.46 | 1.64 | 86 | 510 | 5.84 | - | [49] |
| 40 | No.1 | 2.00 | 300 | 300 | 100 | 2.68 | 0.19 | 31 | 392 | 0.64 | - | [50] |
| 41 | No.3 | 2.00 | 300 | 300 | 200 | 2.68 | 0.09 | 31 | 392 | 0.55 | 8.00 | |
| 42 | No.4 | 2.00 | 300 | 300 | 100 | 2.68 | 0.19 | 31 | 392 | 0.62 | 1.95 | |
| 43 | BE | 1.00 | 175 | 175 | 110 | 2.42 | 0.29 | 33 | 312 | 0.28 | 2.01 | [51] |
| 44 | CE | 1.00 | 175 | 175 | 110 | 2.42 | 0.29 | 26 | 312 | 0.28 | - | |
| 45 | LE | 1.00 | 175 | 175 | 20 | 6.94 | 1.62 | 42 | 322 | 0.77 | - | |
| 46 | 104-08 | 1.00 | 160 | 160 | 40 | 2.22 | 0.61 | 20 | 559 | 0.56 | - | [29] |
| 47 | 204-08 | 2.00 | 160 | 160 | 40 | 2.22 | 0.61 | 21 | 559 | 1.10 | - |
© 2019 by the authors. Licensee MDPI, Basel, Switzerland. This article is an open access article distributed under the terms and conditions of the Creative Commons Attribution (CC BY) license (http://creativecommons.org/licenses/by/4.0/).
Share and Cite
Han, S.W.; Lee, C.S.; Paz Zambrana, M.A.; Lee, K. Calibration Factor for ASCE 41-17 Modeling Parameters for Stocky Rectangular RC Columns. Appl. Sci. 2019, 9, 5193. https://doi.org/10.3390/app9235193
Han SW, Lee CS, Paz Zambrana MA, Lee K. Calibration Factor for ASCE 41-17 Modeling Parameters for Stocky Rectangular RC Columns. Applied Sciences. 2019; 9(23):5193. https://doi.org/10.3390/app9235193
Chicago/Turabian StyleHan, Sang Whan, Chang Seok Lee, Mary Ann Paz Zambrana, and Kihak Lee. 2019. "Calibration Factor for ASCE 41-17 Modeling Parameters for Stocky Rectangular RC Columns" Applied Sciences 9, no. 23: 5193. https://doi.org/10.3390/app9235193
APA StyleHan, S. W., Lee, C. S., Paz Zambrana, M. A., & Lee, K. (2019). Calibration Factor for ASCE 41-17 Modeling Parameters for Stocky Rectangular RC Columns. Applied Sciences, 9(23), 5193. https://doi.org/10.3390/app9235193