1. Introduction
The research started from the analysis of the medical prosthesis world, in order to have a good knowledge of this sector. The first patented crutch was invented 100 years ago (1917), before conventional sticks or axillary supports were normally used. Currently, the more widespread types of crutch in the world are the Canadian crutch, which has a support for the forearm, and the axillary crutch. In Europe, the Canadian crutch is used for both short-term and long-term disabilities; on the other hand, outside Europe, especially in the USA, the axillary crutch is used for short-term disabilities, while the Canadian crutch is used for long-term needs.
Crutches can be divided, also, into analog and smart. The market currently presents only the first category, and in fact, there are many patents of smart crutches, but none of these is currently available for sale. Smart crutches at the state of art are crutches that aim to be multi-function (e.g., they have torches to illuminate the path, heating handles, call buttons, GPS, signals for requesting help, weight and movement control, etc.). Most of them are difficult to be sold on the market; firstly, because of their technical complexity and secondly for the gap between what the crutch offers and what people normally use. For these reasons, these crutches could be used in laboratories or during a medical examination, but not in everyday life. Then, all the new crutches launched on the market so far are crutches that have slightly different shapes than the usual ones, and they focus their innovation on performance and ergonomics, but none of them has ever proposed a smart feature.
Finally, based on the physical problem of the person involved, there are different types of crutches that can be used, but in the majority the two most common models used are the Canadians and the axillaries.
Actually, every physical problem requires a different and adequate support. For this reason, it has been identified that the people most in need of customized crutches are those who have permanent disabilities. In reality, there are not many crutches suitable for long-period disabilities that can be 100% customized. In fact, users who use crutches for life are people who have suffered injuries, various types of surgery in the lower limbs, or amputations, and so they need a comfortable and ergonomic support that may help them in their everyday life and during the rehabilitation process with the doctor [
1]. Furthermore, during the rehabilitation, the patient needs to load only a certain percentage of his weight to have a good recovery. Actually, the patient is just trained to load this percentage with the help of two personal weighing machines, in order to learn to feel the correct percentages of the correct load. This method does not work well, because it cannot be used in everyday life, so the patient often overloads the debilitated limb, compromising the rehabilitation process, or underloads it, thus not making progress. Furthermore, the load distribution is also important, in order to check how the patient balances his weight on the crutches [
2].
Starting from these premises and considering as our target a user who suffers a long-term disability, the project started with a market and competition analysis, supported by the quality function deployment (QFD) method and benchmarking, that will be better exposed in the next chapter. Through these methods—they are not the only ones, since another important innovation-oriented method could be the theory of the resolution of invention-related tasks (TRIZ, Russian for teoriya resheniya izobretatelskikh zadatch), for example [
3,
4,
5,
6]—it was possible to define qualitative and technical characteristics, which constitute the project objectives. Then, through a careful analysis of product architecture, styles and trends, it has been defined a crutch shape modeled with the creation of three dimensional (3D) prototypes, renderings and a formal prototype on a scale of 1:5.
2. Methods of Industrial Design Structure (IDeS)
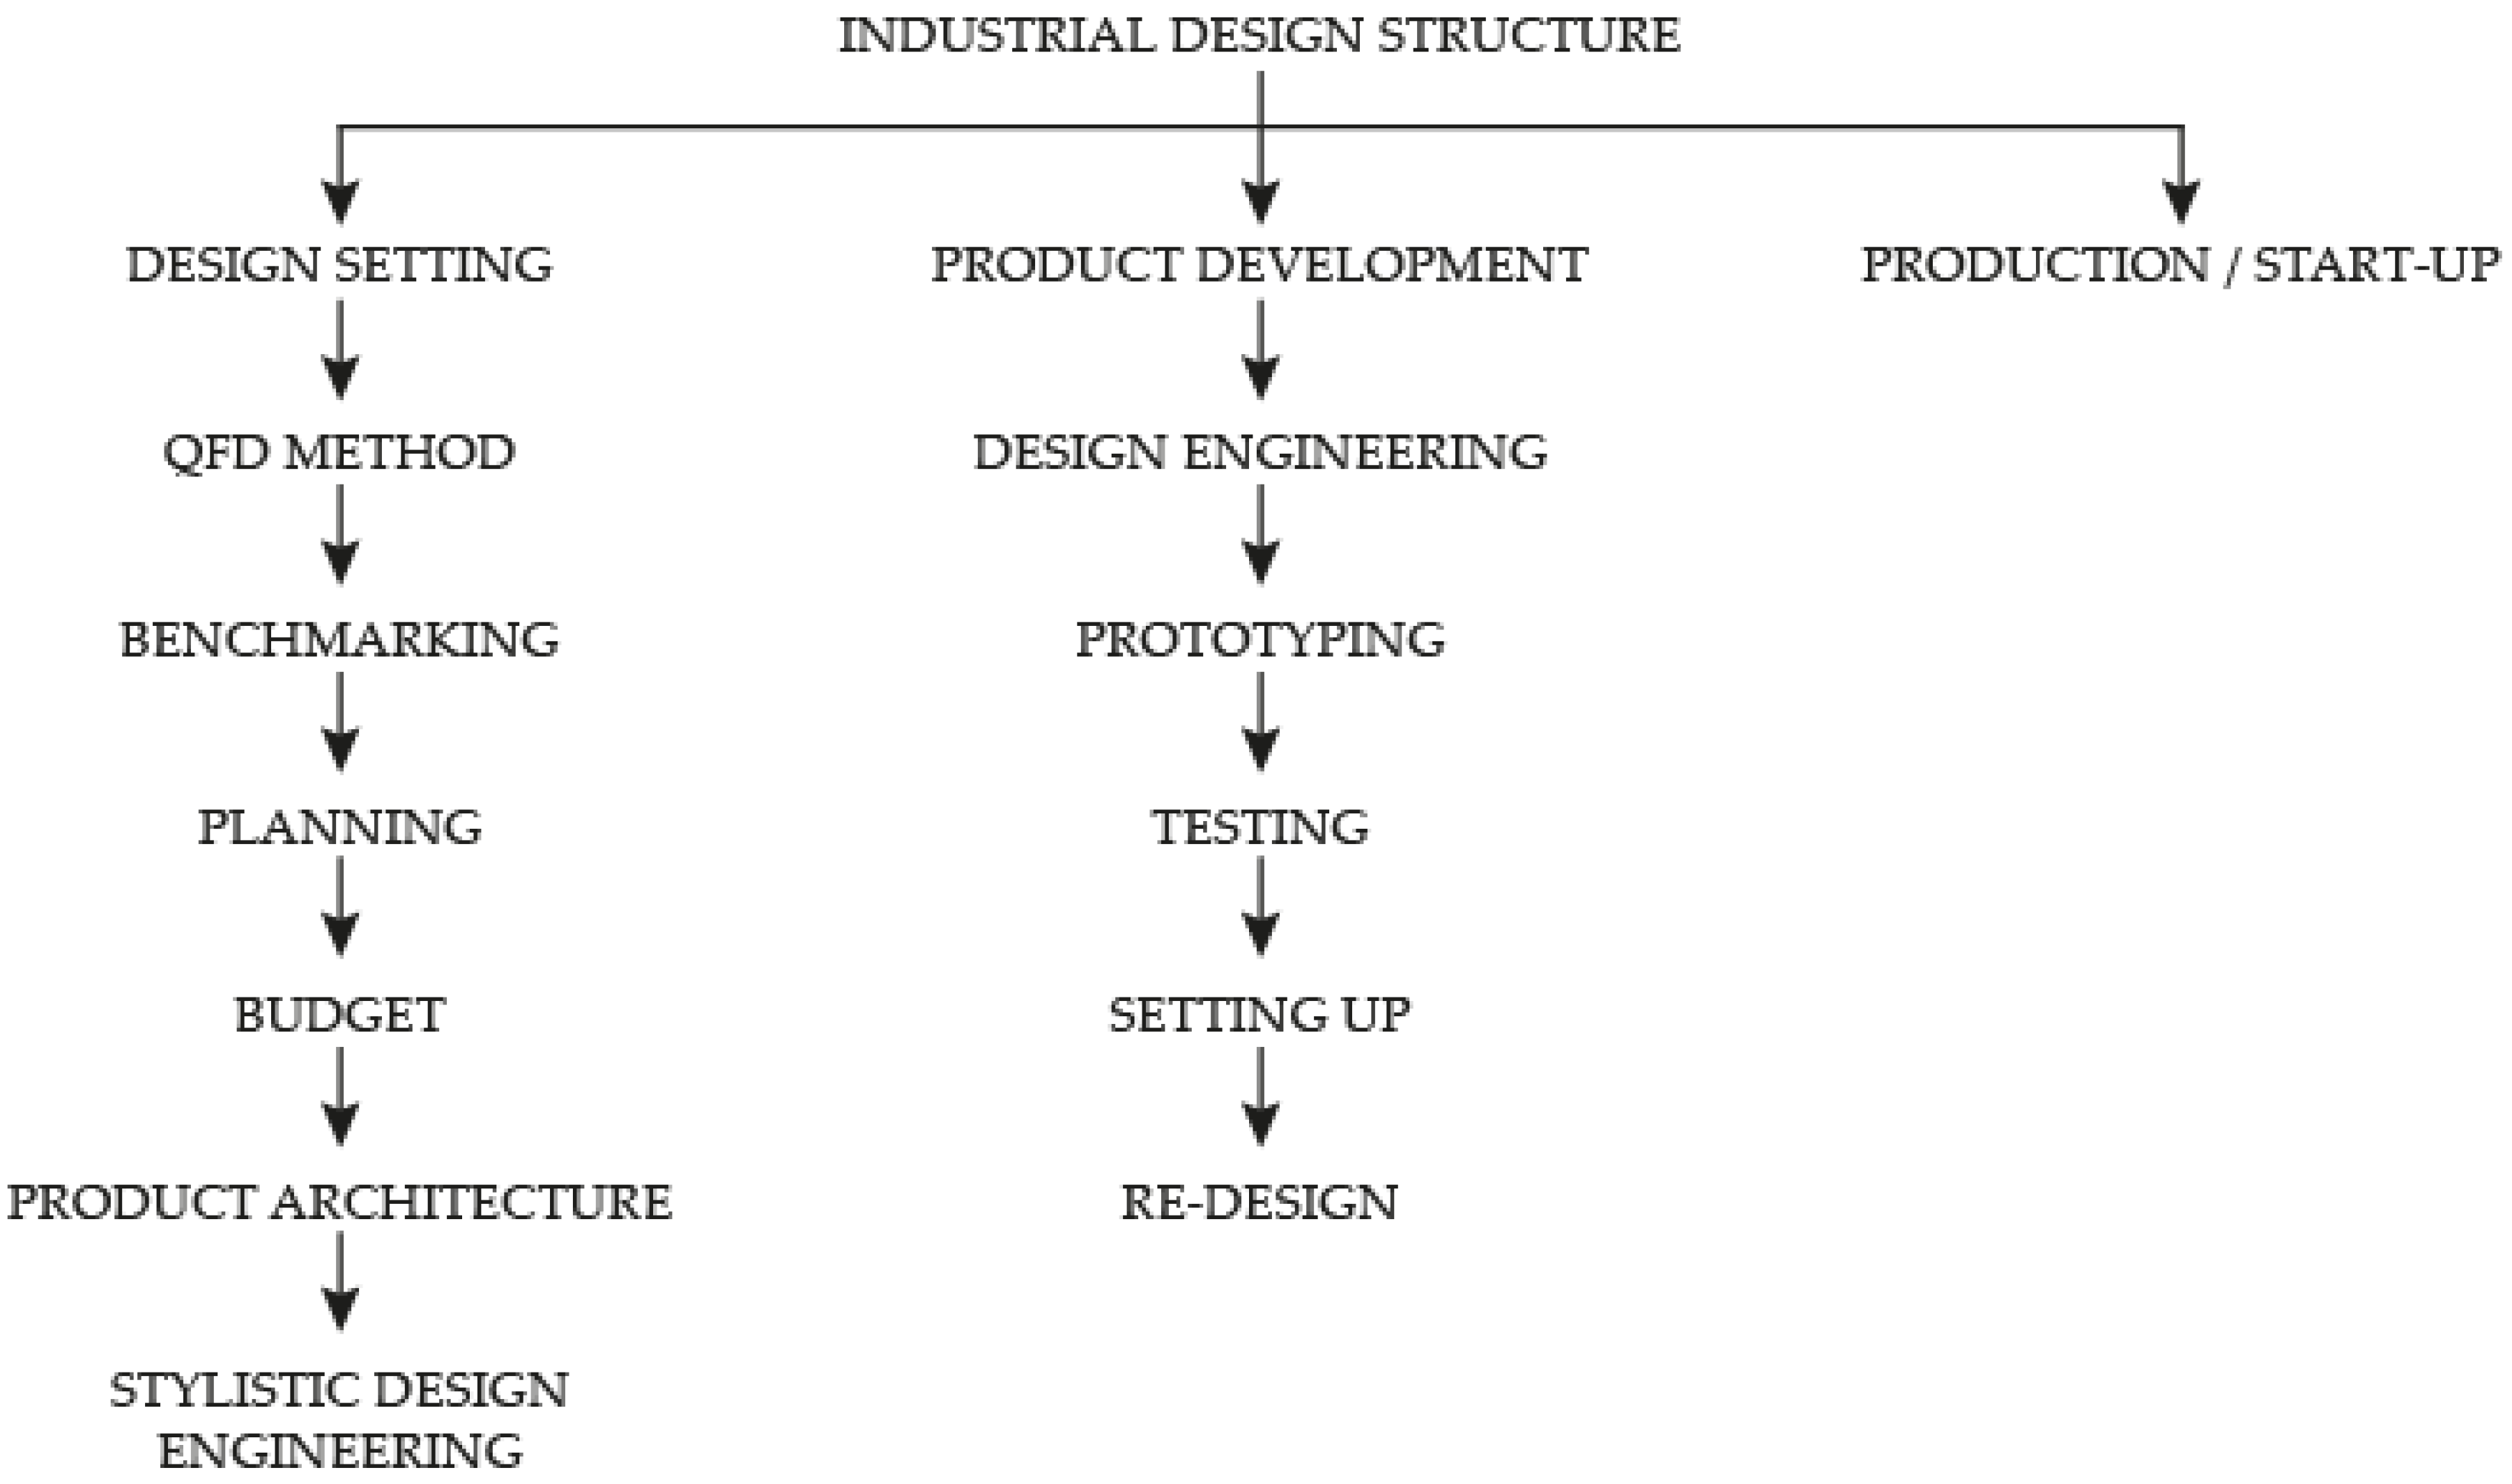
2.1. Design Setting
In support of our research, methods called quality function deployment (QFD) and benchmarking have been used to analyze the market and the competitors. The competitor analysis has been completed with the Top-Flop Analysis and the What-How Matrix. In the end, after the planning and the budget phase, the project ended with the Product Architecture development and the Stylistic Design Engineering,
Figure 1.
2.1.1. QFD Method
The QFD, or Quality Function Deployment, is a useful tool for the quality management applied to the design. It helps in designing the product or the service according to the functions expected by the customer.
The QFD consists of three analyses:
It generates a list of information that defines the characteristics which have an impact on user satisfaction.
The Six Questions (Who? Where? When? How? What? Why?) all help to frame the system and to start the brainstorming on the product/service in a more conscious way. From these questions, the characteristics that the product/service must have, came up. These requirements are then skimmed through the Relationship Matrices. Both matrices compare the requirements obtained in a double entry table.
In the Relationship Matrix of Relative Importance, it is necessary to assign a numerical value to all the cells, answering this question: “is the requirement of the row more important than the requirement of the column?”. After having done the sum of all the values in a column, the matrix reveals the most important features, which will be the ones with the highest values.
Similarly, in the Relationship Matrix of Dependence/Independence, it must be assigned a numeric value to all the cells based on how much a characteristic depends on the other one. By summing the values in every column, the matrix shows a classification of the most independent characteristics.
Taking the first three characteristics classified by the first matrix and the first three by the second matrix, there has been finally obtained a first list of project requirements.
2.1.2. Benchmarking
The second tool used is the benchmarking, which analyzes and compares the performances and the functions of the product/service competitors, thanks to a simple table.
The last column is the so-called Innovation Column, and it contains the best value for each row of benchmarking.
When the table is completed, the next phase is the Top-Flop Analysis. In this phase, the best and the worst values among the performances are compared; the quantity of Flop (worst performance) and Top (best performance) are added at the end of each columns. Calculating the numerical difference between the Tops and the Flops, the highest score of Δ obtained will define the number of characteristics which has to be innovated among the ones identified in the Innovation Column.
In order to understand which of these features should be innovated, the last tool to use is the What-How Matrix, which crosses the first six requirements of the Relationship Matrix and the performances of the Innovation Column. It is necessary to fill all the cells with a numerical value that depends upon how much a characteristic influences a specific feature of the product/service. As mentioned before, adding the totals obtained by summing all the values in a column, it is finally possible to see which are the features that must be innovated.
So, in this method all these tools are necessary in order to define the objectives of the project.
2.1.3. Planning
Another tool used to make a good project was the Gantt chart. This tool allows us to control the tasks (WBS—Work Breakdown Structure) and the time (scheduling) for each person in charge of the project, in order to have an absolute on them. First, it is necessary to define in advance every task which must be done, and how much time they would take. Every task must be divided into smaller tasks, and each one of them must be assigned to one member of the team.
Furthermore, every task always has some deadlines, so everything is determined starting with them and with the expected results. In this way everyone, in each moment, could schedule his tasks agreed in advance, and this way allow the whole design process to be very efficient. This tool also enables people to be aware of the consequences of possible delays; in these cases, it is possible to resize the time assigned to the further tasks.
2.1.4. Budget
Setting the budget is important to understand the costs of the product and to hypothesize the possible sale price. Normally, in the present step, the budget is dedicated only to R&D Costs. The period for this development was subdivided into Project Setting and Product Development; for the second part, the budget was calculated through different phases (design, prototyping, experimentation, setting up and redesign) and for each step has been specified the costs of the materials, the prototype equipment and the professional service. The result obtained was the budget needed to make a functional prototype.
2.1.5. Product Architecture
The Product Architecture is a method that allows designers to think about the functions and the shapes of the product without focusing too much on details and technical components.
Product Architecture is the “skeleton” of an idea. By drawing or representing the product in a simplified way, it is possible to see if each part is in harmony with the others and the functions, and to see if there is a solid basis upon which to build all of the system.
2.1.6. Stylistic Design Engineering (SDE)
To conclude the section about project setting, Stylistic Design Engineering (SDE) methodology was developed. The main steps of SDE are the following ones:
Stylistic trends analysis; that allows us to know and to combine specific shapes and colors in a unique product.
Sketch; to create a first draft of the product.
Two dimensional (2D) Drawing done on 2D modeling software—e.g., AutoCAD—to define the dimensions.
Canvas and three dimensional (3D) Model done on 3D modeling software—e.g., Creo PTC—to build digital models.
Renders done with rendering software—e.g., Autodesk VRed or Keyshot—to realize digital prototypes with realistic materials.
2.2. Product Development
The Product Development is the operative phase of the project. In this section the goal consists of defining dimensions, materials and technologies, and in making a digital model of the product.
Then it comes to the prototyping and the testing phase.
2.2.1. Design Engineering
Design Engineering includes different phases. Shape, dimensions and materials of the project are defined using 2D and 3D modeling software, and after that it is possible to proceed with the definition of the components and the details, in order to understand how the product can work, and of the usability.
2.2.2. Prototyping
This moment is very important, because it is crucial to check the project from a different point of view. There are different kinds of prototype: the digitals, the aesthetics, the functionals and the virtuals.
The first one is a prototype made with CAD software—e.g., Creo PTC—and it is perfect for being quickly modified with parameters.
The second one can be made with rendering software—e.g., Autodesk VRed—or with rapid prototyping techniques, such as 3D printing.
The third one is most of the time a 1:1 scale prototype; in this way it is easy to check if the proportions are right and if the object designed properly works.
Finally, sometimes it is possible to have a virtual prototype using the Augmented Reality to test different properties at once.
All of these prototypes can be used for the development of a product or a service. In fact, it is significant to test even the service interface, and this is possible thanks to some special software, such as vector graphic software—e.g., Adobe Illustrator—and UX simulation software—e.g., Adobe XD.
2.2.3. Testing
The level of innovation must satisfy the target of the project setting. For this reason, it is important to re-calculate the Top-Flop Analysis, in order to check if the highest score of Δ obtained before has been surpassed by the new developed project.
Concretely, the testing phase is done by checking the various types of prototypes and by evaluating their shapes, dimensions, materials and functionalities.
2.2.4. Setting Up
During this phase the product is tested in order to collect data and improve the project changing the shapes, dimensions, programming, etc. This stage and the next can be reiterated many times, even if the product is already on the market.
2.2.5. Re-Design
Using the data and information collected in the previous stages, the re-design phase allows researchers to insert changes to improve the project. Reiterating those last two phases, the project will get better and better.
3. Case Study
In this section, the design process is explained showing the analysis done: from the application of the explained methods to the product development.
3.1. Design Settings
The project started from a general research about the world of crutches, where it was found out how many types of crutches exist, their diffusion in the world and the possible paces and usages. Then, the analysis started, using from the QFD Method to the What-How Matrix, as was explained in the second chapter.
3.1.1. QFD Method
At the beginning, the QFD method was applied using the Six Questions process to fill a list of features that define a crutch:
Who: those who have suffered injuries or surgeries, amputees with one leg; children (3+), adults and elderly people. From the definition of this target, ergonomics and adjustability became two essential characteristics that the crutch should present. Where: house interior (bathroom, kitchen, living room, bedroom, stairs, slippery floors), outdoors (public transport, road, uneven terrain, parks), other internal spaces (home, pool, gym, office, hospital). From this answer came out that adaptability, hygiene and dimensions are characteristics that should be well designed.
When: every day, whenever it is necessary to use the legs for movements. So, durability and material strength became important characteristics.
How: leaning on it, intermittently or as a support. For this reason, reliability, lightness and affordance are features that should be taken into consideration.
What: stick with grip and underarm support thereof for the forearm with adjustable height.
Why: to help in walking, moving, getting up, sitting, going up and down the stairs, maintain balance, reduce pain, speed up healing and facilitate rehabilitation; maintaining the patient’s own autonomy and their own habits without weighing on others. So, the comfort of use becomes very important.
Summarizing, the list of features is composed of: 1. Adaptability; 2. Adjustability; 3. Lightness; 4. Ergonomics; 5. Reliability; 6. Hygiene; 7. Material Strength; 8. Durability; 9. Affordance; 10. Dimensions; 11. Appearance; 12. Comfort of use.
Those features were used to fill the Relationship Matrix, in order to define which of them were most important and more independent. In the Relationship Matrix of Relative Importance (
Table 1), every cell should be filled with a numerical value (from 0 to 2), depending on how much the requirements of the rows are more or less important than the ones in the columns (e.g., comparing row 1 with column 2, the question is: is adaptability more important than the adjustability?) The scores are then assigned in this way:
0—if the requirement of the row is more important than the one of the column,
1—if the requirement of the row and the one of the column are equally important,
2—if the requirement of the row is less important than the one of the column.
After calculating the sum of all the values in each column, there was obtained a ranking of all the features; the ones with the highest ranks were reliability, material strength, adaptability, ergonomics and durability. These ones were considered as the most important features that should be well designed.
Similarly, in the Relationship Matrix of Dependence/Independence (
Table 2), every cell should be filled with a numerical value (from 0 to 9) depending upon how much the requirements of the rows are more or less dependent than the ones in the columns (e.g., comparing row 1 with columns 2: how much adaptability depends on adjustability?). The scores are then assigned in this way:
0—if the requirement of the row is totally independent on the one of the column,
1—if the requirement of the row is not so dependent on the one of the column,
3—if the requirement of the row is very dependent on the one of the column,
9—if the requirement of the row is totally dependent on the one of the column.
In this case, by calculating the sum of all the values in each column, there was revealed a classification of the most independent features and the first three ones were: adaptability, adjustability and material strength.
Taking into account the first three characteristics of the first matrix and the first three by the second matrix, it is finally possible to draw up this list of project requirements:
Reliability
Material Strength
Adaptability
Ergonomics
Durability
Adjustability
At the same time, in order to identify the most important and interesting features that can be implemented in the crutch with the use of sensors, there have been planned a few brainstorming sessions among the components of the team. Then, these features were placed into the Relationship Matrix of Relative Importance (
Table 3) to define the most important ones, assigning the scores using the method already explained. By calculating the sum of all the values in each column, there was obtained a ranking of the most important features that have to be implemented, usage monitoring and fall alarm.
3.1.2. Benchmarking
In the benchmarking were compared the main crutches on the market based on different materials, handles, tips, height adjustability, weights, maximum capacities, amortizations and price. Currently, there are no sensorized or technological crutches on the market; for this reason, in the benchmarking there are only “analogical” crutches. Models of patented sensorized crutches exists, but these are not included in the market yet; among these crutches, there are some that can monitor the applied load and send tactile or visual feedback (see patents WO2011039389A2 or DE102004049551A1), or that increase visibility at night with lights (see CN107296726 patent), or that can send a help signal through sensors or buttons (see patent CN109588825A), just to name a few. These crutches are far from being on the market because of their constructive and technological complexity. For these reasons, in the benchmarking were included only crutches already present on the market. (
Table 4). Among the selected crutches, for example, the titanium material was considered as a “Top” because it is the best compromise between weight and resistance; excellent resistance is necessary to support the weight of the person and provides a long-lasting quality, and a low weight is preferable to avoid the lift of a too heavy crutch. Another “Top” was given to crutches that have a good grip on damp soils, thanks to a tip with non-slip material.
Then, the best and worst values among the performances have been compared for each row and the quantity of Flop (worst performance) - marked with the red background in the
Table 4 - and Top (best performance) - marked with the green background in the
Table 4 - is added to the columns. Making the difference between Top values and Flop values, the highest score of Δ obtained will define the number of characteristics that have to be innovated among those identified in the Innovation Column. In this case, the Δ Innovation was 2.
For achieving innovation, a product with a Δ ≥ 3 should be obtained, thanks to the improvement of some of the characteristics analyzed.
Then, another matrix was used to determine which of the requisites had to be developed, through a ranking of the most useful ones to innovate. In the What-How Matrix (
Table 5), the six features obtained from the Relationship Matrices and the performances of the Innovation Column are compared. The assigned score will be:
0—if the performance of the column does not influence the feature of the row,
1—if the performance of the column affects very little the feature of the row,
3—if the performance of the column influences the feature of the line enough,
9—if the performance of the column greatly influences the feature of the row.
By adding the values along the columns, a classification of which performance must be innovated is obtained.
Therefore, all these tools—matrices and benchmarking—have been useful to define the objectives of the project, both from a technical and a functional point of view.
To sum up, the targets turned out to be:
Obtain an innovative product with Δ ≥ 3, by improving at least one of these characteristics: tip, adjustable height and material.
Obtain a smart product with innovative features, such as usage monitoring and fall alarm, which can be used for medical support.
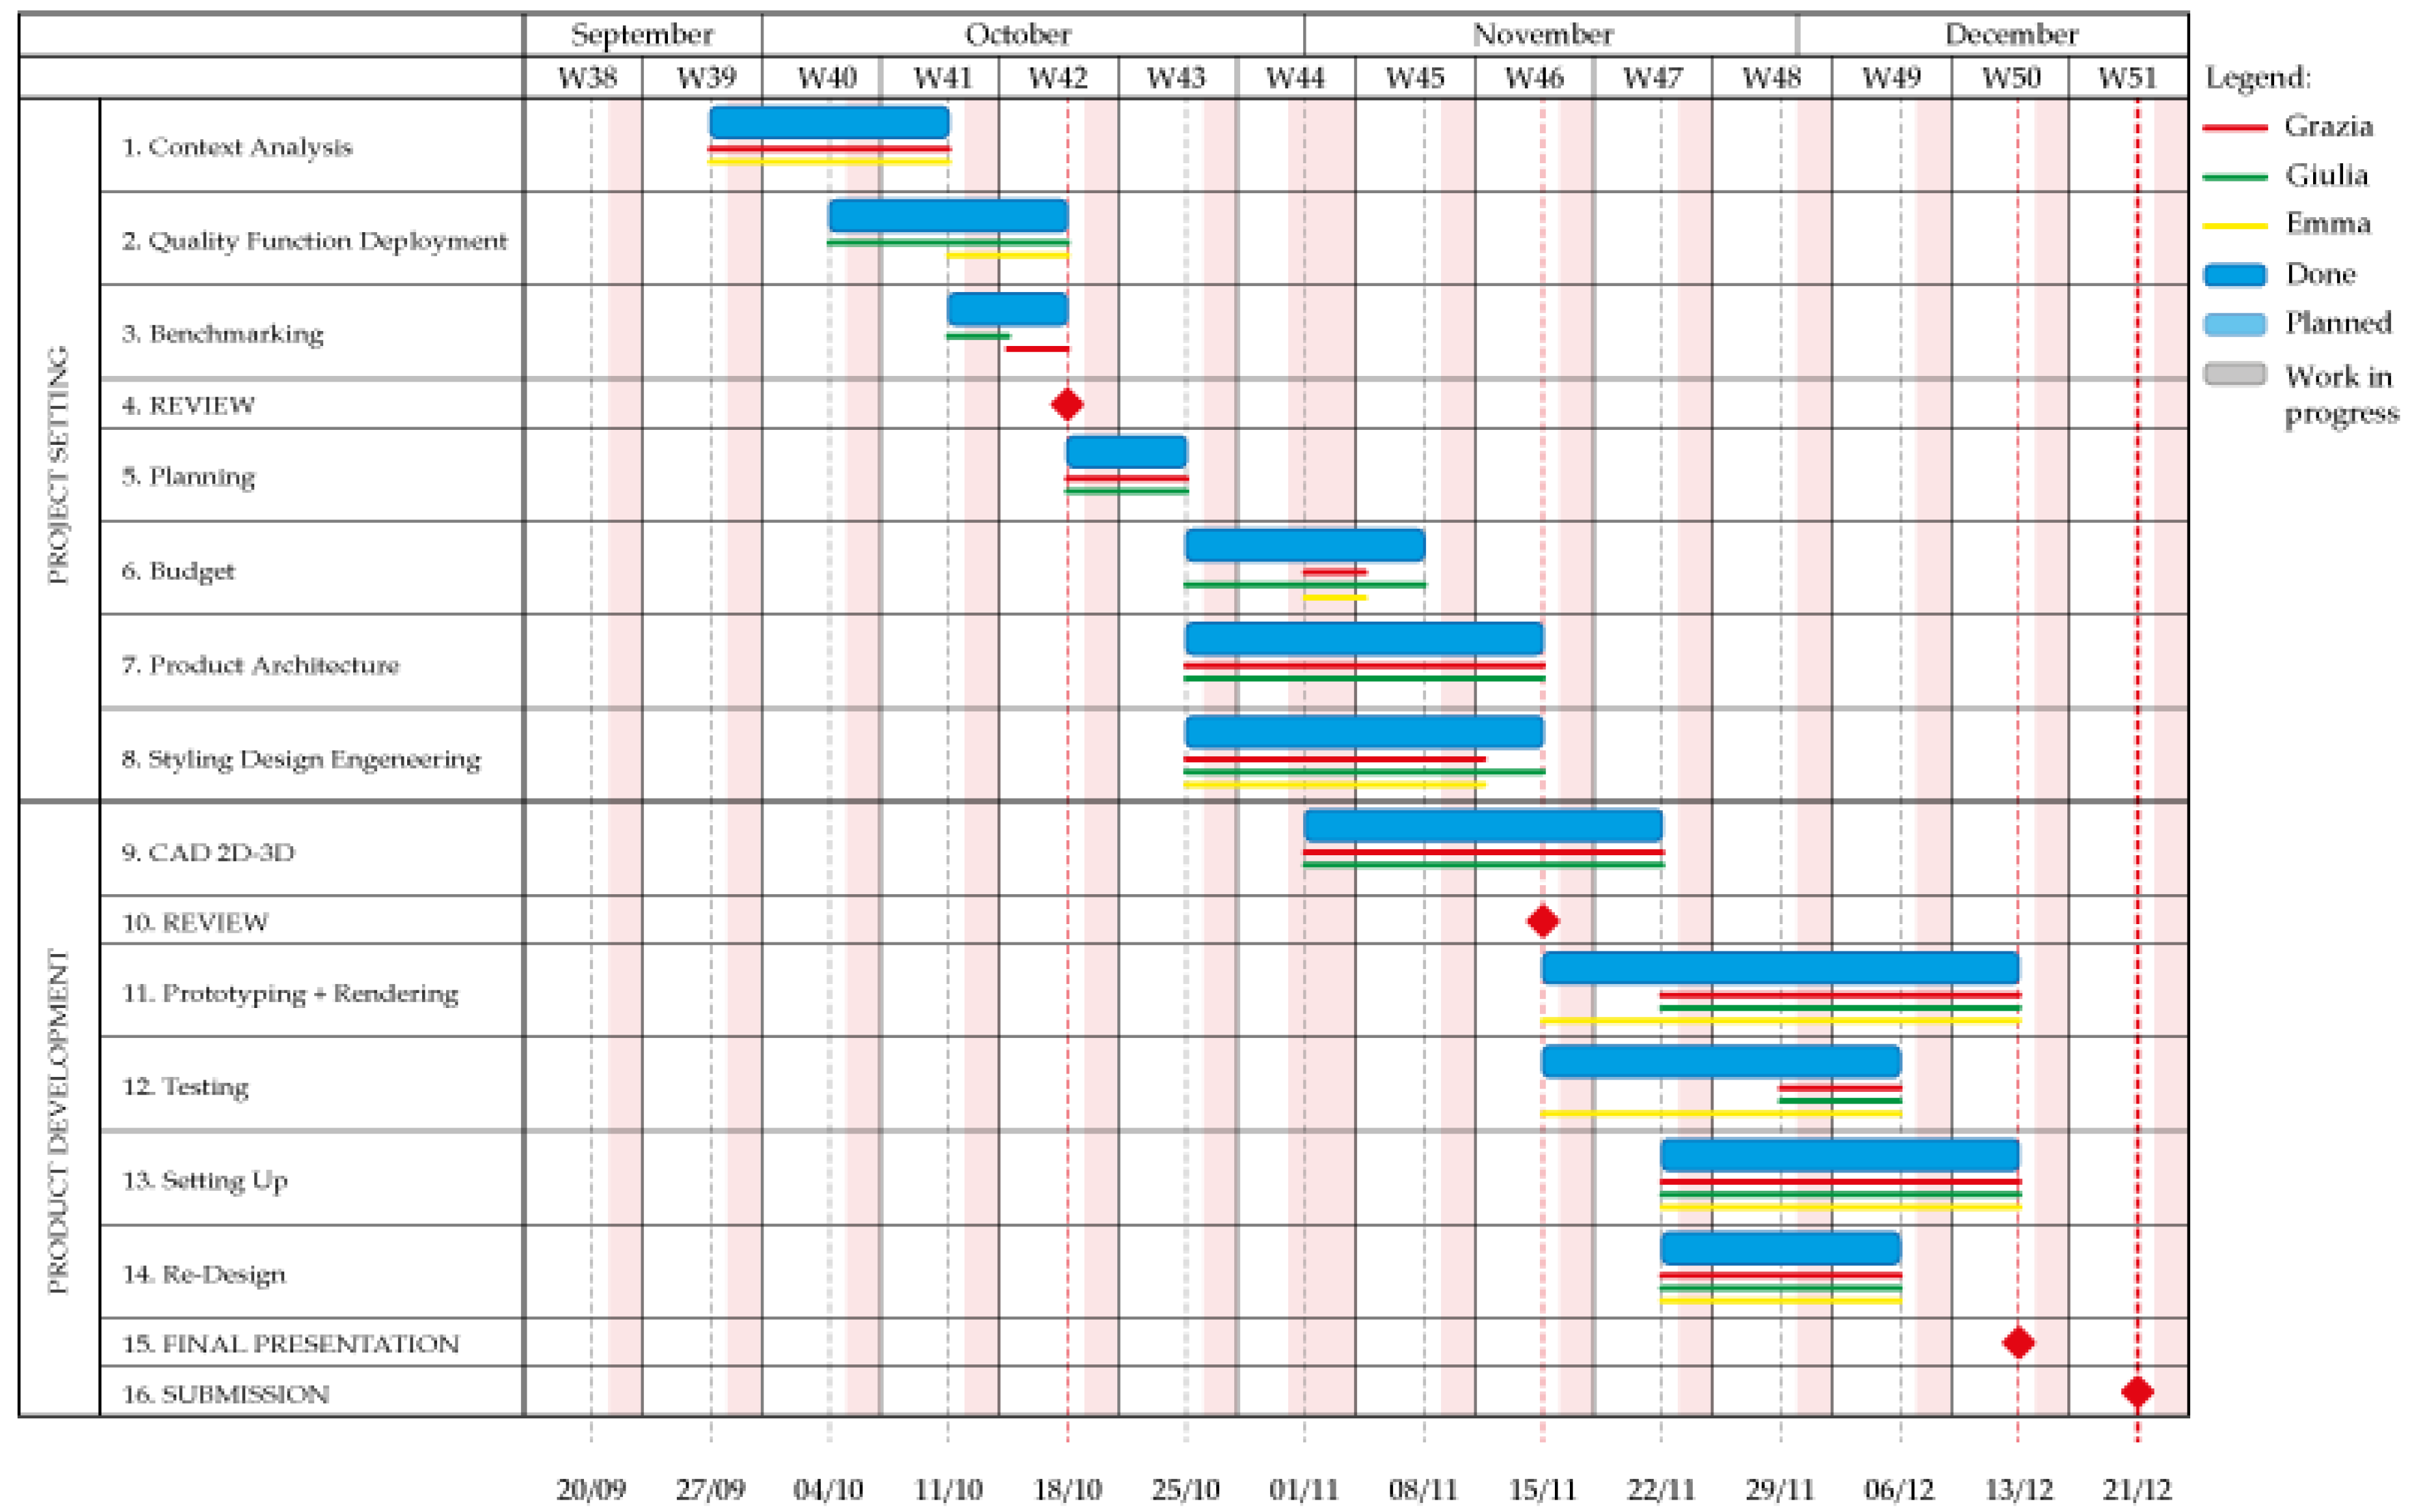
3.1.3. Planning
The Gantt chart (
Figure 2) was used in this phase to create a scheduling of the project. The time span was fixed on three months—from September to December. During this period, the team, composed of three designers, has planned the tasks that define the WBS—Work Breakdown Structure. The WBS, which definition was explained previously, includes these phases:
Context Analysis
QFD—Quality Function Deployment
Benchmarking
First Review in the half of the Project Setting
Planning
Budget
Product Architecture
SDE—Styling Design Engineering
CAD 2D and 3D
Second Review for check the concept
Prototyping and Rendering
Testing
Setting Up
Re-Design
Final presentation of the product
Submission of the entire project
All these phases were planned by defining how long they would take, and how many and which members they would take care of. This method has allowed designers to be very efficient and to be able to fulfil the deadlines.
3.1.4. Budget
A budget hypothesis was made on a 6-month project development work.
To evaluate the professional service costs, both designers and workers—who would work 8 h a day with an average salary of €40 per hour and €25 per hour, respectively—were involved. For each phase of the project these pieces of information were accounted in different times and numbers. Therefore, the estimated costs per phase (
Table 6) were:
Designing 16,000 €
Prototyping 18,000 €
Testing 18,000 €
Setting up 26,000 €
Re-Design 20,800 €
The total costs for the professional service was about 98,000 €.
Simultaneously, materials and equipment were considered to estimate the costs for a prototype (
Table 7 and
Table 8). The total costs for the realization of the prototype were made, taking into consideration a margin of 70%, so the construction of a functioning prototype would cost around 2.848 €. By adding up all the values, the entire project would cost about 101,648 € (
Table 9).
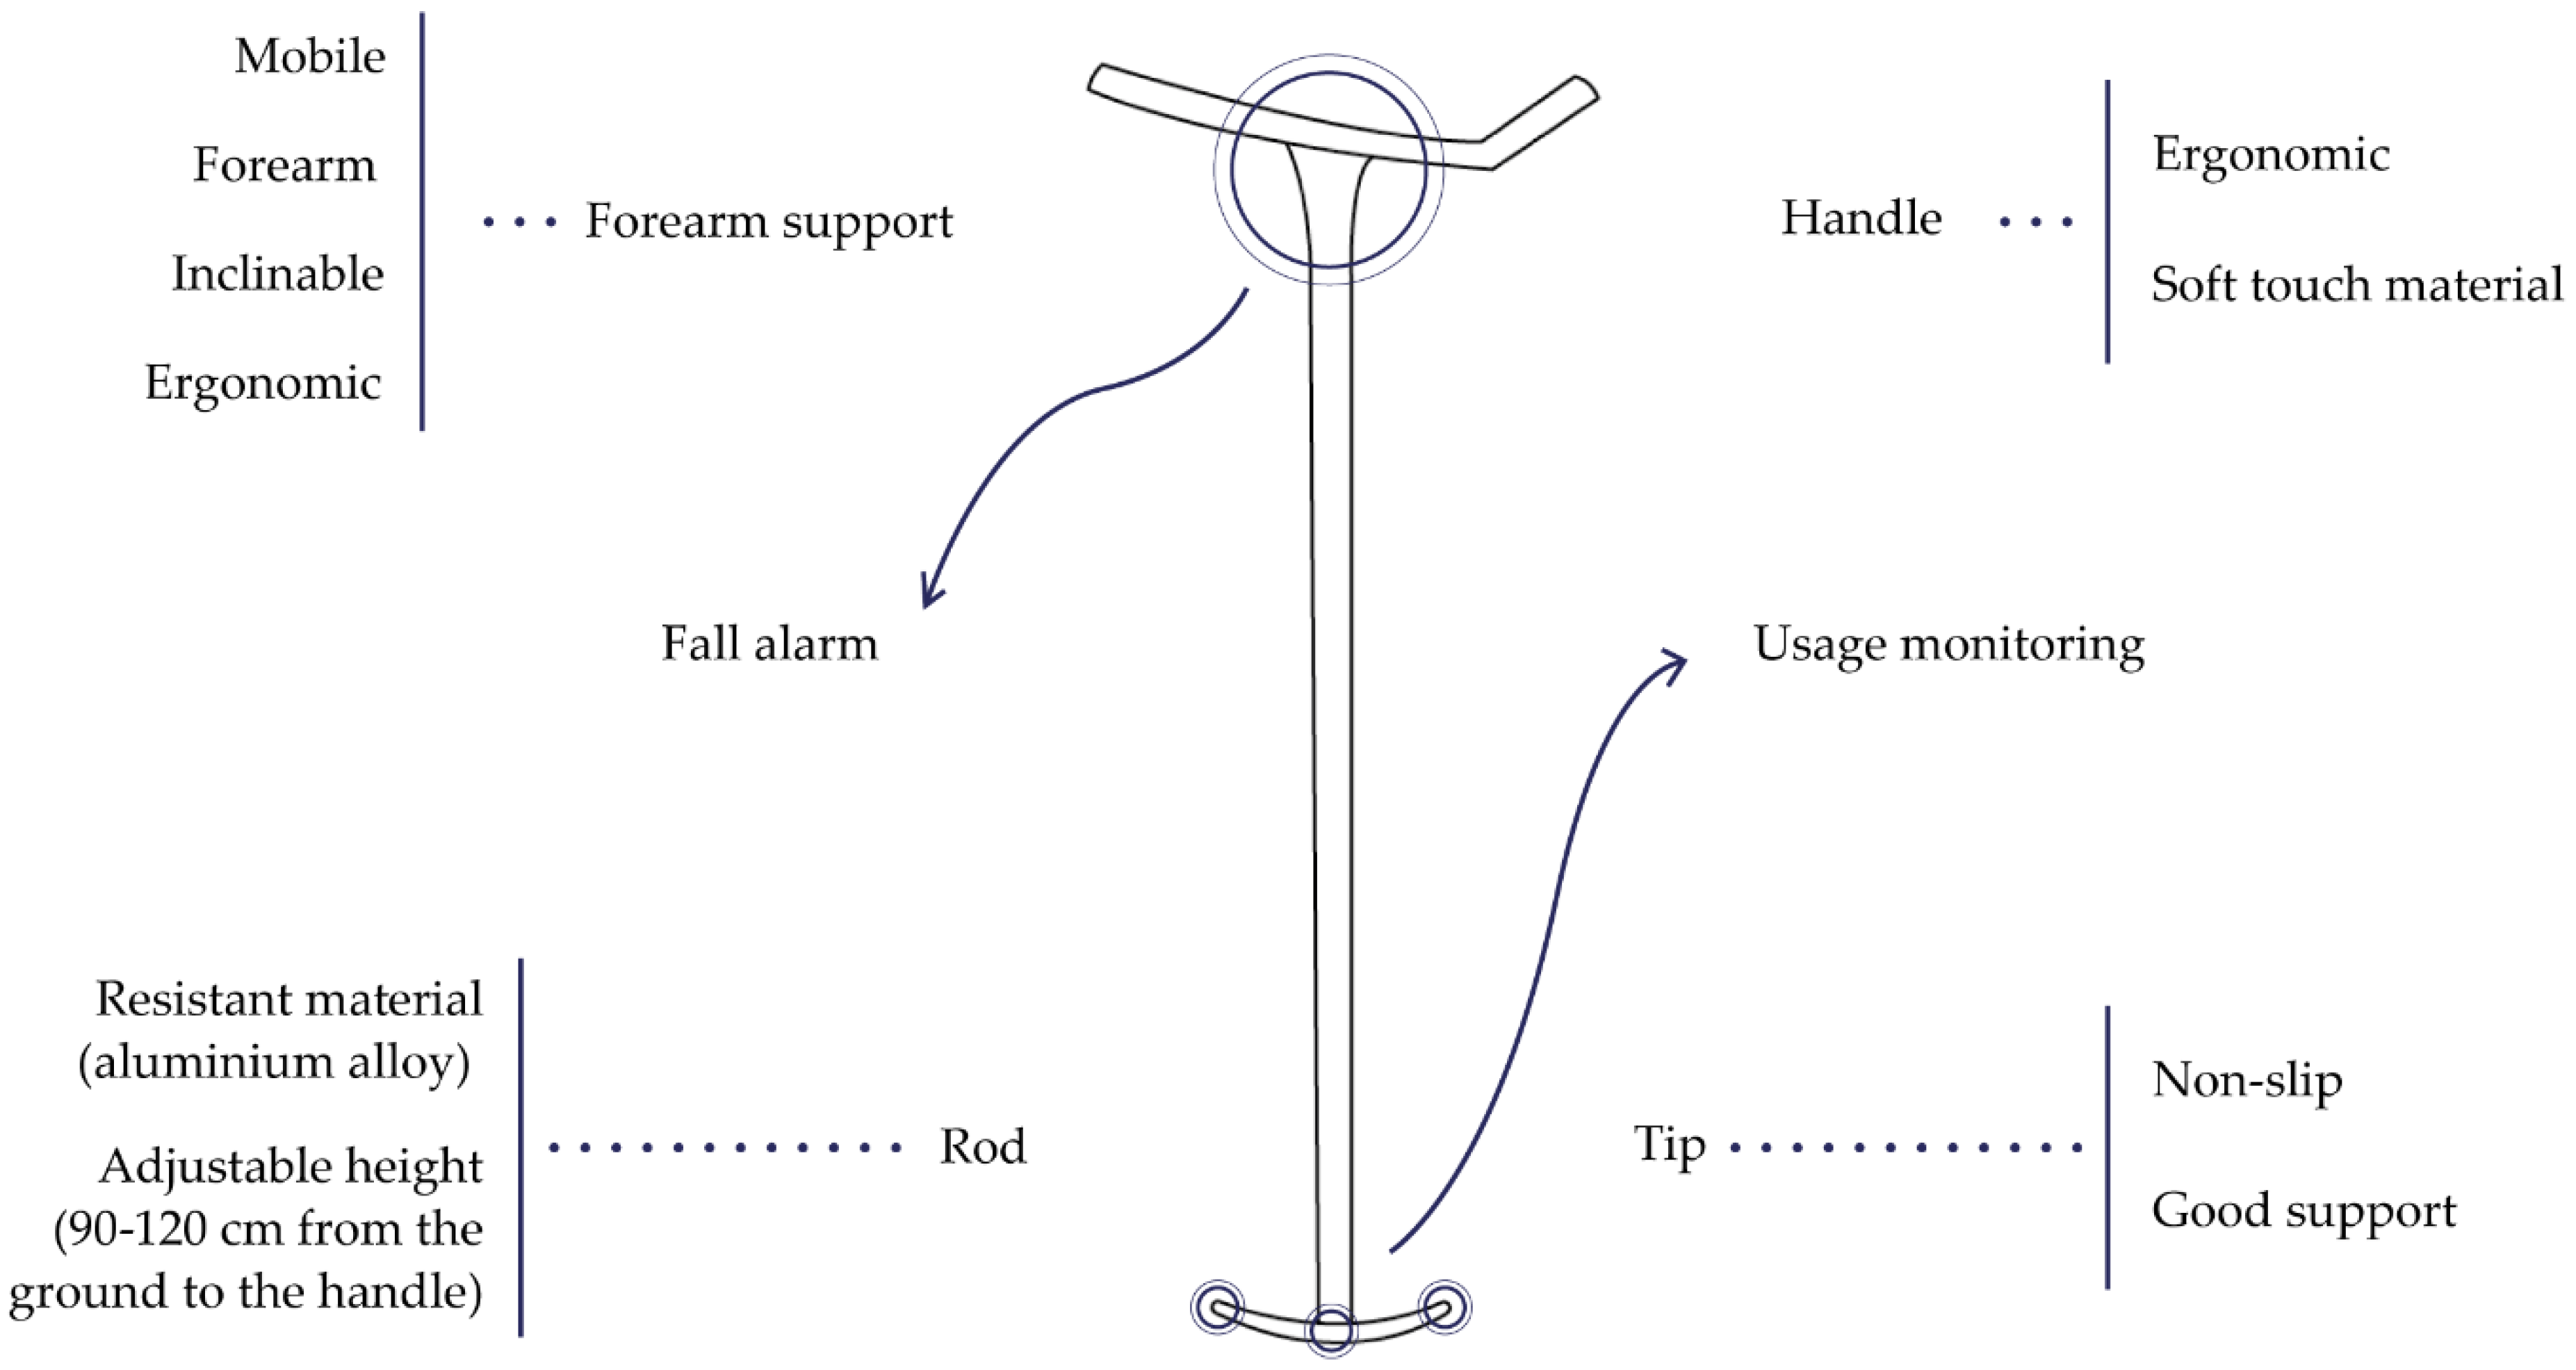
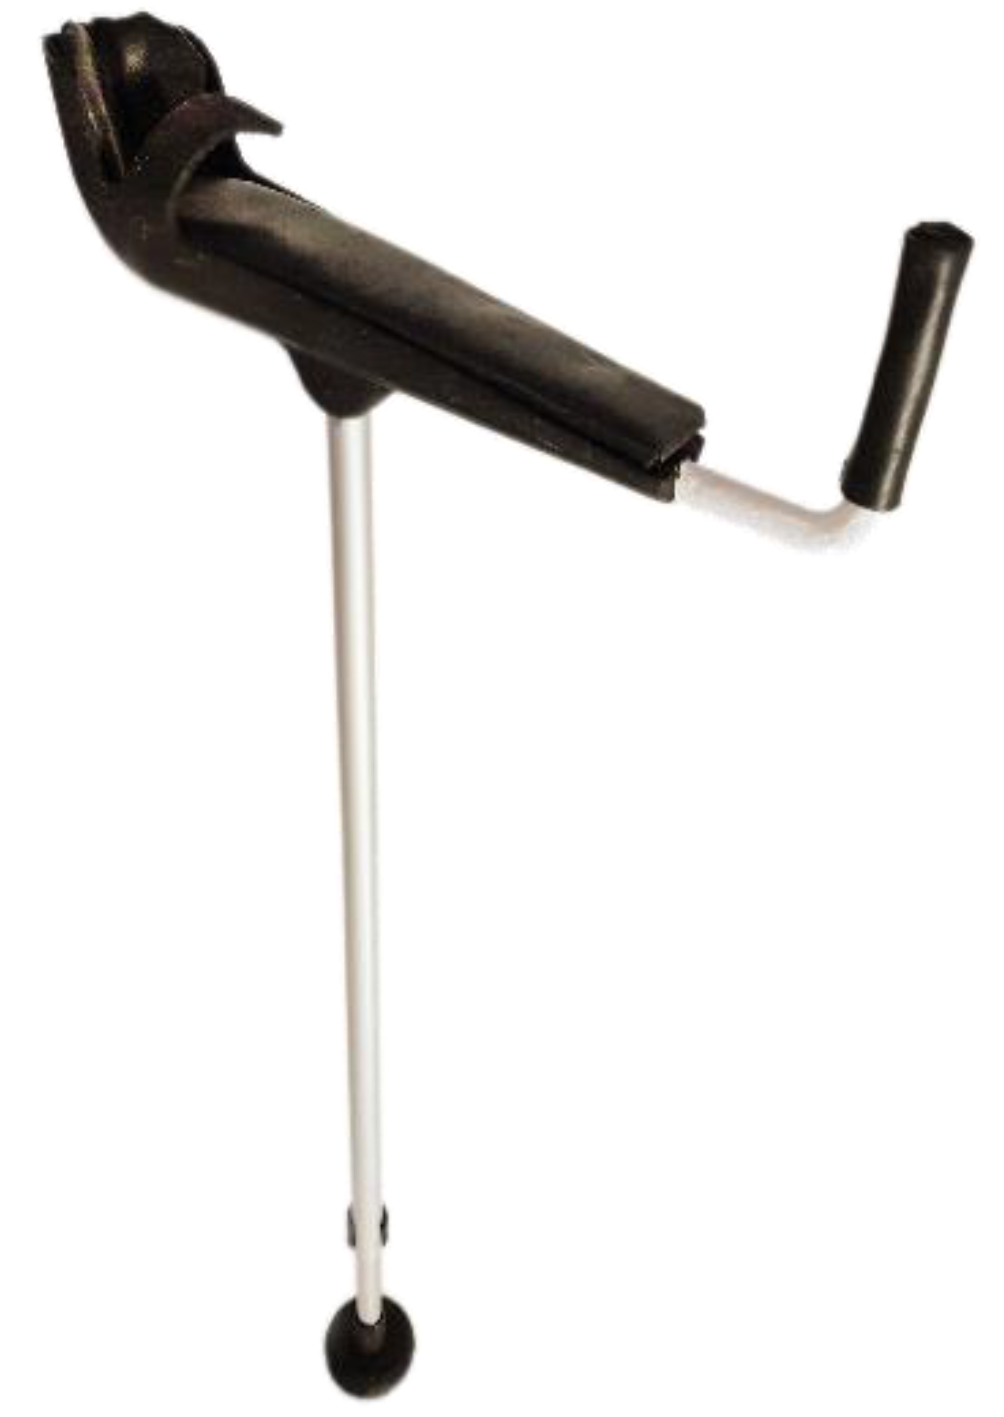
3.1.5. Product Architecture
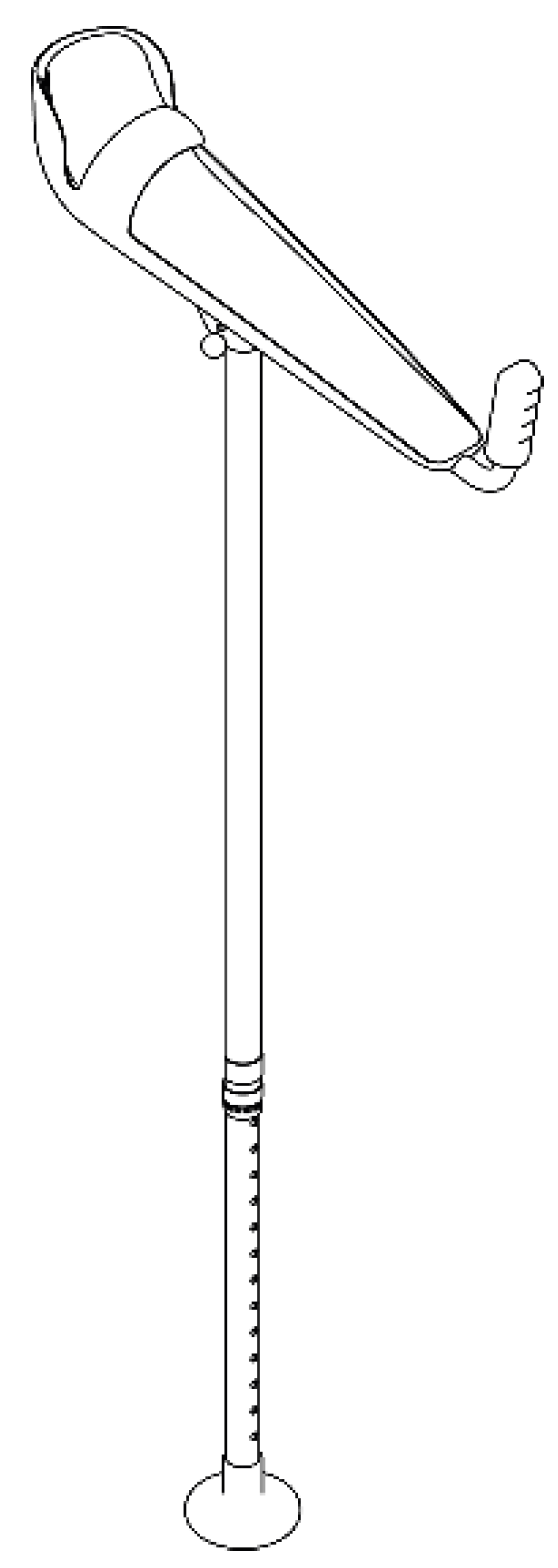
Subsequently, the design itself consisted in the definition of the right architecture for the product to be as comfortable as possible (
Figure 3):
A forearm support that holds up the whole forearm, so that the wrists or the underarm area are not strained (an excessive stimulation of these areas may cause joint pains, as in the case of Canadian crutches or axillaries ones) [
7]. It must also be ergonomic, slightly inclined—to allow a more natural position of the arm—and mobile—so it can be adjusted to your own size.
An ergonomic handle with soft material for a good grip that feels pleasing to the touch.
Aluminum alloy rods with good corrosion resistance and good mechanical characteristics, which allows a height between 900 mm and 1200 mm from the ground, so it can be suitable for people from 1500 mm to 1900 mm tall (4’11”– 6’3”) approximately.
A non-slip tip with a shape that allows a good stability.
A fall alarm positioned between the forearm support and the rod, which sends a signal if the crutch falls, and it is not picked up for a prolonged time.
Usage monitoring for the analysis of weight distribution and of other data, such as distance tracking, kilometers travelled, speed, etc.
3.1.6. Stylistic Design Engineering (SDE)
To define what kind of shape was the most captivating, three different current trends were identified and compared: Futuristic (
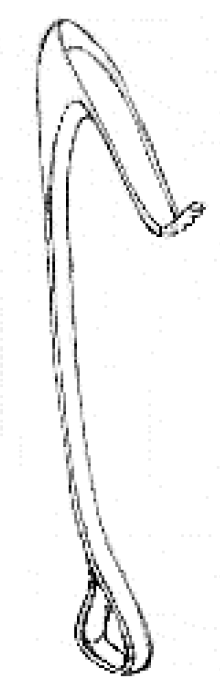
Figure 4), inspired by the new futuristic, aerodynamic and soft forms of super modern projects; Retro (
Figure 5), the charm of the past can reassure in times of crisis; Natural (
Figure 6), the natural style is good for the spirit, rustic but classy.
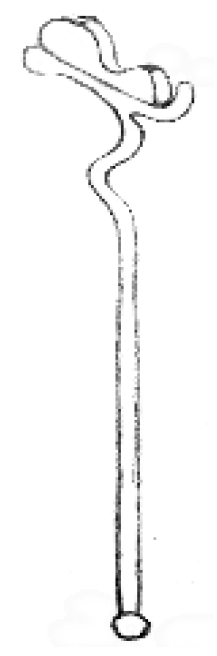
These are some of the sketches that were made for studying the style, following these trends.
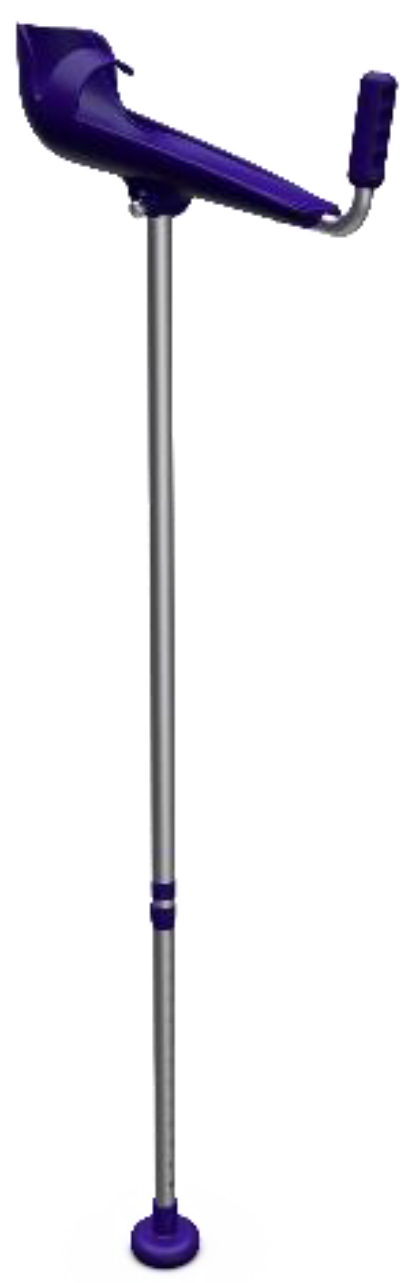
Lastly, a futuristic style with some natural details was opted for, obtaining a crutch with an elongated silhouette, but with soft and sinuous shapes (
Figure 7).
3.2. Product Development
This is the operative phase of the case studies, where all the characteristics designed before in the project setting are now applied.
3.2.1. Design Engineering
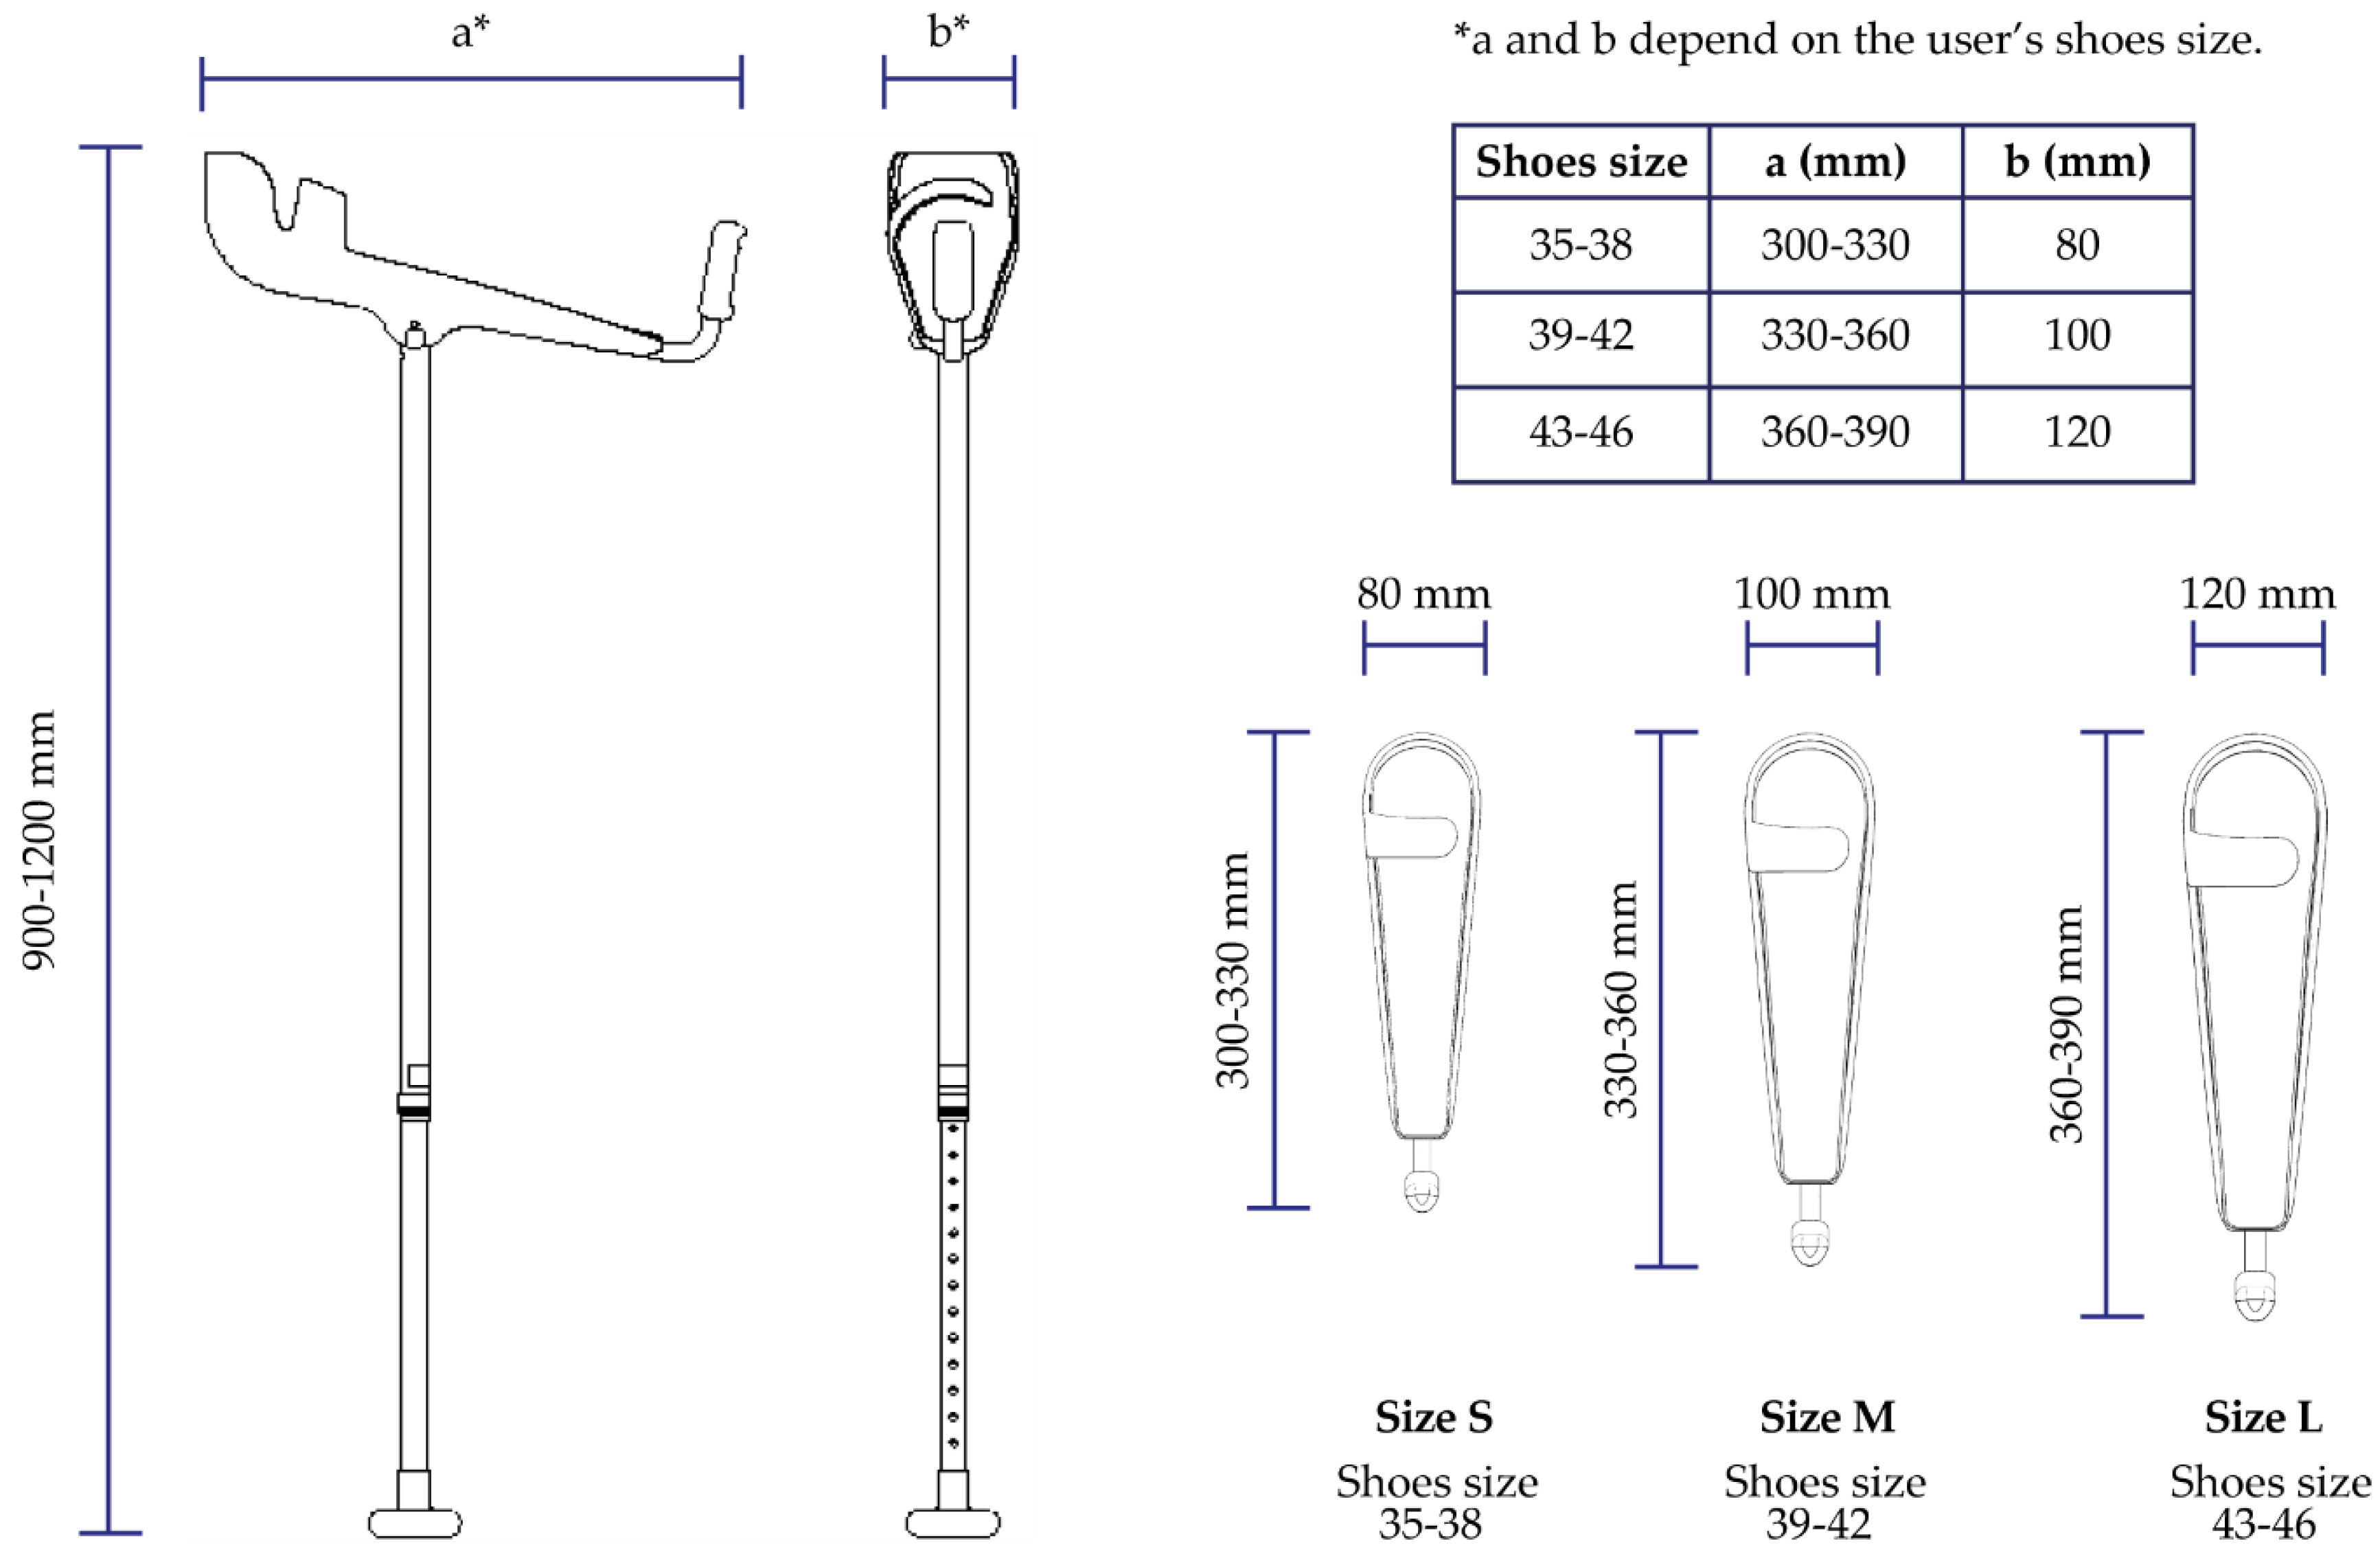
As for the dimensioning, the rod has a height adjustment between 900 mm and 1200 mm, while the support has three different sizes (S, M, L)—which differ in width—for each of which is possible a further adjustment of the length of the handle. For each size, there is a range of measures based on the individual’s shoe size (the length of the foot corresponds to the length of the forearm),
Figure 8.
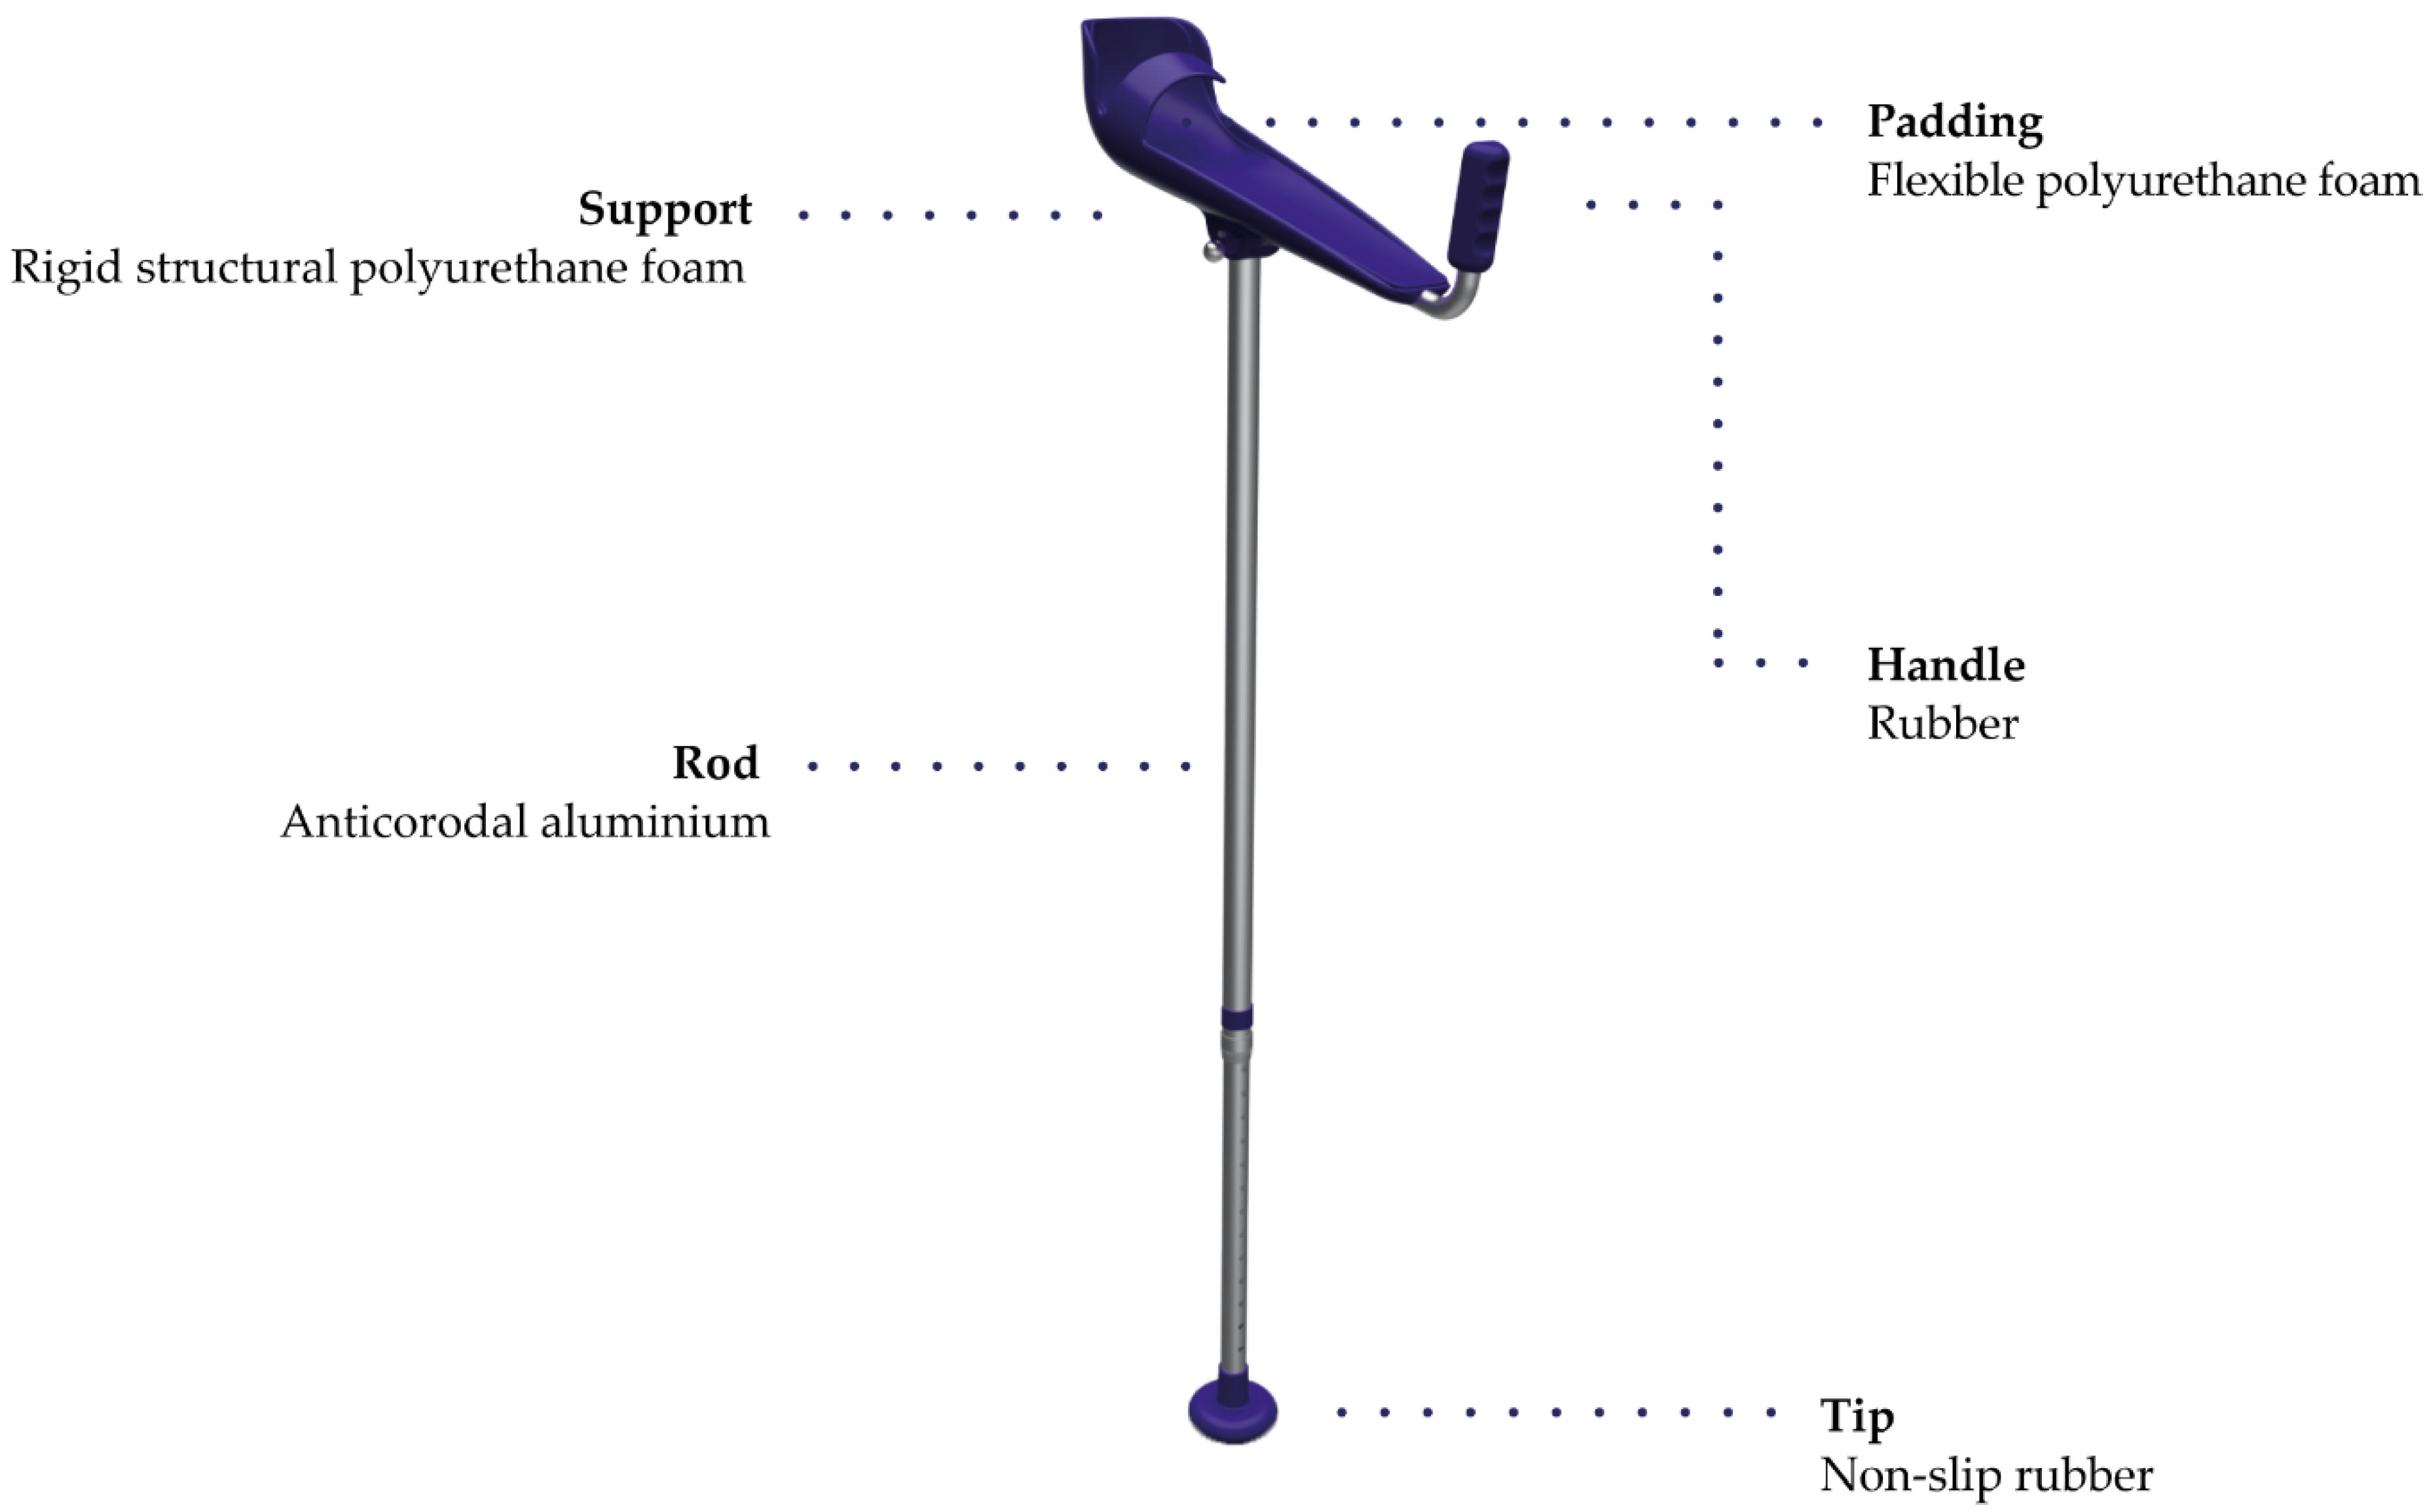
Subsequently, the definitive materials were chosen,
Figure 9:
Support: structural rigid polyurethane foam
Padding: flexible polyurethane foam
Handle: rubber
Rod: Anticorodal aluminum
Tip: non-slip rubber
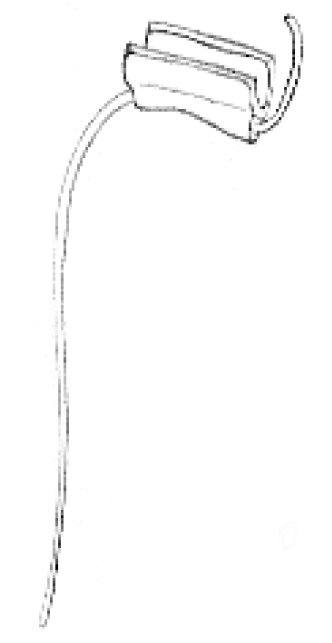
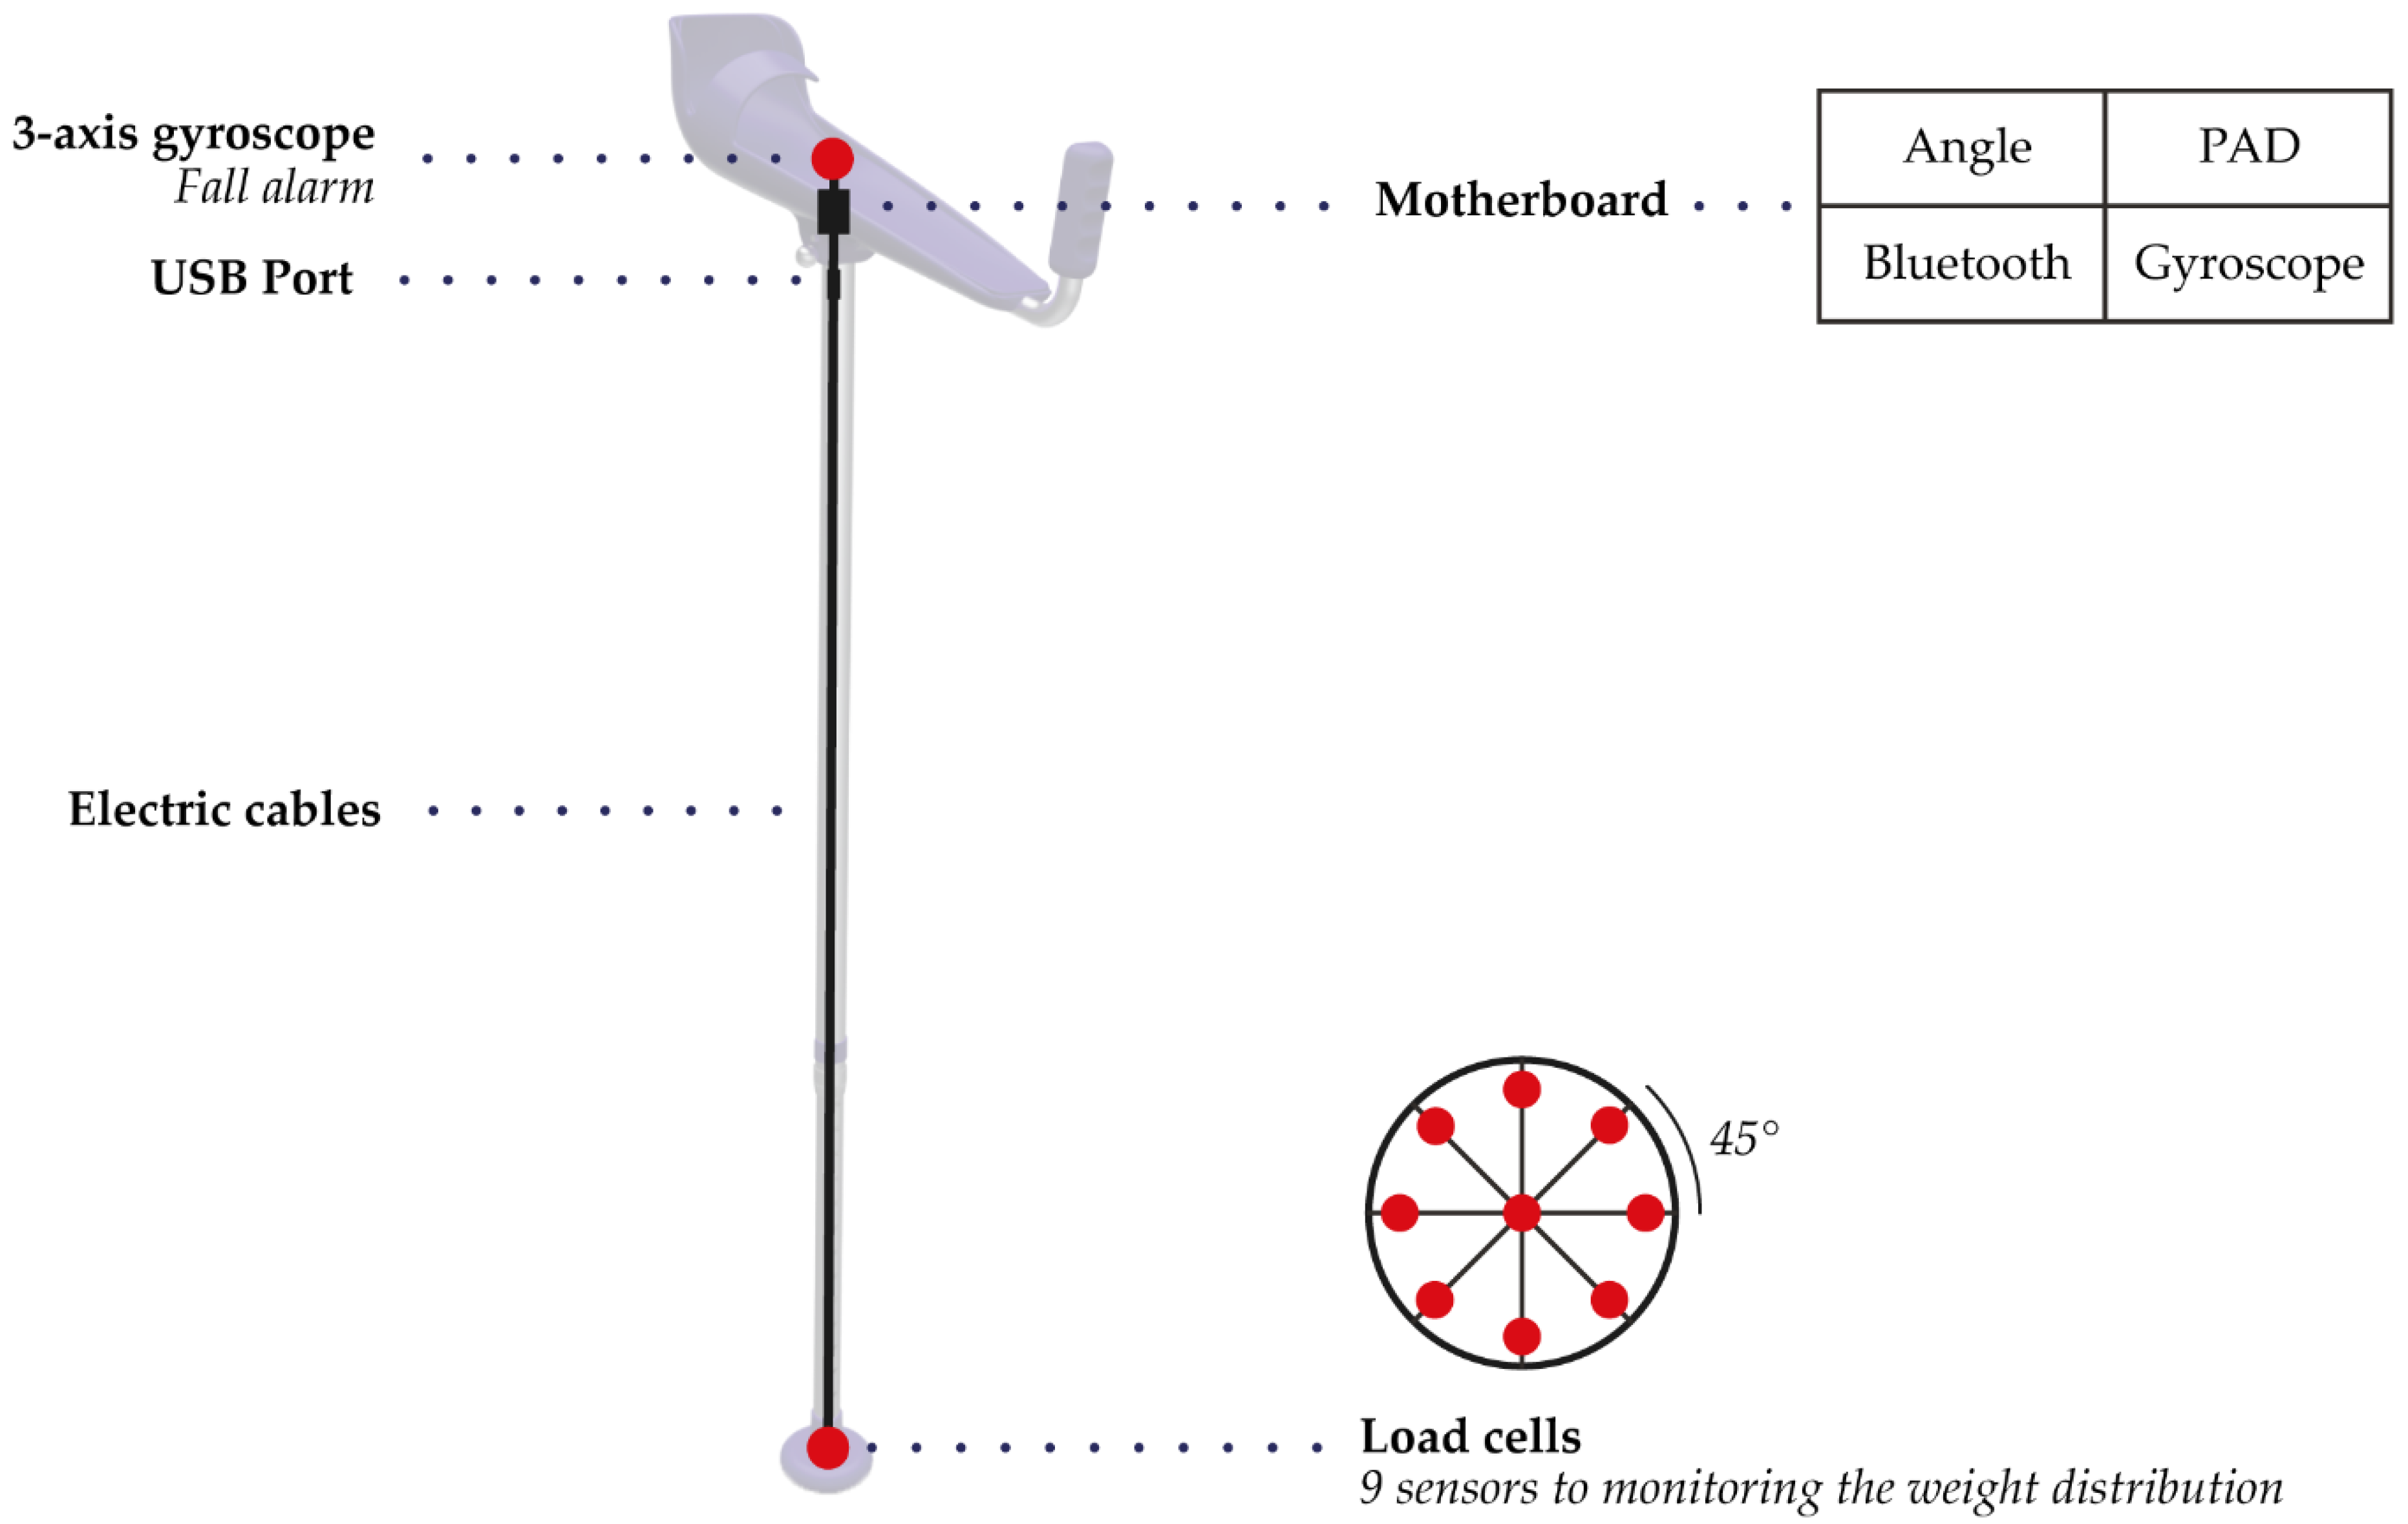
The sensors and the wiring are placed inside the rod (
Figure 10).
A tri-axial gyroscope and a tri-axial accelerometer are used as a fall detection system based on the linear acceleration and angular speed to determine whether the crutch is dropped, and then if the user is fallen: if the user falls, an alarm—placed inside the forearm support—is triggered, and a notification is sent to the mobile phone of the person who has been set up as the emergency number in the app, so that he or she can check the patient’s health status. The combination of the accelerometer and the gyroscope makes it possible to detect accidental falls more accurately. In fact, using only the accelerometer, it is possible to confuse a fall with a simple fast sitting [
8,
9].
A matrix composed of nine load cells—which acts as a weight distribution sensor—is positioned in a special hollow inside the tip. The matrix is also connected to the gyroscope and the accelerometer to return a more precise data analysis [
10].
Those sensors are connected by cables to a motherboard, which is also connected to a Bluetooth transmitter for broadcasting the detected data, and to a system that can identify the modality—City or Sport—in which the crutch is being used [
11]. In addition, a rechargeable battery with USB port was inserted.
The collected data are analyzed by the system in order to control the user’s safety and to inform him or her and the doctor about the use of the crutch, so that the information can support the doctor to check and to improve the therapy [
12,
13,
14].
The crutch has several features:
Adjustable handle with a spring button under the support.
“City” and “Sport” mode: It is possible to choose the desired mode setting changing the angle between the rod and the forearm support, thanks to a lever below the support. The “City” mode consists of setting an angle of approximately 105° between the forearm support and the rod, allowing you to have a natural position of the arm for a better daily use; this is the classical set of the forearm crutches. The “Sport” mode makes an angle of 90° between forearm and the rod, and even between the rod and the ground. This is useful on not-uniform grounds, because it allows a better exploitation of the thrust of the arms. The idea of the “Sport” setting comes from Tompoma, a crutch with a “Z” shape that has been developed to be used for people that want to continue an active lifestyle, or to do activities in nature, such as trekking, and the medical data is re-calibrated based on the inclination of the crutch, which is one of the elements of data analysis.
Easy setting of the height by sliding the rods and locking them to the desired size.
Cushioning due to a spring placed in the tip which dampens the impact with the ground.
Weight distribution monitoring, thanks to the sensors placed in the crutch.
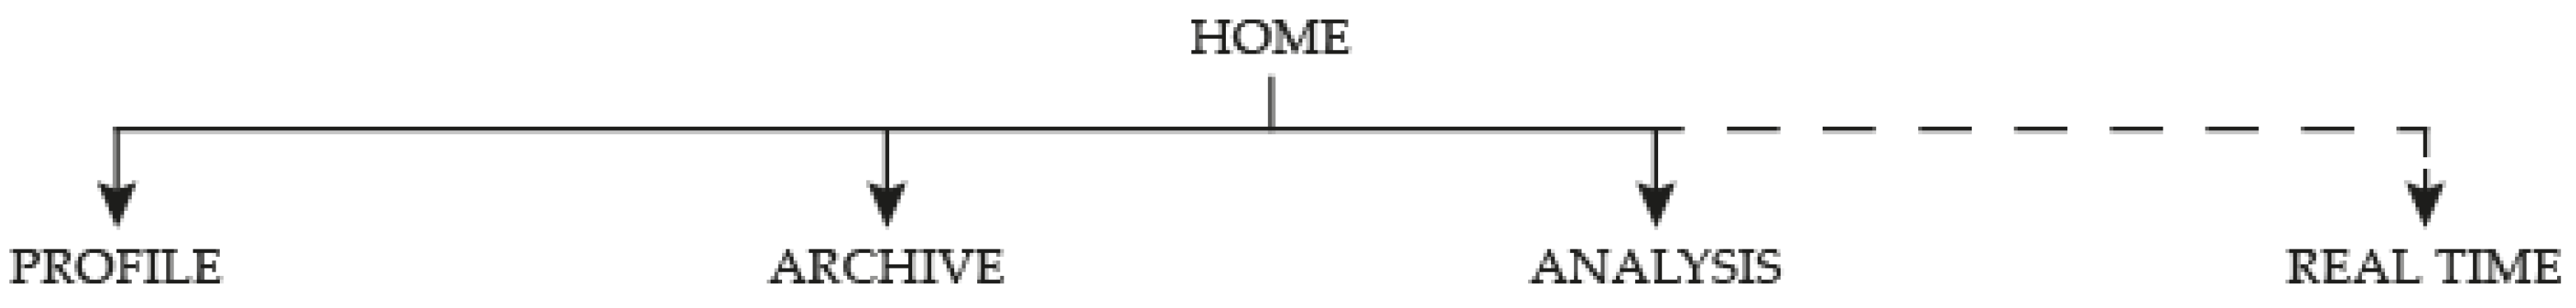
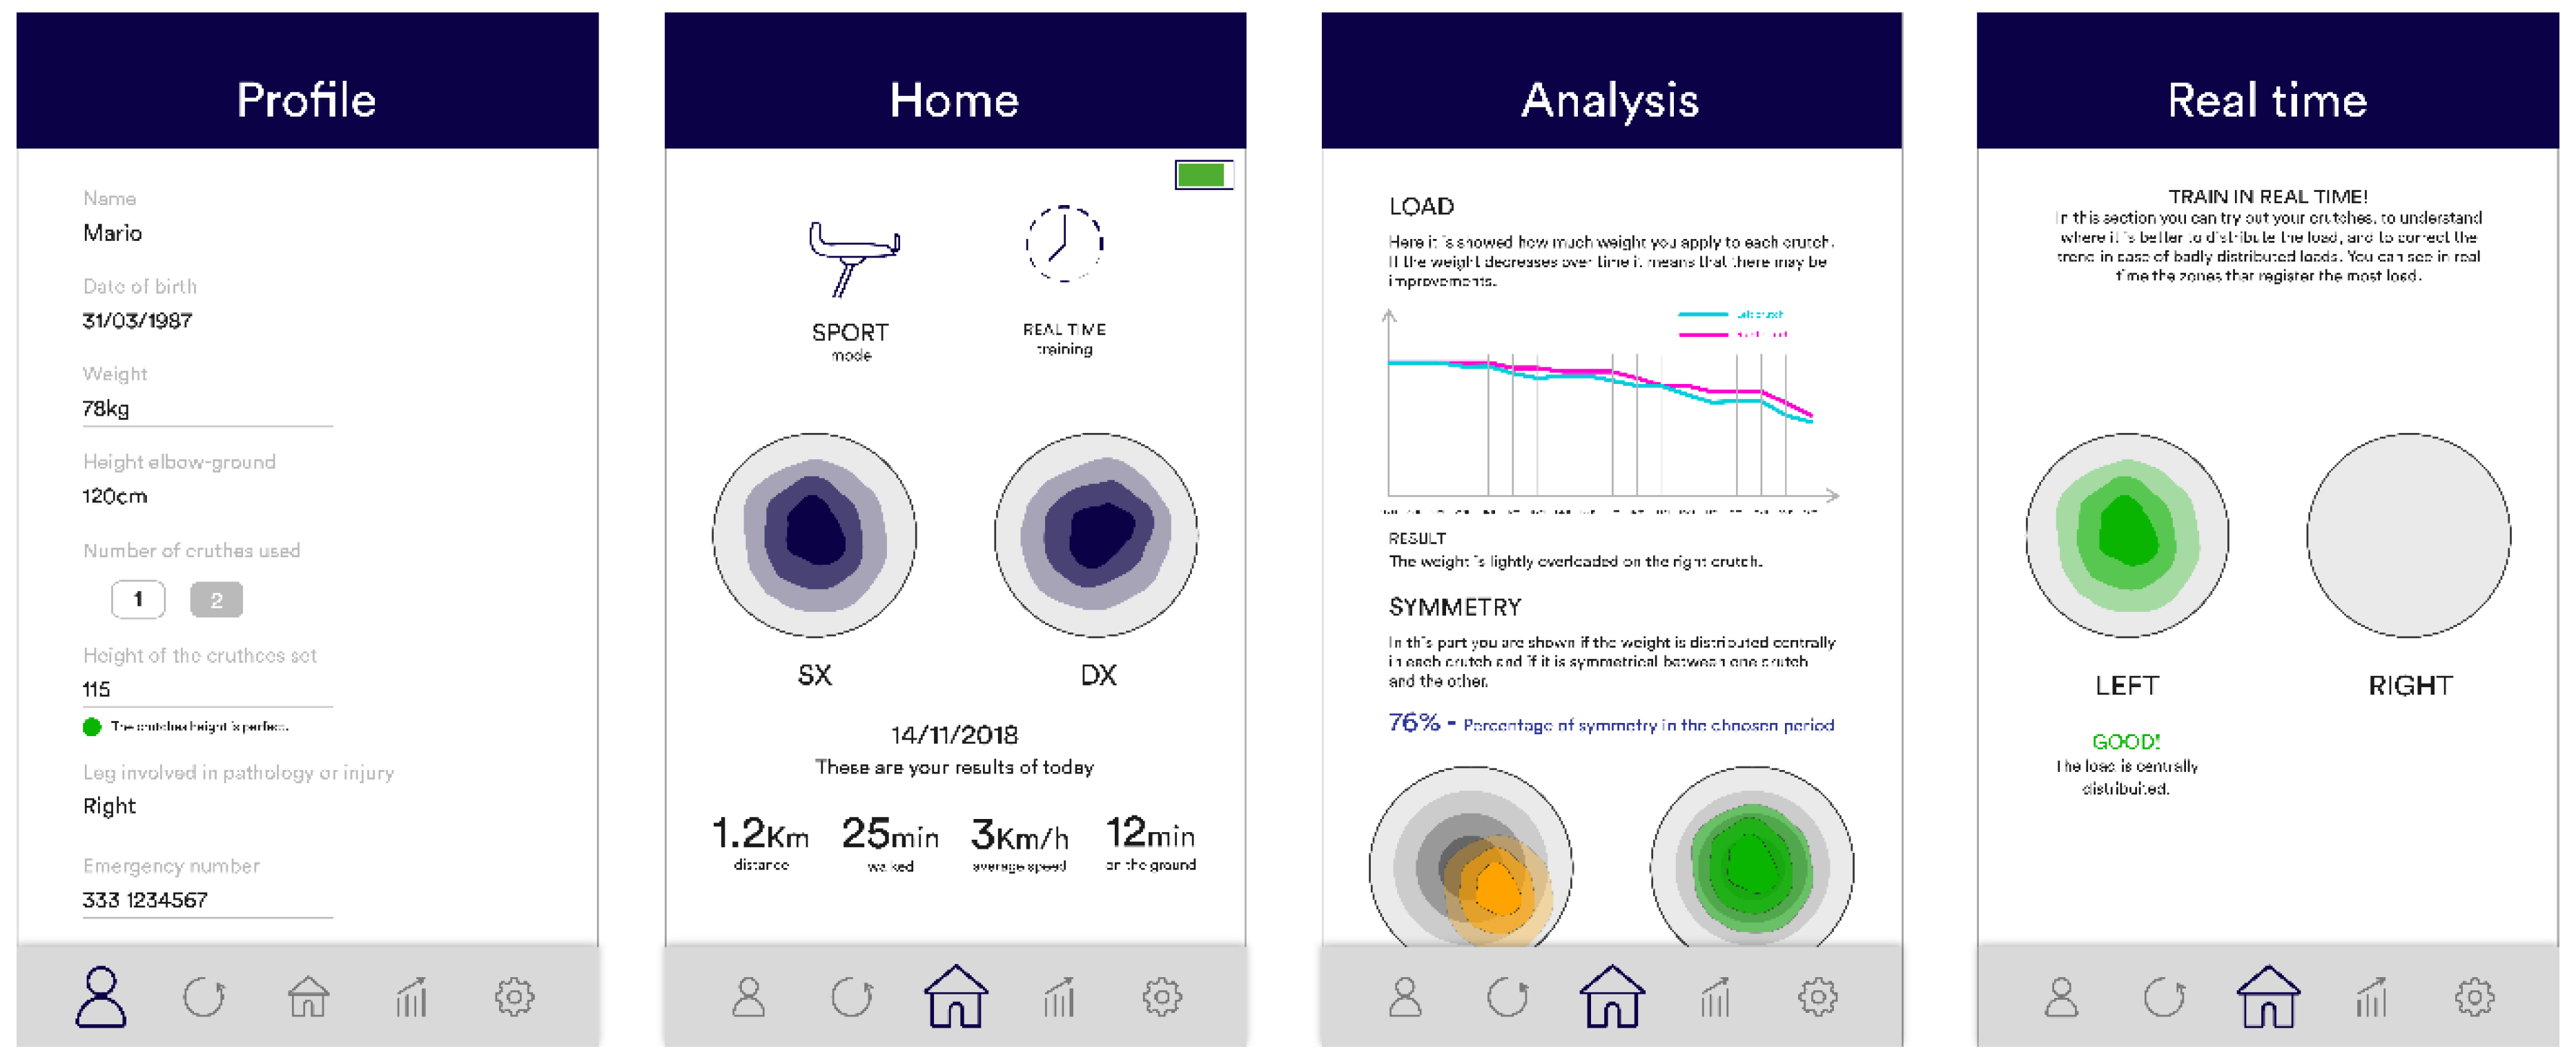
An application was made to allow the collection of these data. Below is shown the information tree (
Figure 11).
The app allows us to see the settled mode of the crutch (Sport or City mode), the daily load distribution and other data related to its use. From there, there is the access to the other parts of the app. The first time the app is used, it is necessary to insert the user’s data, including the height between the elbow and the ground, allowing the app to identify the correct height of the crutch, and an emergency mobile number that will receive a notification in case of the detection of a fall. Changes can be done at any time.
The most important function it is that is possible to know how the load changes over time (and if there are improvements in walking) and what was the load distribution during a certain period. In the latter case, it is important to know how the load has been distributed over time, if it has been equally distributed towards the center of the tip, and if the crutch is being used correctly. Thanks to the filters, it is possible to select the period, the mode and the use of the right or the left crutch. In elder applications, other ones were devices transforming mechanical energy into electronic signals, just like extensometers [
15].
Lastly, the app allows one to see in real time whether the crutch is used in the right way, so if the load is well distributed in the center of the tip (
Figure 12).
The mockup shown in the figure below it is just an example; it will be developed both for Android and iOS.
3.2.2. Prototyping
To check the project in a better way, there was made a digital prototype using Creo PTC, that allowed the designers to control dimensions and proportions between components (
Figure 13). Then, for the aesthetic prototype, some renders were done with the correct materials chosen using the 3D model made for the digital one. To have a better feedback about the aesthetics of the crutch, there was made a 1:5 scale prototype using 3D printing (
Figure 14).
For what concerns about the functional and virtual prototypes, they have not been done yet. The same was made for the Application: its aesthetic was checked with Adobe Illustrator, and its functionality with Adobe XD.
3.2.3. Testing
The application has been tested by an experienced physiotherapist, who considered very useful some specific parts of the service, especially the graphs that show whether the load on the crutch increases or decreases over time; in fact, that graph allows us to understand if the patient is healing or not. Currently, another physiotherapeutic center is also interested in the idea, and would like to contribute to the improvement of the product and the service. In the future tests, it will certainly be tested with the users, to validate the simplicity of the service and the functionality of the prototype.
4. Results and Future Development
From the What-How Matrix (
Table 4) it resulted that the three features to innovate were: tip, adjustable height and material. Furthermore, there have been added innovative features, thanks to the use of sensors for usage monitoring and fall alarm.
In the final stages of the design there was made the Top-Flop Analysis another time, to understand if the product had succeeded in innovation, and then were compared the features implemented with those of the Innovation Column. As in
Table 3, the Flops were marked with the red background, the Tops with the green backgroud. The Δ turned out to be 4, (higher than 2, emerged in the first Top-Flop Analysis); this means that four characteristics of the crutches analyzed in the benchmarking had been improved (
Table 10).
Comparing the final product with the objectives initially set, an innovation has been certainly brought with regards to the tip, in terms of shape, materials, cushioning and technology; in fact, there are actually no crutches on the market connected to an application that can expand and improve the experience with them, and this was possible thanks to the load sensors placed in the tip.
It would be very important to analyze the product through a physical prototyping using Additive Manufacturing [
16,
17,
18,
19,
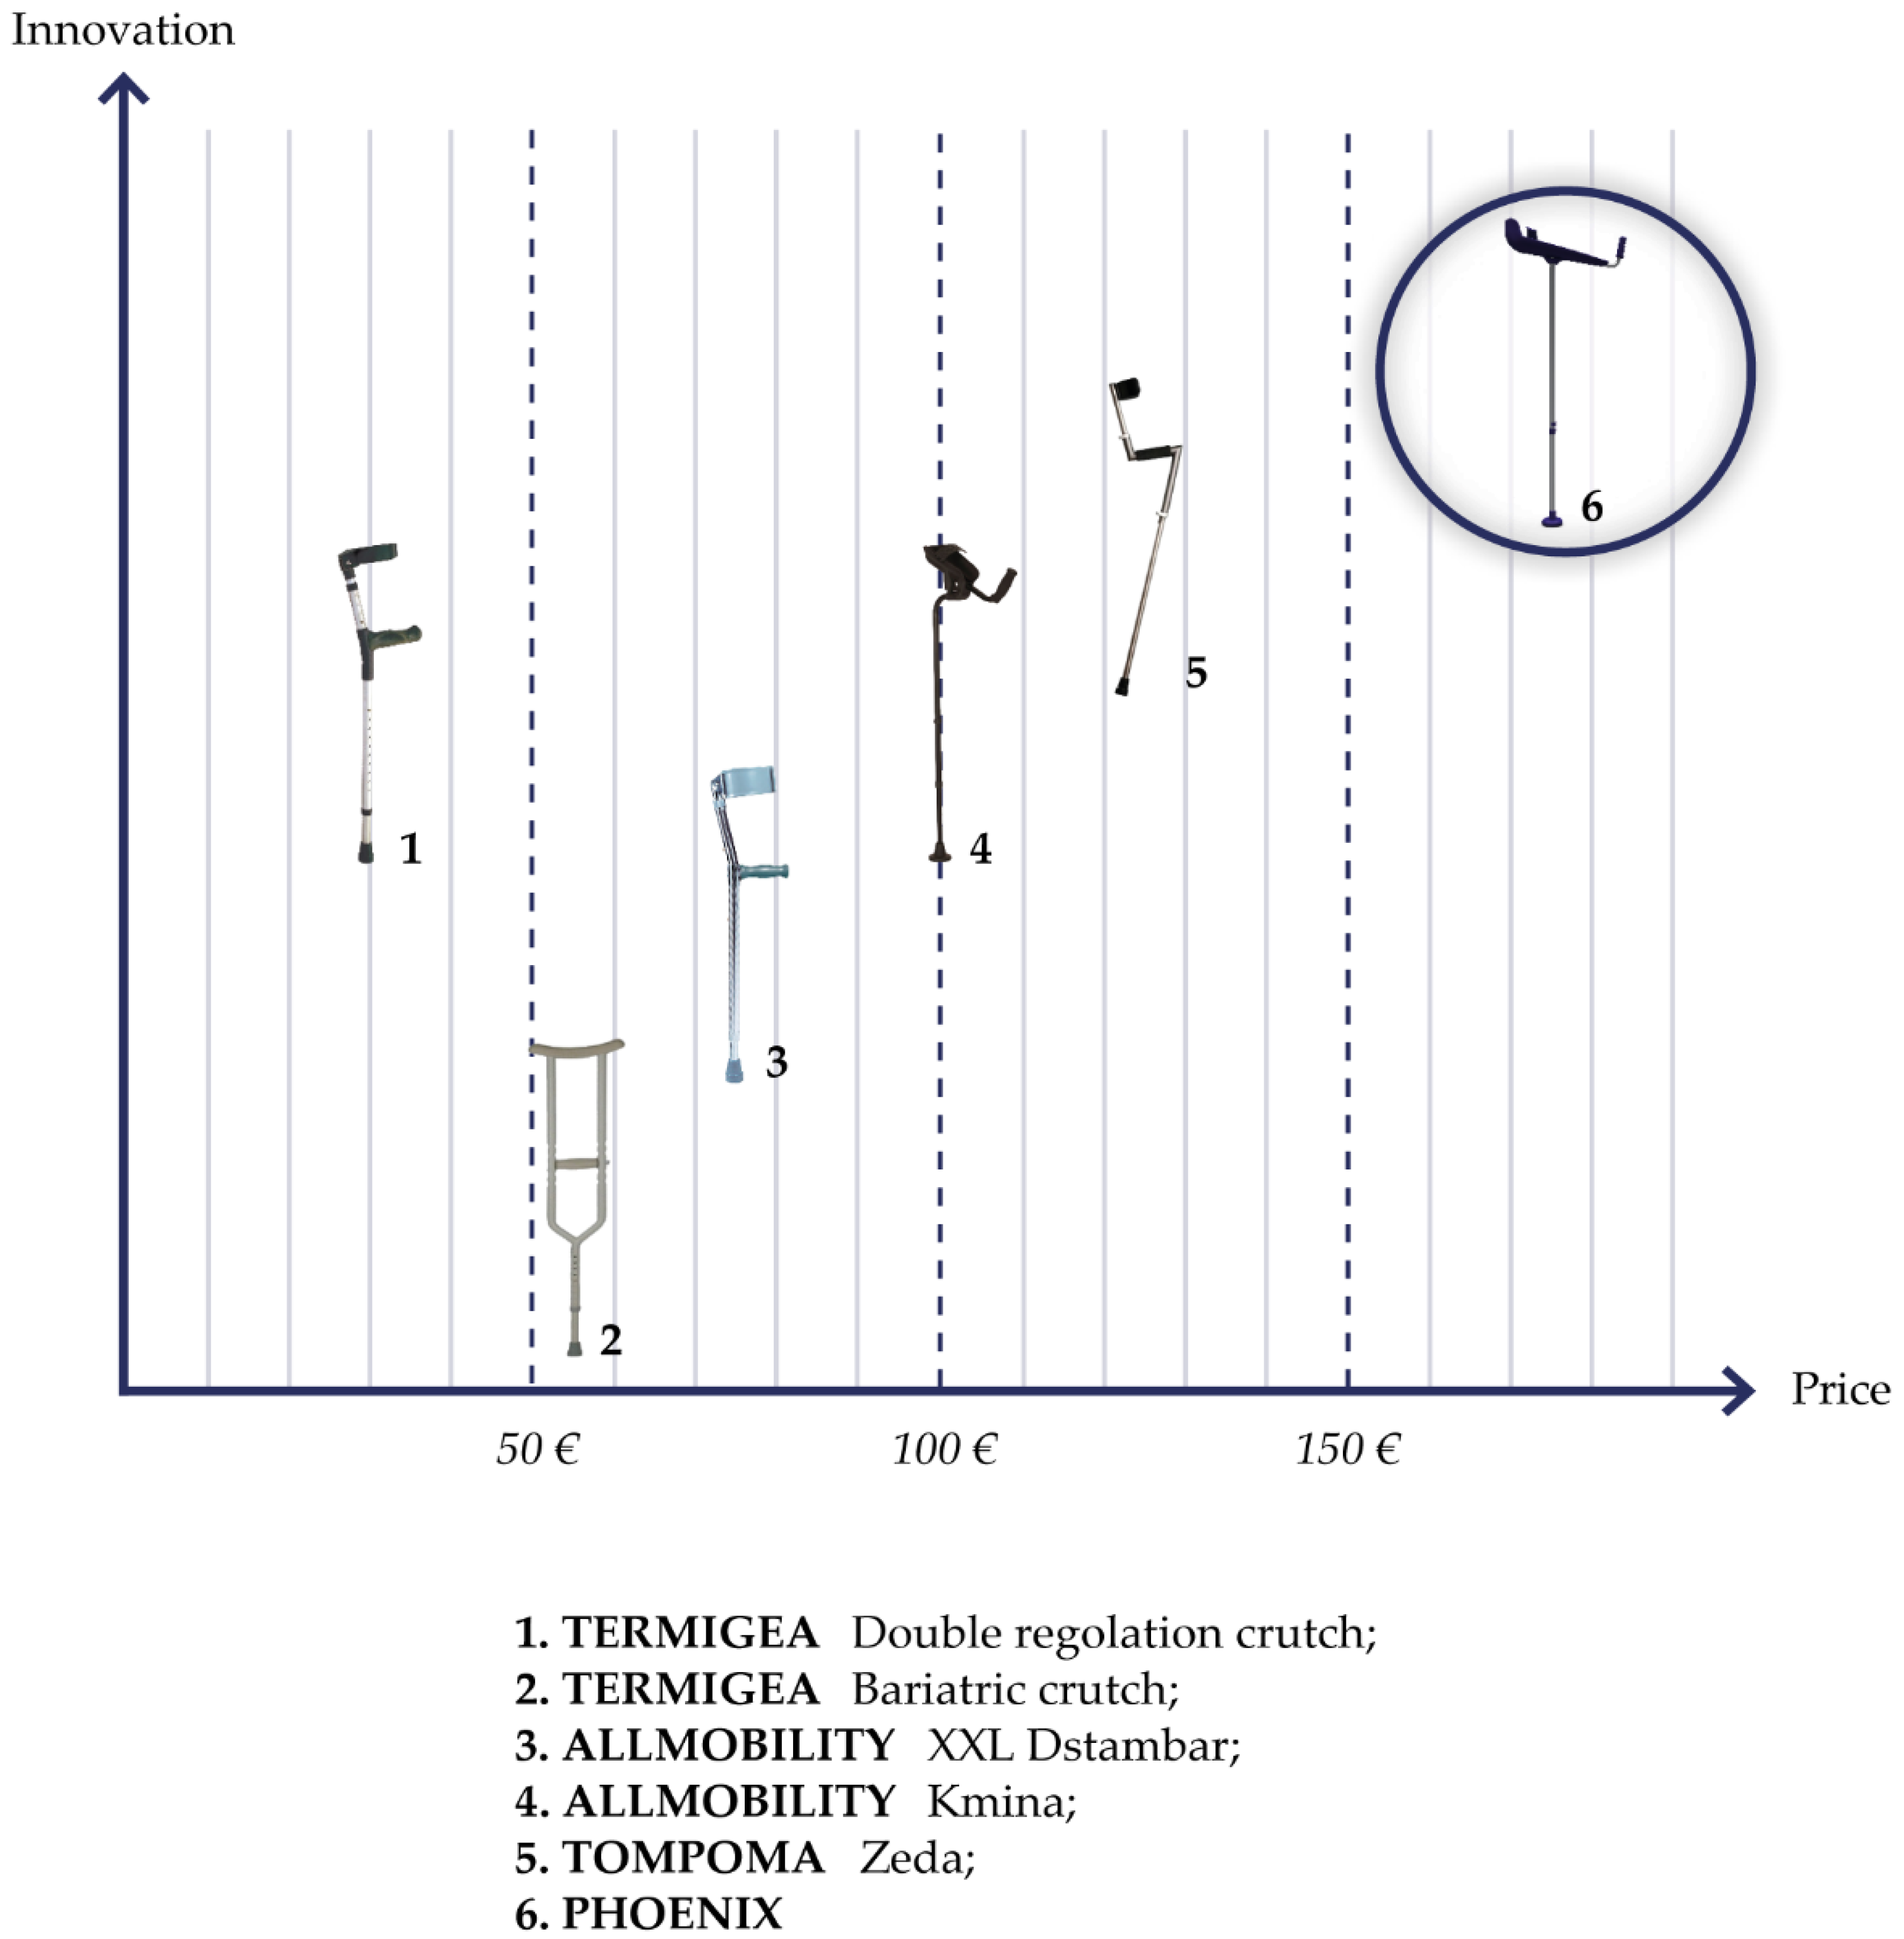
20]. Then, relying upon the initial budget hypothesis to carry out a cost analysis, in order to understand what the cost of the product could be and a possible sale price. Finally, it was studied how the product could be positioned on the market. According to the analysis of costs and to sales figures of crutches for chronic patients, it has been hypothesized at a sales cost of around €174, higher than the price of other crutches on the market, but acceptable for the technological innovations inside of it (
Figure 15).
The first phase of product setup has been completed, and an advanced phase of product development is now beginning. Psychiatric research is being set up to get to the test and engineering phase.
5. Conclusions
This method has allowed the design of an innovative crutch in terms of use and shapes. Regarding the shape, a forearm support, that is currently not present on the market, has been included in the designed crutch. This improvement offers a wider backing to patients who have to use it for a long period, and who cannot make much effort to lift their weight. Regarding the usage, the crutch offers a more aware and complete experience of its use, both for the patient and for doctors or physiotherapists, thanks to the technological features that have been included. In this way, the healthcare professional can monitor the use of crutches remotely to check if the patient uses it in the right way, if their condition improves or worsens over time, if they strain a leg too much, and so on. Finally, the method allowed designers to directly compare the crutches on the market and to consider the researches and patents, which actually have similar features to the final crutch designed. Thanks to that, it was possible to develop a crutch that is simple to build and to implement with the technology, because it does not need further devices and a large quantity of sensors, in order to get a faster hypothetical insertion on the market. In conclusion, the method described is more than valid for thinking, planning and designing complex innovative products.

 ,
, 


