Article

A Numerical Study on the Distribution and Evolution Characteristics of an Acoustic Field in the Time Domain of a Centrifugal Pump Based on Powell Vortex Sound Theory

School of Energy and Power Engineering, Shandong University, Jinan 250061, China
*
Authors to whom correspondence should be addressed.
Appl. Sci. 2019, 9(23), 5018; https://doi.org/10.3390/app9235018
Submission received: 27 October 2019 / Revised: 8 November 2019 / Accepted: 18 November 2019 / Published: 21 November 2019
(This article belongs to the Section Acoustics and Vibrations)

Abstract

:
The acoustic field distribution and evolution characteristics in a time domain inside a centrifugal pump are studied. During the fluid motion process, the acoustic source and acoustic pressure are basically less than 0, and the minimum value of the two parameters is distributed near the tongue. Additionally, the concentration, break, extend, migration and reaggregation phenomena of the minimum acoustic source region exist. Specifically, as the blade passes through the tongue, the minimum acoustic source region concentrates on the tongue firstly, then extends and migrates downstream slightly with the blade motion, and aggregates again around the tongue, which results in the similar evolution characteristics of acoustic pressure. Moreover, the standard deviation (STD) of acoustic source mainly focuses near the pressure side of blade tail and volute tongue, and the maximum STD is located at the tongue. Compared with the source component induced by stretching of the vortex, the source component induced by non-uniformity of fluid kinetic energy is closer to the overall acoustic source. Take the tongue as an example, at various rotational speeds, the STD proportions of the two components are about 5% and 95%, respectively. This study discusses the generation, distribution and evolution characteristics of acoustic field, which lays a foundation to analyze the acoustic field propagation mechanism of centrifugal pumps.

1. Introduction

Nowadays, turbomachinery plays a pivotal role in many fields of national economy [1,2,3]. As parts of turbomachinery components, centrifugal pumps have been widely applied for water supplying system, cooling system, agriculture irrigation system, and so on. However, the hydraulic performance and human health are affected by flow-induced noise during operation. Thus, the noise generation, distribution characteristics and noise reduction technology have attracted wide attention.
In the past, experiments have been conducted for the centrifugal pump noise analysis, and valuable conclusions were obtained [4,5,6,7]. However, it was difficult for the experimental method to identify the acoustic source accurately and analyze the coupling between flow and acoustic fields, by comparison, the numerical simulation approach was an ideal method to solve these issues. With the improvement of the Lighthill equation, a hybrid numerical method combining Lighthill acoustic analogy theory with Computational Fluid Dynamics (CFD) was widely used for flow-induced noise calculation [8,9,10,11]. According to the hybrid method, when the flow field simulation was completed, the wall pressure fluctuation in time domain was extracted and transformed into dipole acoustic source, then the noise signal in frequency domain was obtained. Based on the hybrid method, scholars explored the noise changing trend under different operation conditions, noise distribution characteristics, and the effect of different pump structures on noise [12,13,14,15]. Liu et al. [16] also compared the influence of different dipole sources on acoustic calculation results. Gao et al. [17], Liu et al. [18] revealed the noise radiation directivity characteristics with different dipole sources, respectively.
However, the Lighthill acoustic analogy theory assumed that the acoustic source generated by the flow was known beforehand, the flow and acoustic fields were separated, so the theory could not explain the sound wave generation and propagation mechanism, etc. [19]. With the development of research, Powell, Howe [20,21], proposed the vortex sound theory, which made up for this deficiency, and it was applied to acoustic research gradually [22,23]. By using Green function, the analytical solution of the equation could be derived to solve the noise signal in time domain at a certain monitoring point. Liu et al. [24], Ouyang et al. [25] and Wang et al. [26] applied the analytical solution to aerodynamic noise computation of fans and noise directivity characteristics analysis of submerged jet, respectively.
By summarizing the current research results, it is seen that the main concern is the effect of operation condition and pump structure on the noise distribution characteristics, while the acoustic field propagation mechanism in centrifugal pumps is rarely involved. According to synergy principle of flow and acoustic fields [27], the flow and acoustic fields synergy could affect the acoustic field propagation characteristics. Analyzing the propagation characteristics of acoustic field of centrifugal pumps is beneficial for the research about the directional noise reduction. To analyze the propagation characteristics of sound wave in centrifugal pumps based on synergy principle by using CFD, the basic and crucial step is to solve the parameters of flow and acoustic fields simultaneously, and figure out the temporal distribution and evolution characteristics of acoustic field.
However, the analytical solution of vortex sound equation based on Green function is used for noise calculation at a certain monitoring point, which is not suitable for noise calculation in the whole field. Obviously, the numerical approach based on discretizing and solving the vortex sound equation in the whole field [28] is the main method to figure out this issue.
In current work, the effectiveness of the simulation approach is firstly verified by corresponding experiment. Then the distribution and evolution characteristics of acoustic field inside a centrifugal pump are analyzed under various operation conditions. This study could guide the further research about the propagation mechanism of acoustic field.

2. Computational Model and Solving Method

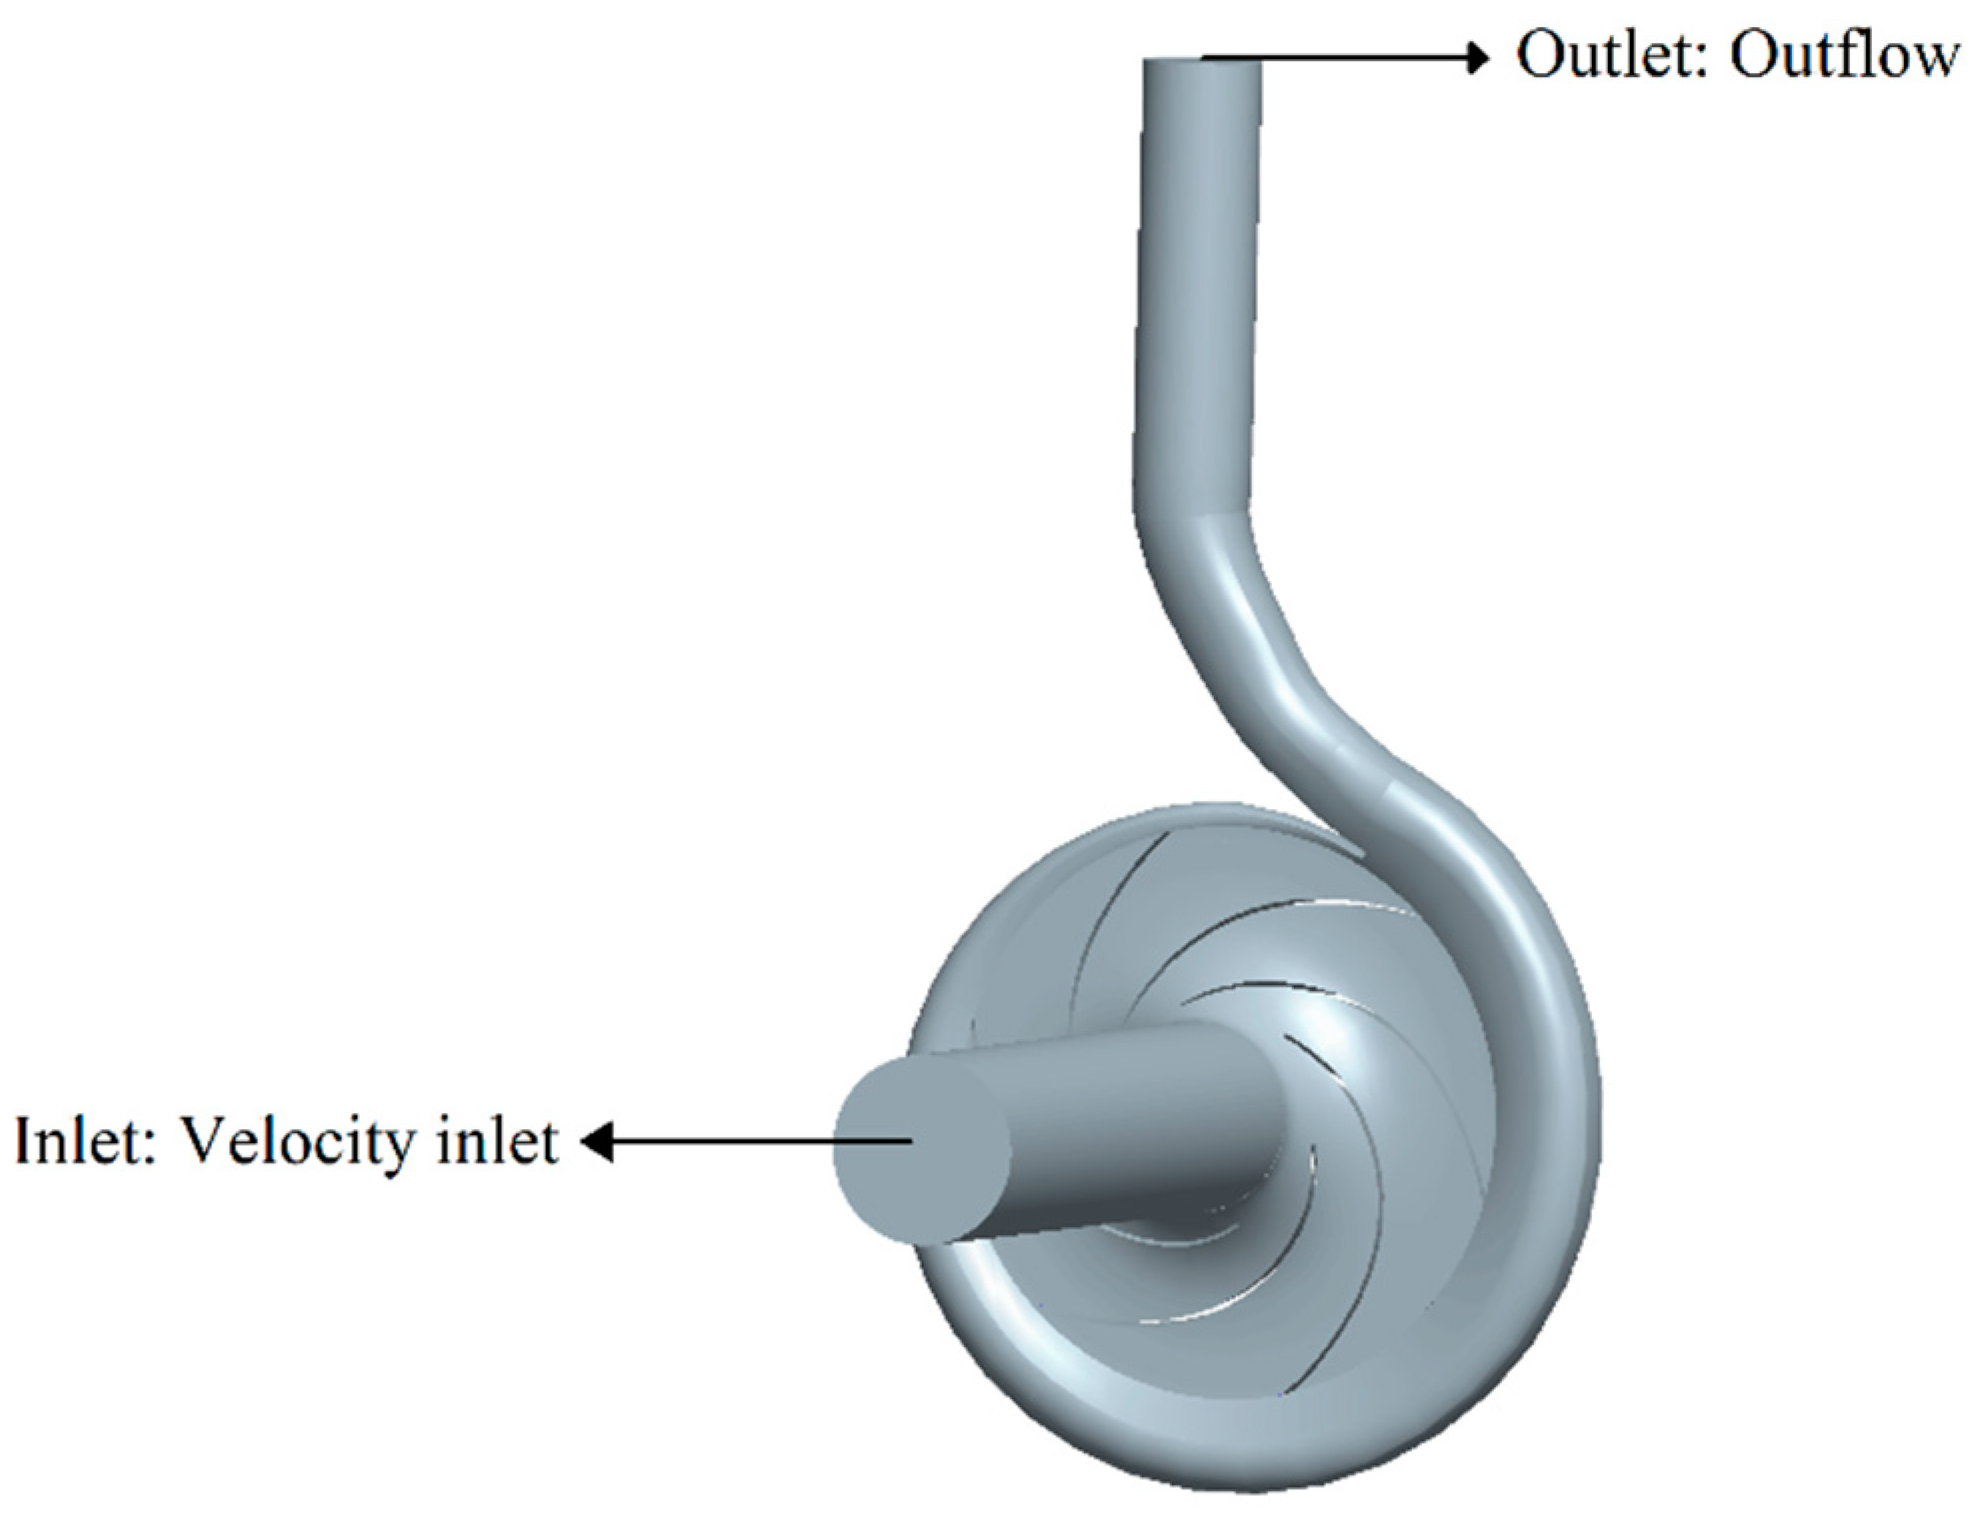
2.1. Flow Field Solver

The sketch of the centrifugal pump model and the model parameters are presented in Figure 1 and Table 1, respectively.
Figure 2 shows the mesh system view which contains 2124594 tetrahedral elements after conducting grid independence analysis [28]. In addition, Fluent 6.3 is used for the simulation. Table 2 summarizes the relevant settings used in the simulation of flow filed. The detailed inlet and outlet boundary conditions are illustrated in Figure 1. The pre-converged steady simulation results are adopted as an initial condition for the unsteady simulation. The time step of flow field satisfies the impeller rotation angle of 2° per time step in the process of unsteady simulation.

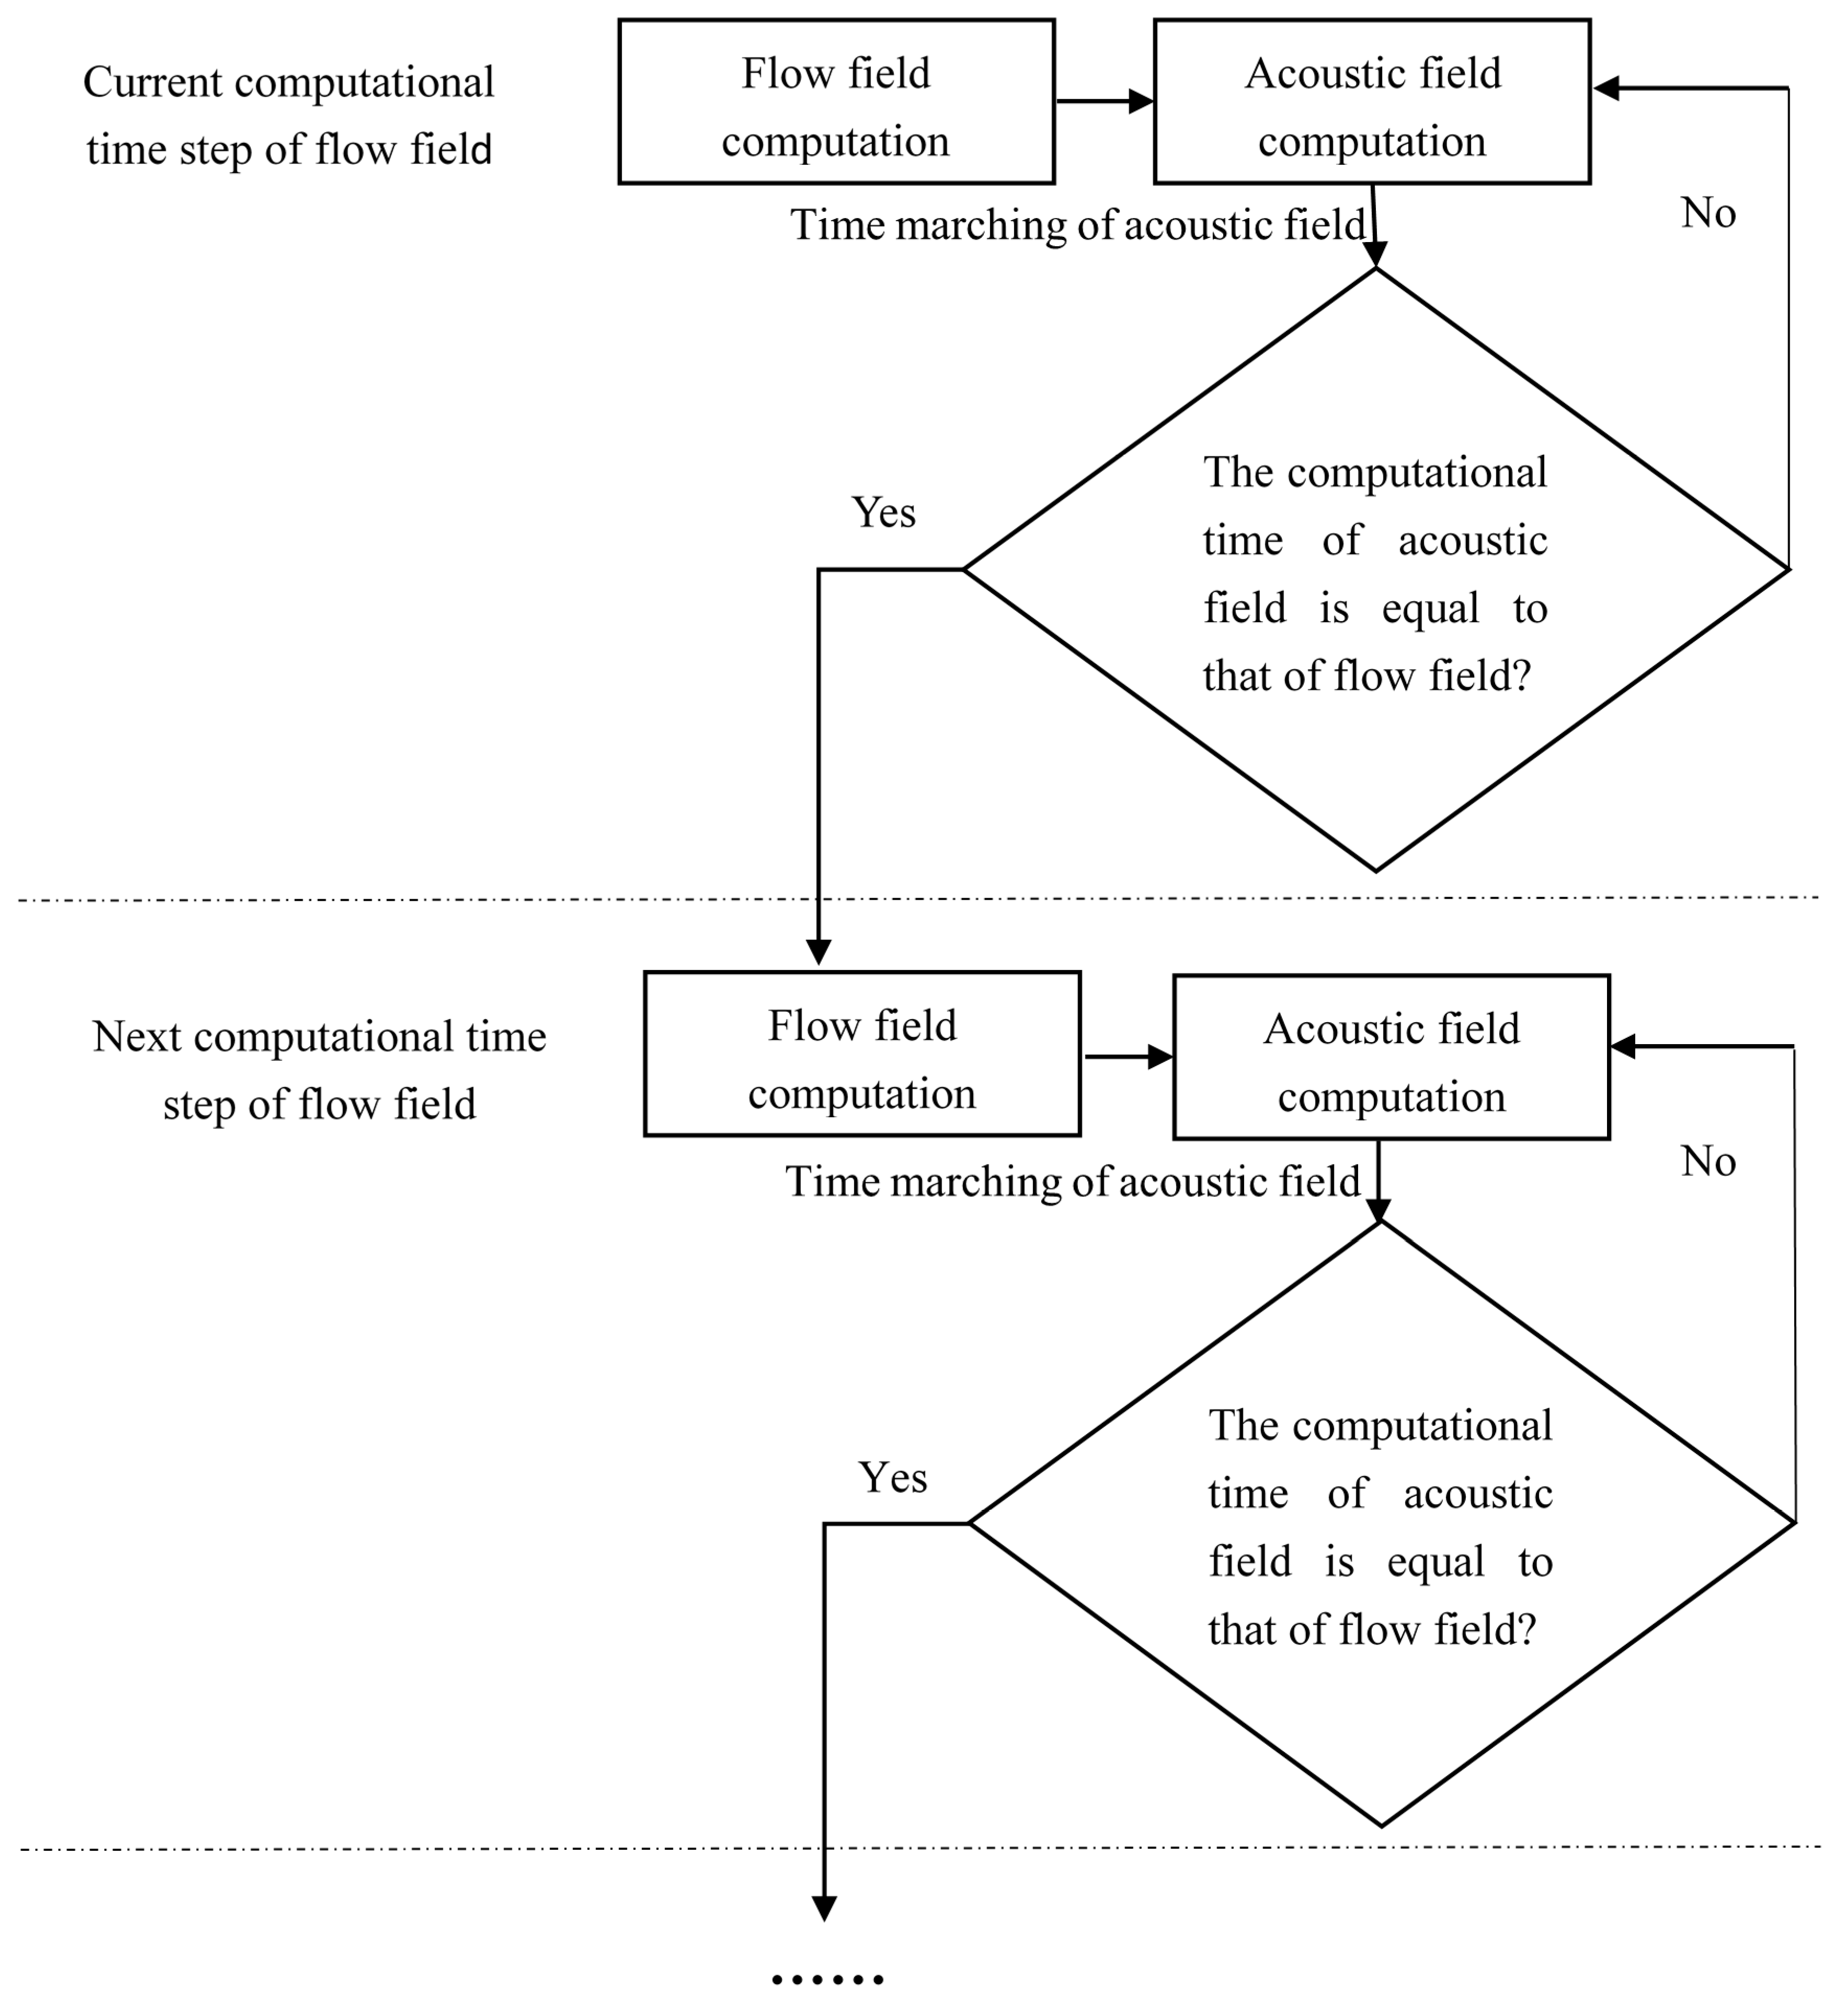
2.2. Acoustic Field Solver

In the process of sound propagation, the time of media compression and expansion is much shorter than that of heat conduction, the media has no time to exchange heat with the adjacent part, so the sound process is assumed to be isentropic [27,29]. Additionally, the media used in the centrifugal pump is water, the kinematic viscosity is very small and can be neglected in calculation [30]. Under the inviscid and isentropic condition, the Powell vortex sound equation is.
1 c 0 2 2 p t 2 2 p = ( ρ ( ω × u ) + ( ρ u 2 2 ) )
The vortex sound equation comprises of time, spatial and source items from left to right.
During the unsteady simulation process of acoustic field, the inlet and outlet surfaces are set to be absorption boundary conditions, and the total reflection boundary condition is applied to the rest boundaries. The absorption boundary and total reflection boundary conditions are defined as [31].
1 c 0 p t + p n = 0   ( absorption   boundary   condition )
p = 0   ( total   reflection   boundary   condition )
To solve Equation (1), the intermediate variable “q” is introduced. The Equation (1) can be written as,
p t = q
q t = c 0 2 * ( ( ρ ( ω × u ) + ( ρ u 2 2 ) ) + 2 p )
The Equations (4) and (5) are solved based on implicit finite volume method [28]. To ensure the rationality of the initial conditions, the initial conditions are defined as [28],
q i n i t i a l = 0 , p i n i t i a l = 0
where qinitial and pinitial represent the initial values of acoustic field. Figure 3 shows the calculation flow chart of flow and acoustic fields. In this study, the various rotational speed condition study is carried out to reveal the changing rules of the acoustic field distribution characteristics.

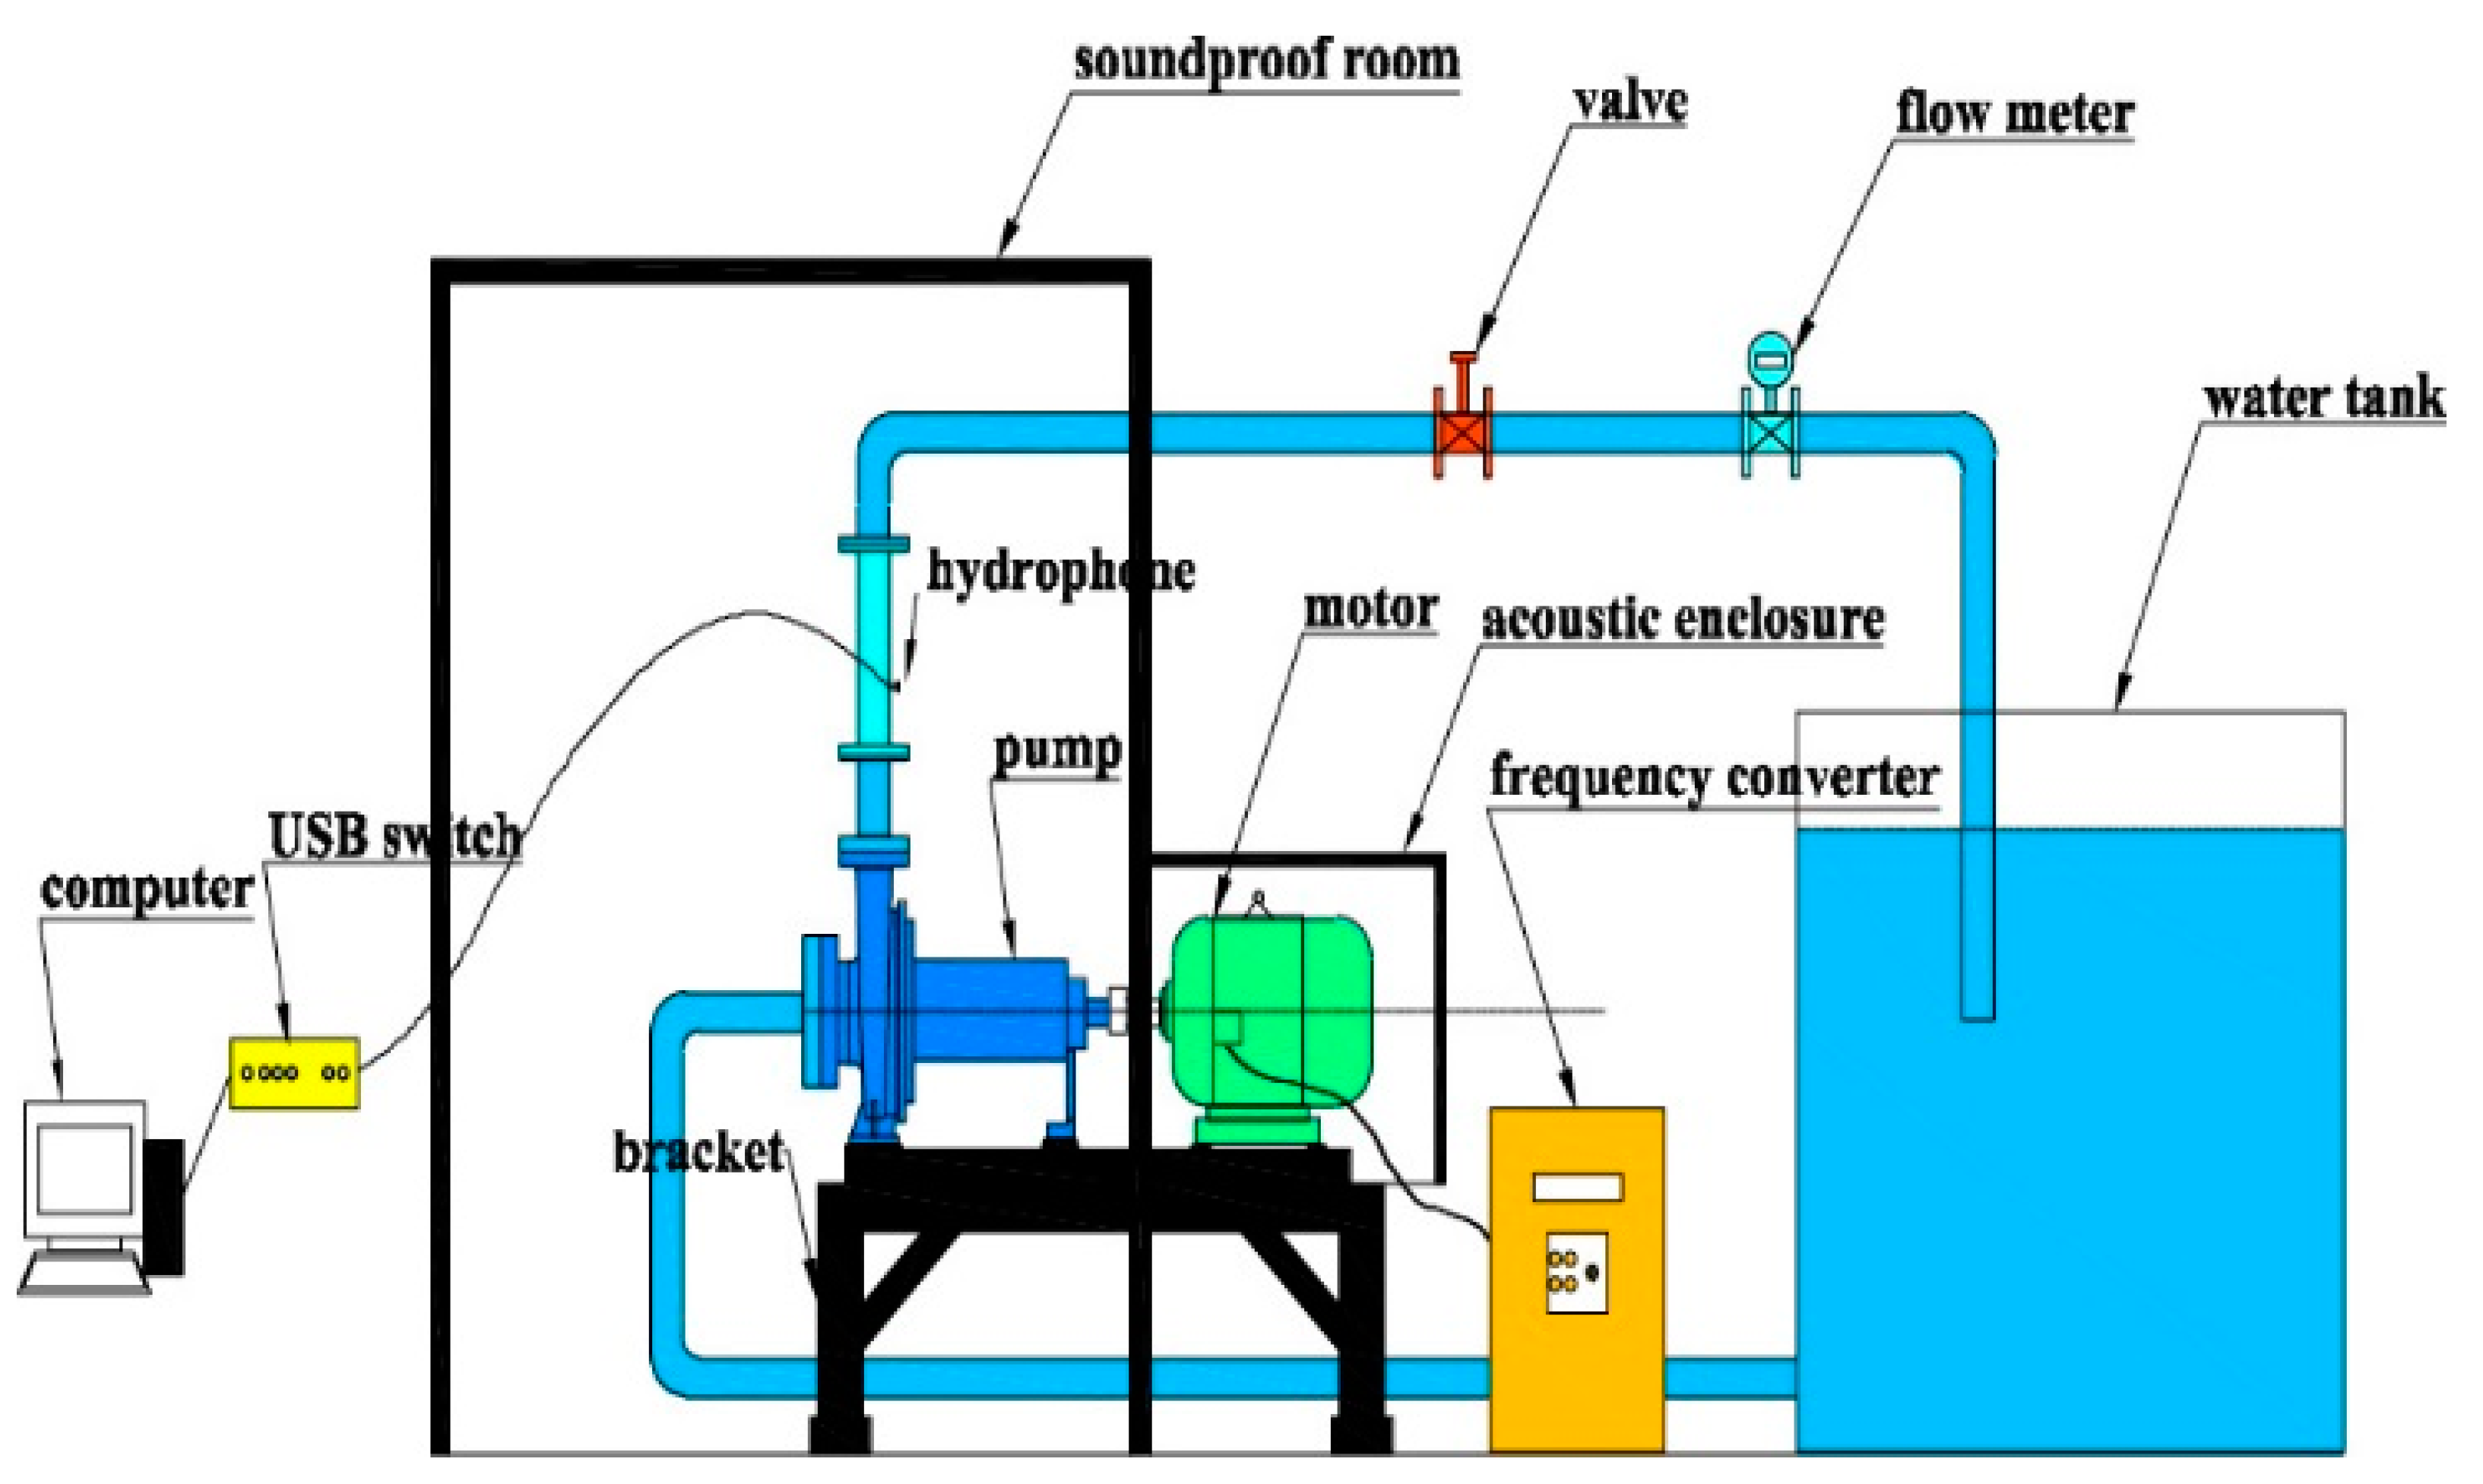
3. Test Facilities and Procedures

In order to validate the effectiveness of the simulation approach, corresponding tests are carried out. Figure 4 shows the test loop. This test loop is made up by the test pump, motor, frequency converter, valve, flow meter, hydrophone, water tank, etc. The flow-induced noise in outlet pipe is measured, and various operation conditions are obtained. Table 3 lists the performance characteristics of relevant apparatuses.

4. Results and Analysis

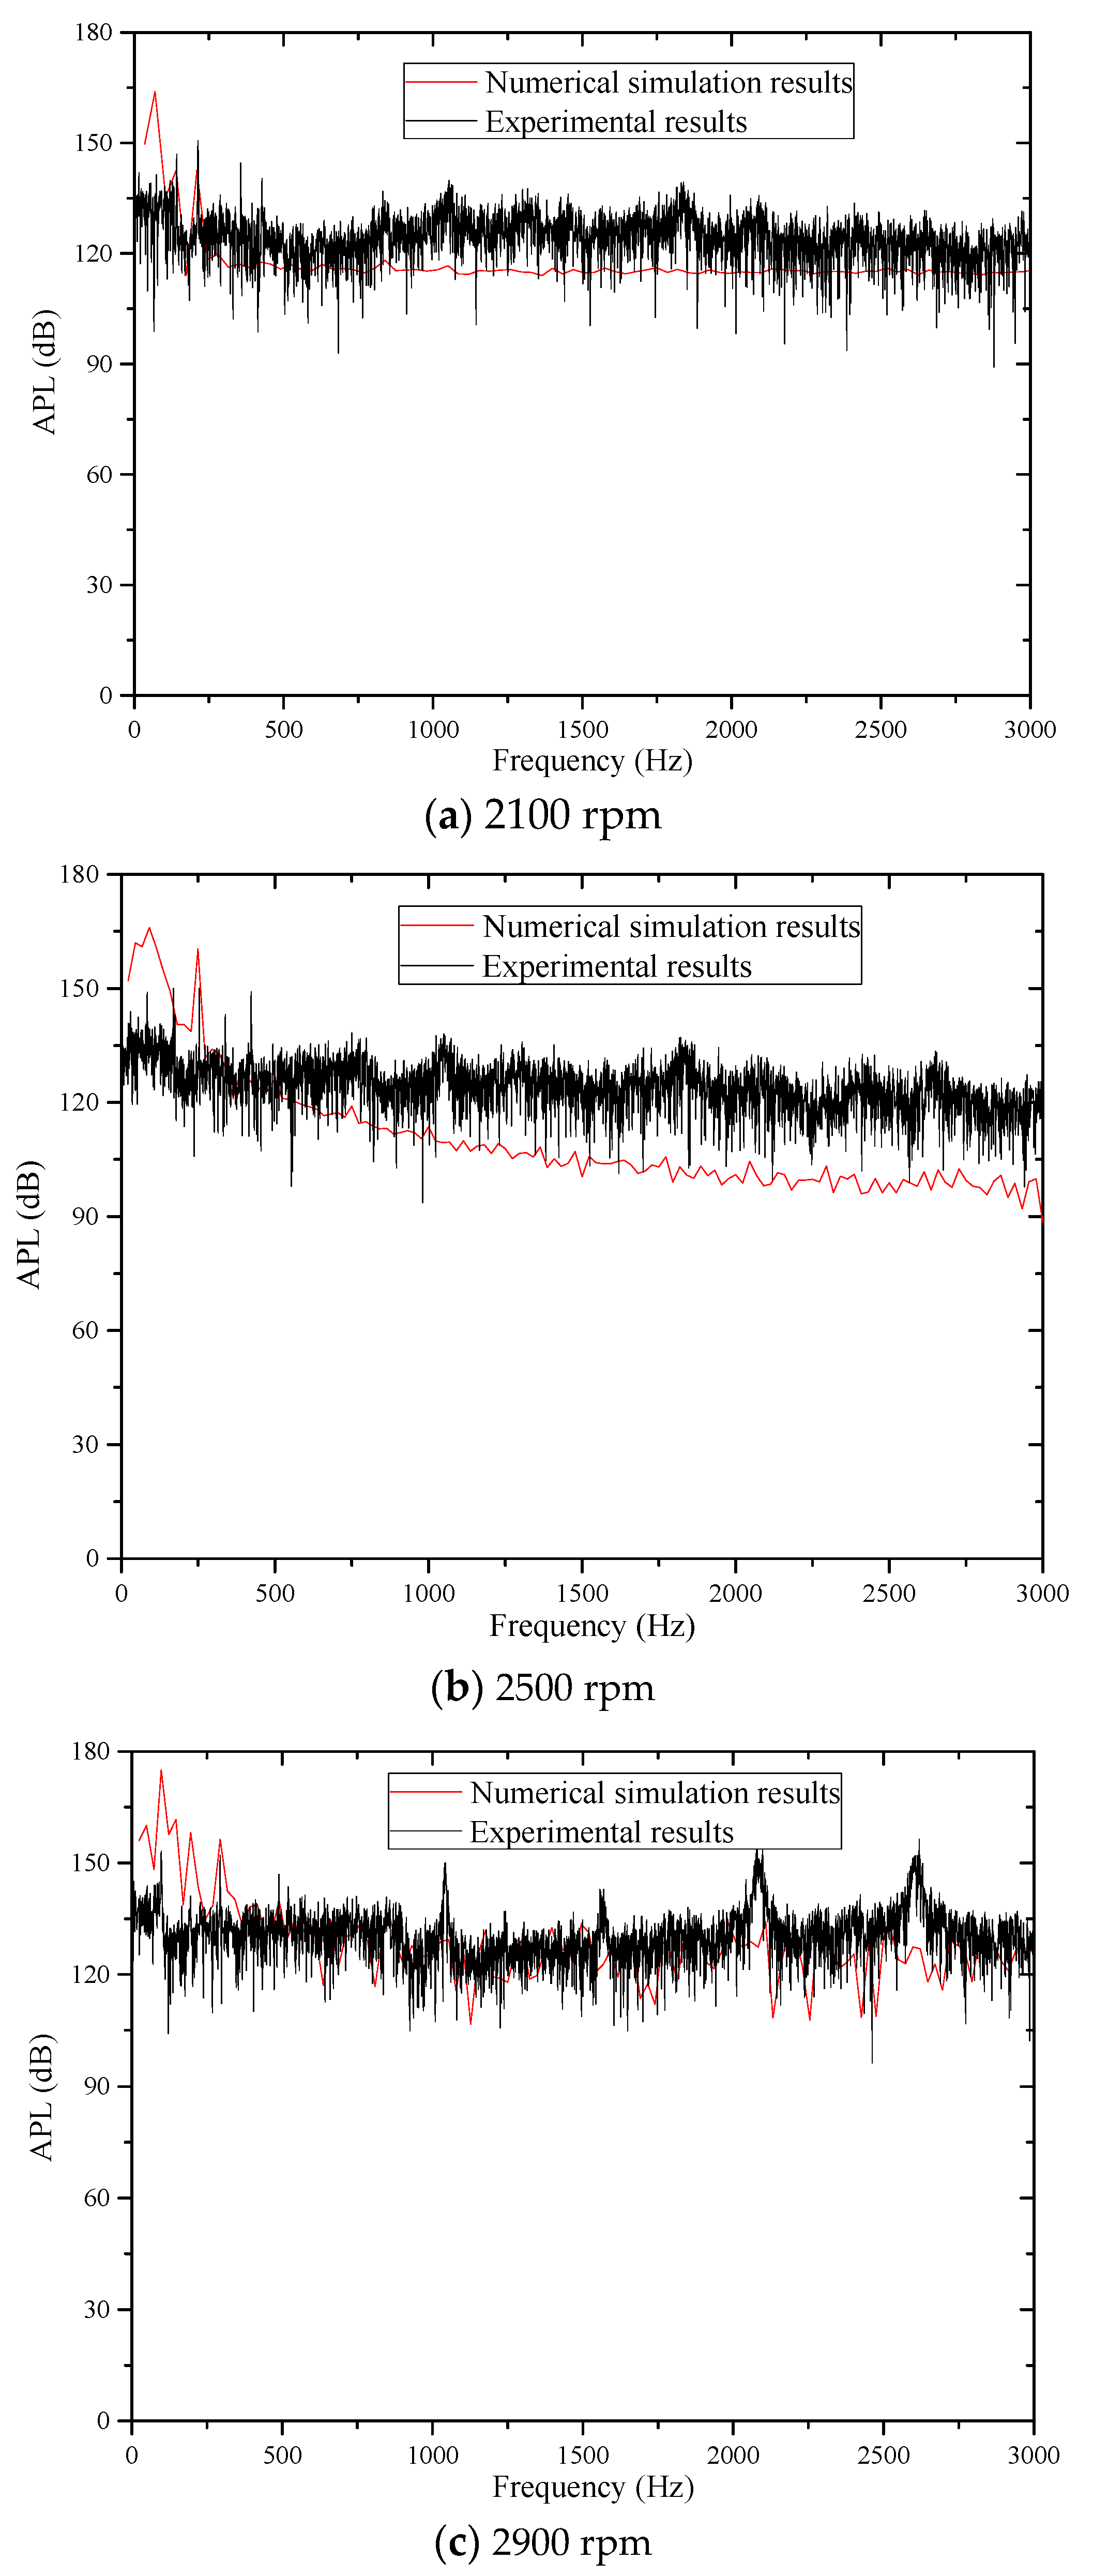
4.1. Verification of the Numerical Simulation Approach

The flow-induced noise obtained by experiment and simulation is compared to verify the accuracy of the approach. Figure 5a–c depicts the Acoustic Pressure Level (APL) distribution characteristics in broadband range at several rotational speeds. It is revealed that with the increase of frequency, the fluctuating downward trend of APL obtained by simulation and experiment is similar at various rotational speeds.
Table 4 further compares the deviation of flow-induced noise between simulation and experiment in detail. It was found that the deviation between experiment and numerical simulation is small, the average deviations of APL at characteristic frequencies and Total Acoustic Pressure Level (TAPL) at various rotational speeds are about 3.68% and 1.07%, respectively. The analysis results of Figure 5 and Table 4 manifest the effectiveness of the approach.

4.2. The Distribution and Evolution Characteristics of Acoustic Field in Time Domain at Rated Operation Condition

In this section, the distribution and evolution characteristics of acoustic field in time domain inside the pump at 2900 rpm are studied. The study time span is one period of blade passing through the volute tongue, which includes 30 time steps of flow field. The middle span surface of volute is chosen as the study surface.

4.2.1. The Distribution and Evolution Characteristics of Acoustic Source

Figure 6 presents the acoustic source distribution characteristic. Basically, the acoustic source is less than 0. The regions near the outlet of impeller, inlet of volute and volute tongue have lower acoustic source than any others, and the minimum acoustic source is located near the tongue. In addition, the concentration, break, extend, migration and reaggregation evolution phenomena of the minimum acoustic source region exist during the fluid motion. Specifically, when the blade is located at the tongue (Time step = 10), the blade-volute tongue interaction intensity is the strongest, the minimum acoustic source region concentrates on the tongue. Subsequently, the minimum acoustic source region initially concentrated on the tongue breaks, then extends and migrates downstream slightly with the blade away from the tongue (Time step = 20). As the blade continues to move, another blade moves close to the tongue (Time step = 30), the minimum acoustic source region aggregates again near the tongue.
According to Powell vortex sound equation, the acoustic source consists of two different components, which represents respectively the stretching of the vortex caused by change of velocity (Source-1) and the non-uniformity of fluid kinetic energy (Source-2) [32]. The standard deviation (STD) is calculated to explore the fluctuation intensity of the acoustic source and the proportion of different source components, and it is defined as.
STD = i = 1 n ( S i S ¯ ) n 2
S ¯ = 1 n i = 1 n S i
where Si represents the acoustic source at i-th time step,   S ¯ represents the average value of acoustic source in one rotational period, n is the number of time step (n = 180).
Figure 7 and Figure 8 illustrate the STD distribution characteristics of the overall acoustic source and the two different acoustic source components, respectively. It was found from Figure 7 that the maximum STD inside the impeller is located near the pressure side of blade tail, while the maximum STD inside the volute is located near the tongue, which is also the region with the largest STD inside the whole pump. What’s more, the STD distribution characteristics of two different acoustic source components are similar to those of overall acoustic source by comparing the Figure 7 and Figure 8, and the STD of Source-1 is lower than that of Source-2 basically, which means that the non-uniformity of fluid kinetic energy is the main noise source.

4.2.2. The Distribution and Evolution Characteristics of Acoustic Pressure

The distribution and evolution characteristics of acoustic pressure are presented in Figure 9. Similarly, the acoustic pressure is also less than 0 basically. The acoustic pressure shows a decreasing trend from inlet to outlet of impeller, the minimum value of acoustic pressure is distributed near the volute tongue, the main noise region corresponding to the main acoustic source region. Moreover, the evolution trend of acoustic pressure near the tongue is similar to that of acoustic source. When the blade is located at the tongue, the minimum acoustic pressure region focuses around the tongue (Time step = 10). The acoustic pressure near the tongue increases significantly with blade away from the tongue (Time step = 20). Then the minimum acoustic pressure region refocuses near the tongue due to another blade closing to the tongue (Time step = 30).

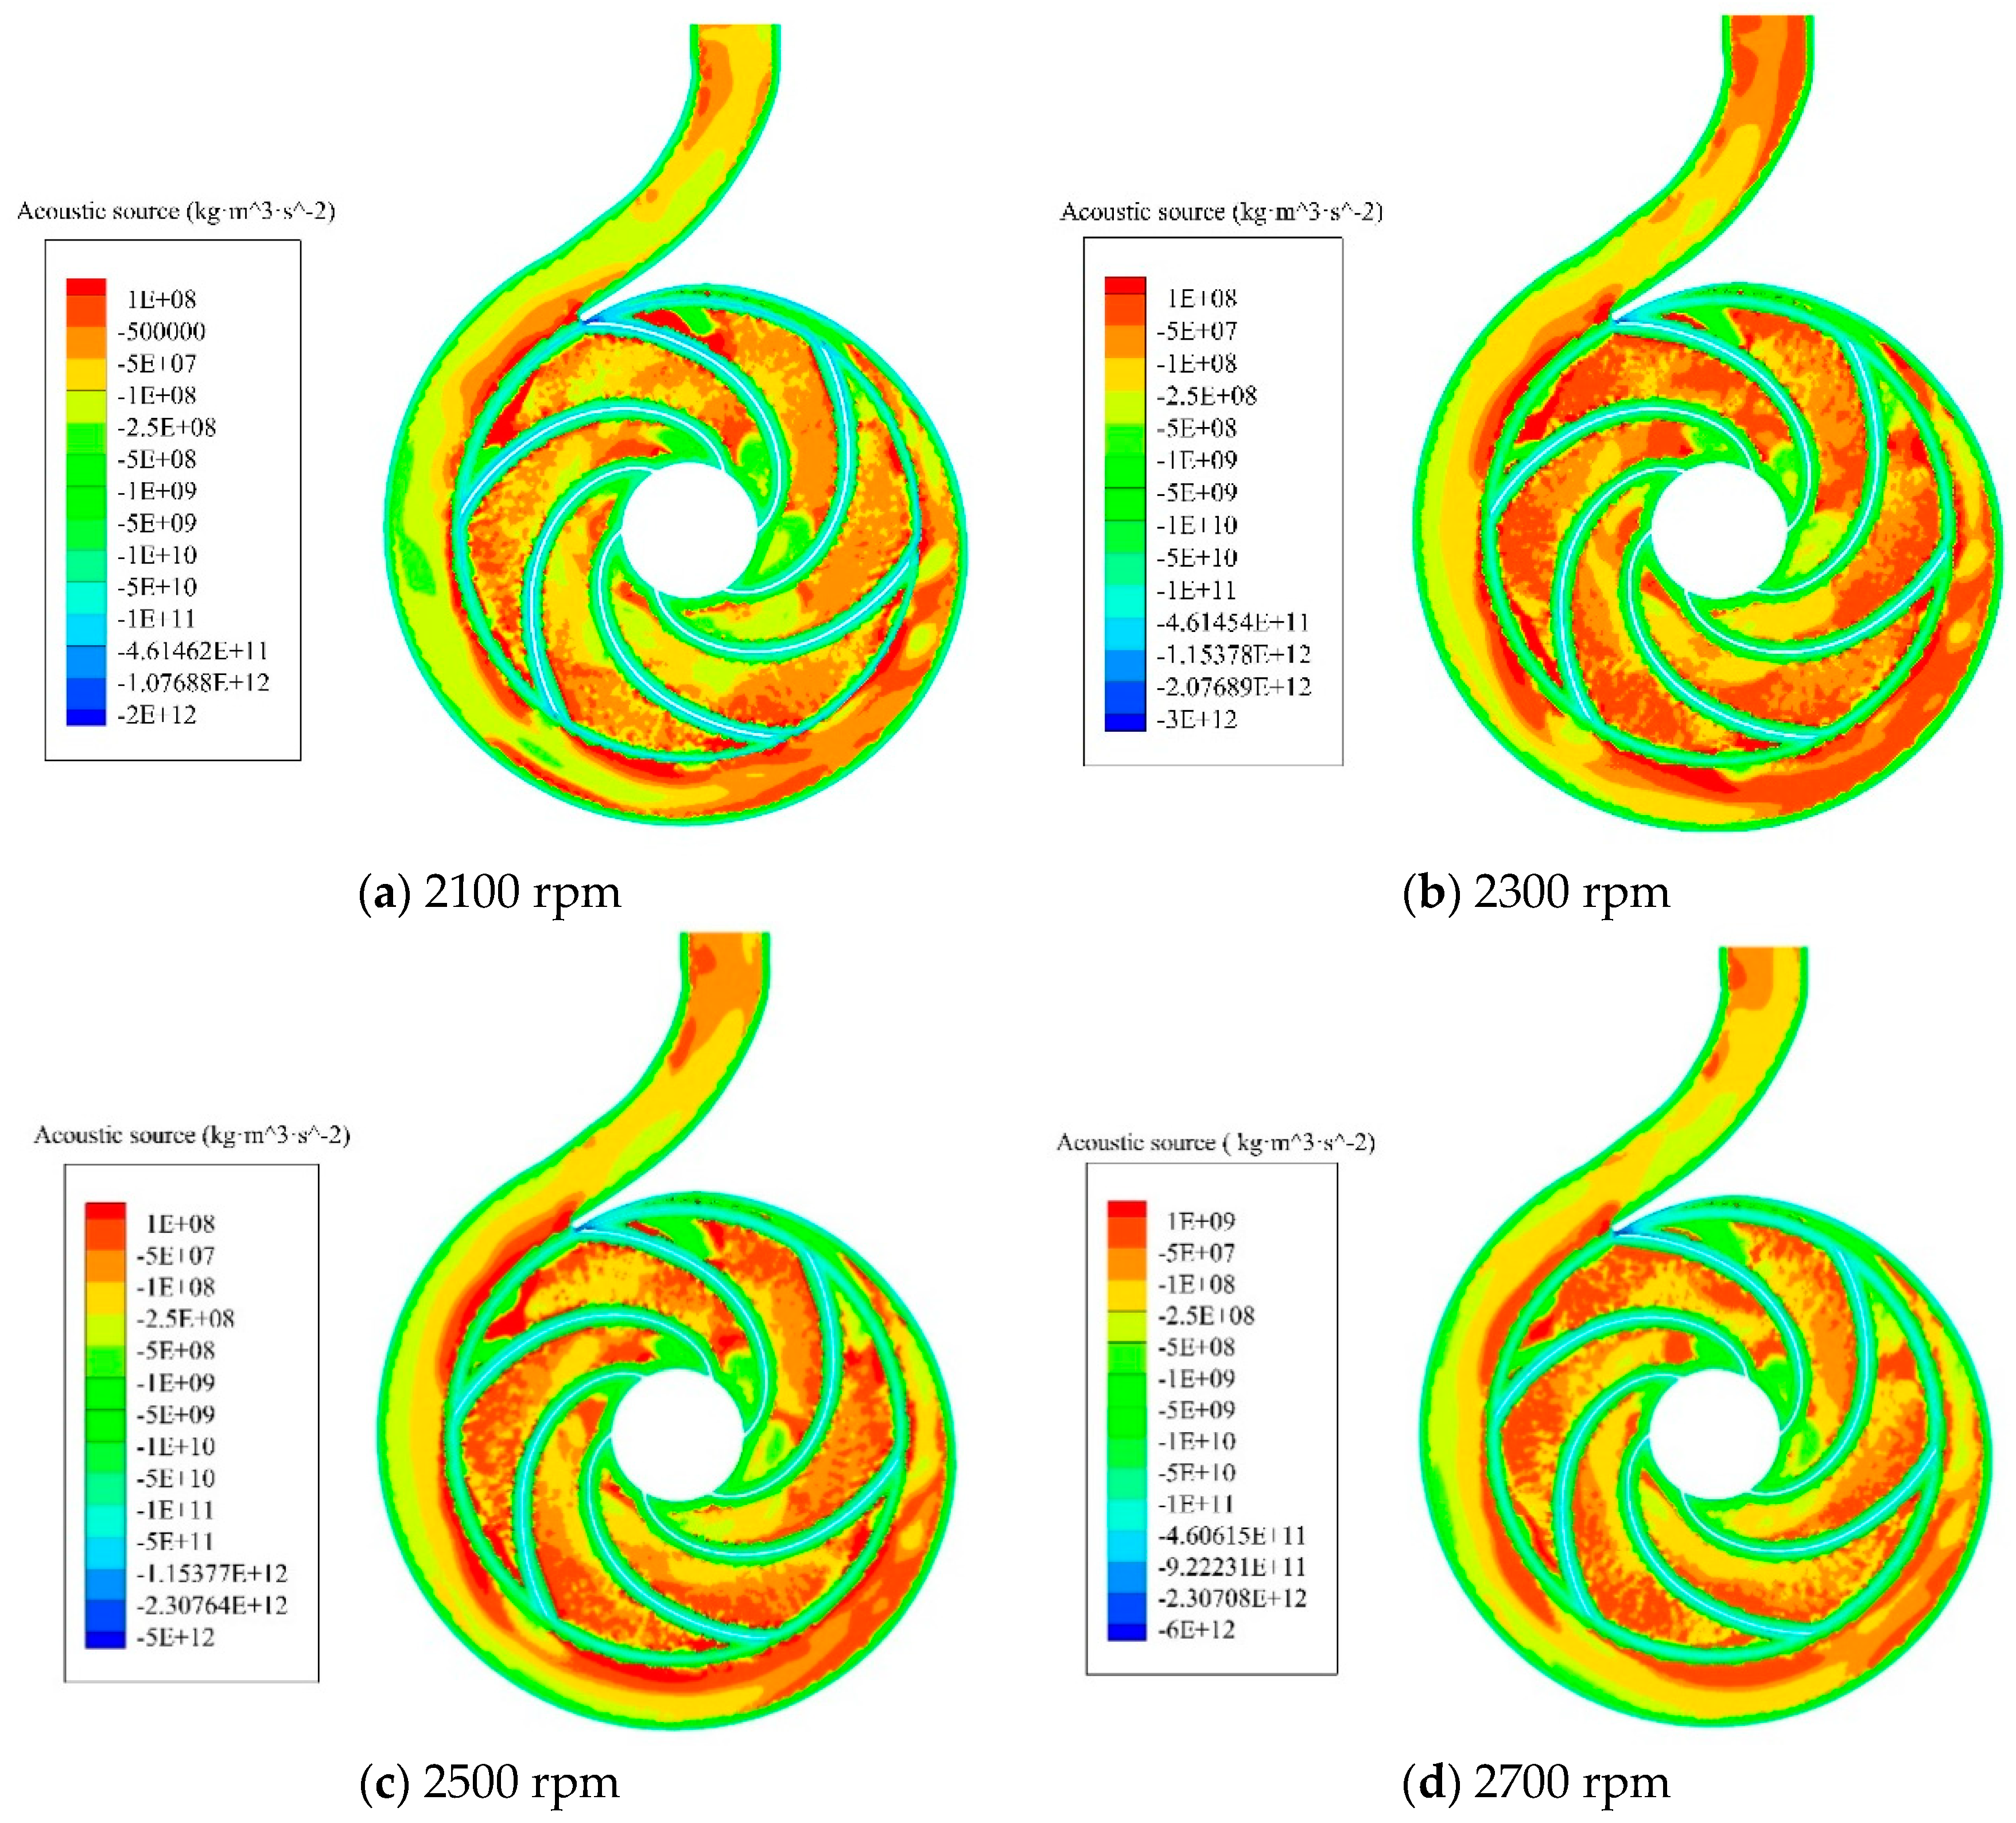
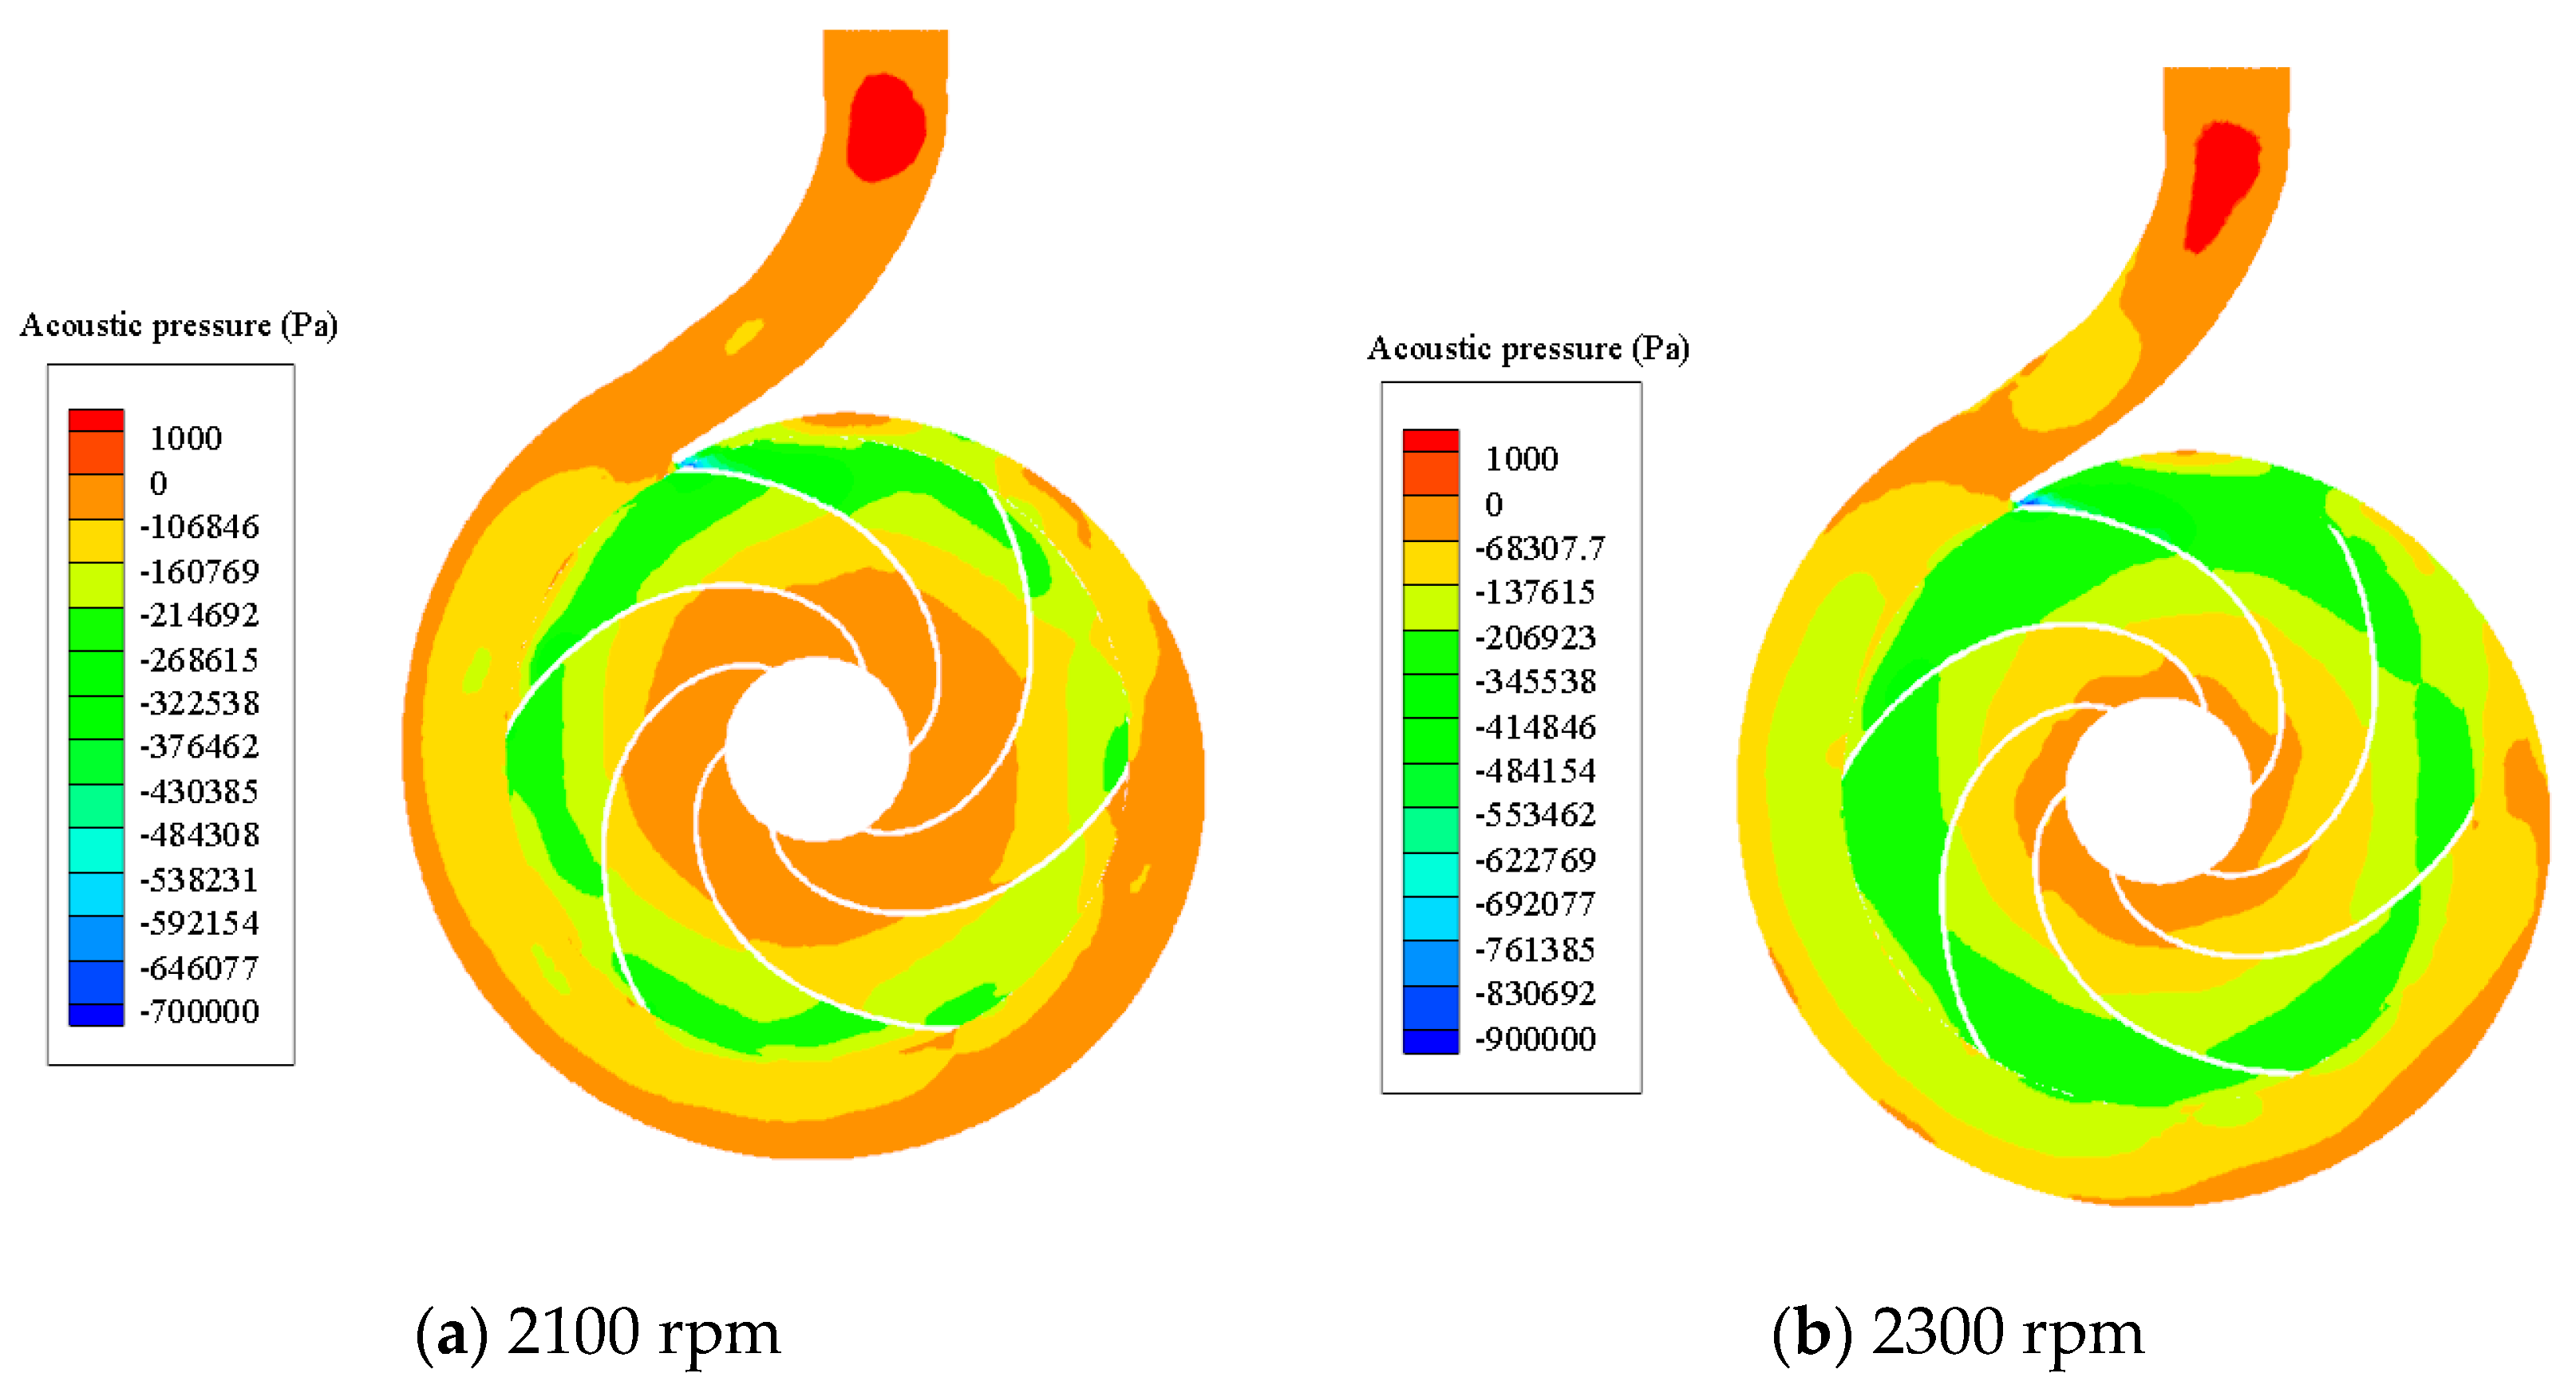
4.3. The Distribution Characteristics of Acoustic Source and Pressure at Various Rotational Speeds

Figure 10, Figure 11 and Figure 12 show the distribution characteristics of acoustic source and STD of acoustic source, as well as acoustic pressure under several low rotational speeds. It was found that the distribution characteristics of the three parameters at low speed conditions are similar to those at 2900 rpm. However, the flow fluctuation intensifies with increasing rotational speed, so the minimum of acoustic source decreases and the fluctuation range extends characterized by the STD increasing gradually. Consequently, the minimum of acoustic pressure decreases, and the fluctuation range extends gradually.

4.4. The Fluctuation Characteristics of Acoustic Source and Pressure Under Various Rotational Speeds

Section 4.2 and Section 4.3 reveal the overall distribution characteristics of acoustic source and pressure. However, it is difficult to figure out the fluctuation characteristics intuitively. Therefore, take the volute tongue as an example, the fluctuation characteristics of the two parameters in one rotational period are revealed intuitively. As shown in Figure 13 and Figure 14, the two parameters present the same periodicity, and reach to crest and trough simultaneously, there are 6 crests and troughs in one rotational period, which corresponds to 6 blades in the pump. Meanwhile, the fluctuation ranges of the two parameters widen simultaneously with increasing rotational speed.
To reveal the main noise source quantitatively, the fluctuation characteristics of different source components, as well as the STD proportions at the volute tongue are studied. Figure 15 depicts the fluctuation curves of overall acoustic source, Source-1 and Source-2 at 2900 rpm. It is observed that the fluctuation characteristics of Source-1 and Souce-2 are similar to that of overall acoustic source. Compared with Souce-1, the fluctuation range of Source-2 is closer to that of overall acoustic source. Figure 16 further compares the STD ratios of different source components to overall acoustic source under various rotational speeds. The STD ratios have little change at different rotational speeds, the STD ratios of Source-1 and Source-2 remain around 5% and 95%, respectively.

5. Conclusions

The effectiveness of the numerical simulation approach combining discretizing and solving the Powell vortex sound equation with CFD is verified by experiment. Then the temporal distribution and evolution characteristics of acoustic field inside a centrifugal pump are revealed, and various operation condition study is conducted. The conclusion of this study is listed as follows,
(1)
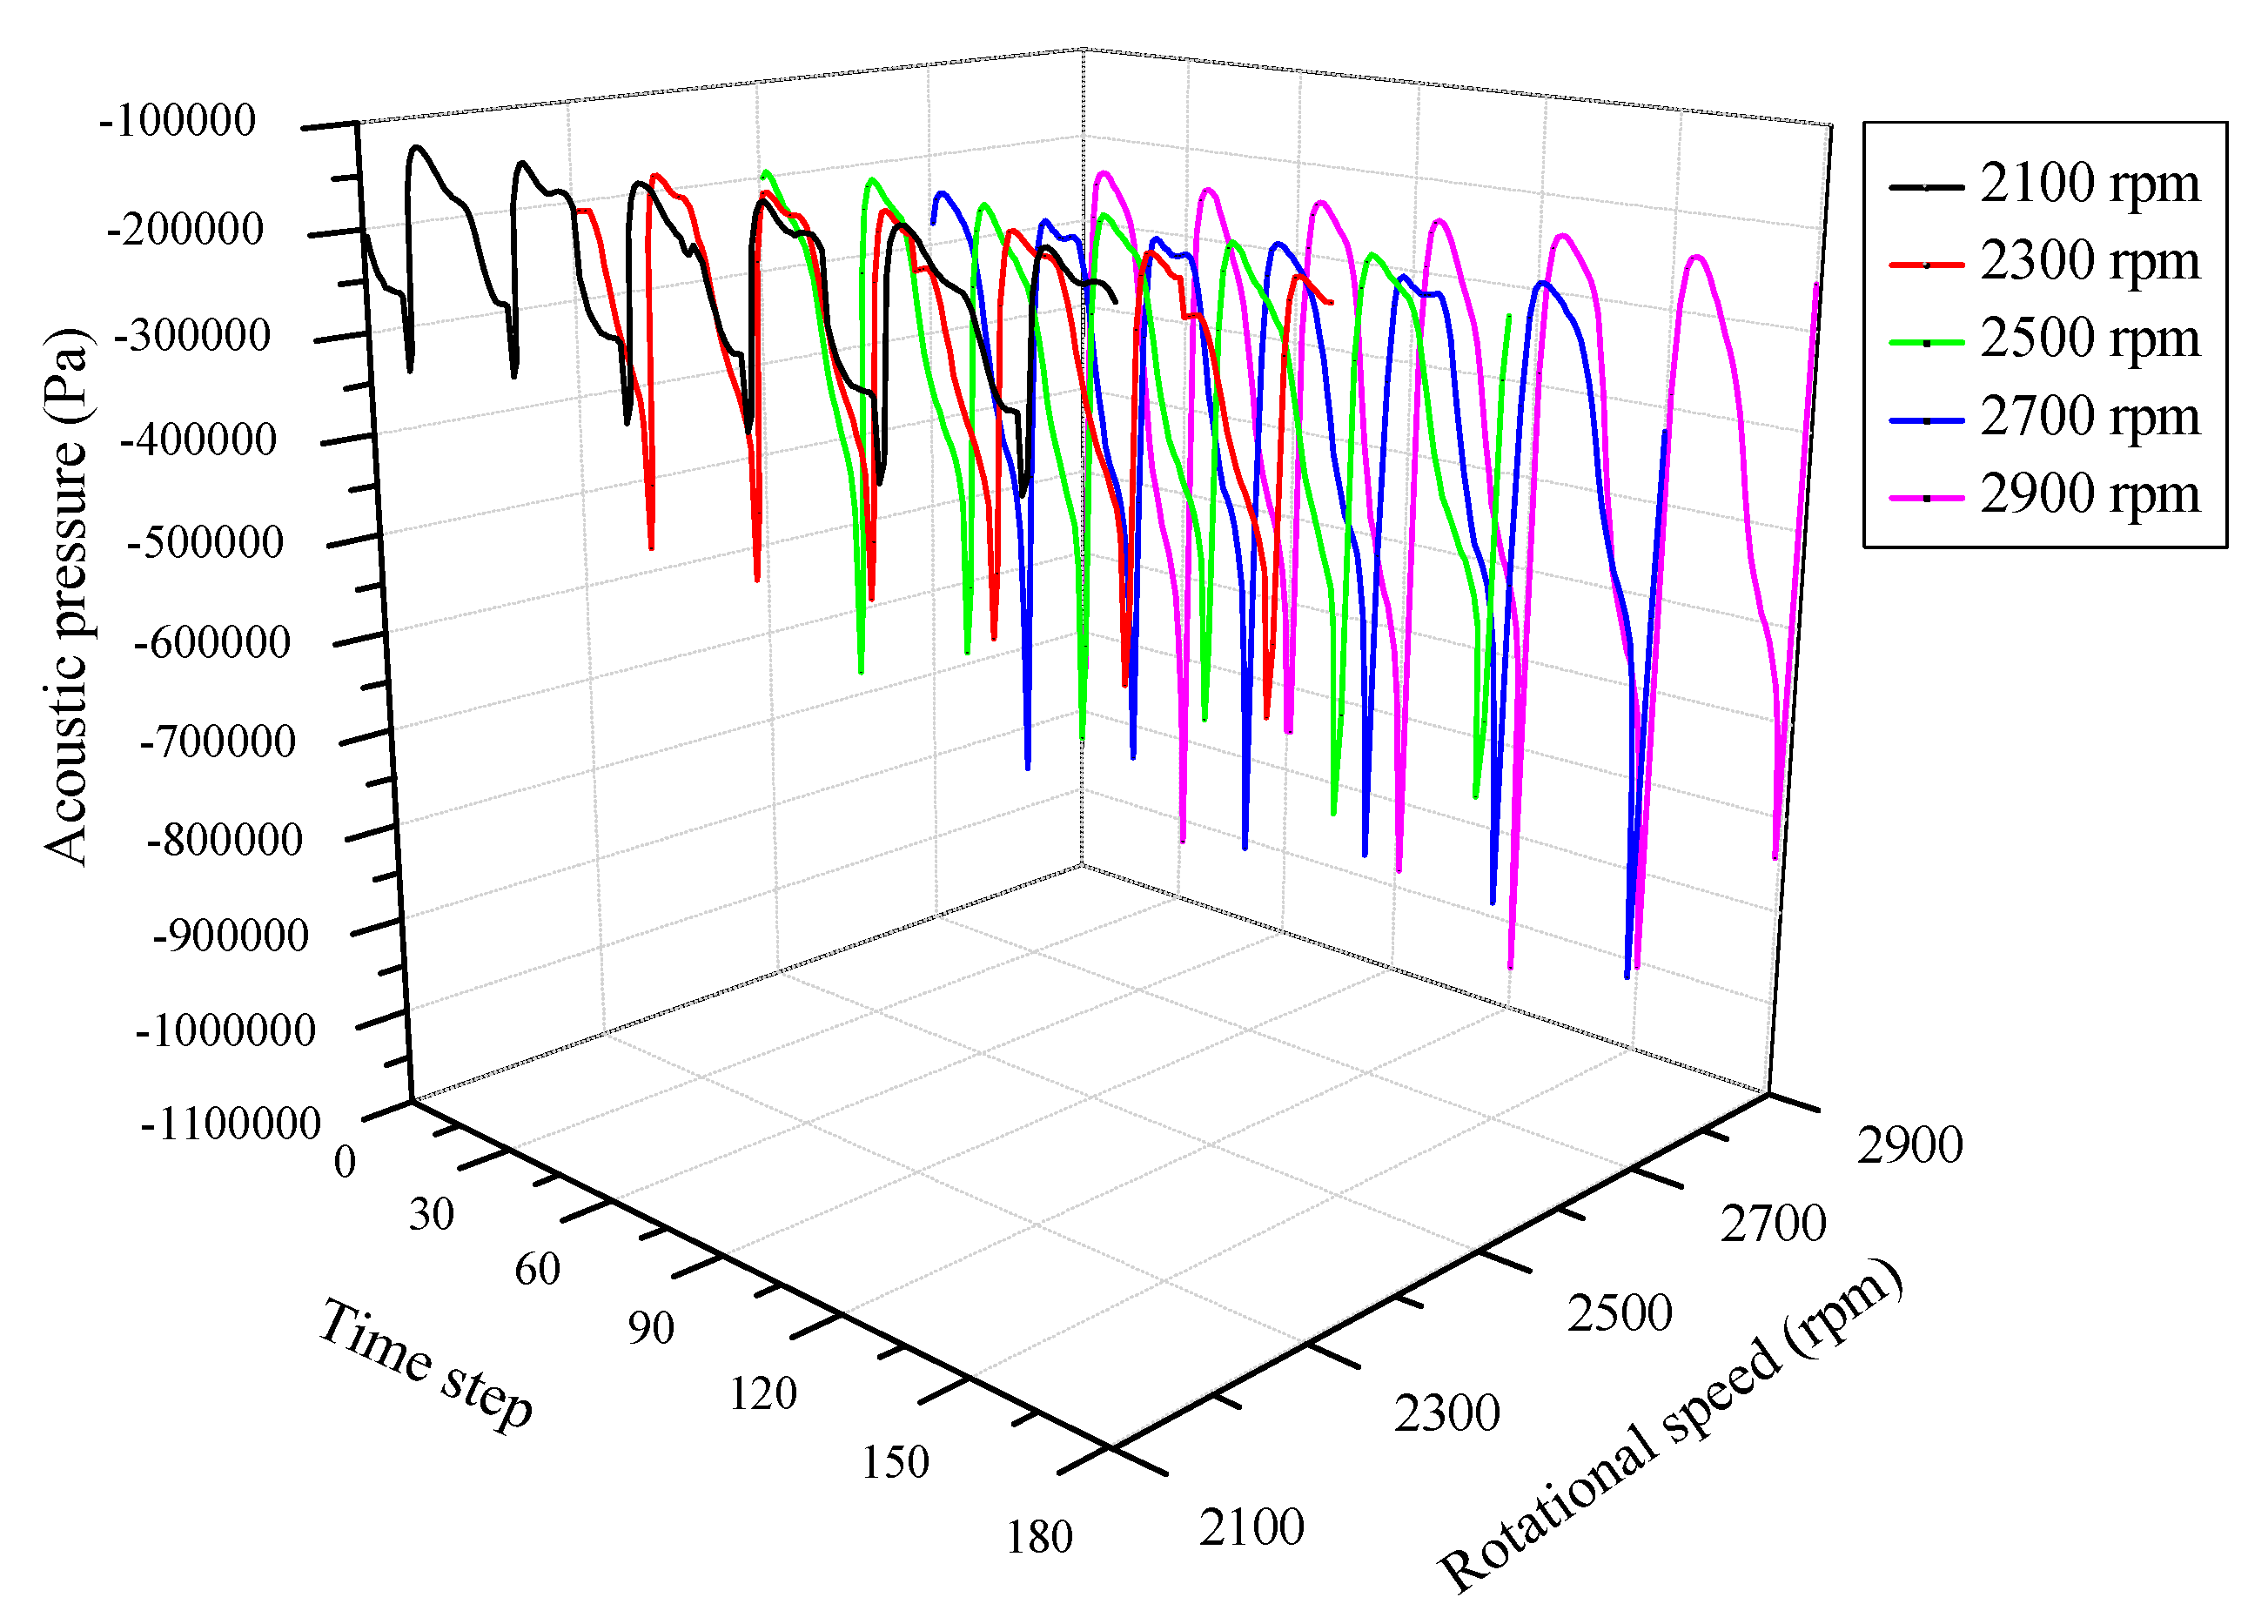
In the centrifugal pump, the acoustic source and acoustic pressure are less than 0 basically, and the minimum value of the two parameters is distributed near the volute tongue. Additionally, the concentration, break, extend, migration and reaggregation phenomena of the minimum acoustic source region exist during the fluid motion process. Specifically, the minimum acoustic source region concentrates on the tongue firstly, then extends and migrates downstream slightly, and aggregates again near the tongue, which leads to the similar evolution characteristics of acoustic pressure. Moreover, the distribution and fluctuation characteristics of the two parameters have little change with increasing rotational speed, while the minimum value of the two parameters decreases and the fluctuation range extends generally. The acoustic source distribution and evolution are the fundamental causes of the acoustic pressure distribution and evolution.
(2)
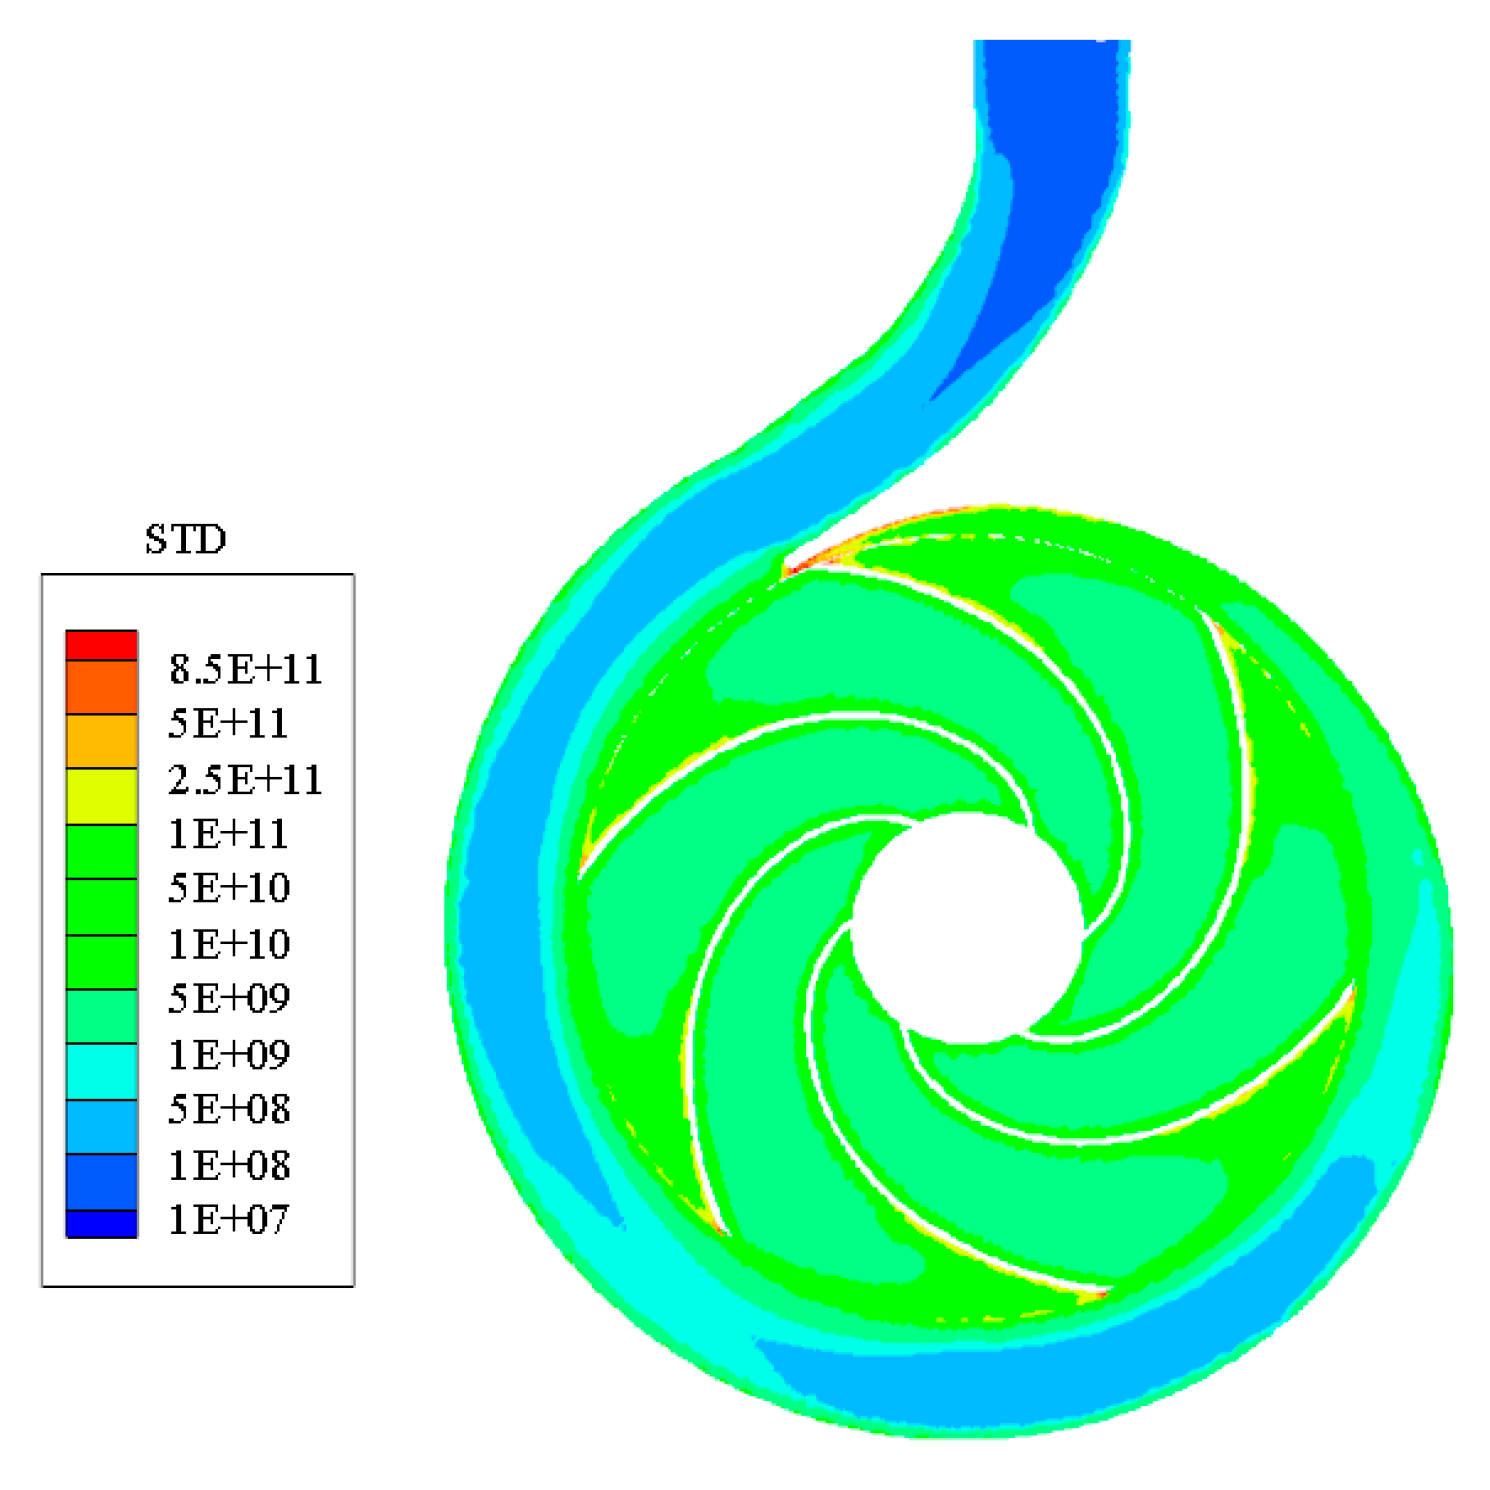
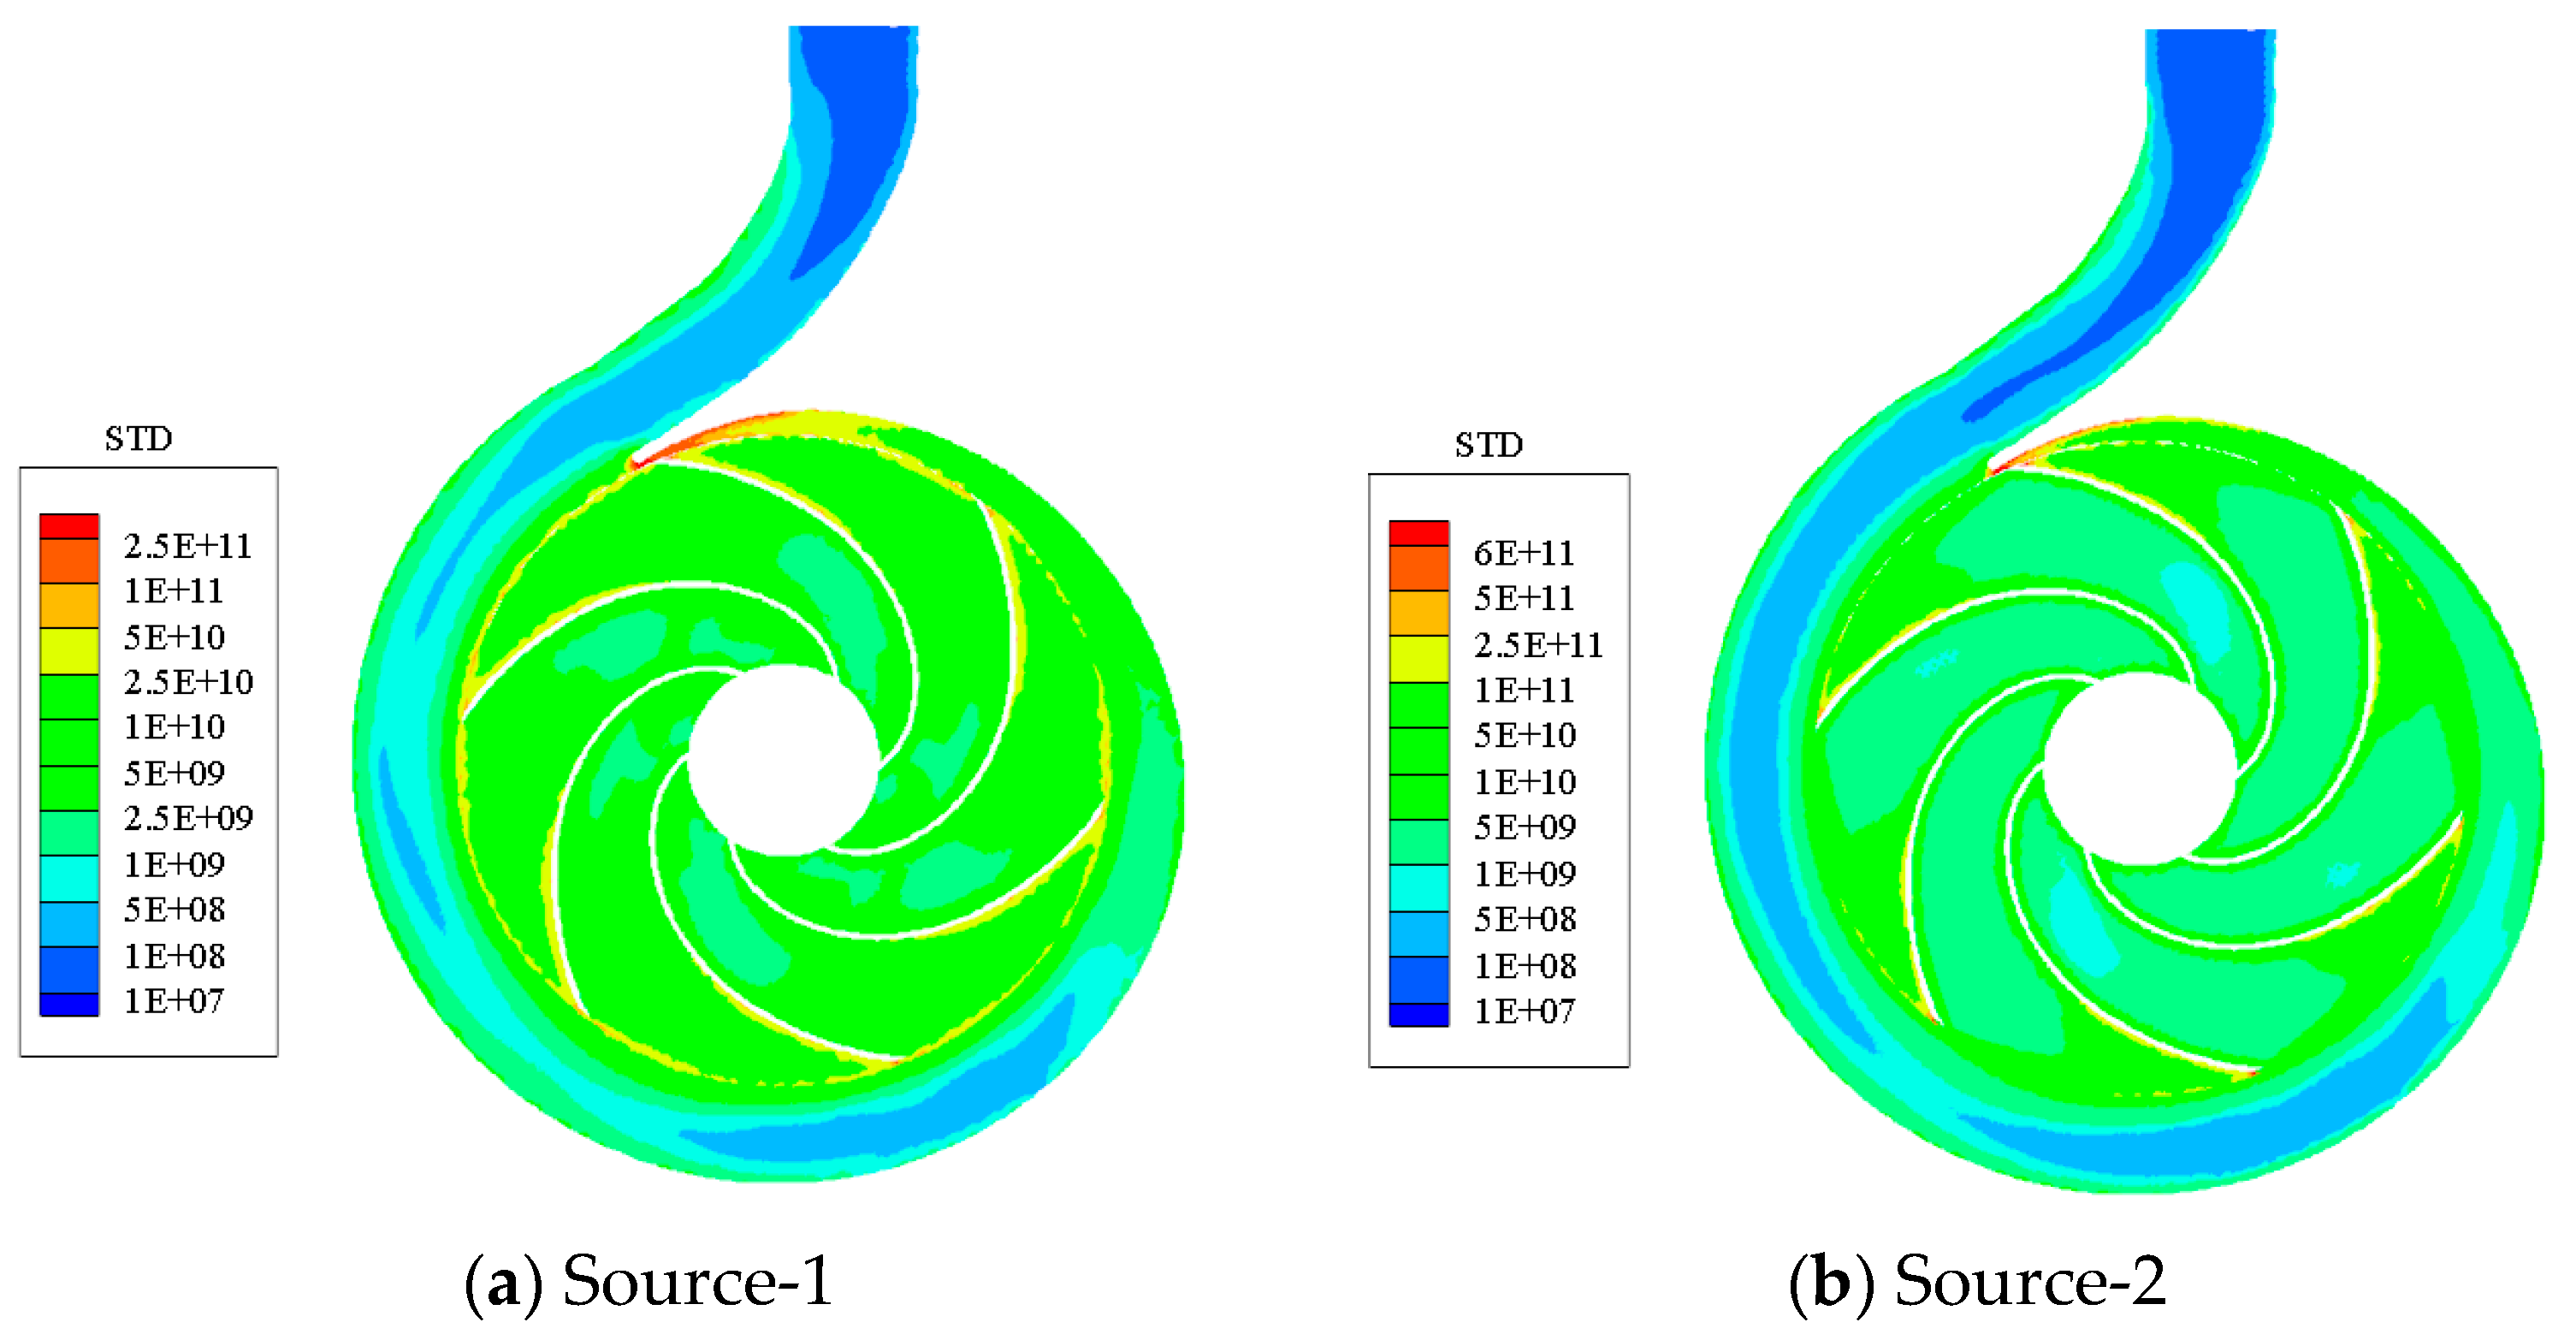
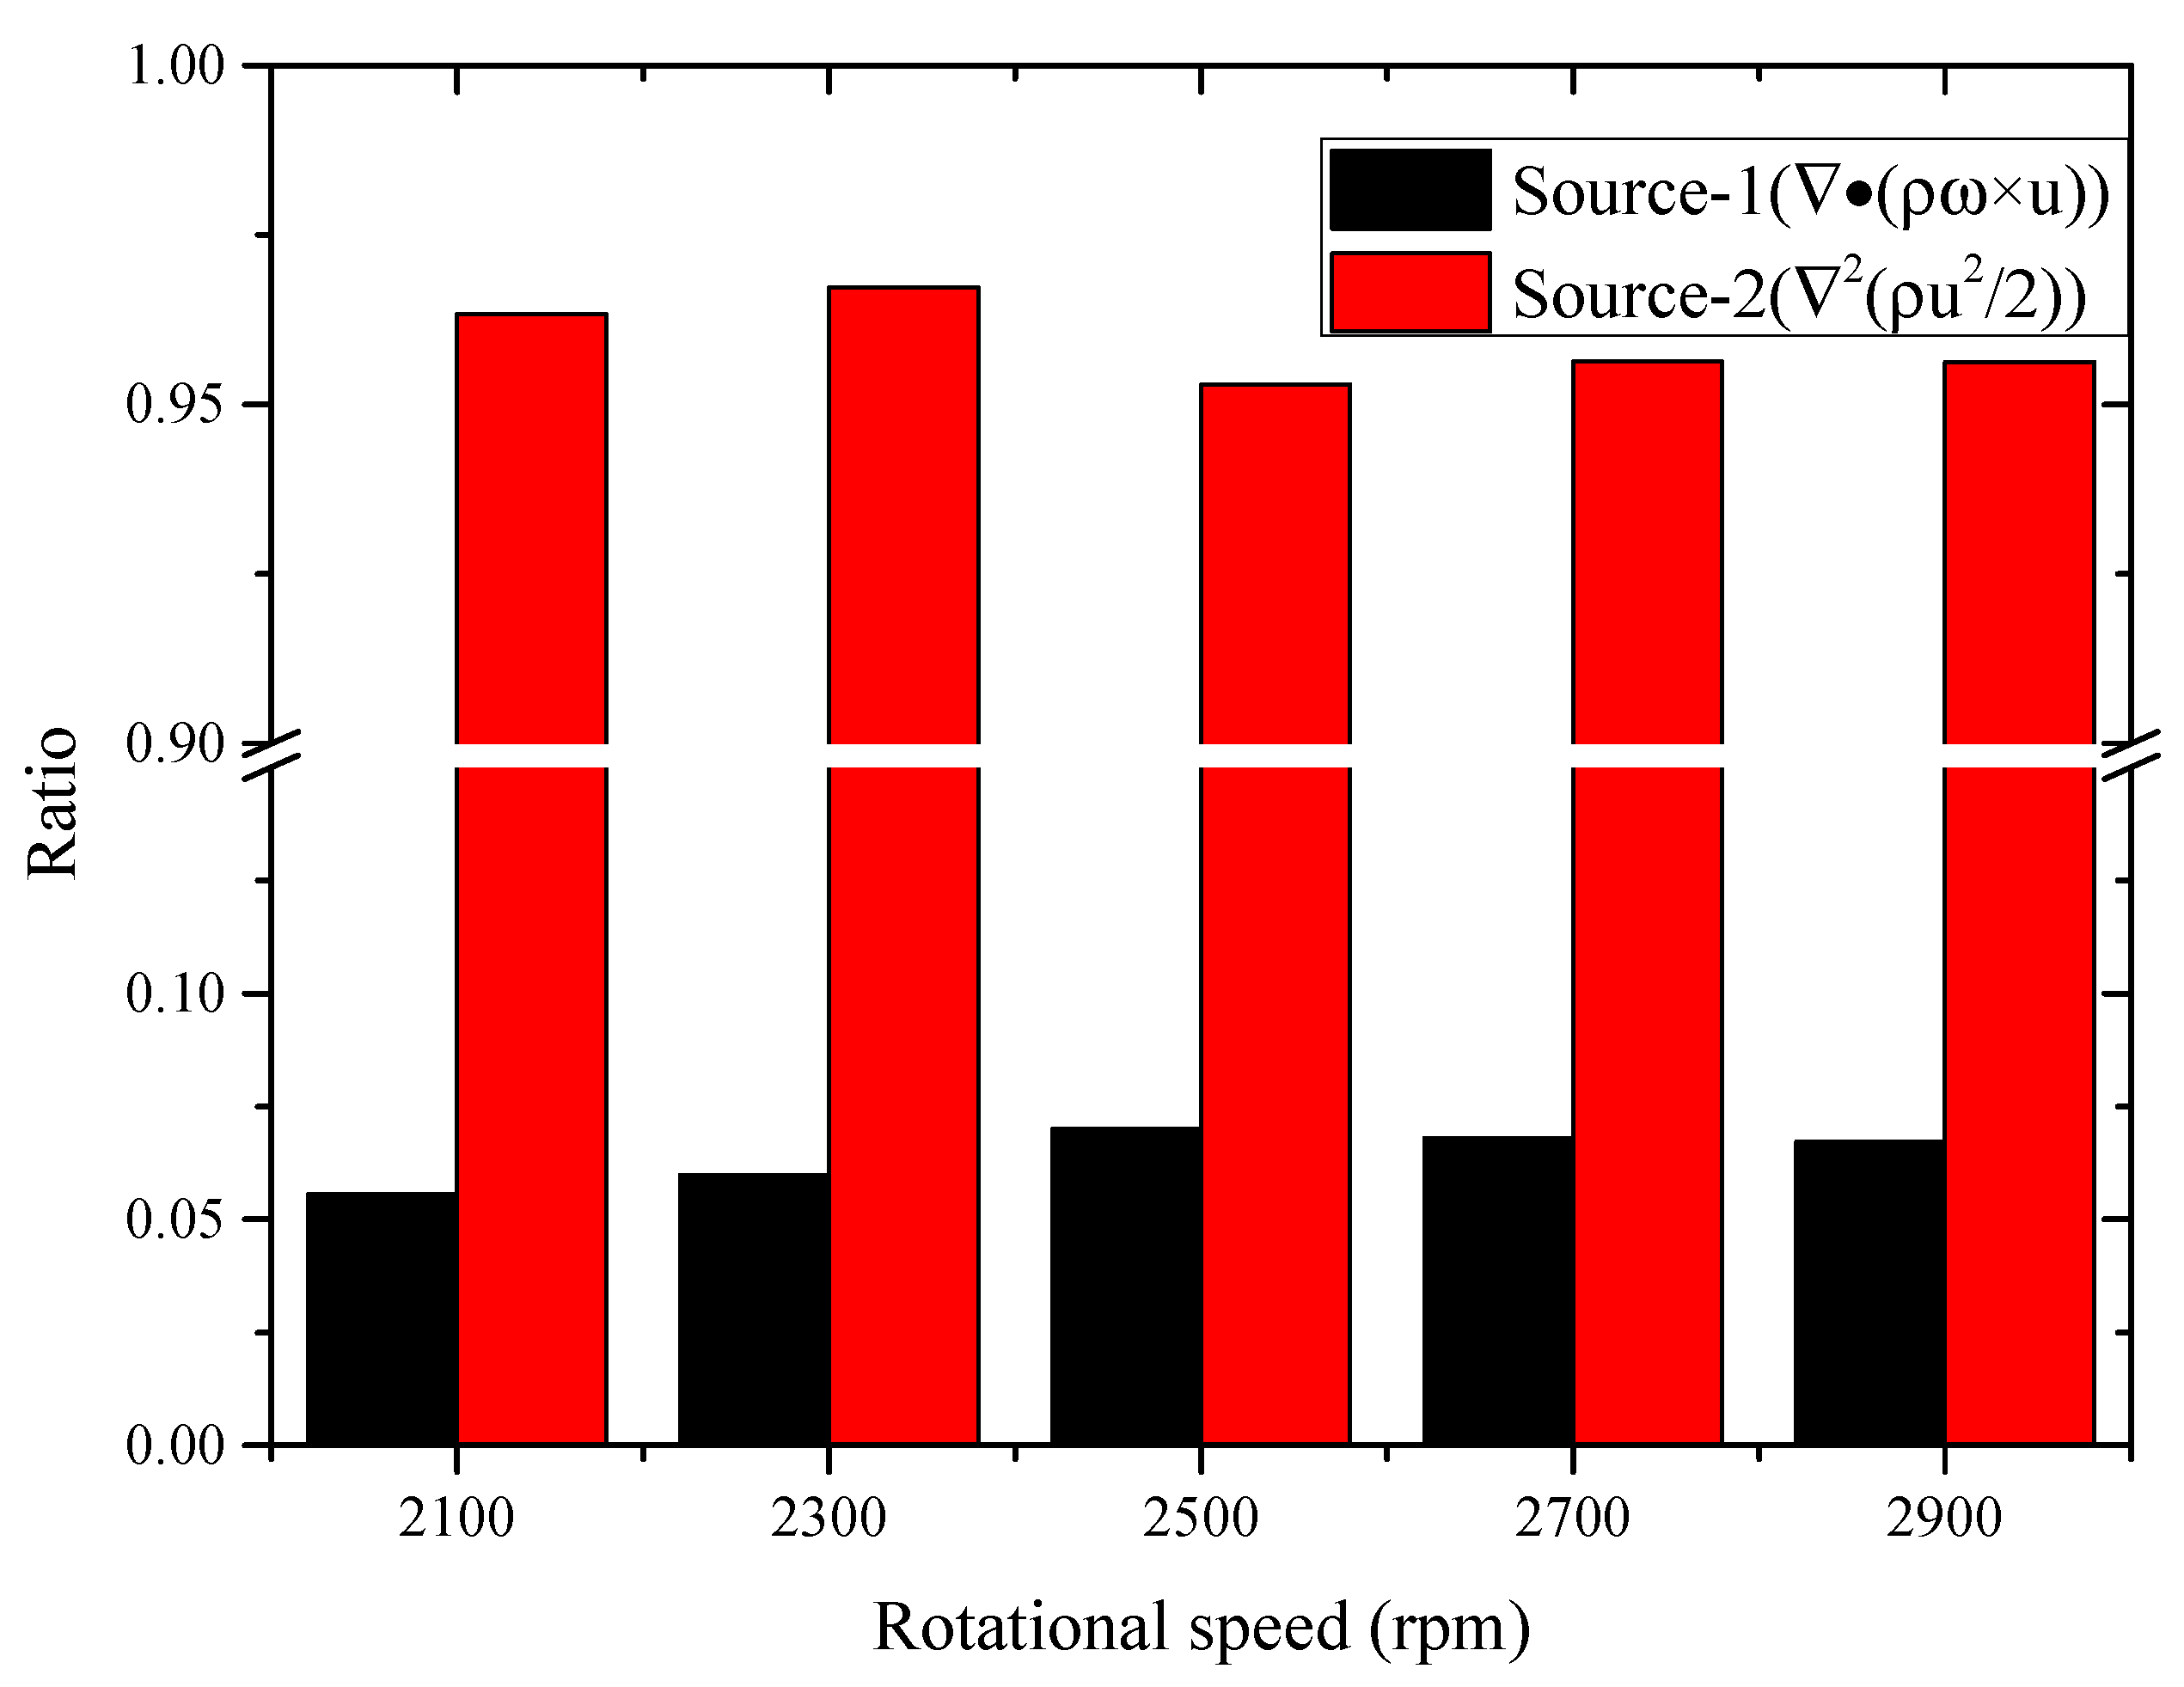
The maximum standard deviation (STD) of acoustic source inside the impeller is located near the pressure side of blade tail, while that inside the volute is located near the volute tongue, which is also the region with the largest STD of the whole pump. Compared with the STD of acoustic source component induced by the stretching of the vortex caused by change of velocity (Source-1), the STD of acoustic source component induced by the non-uniformity of fluid kinetic energy (Source-2) is closer to that of overall acoustic source, which is the main noise source. Take the volute tongue as an example, at different rotational speeds, the STD of Source-1 and Source-2 accounts for about 5% and 95%, respectively, which shows that the change of operation condition has little effect on the proportions of different acoustic source components.
Briefly, the numerical simulation approach is suitable to calculate the parameters of flow and acoustic fields simultaneously, then the generation, distribution and evolution characteristics of acoustic field are revealed. The study lays a foundation to analyze the propagation mechanism of acoustic field in centrifugal pumps.

Author Contributions

C.G. conducted the simulation and experiment, and wrote the manuscript; J.W. and M.G. reviewed and edited the manuscript.

Funding

This research was funded by Key Research and Development Project of Shandong Province, grant number 2019GSF109084 and Young Scholars Program of Shandong University (YSPSDU), No. 2018WLJH73. And the APC was funded by Key Research and Development Project of Shandong Province.

Conflicts of Interest

The authors declare no conflict of interest.

References

  1. Cai, J.; Pan, J.; Guzzomi, A. The flow field in a centrifugal pump with a large tongue gap and back blades. J. Mech. Sci. Technol. 2014, 28, 4455–4464. [Google Scholar] [CrossRef]
  2. Zhang, L.; Zhang, L.; Zhan, Q.; Jiang, K.; Tie, Y.; Wang, S. Effects of the Second-Stage of Rotor with Single Abnormal Blade Angle on Rotating Stall of a Two-Stage Variable Pitch Axial Fan. Energies 2018, 11, 3293. [Google Scholar] [CrossRef]
  3. Xue, R.; Cai, Y.; Fang, X.; Chen, L.; Zhang, X.; Hou, Y. Optimization Study on a Novel High-Speed Oil-Free Centrifugal Water Pump with Hydrodynamic Bearings. Appl. Sci. 2019, 9, 3050. [Google Scholar] [CrossRef]
  4. Dong, R.; Chu, S.; Katz, J. Effect of Modification to Tongue and Impeller Geometry on Unsteady Flow, Pressure Fluctuations, and Noise in a Centrifugal Pump. J. Turbomach. 1997, 119, 506–515. [Google Scholar] [CrossRef]
  5. Rzentkowski, G.; Zbroja, S. Experimental characterization of centrifugal pumps as an acoustic source at the bladde-pasing frequency. J. Fluid Struct. 2000, 14, 529–558. [Google Scholar] [CrossRef]
  6. Guo, C.; Gao, M.; Lu, D.; Wang, K. An Experimental Study on the Radiation Noise Characteristics of a Centrifugal Pump with Various Working Conditions. Energies 2017, 10, 2139. [Google Scholar] [CrossRef]
  7. Guo, C.; Gao, M.; Lu, D.; Guan, H. Experimental Study on Radiation Noise Frequency Characteristics of a Centrifugal Pump with Various Rotational Speeds. Appl. Sci. 2018, 8, 796. [Google Scholar] [CrossRef]
  8. Wang, M.; Freund, J.B.; Lele, S.K. Computational prediction of flow-generated sound. Annu. Rev. Fluid Mech. 2005, 38, 483–512. [Google Scholar] [CrossRef]
  9. Zhang, N.; Shen, H.; Yao, H. Numerical simulation of cavity flow induced noise by LES and FW-H acoustic analogy. J. Hydrodyn. 2010, 22, 242–247. [Google Scholar] [CrossRef]
  10. Jung, S.; Sung, H. Flow structure and flow-induced noise in an axisymmetric cavity with lids. J. Mech. Sci. Technol. 2016, 30, 3229–3241. [Google Scholar] [CrossRef]
  11. Sanghyeon, K.; Cheolung, C.; Warn-Gyu, P. Numerical Investigation into Effects of Viscous Flux Vectors on Hydrofoil Cavitation Flow and Its Radiated Flow Noise. Appl. Sci. 2018, 8, 289. [Google Scholar] [CrossRef]
  12. Wang, K.; Zhang, Z.; Xia, C.; Liu, Z. Experimental investigation of pressure fluctuation, vibration, and noise in a multistage pump. Shock Vib. 2018, 2018, 2784079. [Google Scholar] [CrossRef]
  13. Pang, Q. Influence of Radial Clearance of Pump Chamber on Hydraulic and Noise Performance of Multistage Centrifugal Pump. Master’s Thesis, Jiangsu University, Zhenjiang, China, 2018. [Google Scholar]
  14. Wang, K.; Li, Y.; Liu, H.; Xia, C.; Liu, Z. Numerical simulation for hydrodynamic noise of a multistage centrifugal pump under multi-working condition. J. Vib. Shock 2018, 37, 50–55. [Google Scholar]
  15. Liu, H.; Ding, J.; Dai, H.; Tan, M.; Tang, X. Numerical Research on Hydraulically Generated Vibration and Noise of a Centrifugal Pump Volute with Impeller Outlet Width Variation. Math. Probl. Eng. 2014, 2014, 620389. [Google Scholar] [CrossRef]
  16. Liu, H.; Dai, H.; Ding, J.; Tan, M.; Wang, Y.; Huang, H. Numerical and experimental studies of hydraulic noise induced by surface dipole sources in a centrifugal pump. J. Hydrodyn. 2016, 28, 43–51. [Google Scholar] [CrossRef]
  17. Gao, M.; Dong, P.; Lei, S.; Turan, A. Computational Study of the Noise Radiation in a Centrifugal Pump When Flow Rate Changes. Energies 2017, 10, 221. [Google Scholar] [CrossRef]
  18. Liu, H.; Li, Y.; Wang, K.; Liu, Z. Study on radiated noise characteristics of multistage centrifugal pump under fluid excitation. J. Huazhong Univ. Sci. Technol. 2017, 45, 92–97. [Google Scholar]
  19. Zhang, Q. Fundamentals of Aeroacoustics; National Defense Industry Press: Beijing, China, 2012. [Google Scholar]
  20. Powell, A. Theory of vortex sound. J. Acoust. Soc. Am. 1964, 36, 177–195. [Google Scholar] [CrossRef]
  21. Howe, M.S. Contributions to the theory of aerodynamic sound with application to excess jet noise and the theory of the flute. J. Fluid Mech. 1975, 71, 625–673. [Google Scholar] [CrossRef]
  22. Takaishi, T.; Miyazawa, M.; Kato, C. A computational method of evaluating noncompact sound based on vortex sound theory. J. Acoust. Soc. Am. 2007, 121, 1353–1361. [Google Scholar] [CrossRef]
  23. Schram, C.; Hirschberg, A. Application of vortex sound theory to vortex-pairing noise: Sensitivity to errors in flow data. J. Sound Vib. 2003, 266, 1079–1098. [Google Scholar] [CrossRef]
  24. Liu, Q.; Qi, D.; Tang, H. Computation of aerodynamic noise of centrifugal fan using large eddy simulation approach, acoustic analogy, and vortex sound theory. Proc. Inst. Mech. Eng. Part C J. Mech. Eng. Sci. 2007, 221, 1321–1332. [Google Scholar] [CrossRef]
  25. Ou, Y.; Tian, J.; Wu, Y.; Du, Z. Research of aerodynamic noise source of low speed axial fans based on vortex-sound theory. J. Eng. Therm. 2009, 30, 765–768. [Google Scholar]
  26. Wang, C.; Zhang, T.; Hou, G. Noise Prediction of Submerged Free Jet Based on Theory of Vortex Sound. J. Ship Mech. 2010, 14, 670–677. [Google Scholar]
  27. Cao, Y.; Ke, H.; Lin, Y.; Zeng, M.; Wang, Q. Investigation on the flow noise propagation mechanism in pipelines of shell-and-tube heat exchangers based on synergy principle of flow and sound fields. Appl. Therm. Eng. 2017, 122, 339–349. [Google Scholar] [CrossRef]
  28. Guo, C.; Gao, M.; Wang, J.; Shi, Y.; He, S. The effect of blade outlet angle on the acoustic field distribution characteristics of a centrifugal pump based on Powell vortex sound theory. Appl. Acoust. 2019, 155, 297–308. [Google Scholar] [CrossRef]
  29. Du, G.; Zhu, Z.; Gong, X. Fundamentals of Acoustics; Nanjing University Press: Nanjing, China, 2001. [Google Scholar]
  30. Li, J. The Influence of the Uneven Spaced Stator Cascade on the Flow-Induced Noise Characteristics in a Vaned Centrifugal Pump. Master’s Thesis, Lanzhou University of Technology, Lanzhou, China, 2015. [Google Scholar]
  31. Xuan, L.; Gong, J.; Zhang, W.; Yuan, X. An implicit finite volume method for the acoustic wave equation. J. Harbin Inst. Technol. 2016, 48, 145–149. [Google Scholar]
  32. Zhang, N.; Li, Y.; Wang, Z.; Wang, X.; Zhang, X. Numerical simulation on the flow-induced noise of cavity by LES and Powell vortex sound theory. J. Ship Mech. 2015, 19, 1393–1408. [Google Scholar]
Figure 1. Sketch of the centrifugal pump model.
Applsci 09 05018 g001
Figure 2. Sketch of the centrifugal pump mesh.
Applsci 09 05018 g002
Figure 3. The calculation flow chart of flow and acoustic fields.
Applsci 09 05018 g003
Figure 4. Test loop diagram.
Applsci 09 05018 g004
Figure 5. The Acoustic Pressure Level (APL) distribution characteristics obtained by experiment and simulation.
Applsci 09 05018 g005
Figure 6. The distribution and evolution characteristics of acoustic source.
Applsci 09 05018 g006aApplsci 09 05018 g006b
Figure 7. The standard deviation (STD) distribution characteristics of overall acoustic source.
Applsci 09 05018 g007
Figure 8. The STD distribution characteristics of different acoustic source components.
Applsci 09 05018 g008
Figure 9. The distribution and evolution characteristics of acoustic pressure.
Applsci 09 05018 g009
Figure 10. The distribution characteristics of acoustic source under various rotational speeds.
Applsci 09 05018 g010
Figure 11. The distribution characteristics of STD under various rotational speeds.
Applsci 09 05018 g011
Figure 12. The distribution characteristics of acoustic pressure under various rotational speeds.
Applsci 09 05018 g012aApplsci 09 05018 g012b
Figure 13. The fluctuation characteristics of acoustic source under various rotational speeds.
Applsci 09 05018 g013
Figure 14. The fluctuation characteristics of acoustic pressure under various rotational speeds.
Applsci 09 05018 g014
Figure 15. The fluctuation curves of different acoustic sources at 2900 rpm.
Applsci 09 05018 g015
Figure 16. The STD ratios of different acoustic source components under various rotational speeds.
Applsci 09 05018 g016
Table 1. Model parameters of the centrifugal pump.
ParameterValue
Inlet diameter80 mm
Impeller diameter250 mm
Outlet diameter50 mm
Rated rotating speed2900 rpm
Rated flow rate50 m3/h
Design head80 m
Blade number6
Table 2. Relevant settings of Computational Fluid Dynamics (CFD).
Steady SimulationUnsteady Simulation
Viscous modelk-ε model
Motion typeMoving Reference FrameMoving Mesh
InletVelocity inlet
OutletOutflow
WallsNo slip boundary conditions
Pressure-velocity coupling algorithmSIMPLE
Discretization principleSecond order upwind
Table 3. Performance characteristics of apparatuses.
ApparatusTypeRangeAccuracy or Sensitivity
HydrophoneDHP850120–20 kHz−210 dB (sensitivity)
±1.5 dB (accuracy)
USB switch///
Noise analysis software///
Flow meterSLDG-8000–100 m3/h0.2%
(accuracy)
Table 4. The deviation of flow-induced noise obtained by experiment and simulation.
Rotational Speed (rpm)Flow-Induced NoiseExperiment (dB)Simulation (dB)Deviation (%)
2100APL (fb)150.55142.66−5.24%
APL (2fb)120.56117.67−2.40%
TAPL171.18169.22−1.15%
2500APL (fb)150160.356.90%
APL (2fb)131.13126.24−3.73%
TAPL174.48172.07−1.38%
2900APL (fb)152156.332.85%
APL (2fb)136.41135.13−0.94%
TAPL181.82180.57−0.69%
Note: fb represents the blade-passing frequency.

