2. Three-Dimensional Visualization Methods for Radiologists
The rendering of two-dimensional images is discussed as a possible solution to this issue [
1,
13]. Namely, cross-sectional images can be fused into a three-dimensional representation of data, for instance, in virtual reality (VR) [
14,
15], augmented reality (AR) [
15,
16], on stereoscopic displays [
17,
18], or on volumetric displays [
19,
20].
With the advent of modern imaging technologies, it was quickly apparent that traditional visualization methods do not facilitate visual search through vast datasets. The increasing demand for high-quality three-dimensional images in radiology was comprehensively outlined in the review by Andriole et al. [
1]. This review pointed out that three-dimensional visualization systems, some of which were broadly implemented in the entertainment and gaming industries, had great potential to both display complex results from medical imaging examinations, such as computer tomography and magnetic resonance imaging results, and enhance the ergonomics of radiologists, in terms of the visualization and navigation through overwhelmingly large datasets.
In this regard, the stereoscopic visualization of information has been one of the earliest proposed approaches. More than ten years ago, improved diagnostic accuracy was experimentally proven in digital mammography when stereoscopic displays were employed, compared to standard ones [
17]. However, since then, the method has not been adapted in a clinical environment, and its benefits have been further studied in recent work [
18]. Recently, the possible implementation of mobile stereoscopic systems (VR and AR) was discussed for education and training in diagnostic and interventional radiology [
15], however, further confirmatory studies are required to prove the efficiency of the proposed methods. The first experimental assessment of VR’s implementation in diagnostic radiology was conducted by Nguen et al. [
14]. As no significant differences were demonstrated in lung nodule detection sensitivity, the findings indicated that the VR system might be as suitable as a traditional radiology monitor in the case of the detection of lung nodules. However, most radiologists reported the presence of physical and mental stress due to the VR system. The prolonged use of stereoscopic displays provokes discomfort, which occurs due to the mismatch between accommodation and vergence [
21]. It is believed that the symptoms related to stereoscopic viewing can be eliminated in the foreseeable future by improving the resolution and sampling rate of the visualization system [
14] or by utilizing a multifocal architecture for the optical element, which has originally been applied in volumetric displays within a wearable display [
22]. With improvements in viewing conditions, stereoscopic visualization is expected to become acceptable for long-term use on a daily basis for the purpose of medical image reading.
Compared with the stereoscopic visualization approach, the volumetric visualization of information is considerably less studied in terms of its possible application in the three-dimensional visualization of complex medical information. In contrast to stereoscopic viewing, for which the three-dimensional image rendering is required to be computed separately for each eye, the volumetric visualization system provides both eyes with the entire image. As a result, the accommodation and vergence are stimulated in a manner, which mimics natural viewing conditions [
23], and no discomfort is experienced [
21]. The capability of volumetric imaging systems to be implemented in medical diagnostics was highlighted recently [
20], however, no results of professional users’ performance have been reported.
We believe that three-dimensional visualization systems can be used extensively in medicine. There is a wide range of potential applications, including teaching anatomy, facilitating visual search through multi-slice images, and communicating with patients [
24]. Successful implementation will require the exact customization of visualization and navigation through images, depending on the specific requirements of users [
24]. However, to the best of our knowledge, the comparative assessment of radiologists’ performance and image viewing preferences depending on their professional search experience has not yet been performed for real three-dimensional images. The understanding of perceptual and interaction processes is of great importance when predicting the user acceptance of new displays [
25].
3. Ergonomic Evaluation of Visualization Methods
The ergonomic evaluation of new visualization methods requires the consideration of different factors that may influence user performance, such as physical properties of visual stimuli [
25] and expertise in particular visual tasks [
26]. Radiologists read approximately several hundred medical images per day [
1,
5], and the majority of their professional tasks can be defined as visual search tasks [
27]. Radiologists search for anatomical abnormalities with different physical properties, such as shape, size, contrast and wall thickness. The visual search of radiologists is regularly challenged due to the physical similarity of lesions compared to nearby normal structures. For instance, in lung cancer screening, spherical lung nodules look similar to tubular vessels in a cross-section [
1], and may be occluded by the ribs [
5]. Therefore, true three-dimensional visualization of multi-slice images is expected to facilitate visual search by providing radiologists with the opportunity to see the entire view of the anatomical structure and separate different image elements in physical space.
Extensive training leads to the increased tuning of visual perception [
28] and changes in search strategy which radiologists implement during image reading [
29]. Most previous studies have demonstrated the strong top-down influence of expertise when comparing the performance of radiologists and non-radiologists viewing medical images [
29,
30,
31,
32,
33]. In addition, the tracking of brain activity revealed significant differences among radiologists and non-radiologists, not only for radiology-related images, but also for control images [
34]. As a result, researchers hypothesized that radiology expertise could change visual processing in general. However, the investigation of perceptual processes for edited medical images [
35,
36] and non-medical search items [
28,
32,
37,
38,
39,
40] clarified that the superior skills of radiologists were shown only in the presence of specific physical properties of visual stimulus. Namely, considerable differences were revealed in the temporal aspects of task outcome when low contrast stimuli were employed [
28,
35], suggesting that contrast sensitivity might be enhanced in radiologists. Therefore, one can expect differences in the performance of radiologists when not only viewing domain-specific images, but also domain-general images.
The ability of experienced radiologists to engage in the global processing of the entire image is another piece of evidence for their tuned visual perception. Namely, experts can process large regions of the image in parallel using their parafoveal and/or peripheral vision [
41]. The psychophysical assessment of perceptual expertise has revealed that experienced radiologists can quickly extract the relevant information from the complete visual scene, guiding their selective visual attention efficiently, and further conducting a more organized visual search when compared to their less-experienced colleagues. However, in reality, the opportunity for global processing has been lost when displaying multi-slice images on flat-panel displays. Three-dimensional visualization methods may permit radiologists to recapture the opportunity to develop a comprehensive view before examining in detail.
In addition to visual performance, another important aspect of ergonomic evaluation is the interaction technique that users implement when viewing images on a display. The interaction technique of radiologists was broadly assessed in the context of testing new radiology workstations [
39,
42], studying effective search strategies for multi-slice computer tomography viewing [
2,
33,
43], and studying the cognitive processes of radiologists during medical image reading [
44,
45]. With the advent of multi-slice images, researchers mostly investigated how radiologists manipulated images in the z-direction, the feature which sharply distinguishes the new type of images from two-dimensional ones. The specific search patterns were not associated with the search outcome and the amount of professional search experience [
2,
33], however, in general, experienced radiologists showed a more organized interaction behavior compared to naïve observers, who made many direction changes when searching through multi-slice images on flat-panel displays [
43].
The emergence of new visualization systems in radiology changes the way radiologists conduct visual searches [
1,
2] and affects radiology education [
15]. Whereas three-dimensional visualization systems are expected to be used extensively for professional purposes in medicine, most research into search strategies when viewing multi-slice images are conducted for flat-panel displays (e.g., [
2,
43,
45]). Further investigation of image manipulation techniques is required to maximize the usability of new three-dimensional displays for specific users. It should be noted that the image manipulations and search strategies were not assessed in recent studies where radiologists with different amounts of professional experience inspected three-dimensional images [
14,
18]. Thus, it remains unclear what image manipulation strategies radiologists implement when searching through real three-dimensional images in practice. The analysis of human-computer interaction can provide us with valuable insight into user specifics and technical requirements for new displays and imaging devices, on which all parts of the spatial image can be presented simultaneously.
This study was a part of the research project “3D volumetric screen and the functionality of the visual system”. Its main aim was to perform an ergonomic evaluation of three-dimensional visualization systems and explore how individuals with different amounts of professional search experience perform three-dimensional visual tasks with a controlled variety of stimulus physical properties. Our work highlights that professional experience and stimulus physical properties should be considered when planning the implementation of new three-dimensional visualization workstations and evaluating user performance.
4. Materials and Methods
4.1. Participants
We recruited 47 individuals for participation in this study. Participants were divided into three groups based on their level of expertise in radiology. The first group consisted of 10 qualified radiologists who were employed by large hospitals in Riga, the capital of Latvia. On average, these participants had 22 years of work experience in radiology, ranging from 6 to 33 years. The second group consisted of 13 residents who had started their residency program at least one year prior to the experiment. On average, they had 3 years of work experience in radiology, ranging from 1 to 4 years. The third group consisted of 24 medical students who had no practical experience in radiology. The sample size was constrained by the number of available participants. To assure sufficient visual discrimination abilities when viewing visual stimuli on the volumetric display within the experimental setup, we assessed near visual functions prior to the experiment. The participants’ inclusion criteria were the following: Normal or corrected-to-normal visual acuity, no binocular vision dysfunctions, stereoacuity of 100 s of arc or better (checked with a Titmus stereotest, Stereo Optical Co., Chicago, IL, USA). None of the participants reported having working experience with the volumetric display before the experiment.
4.2. Ethics Statement
The study was approved by the Ethics Committee of the University of Latvia (ZD2017/20467) and was conducted in accordance with the principles embodied in the Declaration of Helsinki Code of Ethics of the World Medical Association. All participants were unaware of the specific aims and methods of the study. They agreed to volunteer and gave informed consent.
4.3. Experimental Setup
To provide participants with a three-dimensional presentation of information, the visual stimuli were demonstrated on the volumetric multi-plane display (model x1406), produced by LightSpace Technologies. The major components of the volumetric display are the high-speed projector and the multi-plane optical element [
46]. The optical element is a stack of twenty air-spaced planes, containing liquid crystal diffusers which are electrically switchable between light scattering and transparent modes. The width of one plane was 1.1 mm. The distance between two sequential planes was 5.0 mm. To produce the three-dimensional image, the two-dimensional images were projected on the diffuser elements, which were consecutively switched off with a refresh rate of 60 Hz. The effect of a three-dimensional image was thus produced by demonstrating two-dimensional images in different locations within the display at a high rate. The resolution of the display was 1024 × 768 pixels (X, Y) per layer, providing a volumetric resolution of 15 million voxels. The length and width of each plane was 39.5 × 29.5 cm.
The participants sat in front of the display at a viewing distance of 60 cm from the frontal surface of the display, with a keyboard in their hands, allowing them to submit their answers and perform image manipulations. The experiment was completed in a dimly lit room.
4.4. Visual Stimuli
Medical images contain a high variability of physical properties and image artifacts, which altogether lead to distracted visual attention [
47]. Moreover, the semantic context of medical images may mask the effect of the physical properties of the display and visual stimulus [
25]. Taking into account this consideration, we chose to evaluate the influence of stimulus physical properties and the three-dimensional representation of visual information without the semantic context of medical images. Thus, we could ensure that the search items were identifiable by experienced and early-career radiologists, as well as non-radiologists, under controlled viewing conditions, as was previously conducted on flat-panel displays [
26,
39].
The detection of small spherical lung nodules is considered to be one of the most challenging and important tasks frequently performed by radiologists [
14]. Inspired by the appearance of lung nodules, which are frequently missed due to their physical similarity when compared with pulmonary blood vessels in a cross-section, we designed a visual search array consisting of bright circles of a constant angular size on a dark background. The outer diameter was 0.5°, and the inner diameter was 0.4°. The luminance of stimuli was 21 cd/m
2 (measured with the Photo Research spectroradiometer PR-655). The background luminance was 0.6 cd/m
2. In the beginning of the visual search task, the circles were distributed among ten consequent display planes. The target differed from other search items (distractors) with its line width, which was larger in the direction of the circle’s center. Based on previous studies investigating the role of peripheral vision in search performance, differences in this target feature were expected to affect visual processing [
48] and search time [
49,
50]. Visual search tasks without semantic context are considered to be more sensitive to visual degradation effects compared to the ones that simulate usual activities [
25]. Thus, we had an opportunity to test whether the slight changes of the target feature were visible to medical professionals and students on the volumetric display.
The central part of each display plane (4.75° × 4.75°) was divided into an invisible grid of 5 × 5 equal cells. The search items were randomly assigned to these cells according to the set size, with no items sharing the same points. In order to avoid misconceptions, the target item could not intersect the vertical or horizontal meridian of the display planes (where the borders of the invisible grid were formed), but the distractors were allowed to be demonstrated there. In the z-direction, the target was located in any of the 6th to 10th slices of the three-dimensional image. The slices on the closest planes of the volumetric display did not contain the target item, in order to avoid the pop-out effect due to the depth component [
51].
In order to study how the physical properties of visual information affect visual search outcomes and image manipulation, we varied the target conspicuity and amount of visual information in the search tasks by employing the target-distractor similarity and set size as controlled variables. In the test session, the set size could be two or four search items per each display plane, which resulted in 20 or 40 items per trial. The target-distractor similarity could be high or low, with an increased line thickness of 15% or 25% towards the center of the circle, respectively.
4.5. Experimental Procedure
Due to mesopic viewing conditions, a short visual adaptation preceded the experiment when the participant sat in a dimly lit room and was not permitted to look at any additional light sources such as a mobile phone. At the same time, the participant was introduced to the experimental procedure and received oral instructions about the search task. Then, the practice session followed. It included three search trials with 40 stimuli on ten display planes and a 30% difference in line thickness, comparing the target and distractors. In the practice session, the participants learned to distinguish the target on the display and navigate. The experiment operator answered participant’s questions if required and provided feedback. The results of the practice session were not included in the further analysis.
Before each trial, a fixation cross appeared for one second in the center of the closest plane. The participants were instructed to focus their gaze on the cross. Afterwards, the circles appeared on the screen and the visual search task began. The instructions asked the participant to find the target accurately and quickly.
4.6. Experimental Design
We were interested in exploring how radiologists adapted their search performance to the simultaneous viewing of multiple image slices in a three-dimensional way, depending on their professional search experience and the physical properties of the visual information. For this reason, we studied how participants manipulated and searched through images in the z-direction. The search items were presented on the display planes either closer to or further from the participant by using the keyboard’s up and down arrow keys. In clinical practice, radiologists use different conventional devices for navigation, for instance, keyboards, computer mice, and joysticks, but the navigation approach varies between viewers. Similar to Drew et al. [
2], we have chosen to employ the computer keyboard for the navigation because we aimed to describe the search strategy and viewing preferences in a quantitative manner, and discrete keyboard arrow clicks allowed us to reduce the noise of occasional movements.
When the up arrow key was pressed once, all circles “moved” one display plane closer to the participant, except the one that was on the first layer before this action, which temporarily disappeared. When the participant preferred to return the circles on the screen to their original position, he pressed the down arrow key, and the circles “moved” one plane further from him. Thus, each discrete keyboard click corresponded to a change in image location between planes. By recording the sequence of slice changes, we were able to follow the image manipulation to form the search pattern in the z-direction that participants implemented when viewing the stimulus on the volumetric display. Herein, the described change of stimuli location within the optical element of the display is referred to as image manipulation. The constant angular size of the stimuli and relative location on the display planes was met at all times. We employed a free-navigation mode to allow participants to choose if they wanted to manipulate images during the visual search when all visual information was presented on the display.
When the participant distinguished the target item, they pressed a space bar to finish the visual search task. Then, a choice was provided, consisting of four options to describe the relative location of the found target (i.e., the 4-alternative forced-choice procedure). The participant submitted his answer by pressing the number key corresponding to the quadrant (formed by the previously described invisible grid) in which he detected the target item on the display (i.e., top left, top right, bottom left, bottom right). The fixation cross was shown immediately afterwards, and the participant continued to the next trial. In the test session, five trials were given for each combination of controlled variables, resulting in twenty trials per participant after the practice session.
4.7. Data Analysis
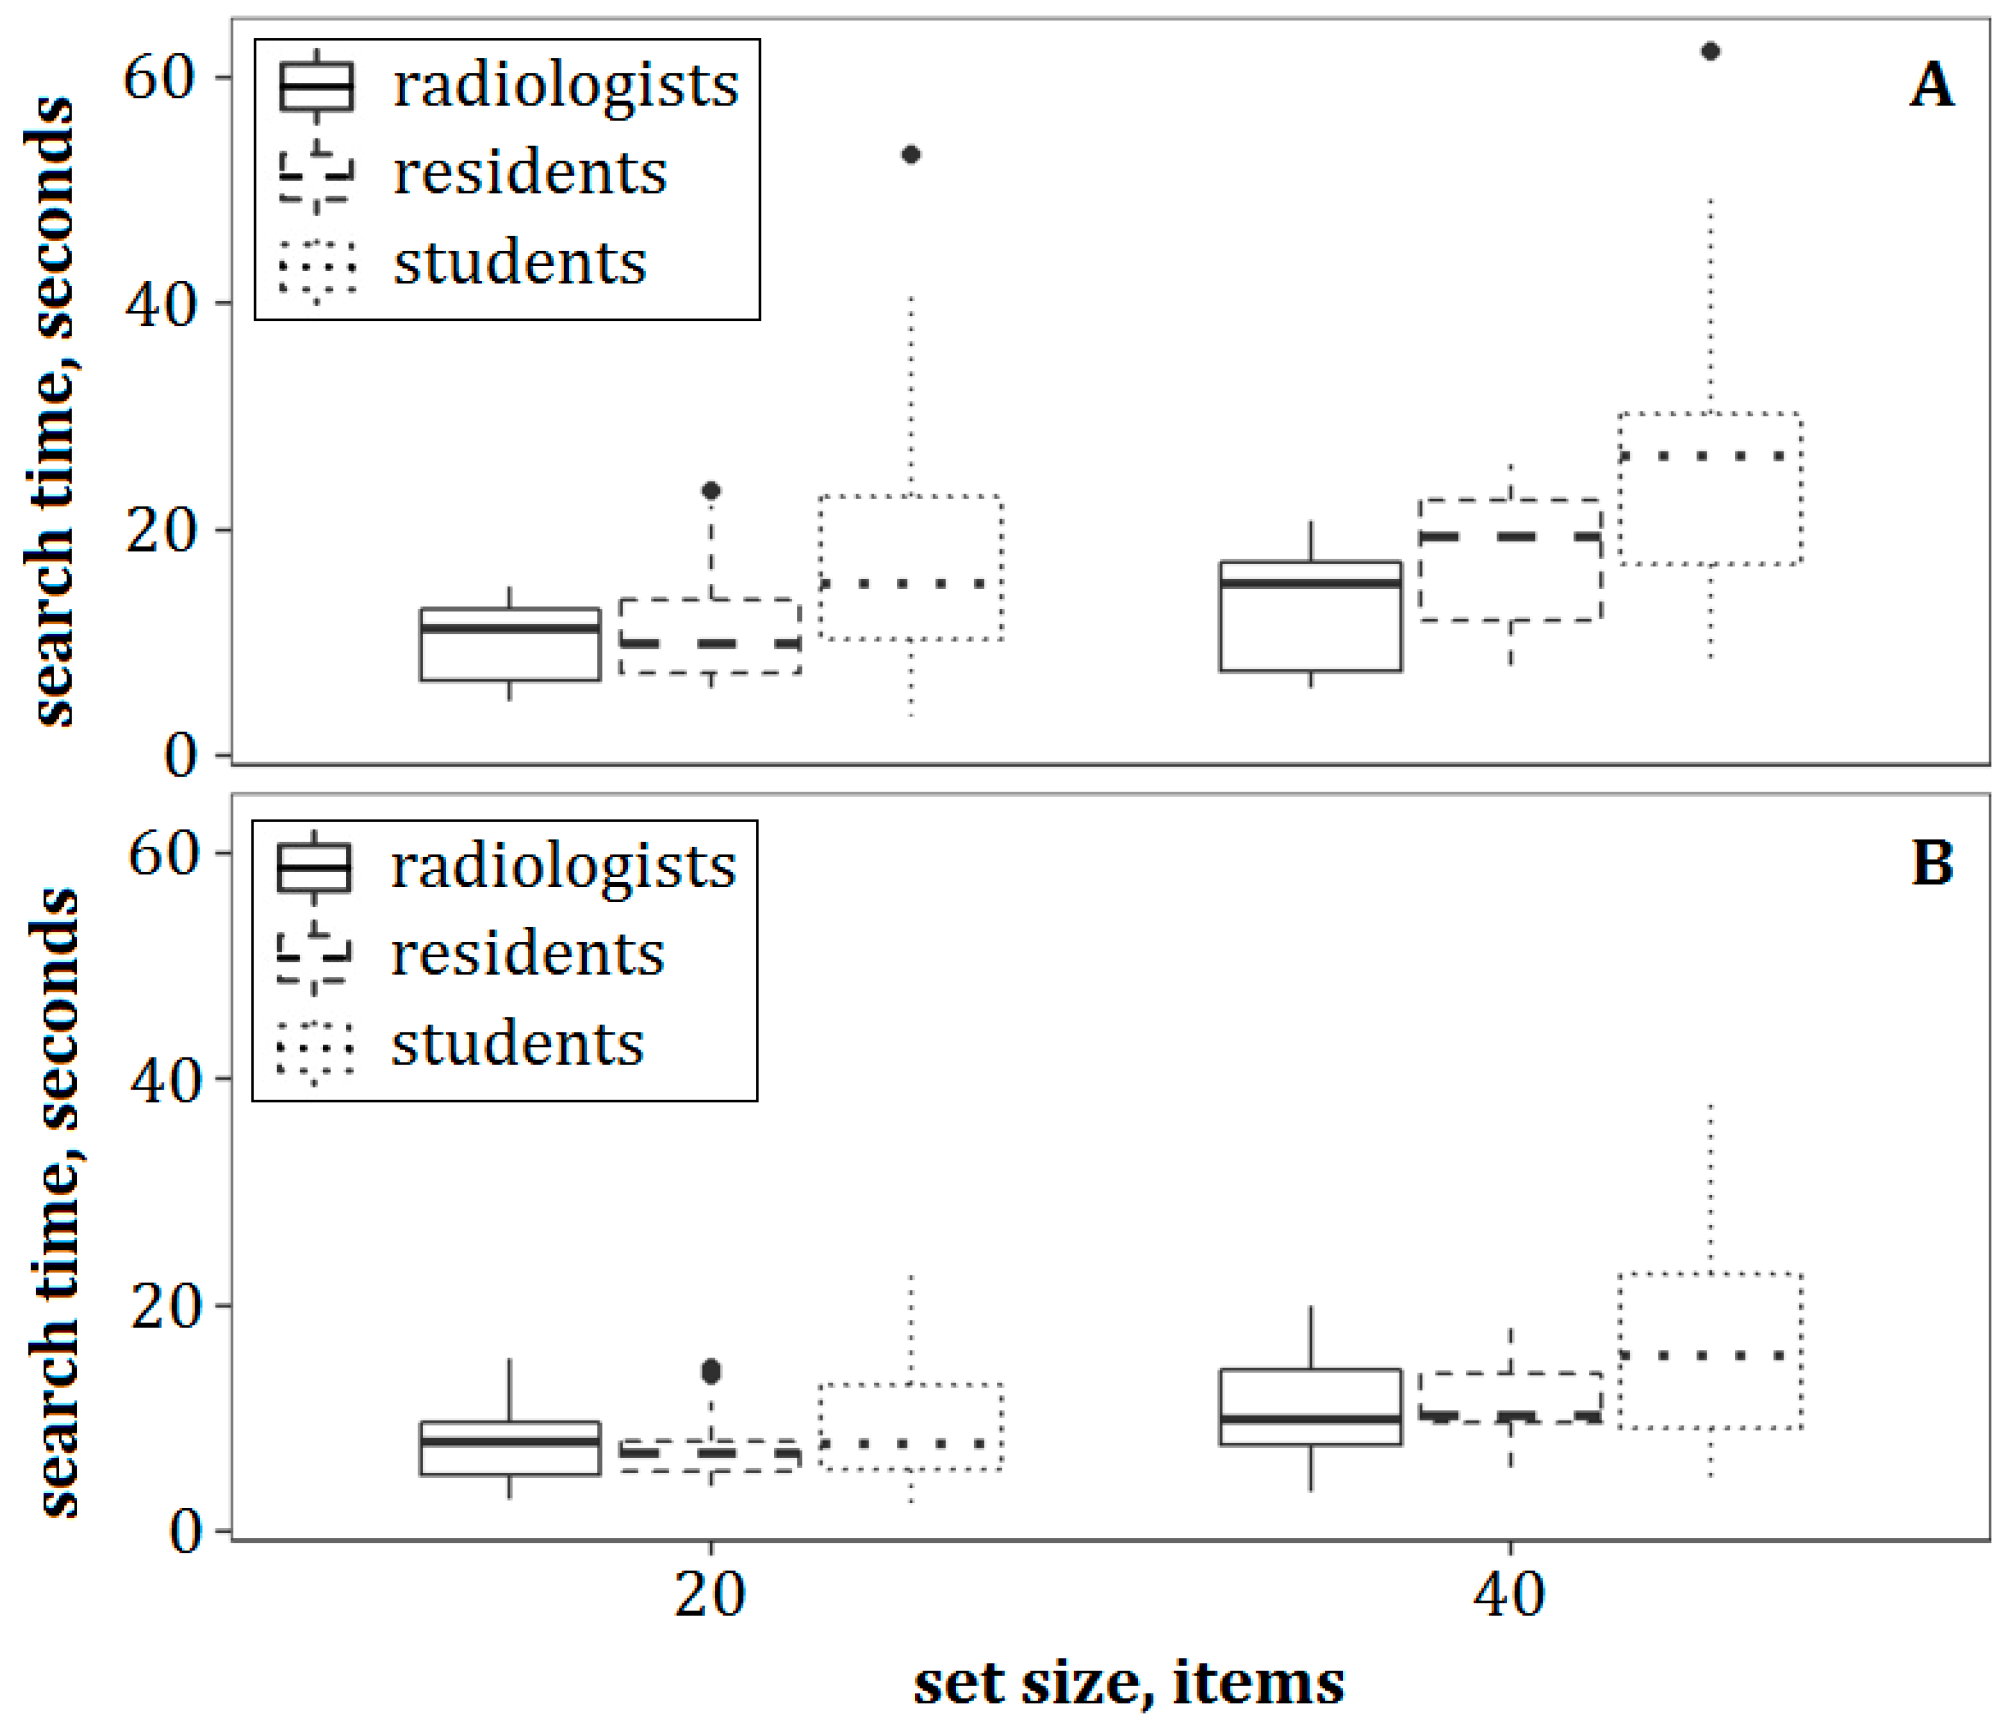
The search task was considered to be completed correctly if the target’s corresponding quadrant was chosen. Thus, for all trials, the data of true-false responses (in the form of a 1 or 0) were recorded. The participants’ visual search outcome was the number of correct responses and had a range of 0 (i.e., no correctly completed tasks) to 5 (i.e., all tasks correctly completed), with intervals of 1 for each combination of the physical variables. The search time was calculated as the time starting from the initial demonstration of search items on the volumetric display until the space button was pressed.
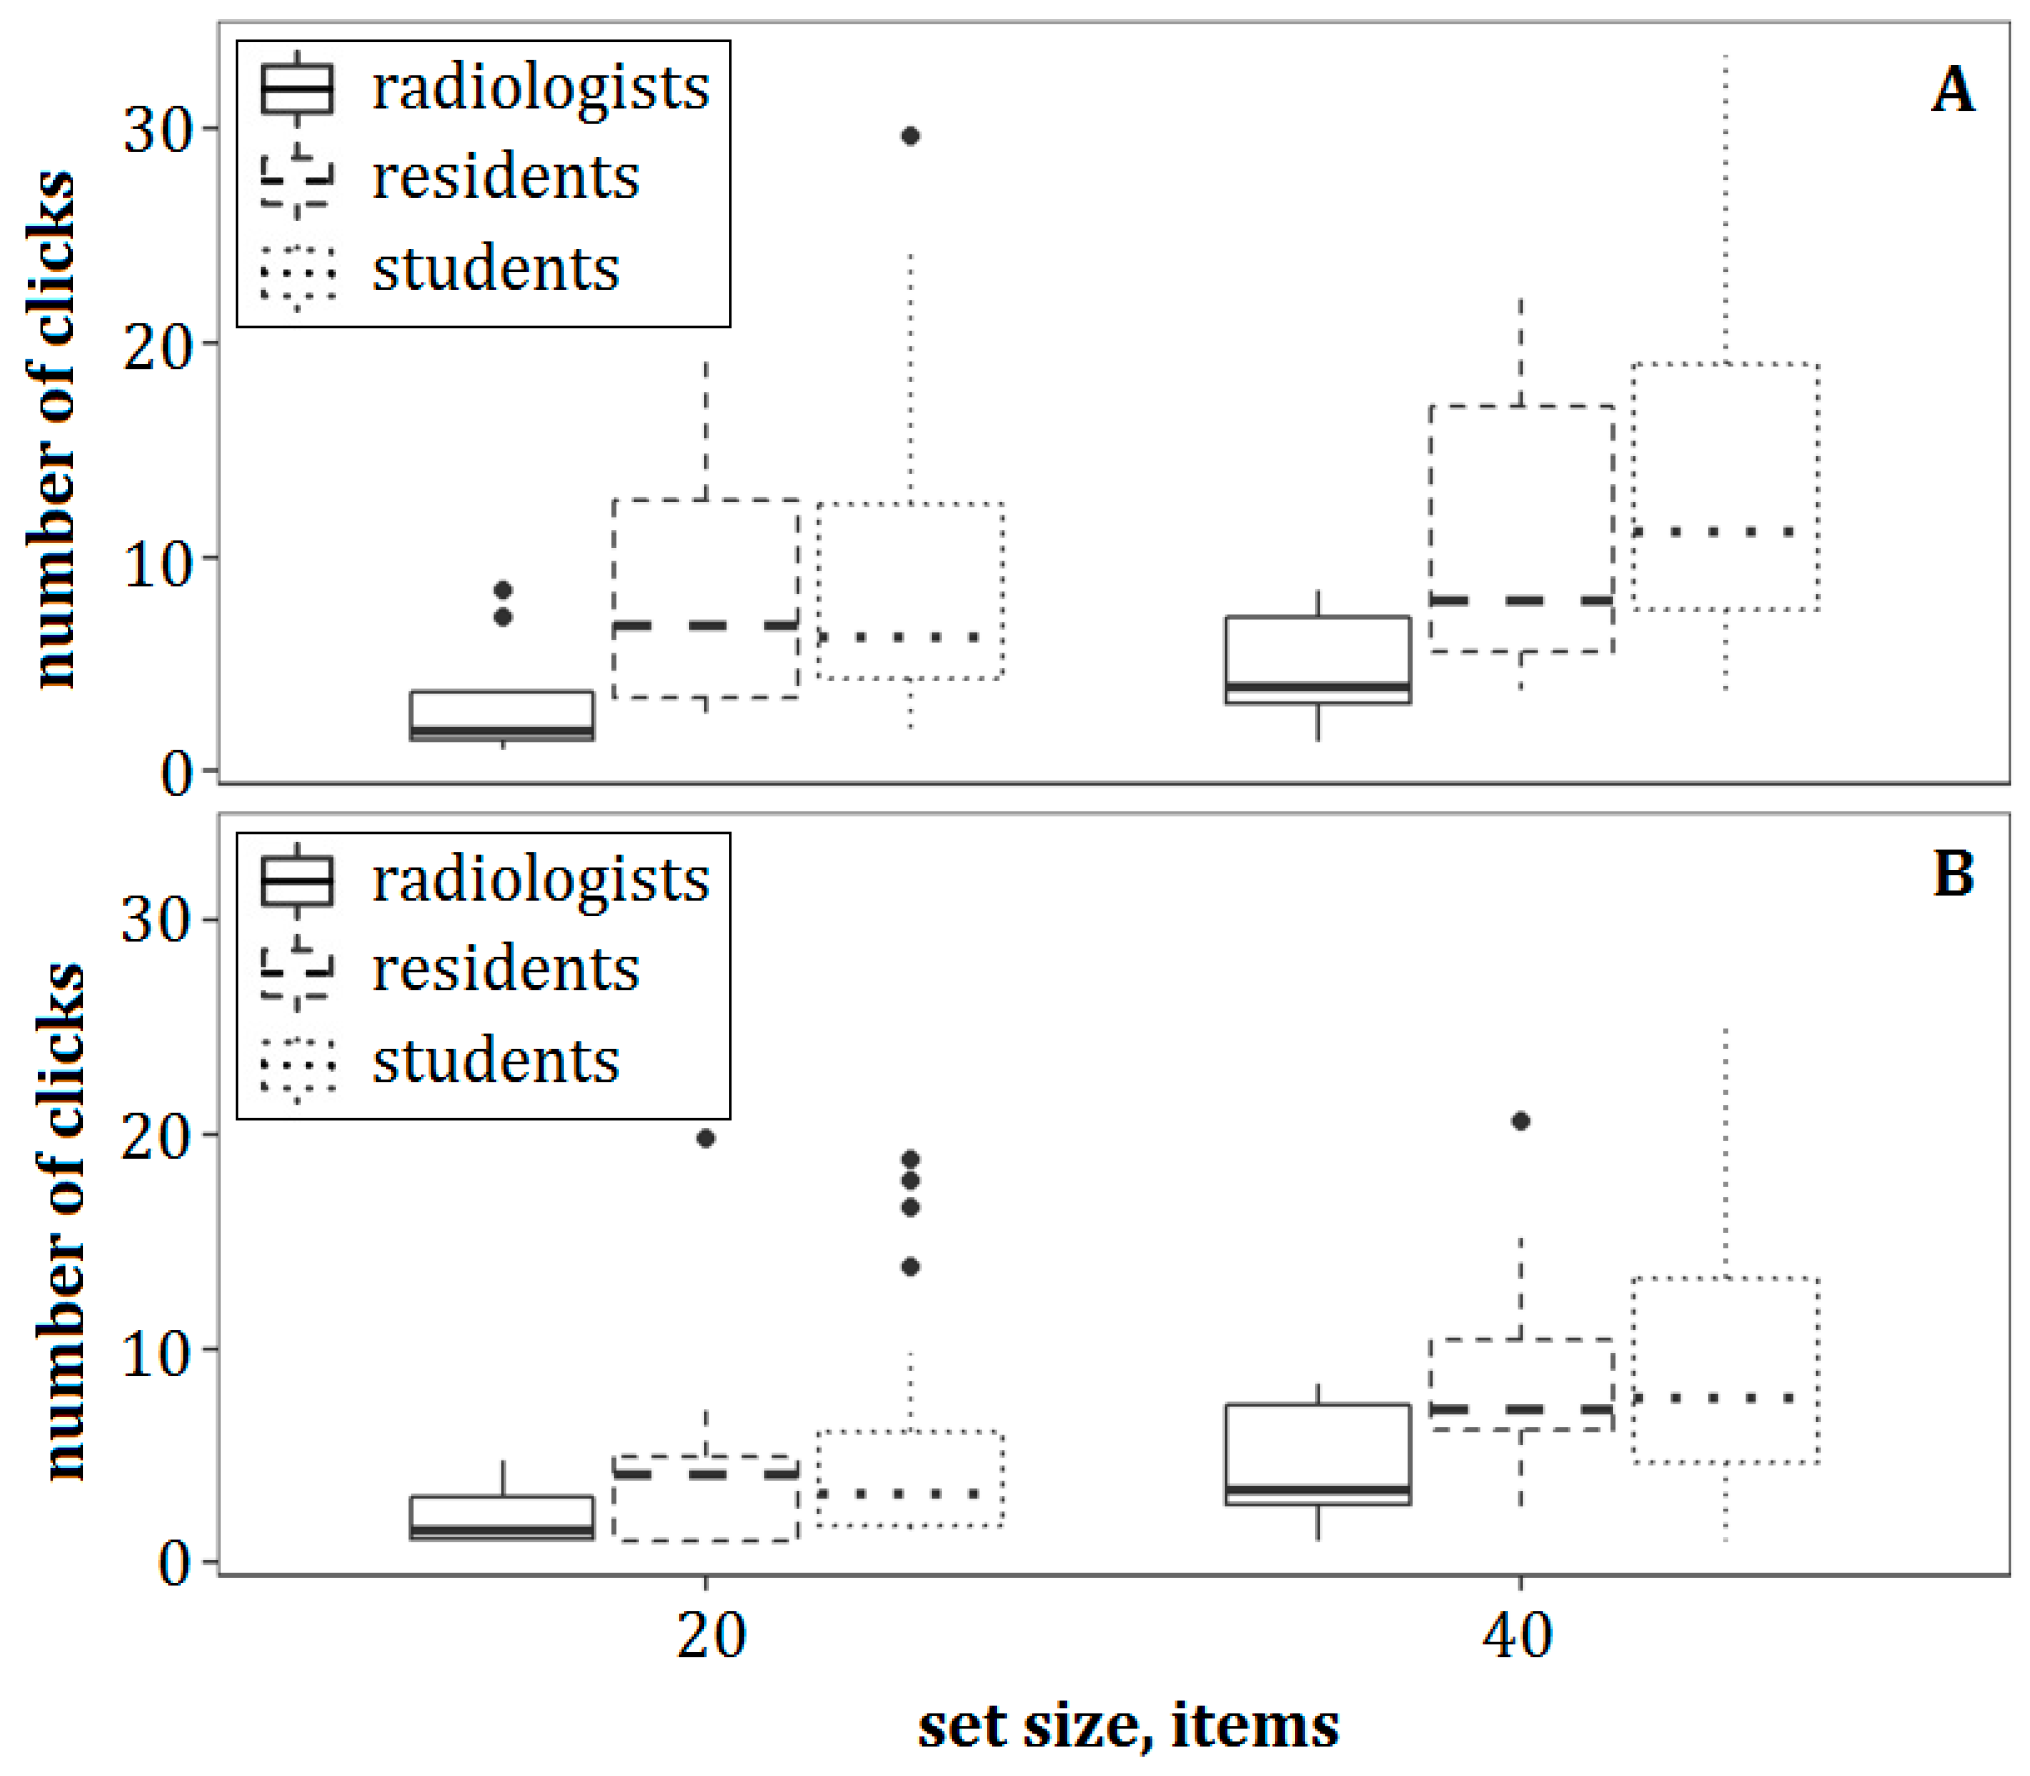
To investigate the search strategy and the image manipulation requirements of participants, the search pattern was recorded in the form of the image slice sequence that was shown on the closest plane of the volumetric display. Afterwards, we analyzed the following three parameters to describe image manipulation and search pattern: The number of clicks, direction changes, and image coverage. The number of clicks represents the frequency of image manipulations during the search procedure. The direction changes were defined as each time the observer changed the direction of image manipulation. For instance, if the participant pressed the up arrow key several times and then pressed the down arrow key, one direction change was counted.
The manipulations could cover different amounts of image slices. We were interested in assessing to what extent images were manipulated and how this approach was influenced by the stimulus physical properties for participants with different amounts of experience in radiology. We defined the types of image coverage as following: “No changes” meant that no clicks were employed and the participant viewed the entire three-dimensional image on the display; “half image”—1 to 5 slices were moved within the image manipulations; and “full image”—more than 5 slices were moved.
The data analysis was performed using R Statistical Software version 3.5.2. (Foundation for Statistical Computing, Vienna, Austria). The differences in the number of correct responses and direction changes were analyzed separately by pairwise comparisons for each of the factors, using non-parametric rank-based tests, namely, the Wilcoxon signed rank test for the repeated measures factors (target-distractor similarity and set size), and the Wilcoxon rank sum test for the between-groups factor (experience-adjacent group). To control the family-wise error rate, pairwise comparison p-values were adjusted via the Bonferroni procedure.
We evaluated search time and the number of clicks using a three-way mixed design analysis of variance (ANOVA) based on two repeated-measure factors (target-distractor similarity and set size), and between-group factor (experience-adjacent group). Given the positive skew of the distributions, the search time and number of manipulations were log-transformed prior to the ANOVA analysis. For the post hoc comparisons, pairwise t-tests with Bonferroni correction were used.
To analyze the association between image coverage, experience-adjacent group, and stimulus physics, we performed Cochran–Mantel–Haenszel tests of two associations between three categorical variables, namely, (1) image coverage, experience-adjacent group, and set size, and (2) image coverage, experience-adjacent group, and target-distractor similarity. For the post hoc comparisons, the associations between the two variables of interest (image coverage type and set size; image coverage type and target-distractor similarity) were analyzed separately with a chi-squared test of association for each of the participants’ groups. The multiple comparison p-values were adjusted via the Bonferroni procedure.
6. Discussion
This is the first study to investigate the differences in visual search performance and strategy depending on radiologist experience for real three-dimensional images on a volumetric display. We designed the visual stimulus with known physical properties for the multi-plane display in the absence of a semantic context relating to medical images in order to control the bottom-up influence. This way, we could quantify the search accuracy, response time, and image manipulation strategy in the z-direction to estimate the usability of the novel display, as well as evaluating the viewing requirements of individuals with varying amount of specific search experience (i.e., reading medical images) when working with a three-dimensional visualization system. Based on our study results, the three-dimensional visualization of information provides experienced radiologists with a valuable opportunity to grasp the overview of the entire rendered image without image manipulations before switching to a more focused local search.
In all three groups, individuals performed their best when the target-distractor similarity was low and the amount of visual information was relatively small on the display. In general, performance was significantly affected by target-distractor similarity, but no considerable differences were demonstrated between radiologists, residents and students in terms of their average search accuracy. The assessment of the temporal aspects revealed that radiologists and residents presented considerably faster search times compared to students. Moreover, the analysis of image manipulation strategy in the z-direction revealed differences in terms of the viewing preferences of radiologists, residents, and medical students. Specifically, radiologists preferred seeing the entire three-dimensional image for search purposes, whereas residents and students did not. Mostly, residents and radiologists tended to reduce the amount of information on the display and selectively inspect slices of three-dimensional images, similar to the multi-slice image-reading procedure commonly executed on flat-panel displays. With the increase of the amount of visual information on the display, students made more direction changes when compared with residents and radiologists. Of all participants, only radiologists persuasively showed the image manipulation pattern that was independent of changes in target-distractor similarity.
The accuracy of visual search is of primary importance in radiology, because it influences further decision making and diagnosis establishment. For this reason, the majority of previous experimental studies focused on investigating the possible impact of various expertise and stimulus-related factors on the search outcome. Similar to our findings, search accuracy did not vary considerably in earlier studies, in which the search performance of radiologists and non-radiologists (medical students or lay people) was compared using non-radiological search items [
38,
39,
40]. Thus, our study supports the previously announced concept that the differences in search accuracy among radiologists are domain-specific and do not apply to visual search tasks in general. In addition, our study emphasized the influence of stimulus physical properties on search accuracy. Accuracy decreased with the increase of target-distractor similarity but was unaffected by the amount of visual information on the volumetric display. This finding is in agreement with the perceptual study wherein the target discriminability was manipulated, and the response time was not limited [
52]. Participants from all groups sometimes missed the slight differences between the target and distractors. Taking into account that performance is dependent on the visual capabilities of users and the quality of display, we emphasize that further improvements are required in the display resolution in order to enhance the usability of novel three-dimensional visualization systems.
On a daily basis, radiologists must carefully inspect a vast number of images. For this reason, it is important to assess the time it takes to accomplish each search task. Previously, the domain-general temporal aspects of radiologists’ performance were examined using eye-tracking [
33,
35], and by recording the reaction time [
29,
30] and trial completion time [
34]. However, no differences were reported for gaze fixation characteristics [
35], and radiologists demonstrated considerably faster reactions than other participants when detecting slight changes in non-radiological images [
29] and finding low contrast targets [
28,
30], which allowed us to assume that the physical properties of stimuli might play a critical role in the temporal evaluation of performance depending on radiologist experience. In our study, we saw a tendency for students to consume more time compared to radiologists and residents when target-distractor similarity was high, however, no significance was reached. Despite the relatively low contrast of visual stimuli on the volumetric display, we did not prove the superior performance of radiologists, presumably due to the complexity of the visual task. The search items were distributed in the physical space of the optical element, therefore, participants could require a longer inspection time than when viewing flat images, and this could potentially mask the faster reaction presented by radiologists.
With the continuous emergence of new visualization methods, the way in which radiologists read and manipulate images changes substantially. The human-computer interaction was increasingly studied, investigating its relation to cognitive processes [
8,
44,
45] and the visual search outcome [
2,
33] during image interpretation in radiology. The major part of relevant research has been conducted using medical images (e.g., [
2,
43,
45]), and few studies with non-medical search items have also included image manipulations in the experimental design [
39,
42]. Similar to our findings, the number of manipulations was reported [
39] to increase for radiologists and non-radiologists when they viewed high-complexity images on a flat-panel display. In our study, the complexity of the image depended on the amount of visual information and target conspicuity.
The stimulus physics affected the search strategy and image manipulations of radiologists, residents, and students in our study in different ways. It is interesting that, in contrast to radiologists, students and residents made more direction changes due to changes in stimulus physics on the volumetric display. This finding is consistent with the results of earlier work [
43], in which radiologists demonstrated a more organized search in the z-direction compared to non-radiologists when inspecting multi-slice images on a flat-panel display. This result is compatible with the assumption that bottom-up processing plays a major role in the perception of early-career radiologists, as was emphasized in previous experimental studies [
45,
53,
54].
Stronger top-down control may provide radiologists with the benefit of inspecting three-dimensional images in a systematic way. Namely, in more than half of trials, radiologists did not change the location of slices on the display and inspected the entire three-dimensional image. This approach might be consistent with the global processing of visual information, which is a characteristic feature of radiologists’ perception, previously reported for medical image reading [
41]. According to this approach, experienced radiologists effectively use their parafoveal and peripheral vision to obtain a global impression of the image in contrast to novices who mostly focus on details and rely more on foveal vision. Altogether, the short search times and minimal amount of image manipulations demonstrated by experienced radiologists suggest that three-dimensional visualization may potentially become a helpful tool in the reading of medical images in the future. Three-dimensional visualization methods such as VR and AR are intended to improve ergonomics in radiology [
14,
15,
16,
17,
18,
19,
20] by reducing the cognitive load and time required to inspect multi-slice images. In contrast, viewing the entire three-dimensional image on the display could be overwhelming to students and early-career radiologists, due to the dominance of bottom-up processing in visual search. This could explain why the participants attempted to reduce to minimum the amount of presented information in most search tasks. However, the intensive human-computer interaction leaded to an increase in cognitive load [
8], and, as a result, residents and students did not take advantage of being able to view entire three-dimensional images on the volumetric display.
The results of our study should be interpreted in the light of some limitations. The first is the sample size, both in terms of the trials and participants. It should be noted that the limited number of experiment participants is characteristic of studies of specific users. Particularly, radiologists are a limited resource [
27], with a small amount of time available to dedicate to the experiment. For this reason, the number of qualified radiologists has been around ten individuals in most recent studies, e.g., [
4,
31,
32,
36,
40]. We acknowledge that one cannot necessarily apply conclusions made in one study to the entire population. Instead, this work acts as a valuable insight into viewing preferences and search performance when the usability of novel three-dimensional representation of information is tested before running further confirmatory studies employing the rendering of complex and domain-specific images. As our study showed, the involvement of professionals is crucial for understanding the specific requirements, which might be dictated by expertise.
Another limitation is related to the experiment design, which restricted the direction of image manipulations. In clinical practice, radiologists have the opportunity to rotate and the change scale of images, and adjust their brightness and contrast. We were interested in investigating experience-related differences and the influence of physical properties of visual information on human-computer interaction in the z-direction because, in contrast to flat-panel displays, the entire three-dimensional image can be presented on the multi-plane display. The clinical search pattern would be too complicated to be reproduced for a controlled experimental design. Nevertheless, our experimental design with controlled physical properties of visual stimulus allowed us to broaden knowledge about the viewing preferences of radiologists and students when searching through real spatial images. However, because radiologists mentioned that adding the opportunity for rotation would be a helpful and desirable option in the future, a potential follow-up to our current work could include extra image manipulation directions and test the domain-specific influence on image manipulation, and this would further advance the understanding of human-computer interaction when visual information is demonstrated in a three-dimensional manner.
Our research provides insights into the visual search outcome and viewing preferences of radiologists when viewing real three-dimensional images. In this initial validation of volumetric three-dimensional visualization for radiologists, we also demonstrated how the physical properties of the visual stimulus affected the visual search performance and outcome. Taken together, our results have important implications for the further development of three-dimensional visualization devices for professional use in medicine and medical education.
7. Implications for User Performance Studies
The field of advanced three-dimensional visualization systems is large and growing. Different visualization approaches are suggested to meet the demand for the qualitative three-dimensional presentation of complex medical information, and these approaches offer benefits in terms of improved ergonomics for diagnostic radiology.
Specific user performance studies allow the estimation of the usability of new visualization systems and define the requirements for the adoption and eventual transition to the new visualization paradigm. However, it is often difficult to recruit participants to be involved in the study, because professionals do not have time to participate as experimental observers. The previous user studies employed residents [
39,
45] or analyzed the results of radiologists and residents together [
2,
14,
18] to investigate visual search through medical images and test the application of new workstations for professional purposes. Similar to the case of performance assessment using multi-slice images [
43], the results of our study highlighted that the performance accuracy can be similar, however, the image manipulation strategies differ significantly depending on the amount of radiologist experience. Because image manipulation strategies are important, to be carefully investigated, aiming to make appropriate navigation systems for three-dimensional visualization tools in diagnostic radiology, user performance assessment should be conducted, involving experienced radiologists in order to obtain reliable and acceptable results.
It is important to note that, in comparison to multi-slice images traditionally presented on flat-panel displays, the three-dimensional visualization of information returns radiologists an opportunity to benefit from the global search. In our study, radiologists largely examined the entire three-dimensional images without image manipulation, however, they changed their search strategy and navigated actively through images when the target conspicuity was reduced. Active navigation through images is characteristic to the local search. In the human-centered design of a three-dimensional visualization system, one should consider the alternation of global and local search when radiologists read medical images [
41], and ensure flexible and meaningful navigation through the rendered images, which will facilitate both modes of search. As an alternative to traditionally used navigation devices, a gaming controller has been proposed to facilitate visual search in the three-dimensional environment [
1,
16]. The practicality of a new navigation device has not yet been reported and should be assessed using quantitative and qualitative measures. In addition to global measures, such as the time and accuracy of search performance, local measures, such as oculomotor behavior, should be further analyzed to describe search patterns and cognitive processes during visual search in detail. In terms of qualitative assessment, as professionals and novices are likely to verbalize less than intermediates [
45], we consider a survey based on recent findings about main viewing preferences and manipulations to be the most appropriate method for collecting and analyzing user feedback in the future study.
In addition to the ergonomic design of navigation, the high quality of rendered images is critical to ensure the usability and acceptance of new three-dimensional visualization methods. Accurate, high-quality rendering of multi-slice images is a challenge to work on when planning the implementation of three-dimensional visualization systems in radiology. Namely, approximately one hundred image slices should be condensed to be presented on the limited number of display planes which are located at different positions within the physical space of an optical element. This can be done by defining image boundaries to be visualized and then applying volume rendering [
20]. The specific user performance should be employed to assess whether important information is not missed during the visual search and navigation through complex, domain-specific images presented on multiple planes. In addition, the increase of spatial and contrast resolution is required for three-dimensional visualization systems to be accepted by medical professionals, since the current resolution of modern three-dimensional visualization systems is lower than that of conventional displays in radiology [
14].
The potential implementation of three-dimensional visualization systems is also broadly discussed in the context of radiology education. Three-dimensional visualization was claimed to be useful in helping radiology residents to conceptualize complex anatomy [
15], however, its usefulness was not assessed for the purposes of learning visual search strategies in medical image reading. In our study, residents and students intensively navigated through most three-dimensional images and reduced the amount of information presented in search tasks. This search strategy may be associated with the lack of so called perceptual knowledge, comprehensively reported in several reviews [
41,
55], which limits the ability to benefit from viewing the entire presentation of information. On the one hand, it means that we may suggest the three-dimensional visualization system to be implemented in medical image reading for use only by experienced radiologists. However, on the other hand, taking into account the importance of being effective in processing the information from the entire image and planning search strategy, the learning effect should be explored in the future. Residents and students may need additional training and guidance to use efficiently the benefits of three-dimensional representation of information for search purposes in medical image reading.

 ,
, 


