Article

Analysis of the LIF/Mie Ratio from Individual Droplets for Planar Droplet Sizing: Application to Gasoline Fuels and Their Mixtures with Ethanol

1
Lehrstuhl für Technische Thermodynamik (LTT), Friedrich-Alexander-Universität Erlangen-Nürnberg (FAU), 91058 Erlangen, Germany
2
Erlangen Graduate School in Advanced Optical Technologies, FAU, 91052 Erlangen, Germany
3
Division of Combustion Physics, Lund University, Box 118, 22100 Lund, Sweden
*
Author to whom correspondence should be addressed.
Appl. Sci. 2019, 9(22), 4900; https://doi.org/10.3390/app9224900
Submission received: 22 October 2019 / Revised: 6 November 2019 / Accepted: 7 November 2019 / Published: 15 November 2019
(This article belongs to the Special Issue Progress in Spray Science and Technology)

Abstract

:
In this work, the possibility of using planar droplet sizing (PDS) based on laser-induced fluorescence (LIF) and Mie scattering was investigated within the framework of measuring the droplet Sauter mean diameter (SMD) of direct-injection spark-ignition (DISI) spray systems. For this purpose, LIF and Mie signals of monodisperse fuel droplets produced by a droplet generator were studied at engine relevant diameters (20–50 µm). The surrogate gasoline fuel Toliso (consisting of 65 vol. % isooctane, 35 vol. % toluene) and the biofuel blend E20 (consisting of 80 vol. % Toliso, 20 vol. % ethanol) were used and which were doped with the fluorescence dye “nile red”. The effects of ethanol admixture, dye concentration, laser power, and temperature variation on the LIF/Mie ratio were studied simultaneously at both macroscopic and microscopic scale. The deduced calibration curves of the LIF and Mie signals of both fuels showed volumetric and surface dependent behaviors, respectively, in accordance with the assumptions in the literature. The existence of glare points and morphology-dependent resonances (MDRs) lead to slightly higher LIF and Mie exponents of E20 in comparison to Toliso. In principle, these calibration curves enable the determination of the SMD from LIF/Mie ratio images of transient fuel sprays.

1. Introduction

The addition of renewable biofuels, such as ethanol in fossil gasoline fuels, can contribute to the reduction of CO2 emissions. Nowadays, direct-injection spark-ignition (DISI) engines are commonly used in the automotive sector. These engines show a higher efficiency than engines based on conventional port fuel injection. However, direct fuel injection requires a faster atomization and mixture formation, leading to a very complex combustion process. The liquid fuel atomization and the evaporation behavior govern the ensuing process steps including mixture formation, ignition, heat release, and pollutant formation as well as the IC (internal combustion) engine efficiency. These process steps of combustion are very intricate and not fully understood, and the utilization of alternative fuel blends leads to an even higher degree of complexity. An admixture of 20 vol. % ethanol (E20) to gasoline is common in the US and in Brazil, while E10 is internationally the most common blend. Ethanol admixture, however, may promote soot formation under certain conditions in DISI engines [1,2,3,4], especially E20 which showed an increased soot formation in comparison to the base fuel, particularly for late injection timings in cold start conditions. The atomization and mixture formations are mainly governed by the thermo-physical properties of the fuel which essentially affect the soot formation [2,3,4,5]. To meet the emission limits and efficiency requirements, the fuel-dependent spray-formation processes of DISI engines must be controlled, and their investigation with optical techniques may significantly contribute to better understanding of the spray structure which is necessary for a fuel-specific optimization of the injection.
A suitable tool to characterize the spray formation is planar droplet sizing (PDS), as it allows for the determination of the droplet size (d) in terms of the Sauter mean diameter (SMD) over a plane defined by an illuminating laser sheet. The LIF/Mie ratio technique is based on the assumptions of a d3 dependence of the LIF signal and a d2 dependence of the Mie signal of droplets illuminated with a laser light source [6,7,8,9,10,11,12,13,14]. The qualitative LIF/Mie ratio can be calibrated using phase-Doppler anemometry (PDA) measurements [5,6] or a droplet generator [9,15,16]. In principle, a LIF signal can be created by the excited aromatic fuel components (e.g., toluene, benzene, naphthalene) of a multi-component commercial gasoline fuel [17]. However, aromatic hydrocarbons show a distinct temperature and oxygen sensitivity to the fluorescence at the same time [18,19]. Thus, the addition of a well-characterized fluorescence dye [5,6,20] can be favorably applied for PDS. For this purpose, a large number of fluorophores, mainly dissolved in water, were characterized in the past including dissolved sodium salicylate [21], rhodamine 6G in water [9], and pyranine (“solvent green 7”) [20]. Several studies dealing with droplet sizing in alcohol sprays already exist in the literature [5,15,16,20,22,23]. The tracer Eosin Y, which has been used in previous studies [22,23,24,25], cannot be dissolved in alkanes or gasoline fuels. Only a small number of tracers are soluble in alkanes, oils, diesel, and gasoline, e.g., pyrromethene and its derivatives (e.g., 597-8C9, 597-C8) [26,27].
Nile red (C20H18N2O2) is another LIF-tracer which has already been employed in a previous study in commercial gasoline and diesel fuels [24] for the investigation of the primary breakup of sprays in the near-nozzle region. Its spectral absorption and fluorescence characteristics in gasoline–ethanol blends as well as aviation fuels (also blended with biofuels such as farnesane and HEFA (Hydroprocessed Esters and Fatty Acids)) was recently studied by our group [28]. To ensure that aromatic fuel components of a realistic gasoline fuel do not become excited by the laser, a visible wavelength is preferred. This criterion is fulfilled by the dye nile red, as it can be excited to fluoresce using a 532 nm Nd:YAG-laser. Consequently, this dye is suitable for the investigations in the present study. In addition, the tracer nile red is commonly used in microfluidic systems and in biology applications [29,30,31].
The temperature insensitivity of the LIF/Mie-ratio is essential for the technical applicability of the sizing technique under IC engine conditions. Generally, and depending on the solvent and dye, the LIF signal is temperature sensitive which must be considered for accurate droplet sizing. The Mie signal shows no significant temperature sensitivity under moderate conditions involving small temperature variations. The LIF signal usually depends on the solvent (i.e., the fuel composition) as well as on the absorption and emission properties of the dye at the respective ambient conditions. During the injection process, the liquid and gas phase temperature may vary tremendously. When injected into hot compressed gas, the droplet may heat up quickly. Otherwise, under injection conditions with moderate temperatures (or cold start conditions), the droplet temperatures in the spray can easily drop by 10 K or even more (e.g., at 0.1 MPa, 293 K) [5] due to the evaporative cooling (depending on the fuel evaporation enthalpy). Consequently, for application of the LIF/Mie ratio technique in DISI engine sprays, a temperature insensitive signal ratio is advantageous in order to achieve accurate and reliable measurements.
In this article, the microscopic and macroscopic LIF and Mie signals of micrometric monodisperse fuel droplets are investigated using nile red, and the suitability of this technique for planar droplet sizing is discussed. The two-component surrogate fuel Toliso (consisting of 65 vol. % isooctane, 35 vol. % toluene) was applied to model gasoline (see also References [1,28,32,33] and information in Section 2.2.). Furthermore, the relevant ethanol–gasoline blend E20 (80 vol.% Toliso, 20 vol. % ethanol) was studied, which showed worse atomization and evaporation leading to increased soot emissions under certain IC engine operating points [1,33]. The individual LIF and Mie signals of monodisperse droplets produced by a droplet generator were investigated with both a microscopic and a macroscopic setup. The macroscopic setup corresponded to the arrangement of the spray measurements while the microscopic setup was necessary to resolve the size and shape of the droplets produced which was required for signal interpretation as well as for calibration purposes. Here, the effects of ethanol admixture, laser fluence, dye concentration, and liquid temperature on the LIF/Mie ratio were studied for individual droplets. Finally, calibration curves of the LIF/Mie signal ratio as a function of droplet size were deduced in a wide range of droplet sizes relevant for DISI injection conditions.

2. Experimental Setup

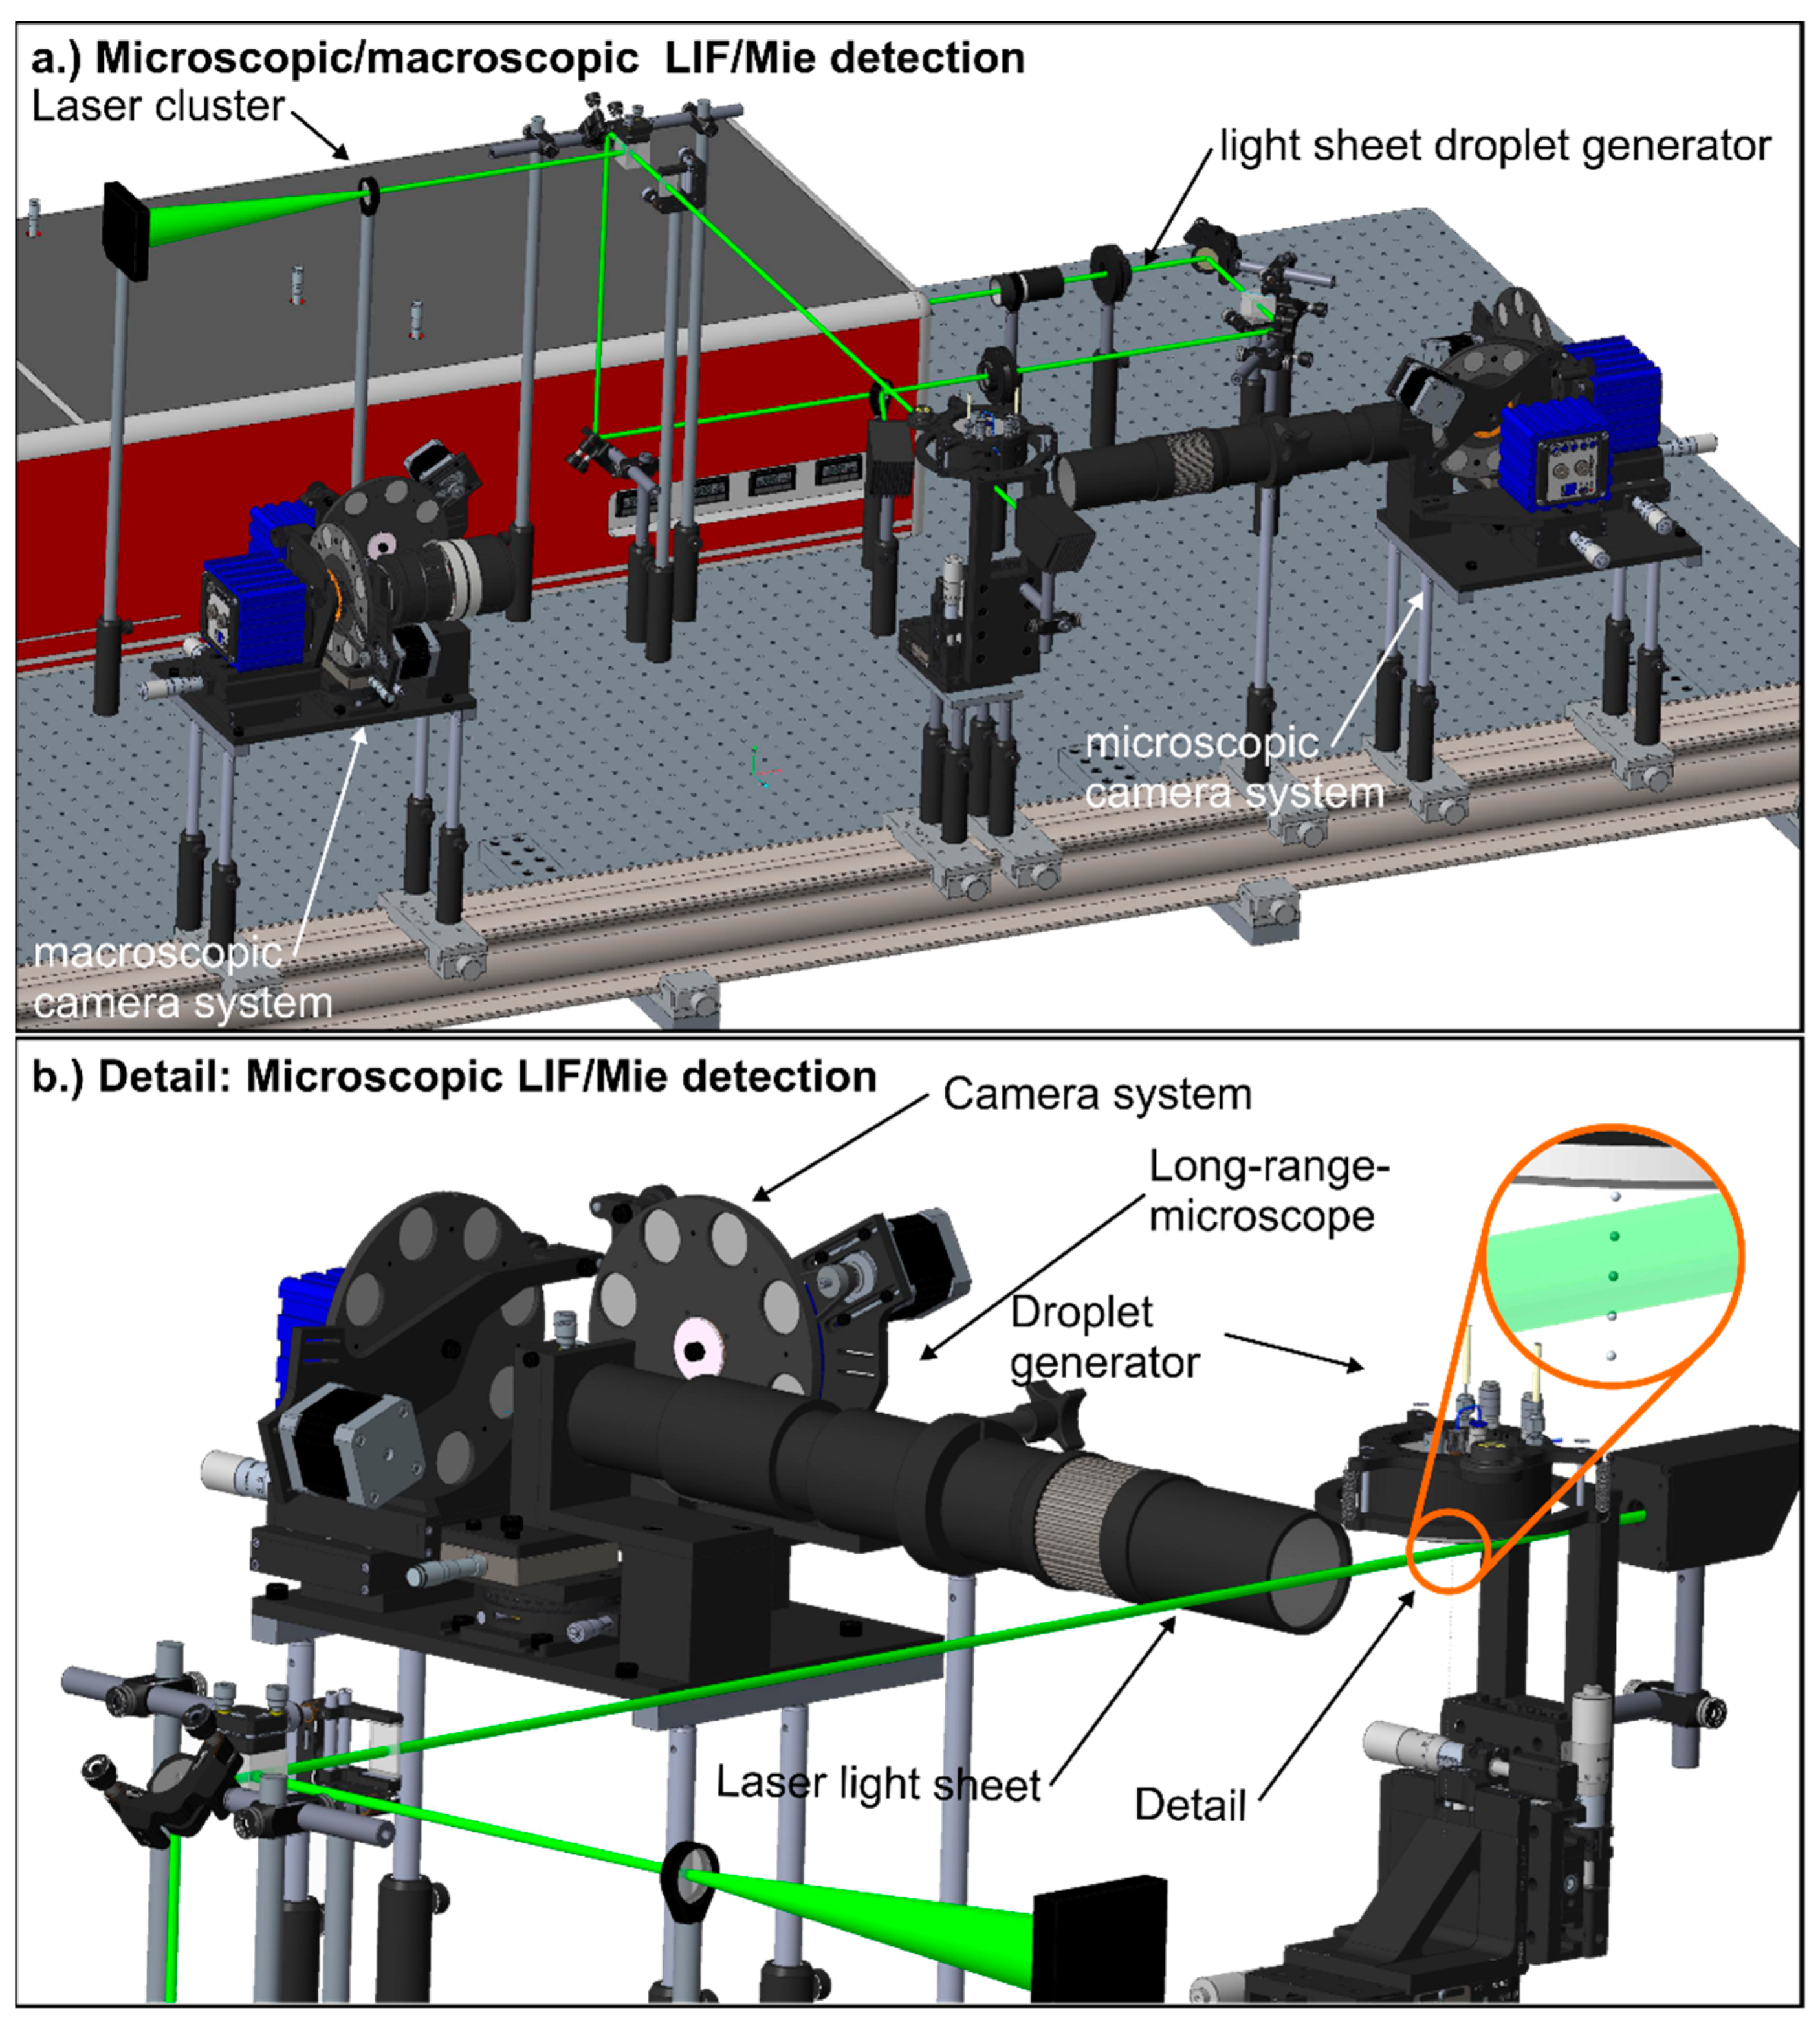
2.1. Microscopic and Macroscopic LIF/Mie Setup

The optical setup for the simultaneous detection of microscopic and macroscopic LIF and Mie signals, generated from individual monodisperse droplets, is displayed in Figure 1.
For droplet illumination, a laser beam (Multi-Nd:YAG-Laser, Thales, Paris, France, 532 nm with top-hat beam profile) was formed to a light sheet (height: 15 mm, thickness: approximately 0.7 mm). The LIF- and Mie-signal intensities were recorded simultaneously with a micro and a macro imaging system, respectively. Each imaging system was equipped with two identical sCMOS cameras (Imager, LaVision, Goettingen, Germany, resolution 2560 pixel × 2160 pixel). The design of the systems and the associated adjustment possibilities simplify the alignment for obtaining the same field-of-view for both cameras. The individual filters were mounted directly in front of the camera chips. The LIF signal was detected using a 532 nm (17 FWHM) notch filter to exclude the excitation wavelength. The Mie scattering signal was detected using a 532 nm (1 nm FWHM) laser line filter. To optimize the signal detection at constant laser power, motorized filter wheels equipped with a set of ND-filters (ND 0, ND 0.3, ND 0.6, ND 1, ND 1.3) were mounted in front of the individual cameras. All optical elements of the objective systems were characterized with a photo spectrometer (UV/VIS Spectrometer Lambda 40, Perkin Elmer, Waltham, USA, wavelength range 300–900 nm, 3001 pixels, spectral bandwidth 0.2 nm) to calibrate the spectral properties of the detection system. The microscopic objective system was equipped with a high-resolution, long-range microscope (K2 DistaMax, Infinity, Centennial, USA) with a nominal pixel resolution of 0.28 µm/pixel. The macroscopic detection system was equipped with a conventional objective (135 mm, 2.8/135, Pentacon, Dresden, Germany) with a nominal pixel resolution of 6.67 µm/pixel.

2.2. Droplet Generator

The droplet generator used (type 1530, MSP Corp., Shoreview, USA) produced monodisperse droplets of sizes ranging between 20 µm and 50 µm (or larger; maximal droplet size was 93 µm according to the manufacturer) which is relevant for gasoline direct injection. The device changes the droplet size by adjustment of fuel and air mass flows and piezo frequency in contrast to commonly used orifice droplet generators [34]. The flow focusing air, the droplet generator itself, and the fuel were conditioned with two recirculating chillers (FP50, Julabo, Seelbach, Germany) to ensure constant measurement conditions at an ambient pressure of 0.1 MPa. The temperatures of the setup were monitored by integrated thermocouples (type K, 1.5 mm, tc-direct GmbH, Moenchengladbach, Germany). The droplets were dragged along the carrier gas. The LIF and Mie measurement volume (region of interest, ROI) was approximately 3 to 7 mm below the nozzle of the droplet generator, depending on the investigated droplet size. The conditioned carrier gas and the small droplet path after injection avoided significant temperature variations within the droplet chain. Significant temperature gradients would affect LIF signals and would also change the scattering behavior of the droplets [35].

2.3. Fuels and Tracers Investigated

In accordance with our previous studies [1,32,33,36] and to avoid composition variations of commercial gasoline, we used the well-defined two-component surrogate fuel Toliso (65 vol. % isooctane, 35 vol. % toluene) instead. The sooting tendency of commercial gasoline was mainly driven by its aromatic components, such as toluene, benzene or xylene, which were in sum up to 35% in total volume of gasoline. Toluene is known as an octane number enhancer, and gasoline contains up to 15 vol. % of this component [37]. Toliso has thermo-physical properties similar to those of multi-component gasoline, and toluene mixtures with isooctane (or n-heptane) lead to a similar sooting behavior as commercial gasoline [38]. The effect of biofuel admixture on the LIF and Mie signals was considered by blending Toliso with 20 vol. % of ethanol (E20). The chemical and physical properties of the investigated fuels and conventional gasoline for various ambient conditions are shown in Table 1.
The dye nile red (Sigma–Aldrich) was used for all investigations. It belongs to the group of fluorophores and its aromatic ring structure contains polar substituents. Its properties lead to a high sensitivity to the chemical and physical environment of surrounding solvent molecules [39]. For the preliminary characterization of the spectral emission of the fuel–dye mixture in a dye cell, the selected concentration of nile red was 9.38 mg/l [28]. This relatively low concentration prevents measurement uncertainties caused by excessive extinction effects due to the long probe path in the dye cell (in comparison to the droplet diameter). To achieve a good signal-to-noise ratio in the 2D droplet investigations, the fuel was doped with 100 mg/l nile red concentration.

2.4. Post-Processing Routine of the Droplet Measurements

The in-house post-processing code based on Matlab® evaluates each individual droplet in terms of sphericity (which is the ratio of the minimum and maximum distance of the individual droplet in the present study), location within the measurement region, and spacing among neighboring droplets. Only droplets with a sphericity (which is the ratio of major ellipse and minor ellipse) between 1.0 and 1.2 and that were clearly separated from neighboring droplets were considered for further evaluation. This geometric limitation was necessary, since the sphericity of the single droplets had a significant impact on the scattering behavior [45].
The intensity ratio, as a function of the droplet diameter (d), was determined by two parameters, which were fitted according to the power-law function, I = a∙db. The fit was performed by a weighted least squares minimization. The weighting factors were determined by the measurement noise, σI, of the signal. The noise was approximately distributed log-normally; thus, the least-squares minimization was performed in log-space. The chosen routine ensured that fitting errors based on the greater weight of high intensities corresponding to large droplets were avoided.

3. Results

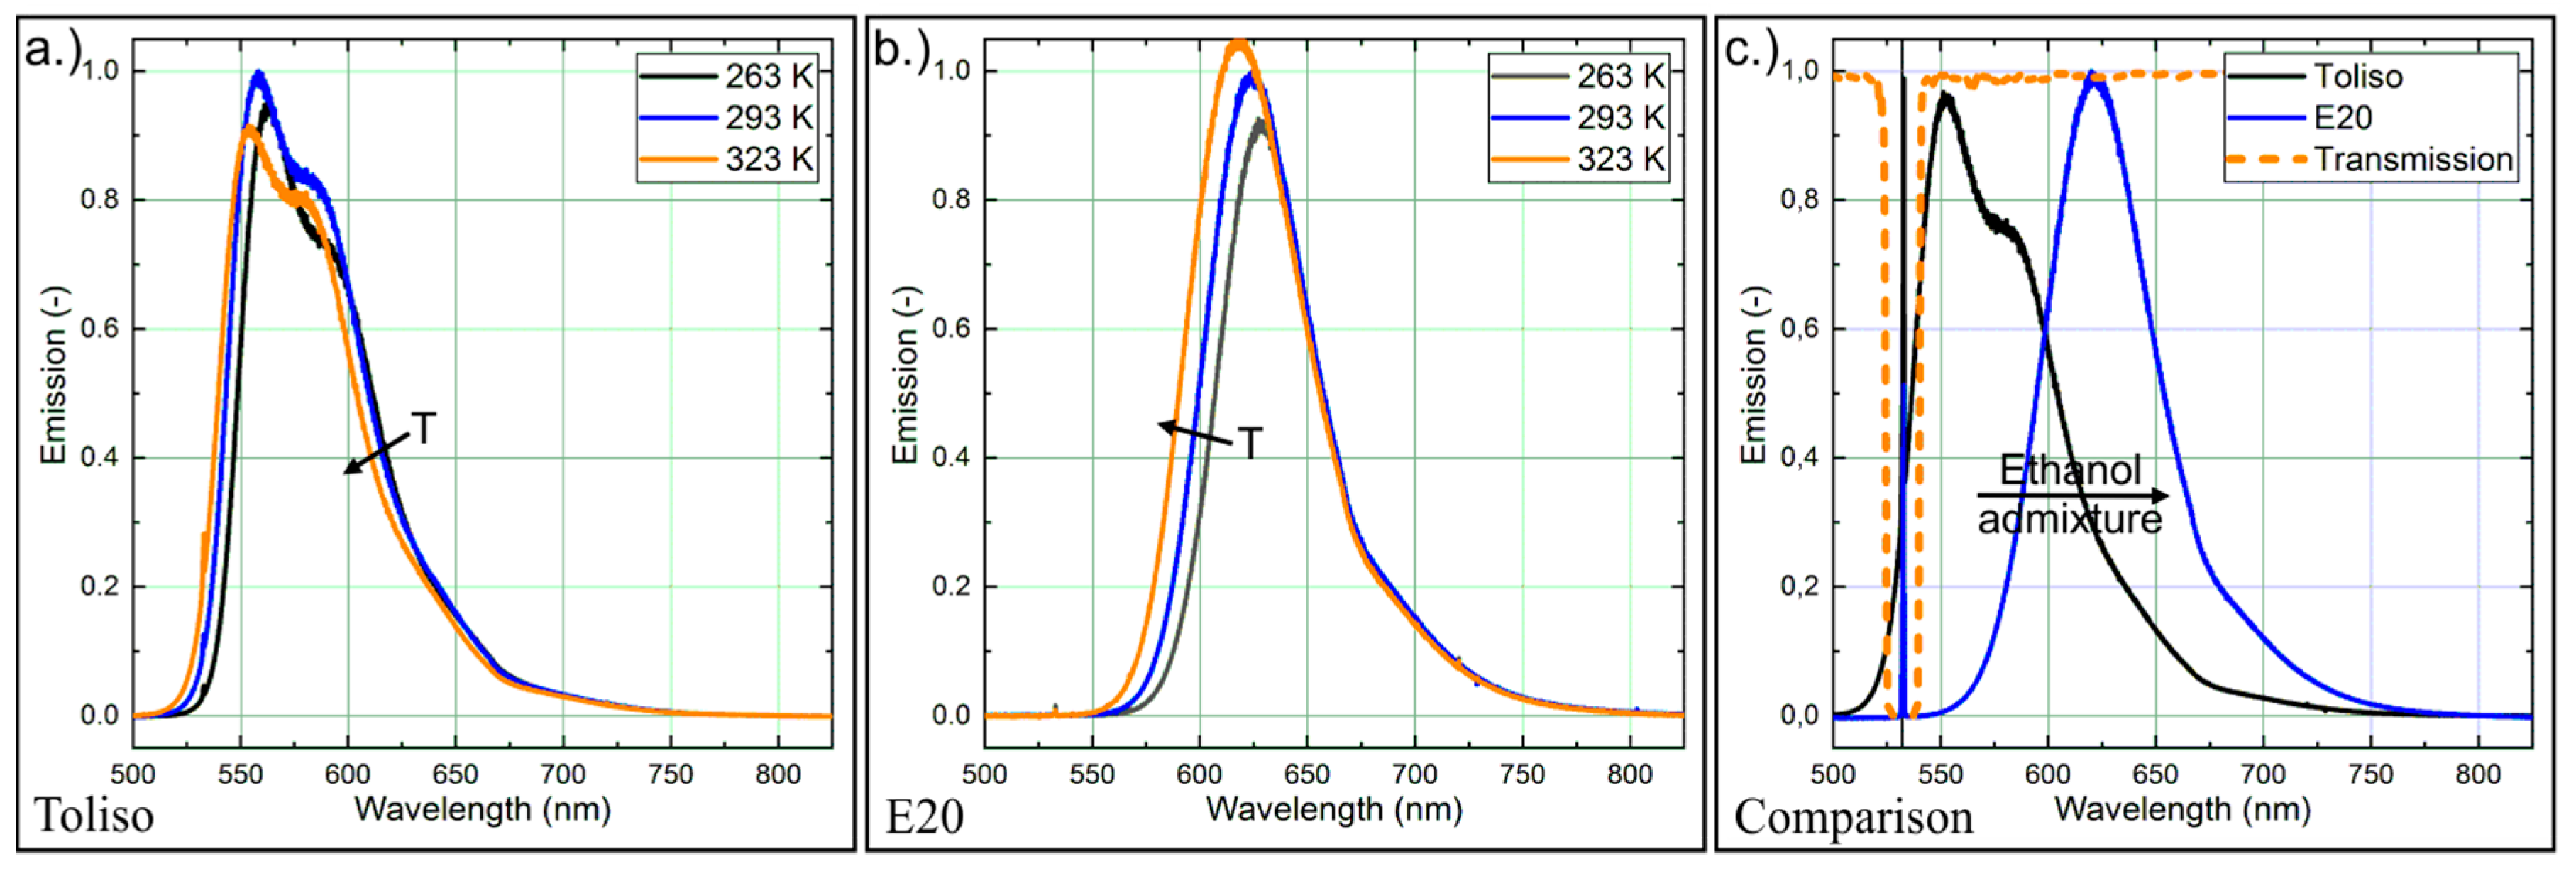
3.1. Spectral Fluorescence Characterization of the Dye

In this section, the fluorescence spectra of the dye dissolved in Toliso and E20 are presented at various temperatures. This preliminary study was necessary for filter selection and signal interpretation in the imaging study using the droplet generator. The fuel–dye mixture was studied in a dye cell which was heated by a recirculating chiller (type: Julabo FP50). The micro cell was equipped with four windows (sapphire, diameter: 0.5 inch) with an optical access diameter of 9 mm each. A homogeneous temperature distribution within the micro cell was ensured by a built-in magnetic stirrer (8 mm × 3 mm stir bar) and monitored by two thermocouples (type K, 1.5 mm, tc-direct GmbH, Moenchengladbach, Germany). The laser beam was generated by a 532 nm Nd:YAG laser (model 150-10, Spectra Physics, Santa Clara, USA). The LIF spectra were recorded under a detection angle of 90° using a photo spectrometer (model USB 4000, Ocean Optics, Largo, USA, wavelength range 495.9–831.8 nm, 3648 pixels, slit size 10 µm, integration time 100 ms, average over 50 subsequent spectra for each measurement). Further details of the setup can be found in Reference [28]. The temperature-dependent fluorescence signals for the investigated fuel–dye mixtures are shown in Figure 2. The signals were normalized to the maximum intensity of E20. The chamber was cooled down to 263 K or heated up to 323 K, respectively. The fluorescence spectra were presented in the visible wavelength region 400–750 nm. In the UV region, there were also some absorption bands of toluene (240–270 nm) [46], but this range is not relevant for an excitation at 532 nm. The fluorescence of nile red in Toliso was characterized by continuous spectra with two individual peaks. The integrated fluorescence signal showed a temperature dependence of less than 10% in the temperature range of 263 K – 323 K. The temperature dependence can partly be explained by the absorption behavior which showed a decrease with selevated temperatures (22% from 313 K – 343 K) [28]. However, the fluorescence yield depends on temperature as well. The fluorescence spectra were slightly shifted to lower wavelengths with the increasing temperature. At higher temperature, the first peak of the emission spectrum (~ 555 nm) decreased more quickly in comparison to the second peak (~580 nm). The dependence of the fluorescence signal of nile red on the solvent becomes visible when Toliso is blended with ethanol. The peaks of the fluorescence spectra of E20 were shifted by approximately 50 nm towards larger wavelengths in comparison to Toliso. This behavior was already reported by Kalathimekkad et al. [39] in the case of nile red mixed with various solvents including ethanol and toluene. The emission spectra of E20 consist of one only peak, instead of two peaks for Toliso. Again, all emission spectra were slightly shifted towards lower wavelengths with increasing temperature. The E20 showed an increase of the (peak) intensity with higher temperature in contrast to Toliso, where a reduction with the increasing temperature was observed. The low temperature sensitivity at moderate temperatures qualified the investigated fuel–dye mixtures as systems suitable for LIF/Mie-droplet sizing without temperature correction. This is valid, especially at moderate ambient temperatures where the fuel evaporation rate is low and variation of droplet temperature due to the increasing heat or evaporation cooling is less significant. The individual fluorescence signals of Toliso and E20 as well as the transmission curve of the respective laser filter are shown in Figure 2. The LIF detection was only affected by the filter used in the case of Toliso (where a small part of the signal around 532 nm was cut off). The signal of E20 was not affected by the filter due to the red-shift of the fluorescence spectrum.

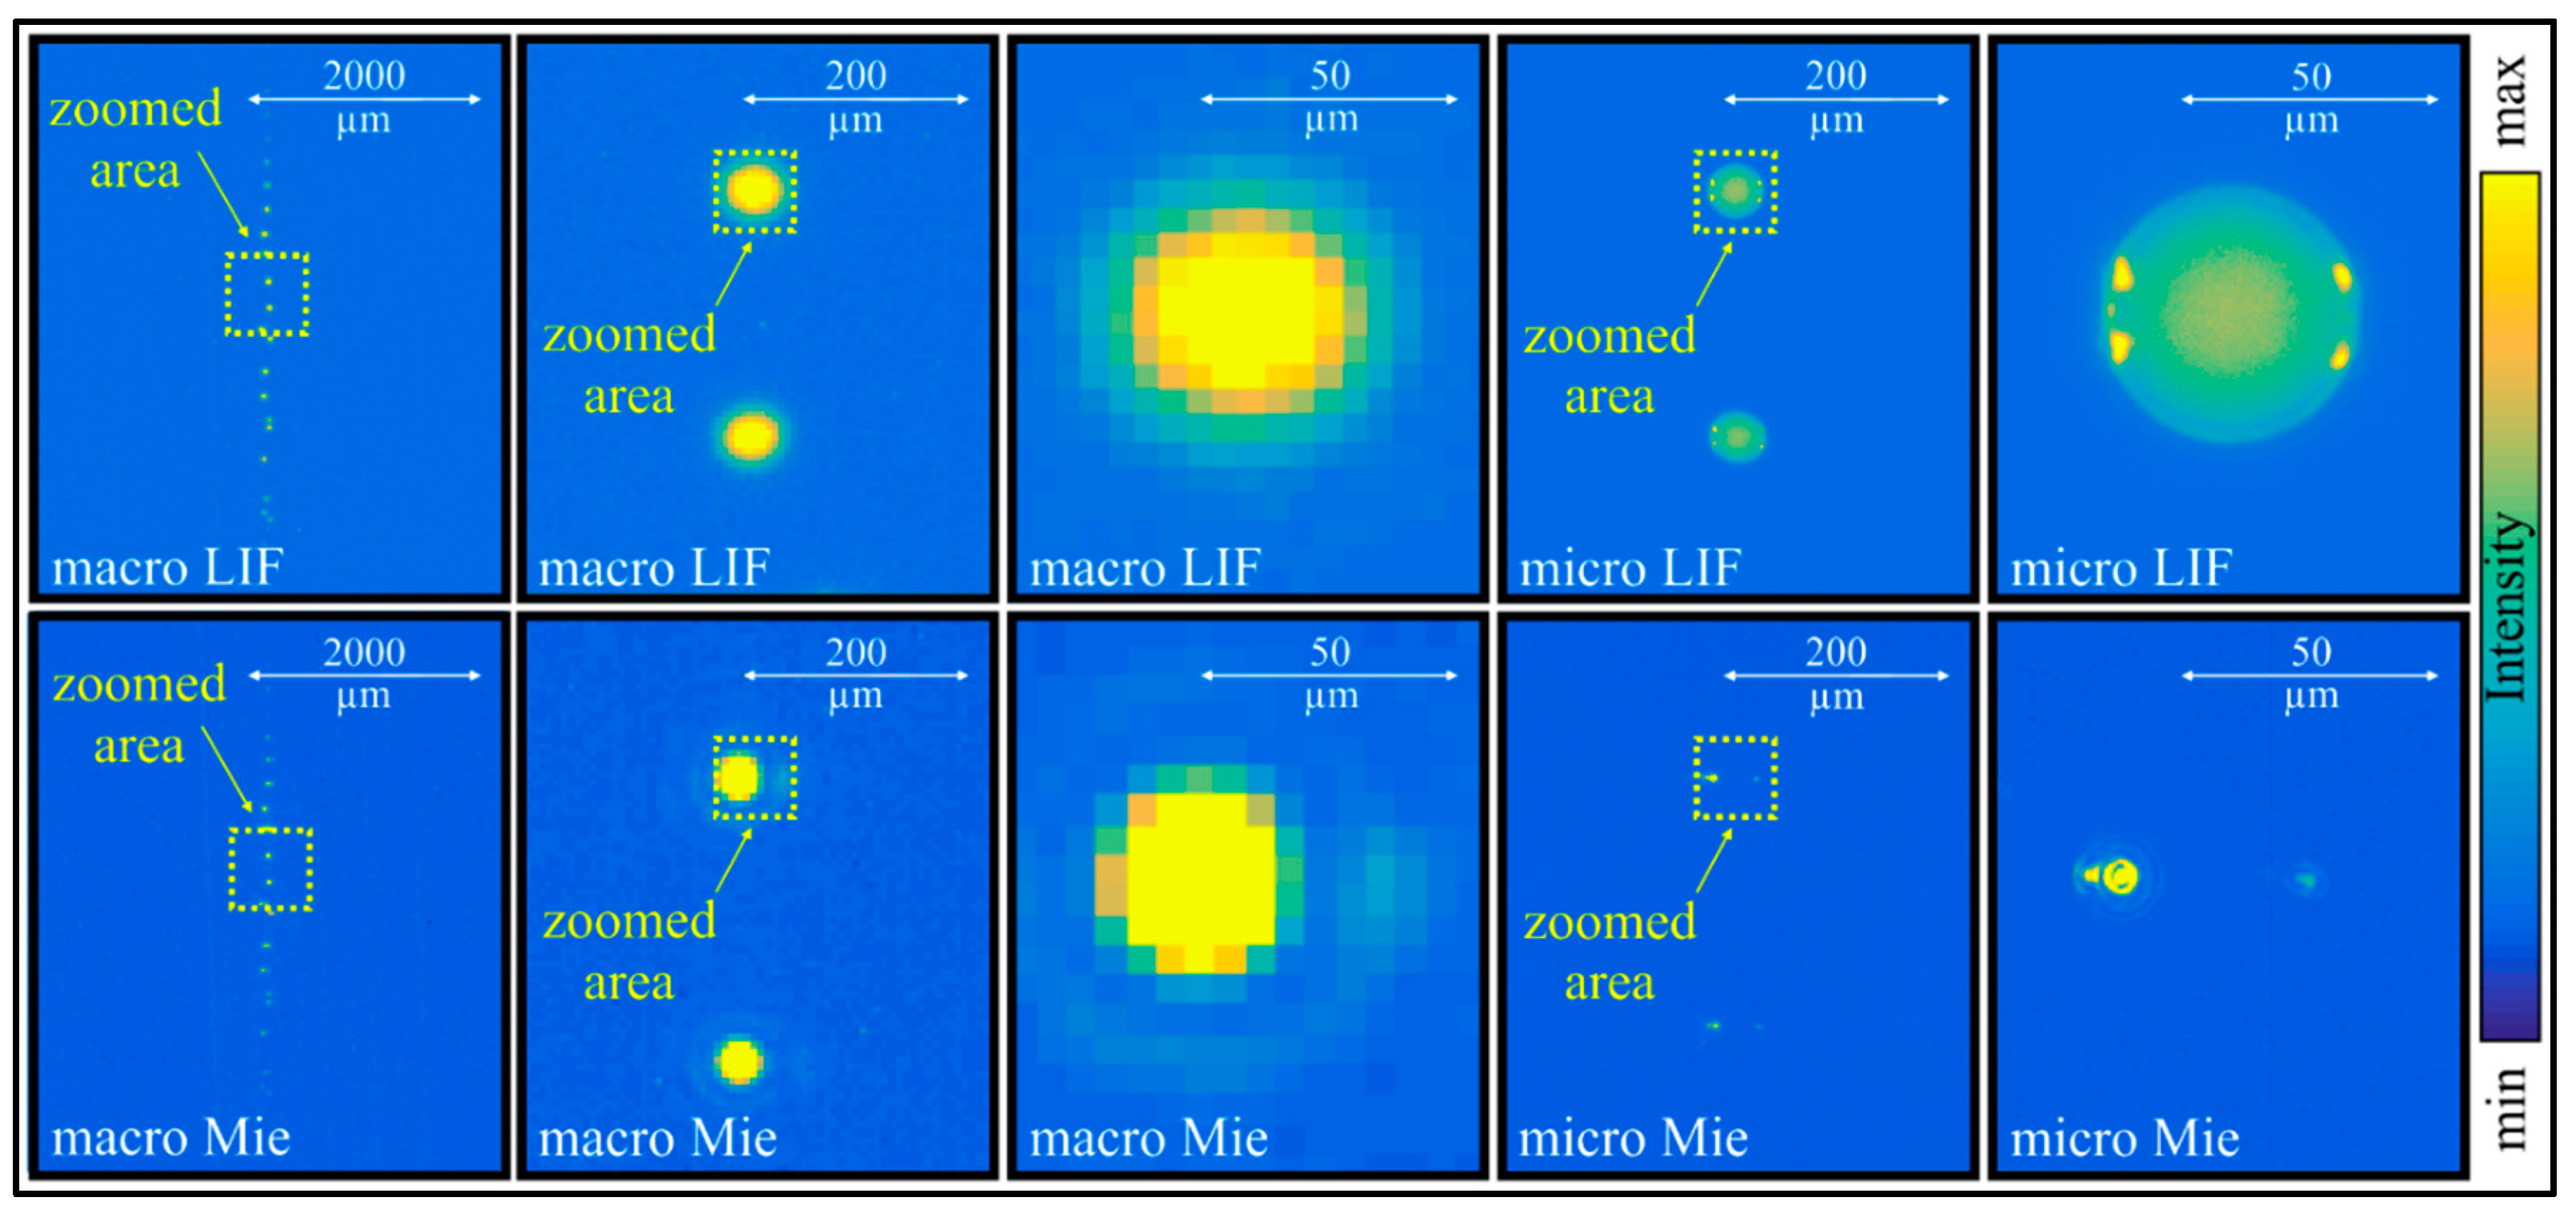
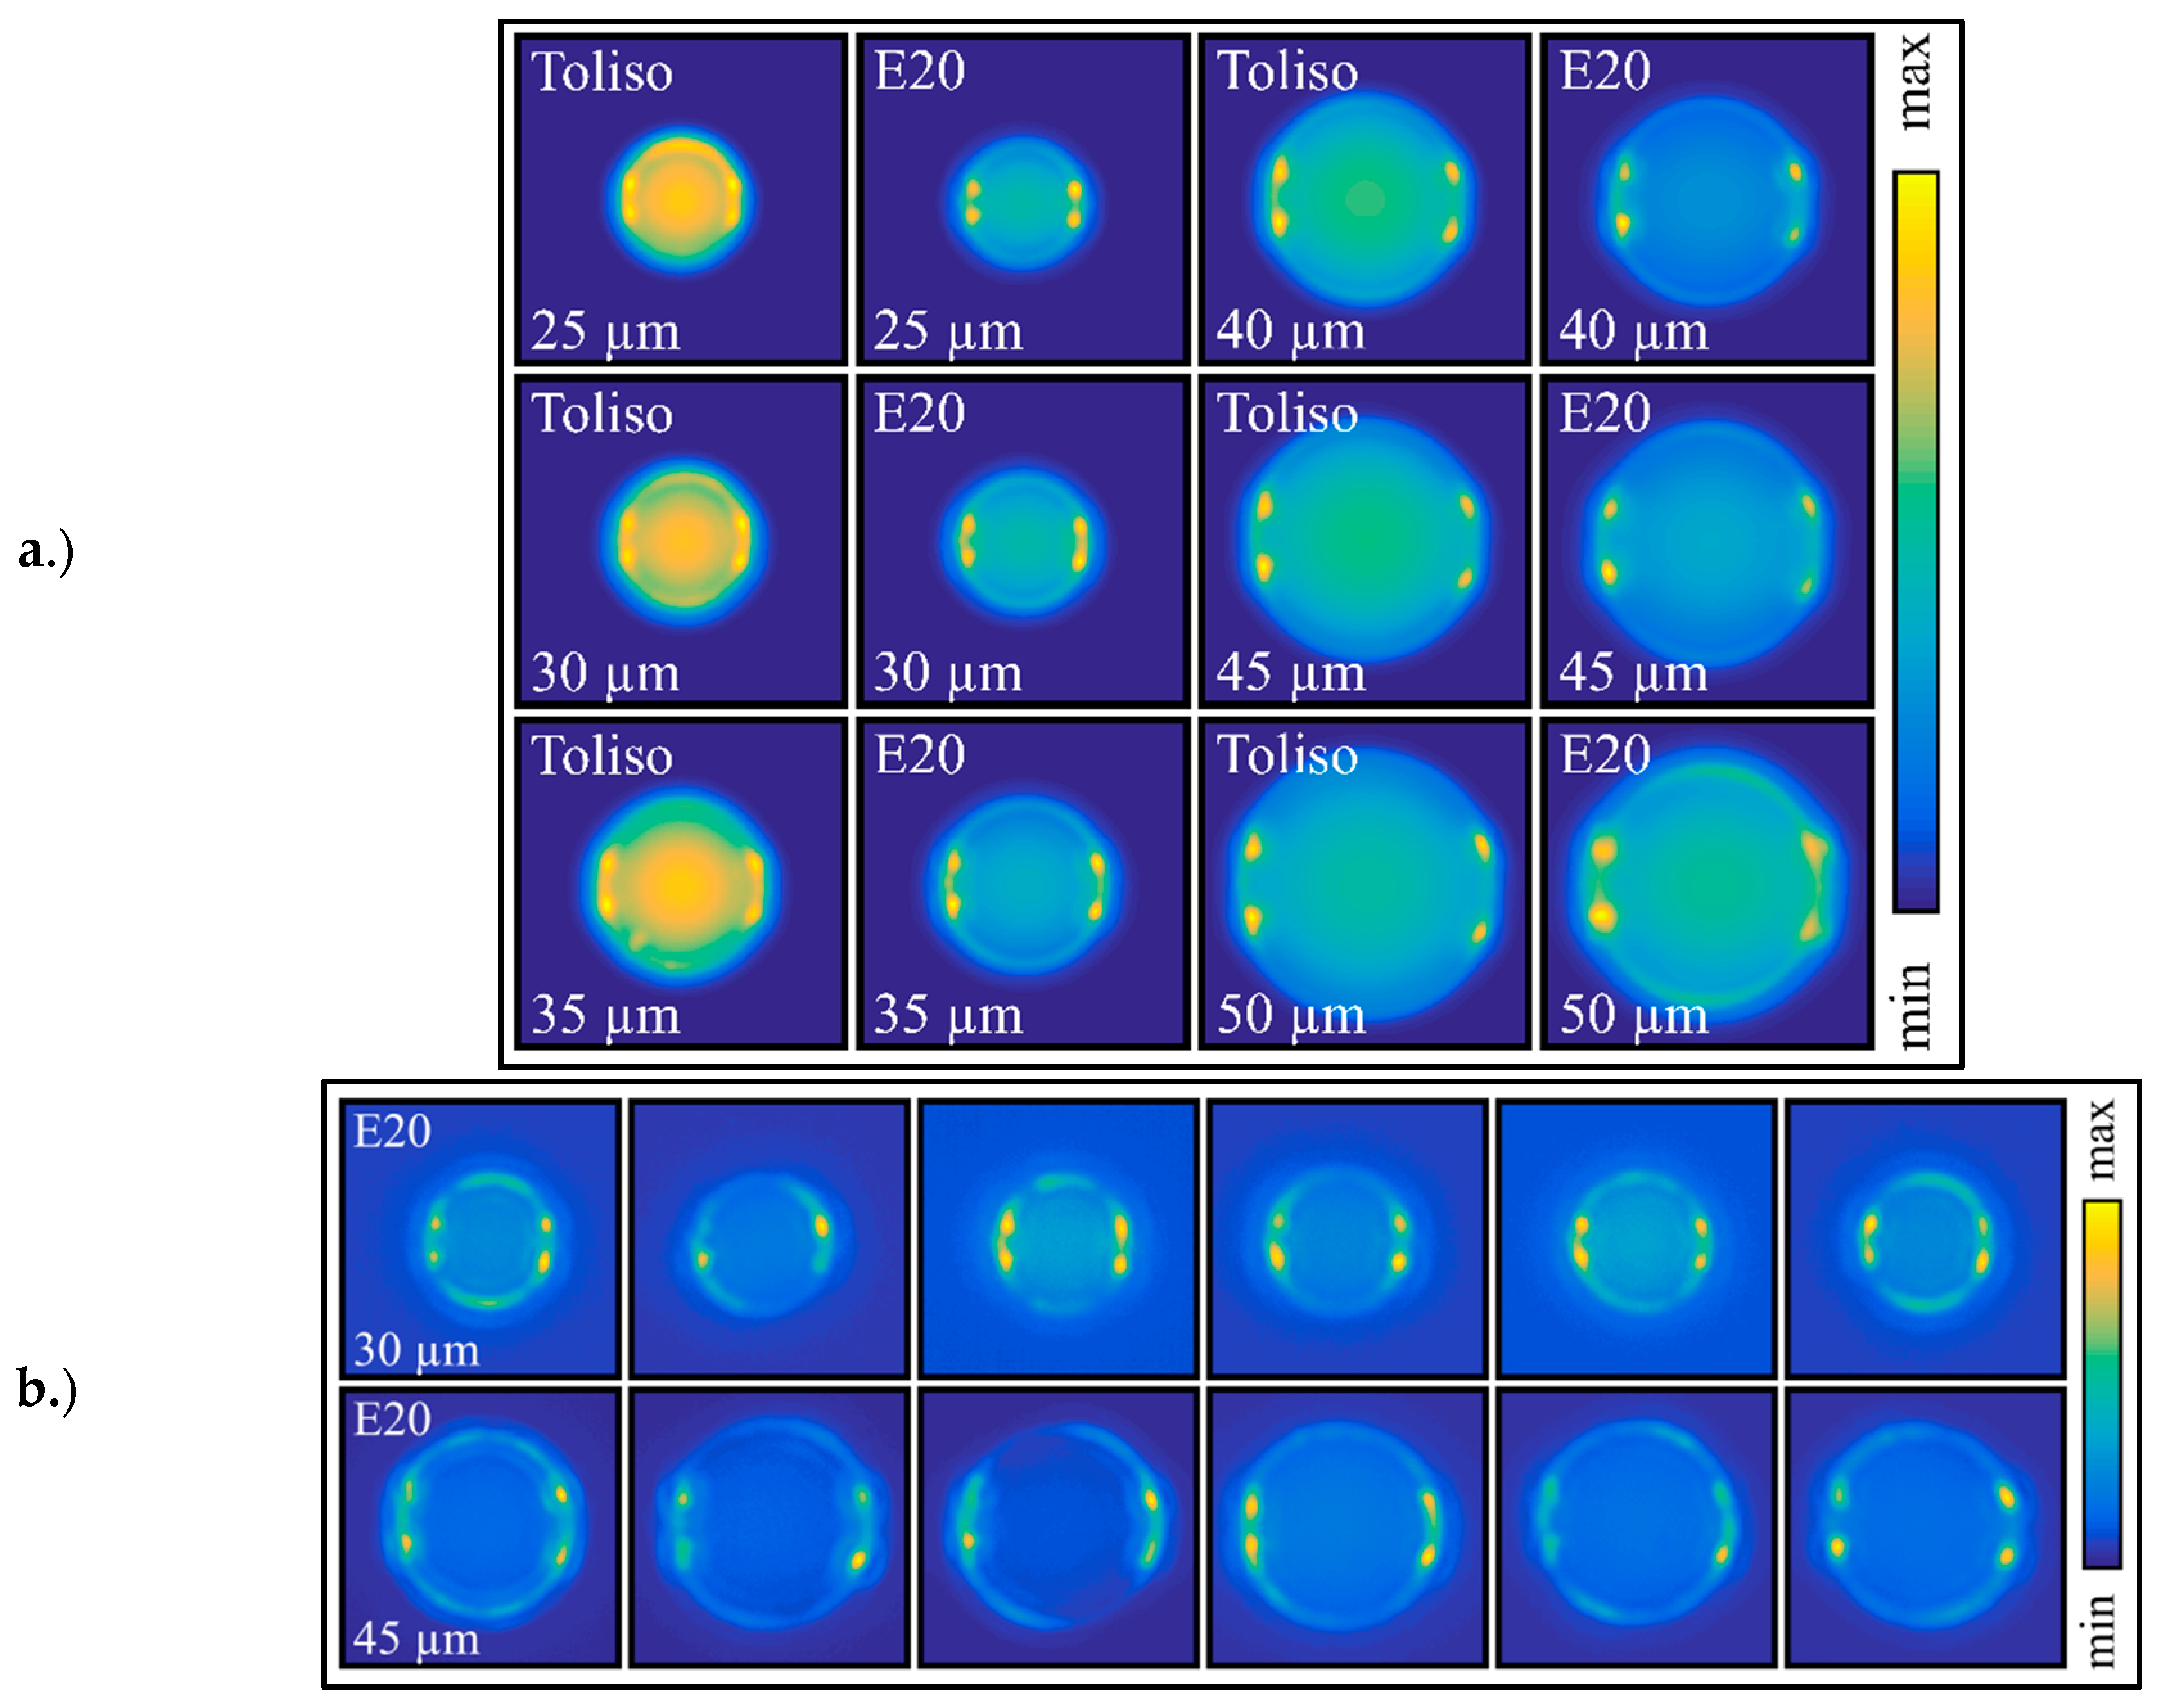
3.2. Microscopic and Macroscopic Droplet Measurements

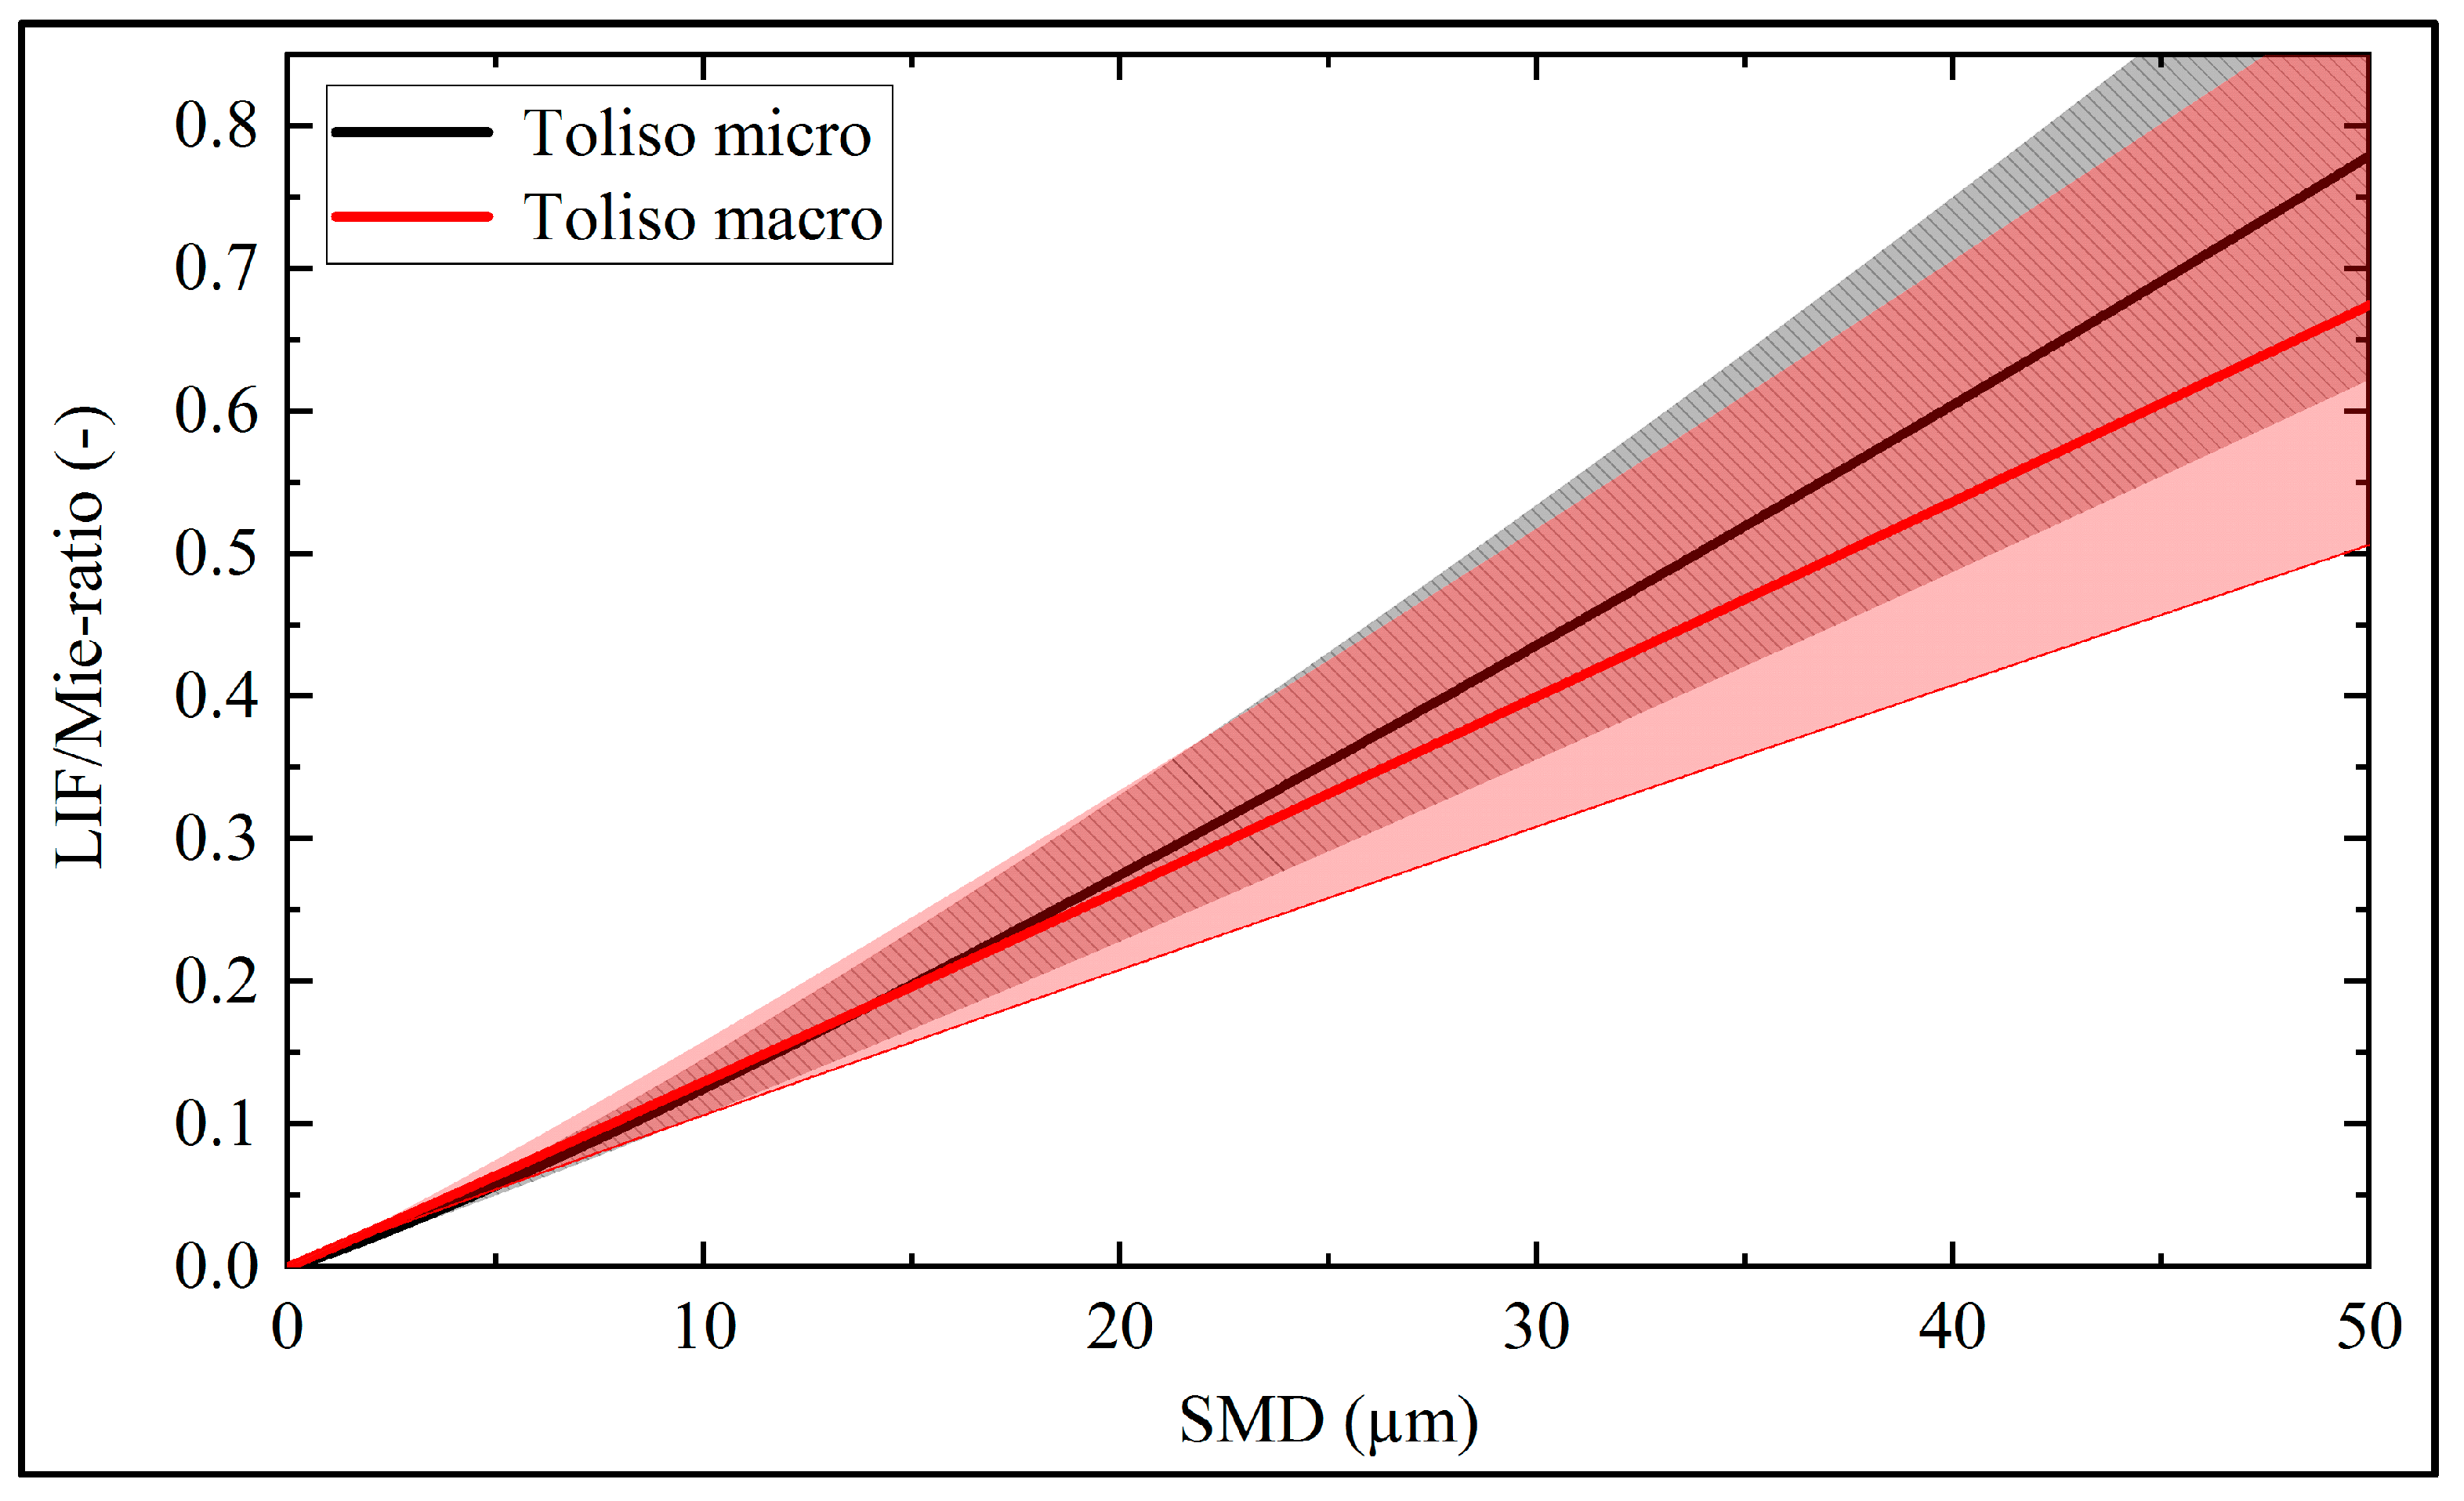
3.2.1. LIF and Mie Signals of Toliso

Figure 3 shows the simultaneous single-shot images of the LIF and the Mie signals of the Toliso droplet chain of the microscopic and macroscopic detection systems at reference conditions (293 K, 0.1 MPa). Due to the larger ROI, the macroscopic resolution was around 24 times lower than the microscopic resolution. The laser light enters the droplets from the left side. The images are shown zoomed for clarity. Bright spots and glare points become visible inside the droplets in the LIF and Mie images. Morphology-dependent resonance (MDR) effects are also visible, mainly in the form of a ring-shaped outer layer (see also Figure 7 below). The MDRs are commonly present at high laser fluence. The Mie images of the microscopic image (bottom row) mainly consist of two glare points. The intensity of the entrance glare point (reflection) is higher in comparison to the exiting glare point, as refraction and extinction effects take place within the droplet. The macroscopic image consists only of one very large and bright spot, which is also true for the macroscopic LIF image. In the microscopic LIF image, the signal exists throughout the whole droplet with a larger intensity in the center and bright spots at the surface.
The fitting curves for all evaluated individual LIF and Mie signals of Toliso are shown in Figure 4. as a function of the droplet diameter with the corresponding standard deviations of the curve fitting. In total, 31,019 single droplets were processed. The Mie curve shows a roughly quadratic dependency on the SMD and a relatively large standard deviation. In principle, the Mie scattering intensity was characterized by strong intensity oscillations with droplet size [14], which distinctly contribute to the large standard deviation. Nevertheless, the selected detection angle area smoothens these oscillations and enables a potential fitting procedure (further details can be found in previous work [15]).
The microscopic LIF and the Mie signals at 293 K can be described by the following equations:
I L I F _ T o l i s o _ 293 K ( m i c r o ) = f ( d d r o p l e t ) = 367.1 · d d r o p l e t 3.03
I M i e _ T o l i s o _ 293 K ( m i c r o ) = f ( d d r o p l e t ) = 53777 · d d r o p l e t 1.87
The LIF signal closely followed a d3 dependence and the Mie signal showed an approximate d2 dependence which is in accordance with the LIF/Mie theory [7,8,9,10,11,12,13,14].
The comparison between the microscopic and macroscopic detection on the LIF/Mie ratio of Toliso with the corresponding standard deviations of the curve fitting is shown in Figure 5.
The microscopic and macroscopic LIF/Mie ratios at 293 K can be described by the following equations:
I L I F / M i e _ T o l i s o _ 293 K ( m i c r o ) = f ( d d r o p l e t ) = 0.0092 · d d r o p l e t 1.14
I L I F / M i e _ T o l i s o _ 293 K ( m a c r o ) = f ( d d r o p l e t ) = 0.0123 · d d r o p l e t 1.02
Both fitting curves showed the approximate d dependence according to the LIF/Mie ratio approach [6,7].
The macroscopic fitting curve of Toliso lies below the microscopic function and showed a larger deviation from the microscopic fitting curve at increased droplet sizes. Due to the higher resolution and the lower standard deviation of the microscopic signal in comparison with the macroscopic signal, microscopic detection was used for further investigations.

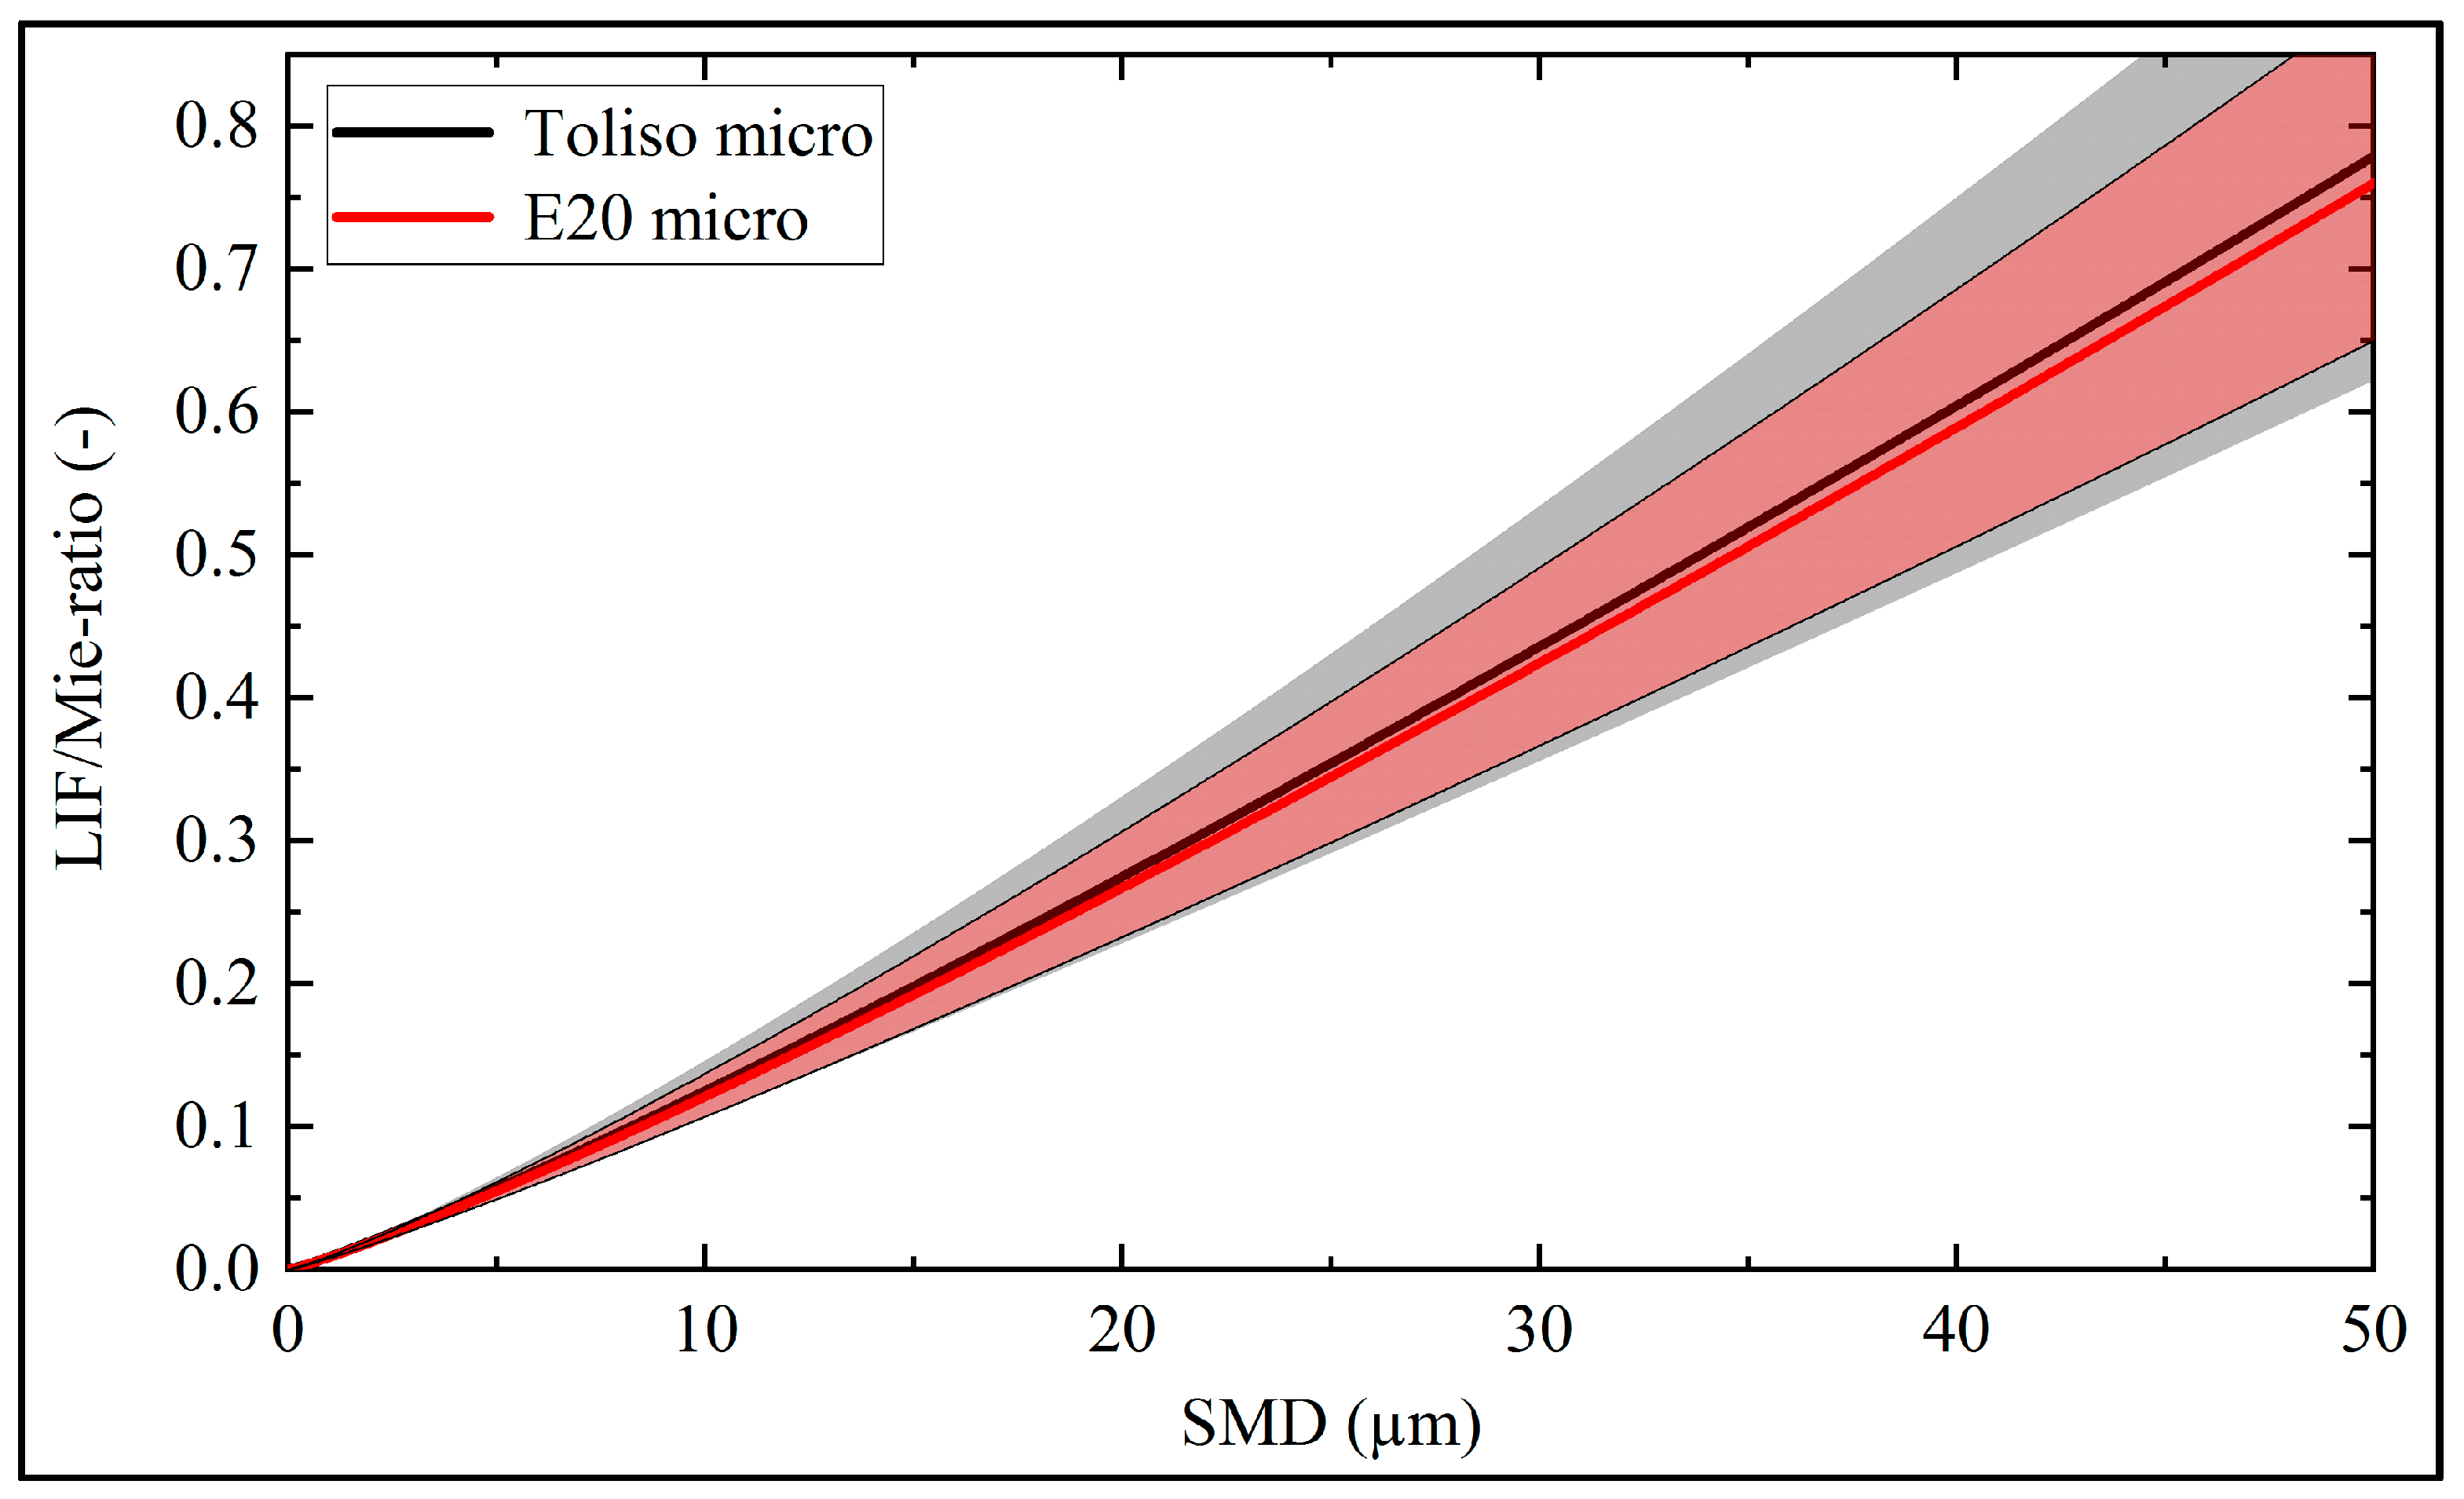
3.2.2. Effects of Ethanol Admixture

The effects of ethanol admixture were studied at a constant dye concentration (100 mg/l nile red) at reference conditions (293 K, 0.1 MPa) in terms of the LIF/Mie ratio. The fitting curves for the LIF signals as a function of the droplet diameter are displayed in Figure 6.
The microscopic LIF, Mie, and LIF/Mie ratio of E20 at 293 K can be described by the following equations:
I L I F _ E 20 _ 293 K ( m i c r o ) = f ( d d r o p l e t ) = 54.97 · d d r o p l e t 3.34
I M i e _ E 20 _ 293 K ( m i c r o ) = f ( d d r o p l e t ) = 9355 · d d r o p l e t 2.02
I L I F / M i e _ E 20 _ 293 K ( m i c r o ) = f ( d d r o p l e t ) = 0.0087 · d d r o p l e t 1.14
The microscopic fitting curves showed a similar trend for both investigated fuels. The ethanol admixture led to an increase in the microscopic LIF signal exponent from ~3.03 to ~3.34 and the Mie exponent from ~1.87 to ~2.02 in comparison to the base fuel Toliso. The resulting microscopic LIF/Mie-ratio exponents were not dependent on the ethanol admixture and had the same value of 1.14. According to Le Gal [6], an exponent greater than three for the LIF signal and an exponent greater than two for the Mie signal are mainly attributed to MDR emissions (i.e., “cavity mode effects”) in the droplets. This can be confirmed by Figure 7a showing the bin-wise (ddroplet ± 0.25 µm) averaged LIF droplet signals for a droplet size ranging from 25 µm to 50 µm. There, E20 exhibited stronger MDR effects which were characterized by ring-shaped structures at the outer part of the droplet.
These structures are more visible in the single-shot images in Figure 7b where two droplet size classes (30 µm, 45 µm) are displayed. These MDRs can occur in the form of complete rings or fractions of it, sometimes only a few bright spots are apparent inside the droplets.

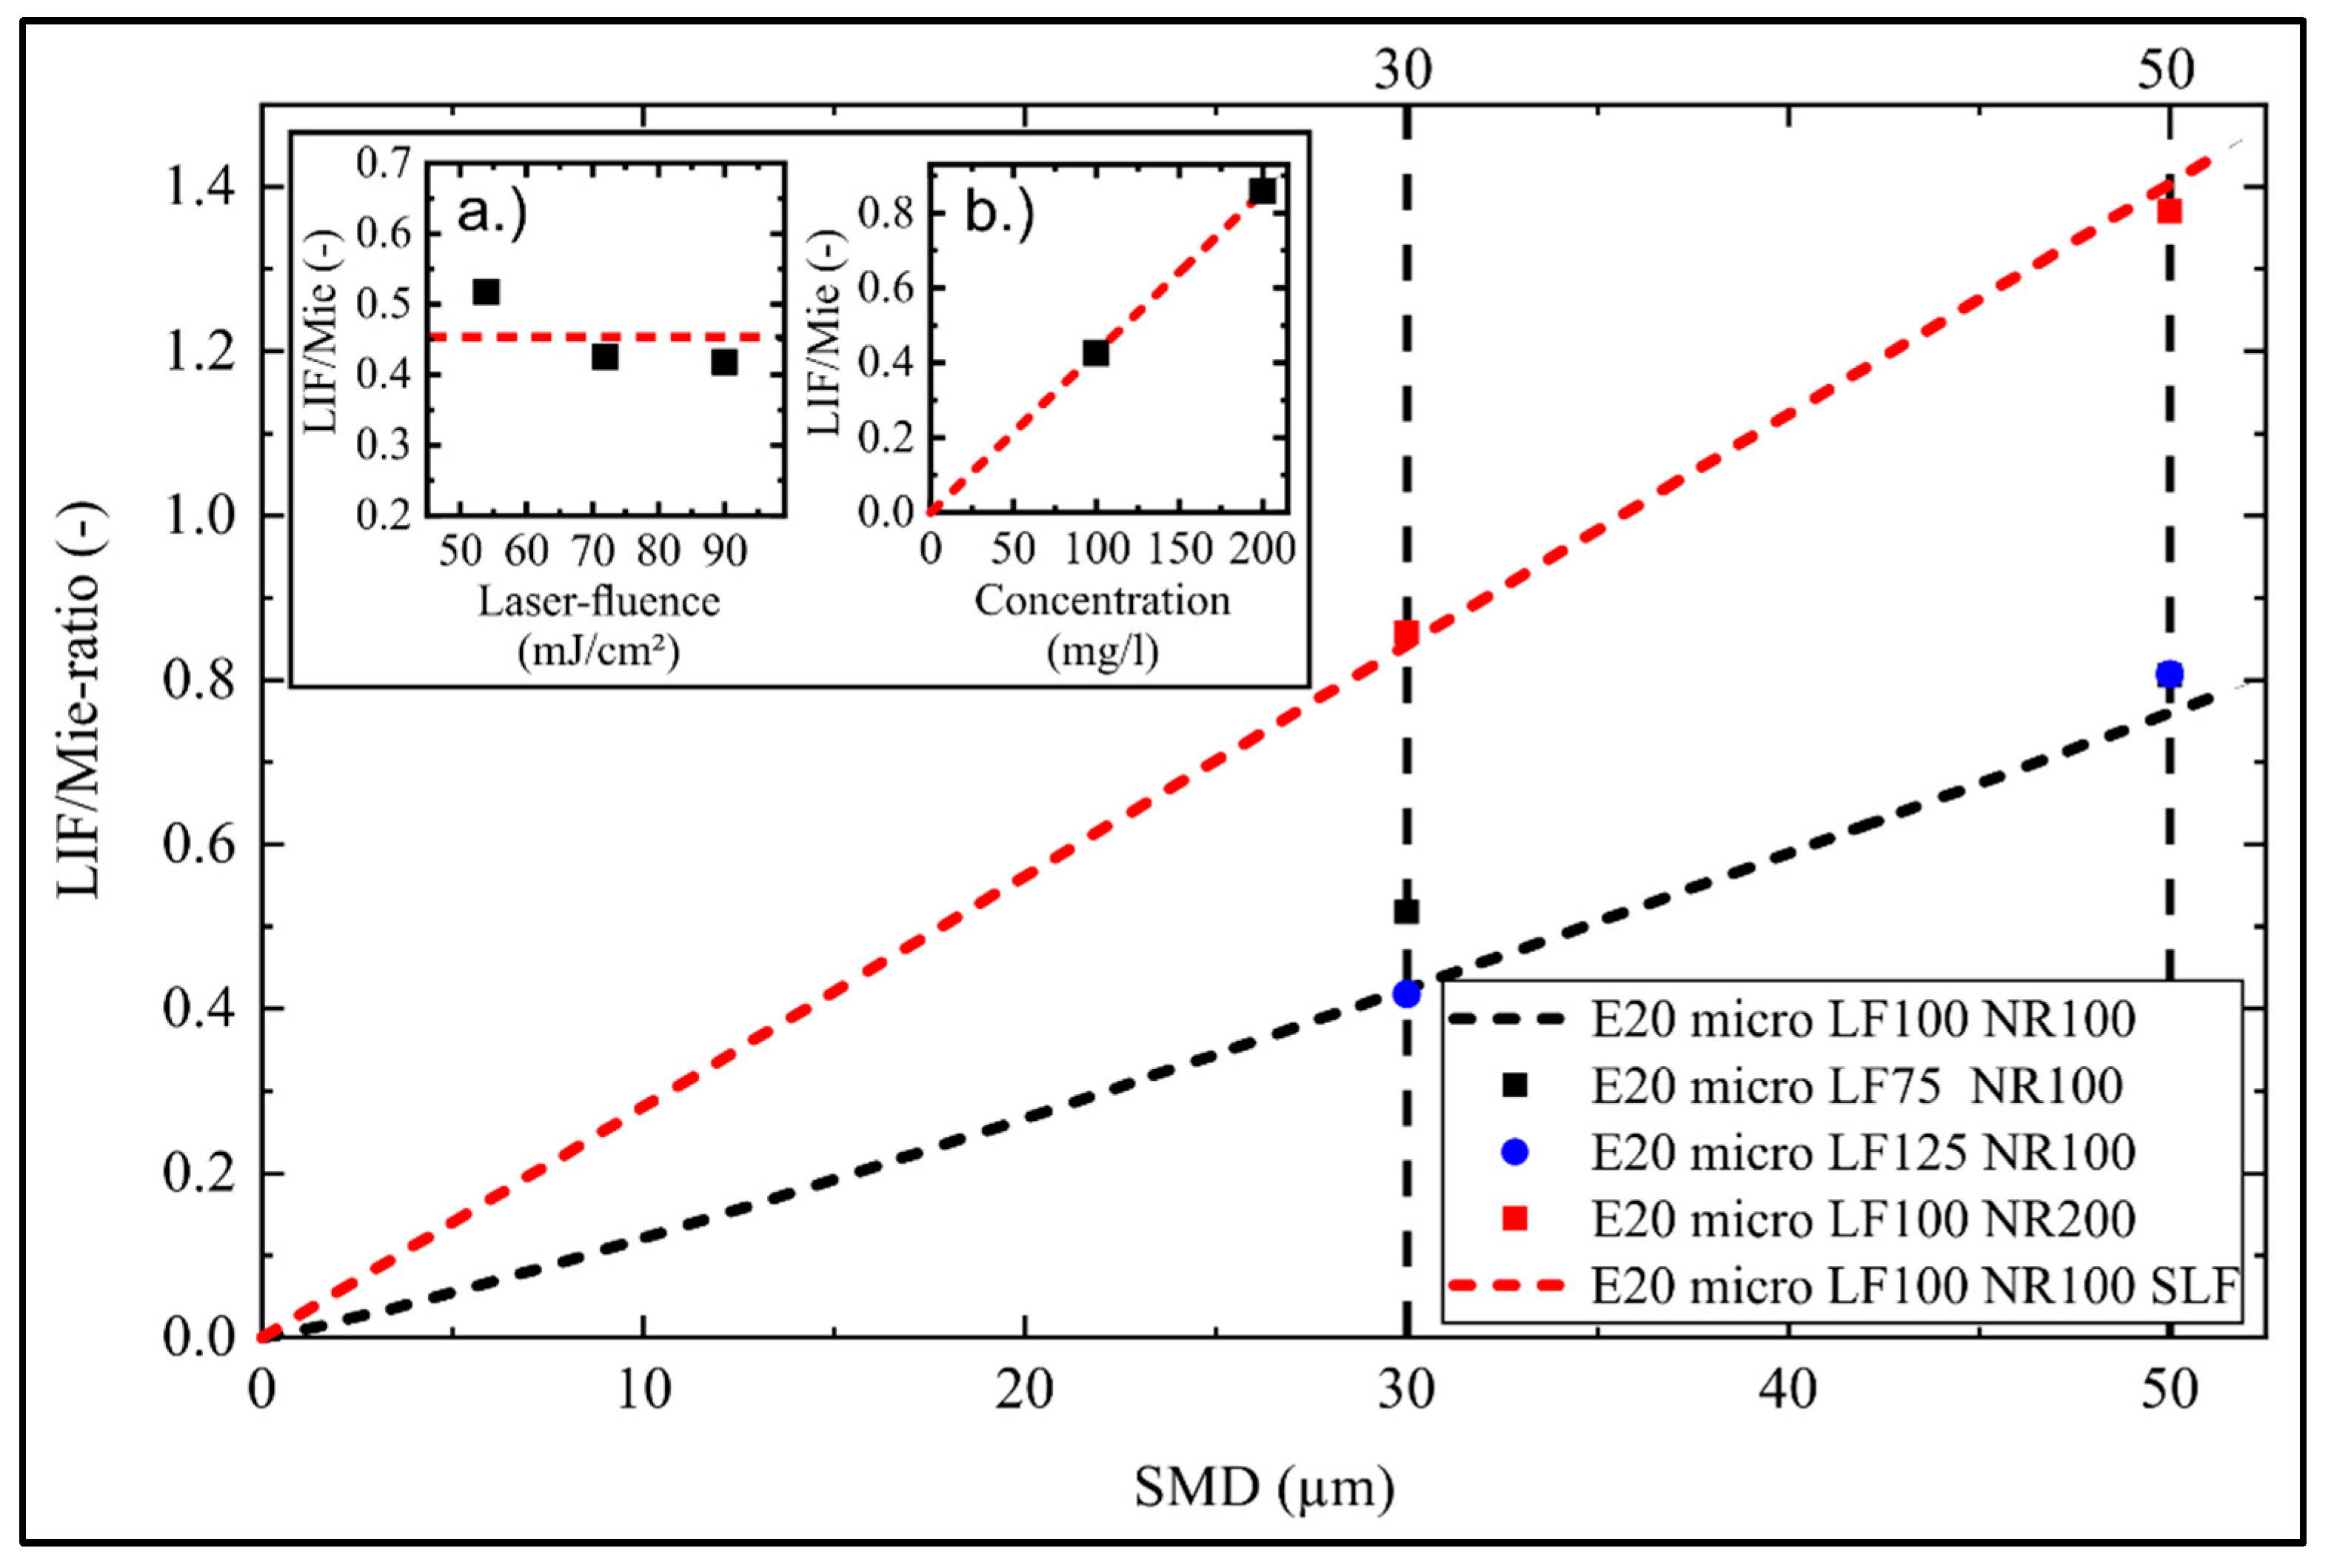
3.2.3. Effects of Laser Fluence and Dye Concentration on the LIF/Mie Ratio

The effects of laser fluence and dye concentration are presented in the following section based on E20 at reference conditions. The results are presented in Figure 8. For all investigations, representative droplet sizes of 30 µm and 50 µm (in an interval of ±0.5 µm each) were studied, to avoid extensive time-consuming measurements of the entire droplet range. Datasets covering the entire droplet size spectrum were already performed in a previous study except for the fuel ethanol in combination with the tracer eosin Y [15]. A reduced dataset was chosen to study the dependencies of the LIF/Mie ratio on laser fluence and dye concentration. Three laser fluences of 54 mJ/cm2, 72 mJ/cm2 (reference condition, corresponding to a pulse energy of 1.48 mJ), and 90 mJ/cm2 were chosen for these investigations. The laser fluence showed only a small impact on the LIF/Mie ratio (see the inset at the upper-left side in Figure 8) which is in accordance with several other studies [15,17,20]. Basically, the LIF/Mie ratio does not vary with the laser fluence in the investigated range, as both the LIF and Mie signals showed linear behavior unless effects such as saturation occurred. This behavior is advantageous for spray measurements, as temporal and spatial fluctuations in laser fluence will play a minor role in such cases.
The influence of the dye variation was studied using nile red concentrations of 100 mg/l and 200 mg/l in E20 at a constant laser fluence (72 mJ/cm2). The linear increase of the ratio with increasing dye concentration is shown in Figure 8 (see the insert on the upper right). For both droplet sizes, a doubling of the dye concentration led to a doubled LIF/Mie ratio. This measurement confirms the linear behavior of the LIF signal as a function of dye concentration, while the Mie signal should hardly be affected as long as laser extinction effects in the droplet were negligible. Additional uncertainties due to the saturation of the LIF signal were not observed. However, a partial evaporation of the fuel droplets at high or moderate ambient temperatures may lead to an increase of the dye concentration within the shrinking droplets. This will result in an increased LIF/Mie ratio and in an overestimated droplet size in spray experiments. Consequently, reliable droplet sizing measurements should preferably be conducted at moderate ambient conditions in combination with low evaporation rates. For conditions with increased evaporation rates in spray measurements, the variation of the dye concentration must be corrected. Another aspect is the varying droplet temperature during droplet heating and evaporation (of a spray), which will affect the LIF/Mie ratio. This source of uncertainty is discussed in the subsequent section.

3.2.4. Effects of Liquid Temperature

In a droplet chain and in a spray, evaporation effects have to be taken into account. In a hot ambience, the droplet will heat up first while, during evaporation, the droplet temperature may drop again due to the evaporation enthalpy of the fuel. The effect of the liquid temperature of a monodisperse droplet chain on the LIF/Mie ratio was investigated for E20. The corresponding microscopic fitting curves for the investigated temperatures are shown in Figure 9.
The equation of the microscopic LIF/Mie ratio at 293 K is shown in Equation (7), the behavior of the microscopic LIF/Mie ratios at 263K and at 323K are shown in the subsequent equations:
I L I F / M i e _ E 20 _ 263 K ( m i c r o ) = f ( d d r o p l e t ) = 0.0037 · d d r o p l e t 1.30
I L I F / M i e _ E 20 _ 323 K ( m i c r o ) = f ( d d r o p l e t ) = 0.0105 · d d r o p l e t 1.37
An increase in liquid temperature from 263 K to 293 K does not show distinct variations in the LIF/Mie ratio. For example, an increase of 9% was observed for a droplet size of 30 µm. The temperature dependency of the LIF signal was in accordance with the spectral analysis of the LIF signals in the micro cell (see Figure 2) which shows an increase in integrated intensity of 13% for a temperature variation from 263 K to 293 K. Thus, it can be confirmed that the temperature dependence of the LIF signal had a low influence on the accuracy of the LIF/Mie ratio technique at moderate temperatures. However, the elevated droplet temperature (323 K) leads to a more distinct change in the LIF/Mie ratio in comparison to 263 K and 293 K. For a droplet size of 30 µm, this temperature increase results in an increase of the LIF/Mie ratio of 56%. In general, previous investigations of monodisperse ethanol droplets using eosin-Y as dye showed a similar temperature behavior [15]. The temperature study within the droplet chain shows that droplet heating and cooling have to be taken into account for planar droplet sizing. The LIF/Mie ratio technique is suitable for the investigated fuel–dye-mixtures at moderate temperature variations without temperature and concentration correction, i.e., under conditions with low fuel evaporation rates and reduced droplet heating or cooling.

4. Conclusions and Outlook

The microscopic and macroscopic LIF and Mie signals of micrometric monodisperse fuel droplets doped with nile red were investigated and the suitability of this tracer for planar droplet sizing was discussed. The surrogate fuel Toliso, used to simulate commercial gasoline, and the ethanol–gasoline blend E20 were used as fuels. The spectral emissions of the investigated fuel–dye mixtures were analyzed in a specially designed dye cell in a preliminary study at varying temperatures. Excited at 532 nm, the fluorescence signal was in the visible wavelength region (400–750 nm). Both fuel–dye-mixtures showed a low temperature sensitivity of the fluorescence at moderate temperature variations (283–313 K), which is essential for reliable direct droplet sizing using the LIF/Mie approach. The ethanol admixture of E20 resulted in slightly larger fluorescence signals, and the fluorescence spectrum was shifted 50 nm towards higher wavelengths. This suggests that for each gasoline-–ethanol mixture, an individual LIF/Mie-calibration curve is necessary.
For calibration, monodisperse droplets were produced with a droplet generator and the respective 2D LIF and Mie signals were simultaneously analyzed with microscopic and macroscopic detection systems. The fitting curves for the LIF and Mie signals were deduced after adequate post processing according to the power law function I = a·db. The LIF and Mie signals of Toliso showed an approximate d3- and d2-dependence, respectively, in accordance with theory. The Mie signals showed an overall higher standard deviation in comparison to the LIF signal because of the typical Mie signal oscillations within the chosen detection angular aperture. For the macroscopic detection, a lower LIF/Mie ratio and higher respective standard deviations were observed in comparison to the microscopic detection. This is caused by the lower resolution and SNR of the macroscopic detection system. A comparison of Toliso and E20 led to similar LIF/Mie ratios for both fuels despite the spectral shift of the fluorescence. An analysis of the single droplets showed more distinct MDR effects and glare points for E20 in comparison to the base fuel Toliso. This was probably because of the different absorption and emission behaviors of the dye dissolved in E20 leading to an increase of the LIF exponent from ~3.03 to ~3.34 and of the Mie exponent from ~1.87 to ~2.02. Further investigations showed that the LIF/Mie ratio did not depend on laser power but directly increased with the dye concentration as expected. To avoid enrichment of the dye within the evaporating droplets of a spray, fuel evaporation had to be avoided (or corrected) so that a reliable droplet sizing was possible under moderate ambient temperatures. An investigation of the temperature dependence of the LIF/Mie ratio showed almost no temperature sensitivity under moderate ambient conditions (between 263 K and 293 K), but a distinct increase of several tens of percent for a temperature rise to 323 K. In summary, the suggested dye is suitable for planar droplet sizing in sprays at moderate temperatures based on the LIF/Mie ratio at which evaporation and distinct droplet heating or evaporation cooling can be neglected. Under conditions with larger droplet heating and increased evaporation rates, additional dye concentration measurements and droplet thermometry is required to avoid overestimation of droplet sizes. Finally, a detailed study of the MDR effects on the LIF/Mie ratio calibration curve and its measurement uncertainty will be performed in future. Afterwards, subsequent planar measurements in the spray will be conducted which require a suppression of multiple scattering, for example, using the structured laser illumination planar imaging (SLIPI) [20,23,47].

Author Contributions

M.K. designed the experimental setup; E.B. provided the droplet generator and parts of the optical equipment; K.B. and M.K. performed the measurements; M.K. and L.Z. performed the data evaluation; F.J.B. and B.H. supported the post-processing; M.K., L.Z. and S.W. wrote the paper; E.B. corrected the paper;

Funding

This research was partly funded by Agreement No. 638546—ERC starting grant “Spray-Imaging”.

Acknowledgments

The authors acknowledge support by the Erlangen Graduate School in Advanced Optical Technologies (SAOT), which is funded by German Research Foundation (DFG). The authors thank Franz Huber (LTT) for supporting the data evaluation.

Conflicts of Interest

The authors declare no conflict of interest.

References

  1. Koegl, M.; Hofbeck, B.; Will, S.; Zigan, L. Investigation of soot formation and oxidation of ethanol and butanol fuel blends in a DISI engine at different exhaust gas recirculation rates. Appl. Energy 2018, 209, 426–434. [Google Scholar] [CrossRef]
  2. Storch, M.; Zigan, L.; Wensing, M.; Will, S. Systematic Investigation of the Influence of Ethanol Blending on Sooting Combustion in DISI Engines Using High-Speed Imaging and LII. SAE Tech. Pap. 2014. [Google Scholar] [CrossRef]
  3. Chen, L.; Stone, R. Measurement of Enthalpies of Vaporization of Isooctane and Ethanol Blends and Their Effects on PM Emissions from a GDI Engine. Energy Fuels 2011, 25, 1254–1259. [Google Scholar] [CrossRef]
  4. Storch, M.; Hinrichsen, F.; Wensing, M.; Will, S.; Zigan, L. The effect of ethanol blending on mixture formation, combustion and soot emission studied in an optical DISI engine. Appl. Energy 2015, 156, 783–792. [Google Scholar] [CrossRef]
  5. Koegl, M.; Mishra, Y.N.; Storch, M.; Conrad, C.; Berrocal, E.; Will, S.; Zigan, L. Analysis of ethanol and butanol direct-injection spark-ignition sprays using two-phase structured laser illumination planar imaging droplet sizing. Int. J. Spray Combust. Dyn. 2019, 11, 16. [Google Scholar] [CrossRef]
  6. Le Gal, P.; Farrugia, N.; Greenhalgh, D.A. Laser Sheet Dropsizing of dense sprays. Opt. Laser Technol. 1999, 31, 75–83. [Google Scholar] [CrossRef]
  7. Domann, R.; Hardalupas, Y. Quantitative Measurement of Planar Droplet Sauter Mean Diameter in Sprays using Planar Droplet Sizing. Part. Part. Syst. Charact. 2003, 20, 209–218. [Google Scholar] [CrossRef]
  8. Domann, R.; Hardalupas, Y. Spatial distribution of fluorescence intensity within large droplets and its dependence on dye concentration. Appl. Opt. 2001, 40, 3586–3597. [Google Scholar] [CrossRef]
  9. Domann, R.; Hardalupas, Y. A Study of Parameters that Influence the Accuracy of the Planar Droplet Sizing (PDS) Technique. Part. Part. Syst. Charact. 2001, 18, 3–11. [Google Scholar] [CrossRef]
  10. Domann, R.; Hardalupas, Y.; Jones, A.R. A study of the influence of absorption on the spatial distribution of fluorescence intensity within large droplets using Mie theory, geometrical optics and imaging experiments. Meas. Sci. Tech. 2002, 13, 280–291. [Google Scholar] [CrossRef]
  11. Frackowiak, B.; Tropea, C. Fluorescence modeling of droplets intersecting a focused laser beam. Opt. Lett. 2010, 35, 1386–1388. [Google Scholar] [CrossRef] [PubMed]
  12. Frackowiak, B.; Tropea, C. Numerical analysis of diameter influence on droplet fluorescence. Appl. Opt. 2010, 49, 2363–2370. [Google Scholar] [CrossRef] [PubMed]
  13. Charalampous, G.; Hardalupas, Y. Method to reduce errors of droplet sizing based on the ratio of fluorescent and scattered light intensities (laser-induced fluorescence/Mie technique). Appl. Opt. 2011, 50, 3622–3637. [Google Scholar] [CrossRef] [PubMed]
  14. Charalampous, G.; Hardalupas, Y. Numerical evaluation of droplet sizing based on the ratio of fluorescent and scattered light intensities (LIF/Mie technique). Appl. Opt. 2011, 50, 1197–1209. [Google Scholar] [CrossRef]
  15. Koegl, M.; Hofbeck, B.; Baderschneider, K.; Mishra, Y.N.; Huber, F.J.T.; Berrocal, E.; Will, S.; Zigan, L. Analysis of LIF and Mie signals from single micrometric droplets for instantaneous droplet sizing in sprays. Opt. Express 2018, 26, 31750–31766. [Google Scholar] [CrossRef]
  16. Koegl, M.; Mishra, Y.N.; Hofbeck, B.; Baderschneider, K.; Huber, F.J.T.; Pracht, J.; Berrocal, E.; Will, S.; Zigan, L. 3D LIF/Mie planar droplet sizing in IC engine sprays using single-droplet calibration data. In Proceedings of the ICLASS 2018: 14th International Conference on Liquid Atomization & Spray Systems, Chicago IL, USA, 22–26 July 2018. [Google Scholar]
  17. Park, S.; Cho, H.; Yoon, I.; Min, K. Measurement of droplet size distribution of gasoline direct injection spray by droplet generator and planar image technique. Meas. Sci. Tech. 2002, 13, 859–864. [Google Scholar] [CrossRef]
  18. Zhao, H.; Ladommatos, N. Optical diagnostics for in-cylinder mixture formation measurements in IC engines. Prog. Energy Combust. Sci. 1998, 24, 297–336. [Google Scholar] [CrossRef]
  19. Wieske, P.; Wissel, S.; Grünefeld, G.; Pischinger, S. Improvement of LIEF by wavelength-resolved acquisition of multiple images using a single CCD detector—Simultaneous 2D measurement of air/fuel ratio, temperature distribution of the liquid phase and qualitative distribution of the liquid phase with the Multi-2D technique. Appl. Phys. B 2006, 83, 323. [Google Scholar] [CrossRef]
  20. Mishra, Y.N.; Kristensson, E.; Berrocal, E. Reliable LIF/Mie droplet sizing in sprays using structured laser illumination planar imaging. Opt. Express 2014, 22, 4480–4492. [Google Scholar] [CrossRef]
  21. Jermy, M.C.; Greenhalgh, D.A. Planar dropsizing by elastic and fluorescence scattering in sprays too dense for phase Doppler measurement. Appl. Phys. B 2000, 71, 703–710. [Google Scholar] [CrossRef]
  22. Mishra, Y.N.; Kristensson, E.; Koegl, M.; Jonsson, J.; Zigan, L.; Berrocal, E. Comparison between two-phase and one-phase SLIPI for instantaneous imaging of transient sprays. Exp. Fluids 2017, 58, 110. [Google Scholar] [CrossRef]
  23. Storch, M.; Mishra, Y.N.; Koegl, M.; Kristensson, E.; Will, S.; Zigan, L.; Berrocal, E. Two-phase SLIPI for instantaneous LIF and Mie imaging of transient fuel sprays. Opt. Lett. 2016, 41, 5422–5425. [Google Scholar] [CrossRef]
  24. Durst, A.; Wensing, M.; Berrocal, E. Light sheet fluorescence microscopic imaging for the primary breakup of diesel and gasoline sprays with real-world fuels. Appl. Opt. 2018, 57, 2704. [Google Scholar] [CrossRef] [PubMed]
  25. Mishra, Y.N.; Koegl, M.; Baderschneider, K.; Hofbeck, B.; Berrocal, E.; Conrad, C.; Will, S.; Zigan, L. 3D mapping of droplet Sauter mean diameter in sprays. Appl. Opt. 2019, 58, 3775–3783. [Google Scholar] [CrossRef] [PubMed]
  26. Depredurand, V.; Castanet, G.; Lemoine, F. Heat and mass transfer in evaporating droplets in interaction: Influence of the fuel. Int. J. Heat Mass Transf. 2010, 53, 3495–3502. [Google Scholar] [CrossRef]
  27. Depredurand, V.; Miron, P.; Labergue, A.; Wolff, M.; Castanet, G.; Lemoine, F. A temperature-sensitive tracer suitable for two-colour laser-induced fluorescence thermometry applied to evaporating fuel droplets. Meas. Sci. Tech. 2008, 19, 105403. [Google Scholar] [CrossRef]
  28. Koegl, M.; Mull, C.; Baderschneider, K.; Wislicenus, J.; Will, S.; Zigan, L. Characterization of Nile Red as a Tracer for Laser-Induced Fluorescence Spectroscopy of Gasoline and Kerosene and Their Mixture with Biofuels. Sensors 2019, 19, 2822. [Google Scholar] [CrossRef]
  29. Zhang, Y.; Leng, J.; Hu, W. Theoretical Design of a Two-Photon Fluorescent Probe for Nitric Oxide with Enhanced Emission Induced by Photoninduced Electron Transfer. Sensors 2018, 18, 1324. [Google Scholar] [CrossRef]
  30. Lin, B.S.; Yang, Y.C.; Ho, C.Y.; Yang, H.Y.; Wang, H.Y. A PDMS-based cylindrical hybrid lens for enhanced fluorescence detection in microfluidic systems. Sensors 2014, 14, 2967–2980. [Google Scholar] [CrossRef]
  31. Greenspan, P.; Fowler, S.D. Spectrofluorometric Studies of the Lipid Probe, Nile Red. J. Lipid Res. 1985, 26, 781–789. [Google Scholar]
  32. Storch, M.; Pfaffenberger, A.; Koegl, M.; Will, S.; Zigan, L. Combustion and Sooting Behavior of Spark-Ignited Ethanol–Isooctane Sprays under Stratified Charge Conditions. Energy Fuels 2016, 30, 6080–6090. [Google Scholar] [CrossRef]
  33. Koegl, M.; Hofbeck, B.; Will, S.; Zigan, L. Influence of EGR and ethanol blending on soot formation in a DISI engine. Proc. Combust. Inst. 2019, 37, 4965–4972. [Google Scholar] [CrossRef]
  34. MSP Corporation Announces a New Breakthrough in Monodisperse Droplet Generation. Available online: http://www.prweb.com/releases/2017/03/prweb14170934.htm (accessed on 24 July 2019).
  35. Li, H.; Rosebrock, C.D.; Wriedt, T.; Mädler, L. The effect of initial diameter on rainbow positions and temperature distributions of burning single-component n-Alkane droplets. J. Quant. Spectrosc. Radiat. Transf. 2017, 195, 164–175. [Google Scholar] [CrossRef]
  36. Storch, M.; Koegl, M.; Altenhoff, M.; Will, S.; Zigan, L. Investigation of soot formation of spark-ignited ethanol-blended gasoline sprays with single- and multi-component base fuels. Appl. Energy 2016, 181, 278–287. [Google Scholar] [CrossRef]
  37. Burri, J.; Crockett, R.; Hany, R.; Rentsch, D. Gasoline composition determined by 1H NMR spectroscopy. Fuel 2004, 83, 187–193. [Google Scholar] [CrossRef]
  38. Choi, B.C.; Choi, S.K.; Chung, S.H. Soot formation characteristics of gasoline surrogate fuels in counterflow diffusion flames. Proc. Combust. Inst. 2011, 33, 609–616. [Google Scholar] [CrossRef]
  39. Dean, J.A. Lange’s Handbook of Chemistry, 15th ed.; McGraw-Hill Companies: New York NY, USA, 1999. [Google Scholar]
  40. Bronkhorst FLUIDAT on the Net. Available online: https://www.fluidat.com (accessed on 24 September 2019).
  41. GmbH, R.B. Kraftfahrtechnisches Taschenbuch; Vieweg+Teubner Verlag: Wiesbaden, Germany, 2011. [Google Scholar]
  42. Wang, F.; Wu, J.; Liu, Z. Surface Tensions of Mixtures of Diesel Oil or Gasoline and Dimethoxymethane, Dimethyl Carbonate, or Ethanol. Energy Fuels 2006, 20, 2471–2474. [Google Scholar] [CrossRef]
  43. Luning Prak, D.J.; Cowart, J.S.; Trulove, P.C. Density, Viscosity, Speed of Sound, Bulk Modulus, and Surface Tension of Binary Mixtures of n-Heptane + 2,2,4-Trimethylpentane at (293.15 to 338.15) K and 0.1 MPa. J. Chem. Eng. Data 2014, 59, 3842–3851. [Google Scholar] [CrossRef] [Green Version]
  44. Kalathimekkad, S.; Missinne, J.; Schaubroeck, D.; Mandamparambil, R.; Van Steenberge, G. Alcohol Vapor Sensor Based on Fluorescent Dye-Doped Optical Waveguides. IEEE Sens. J. 2015, 15, 76–81. [Google Scholar] [CrossRef]
  45. Onofri, F.R.A.; Ren, K.F.; Sentis, M.; Gaubert, Q.; Pelcé, C. Experimental validation of the vectorial complex ray model on the inter-caustics scattering of oblate droplets. Opt. Express 2015, 23, 15768–15773. [Google Scholar] [CrossRef] [Green Version]
  46. Koban, W.; Koch, J.D.; Hanson, R.K.; Schulz, C. Absorption and fluorescence of toluene vapor at elevated temperatures. Phys. Chem. Chem. Phys. 2004, 6, 2940–2945. [Google Scholar] [CrossRef]
  47. Berrocal, E.; Kristensson, E.; Hottenbach, P.; Aldén, M.; Grünefeld, G. Quantitative imaging of a non-combusting diesel spray using structured laser illumination planar imaging. Appl. Phys. B. 2012, 109, 683–694. [Google Scholar] [CrossRef]
Figure 1. Optical setup for the simultaneous microscopic and macroscopic LIF/Mie detection (a). Detail for the microscopic detection and the droplet generator (b).
Applsci 09 04900 g001
Figure 2. Fluorescence spectra for nile red (9.38 mg/l) in Toliso (a), E20 (b) at various temperatures normalized to 293 K, and a comparison of the two fuel mixtures plotted with the respective filter transmission curve (c). Fluorescence spectra were extracted from Reference [28].
Applsci 09 04900 g002
Figure 3. Simultaneous microscopic and macroscopic LIF and Mie images of single micrometric Toliso droplets (50 µm) at the reference conditions (293 K, nile red 100 mg/l).
Applsci 09 04900 g003
Figure 4. Fitting curves for the experimental microscopic data for LIF and Mie signals as a function of the droplet diameter at the reference condition (293 K, nile red 100 mg/l) with their corresponding standard deviations (Toliso).
Applsci 09 04900 g004
Figure 5. Fitting curve of the experimental data plotted for the LIF/Mie ratio as a function of the droplet diameter for Toliso with their corresponding standard deviations at the reference conditions (293 K, nile red 100 mg/l).
Applsci 09 04900 g005
Figure 6. Fitting curve of the experimental data plotted for the LIF/Mie ratio as a function of the droplet diameter for Toliso and E20 at the reference conditions (293 K, nile red 100 mg/l).
Applsci 09 04900 g006
Figure 7. (a) Bin-wise averaged LIF signals (ddroplet ± 0.25 µm) of micro droplets in diameter in a range of 25 µm to 50 µm at reference conditions (293 K, nile red 100 mg/l). The intensity was normalized to the respective maximum signal. (b) Single -hot fluorescence images for 30 µm and 45 µm droplets (E20) exhibiting MDR.
Applsci 09 04900 g007
Figure 8. Effects of the laser power and dye concentration on the LIF/Mie ratio for E20. The inserted diagrams show the effects of the variation of the laser power (a) and the dye concentration (b) on the LIF/Mie ratio, 293 K (nile red concentration: NR100 = 100 mg/l, NR200 = 200 mg/l; laser power: LF75 = 54 mJ/cm2, LF100 = 72 mJ/cm2, LF125 = 90 mJ/cm2; SLF = simplified linear fit).
Applsci 09 04900 g008
Figure 9. Effects of liquid temperature on the LIF/Mie ratio at a constant dye concentration (100 mg/l nile red) in E20, 293 K.
Applsci 09 04900 g009
Table 1. Physical and chemical properties of the investigated fuels and gasoline for various ambient conditions. Data are extracted from references [40,41,42,43,44].
PropertyUnitIsooctaneTolueneEthanolGasoline
H/C-ratio-2.251.143-
Boiling point @ 0.1 MPaK372383351298–483
Density @ 293 K, 0.1 MPag/cm30.690.870.790.72–0.78
Dynamic viscosity @ 0.1 MPa, 293 K mPa s0.5010.5871.1450.6
Surface tension @ 293 KN/m0.01880.02850.02240.0216
Heat of vaporization @ 293 K kJ/kg305.4409.3938.2380–500
Stoichiometric air-fuel ratio kg/kg15.213.49.014.7
Lower Heating Value MJ/kg44.640.626.840.1–41.6

