A Novel Artificial Intelligence Technique to Estimate the Gross Calorific Value of Coal Based on Meta-Heuristic and Support Vector Regression Algorithms
Abstract
1. Introduction
- -
- Big data with 2583 coal samples were used to analyze proximate components and the GCV for this study.
- -
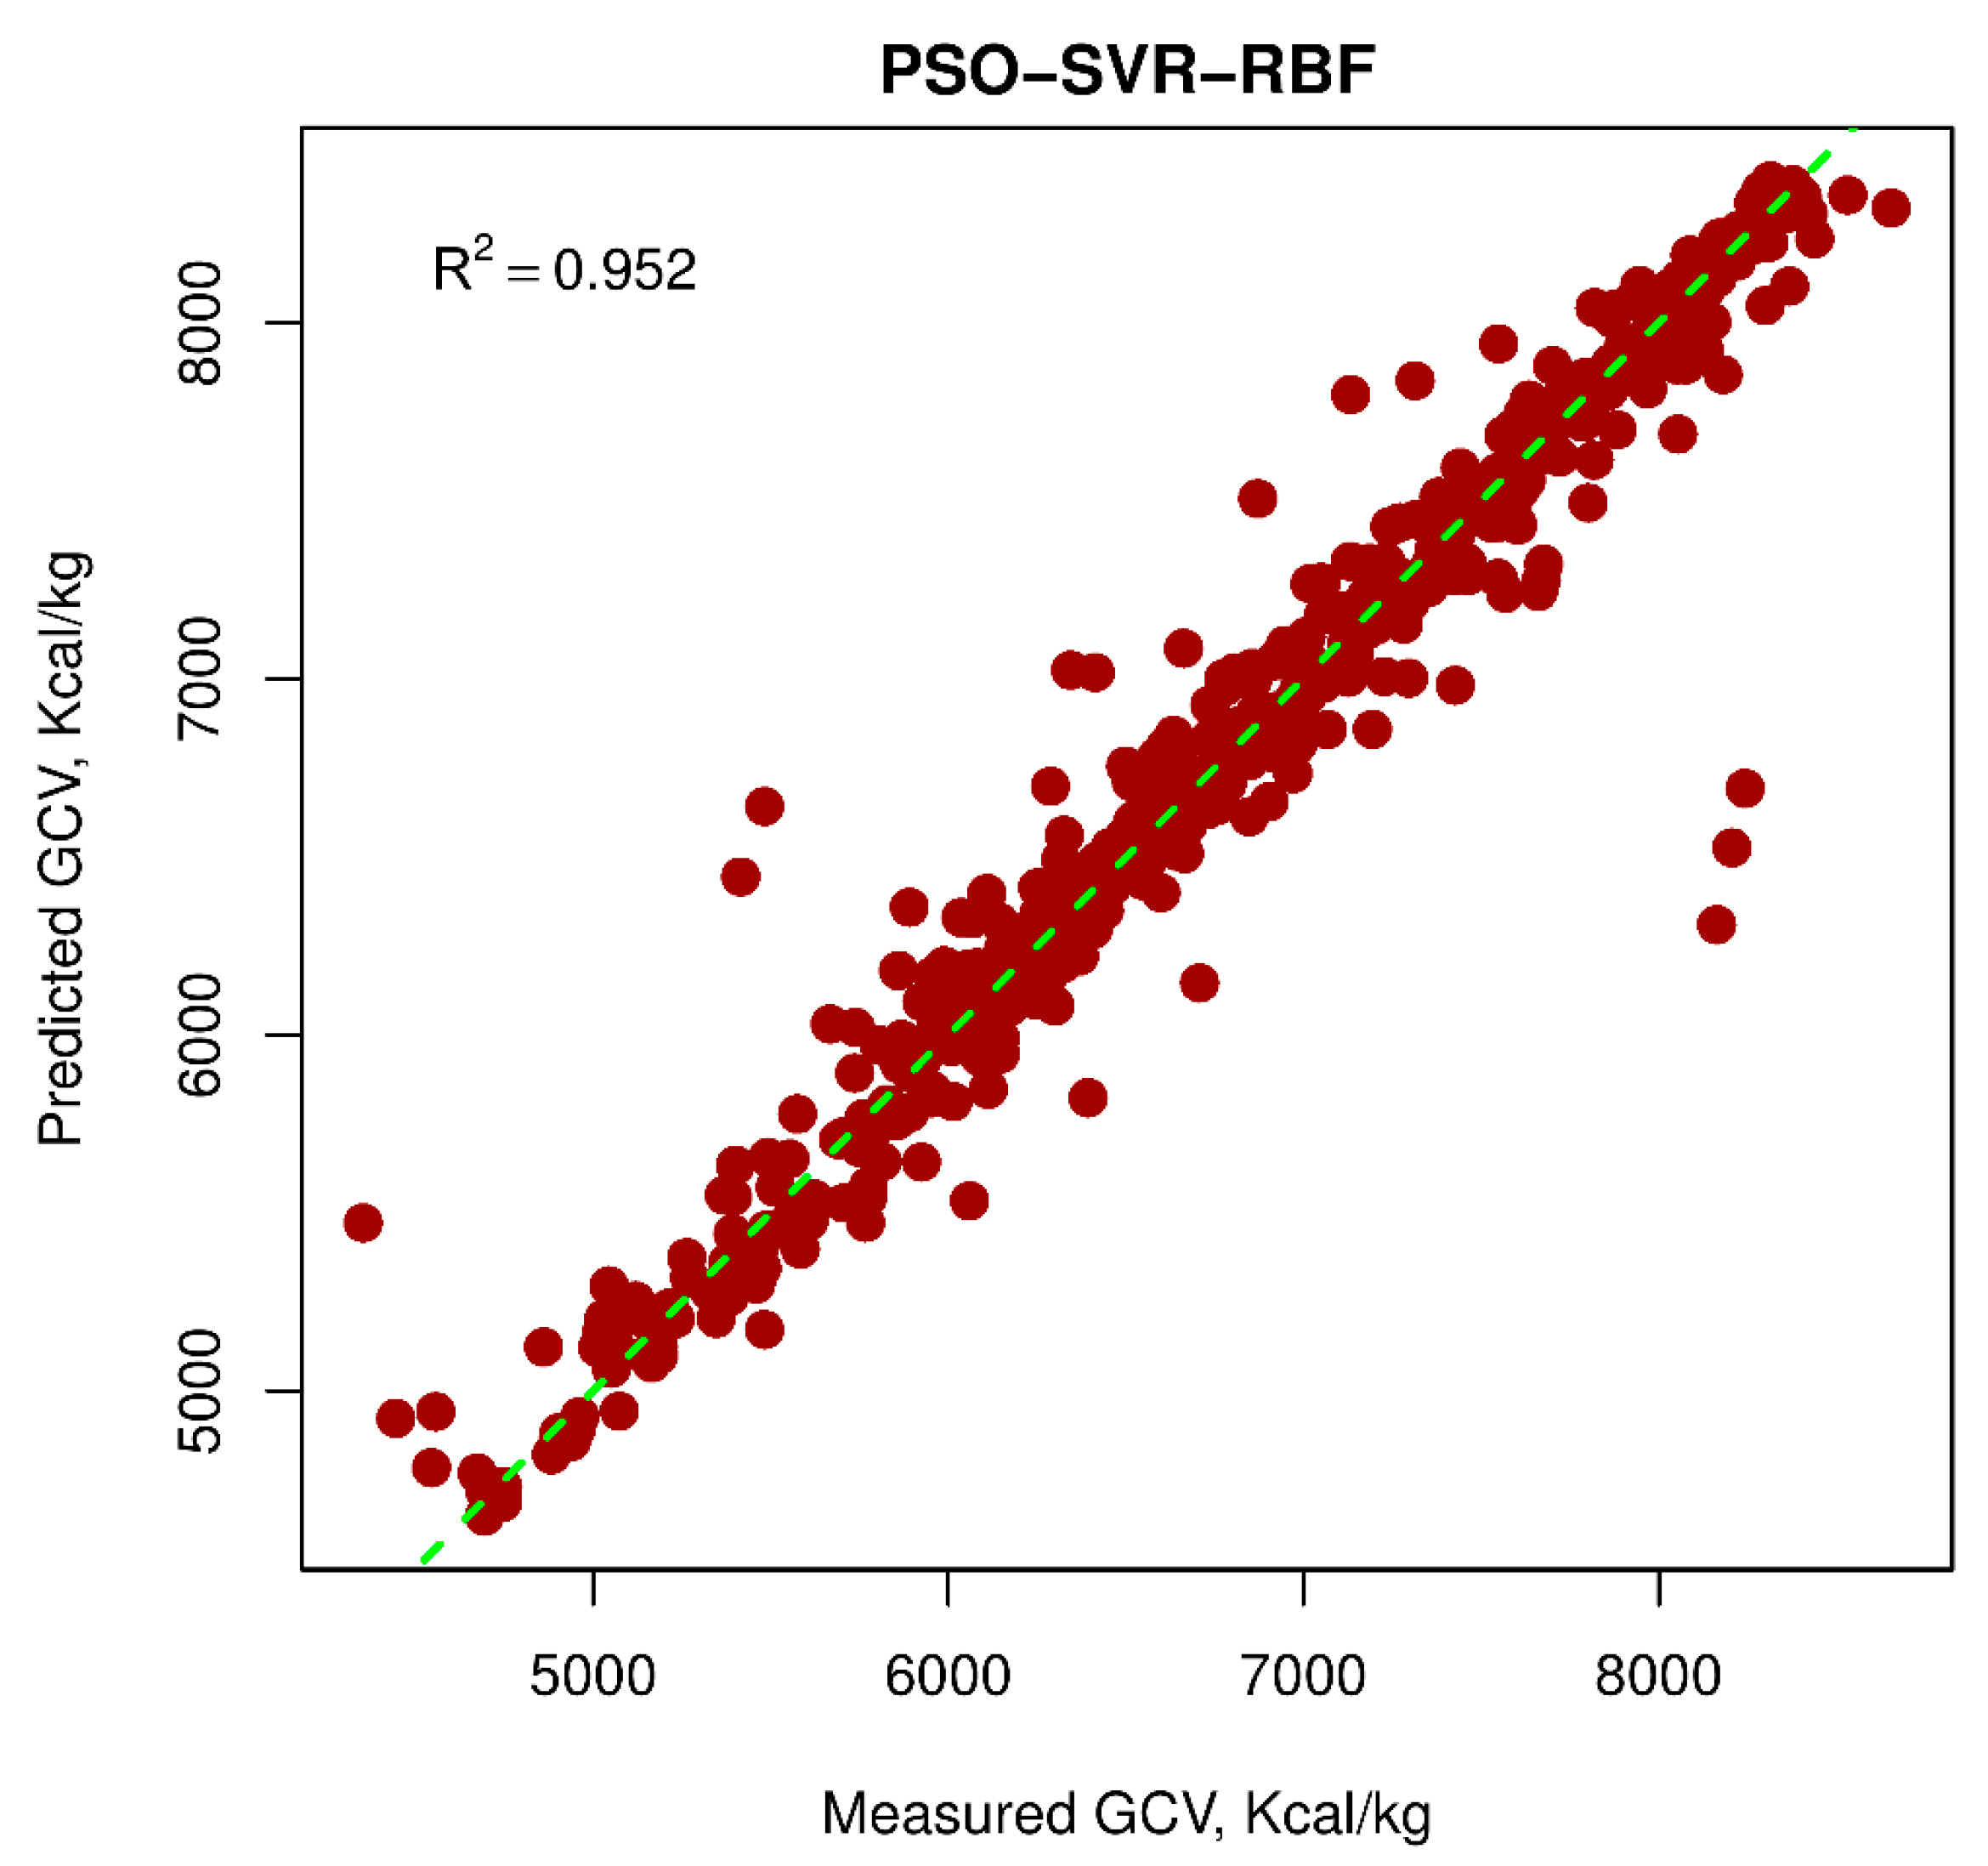
- A meta-heuristic algorithm (i.e., a particle swarm optimization (PSO) algorithm) was considered to optimize the support vector regression (SVR) models for predicting GCV. Subsequently, the particle swarm optimization (PSO)-support vector regression (SVR) model with the radial basis kernel function was proposed as the best model for the aiming of GCV prediction.
- -
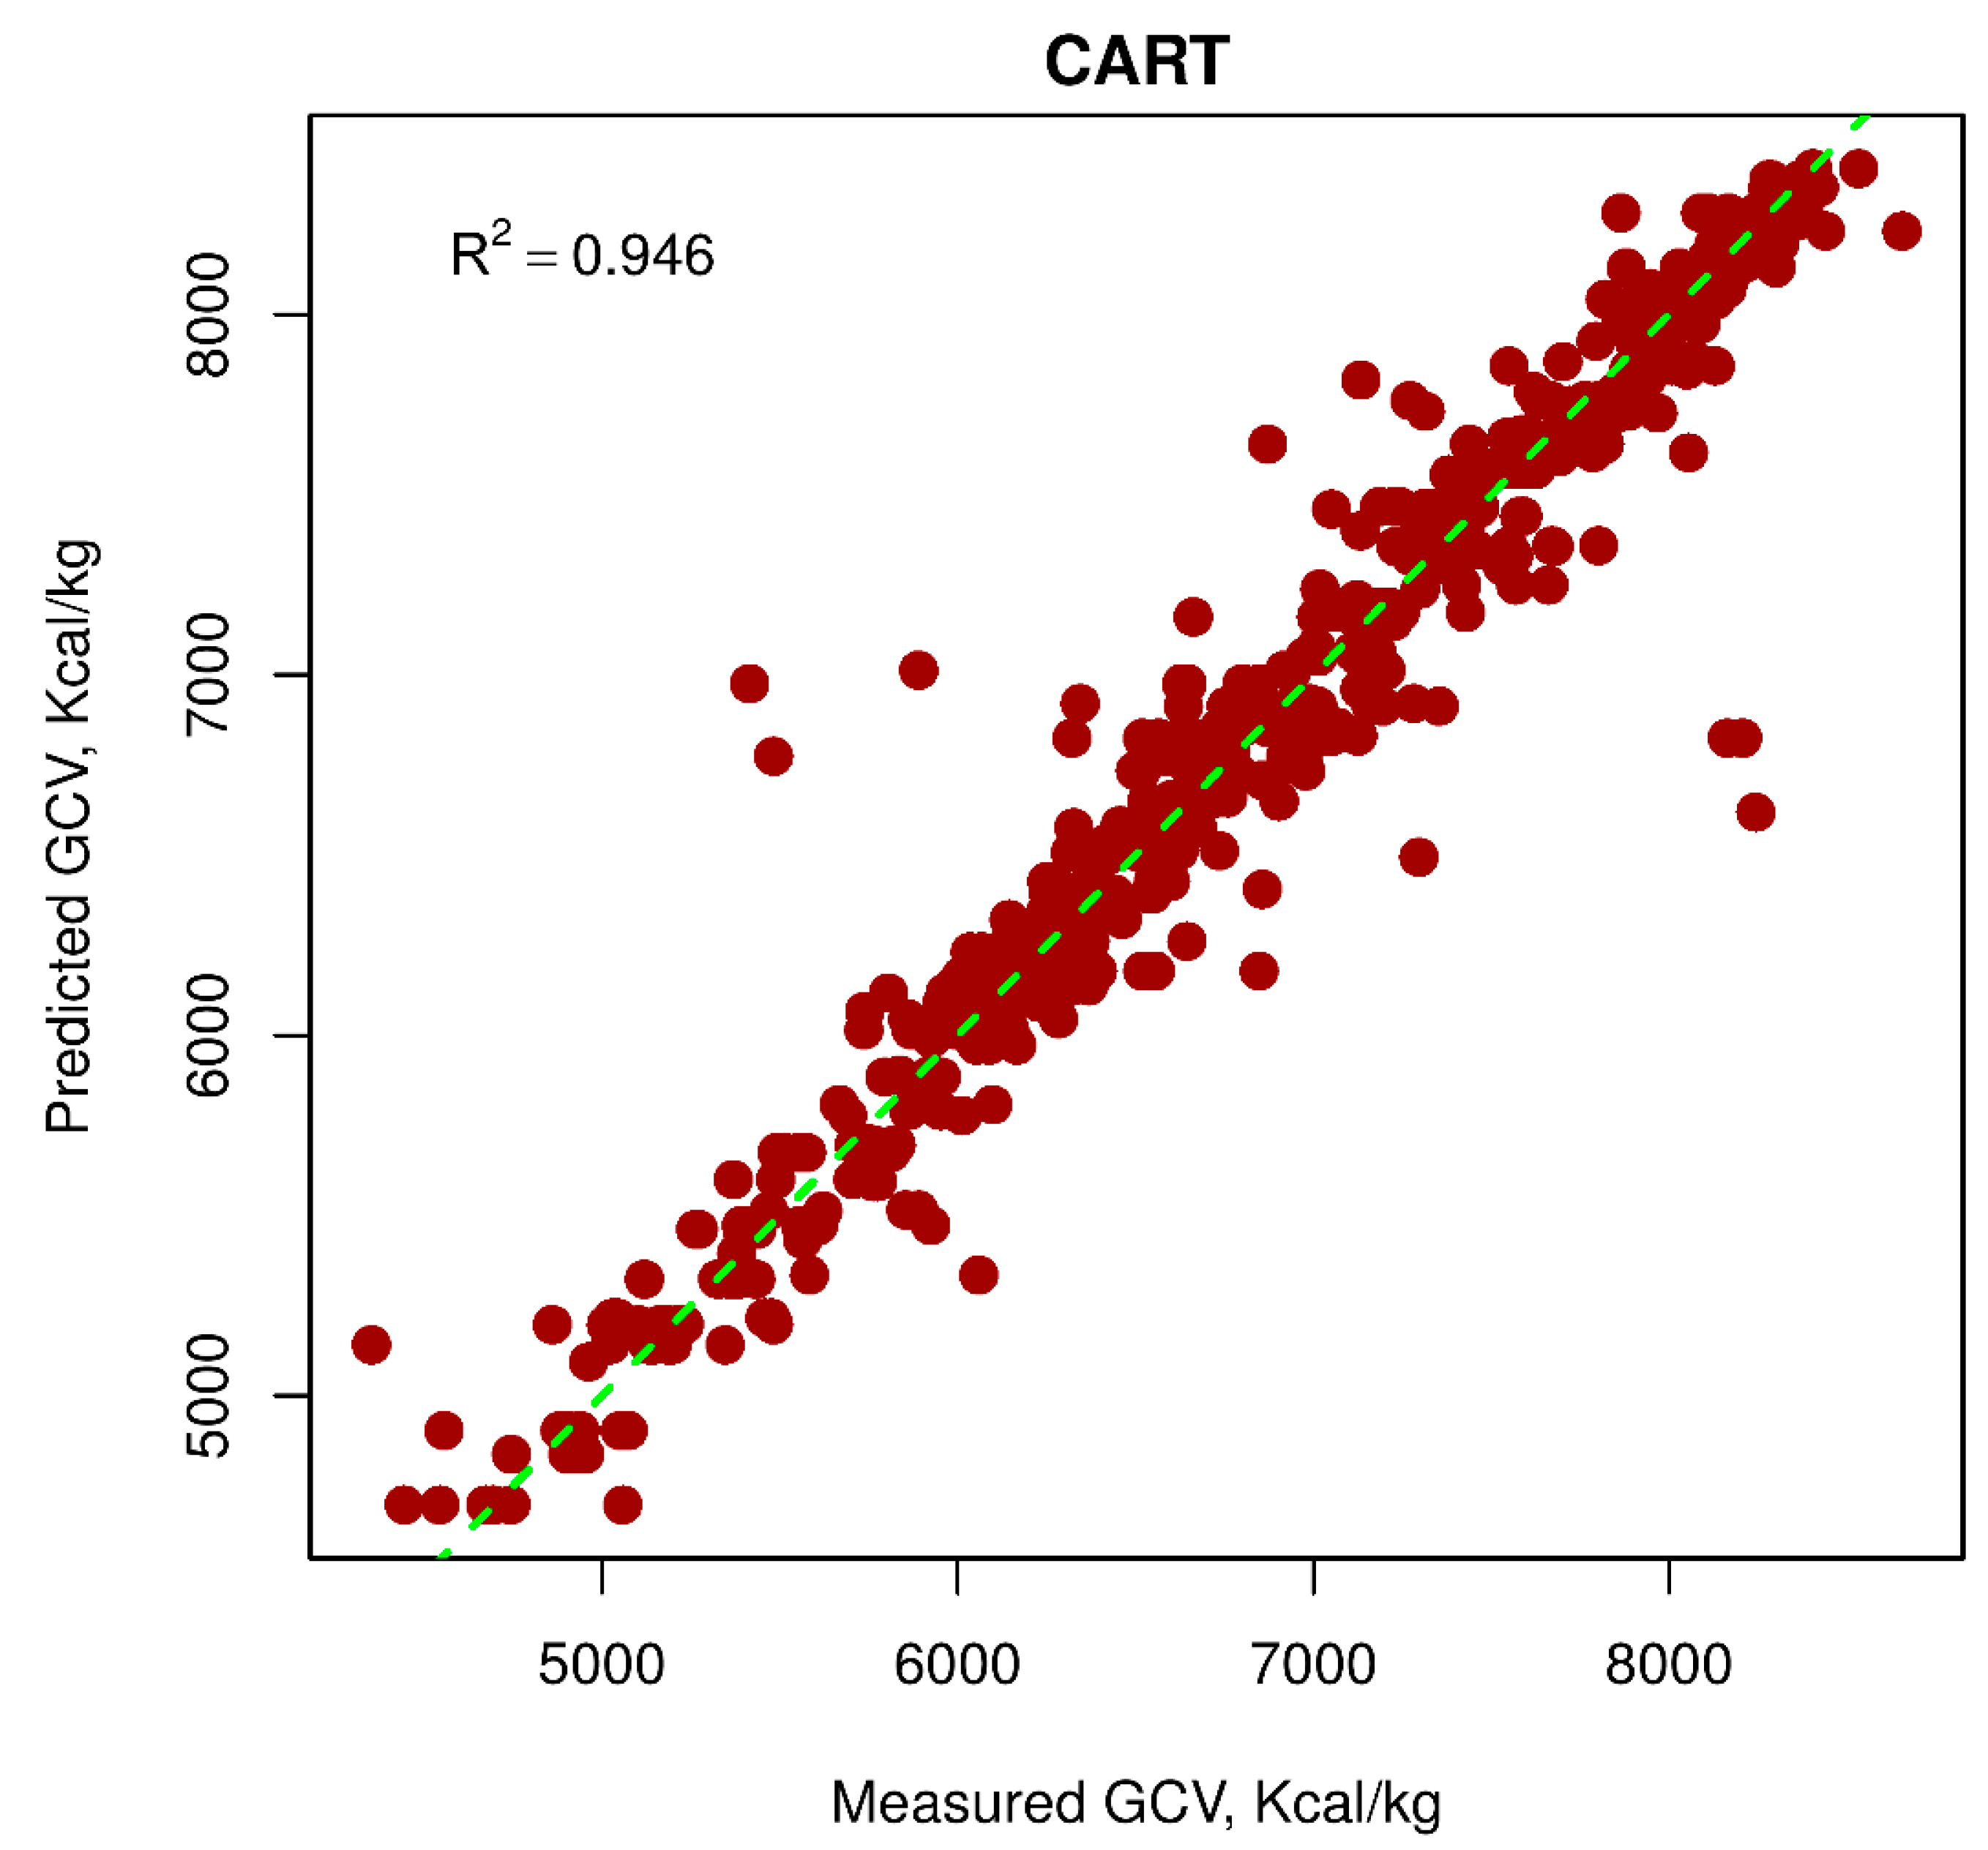
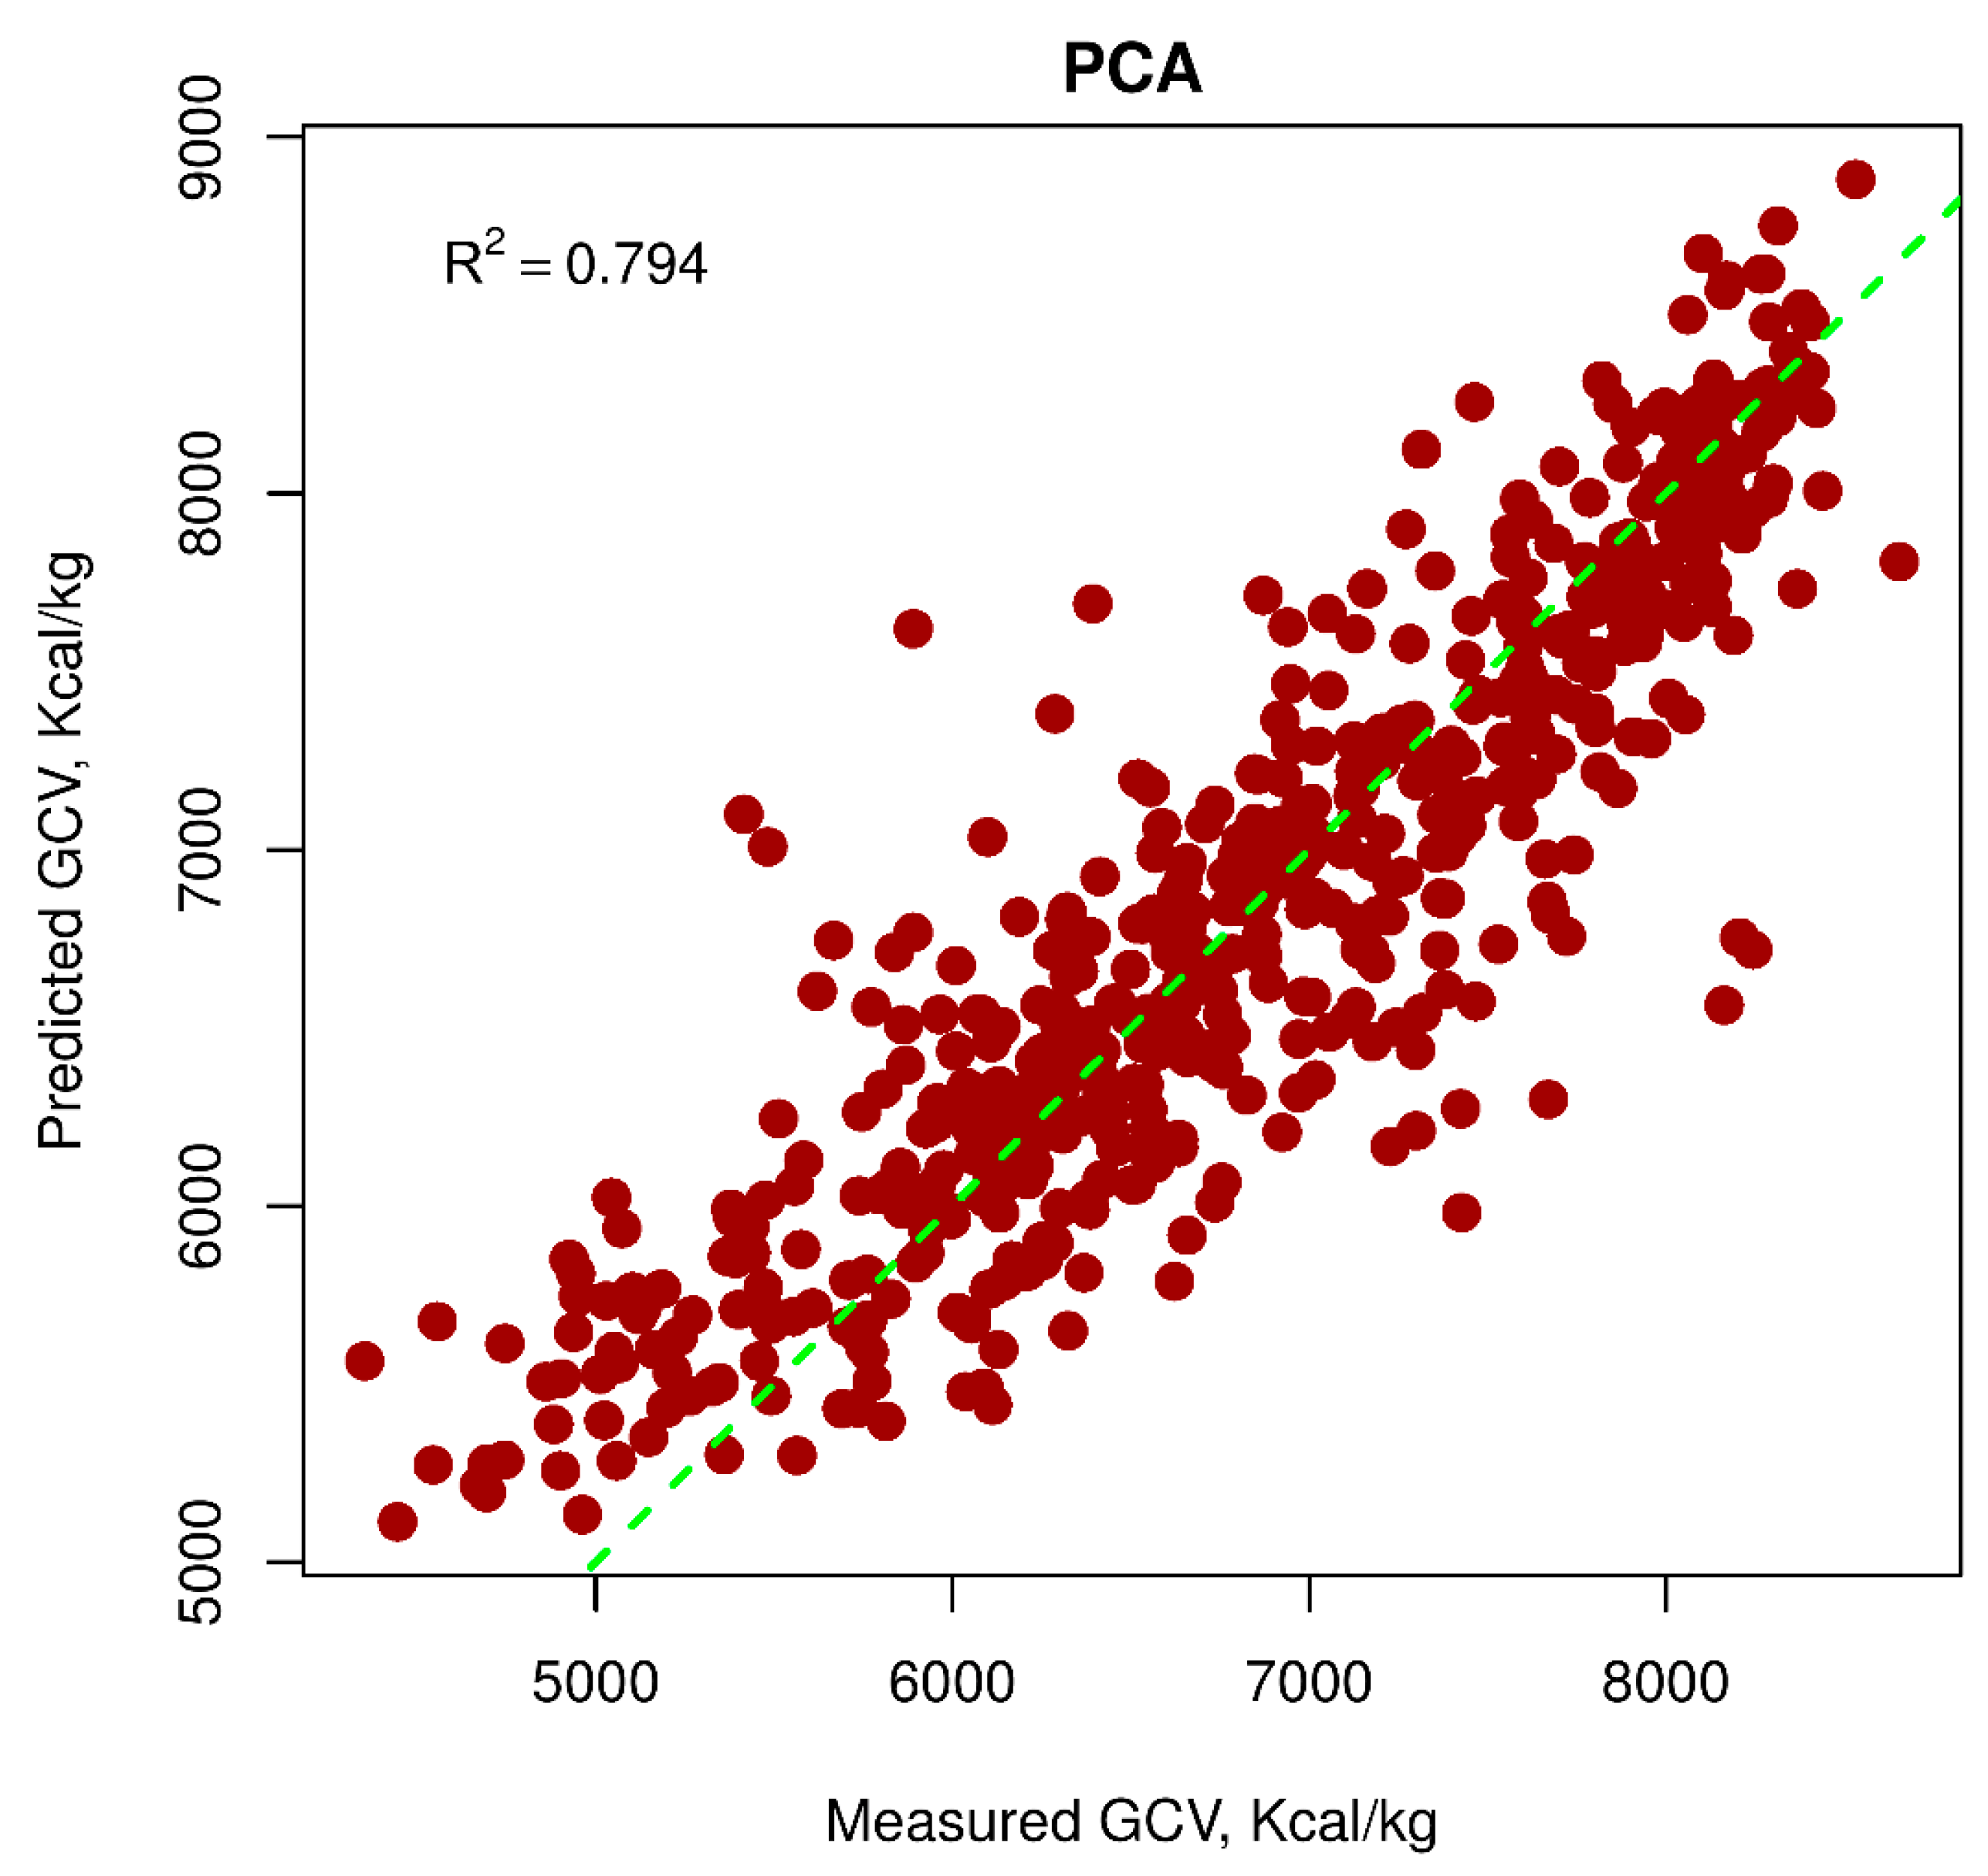
- A variety of different AI models were also developed to predict GCV and compared with the proposed PSO-SVR model, including classification and regression trees (CART), multiple linear regression, and principles component analysis (PCA).
2. Study Area and Data Properties
3. Methods
3.1. Support Vector Regression (SVR)
3.2. Particle Swarm Optimization (PSO)
| Algorithm: The pseudo-code of PSO (particle swarm optimization) algorithm | |
| 1 | for each particle i |
| 2 | for each dimention d |
| 3 | Initialize position xid randomly within permissible range |
| 4 | Initialize velocity vid randomly within permissible range |
| 5 | end for |
| 6 | end for |
| 7 | Iteration k = 1 |
| 8 | do |
| 9 | for each particle i |
| 10 | Calculate fitness value |
| 11 | if the fitness value is better than p_bestid in history |
| 12 | Set current fitness value as the p_bestid |
| 13 | end if |
| 14 | end for |
| 15 | Choose the particle having the best fitness value as the g_bestid |
| 16 | for each particle i |
| 17 | for each dimention d |
| 18 | Calculate velocity according to the following equation |
| 19 | Update particle position according to the following equation |
| 20 | end for |
| 21 | end for |
| 22 | k = k+1 |
| 23 | while maximum iterations or minimum error criteria are not attained |
3.3. PSO-SVR Model for Estimating GCV
3.4. Multiple Linear Regression (MLR)
3.5. Classification and Regression Tree (CART)
- -
- Ability to explain the rules created quickly;
- -
- Ability to apply for both classification and regression problems.
3.6. Principles Component Analysis (PCA)
4. Model Assessment Indices
5. Results and Discussion
5.1. PSO-SVR Models
5.2. MLR Model
5.3. CART Model
5.4. PCA Model
5.5. Evaluation
6. Conclusions
Author Contributions
Funding
Acknowledgments
Conflicts of Interest
References
- Suárez-Ruiz, I.; Diez, M.A.; Rubiera, F. Coal. In New Trends in Coal Conversion; Elsevier: Amsterdam, The Netherlands, 2019; pp. 1–30. [Google Scholar]
- Corbin, D.A. Life, Work, and Rebellion in the Coal Fields: The Southern West Virginia Miners, 1880–1922, 2nd ed.; West Virginia University Press: Morgantown, WV, USA, 2015. [Google Scholar]
- McHugh, L. World energy needs: A role for coal in the energy mix. In Coal in the 21st Century; The Royal Society of Chemistry: Paris, France; pp. 1–29.
- Dai, S.; Finkelman, R.B. Coal as a promising source of critical elements: Progress and future prospects. Int. J. Coal Geol. 2018, 186, 155–164. [Google Scholar] [CrossRef]
- Jordan, B.; Lange, I.; Linn, J. Coal Demand, Market Forces, and, U.S. Coal Mine Closures; Poschingerstr. 5; Muich Society for the Promotion of Economic Research—CESifo GmbH: Munich, Germany, 2018. [Google Scholar]
- Ward, C.R.; Suárez-Ruiz, I. Introduction to applied coal petrology. In Applied Coal Petrology; Elsevier: Amsterdam, The Netherlands, 2008; pp. 1–18. [Google Scholar]
- Majumder, A.; Jain, R.; Banerjee, P.; Barnwal, J. Development of a new proximate analysis based correlation to predict calorific value of coal. Fuel 2008, 87, 3077–3081. [Google Scholar] [CrossRef]
- Pandey, J.; Mohalik, N.; Mishra, R.K.; Khalkho, A.; Kumar, D.; Singh, V. Investigation of the role of fire retardants in preventing spontaneous heating of coal and controlling coal mine fires. Fire Technol. 2015, 51, 227–245. [Google Scholar] [CrossRef]
- Li, J.; Zhuang, X.; Querol, X.; Font, O.; Moreno, N. A review on the applications of coal combustion products in China. Int. Geol. Rev. 2018, 60, 671–716. [Google Scholar] [CrossRef]
- Durković, R.; Grujičić, R. An approach to determine the minimum specific fuel consumption and engine economical operation curve model. Measurement 2019, 132, 303–308. [Google Scholar] [CrossRef]
- Wang, B.; Du, Y.; Xu, N. Simulation and experimental verification on dynamic calibration of fuel gear flowmeters. Measurement 2019, 138, 570–577. [Google Scholar] [CrossRef]
- Oliveira, S.P.; Rocha, A.C.; Jorge Filho, T.; Couto, P.R. Uncertainty of measurement by Monte-Carlo simulation and metrological reliability in the evaluation of electric variables of PEMFC and SOFC fuel cells. Measurement 2009, 42, 1497–1501. [Google Scholar] [CrossRef]
- Albarbar, A.; Gu, F.; Ball, A. Diesel engine fuel injection monitoring using acoustic measurements and independent component analysis. Measurement 2010, 43, 1376–1386. [Google Scholar] [CrossRef]
- Kumar, S.; Dinesha, P. Optimization of engine parameters in a bio diesel engine run with honge methyl ester using response surface methodology. Measurement 2018, 125, 224–231. [Google Scholar] [CrossRef]
- Zhou, M.; Zhang, Y.; Jin, S. Dynamic optimization of heated oil pipeline operation using PSO–DE algorithm. Measurement 2015, 59, 344–351. [Google Scholar] [CrossRef]
- Sierra, A.; Gercek, C.; Übermasser, S.; Reinders, A. Simulation-supported testing of smart energy product prototypes. Appl. Sci. 2019, 9, 2030. [Google Scholar] [CrossRef]
- Nguyen, H.; Bui, X.-N.; Nguyen-Thoi, T.; Ragam, P.; Moayedi, H. Toward a state-of-the-art of fly-rock prediction technology in open-pit mines using EANNs model. Appl. Sci. 2019, 9, 4554. [Google Scholar] [CrossRef]
- Fang, Q.; Nguyen, H.; Bui, X.-N.; Nguyen-Thoi, T. Prediction of blast-induced ground vibration in open-pit mines using a new technique based on imperialist competitive algorithm and M5Rules. Nat. Resour. Res. 2019, 1–16. [Google Scholar] [CrossRef]
- Fang, Q.; Nguyen, H.; Bui, X.-N.; Tran, Q.-H. Estimation of blast-induced air overpressure in quarry mines using cubist-based genetic algorithm. Nat. Resour. Res. 2019, 1–15. [Google Scholar] [CrossRef]
- Bui, X.-N.; Choi, Y.; Atrushkevich, V.; Nguyen, H.; Tran, Q.-H.; Long, N.Q.; Hoang, H.-T. Prediction of blast-induced ground vibration intensity in open-pit mines using unmanned aerial vehicle and a novel intelligence system. Nat. Resour. Res. 2019, 1–20. [Google Scholar] [CrossRef]
- Andria, G.; Attivissimo, F.; Di Nisio, A.; Trotta, A.; Camporeale, S.; Pappalardi, P. Design of a microwave sensor for measurement of water in fuel contamination. Measurement 2019, 136, 74–81. [Google Scholar] [CrossRef]
- Korhonen, I.; Ahola, J. Studying thermal protection for mobile sensor operating in combustion environment. Measurement 2019. [Google Scholar] [CrossRef]
- Aguilar-Jiménez, J.A.; Velázquez, N.; López-Zavala, R.; González-Uribe, L.A.; Beltrán, R.; Hernández-Callejo, L. Simulation of a solar-assisted air-conditioning system applied to a remote school. Appl. Sci. 2019, 9, 3398. [Google Scholar] [CrossRef]
- Le, L.T.; Nguyen, H.; Dou, J.; Zhou, J. A Comparative study of PSO-ANN, GA-ANN, ICA-ANN, and ABC-ANN in estimating the heating load of buildings’ energy efficiency for smart city planning. Appl. Sci. 2019, 9, 2630. [Google Scholar] [CrossRef]
- Le, L.T.; Nguyen, H.; Zhou, J.; Dou, J.; Moayedi, H. Estimating the heating load of buildings for smart city planning using a novel artificial intelligence technique PSO-XGBoost. Appl. Sci. 2019, 9, 2714. [Google Scholar] [CrossRef]
- Mancini, M.; Rinnan, Å.; Pizzi, A.; Toscano, G. Prediction of gross calorific value and ash content of woodchip samples by means of FT-NIR spectroscopy. Fuel Process. Technol. 2018, 169, 77–83. [Google Scholar] [CrossRef]
- Feng, Q.; Zhang, J.; Zhang, X.; Wen, S. Proximate analysis based prediction of gross calorific value of coals: A comparison of support vector machine, alternating conditional expectation and artificial neural network. Fuel Process. Technol. 2015, 129, 120–129. [Google Scholar] [CrossRef]
- Tan, P.; Zhang, C.; Xia, J.; Fang, Q.-Y.; Chen, G. Estimation of higher heating value of coal based on proximate analysis using support vector regression. Fuel Process. Technol. 2015, 138, 298–304. [Google Scholar] [CrossRef]
- Spooner, C. Swelling power of coal. Fuel 1951, 30, 193–202. [Google Scholar]
- Mazumdar, B. Coal systematics: Deductions from proximate analysis of coal part I. J. Sci. Ind. Res. B 1954, 13, 857–863. [Google Scholar]
- Given, P.H.; Weldon, D.; Zoeller, J.H. Calculation of calorific values of coals from ultimate analyses: Theoretical basis and geochemical implications. Fuel 1986, 65, 849–854. [Google Scholar] [CrossRef]
- Parikh, J.; Channiwala, S.; Ghosal, G. A correlation for calculating HHV from proximate analysis of solid fuels. Fuel 2005, 84, 487–494. [Google Scholar] [CrossRef]
- Nguyen, H.; Bui, X.-N.; Tran, Q.-H.; Mai, N.-L. A new soft computing model for estimating and controlling blast-produced ground vibration based on hierarchical K-means clustering and cubist algorithms. Appl. Soft Comput. 2019, 77, 376–386. [Google Scholar] [CrossRef]
- Nguyen, H.; Drebenstedt, C.; Bui, X.-N.; Bui, D.T. Prediction of blast-induced ground vibration in an open-pit mine by a novel hybrid model based on clustering and artificial neural network. Nat. Resour. Res. 2019, 1–19. [Google Scholar] [CrossRef]
- Nguyen, H.; Moayedi, H.; Jusoh, W.A.W.; Sharifi, A. Proposing a novel predictive technique using M5Rules-PSO model estimating cooling load in energy-efficient building system. Eng. Comput. 2019, 1–10. [Google Scholar] [CrossRef]
- Nguyen, H.; Moayedi, H.; Foong, L.K.; Al Najjar, H.A.H.; Jusoh, W.A.W.; Rashid, A.S.A.; Jamali, J. Optimizing ANN models with PSO for predicting short building seismic response. Eng. Comput. 2019, 1–15. [Google Scholar] [CrossRef]
- Balaeva, Y.S.; Kaftan, Y.S.; Miroshnichenko, D.V.; Kotliarov, E.I. Influence of Coal Properties on the Gross Calorific Value and Moisture-Holding Capacity. Coke Chem. 2018, 61, 4–11. [Google Scholar] [CrossRef]
- Balaeva, Y.S.; Miroshnichenko, D.V.; Kaftan, Y.S. Predicting the classification characteristics of coal. Part 1. The gross calorific value in the wet ash-free state. Coke Chem. 2015, 58, 321–328. [Google Scholar] [CrossRef]
- Kumari, P.; Singh, A.K.; Wood, D.A.; Hazra, B. Predictions of gross calorific value of indian coals from their moisture and ash content. J. Geol. Soc. India 2019, 93, 437–442. [Google Scholar] [CrossRef]
- Wood, D.A. Sensitivity analysis and optimization capabilities of the transparent open-box learning network in predicting coal gross calorific value from underlying compositional variables. Model. Earth Syst. Environ. 2019, 5, 1–14. [Google Scholar] [CrossRef]
- Martinka, J.; Martinka, F.; Rantuch, P.; Hrušovský, I.; Blinová, L.; Balog, K. Calorific value and fire risk of selected fast-growing wood species. J. Therm. Anal. Calorim. 2018, 131, 899–906. [Google Scholar] [CrossRef]
- Sampath, K.; Perera, M.; Ranjith, P.; Matthai, S.; Tao, X.; Wu, B. Application of neural networks and fuzzy systems for the intelligent prediction of CO2-induced strength alteration of coal. Measurement 2019, 135, 47–60. [Google Scholar] [CrossRef]
- Sun, J.; Qi, G.; Zhu, Z. A sparse neural network based control structure optimization game under dos attacks for des frequency regulation of power grid. Appl. Sci. 2019, 9, 2217. [Google Scholar] [CrossRef]
- Wang, D.-L.; Sun, Q.-Y.; Li, Y.-Y.; Liu, X.-R. Optimal energy routing design in energy internet with multiple energy routing centers using artificial neural network-based reinforcement learning method. Appl. Sci. 2019, 9, 520. [Google Scholar] [CrossRef]
- Asteris, P.; Kolovos, K.; Douvika, M.; Roinos, K. Prediction of self-compacting concrete strength using artificial neural networks. Eur. J. Environ. Civ. Eng. 2016, 20 (Suppl. 1), s102–s122. [Google Scholar] [CrossRef]
- Asteris, P.; Roussis, P.; Douvika, M. Feed-forward neural network prediction of the mechanical properties of sandcrete materials. Sensors 2017, 17, 1344. [Google Scholar] [CrossRef] [PubMed]
- Asteris, P.G.; Ashrafian, A.; Rezaie-Balf, M. Prediction of the compressive strength of self-compacting concrete using surrogate models. Comput. Concr. 2019, 24, 137–150. [Google Scholar]
- Xu, H.; Zhou, J.; Asteris, P.G.; Jahed Armaghani, D.; Tahir, M.M. Supervised machine learning techniques to the prediction of tunnel boring machine penetration rate. Appl. Sci. 2019, 9, 3715. [Google Scholar] [CrossRef]
- Sarir, P.; Chen, J.; Asteris, P.G.; Armaghani, D.J.; Tahir, M.M. Developing GEP tree-based, neuro-swarm, and whale optimization models for evaluation of bearing capacity of concrete-filled steel tube columns. Eng. Comput. 2019, 1–19. [Google Scholar] [CrossRef]
- Apostolopoulou, M.; Armaghani, D.J.; Bakolas, A.; Douvika, M.G.; Moropoulou, A.; Asteris, P.G. Compressive strength of natural hydraulic lime mortars using soft computing techniques. Procedia Struct. Integr. 2019, 17, 914–923. [Google Scholar] [CrossRef]
- Armaghani, D.J.; Hatzigeorgiou, G.D.; Karamani, C.; Skentou, A.; Zoumpoulaki, I.; Asteris, P.G. Soft computing-based techniques for concrete beams shear strength. Procedia Struct. Integr. 2019, 17, 924–933. [Google Scholar] [CrossRef]
- Akkaya, A.V. Proximate analysis based multiple regression models for higher heating value estimation of low rank coals. Fuel Process. Technol. 2009, 90, 165–170. [Google Scholar] [CrossRef]
- Mesroghli, S.; Jorjani, E.; Chelgani, S.C. Estimation of gross calorific value based on coal analysis using regression and artificial neural networks. Int. J. Coal Geol. 2009, 79, 49–54. [Google Scholar] [CrossRef]
- Erik, N.Y.; Yilmaz, I. On the use of conventional and Soft Computing Models for prediction of gross calorific value (GCV) of coal. Int. J. Coal Prep. Util. 2011, 31, 32–59. [Google Scholar] [CrossRef]
- Wen, X.; Jian, S.; Wang, J. Prediction models of calorific value of coal based on wavelet neural networks. Fuel 2017, 199, 512–522. [Google Scholar] [CrossRef]
- Wood, D.A. Transparent open-box learning network provides auditable predictions for coal gross calorific value. Model. Earth Syst. Environ. 2019, 5, 395–419. [Google Scholar] [CrossRef]
- Acikkar, M.; Sivrikaya, O. Prediction of gross calorific value of coal based on proximate analysis using multiple linear regression and artificial neural networks. Turk. J. Electr. Eng. Comput. Sci. 2018, 26, 2541–2552. [Google Scholar] [CrossRef]
- Qi, M.; Luo, H.; Wei, P.; Fu, Z. Estimation of low calorific value of blended coals based on support vector regression and sensitivity analysis in coal-fired power plants. Fuel 2019, 236, 1400–1407. [Google Scholar] [CrossRef]
- Saha, U.K.; Sonon, L.; Kane, M. Prediction of calorific values, moisture, ash, carbon, nitrogen, and sulfur content of pine tree biomass using near infrared spectroscopy. J. Near Infrared Spectrosc. 2017, 25, 242–255. [Google Scholar] [CrossRef]
- Ozveren, U. An artificial intelligence approach to predict gross heating value of lignocellulosic fuels. J. Energy Inst. 2017, 90, 397–407. [Google Scholar] [CrossRef]
- De la Roza-Delgado, B.; Modroño, S.; Vicente, F.; Martínez-Fernández, A.; Soldado, A. Suitability of faecal near-infrared reflectance spectroscopy (NIRS) predictions for estimating gross calorific value. Span. J. Agric. Res. 2015, 13, 203. [Google Scholar] [CrossRef]
- Jing, L. Predicting the gross calorific value of coal based on support vector machine and partial least squares algorithm. In Proceedings of the 2016 IEEE International Conference on Knowledge Engineering and Applications (ICKEA), Singapore, 28–30 September 2016; IEEE: Piscataway, NJ, USA, 2016; pp. 221–225. [Google Scholar]
- Uzun, H.; Yıldız, Z.; Goldfarb, J.L.; Ceylan, S. Improved prediction of higher heating value of biomass using an artificial neural network model based on proximate analysis. Bioresour. Technol. 2017, 234, 122–130. [Google Scholar] [CrossRef]
- Wang, K.; Zhang, R.; Li, X.; Ning, H. Calorific value prediction of coal based on least squares support vector regression. In Information Technology and Intelligent Transportation Systems; Springer: Berlin/Heidelberg, Germany, 2017; pp. 293–299. [Google Scholar]
- Boumanchar, I.; Charafeddine, K.; Chhiti, Y.; Alaoui, F.E.M.H.; Sahibed-dine, A.; Bentiss, F.; Jama, C.; Bensitel, M. Biomass higher heating value prediction from ultimate analysis using multiple regression and genetic programming. Biomass Convers. Biorefinery 2019, 9, 1–11. [Google Scholar] [CrossRef]
- Vite Company. Report on the Results of Exploration of Mong Duong Coal Mine, Cam Pha City, Quang Ninh Province; General Department of Geology and Minerals of Vietnam, Hanoi University of Mining and Geology: Hanoi, Vietnam, 2017. [Google Scholar]
- 1693:1995 T. TCVN 1693:1995: Hard Coal—Sampling; TCVN 172:1997: Hard Coal—Determination of Total Moisture; Ministry of Science and Technology of Vietnam; Hanoi, Vietnam, 1995.
- 173:1995 T. TCVN 173:1995: Solid Minerals Fuels—Determination of Ash; Ministry of Science and Technology of Vietnam; Hanoi, Vietnam, 1995.
- 174:1995 T. TCVN 174:1995: Hard Coal and Coke—Determination of Volatile Content; Ministry of Science and Technology of Vietnam; Hanoi, Vietnam, 1995.
- 200:2011 T. TCVN 200:2011: Solid Minerals Fuels—Determination of Gross Calorific Value by the Bomb Calorimetric Method and Calculation of Net Calorific Value, Ministry of Science and Technology of Vietnam; Hanoi, Vietnam, 2011.
- Patel, S.U.; Kumar, B.J.; Badhe, Y.P.; Sharma, B.; Saha, S.; Biswas, S.; Chaudhury, A.; Tambe, S.S.; Kulkarni, B.D. Estimation of gross calorific value of coals using artificial neural networks. Fuel 2007, 86, 334–344. [Google Scholar] [CrossRef]
- Nguyen, H.; Bui, X.-N. Predicting blast-induced air overpressure: A robust artificial intelligence system based on artificial neural networks and random forest. Nat. Resour. Res. 2019, 28, 893–907. [Google Scholar] [CrossRef]
- Asteris, P.G.; Nikoo, M. Artificial bee colony-based neural network for the prediction of the fundamental period of infilled frame structures. Neural Comput. Appl. 2019, 1–11. [Google Scholar] [CrossRef]
- Matin, S.; Chelgani, S.C. Estimation of coal gross calorific value based on various analyses by random forest method. Fuel 2016, 177, 274–278. [Google Scholar] [CrossRef]
- Vapnik, V. Three remarks on the support vector method of function estimation. In Advances in Kernel Methods; MIT Press: Cambridge, MA, USA, 1999; pp. 25–41. [Google Scholar]
- Smola, A.J.; Schölkopf, B. A tutorial on support vector regression. Stat. Comput. 2004, 14, 199–222. [Google Scholar] [CrossRef]
- Dutta, S.; Gupta, J. PVT correlations of Indian crude using support vector regression. Energy Fuels 2009, 23, 5483–5490. [Google Scholar] [CrossRef]
- Zheng, L.; Zhou, H.; Wang, C.; Cen, K. Combining support vector regression and ant colony optimization to reduce NOx emissions in coal-fired utility boilers. Energy Fuels 2008, 22, 1034–1040. [Google Scholar] [CrossRef]
- Liu, J.; Shi, G.; Zhu, K. Vessel trajectory prediction model based on AIS sensor data and adaptive chaos differential evolution support vector regression (ACDE-SVR). Appl. Sci. 2019, 9, 2983. [Google Scholar] [CrossRef]
- Eberhart, R.; Kennedy, J. A new optimizer using particle swarm theory. In Micro Machine and Human Science, 1995, MHS’95, Proceedings of the Sixth International Symposium on; IEEE: Piscataway, NJ, USA, 1995; pp. 39–43. [Google Scholar]
- Chen, H.; Asteris, P.G.; Jahed Armaghani, D.; Gordan, B.; Pham, B.T. Assessing dynamic conditions of the retaining wall: Developing two hybrid intelligent models. Appl. Sci. 2019, 9, 1042. [Google Scholar] [CrossRef]
- Zendehboudi, S.; Ahmadi, M.A.; James, L.; Chatzis, I. Prediction of condensate-to-gas ratio for retrograde gas condensate reservoirs using artificial neural network with particle swarm optimization. Energy Fuels 2012, 26, 3432–3447. [Google Scholar] [CrossRef]
- Esmin, A.A.; Coelho, R.A.; Matwin, S. A review on particle swarm optimization algorithm and its variants to clustering high-dimensional data. Artif. Intell. Rev. 2015, 44, 23–45. [Google Scholar] [CrossRef]
- Ghamisi, P.; Benediktsson, J.A. Feature selection based on hybridization of genetic algorithm and particle swarm optimization. IEEE Geosci. Remote Sens. Lett. 2015, 12, 309–313. [Google Scholar] [CrossRef]
- Kaloop, M.R.; Kumar, D.; Samui, P.; Gabr, A.R.; Hu, J.W.; Jin, X.; Roy, B. Particle Swarm Optimization Algorithm-Extreme Learning Machine (PSO-ELM) model for predicting resilient modulus of stabilized aggregate bases. Appl. Sci. 2019, 9, 3221. [Google Scholar] [CrossRef]
- Abdullah, N.A.; Abd Rahim, N.; Gan, C.K.; Nor Adzman, N. Forecasting solar power using Hybrid Firefly and Particle Swarm Optimization (HFPSO) for optimizing the parameters in a Wavelet Transform-Adaptive Neuro Fuzzy Inference System (WT-ANFIS). Appl. Sci. 2019, 9, 3214. [Google Scholar] [CrossRef]
- Kulkarni, R.V.; Venayagamoorthy, G.K. An estimation of distribution improved particle swarm optimization algorithm. In Proceedings of the 2007 3rd International Conference on Intelligent Sensors, Sensor Networks and Information, Melbourne, Australia, 3–6 December 2007; IEEE: Piscataway, NJ, USA, 2007; pp. 539–544. [Google Scholar]
- Khademi, F.; Jamal, S.M.; Deshpande, N.; Londhe, S. Predicting strength of recycled aggregate concrete using artificial neural network, adaptive neuro-fuzzy inference system and multiple linear regression. Int. J. Sustain. Built Environ. 2016, 5, 355–369. [Google Scholar] [CrossRef]
- Breiman, L. Classification and Regression Trees; Routledge: Abingdon, UK, 2017. [Google Scholar]
- Byeon, H. Development of prediction model for endocrine disorders in the Korean elderly using CART algorithm. Dev. Int. J. Adv. Comput. Sci. Appl. 2015, 6, 125–129. [Google Scholar] [CrossRef][Green Version]
- El Moucary, C. Data Mining for Engineering Schools Predicting Students’ Performance and Enrollment in Masters Programs. Int. J. Adv. Comput. Sci. Appl. 2011, 2, 1–9. [Google Scholar]
- Suknović, M.; Čupić, M.; Martić, M. Data warehousing and data mining—A case study. Yugosl. J. Oper. Res. 2005, 15, 125–145. [Google Scholar] [CrossRef]
- Wold, S.; Esbensen, K.; Geladi, P. Principal component analysis. Chemom. Intell. Lab. Syst. 1987, 2, 37–52. [Google Scholar] [CrossRef]
- Jolliffe, I. Principal Component Analysis; Springer: Berlin/Heidelberg, Germany, 2011. [Google Scholar]
- Abdi, H.; Williams, L.J. Principal component analysis. Wiley Interdiscip. Rev. Comput. Stat. 2010, 2, 433–459. [Google Scholar] [CrossRef]
- Bui, X.N.; Nguyen, H.; Le, H.A.; Bui, H.B.; Do, N.H. Prediction of blast-induced air over-pressure in open-pit mine: Assessment of different artificial intelligence techniques. Nat. Resour. Res. 2019, 1–21. [Google Scholar] [CrossRef]
- Nguyen, H.; Bui, X.-N.; Bui, H.-B.; Mai, N.-L. A comparative study of artificial neural networks in predicting blast-induced air-blast overpressure at Deo Nai open-pit coal mine, Vietnam. Neural Comput. Appl. 2018, 1–17. [Google Scholar] [CrossRef]
- Moayedi, H.; Hayati, S. Applicability of a CPT-based neural network solution in predicting load-settlement responses of bored pile. Int. J. Geomech. 2018, 18, 06018009-1–06018009-11. [Google Scholar]
- Marinakis, Y.; Migdalas, A.; Sifaleras, A. A hybrid particle swarm optimization–variable neighborhood search algorithm for constrained shortest path problems. Eur. J. Oper. Res. 2017, 261, 819–834. [Google Scholar] [CrossRef]
- Agrawal, A.P.; Kaur, A. A Comprehensive comparison of ant colony and hybrid particle swarm optimization algorithms through test case selection. In Data Engineering and Intelligent Computing; Springer: Singapore, 2018; pp. 397–405. [Google Scholar]
- Poli, R.; Kennedy, J.; Blackwell, T. Particle swarm optimization. Swarm Intell. 2007, 1, 33–57. [Google Scholar] [CrossRef]
- Kennedy, J. The behavior of particles. In International Conference on Evolutionary Programming; Springer: Berlin/Heidelberg, Germany, 1998; pp. 579–589. [Google Scholar]
- Clerc, M.; Kennedy, J. The particle swarm-explosion, stability, and convergence in a multidimensional complex space. IEEE Trans. Evolut. Comput. 2002, 6, 58–73. [Google Scholar] [CrossRef]
- Eberhart, R.C.; Shi, Y. Comparing inertia weights and constriction factors in particle swarm optimization. In Evolutionary Computation, Proceedings of the 2000 Congress on, 2000; IEEE: Piscataway, NJ, USA, 2000; pp. 84–88. [Google Scholar]
- Pérez-Guaita, D.; Kuligowski, J.; Lendl, B.; Wood, B.R.; Quintás, G. Assessment of discriminant models in infrared imaging using constrained repeated random sampling–Cross validation. Anal. Chim. Acta 2018, 1033, 156–164. [Google Scholar] [CrossRef] [PubMed]
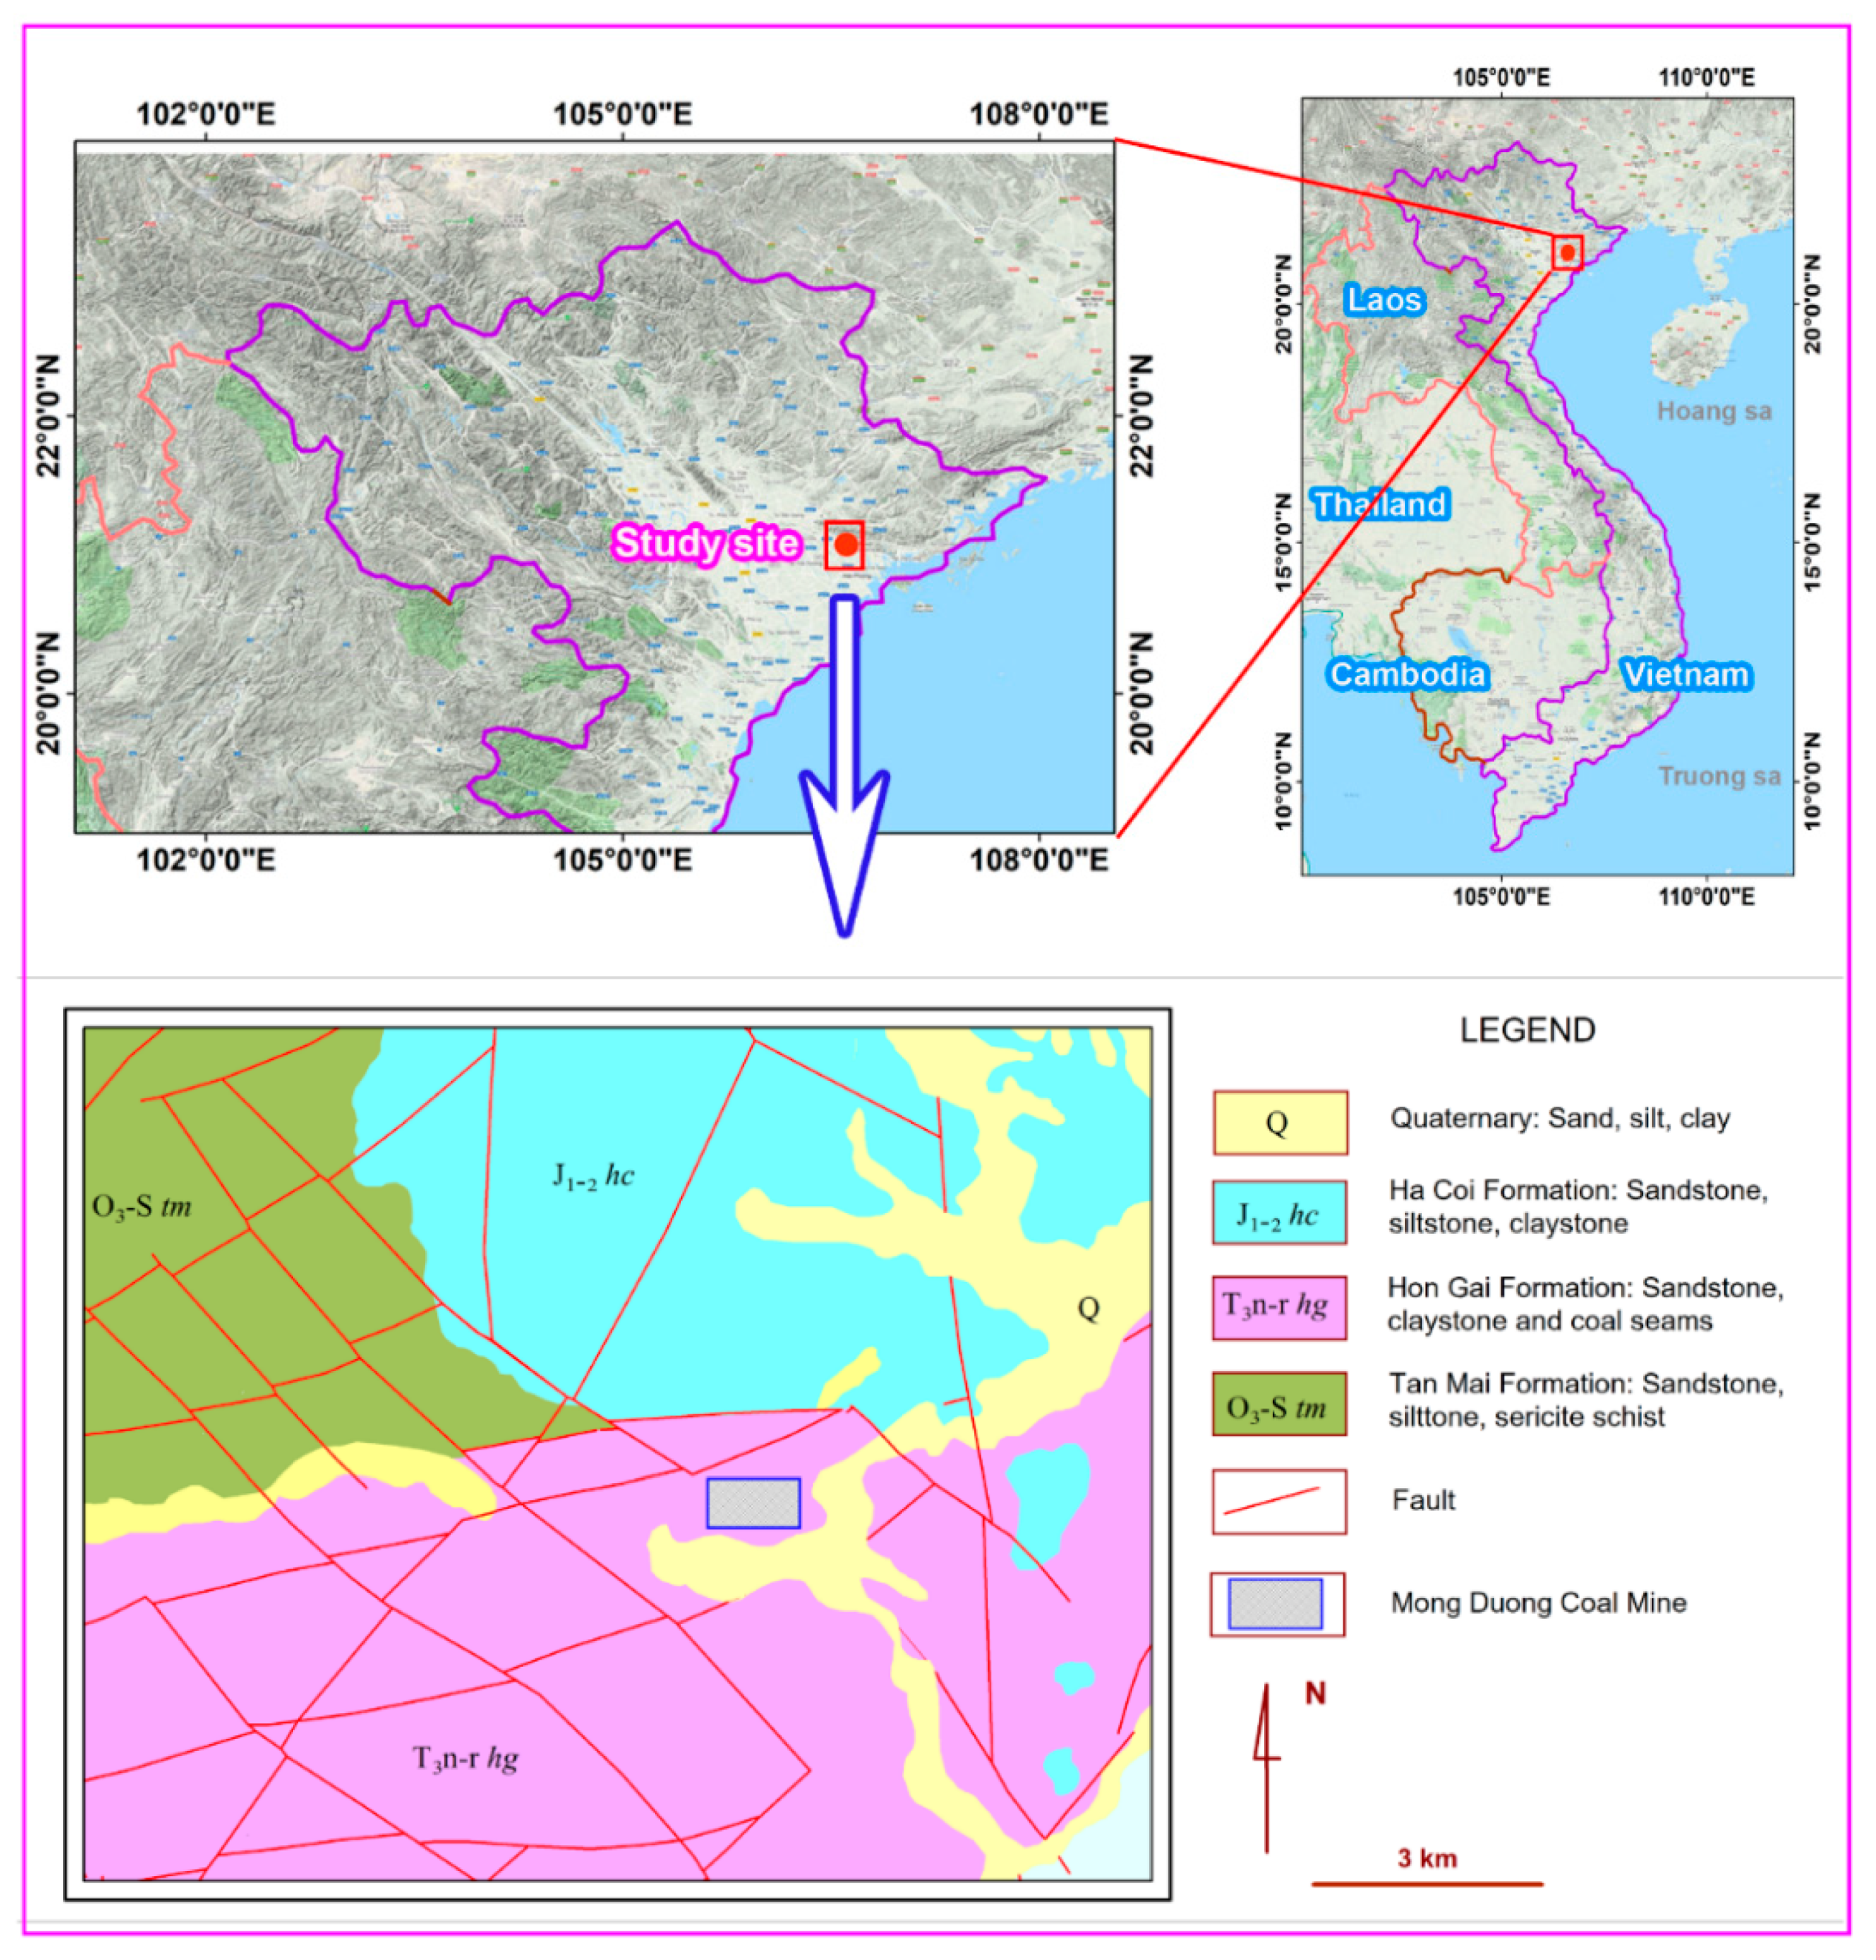
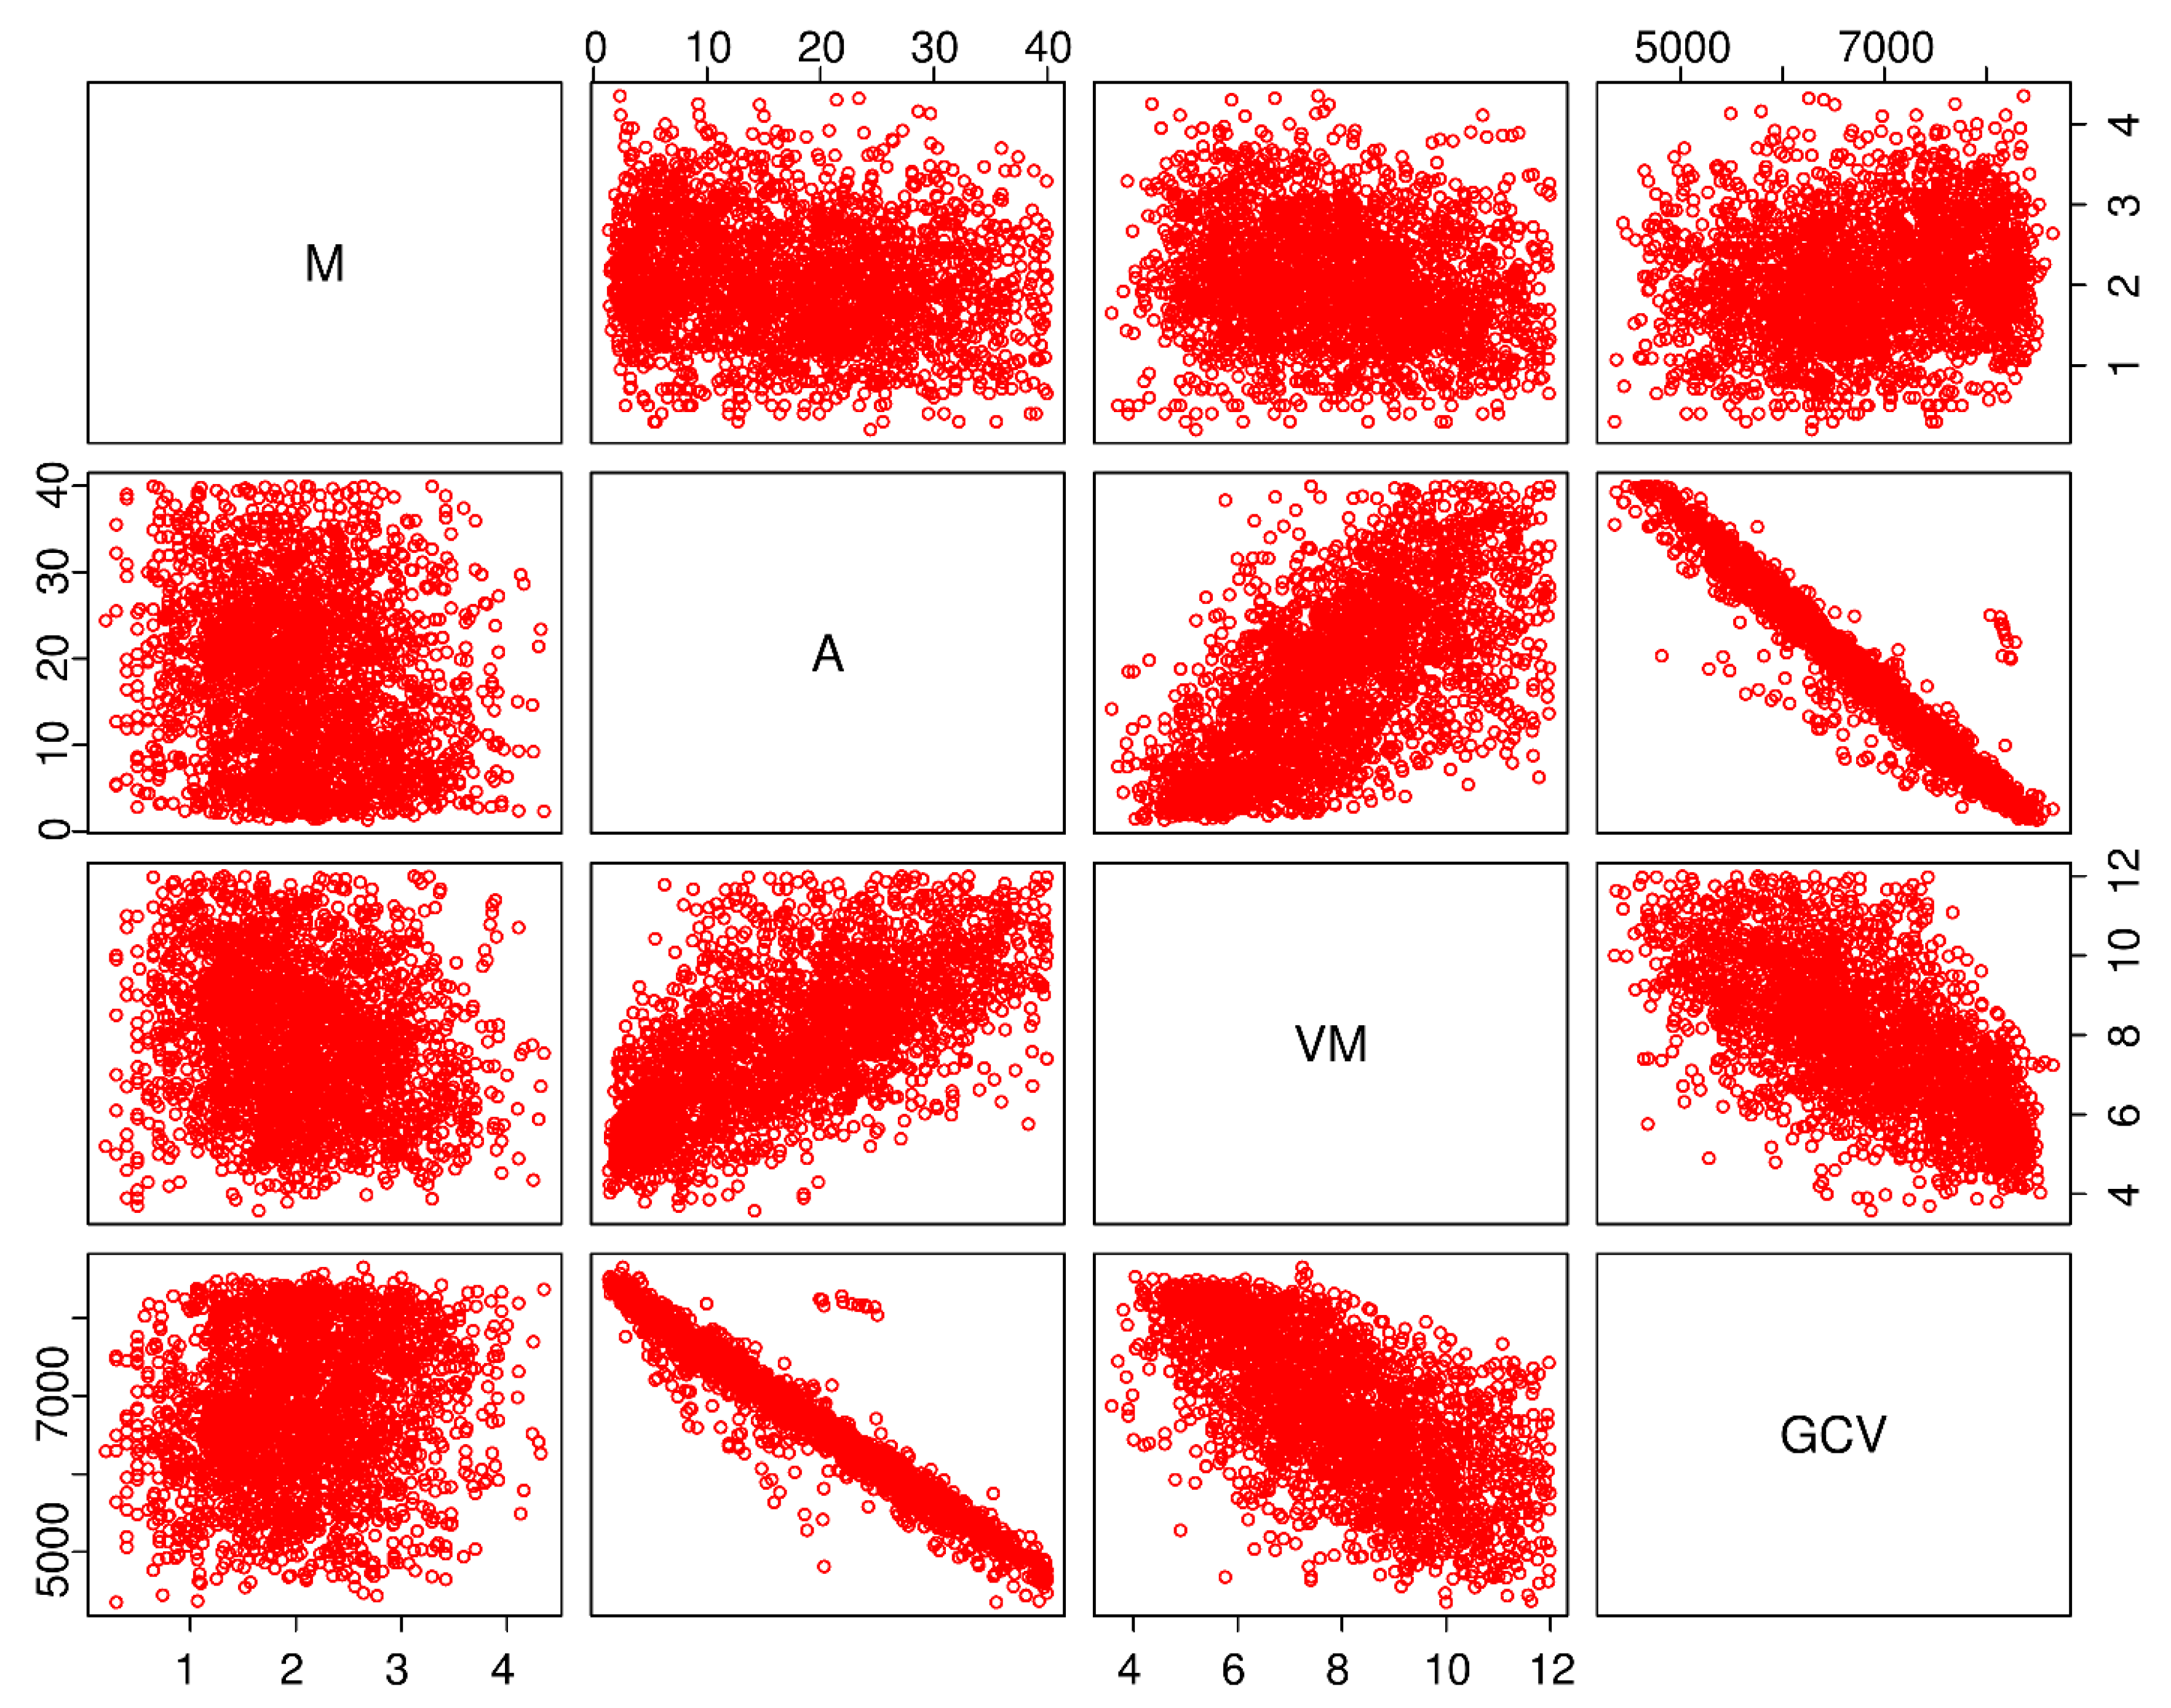
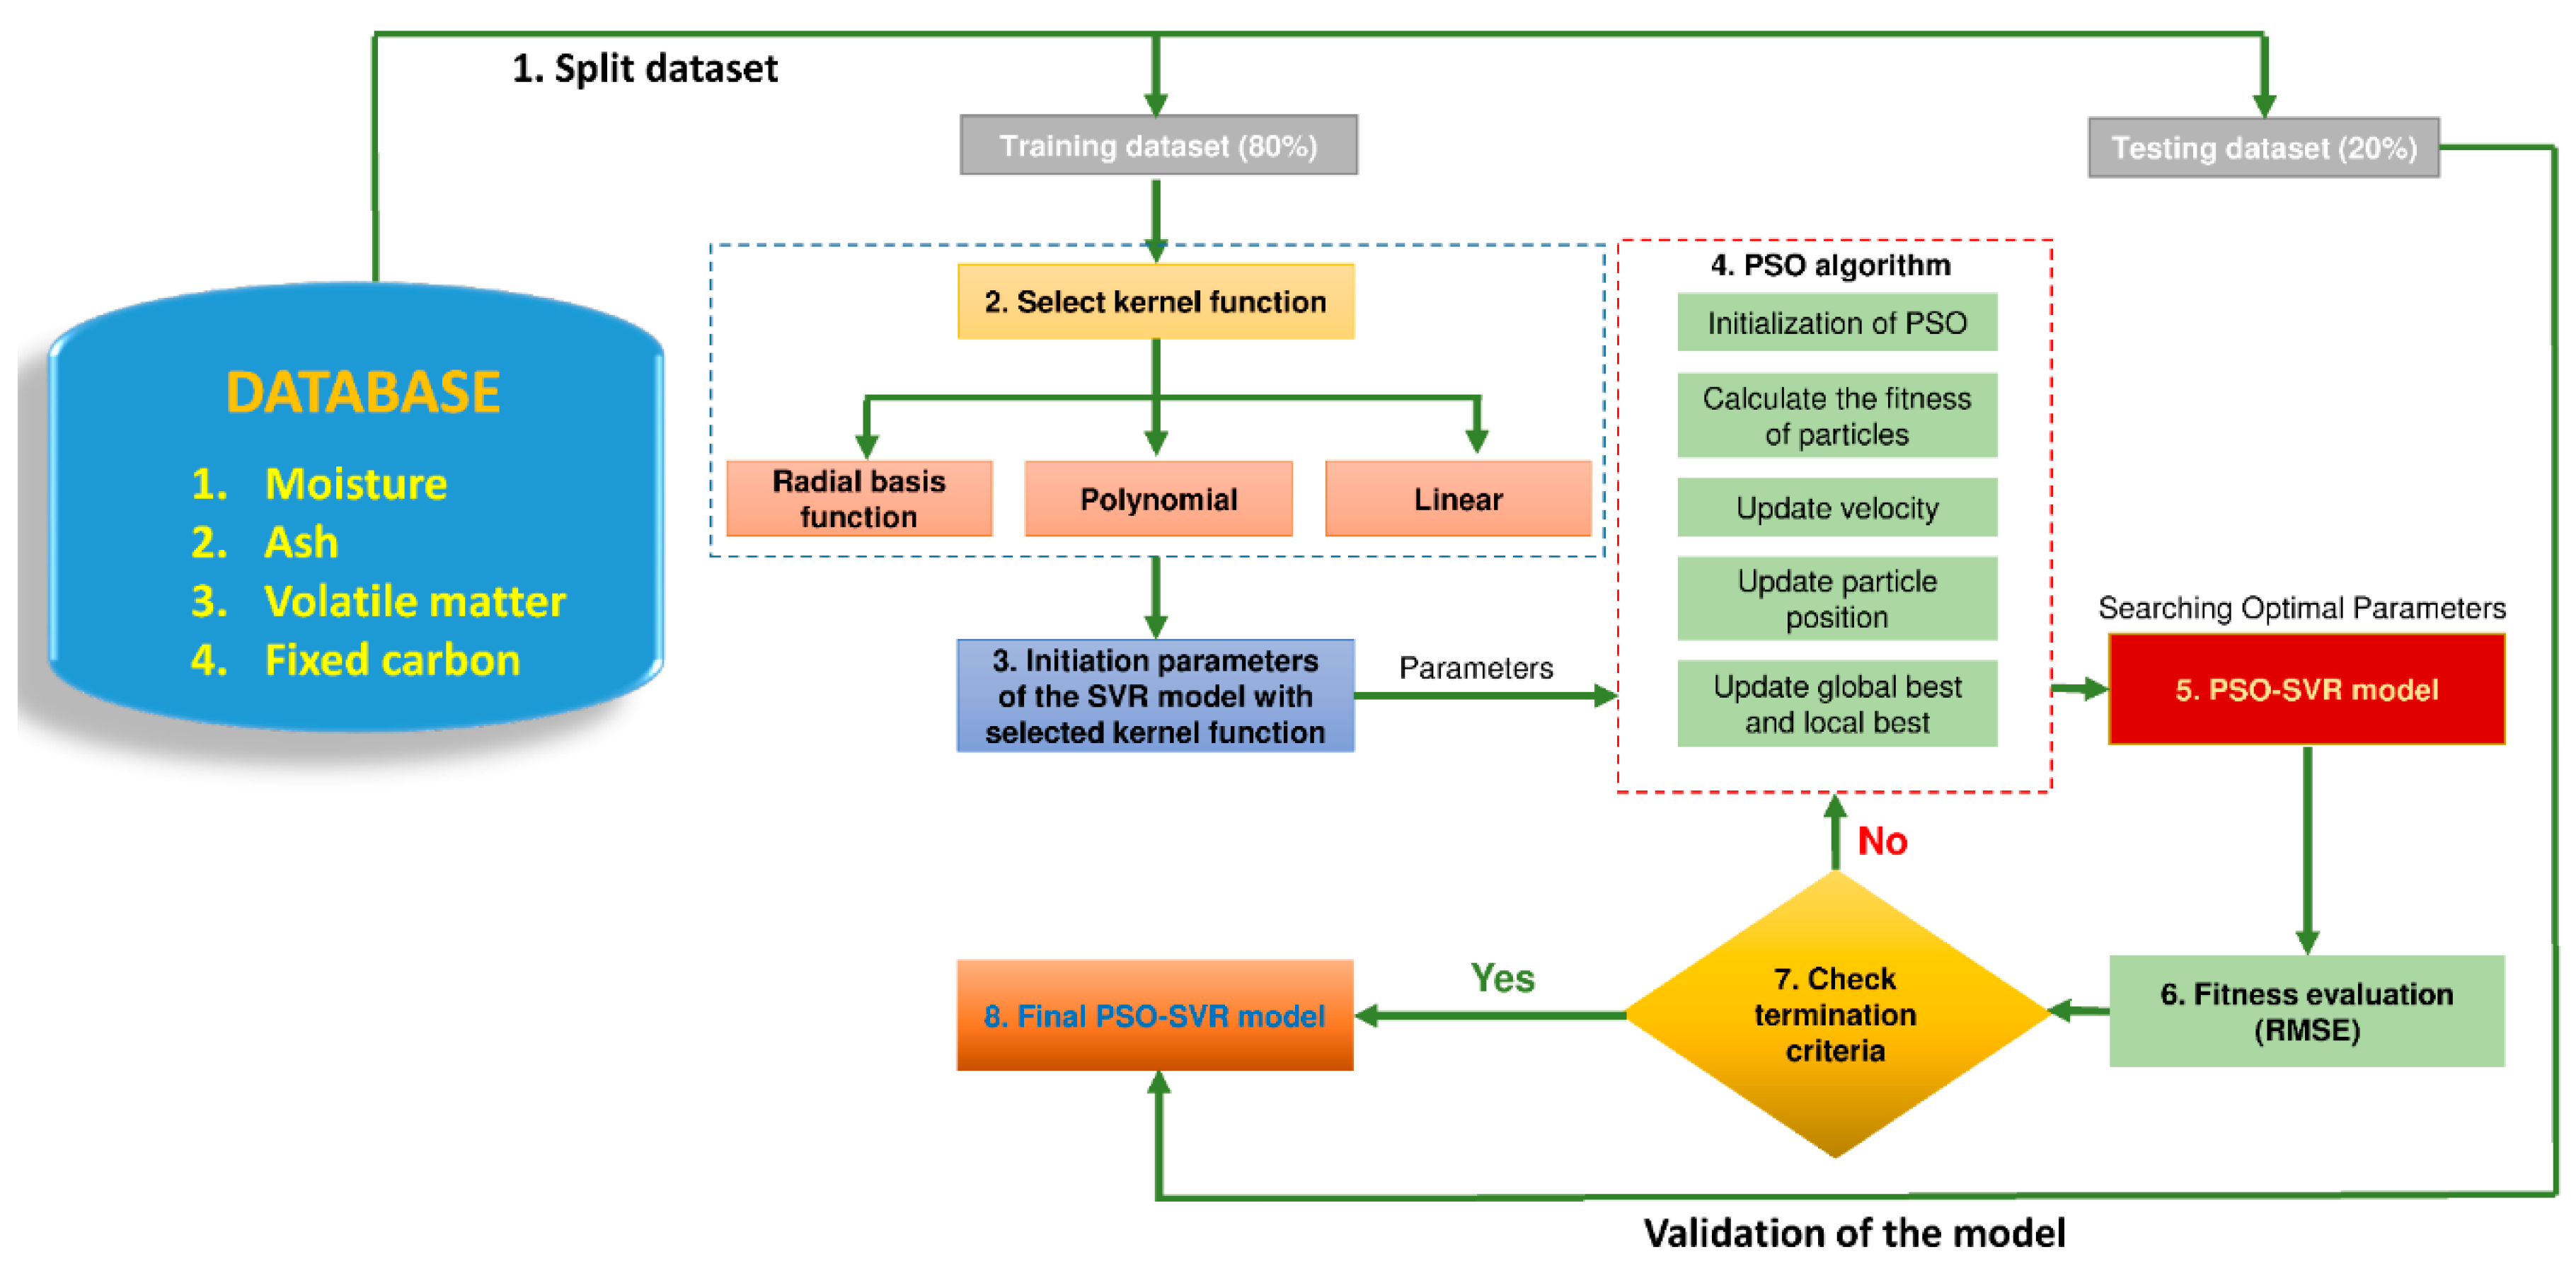
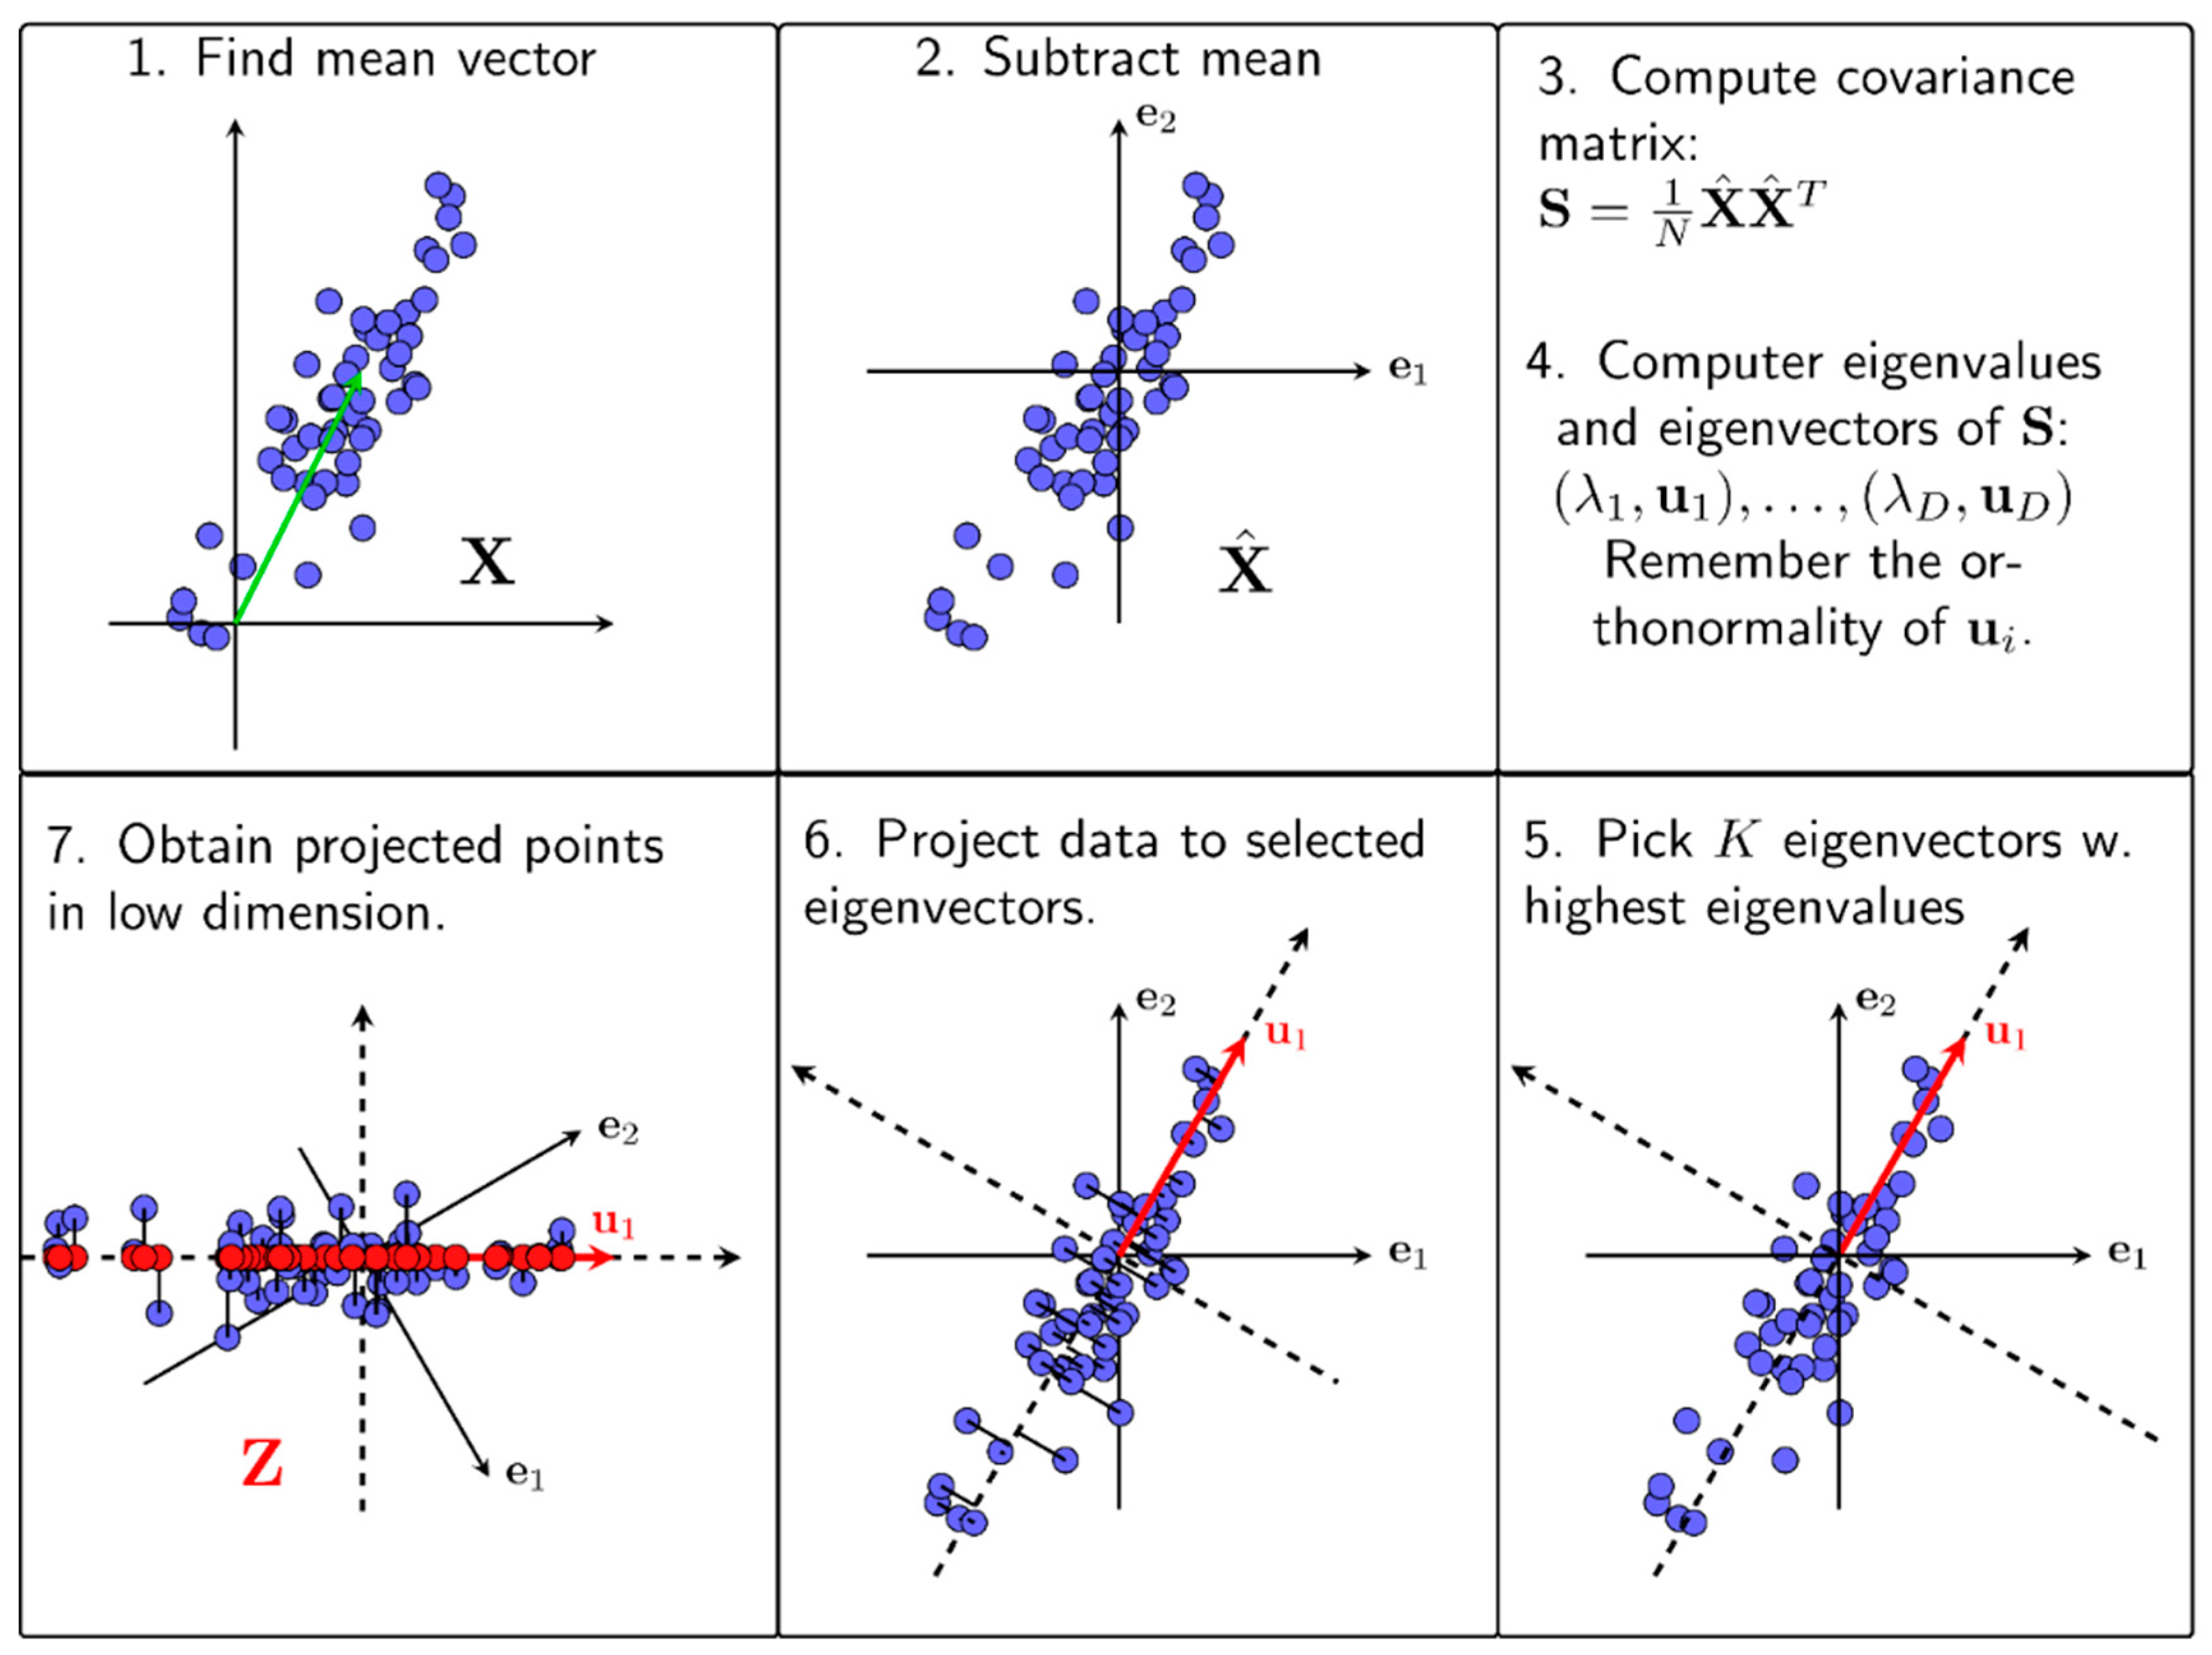
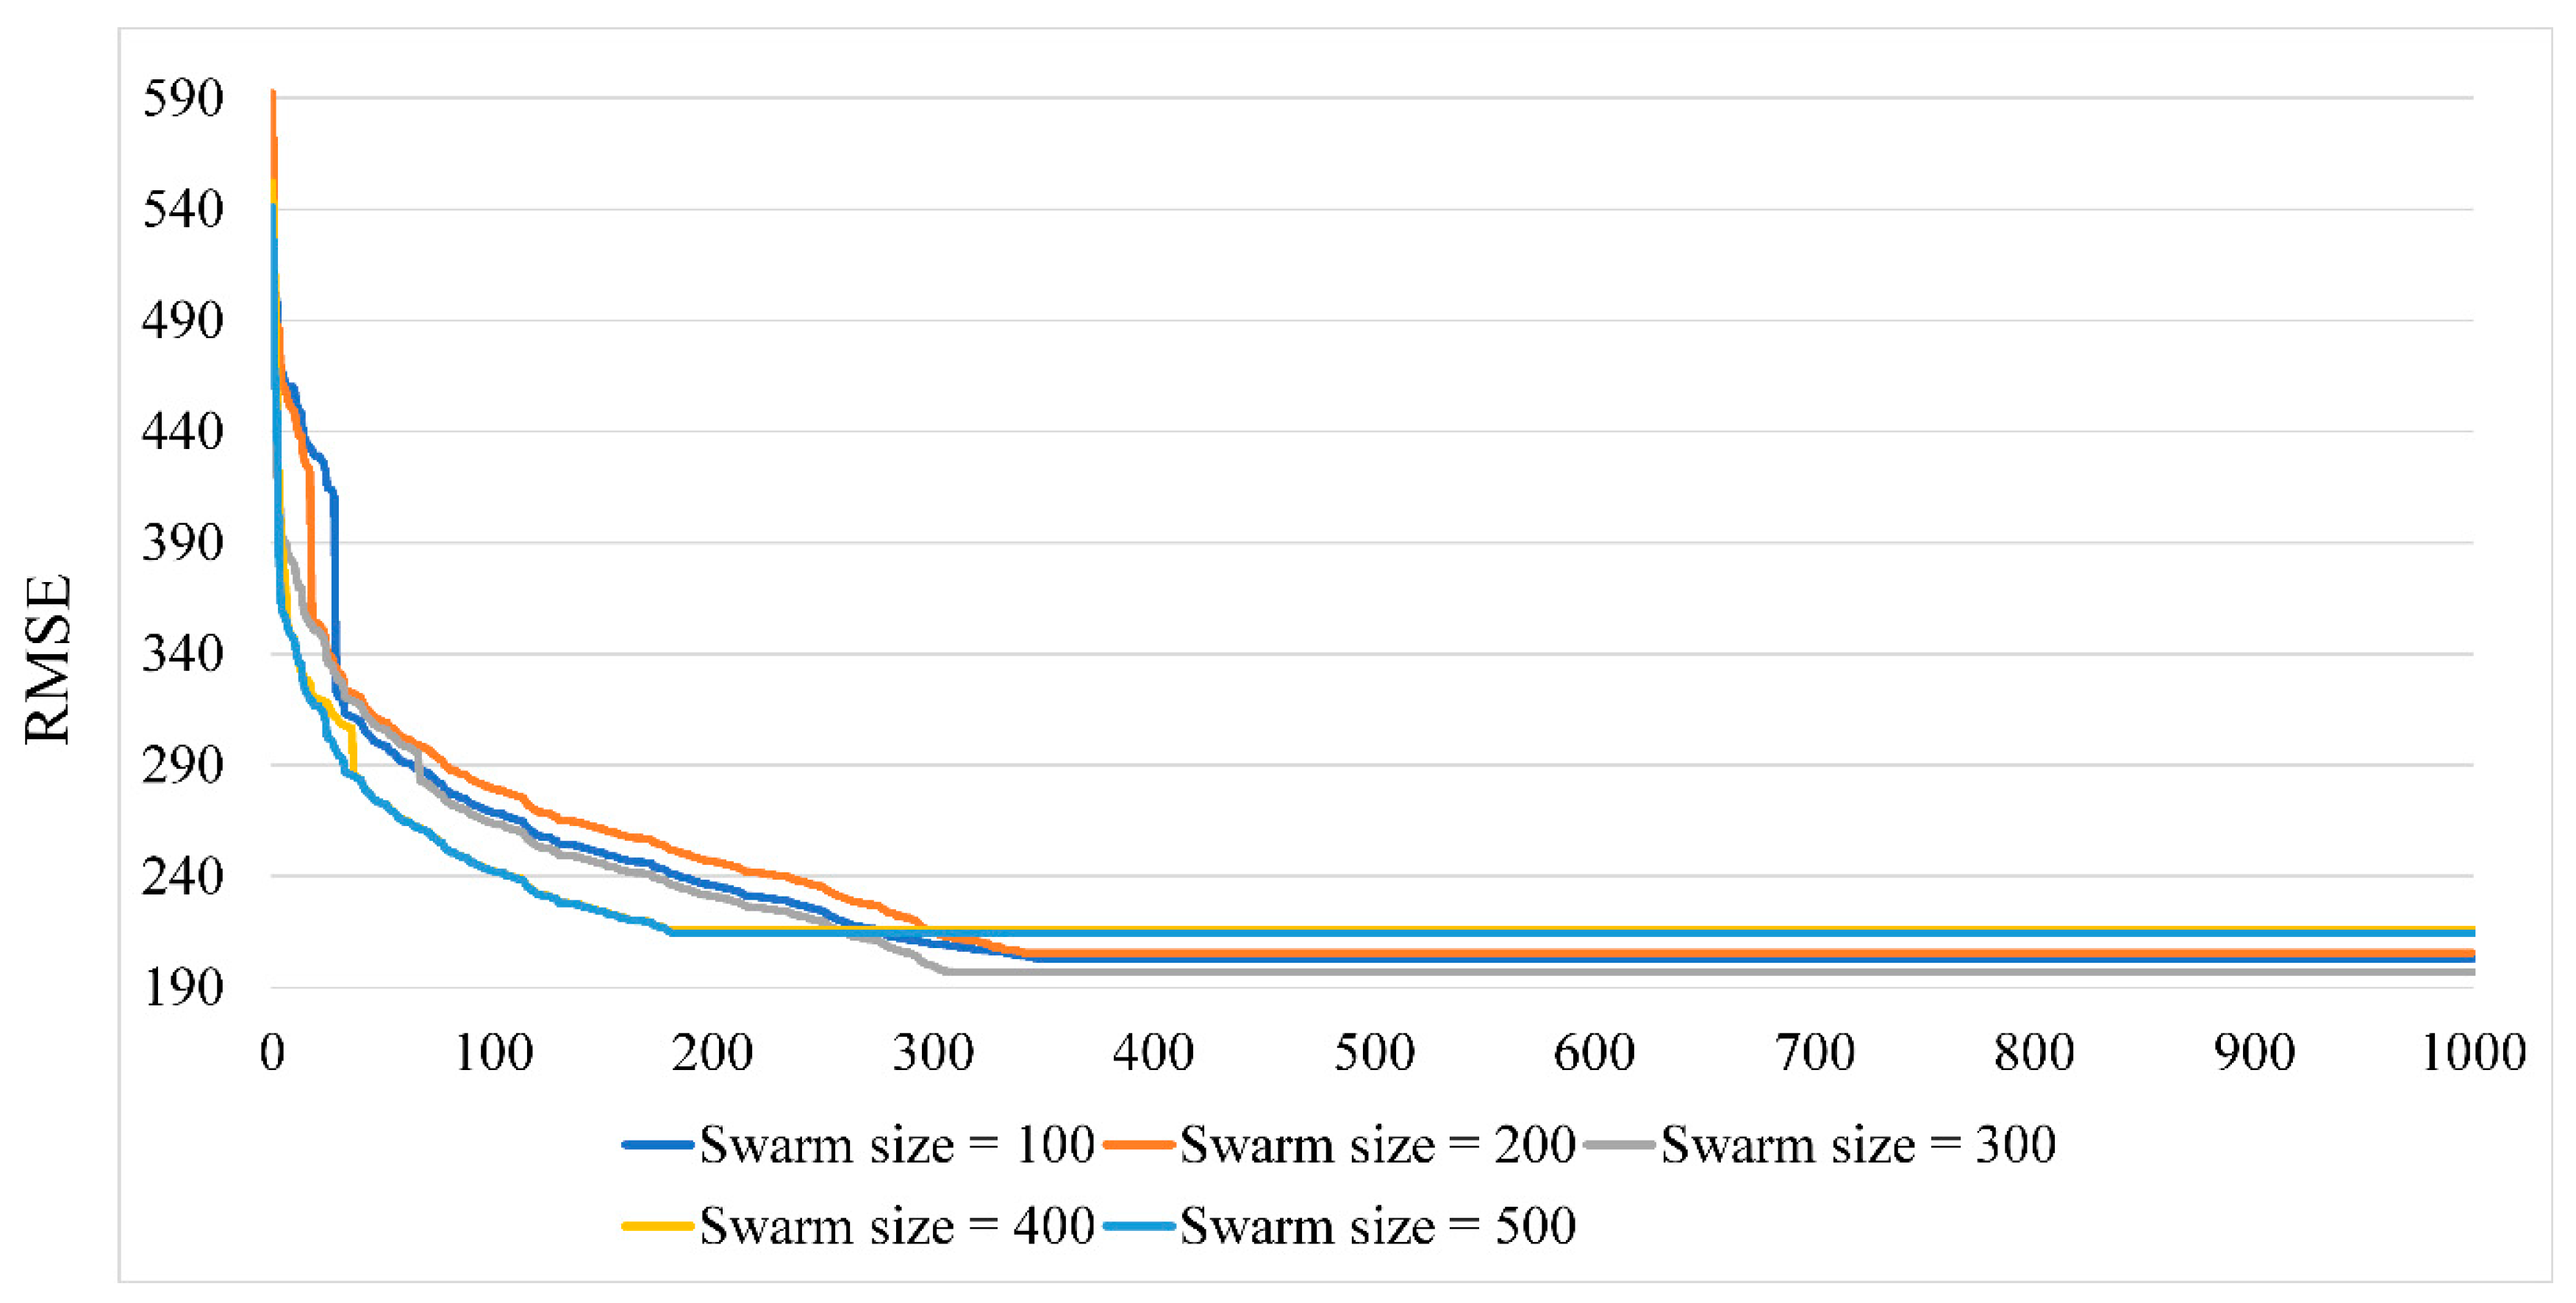
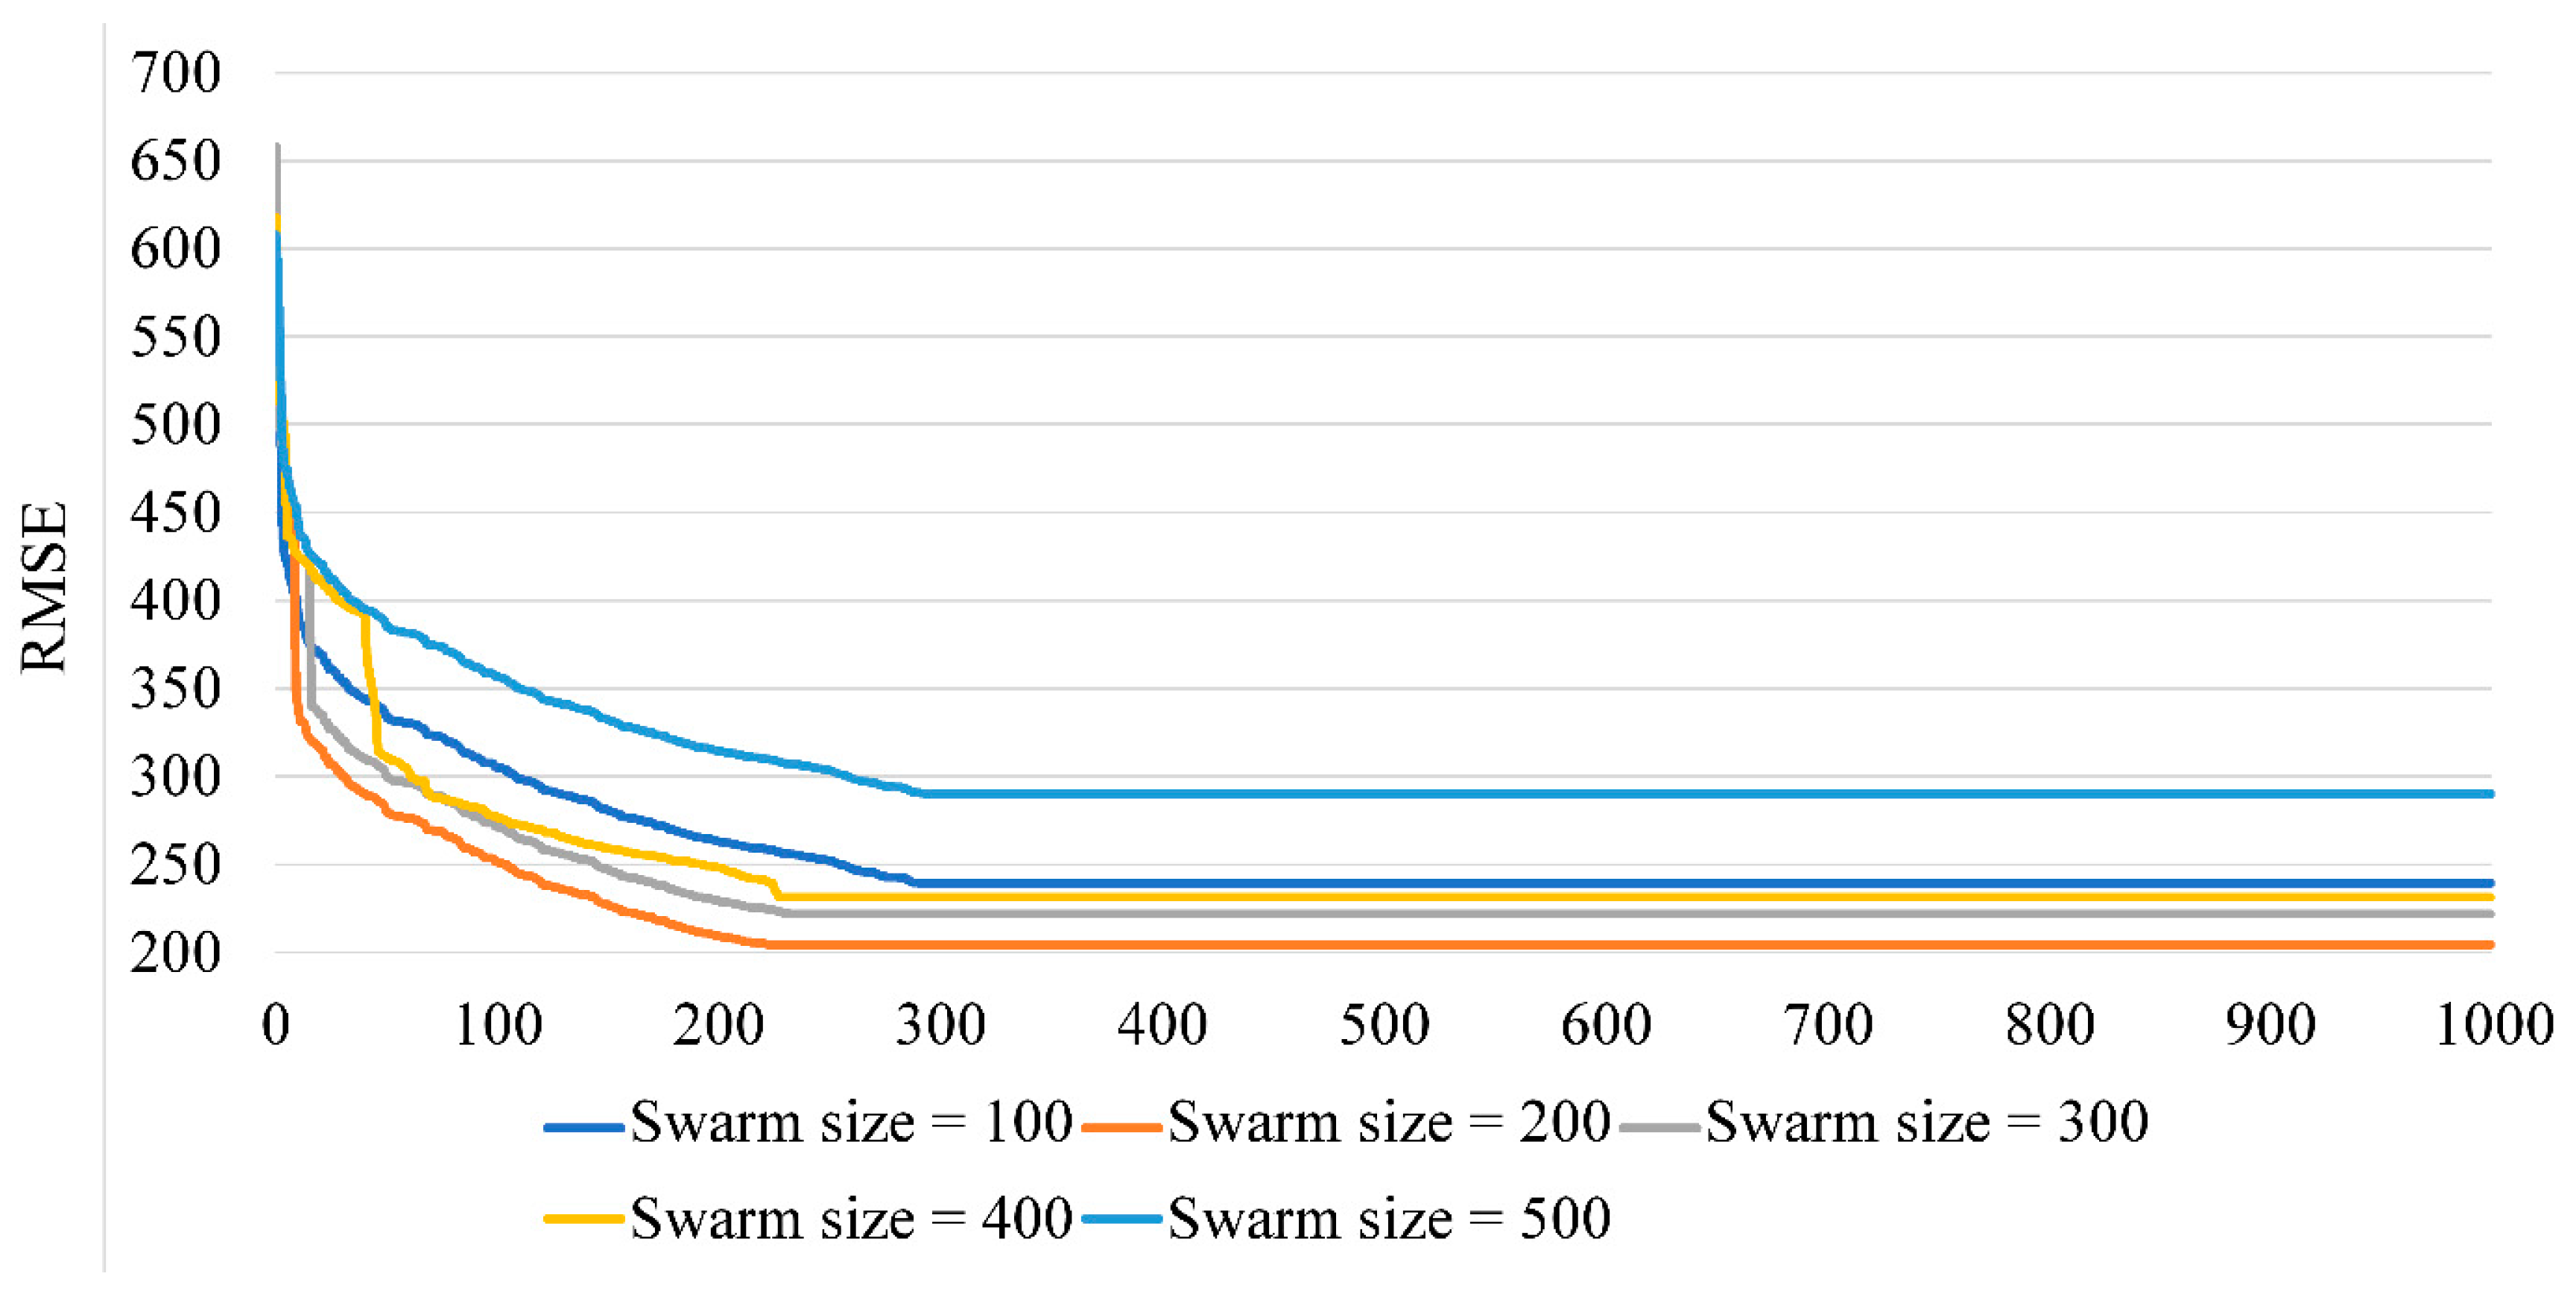
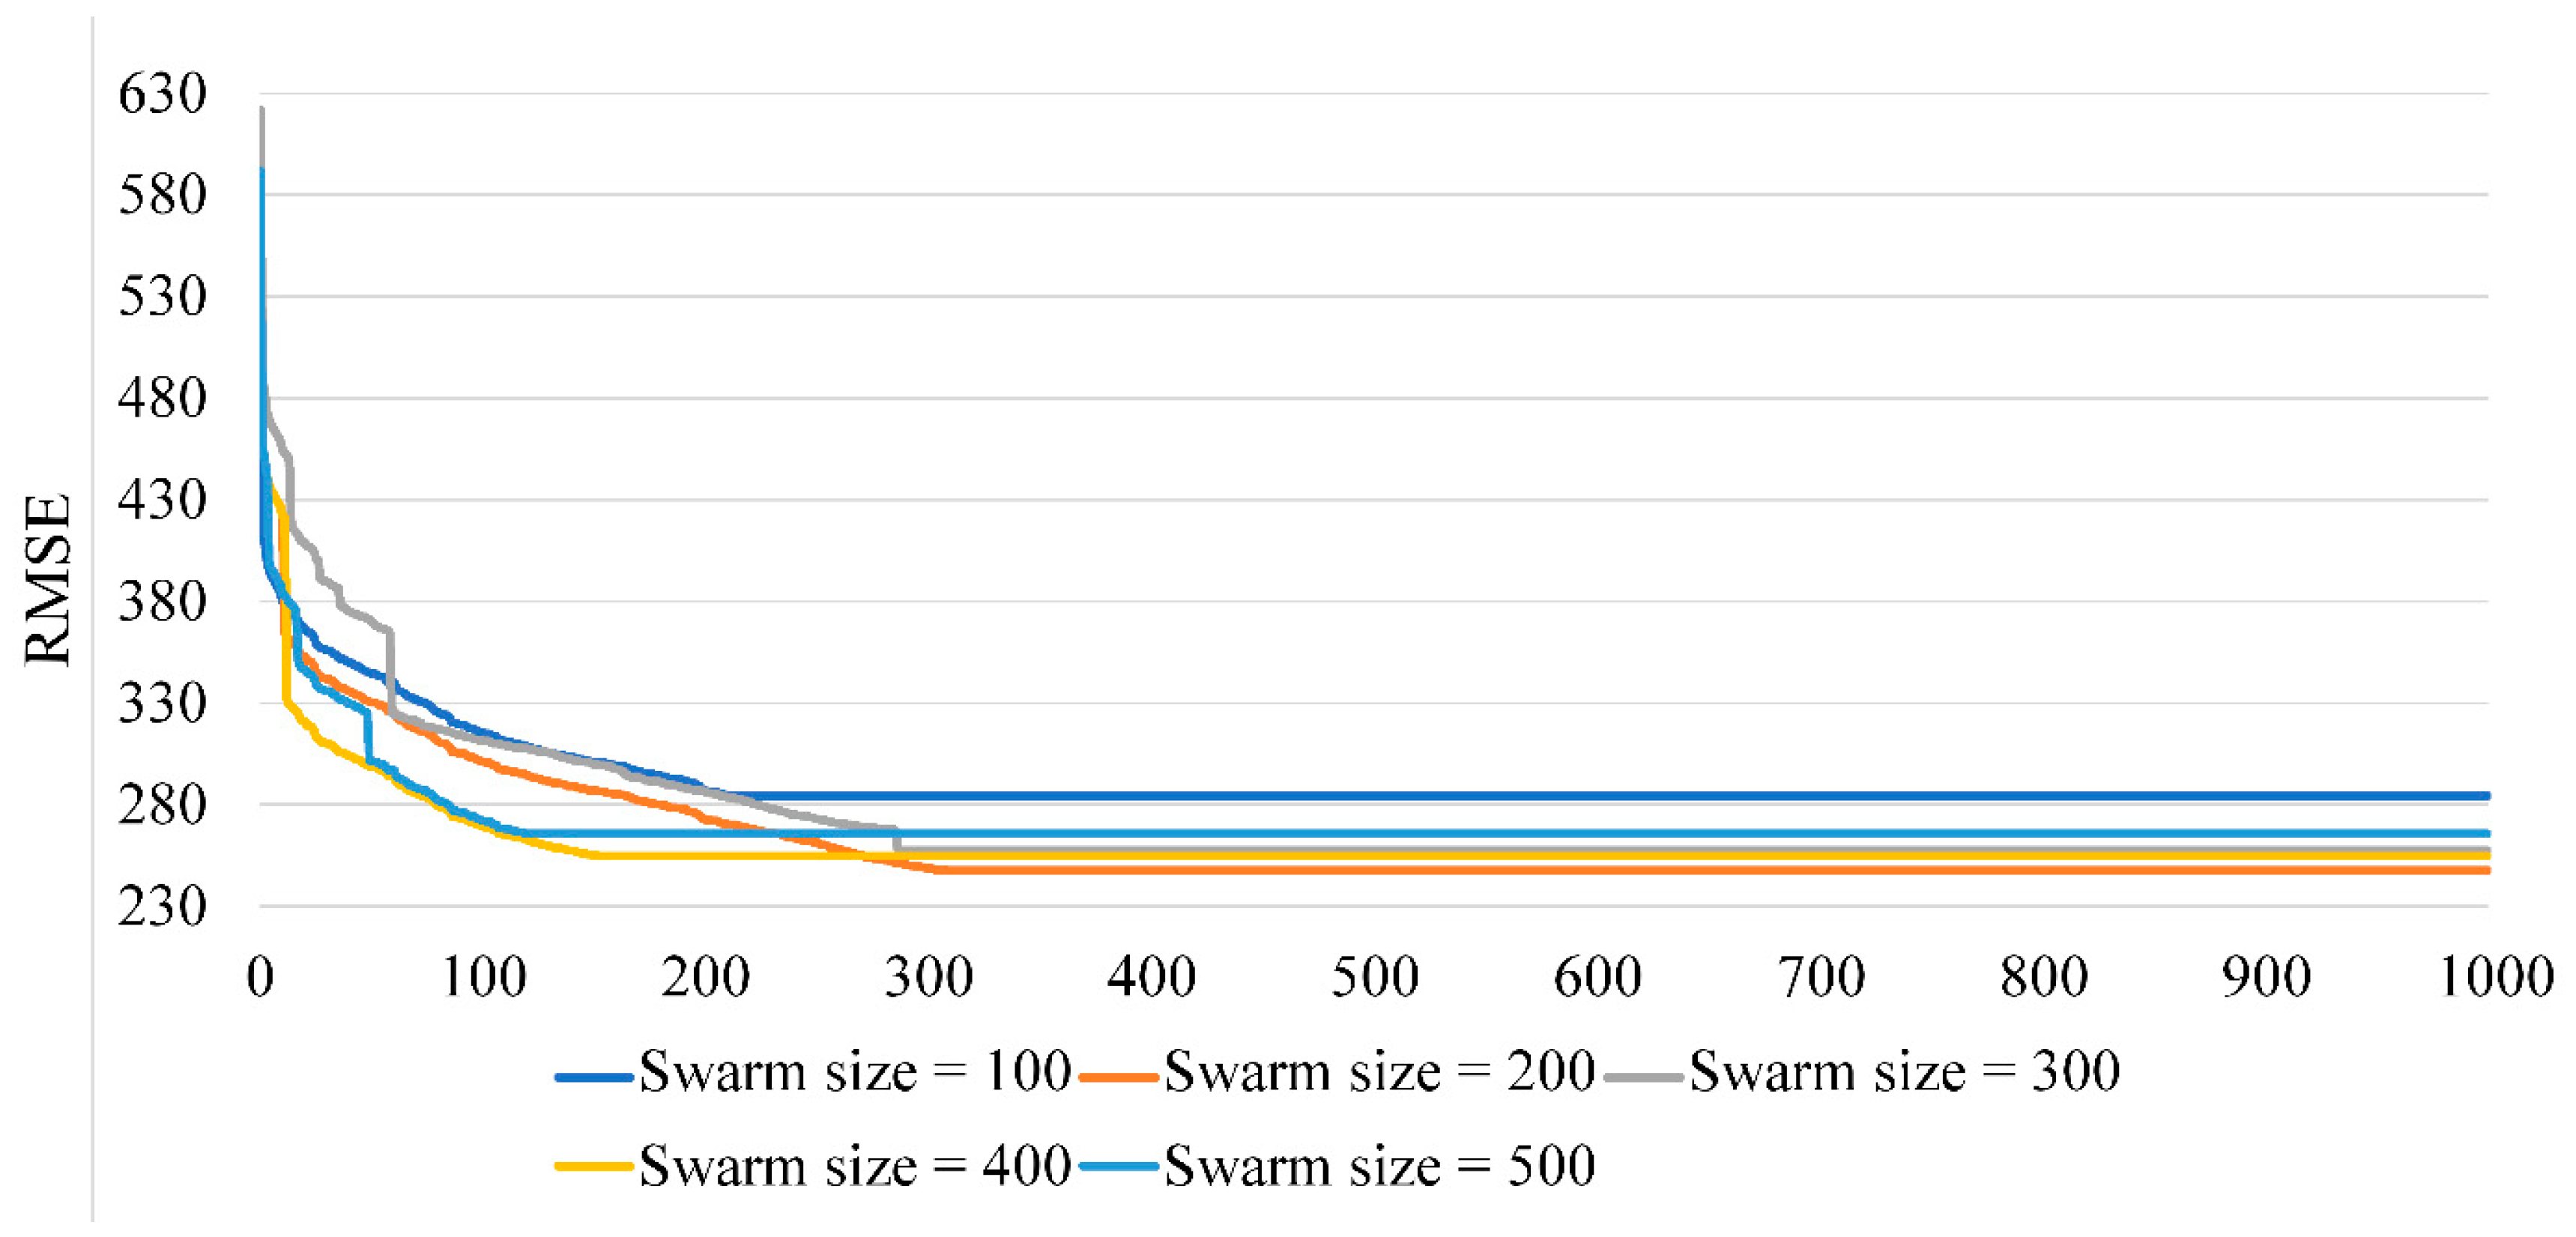
| Category | Moisture (M, %) | Ash (A, %) | Volatile Matter (VM, %) | GCV (Kcal/kg) |
|---|---|---|---|---|
| Min. | 0.200 | 1.32 | 3.580 | 4352 |
| 1st Quarter | 1.520 | 8.95 | 6.435 | 6128 |
| Median | 2.000 | 17.70 | 7.800 | 6816 |
| Mean | 2.037 | 17.60 | 7.860 | 6825 |
| 3rd Quarter | 2.540 | 24.89 | 9.175 | 7625 |
| Max. | 4.350 | 39.96 | 11.990 | 8654 |
| PSO-SVR Model | Hyper-Parameters | |||
|---|---|---|---|---|
| C | d | |||
| Linear function | x | - | - | - |
| Polynomial function | x | x | x | - |
| Radial basis function | x | - | - | x |
| Model | Hyper-Parameters | |||
|---|---|---|---|---|
| C | d | |||
| PSO-SVR-L | 147.025 | - | - | - |
| PSO-SVR-P | 0.157 | 3 | 0.870 | - |
| PSO-SVR-RBF | 4.567 | - | - | 0.279 |
| RMSE | R2 | |
|---|---|---|
| 1 | 475.018 | 0.755 |
| 2 | 432.723 | 0.797 |
| Model | Training | Testing | Total Rank | ||||||
|---|---|---|---|---|---|---|---|---|---|
| RMSE | R2 | Rank for RMSE | Rank for R2 | RMSE | R2 | Rank for RMSE | Rank for R2 | ||
| PSO-SVR-RBF | 196.878 | 0.956 | 6 | 6 | 212.831 | 0.952 | 6 | 6 | 24 |
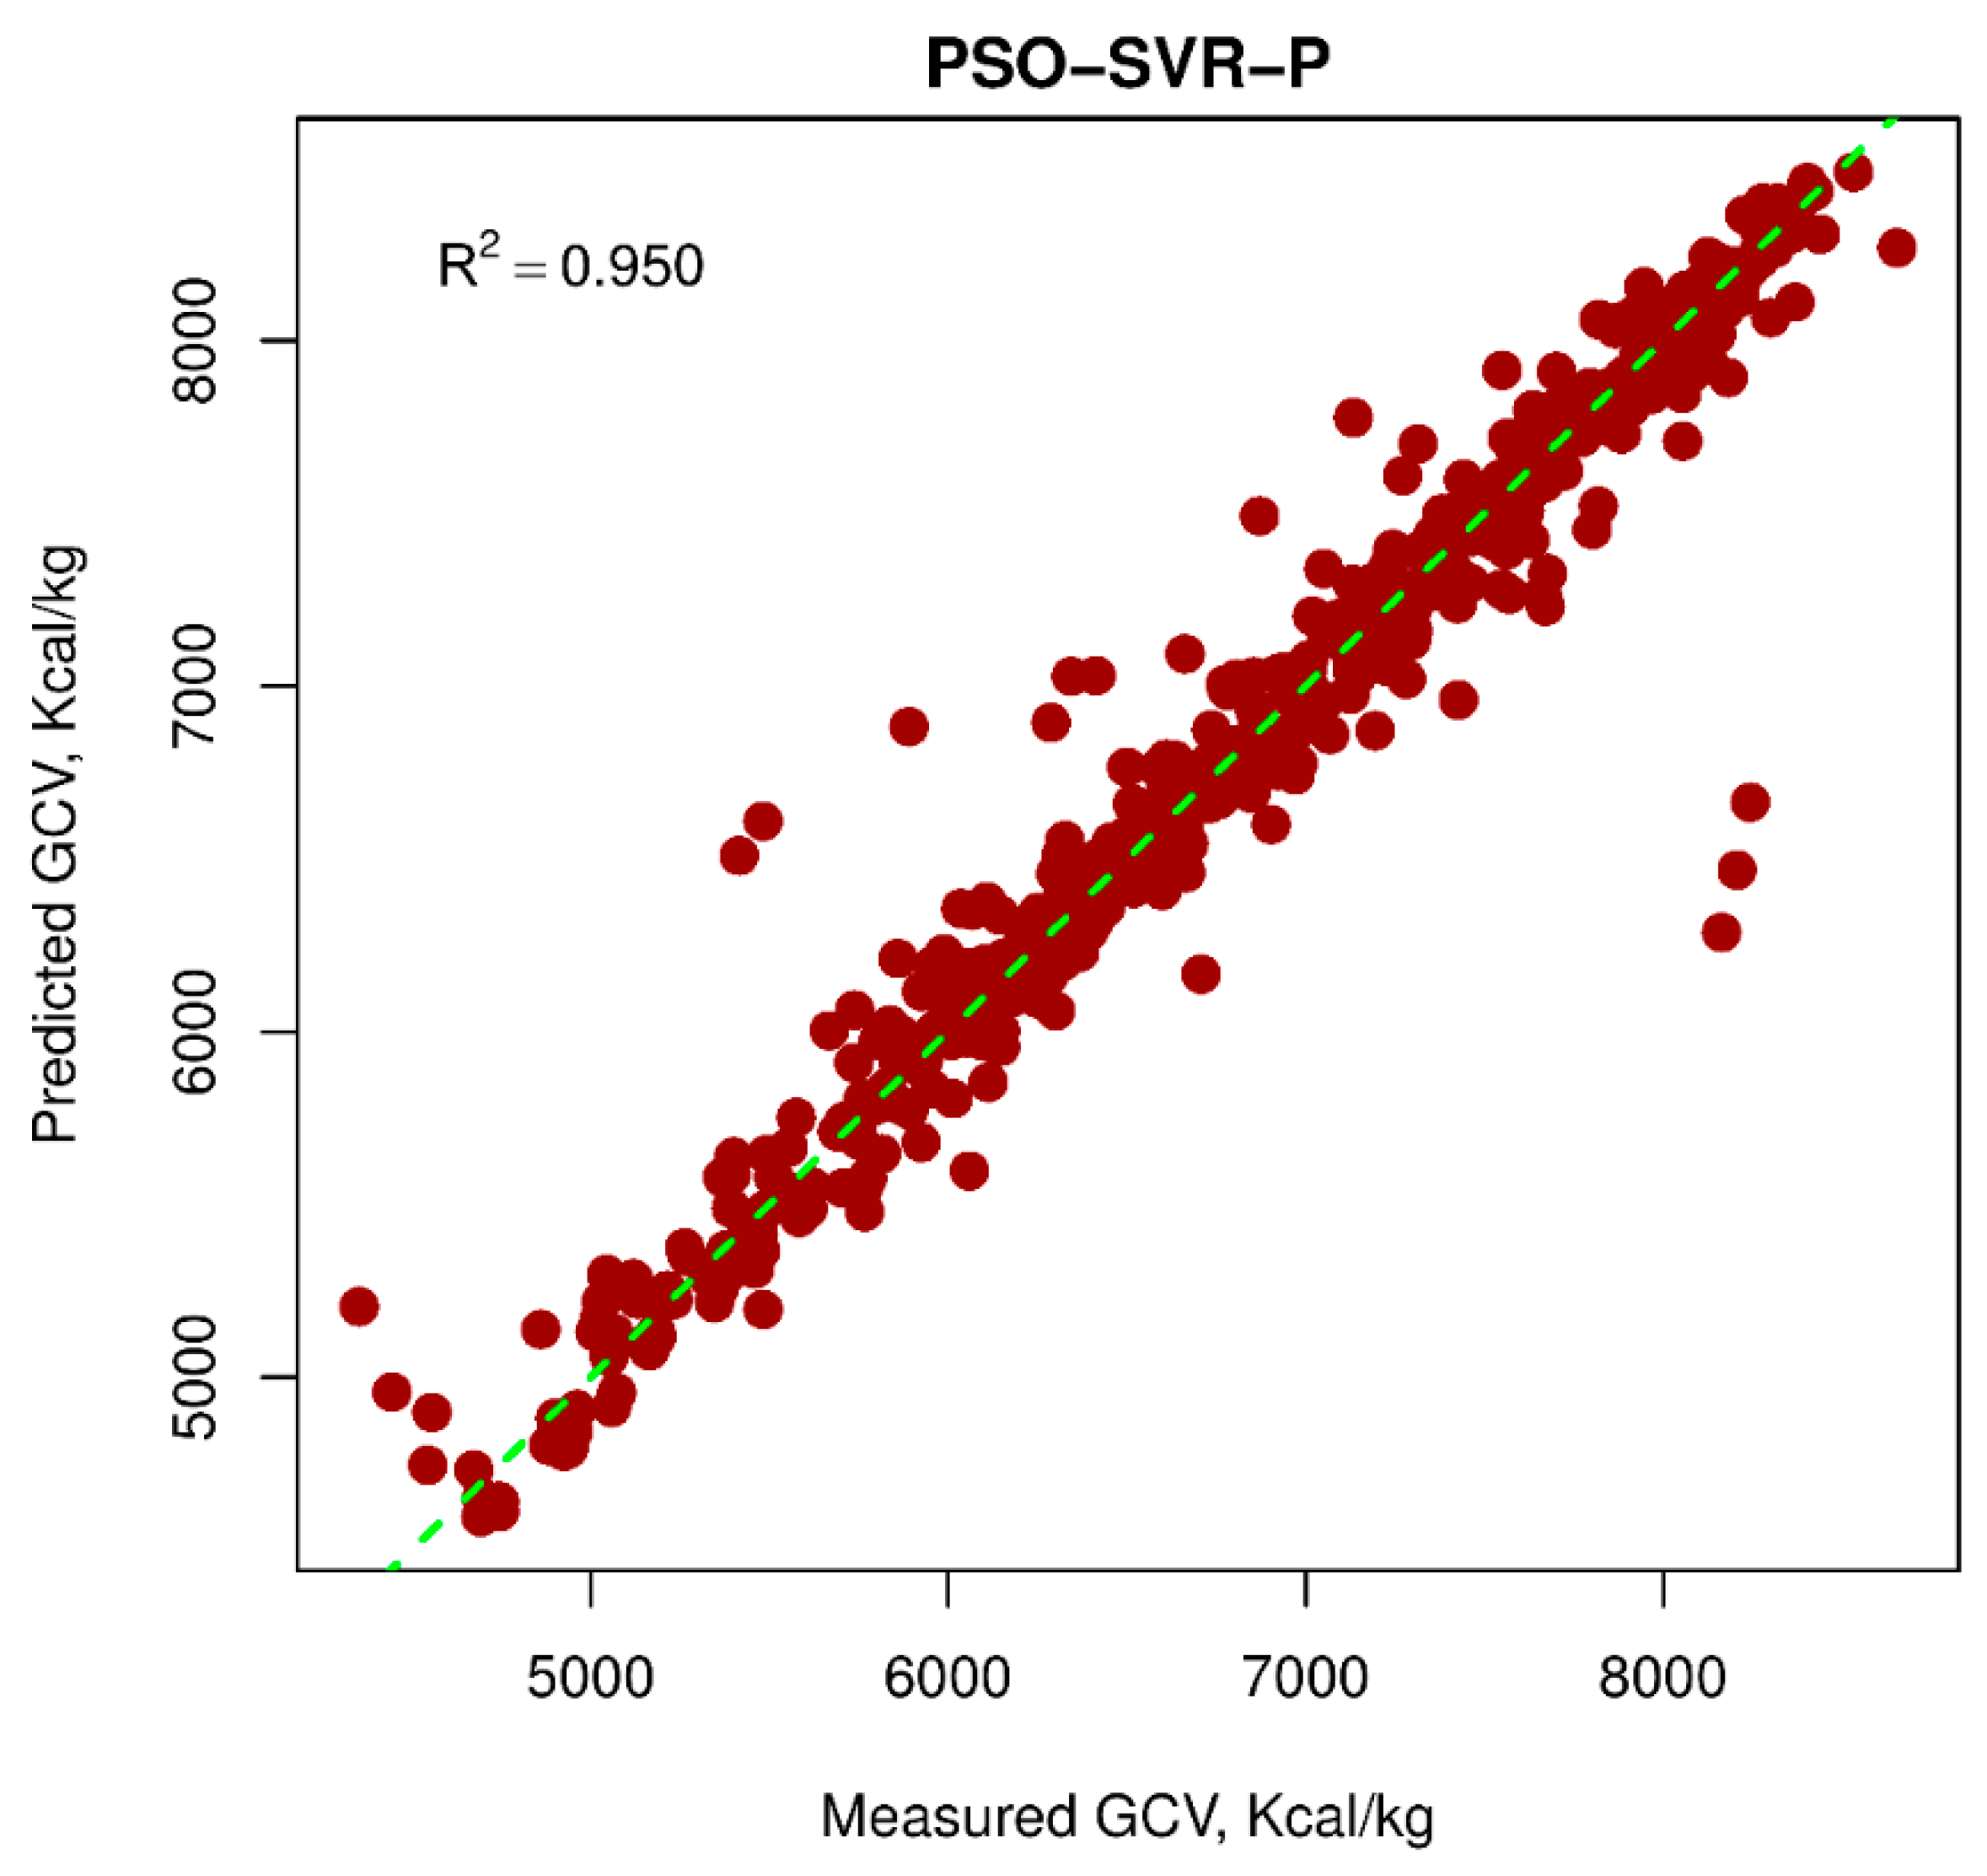
| PSO-SVR-P | 204.347 | 0.953 | 5 | 5 | 215.767 | 0.950 | 5 | 5 | 20 |
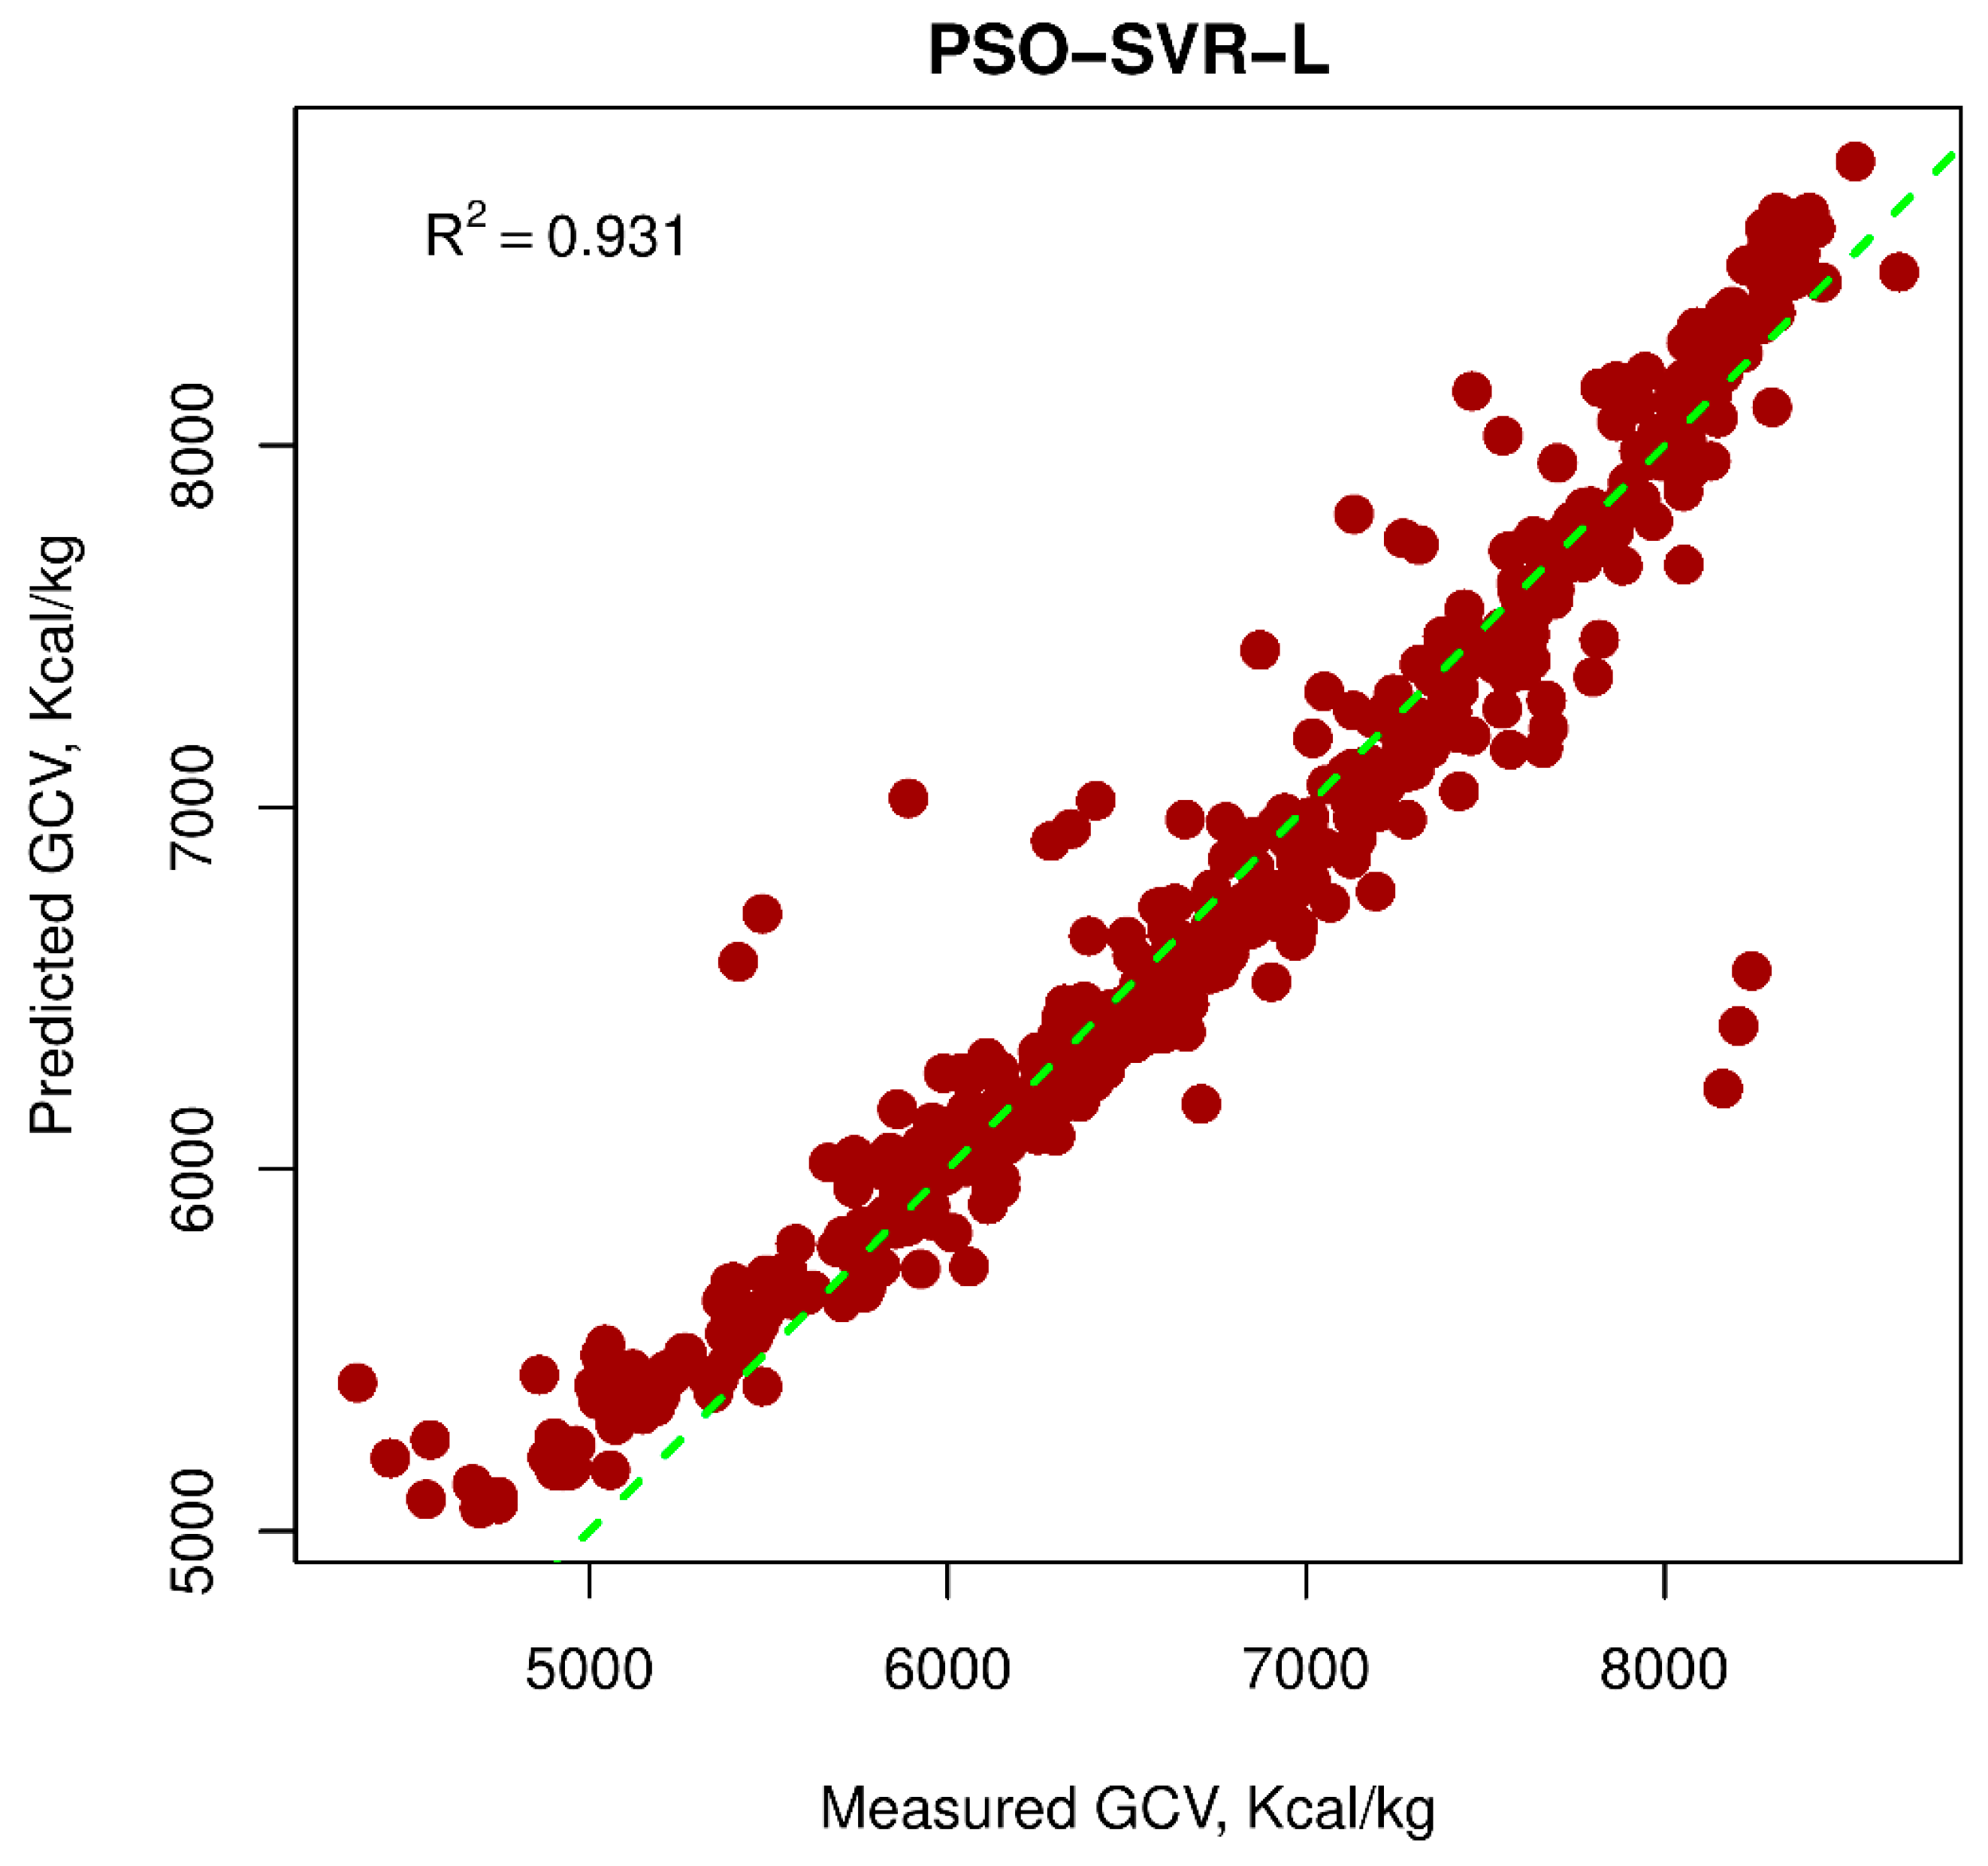
| PSO-SVR-L | 247.581 | 0.933 | 2 | 2 | 254.216 | 0.931 | 2 | 2 | 8 |
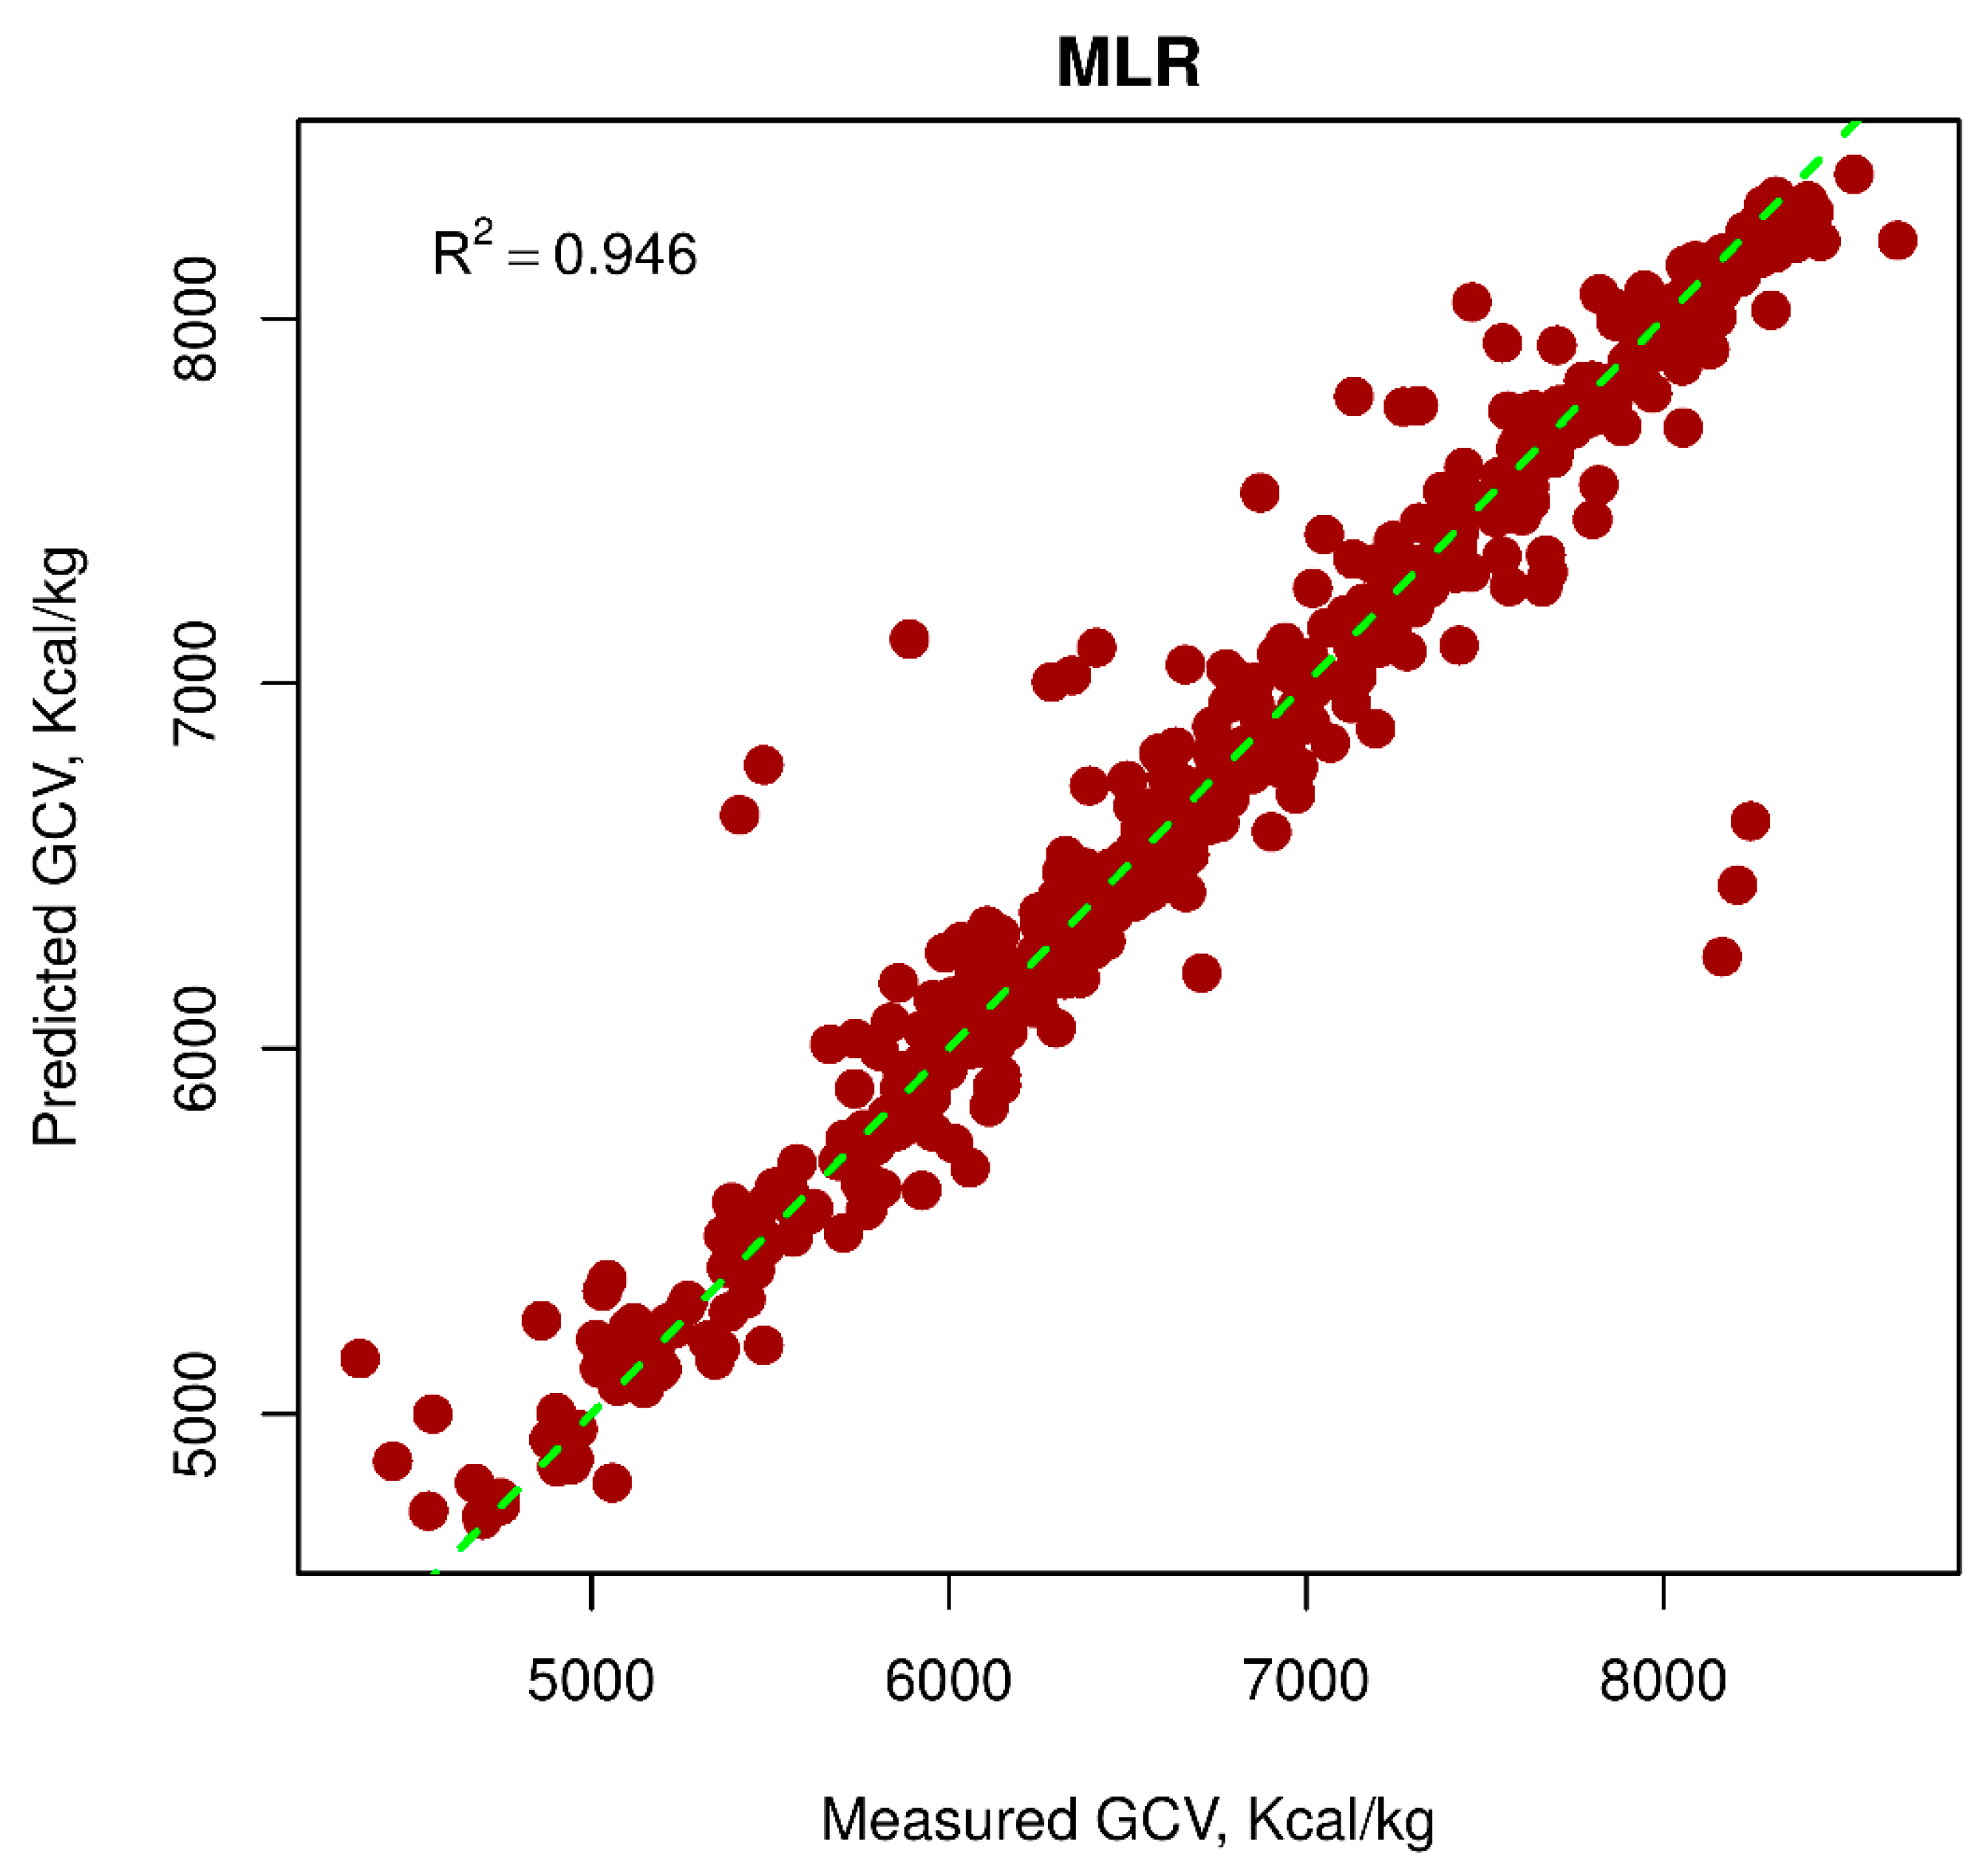
| Multiple linear regression (MLR) | 224.283 | 0.945 | 3 | 3 | 225.943 | 0.946 | 4 | 3 | 13 |
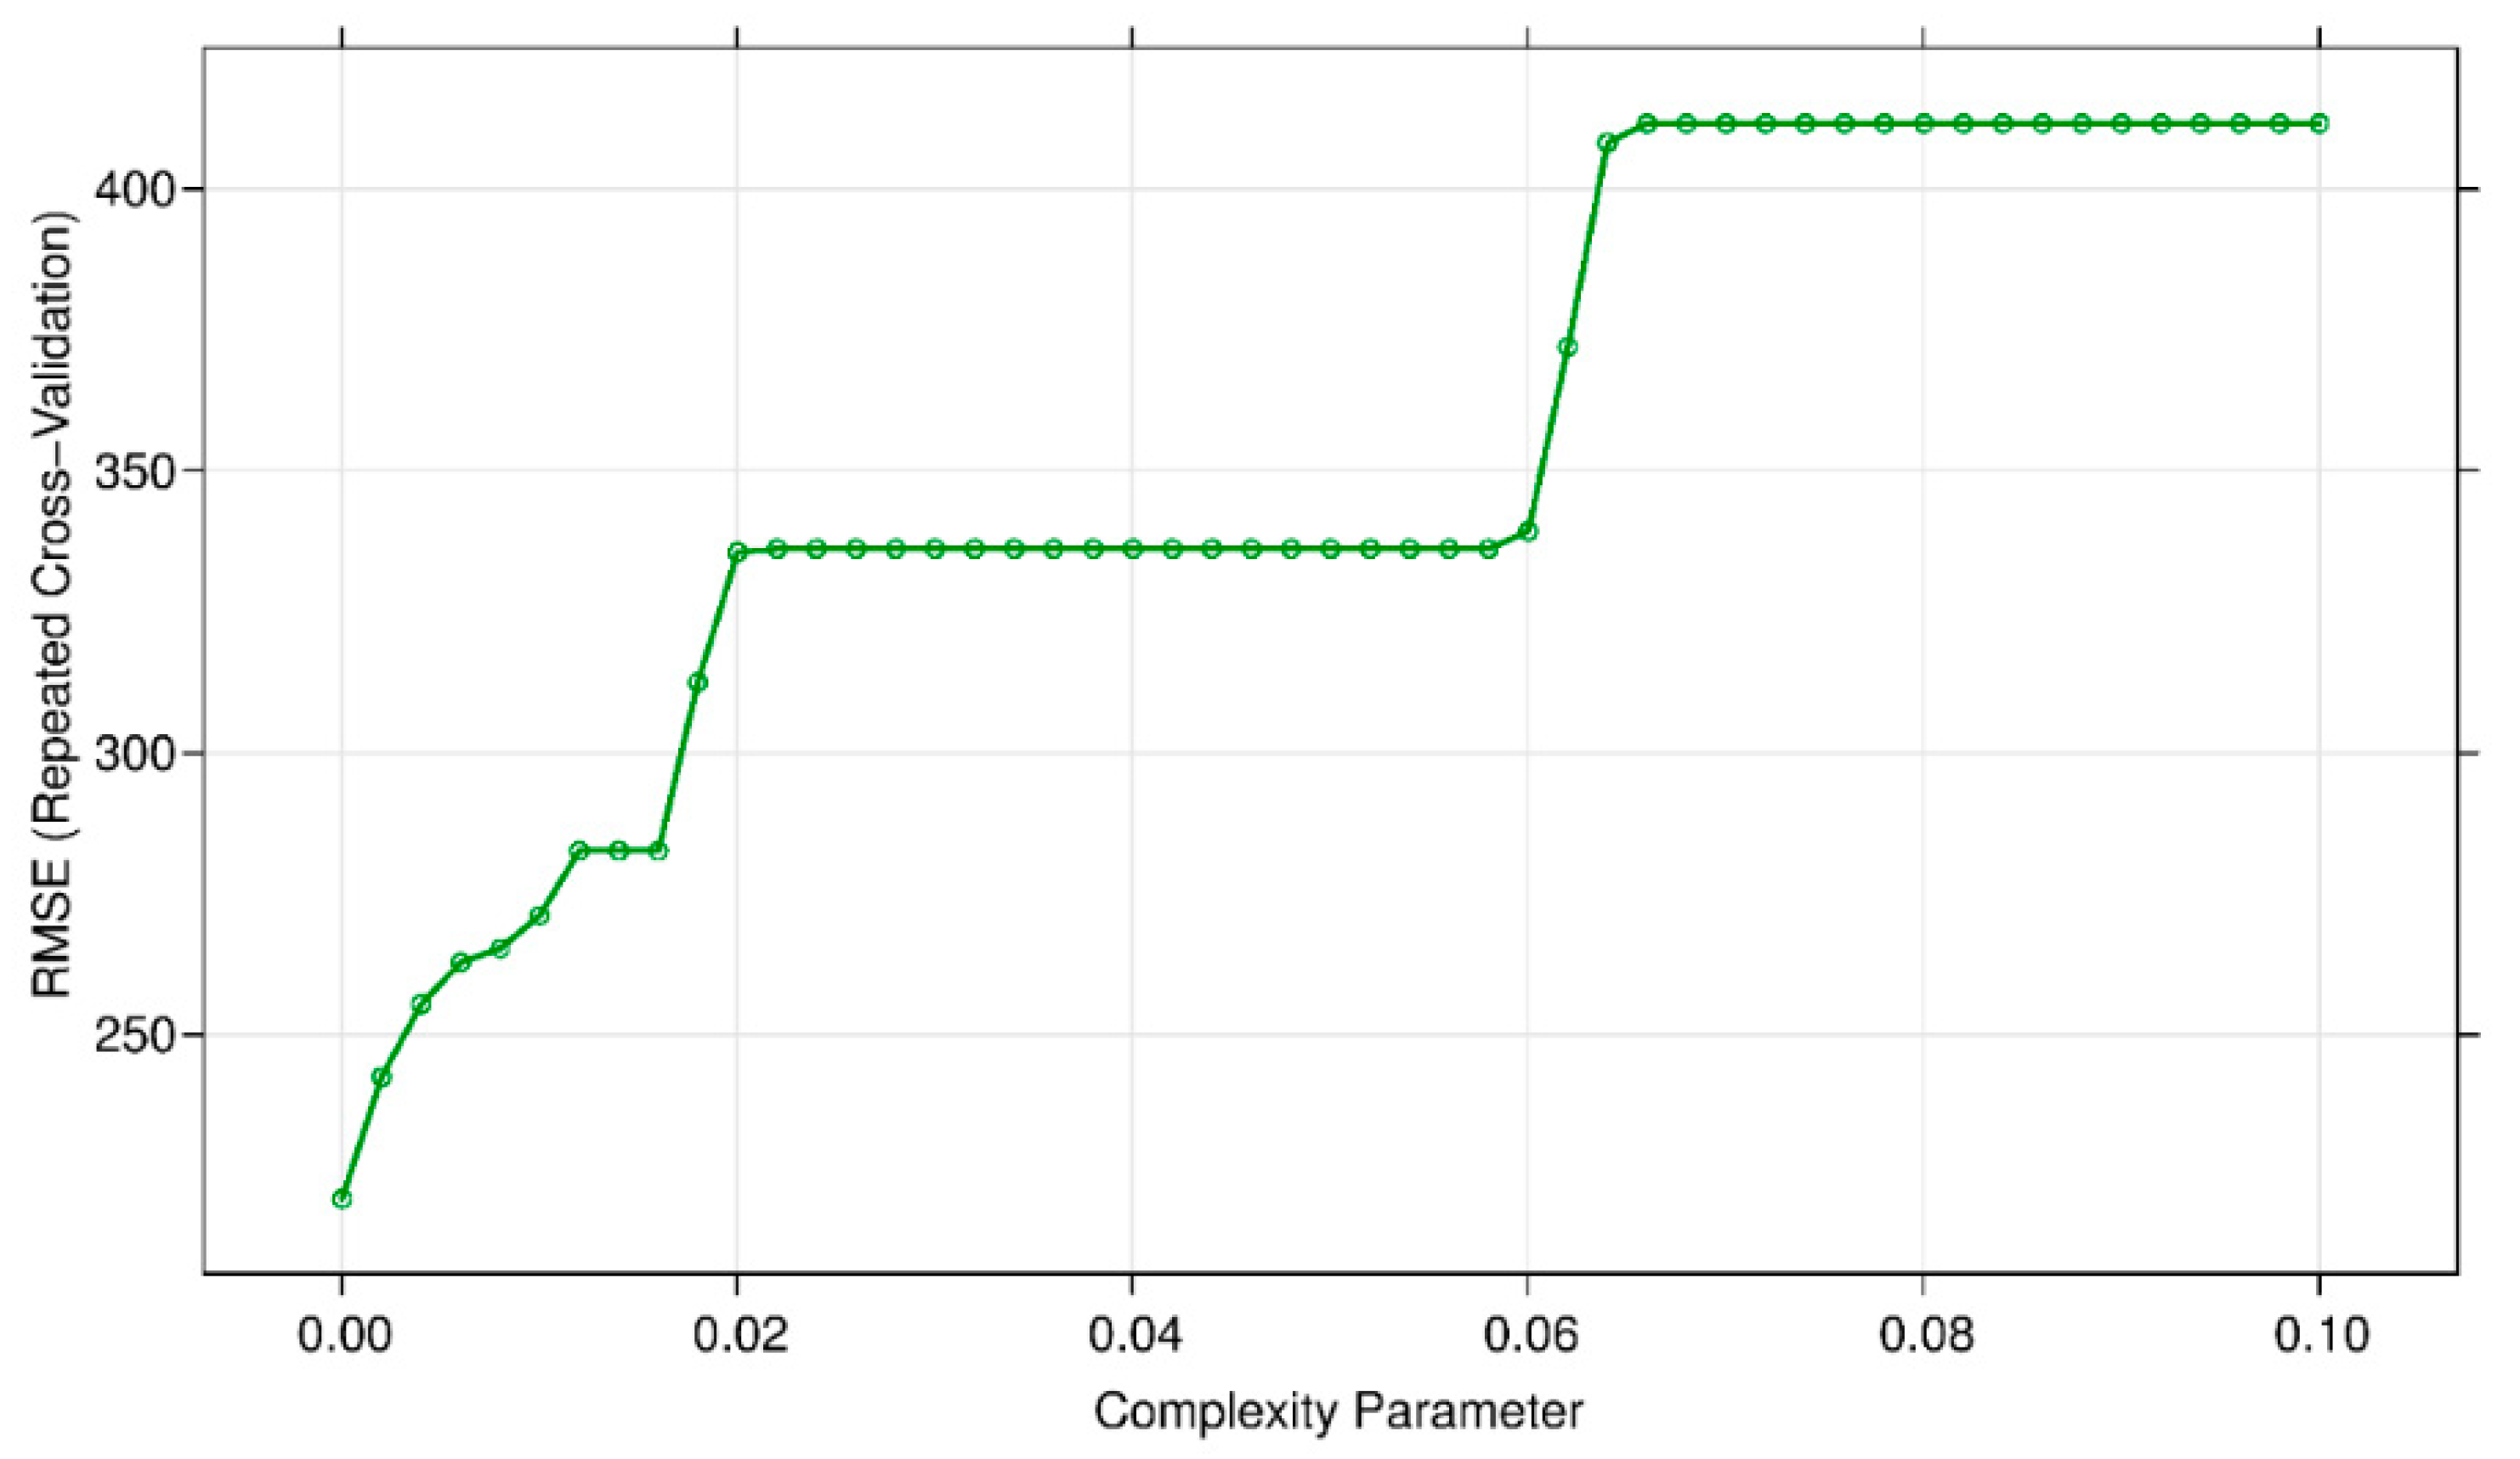
| Classification and regression trees (CART) | 220.891 | 0.946 | 4 | 4 | 226.434 | 0.946 | 3 | 3 | 14 |
| Principal component analysis (PCA) | 432.728 | 0.797 | 1 | 1 | 439.585 | 0.794 | 1 | 1 | 4 |
© 2019 by the authors. Licensee MDPI, Basel, Switzerland. This article is an open access article distributed under the terms and conditions of the Creative Commons Attribution (CC BY) license (http://creativecommons.org/licenses/by/4.0/).
Share and Cite
Bui, H.-B.; Nguyen, H.; Choi, Y.; Bui, X.-N.; Nguyen-Thoi, T.; Zandi, Y. A Novel Artificial Intelligence Technique to Estimate the Gross Calorific Value of Coal Based on Meta-Heuristic and Support Vector Regression Algorithms. Appl. Sci. 2019, 9, 4868. https://doi.org/10.3390/app9224868
Bui H-B, Nguyen H, Choi Y, Bui X-N, Nguyen-Thoi T, Zandi Y. A Novel Artificial Intelligence Technique to Estimate the Gross Calorific Value of Coal Based on Meta-Heuristic and Support Vector Regression Algorithms. Applied Sciences. 2019; 9(22):4868. https://doi.org/10.3390/app9224868
Chicago/Turabian StyleBui, Hoang-Bac, Hoang Nguyen, Yosoon Choi, Xuan-Nam Bui, Trung Nguyen-Thoi, and Yousef Zandi. 2019. "A Novel Artificial Intelligence Technique to Estimate the Gross Calorific Value of Coal Based on Meta-Heuristic and Support Vector Regression Algorithms" Applied Sciences 9, no. 22: 4868. https://doi.org/10.3390/app9224868
APA StyleBui, H.-B., Nguyen, H., Choi, Y., Bui, X.-N., Nguyen-Thoi, T., & Zandi, Y. (2019). A Novel Artificial Intelligence Technique to Estimate the Gross Calorific Value of Coal Based on Meta-Heuristic and Support Vector Regression Algorithms. Applied Sciences, 9(22), 4868. https://doi.org/10.3390/app9224868


