Aroma Release of Olfactory Displays Based on Audio-Visual Content

 , ,
, ,
Abstract
:1. Introduction
2. Literature Review
2.1. Sound Recognition
2.2. Olfactory Displays
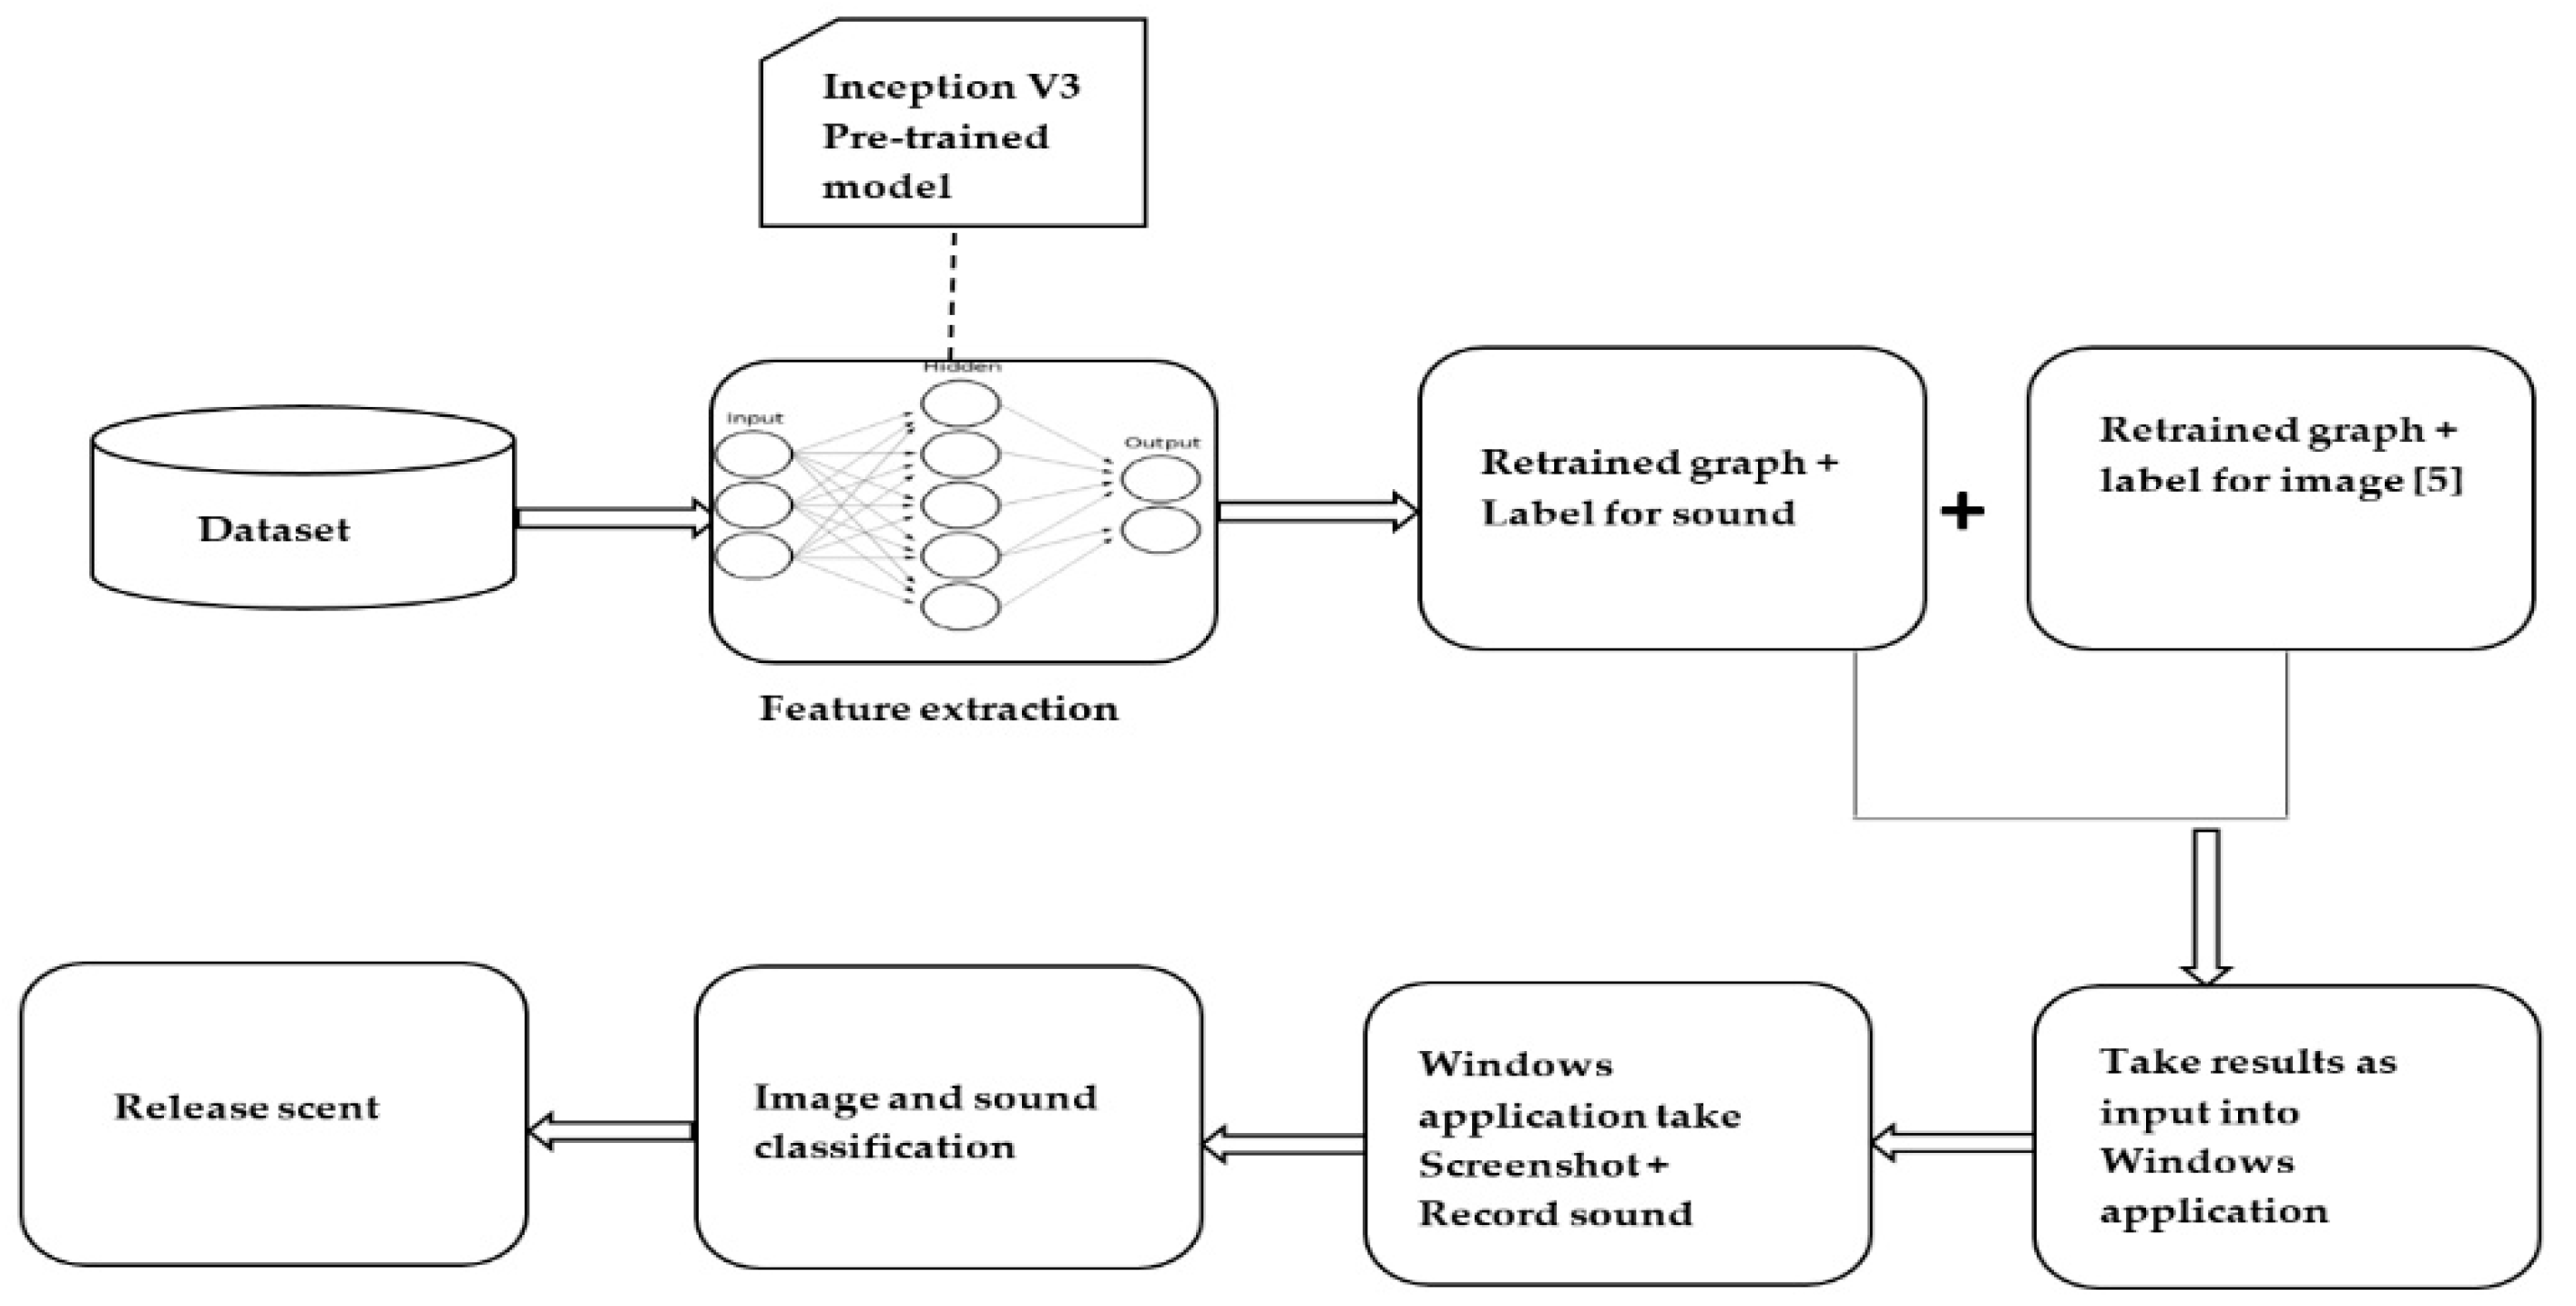
3. Methodology
3.1. System Overview
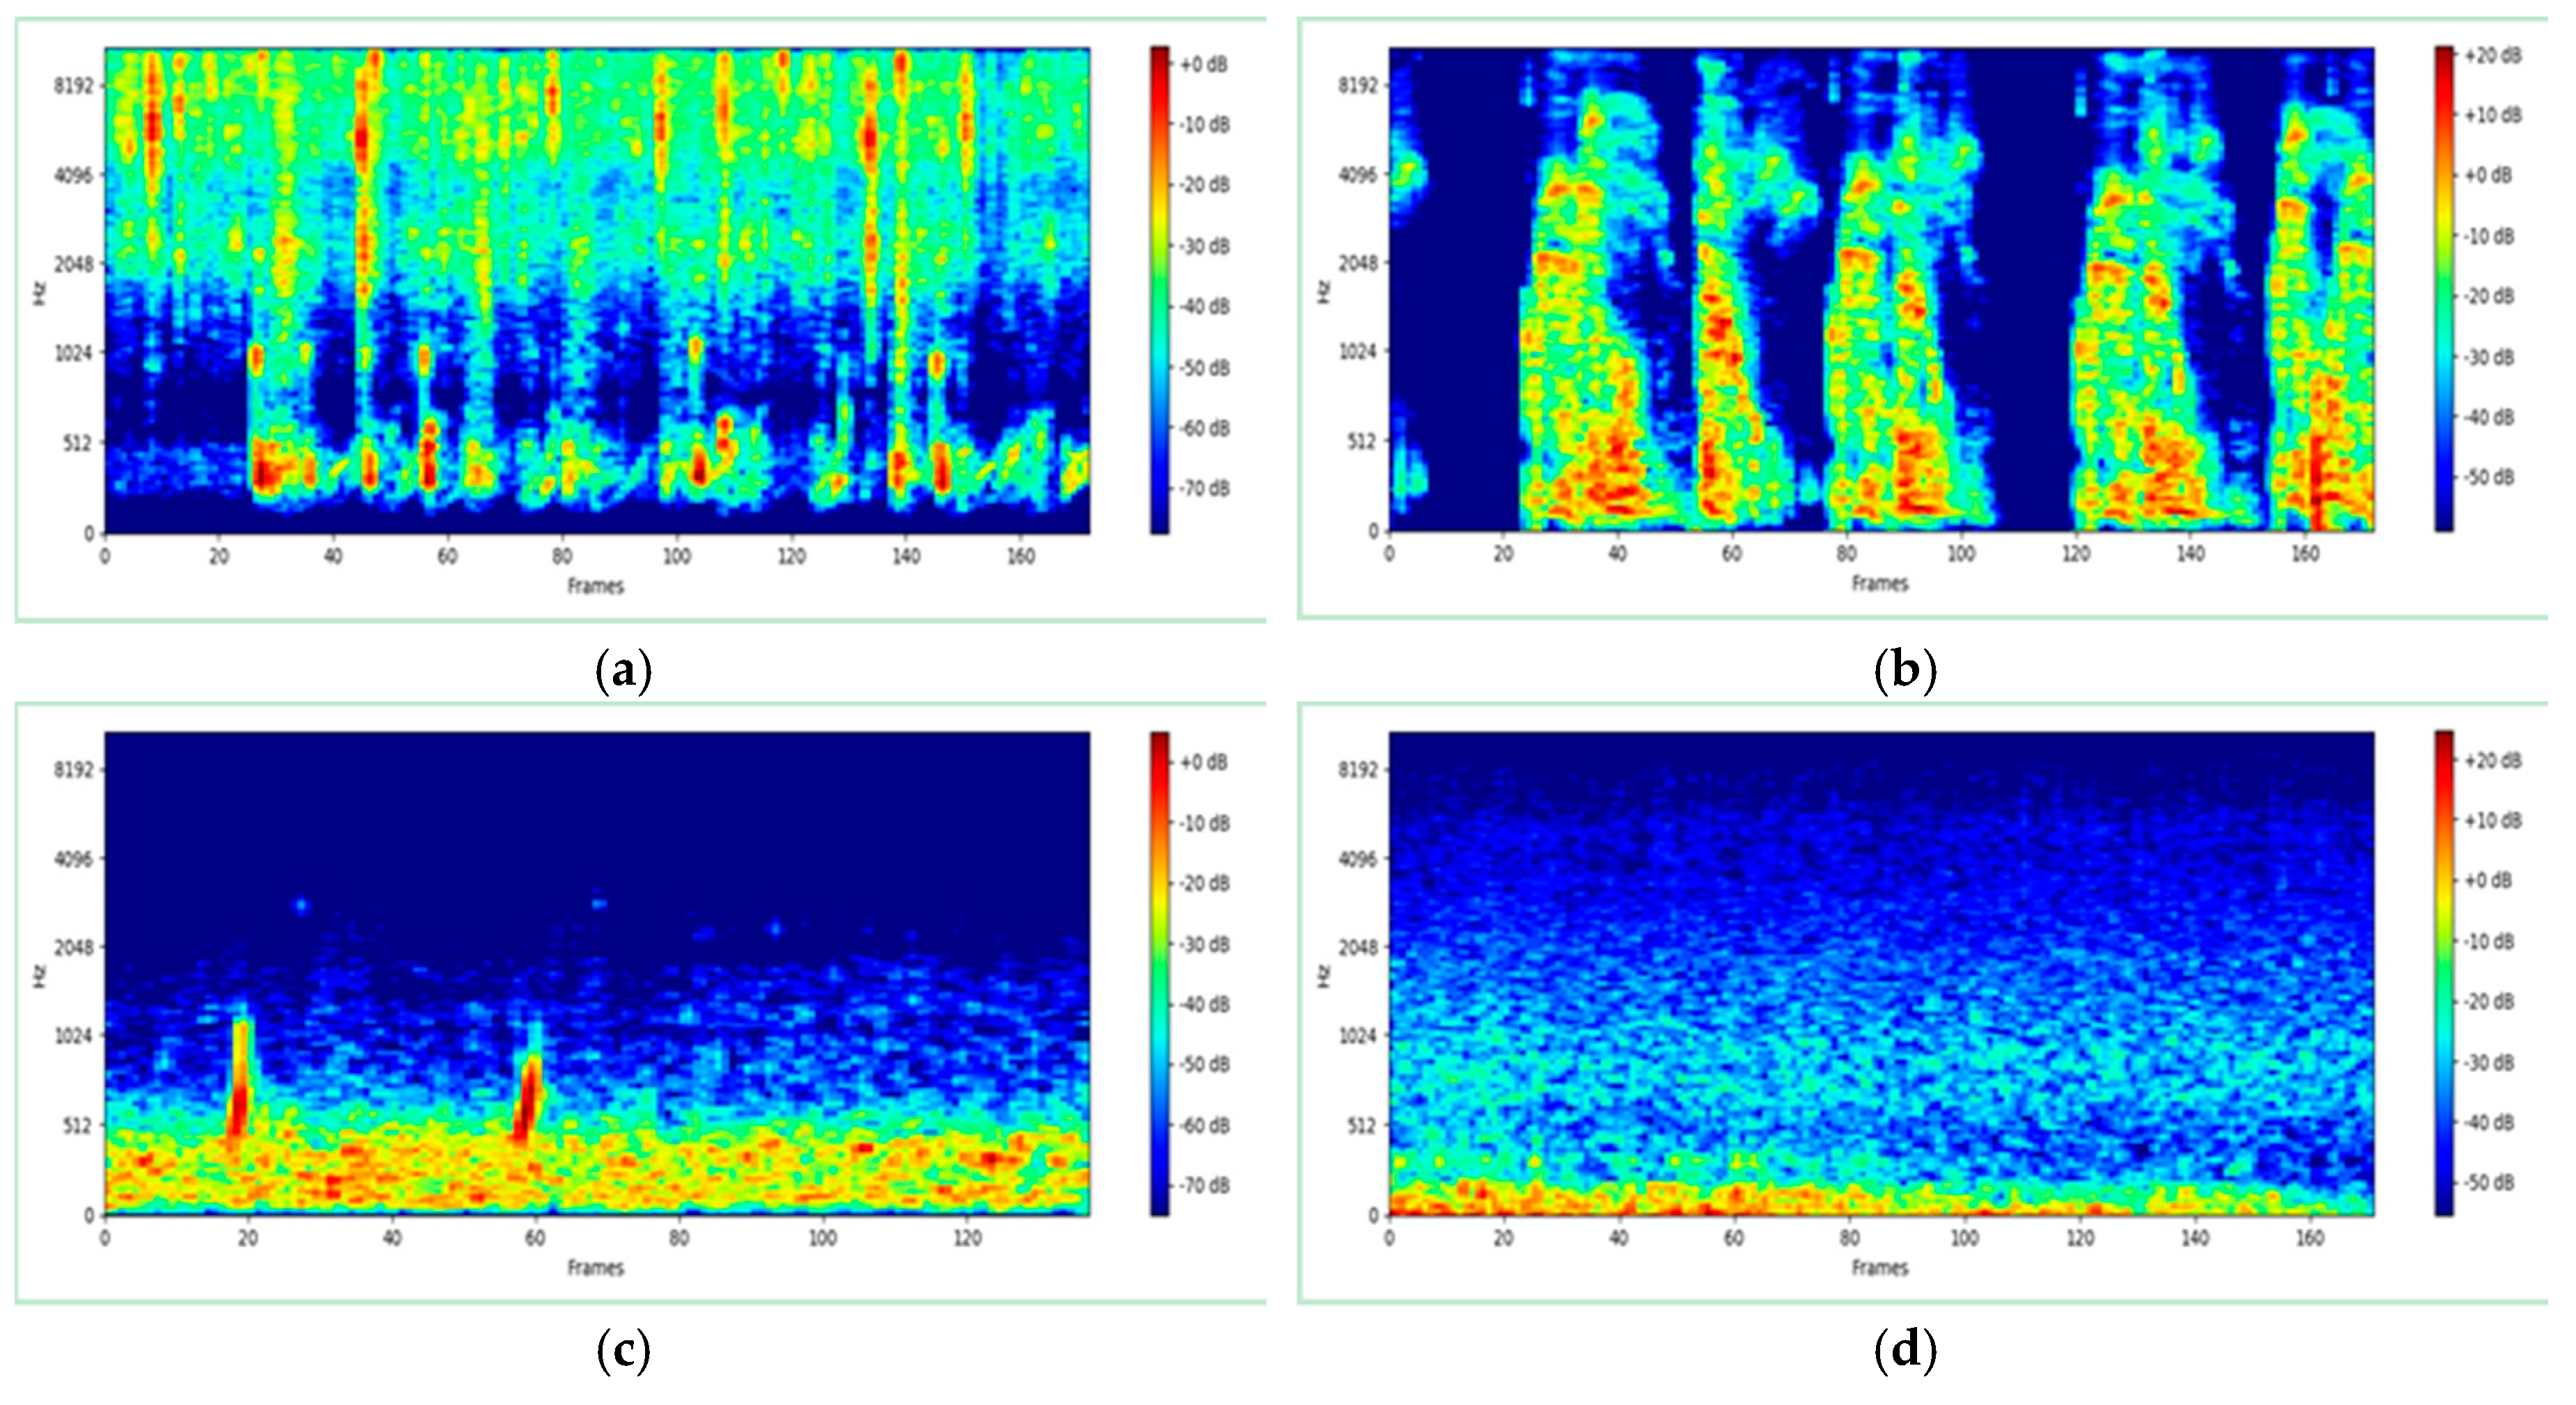
3.2. Dataset
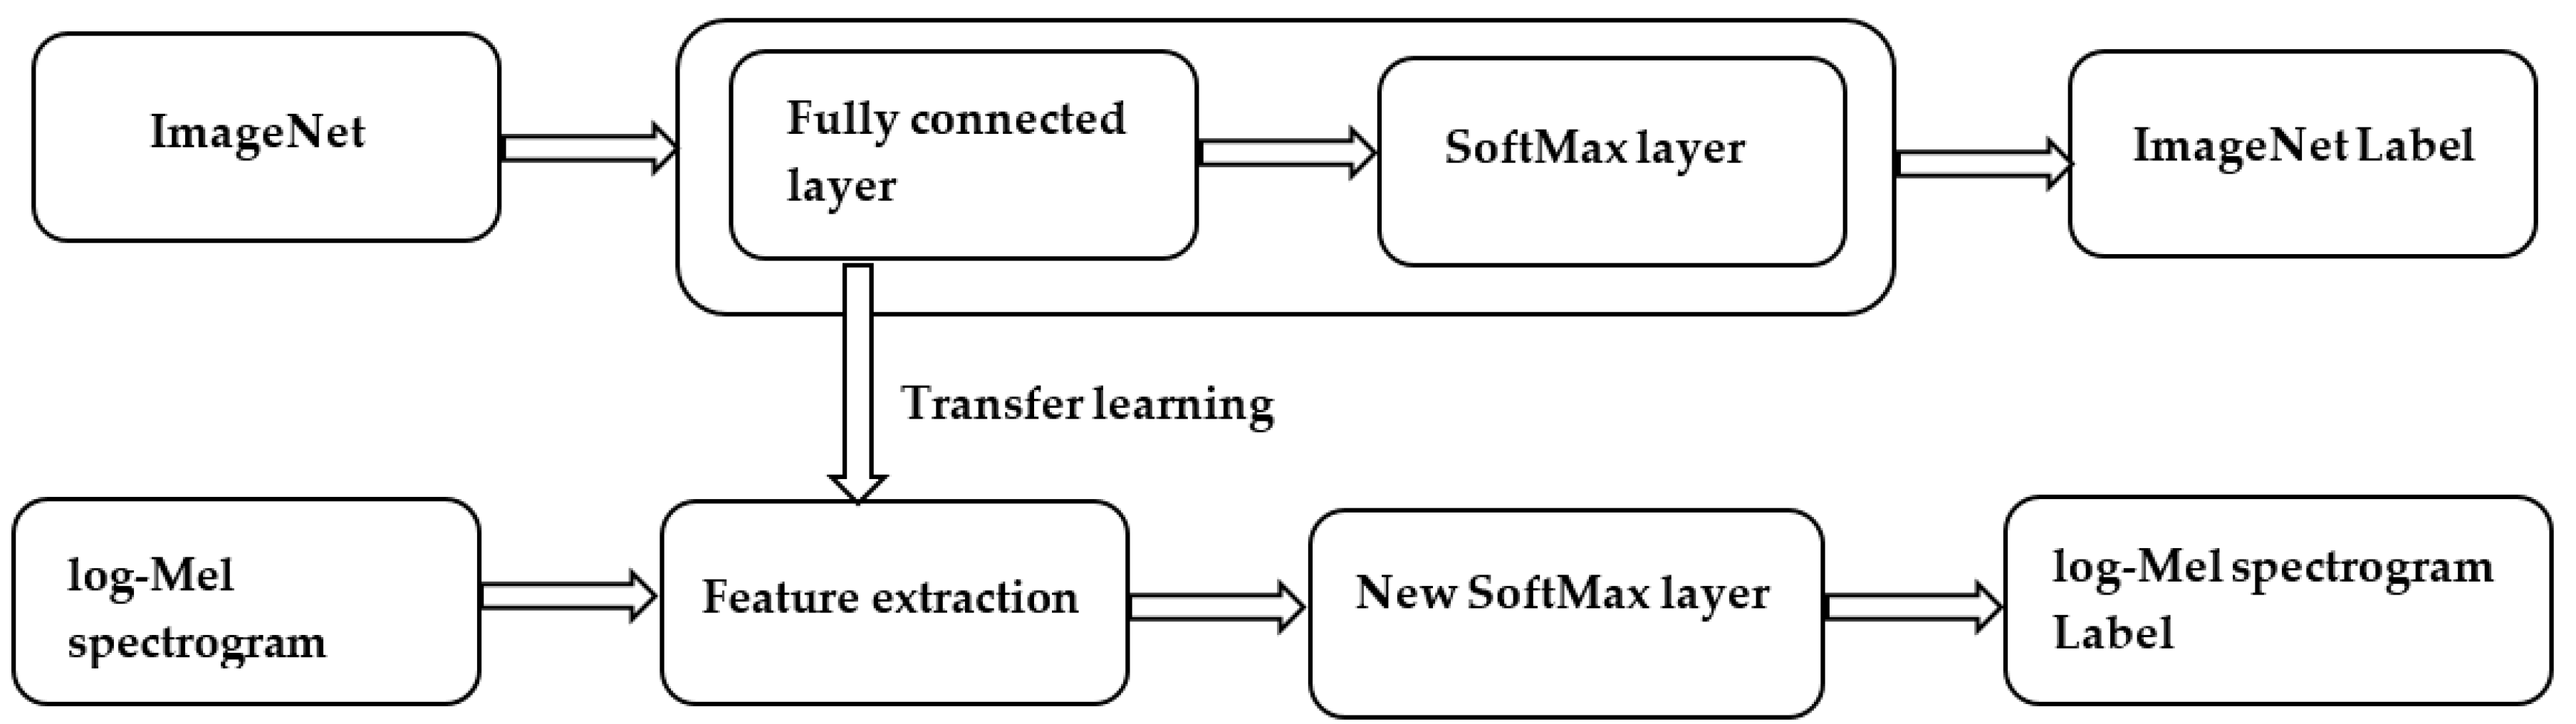
3.3. Transfer Learning
4. System Evaluation and Results
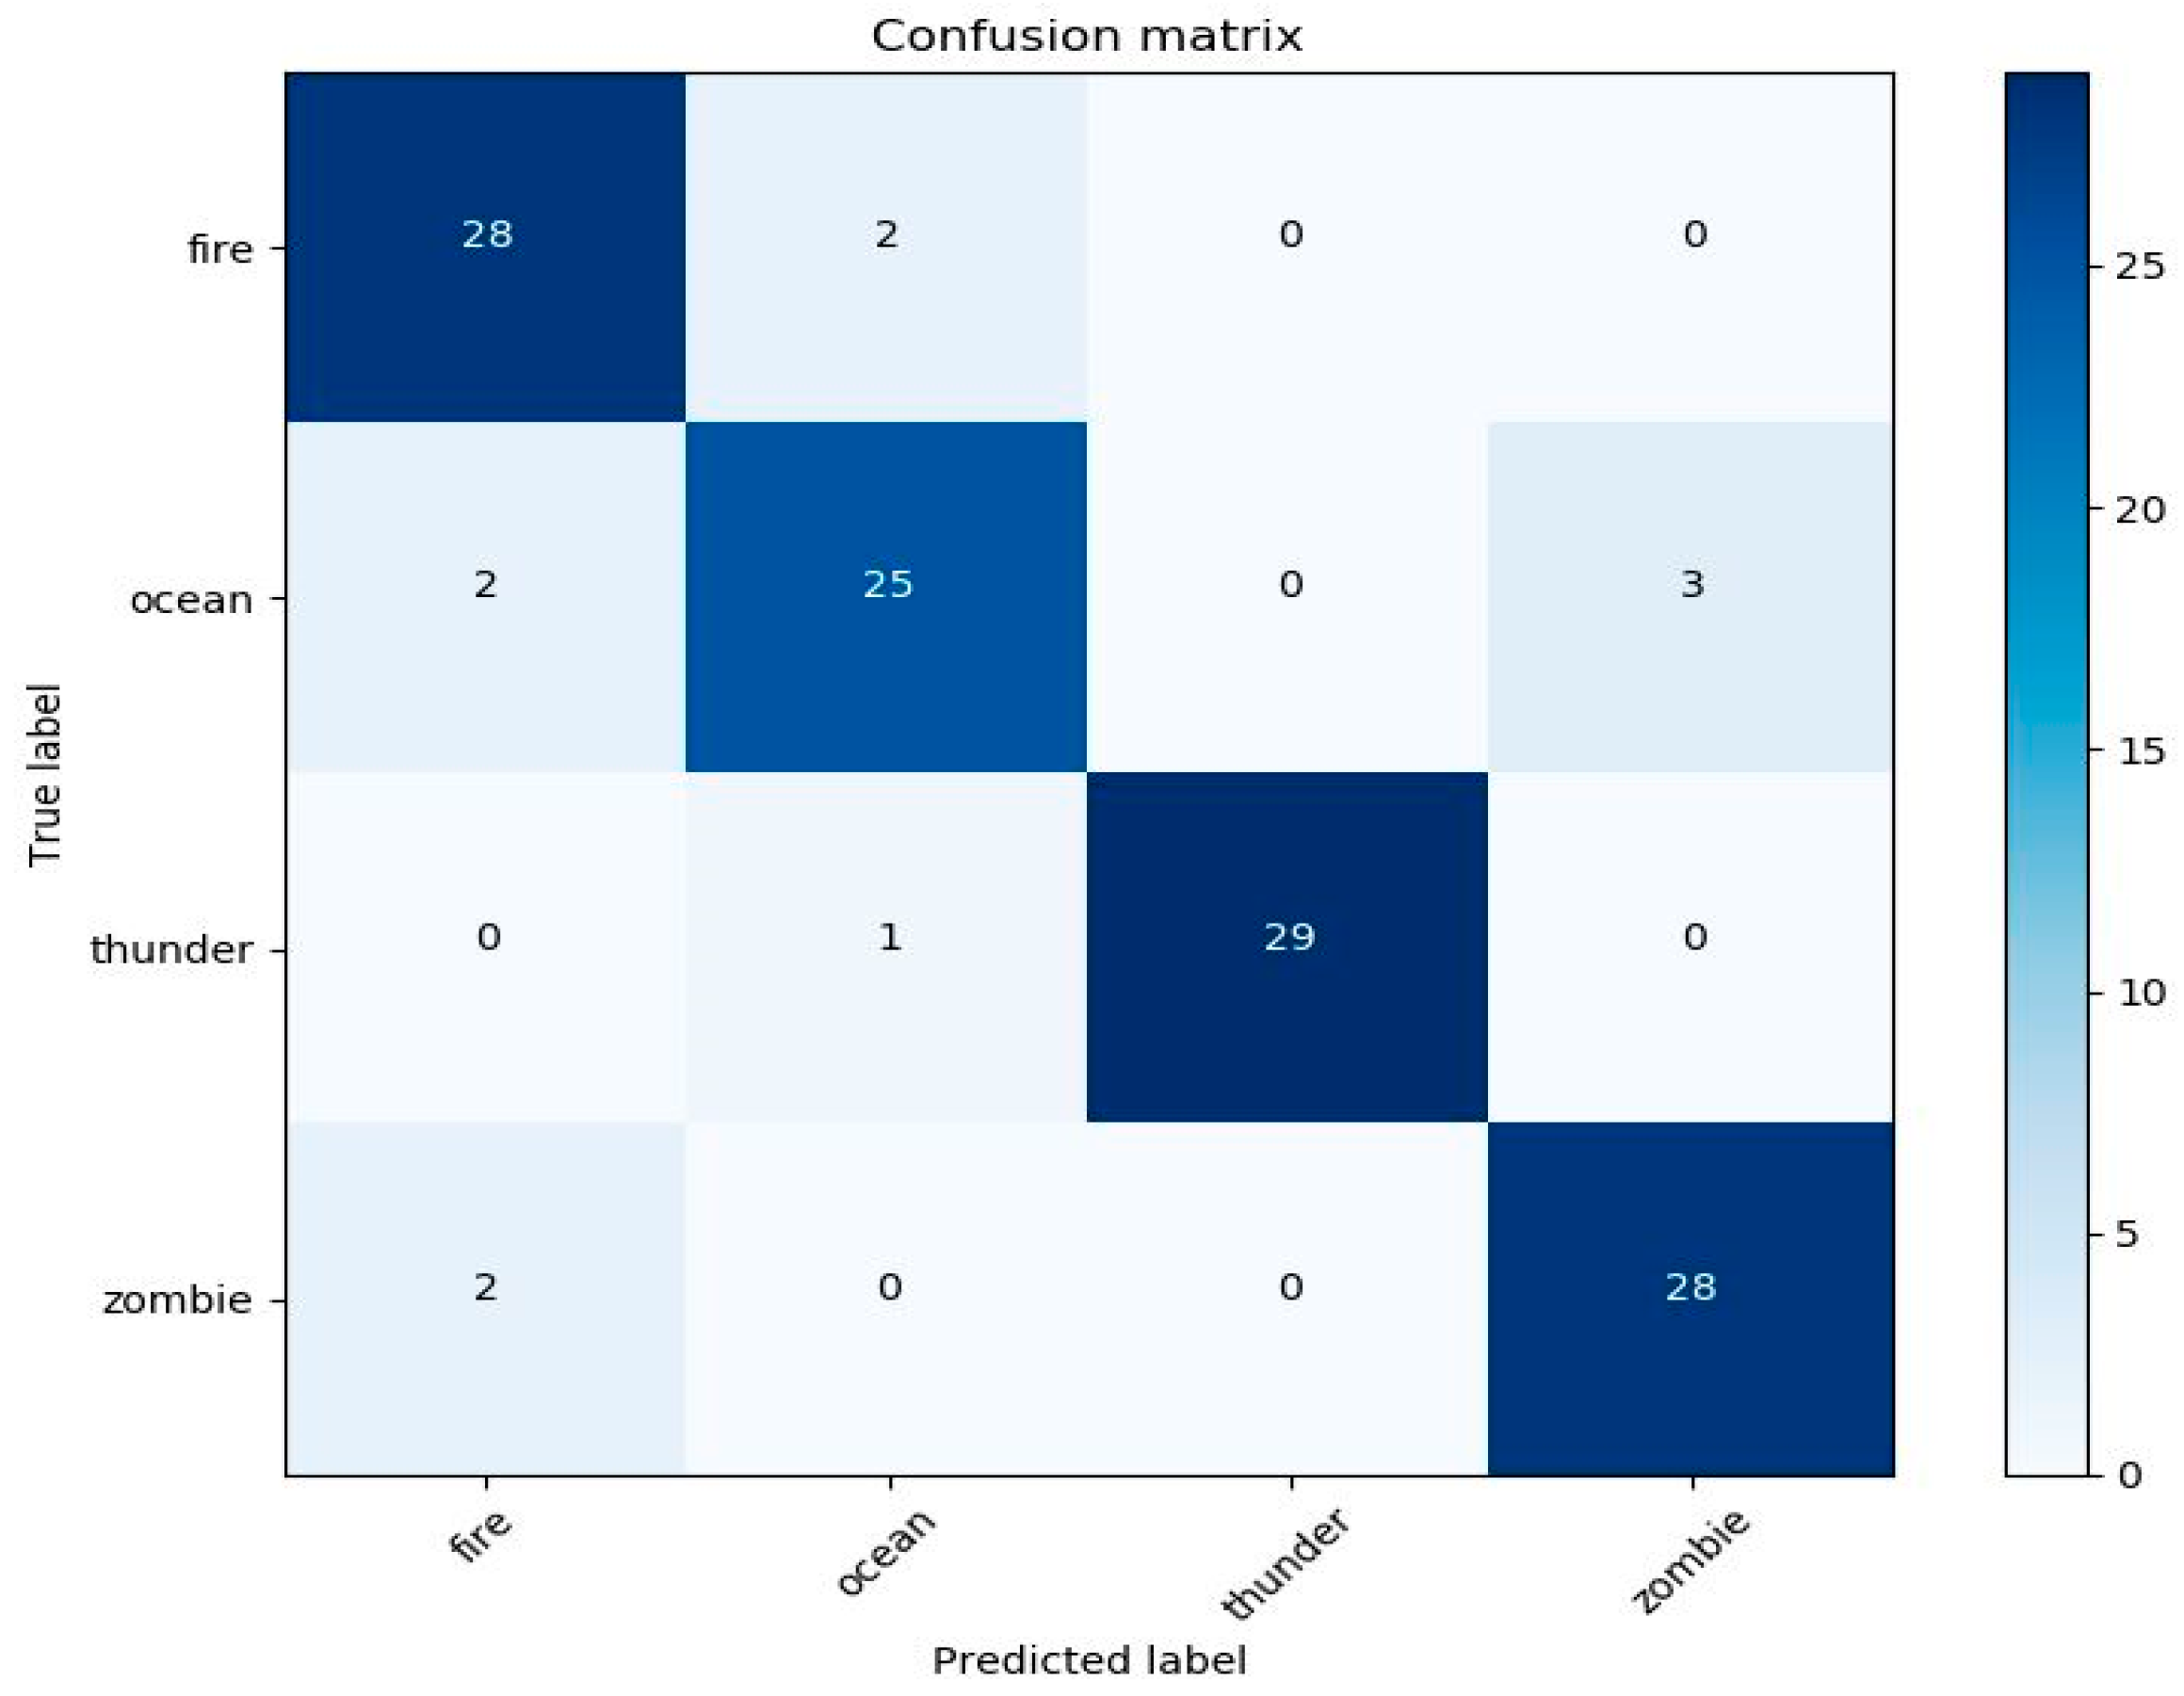
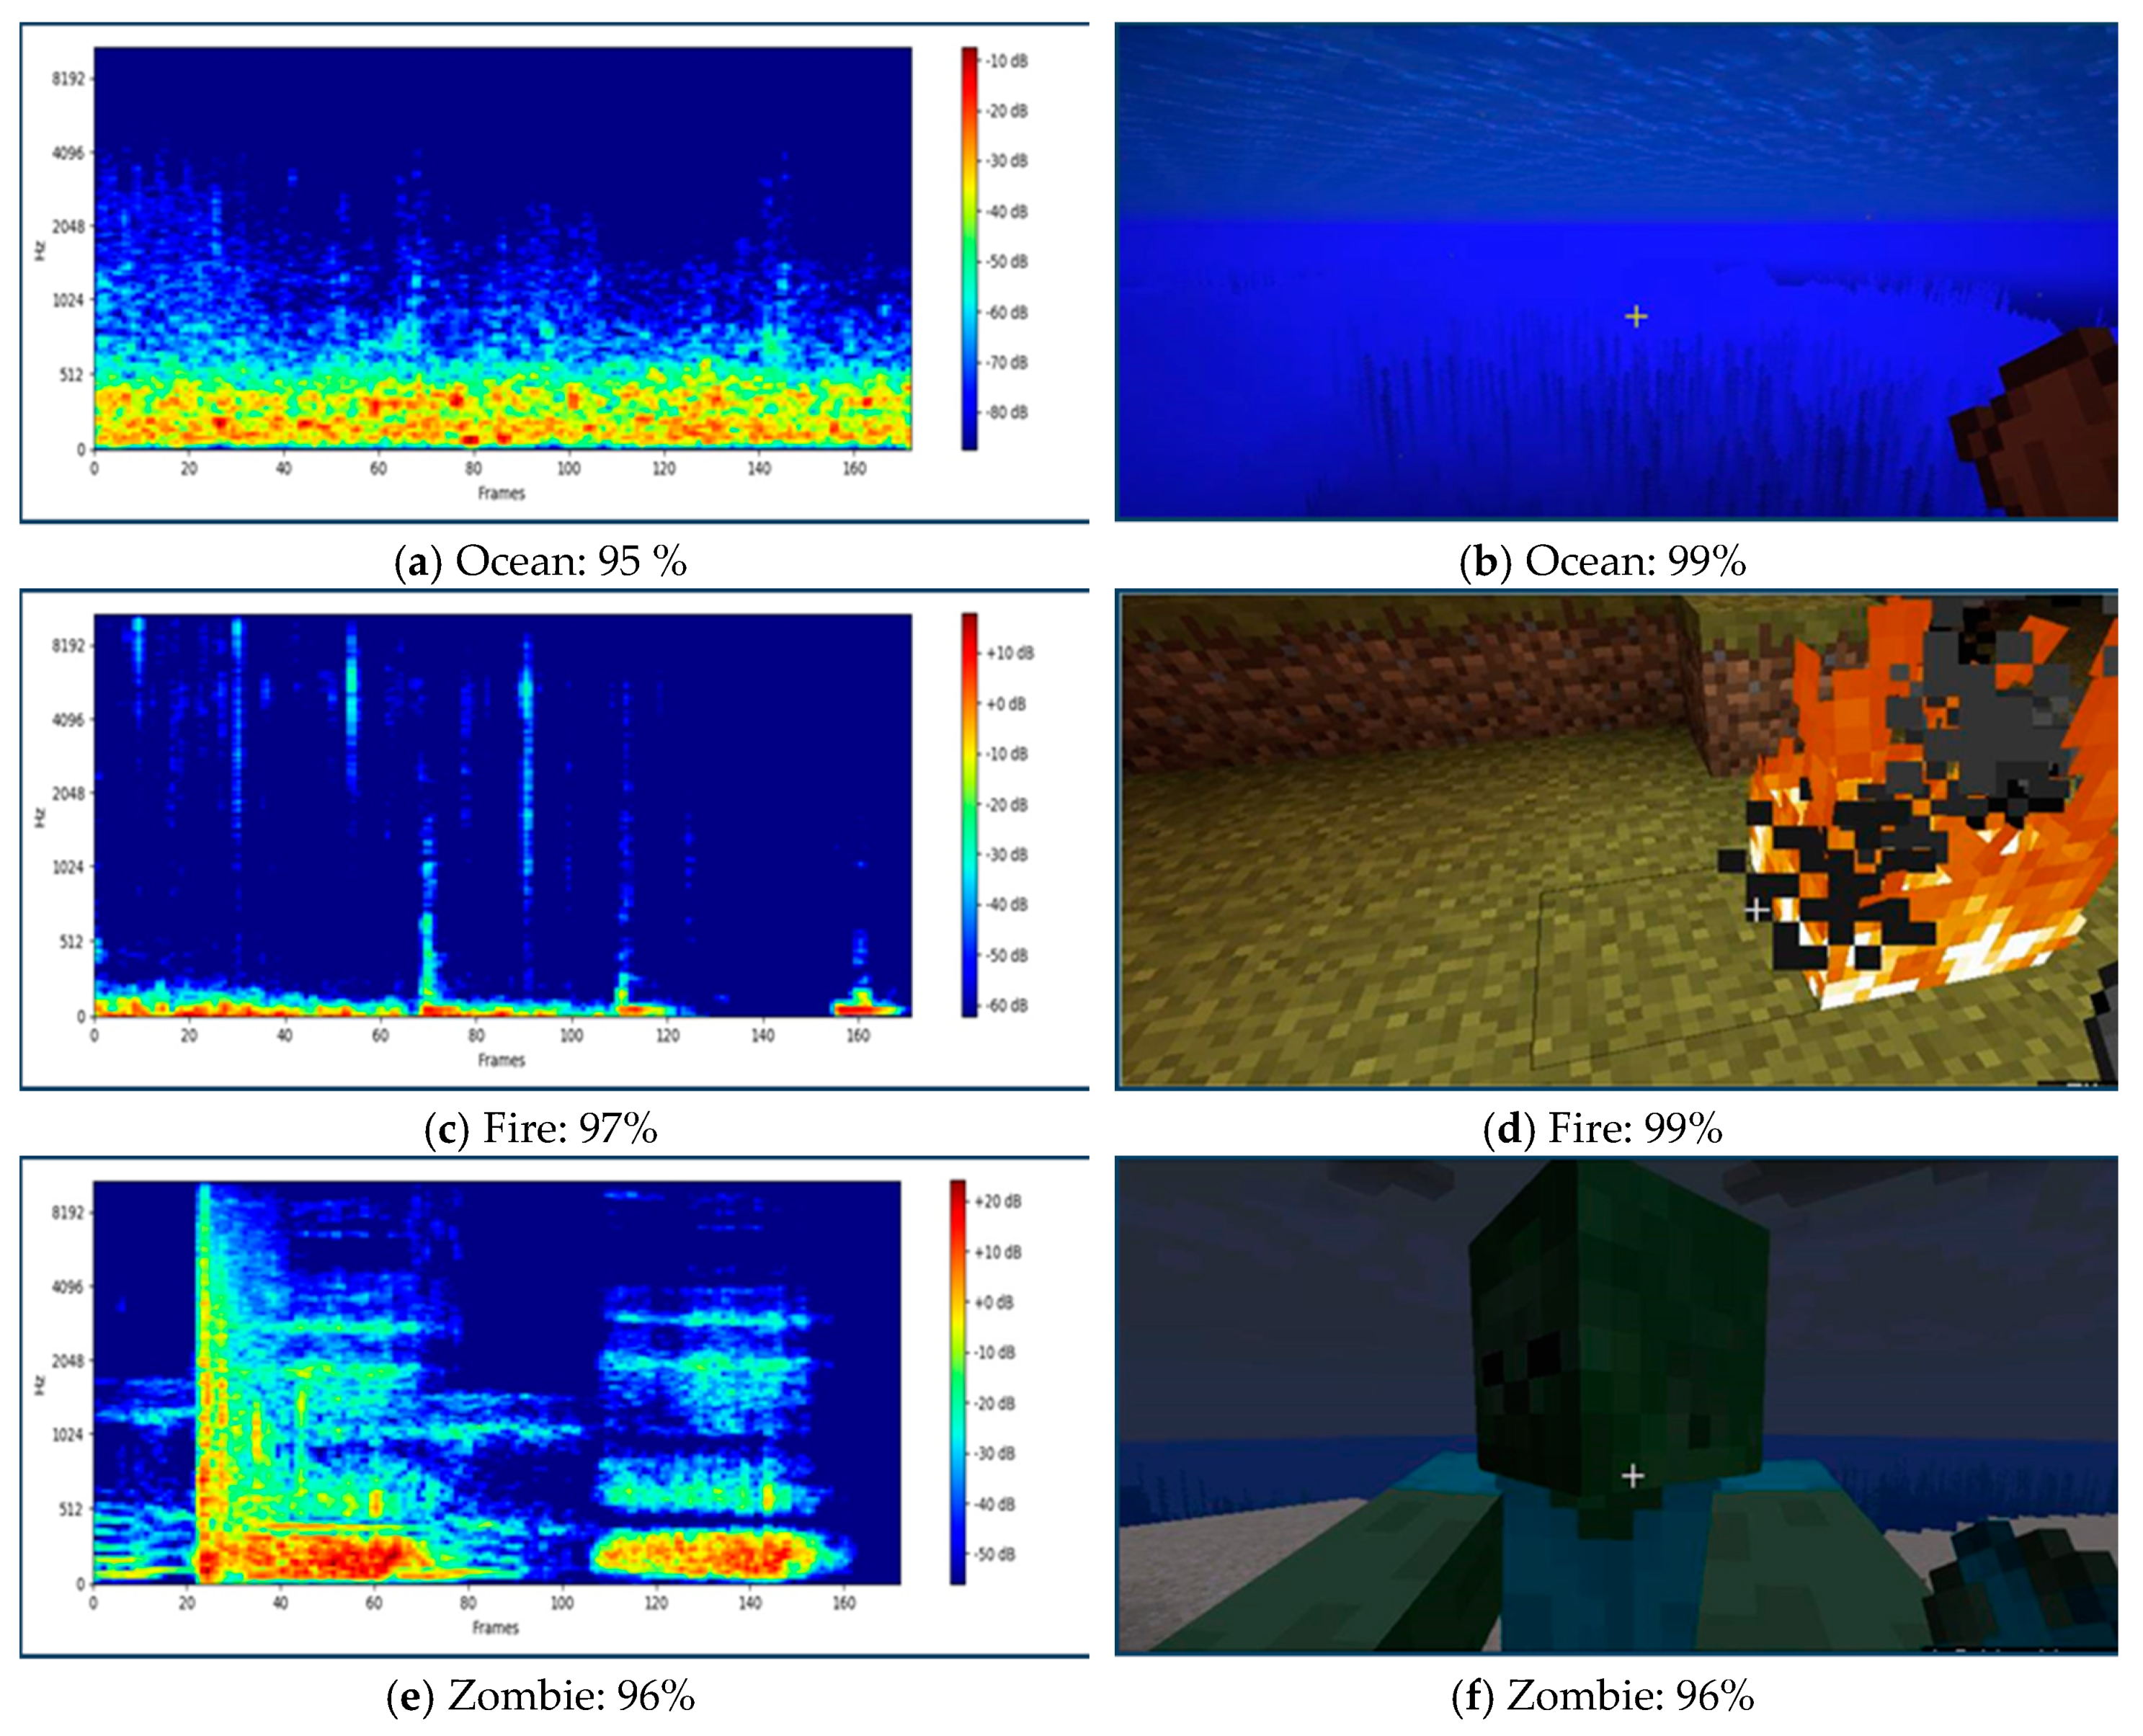
4.1. Performance Sound and Image Classifier in the Application
4.2. User Experience
5. Conclusions
Author Contributions
Funding
Conflicts of Interest
References
- Hashimoto, K.; Nakamoto, T. Tiny Olfactory Display Using Surface Acoustic Wave Device and Micropumps for Wearable Applications. IEEE Sens. J. 2016, 16, 4974–4980. [Google Scholar] [CrossRef]
- Hashimoto, K.; Nakamoto, T. Stabilization of SAW atomizer for a wearable olfactory display. In Proceedings of the 2015 IEEE International Ultrasonics Symposium (IUS), Taiwan, China, 21–24 October 2015; pp. 1–4. [Google Scholar]
- Steuer, J. Defining virtual reality: Dimensions determining telepresence. J. Commun. 1992, 42, 73. [Google Scholar] [CrossRef]
- Kadowaki, A.; Noguchi, D.; Sugimoto, S.; Bannai, Y.; Okada, K. Development of a High-Performance Olfactory Display and Measurement of Olfactory Characteristics for Pulse Ejections. In Proceedings of the 2010 10th IEEE/IPSJ International Symposium on Applications and the Internet, Seoul, Korea, 19–23 July 2010; pp. 1–6. [Google Scholar]
- Al Luhaybi, A.; Alqurashi, F.; Tsaramirsis, G.; Buhari, S.M. Automatic Association of Scents Based on Visual Content. Appl. Sci. 2019, 9, 1697. [Google Scholar] [CrossRef]
- Valenti, M.; Squartini, S.; Diment, A.; Parascandolo, G.; Virtanen, T. A convolutional neural network approach for acoustic scene classification. In Proceedings of the 2017 International Joint Conference on Neural Networks (IJCNN), Anchorage, AK, USA, 14–19 May 2017; pp. 1547–1554. [Google Scholar]
- Tokozume, Y.; Harada, T. Learning environmental sounds with end-to-end convolutional neural network. In Proceedings of the 2017 IEEE International Conference on Acoustics, Speech and Signal Processing (ICASSP), New Orleans, LA, USA, 5–9 March 2017; pp. 2721–2725. [Google Scholar]
- Aytar, Y.; Vondrick, C.; Torralba, A. Soundnet: Learning sound representations from unlabeled video. In Proceedings of the Advances in Neural Information Processing Systems, Barcelona, Spain, 5–10 December 2016; pp. 892–900. [Google Scholar]
- Dai, W.; Dai, C.; Qu, S.; Li, J.; Das, S. Very deep convolutional neural networks for raw waveforms. In Proceedings of the 2017 IEEE International Conference on Acoustics, Speech and Signal Processing (ICASSP), New Orleans, LA, USA, 5–9 March 2017; pp. 421–425. [Google Scholar]
- Salamon, J.; Bello, J.P. Deep Convolutional Neural Networks and Data Augmentation for Environmental Sound Classification. IEEE Signal Process. Lett. 2017, 24, 279–283. [Google Scholar] [CrossRef]
- Kumar, A.; Khadkevich, M.; Fügen, C. Knowledge Transfer from Weakly Labeled Audio Using Convolutional Neural Network for Sound Events and Scenes. In Proceedings of the 2018 IEEE International Conference on Acoustics, Speech and Signal Processing (ICASSP), Calgary, AB, Canada, 15–20 April 2018; pp. 326–330. [Google Scholar]
- Takahashi, N.; Gygli, M.; Gool, L.V. AENet: Learning Deep Audio Features for Video Analysis. IEEE Trans. Multimed. 2018, 20, 513–524. [Google Scholar] [CrossRef]
- Eghbal-zadeh, H.; Lehner, B.; Dorfer, M.; Widmer, G. A hybrid approach with multi-channel i-vectors and convolutional neural networks for acoustic scene classification. In Proceedings of the 2017 25th European Signal Processing Conference (EUSIPCO), Nairobi, Kenya, 28 August–2 September 2017; pp. 2749–2753. [Google Scholar]
- Zhang, Z.; Xu, S.; Cao, S.; Zhang, S. Deep Convolutional Neural Network with Mixup for Environmental Sound Classification. In Proceedings of the Pattern Recognition and Computer Vision, Guangzhou, China, 23–26 November 2018; pp. 356–367. [Google Scholar]
- ESC: Dataset for Environmental Sound Classification. Available online: https://dataverse.harvard.edu/dataset.xhtml?persistentId=doi:10.7910/DVN/YDEPUT (accessed on 9 November 2019).
- UrbanSound8k. Available online: https://urbansounddataset.weebly.com/urbansound8k.html (accessed on 9 November 2019).
- Murray, N.; Lee, B.; Qiao, Y.; Muntean, G.-M. Olfaction-Enhanced Multimedia: A Survey of Application Domains, Displays, and Research Challenges. ACM Comput. Surv. 2016, 48, 1–34. [Google Scholar] [CrossRef]
- Amores, J.; Maes, P. Essence: Olfactory Interfaces for Unconscious Influence of Mood and Cognitive Performance. In Proceedings of the 2017 CHI Conference on Human Factors in Computing Systems, Denver, CO, USA, 6–11 May 2017; pp. 28–34. [Google Scholar]
- Matsukura, H.; Yoneda, T.; Ishida, H. Smelling Screen: Development and Evaluation of an Olfactory Display System for Presenting a Virtual Odor Source. IEEE Trans. Vis. Comput. Graph. 2013, 19, 606–615. [Google Scholar] [CrossRef] [PubMed]
- Dobbelstein, D.; Herrdum, S.; Rukzio, E. inScent: A wearable olfactory display as an amplification for mobile notifications. In Proceedings of the 2017 ACM International Symposium on Wearable Computers, Maui, Hawaii, 11–15 September 2017; pp. 130–137. [Google Scholar]
- Covington, J.A.; Agbroko, S.O.; Tiele, A. Development of a Portable, Multichannel Olfactory Display Transducer. IEEE Sens. J. 2018, 18, 4969–4974. [Google Scholar] [CrossRef]
- Minecraft. Available online: https://minecraft.net/en-us/?ref=m (accessed on 6 April 2019).
- Librosa. Available online: https://librosa.github.io/librosa/ (accessed on 28 March 2019).
- Szegedy, C.; Vanhoucke, V.; Ioffe, S.; Shlens, J.; Wojna, Z. Rethinking the Inception Architecture for Computer Vision. In Proceedings of the 2016 IEEE Conference on Computer Vision and Pattern Recognition (CVPR), Las Vegas, NV, USA, 27–30 June 2016; pp. 2818–2826. [Google Scholar]
- Krizhevsky, A.; Sutskever, I.; Hinton, G.E. ImageNet Classification with Deep Convolutional Neural Networks. Commun. ACM 2017, 60, 84–90. [Google Scholar] [CrossRef]
- Simonyan, K.; Zisserman, A. Very Deep Convolutional Networks for Large-Scale Image Recognition. Available online: https://arxiv.org/abs/1409.1556 (accessed on 25 June 2019).
- ImageNet. Available online: http://www.image-net.org (accessed on 20 March 2019).
- TensorFlow. Available online: https://www.tensorflow.org/ (accessed on 9 March 2019).


| Category | Accuracy | Precision | Recall | F1 score |
|---|---|---|---|---|
| Fire | 0.95 | 0.8 | 0.9 | 0.8 |
| Ocean | 0.93 | 0.8 | 0.8 | 0.8 |
| Thunder | 0.99 | 1 | 0.9 | 0.9 |
| Zombie | 0.95 | 0.9 | 0.9 | 0.9 |
| Average | 0.95 | 0.8 | 0.8 | 0.8 |
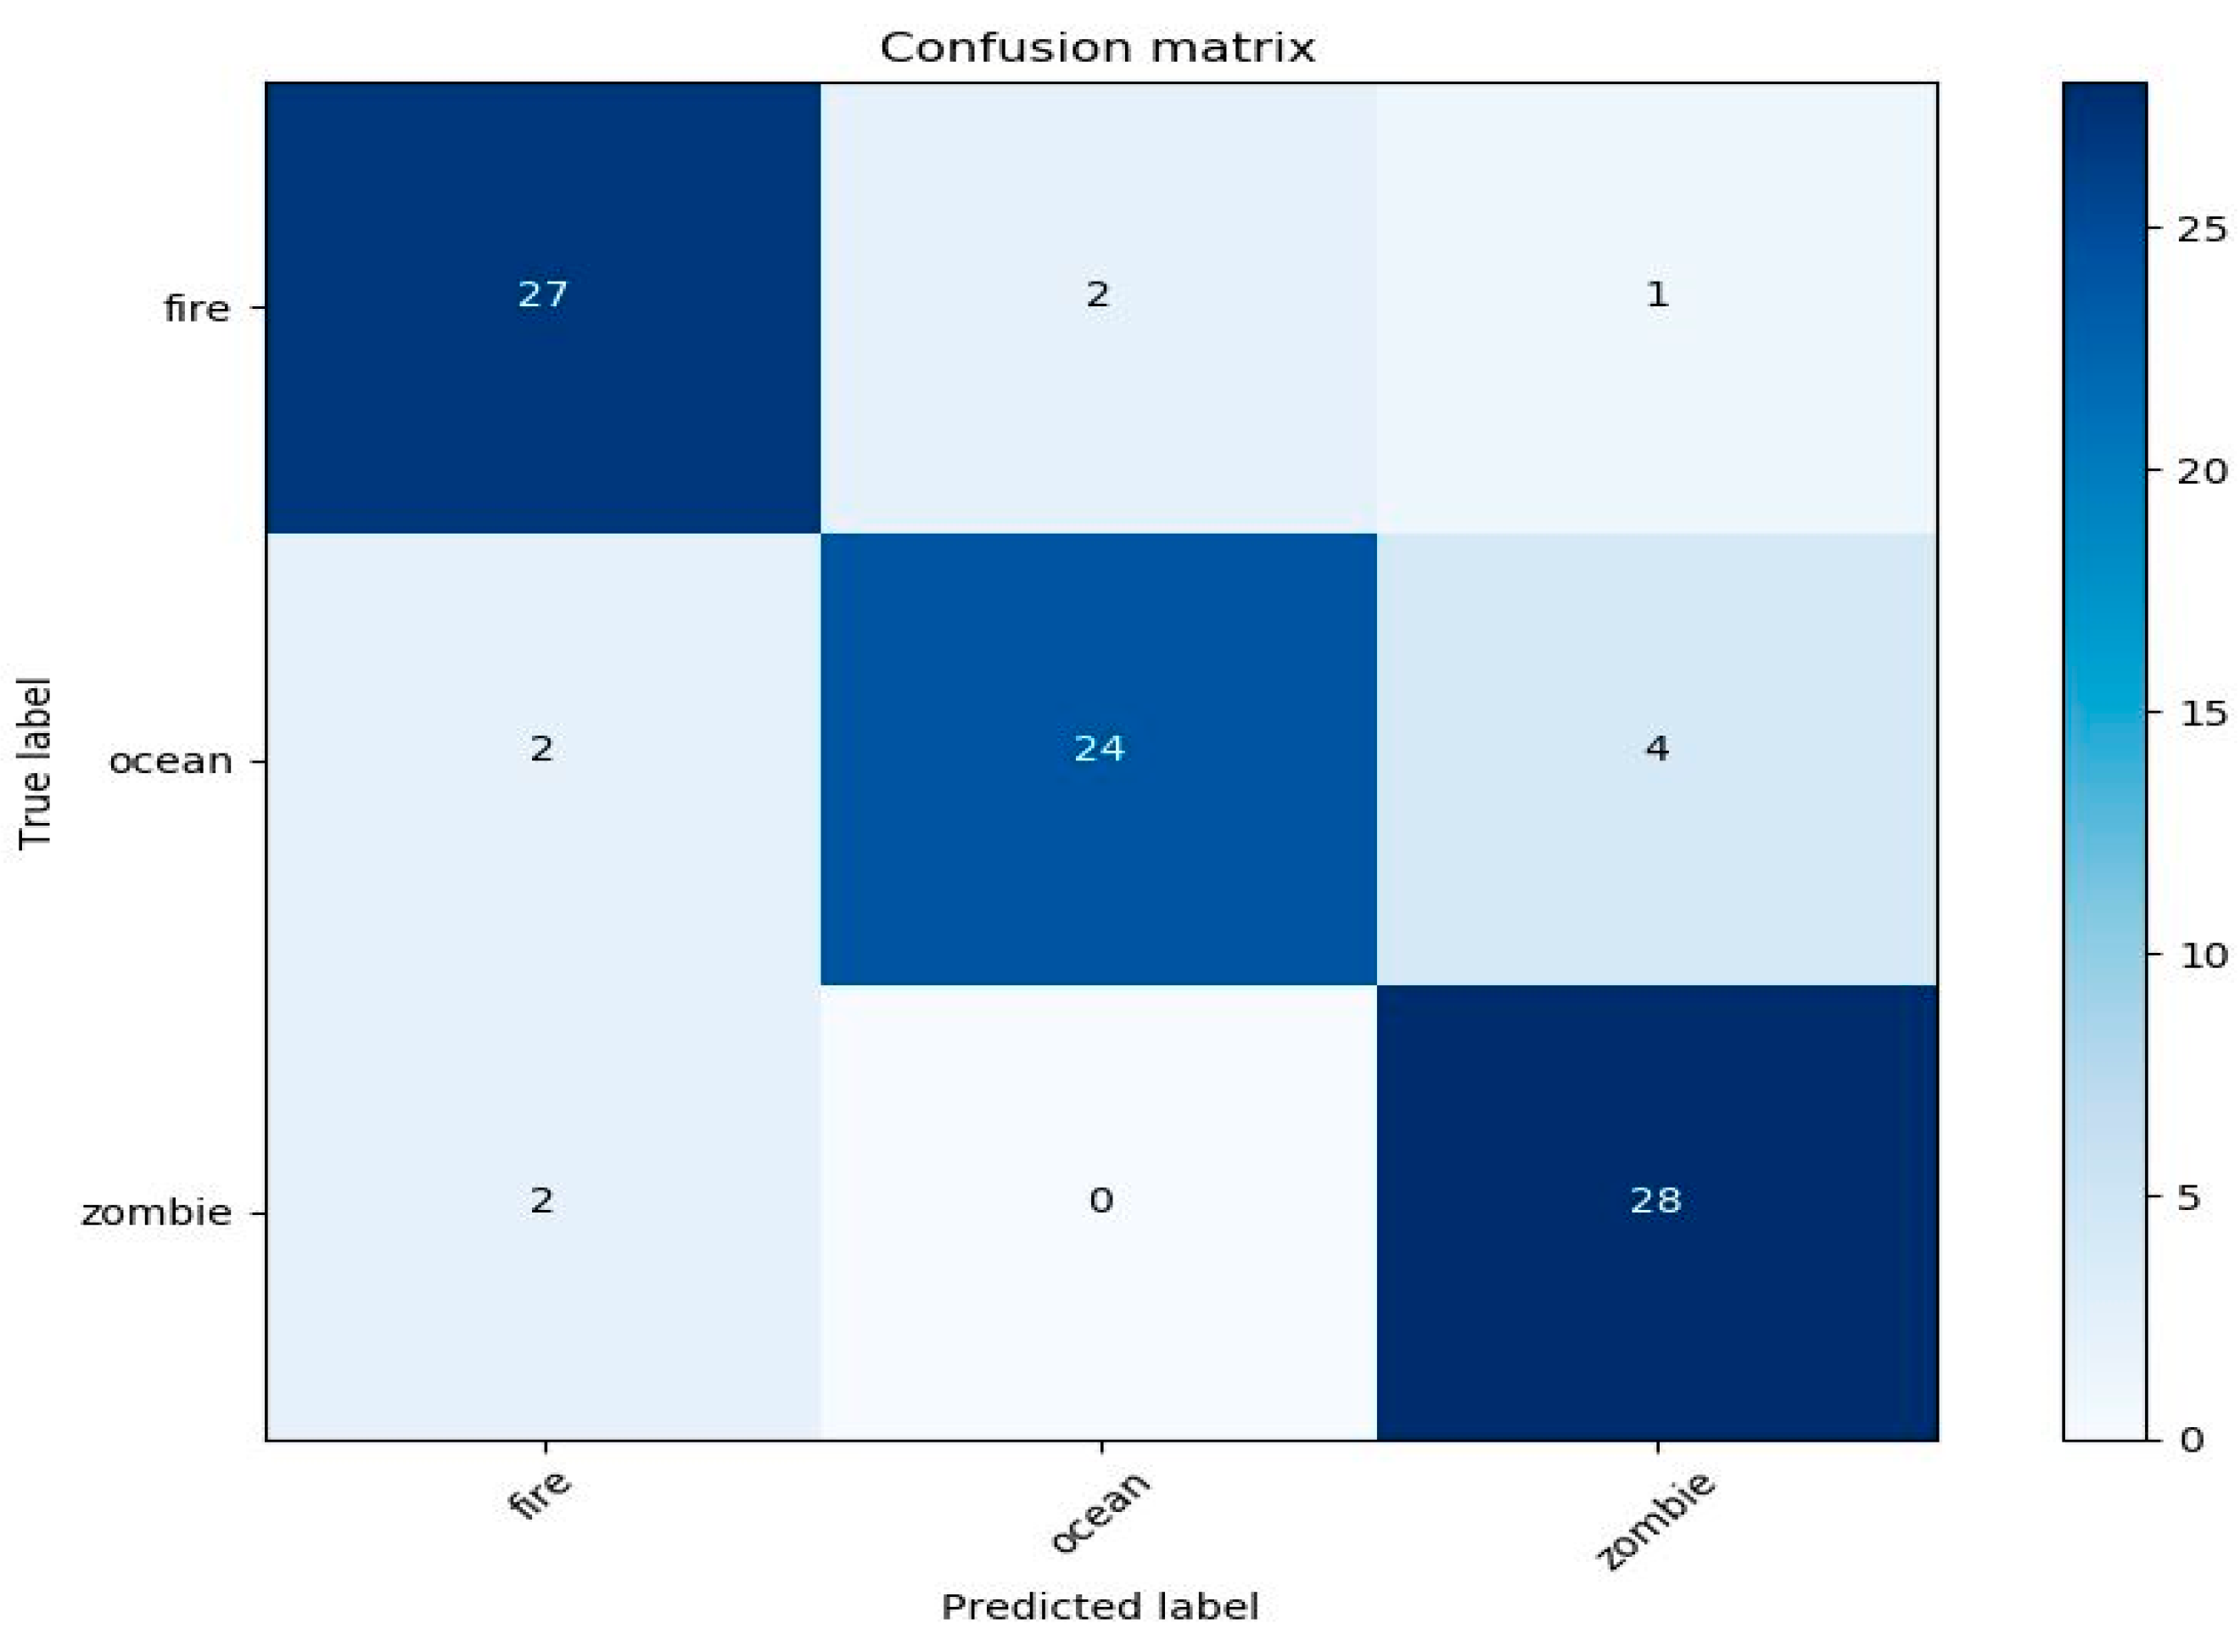
| Category | Accuracy | Precision | Recall | F1 score |
|---|---|---|---|---|
| Fire | 0.92 | 0.8 | 0.9 | 0.8 |
| Ocean | 0.91 | 0.9 | 0.8 | 0.8 |
| Zombie | 0.92 | 0.8 | 0.9 | 0.8 |
| Average | 0.91 | 0.8 | 0.8 | 0.8 |
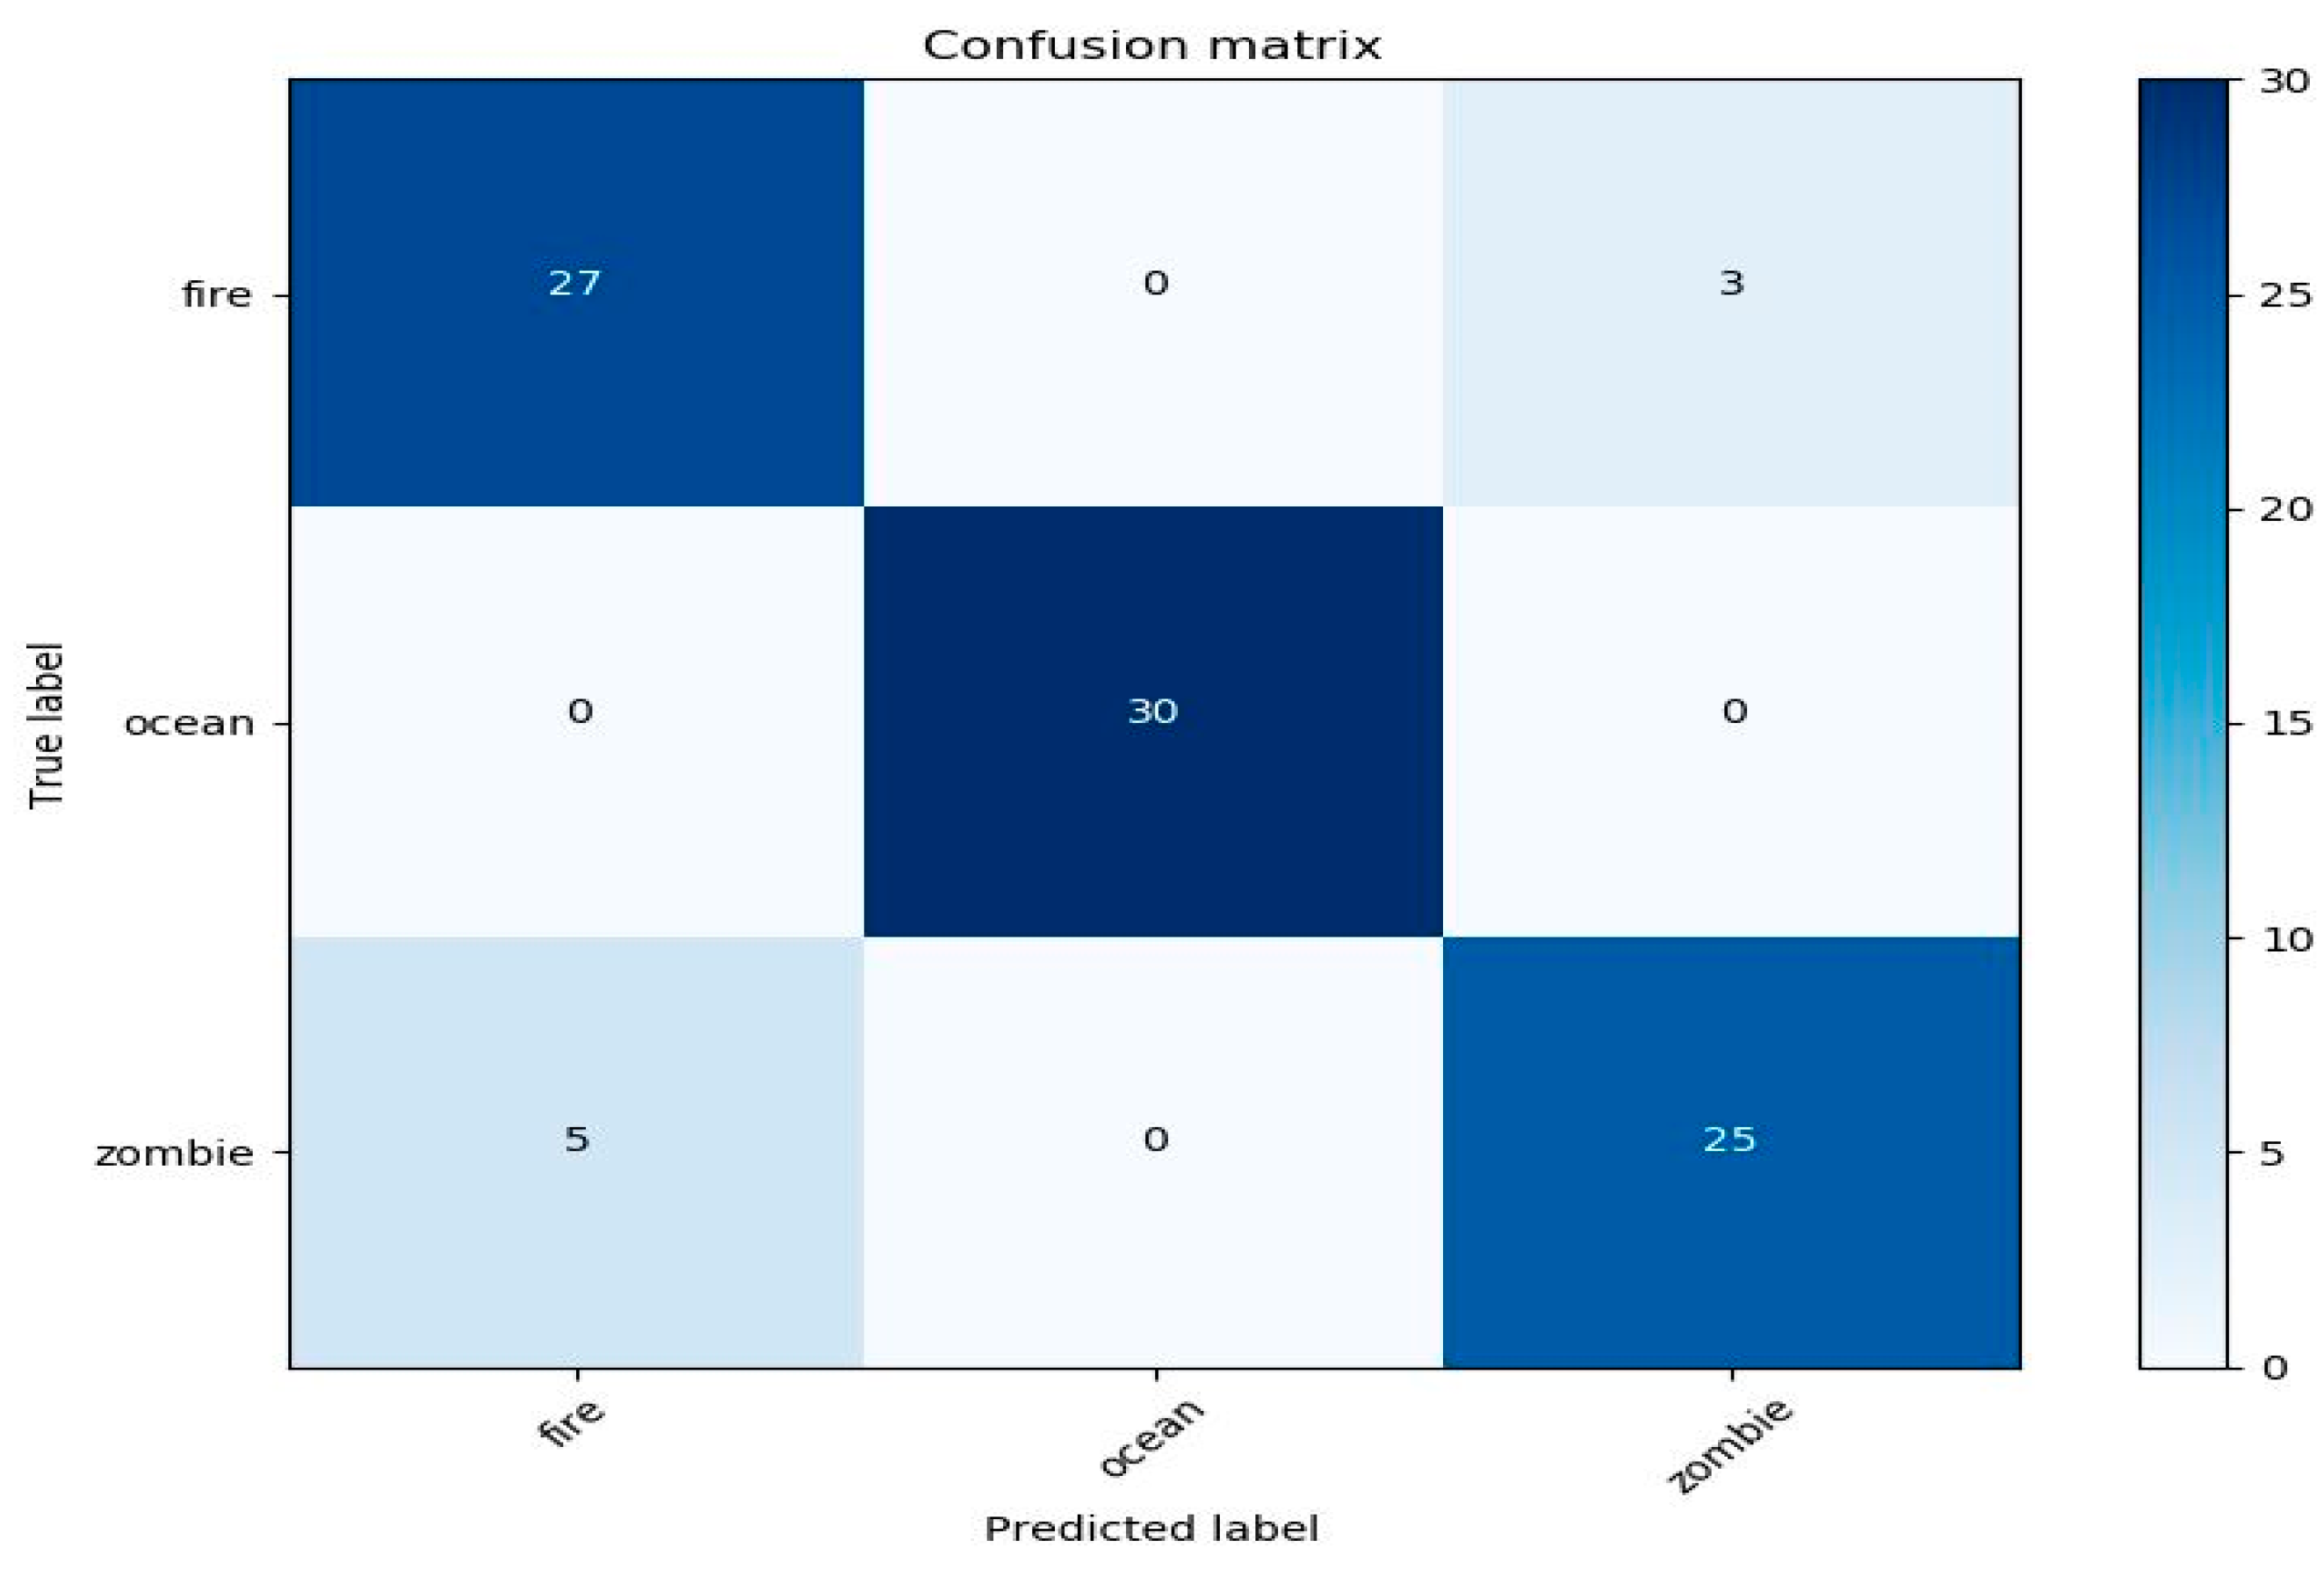
| Category | Accuracy | Precision | Recall | F1 score |
|---|---|---|---|---|
| Fire | 0.91 | 0.8 | 0.9 | 0.8 |
| Ocean | 1 | 1 | 1 | 1 |
| Zombie | 0.91 | 0.8 | 0.8 | 0.8 |
| Average | 0.94 | 0.8 | 0.9 | 0.8 |
© 2019 by the authors. Licensee MDPI, Basel, Switzerland. This article is an open access article distributed under the terms and conditions of the Creative Commons Attribution (CC BY) license (http://creativecommons.org/licenses/by/4.0/).
Share and Cite
Alraddadi, S.; Alqurashi, F.; Tsaramirsis, G.; Al Luhaybi, A.; M. Buhari, S. Aroma Release of Olfactory Displays Based on Audio-Visual Content. Appl. Sci. 2019, 9, 4866. https://doi.org/10.3390/app9224866
Alraddadi S, Alqurashi F, Tsaramirsis G, Al Luhaybi A, M. Buhari S. Aroma Release of Olfactory Displays Based on Audio-Visual Content. Applied Sciences. 2019; 9(22):4866. https://doi.org/10.3390/app9224866
Chicago/Turabian StyleAlraddadi, Safaa, Fahad Alqurashi, Georgios Tsaramirsis, Amany Al Luhaybi, and Seyed M. Buhari. 2019. "Aroma Release of Olfactory Displays Based on Audio-Visual Content" Applied Sciences 9, no. 22: 4866. https://doi.org/10.3390/app9224866
APA StyleAlraddadi, S., Alqurashi, F., Tsaramirsis, G., Al Luhaybi, A., & M. Buhari, S. (2019). Aroma Release of Olfactory Displays Based on Audio-Visual Content. Applied Sciences, 9(22), 4866. https://doi.org/10.3390/app9224866