Article

Validation of a Discrete Element Method (DEM) Model of the Grinding Media Dynamics within an Attritor Mill Using Positron Emission Particle Tracking (PEPT) Measurements

1
Johnson Matthey Technology Centre, P.O. Box 1, Belasis Avenue, Billingham, Cleveland TS23 1LB, UK
2
School of Chemical Engineering, University of Birmingham, Birmingham B15 2TT, UK
3
Johnson Matthey Technology Centre, Blount’s Court, Sonning Common RG4 9NH, UK
*
Author to whom correspondence should be addressed.
Appl. Sci. 2019, 9(22), 4816; https://doi.org/10.3390/app9224816
Submission received: 20 October 2019 / Revised: 6 November 2019 / Accepted: 8 November 2019 / Published: 11 November 2019

Abstract

:
Positron emission particle tracking (PEPT) was used to investigate the grinding media dynamics in a laboratory-scale attritor mill in the absence of powder. The grinding media motion was analysed as a function of the equipment’s typical operating parameters: impeller speed, impeller clearance and bead fill level. It was observed that the impeller speed had the strongest influence on the media motion. An increase of the impeller speed from 300 rpm to 600 rpm led to a change in the bead recirculation patterns with the increasing formation of well segregated upper and lower recirculation loops that fully developed at the maximum speed of 600 rpm. For a constant impeller speed, an increase of the bead loading did not majorly affect the bead velocity as remarked by minor changes on the flow field. For all the impeller clearance values, the occupancy plots revealed an inefficient dead region at the bottom of the attritor where the beads were moving at very low velocity. In this region the beads were tightly packed under their own weight and, furthermore, there was an absence of direct contact with the impeller arms. The depth of this region increased proportionally to the distance between the bottom of the impeller and the vessel base indicating that a minimum value of clearance should be set to optimise the lower recirculation pattern. For two experimental conditions, the data generated by PEPT measurements were utilised to set-up a friction-adjusted discrete element method (DEM) model. Here, the simulation results were qualitatively and quantitatively compared against the PEPT data by assessing the averaged velocity flow fields and the average velocity profiles at different radial locations inside the vessel. Given the intrinsic uncertainty of the PEPT measurements, the DEM model results were in considerably good agreement with the experimental results. The major discrepancy was observed close to the vessel wall where the simulations overpredicted the velocity by about 10%.

Graphical Abstract

1. Introduction

Stirred media mills are widely utilised in fine and ultra-fine grinding because of their high stress energy and stress frequency which result from the improved energy efficiency compared to conventional ball mills [1,2,3,4]. The evaluation of the stress frequency and the stress energy requires information about the grinding media velocity and the grinding media motion inside the mill. The observation and consequent quantification of the media motion, inside industrial mills, can be difficult either because the system is opaque or is destructive for intrusive instrumentation. Often, the particle flow is observed for small laboratory scale mills through qualitative visual inspection of the equipment, which must have transparent walls, and it is limited to media that are visible [5,6,7]. Unfortunately, for complex 3D flow fields this methodology may lead to an incomplete or inaccurate description of the system due to the limited access of information away from the visible accessible walls. Positron emission particle tracking (PEPT) can be utilised to overcome these limitations providing a full quantitative assessment of the flow inside opaque systems without interfering with the process [8]. This technique has been extensively applied to investigate the effect of operating parameters on the media motion for wet milling in both tumbling mills and vertical stirred mills [6,9,10,11]. For wet milling applications, an important contribution is represented by the work of Conway-Baker et al. (2002) [9]. They used PEPT to investigate the grinding media motion within a vertical stirred mill as a function of the impeller speed and the impeller type as well as to evaluate the differences compared to the classical fluid mixing theories. As result of this study, three distinct regions, each one with a different type of motion, were observed inside the mill and ultimately related to some specific forms of breakage mechanisms. Similarly, Yang et al. (2017) investigated by means of PEPT the effect of impeller tip speed (from 5.23 to 9.81 m/s), solid concentration (between 65wt% and 75wt%) and three different impeller designs on the size reduction efficiency for a vertical stirred mill [12]. Based on particle size measurements (D80) and specific energy (kWh/t) data, it was shown that the minimum impeller speed of 5.23 m/s, the lowest solid concentration of 65wt% and the pitched flat blade impeller ensured the best size reduction results. This study also highlighted the importance of understanding the complex energy transfer inside the grinding chamber because high grinding media velocities will not necessarily result in better size reductions if most of the energy is dissipated as heat.
As alternative to PEPT experiments, the discrete element method (DEM) can be utilised for the mechanistic description of the grinding media motion. This modelling tool can be extremely useful to improve the understanding of milling processes where either the experimental limitations or the complexity of the system hinders the ability to get valuable insights. In the last decades, the number of publications using DEM simulations to address granular engineering problems, such as granular flow [13], powder mixing [14,15,16], powder mechanics [17] and milling [18,19,20,21,22,23], has vastly increased. Although the DEM approach to milling still has limitations due to the computational costs of modelling the small particle size of the feed material, the simulations have been useful to drive the mill optimisation as function of operating conditions, to predict the effect of the mill design on the media motion and to support the transition from the lab scale to the industrial scale [24,25,26,27,28,29].
The validation of the DEM model is a necessary step to use the simulations not only as a cost- and time-saving tool for the design of experiments, but also to the quantity of the grinding media motion and its energetics. In this context, PEPT measurements can be used to generate experimental data for the validation of the numerical simulations. Jayasundara et al. (2011) validated the results of a CFD-DEM model of the Isa mill against PEPT measurements [30]. The work showed a reasonably good agreement between the two techniques and it also highlighted some discrepancies which were attributed to the differences between the experimental set-up and the DEM model such as the lower sampling rate of PEPT compared to the simulations. A very interesting study has been conducted by Govender et al. (2013) [6], where the authors validated the predictions of a dry DEM model by statistical comparison with the PEPT measurements carried out in a wet tumbling mill. This work demonstrated the effectiveness of an adjusted-friction DEM model to accurately reproduce the motion of the solid charge, without the explicit representation of either the powder particles or the fluid phase.
In the current work, PEPT experiments and DEM simulations are combined to improve the understanding of dry milling. PEPT experiments are used to investigate the motion of the grinding media inside a laboratory-scale vertical stirred mill (Union Process HD01) as a function of the impeller rotational speed, impeller clearance and bead fill level. As the ultimate aim is to match the experimental results to DEM simulations, the experiments were conducted by using only the grinding media ignoring the effect of the powder on the media motion. Consequently, in the absence of powder the set of data generated by PEPT can be directly compared to the results of the DEM simulations. In fine and ultra-fine grinding the characteristic particle size of a powder is too fine to be modelled by DEM simulations in a reasonable computational time [3,22,26]. However, the effect of the powder on the grinding media motion can be taken into account without modelling the particles. According to several studies, good model predictions can be obtained either by adjusting the DEM input parameters (friction and rolling coefficients, coefficient of restitution) or by scaling-up the size of the powder particles [25,31,32,33,34].
To validate the DEM simulations, for a chosen set of experimental conditions the grinding media static friction coefficient used in the DEM model is adjusted to match the velocity distribution generated by PEPT. Once the optimal static friction coefficient is determined, the velocity fields generated by DEM simulations and PEPT measurements are compared both qualitatively and quantitatively. The resulting validated model will be utilised in future work to link the milling conditions of dry milling to the final material properties.

2. Material and Methods

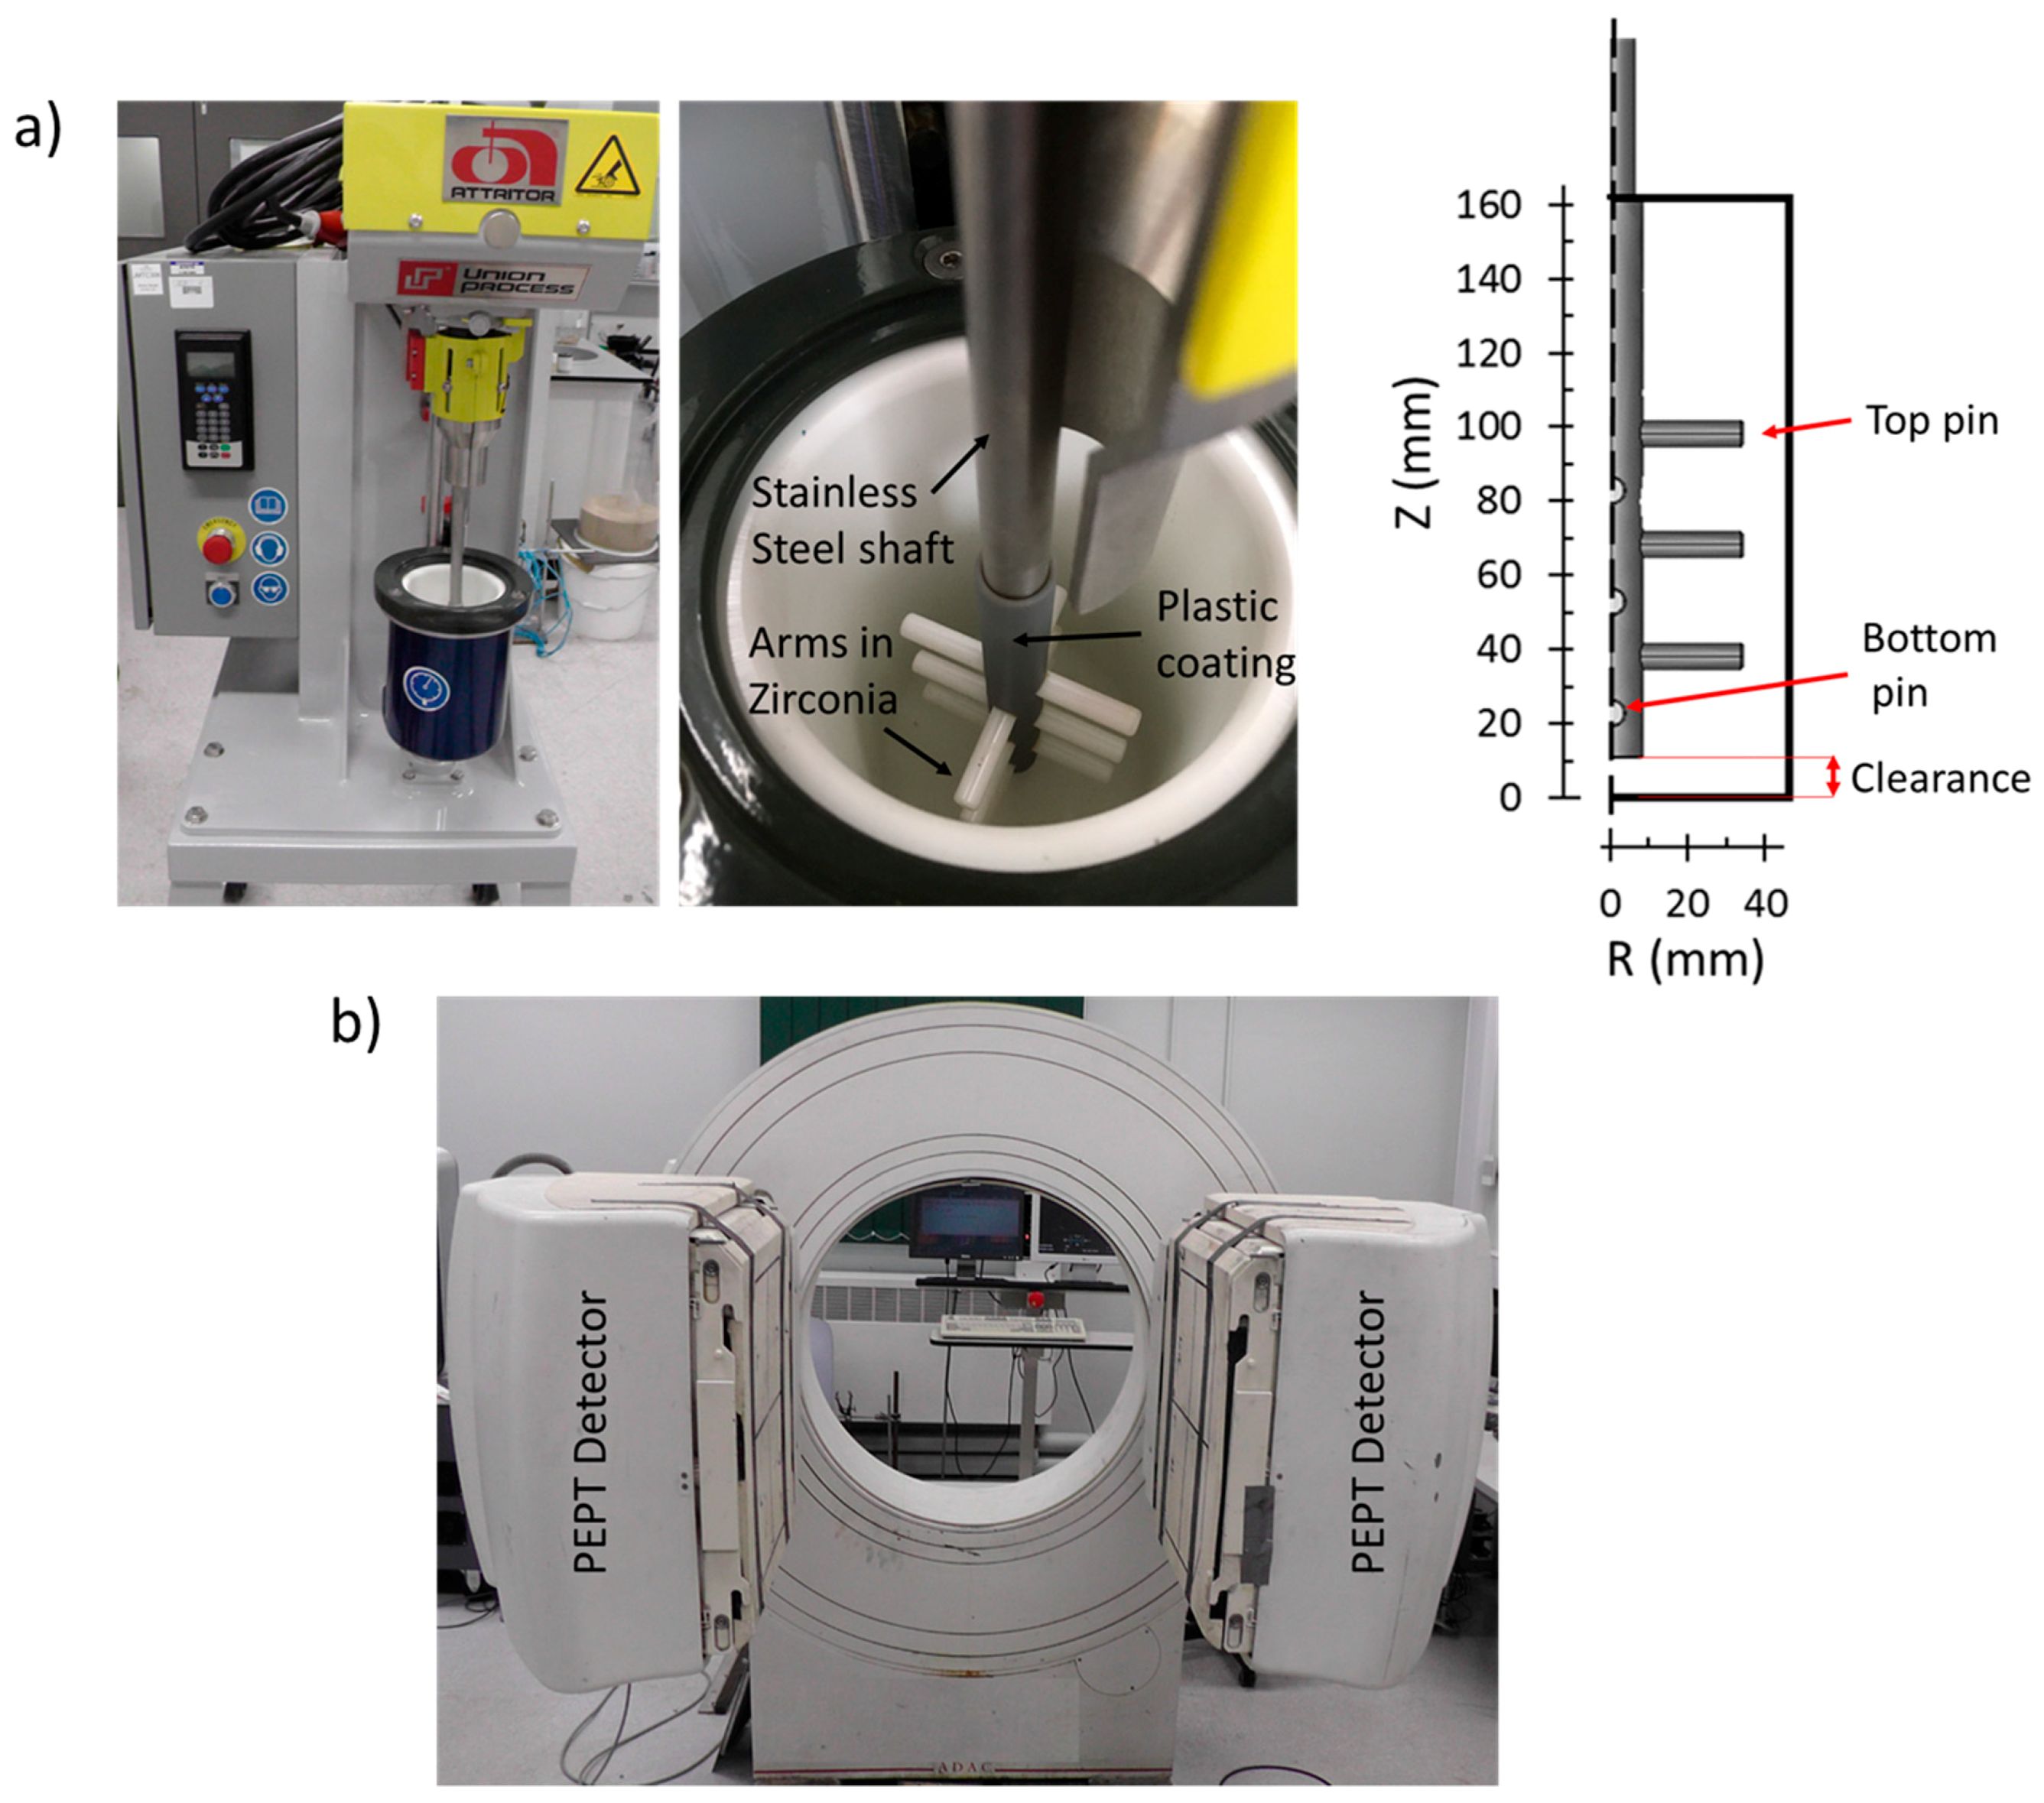
2.1. Experimental Setup: Attritor Mill HD01 and Positron Emission Particle Tracking (PEPT)

The experimental rig consisted of the laboratory-scale attritor mill HD01 (Union Process, Akron, OH, USA) and the positron emission particle tracking (PEPT) scanner showed in Figure 1a,b. The mill vessel was made of yttria-stabilised zirconia and its capacity was of 1.4 L with a diameter of 90 mm and a height of 164 mm. The impeller shaft was made of stainless steel with a plastic coating which acted as sacrificial layer, whereas the impeller arms were made of yttria-stabilised zirconia with a span of 66 mm. The grinding media used for all the experiments were 5 mm yttria-stabilised zirconia beads with a density of 5950 kg/m3. Information on the mill dimensions and grinding media are summarised in Table 1. During the experiments, the temperature inside the mill was controlled by circulating water at a constant temperature of 10 °C through a cooling jacket.
The operating parameters investigated in this study were: the impeller speed (300 rpm, 450 rpm and 600 rpm; the last being the maximum operating speed of the mill), the bead loading (2.4 kg, 2.7 kg and 3.0 kg) and the bottom clearance (12.7 mm or 1/2 inch, 15.9 mm or 5/8 inch and 19 mm or 3/4 inch where the first and last are the limiting values for the mill used). PEPT measurements should be carried out for a theoretically infinite time [6] to ensure ergodicity of the data and reliable statistical quantification of the three-dimensional flow. However, PEPT experiments are costly and they rely on the radioactive decay of a tracer bead of relatively short half-life which, over time, decreases in activity. Consequently, the experiments were designed to reduce the number and the duration of the tests. The acquisition time of the PEPT measurements was limited to 45 min for the tests at an impeller speed of 300 rpm and it was varied for the tests that used different speed values to maintain constant the number of impeller rotations (approximately 13,500). The full list of the experiments is reported in Table 2. For sake of brevity this paper will discuss in detail the results of the experiments number 4, 5, 6, 9, 10 and 11.

2.2. Positron Emission Particle Tracking (PEPT)

Positron emission particle tracking (University of Birmingham, Birmingham, UK) is a non-intrusive technique that can be used to track the location of a radioactively-labelled particle moving inside a bulk of material in process equipment. The particle used as tracer must have the same physical characteristics (e.g. density, size, shape, roughness) as the other particles in the bulk in order to be representative of the granular material dynamics and, therefore, guarantee the fidelity of the PEPT data [35]. The technique relies on the beta decay of a tracer particle resulting in the emission of positrons. The subsequent annihilation of each positron with an electron will release energy in the form of two gamma rays back-to back at 180°, measured by the pair of PEPT detectors showed in Figure 1 For more details on the technique the reader is referred to [8,36,37,38]. The accuracy of the PEPT measurements is system dependent with the main source of errors arising from: the velocity of the tracer particle (tracers moving fast may have moved a significant distance during the acquisition window), the tracer activity (tracer activity decreases over time leading to a decrease of the number of detections per time) and the thickness of material standing between the tracer and the detectors (the intensity of the gamma-rays is attenuated or scattered) [36,37,39]. In this work, the maximum tracer velocity was always below 2.1 m/s and tracers with high activity were used in the experiments to guarantee a high rate of data acquisition. A 5 mm yttria-stabilised zirconia media ball was used as tracer particle, labelled by direct activation using the MC40 Cyclotron (University of Birmingham, Birmingham, UK) by means of a 33 MeV 3He beam. Fluorine-18 was used as radioisotope with a half-life of 109 min.

Data Processing: Tracer Location Reconstruction

Just a few events (photon pairs) are in theory necessary to locate the tracer particle position, but not all the gamma rays detected give a valid tracer location, as a proportion will be electron scattered during passage through the granular material under investigation and the material of the equipment (container walls, impeller shaft, impeller arms). These scattered gamma rays are so called “corrupted events” and are discarded to leave predominantly “valid events” by means of an iterative algorithm developed at Positron Imaging Centre of the University of Birmingham (UK). In determining the tracer location, the algorithm takes a fixed number of consecutive photon pairs, each represented by a line-of-response (LOR), which describes the apparent paths of the two photons from the annihilation event. The centroid of this cluster of lines is determined and those lines furthest away are removed and the centroid recalculated. The procedure is repeated iteratively until a fraction, f, of the initial number of events remains; the tracer location is taken as the centroid of the remaining lines, time-stamped with the average time of these lines. The number of events per slice and the fraction of event f are the two inputs of the algorithm; these are not known a priori, and optimum values will depend on the tracer velocity, the amount of scattering material present and the tracer activity [36]. These two parameters should not be arbitrarily selected because they are inversely proportional to the accuracy of the tracer location for a fixed spatial resolution of the camera [37]. In the current work optimum values were obtained by minimisation of the location error as proposed by [40]. According to this method, a number of events per slice equal to 100 and a fraction of events equal to 0.2 was determined and then used to process the entire set of PEPT data.
Using the described reconstruction method, the X, Y, Z locations over time were obtained from the raw PEPT data. An example of PEPT data is showed in Figure 2 where the movement of the media tracer particle along the vertical axis (Z coordinate) is reported against the time for an impeller rotational speed of 300 rpm.
After the application of the reconstruction method, the Cartesian coordinates of the tracer over time were converted to cylindrical coordinates and the calculated-velocities were azimuthally averaged on an imposed grid as displayed in Figure 3. The grid was generated by dividing the attritor chamber into toroidal cells of equal volume under the assumption that the tracer will spend approximately the same amount of time in every part of the vessel and to simplify the determination of the distribution of occupancy per unit volume. Due to the imposition of equality of cell volumes, the dimension of the 2D cells of the grid varies in the radial direction (wider cells near the impeller and narrower ones near the wall) but remains constant along the vertical direction. The grid contains 73 cells along the vertical axis and 20 along the radial axis. In every cell of the grid the velocity was averaged by considering the time spent by the tracer in it [40].

2.3. DEM and Simulation Conditions

The DEM soft-sphere approach originally developed by Cundall and Strack (1979) [41] and implemented in the DEM open source code LIGGGHTS version 3.8.0 (DSC, Linz, Austria) was used to model the media ball motions within the attritor mill HD01 (Union Process, Akron, Ohio, USA). The motion of individual particles is determined by solving Newton’s equations, Equations (1) and (2), considering the effect of normal and tangential forces, gravity and torque for a particle i interacting with a particle j:
m i d v i d t = ( F i j n + F i j t ) + m i g
I i d ω i d t = ( R i × F i j t τ i j r )
where F i j n and F i j t are the normal and the tangential forces according to the Hertz–Mindlin (no-slip) contact model, whereas m i , I i , v i ,   ω i and τ i j r are the mass, the moment of inertia, the translational velocity, the rotational velocity and the rolling torque of particle i, respectively. R i is the vector between the centre of particle i and the contact point where the force F i j t is applied.
The DEM input parameters used for the simulations are listed in the Table 3. As the impeller, the grinding media (5 mm in diameter) and the grinding chamber were all made of yttria-stabilised zirconia the same mechanical properties were utilised for all of them. A Young’s modulus considerably lower than the real value was used to significantly reduce the computational time. This is a well-established practise in the literature [22,42,43,44,45,46] where values as low as 106 Pa are used, rather than realistic values in the order of 1010–1011 Pa, with little effect on the simulation results. Since, a wide range of velocities exists in the attritor an average value of the coefficient of restitution equal to 0.7 was selected. This fairly high value is justified assuming that the collisions between the grinding media are not expected to be very dissipative in absence of powder. The same value for the coefficient of restitution is used for both media-media and media-wall contacts. The static friction was considered as a parameter to adjust against PEPT data to obtain the correct representation of the media flow field. Three values of static friction coefficient were used (0.15, 0.3 and 0.5) and the same coefficient was used for both media-media and media-wall contacts. The rolling friction coefficient of the grinding media was set equal to zero. The latter parameter always acts to oppose rolling, however, its effect can be neglected when the motion of spherical particles, such as the grinding media, is considered [3,22,45,46,47]. During the PEPT experiments the tracer location was measured on average every 30 milliseconds (approximately 35 measurements per second) therefore, the same characteristic time was used in the DEM simulations to sample the particle data.

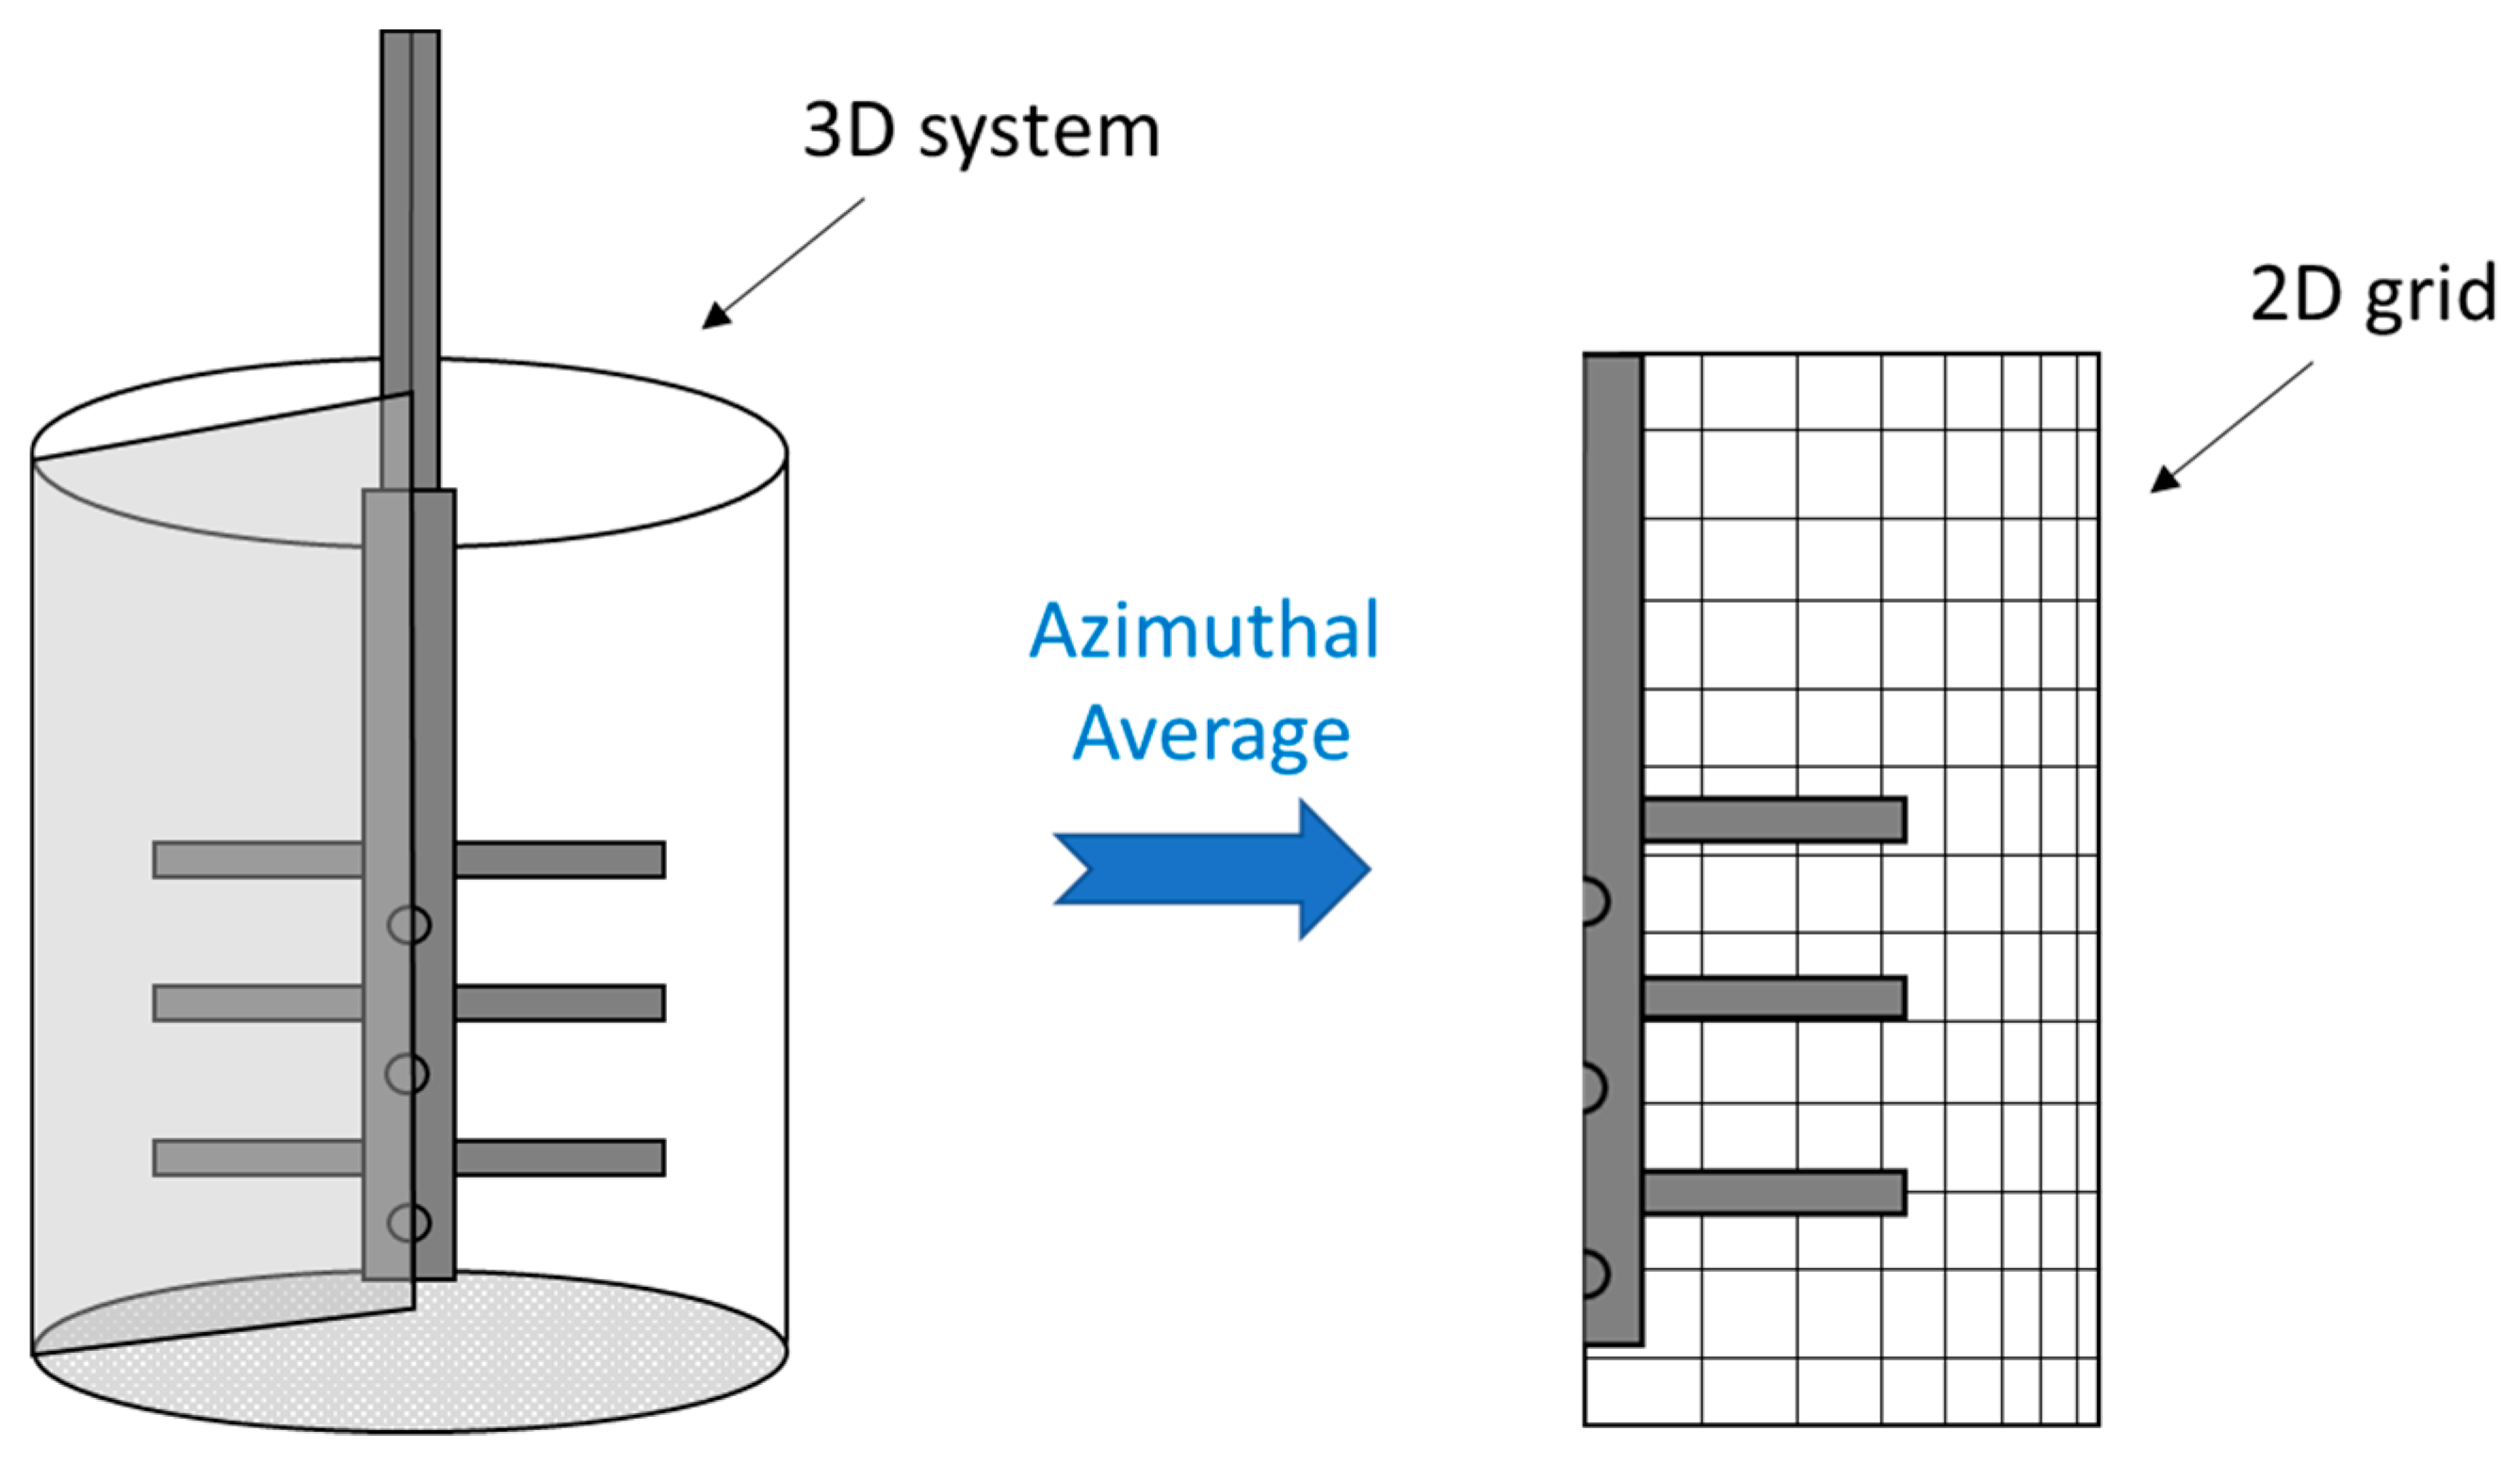
DEM Data Postprocessing Using the Coarse Graining Method

The commercial coarse-graining (CG) software Iota® (Particle-Analytics, Edinburgh, UK) was used for the visualisation of DEM results and the calculation of continuum fields of media properties such as solid fraction and velocity, by averaging the discrete DEM information calculated over the entire simulation time. This software has already been used by the author of this paper to comprehensively investigate the grinding media dynamics inside a vertical stirred mill [24]. The main advantage of the coarse-graining is the ability to handle the large amount of discrete data generated by DEM simulations to represent, starting from microscopic quantities, the continuum bulk properties of the granular material and its flow. For more details on the method and on the selection of the spatial and temporal scales of the coarse-graining the reader is referred to the literature [48,49,50]. After the application of the coarse graining, the DEM simulation results were compared both qualitatively and quantitatively with the PEPT data. The qualitative comparison consisted in the visualisation of the media velocity flow field calculated by the two techniques, while the quantitative comparison was done based on the velocity profiles at different radial locations within the vessel.

3. Results and Discussion

Once the PEPT Cartesian tracer coordinates (X, Y, Z) as a function of time were obtained from the reconstruction algorithm, they were converted to cylindrical coordinates (R, θ, Z) and the tracer velocities were azimuthally averaged on the Eulerian grid as shown by the schematic in Figure 3. The grid was then used to display the following information: magnitude of the velocity, velocity vectors and occupancy plot.

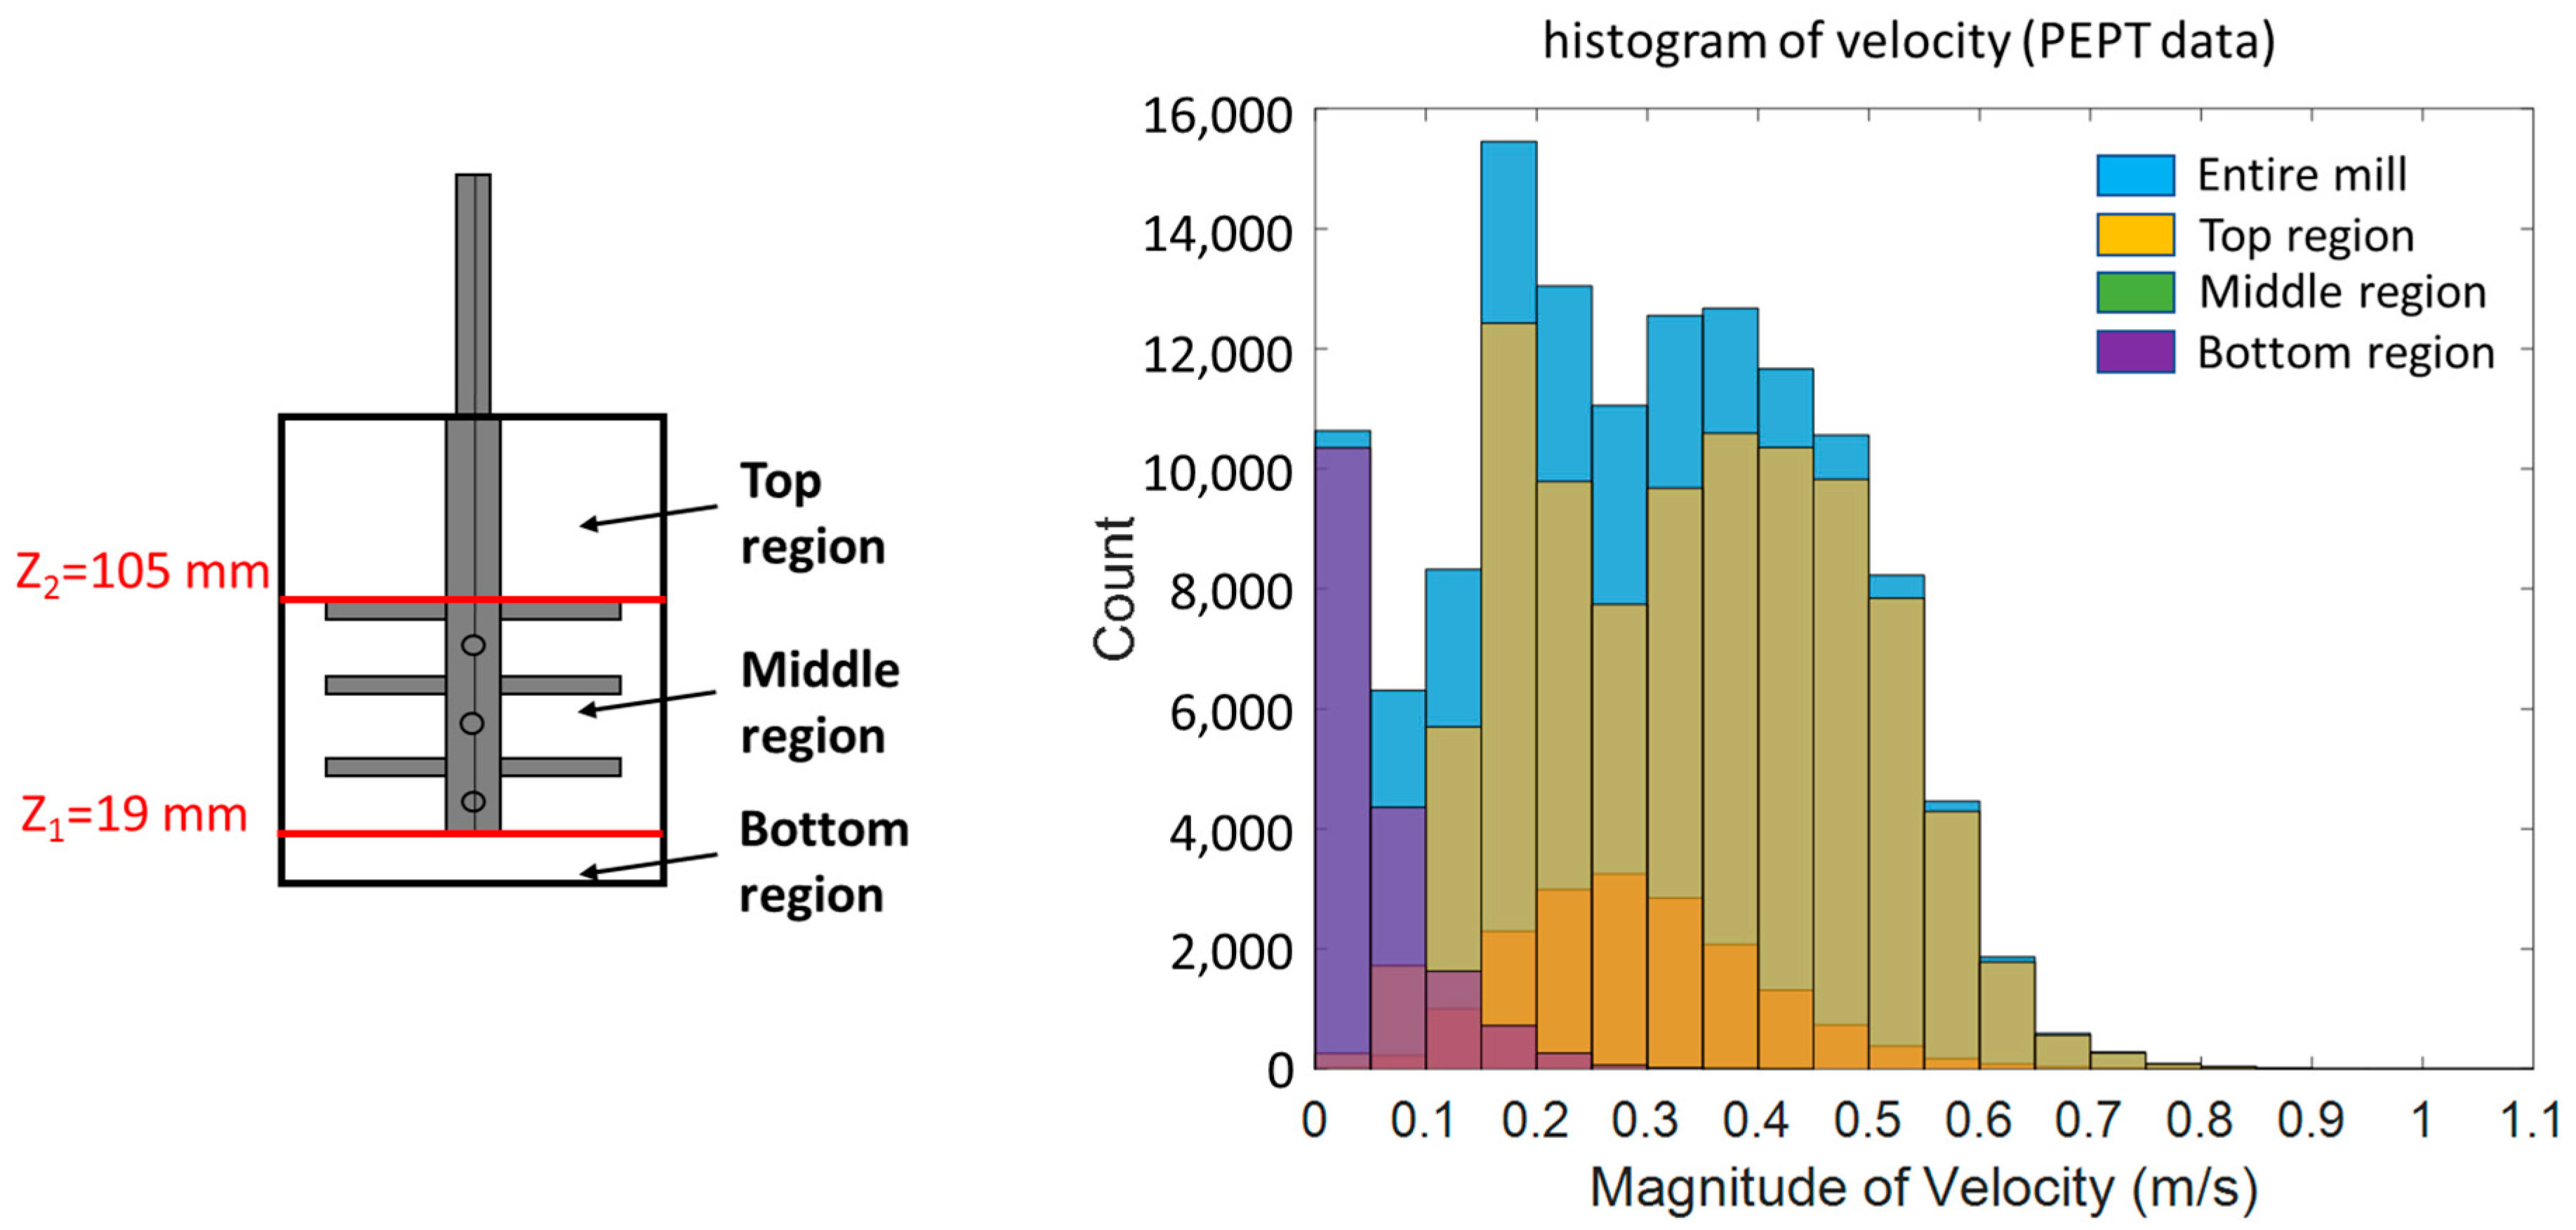
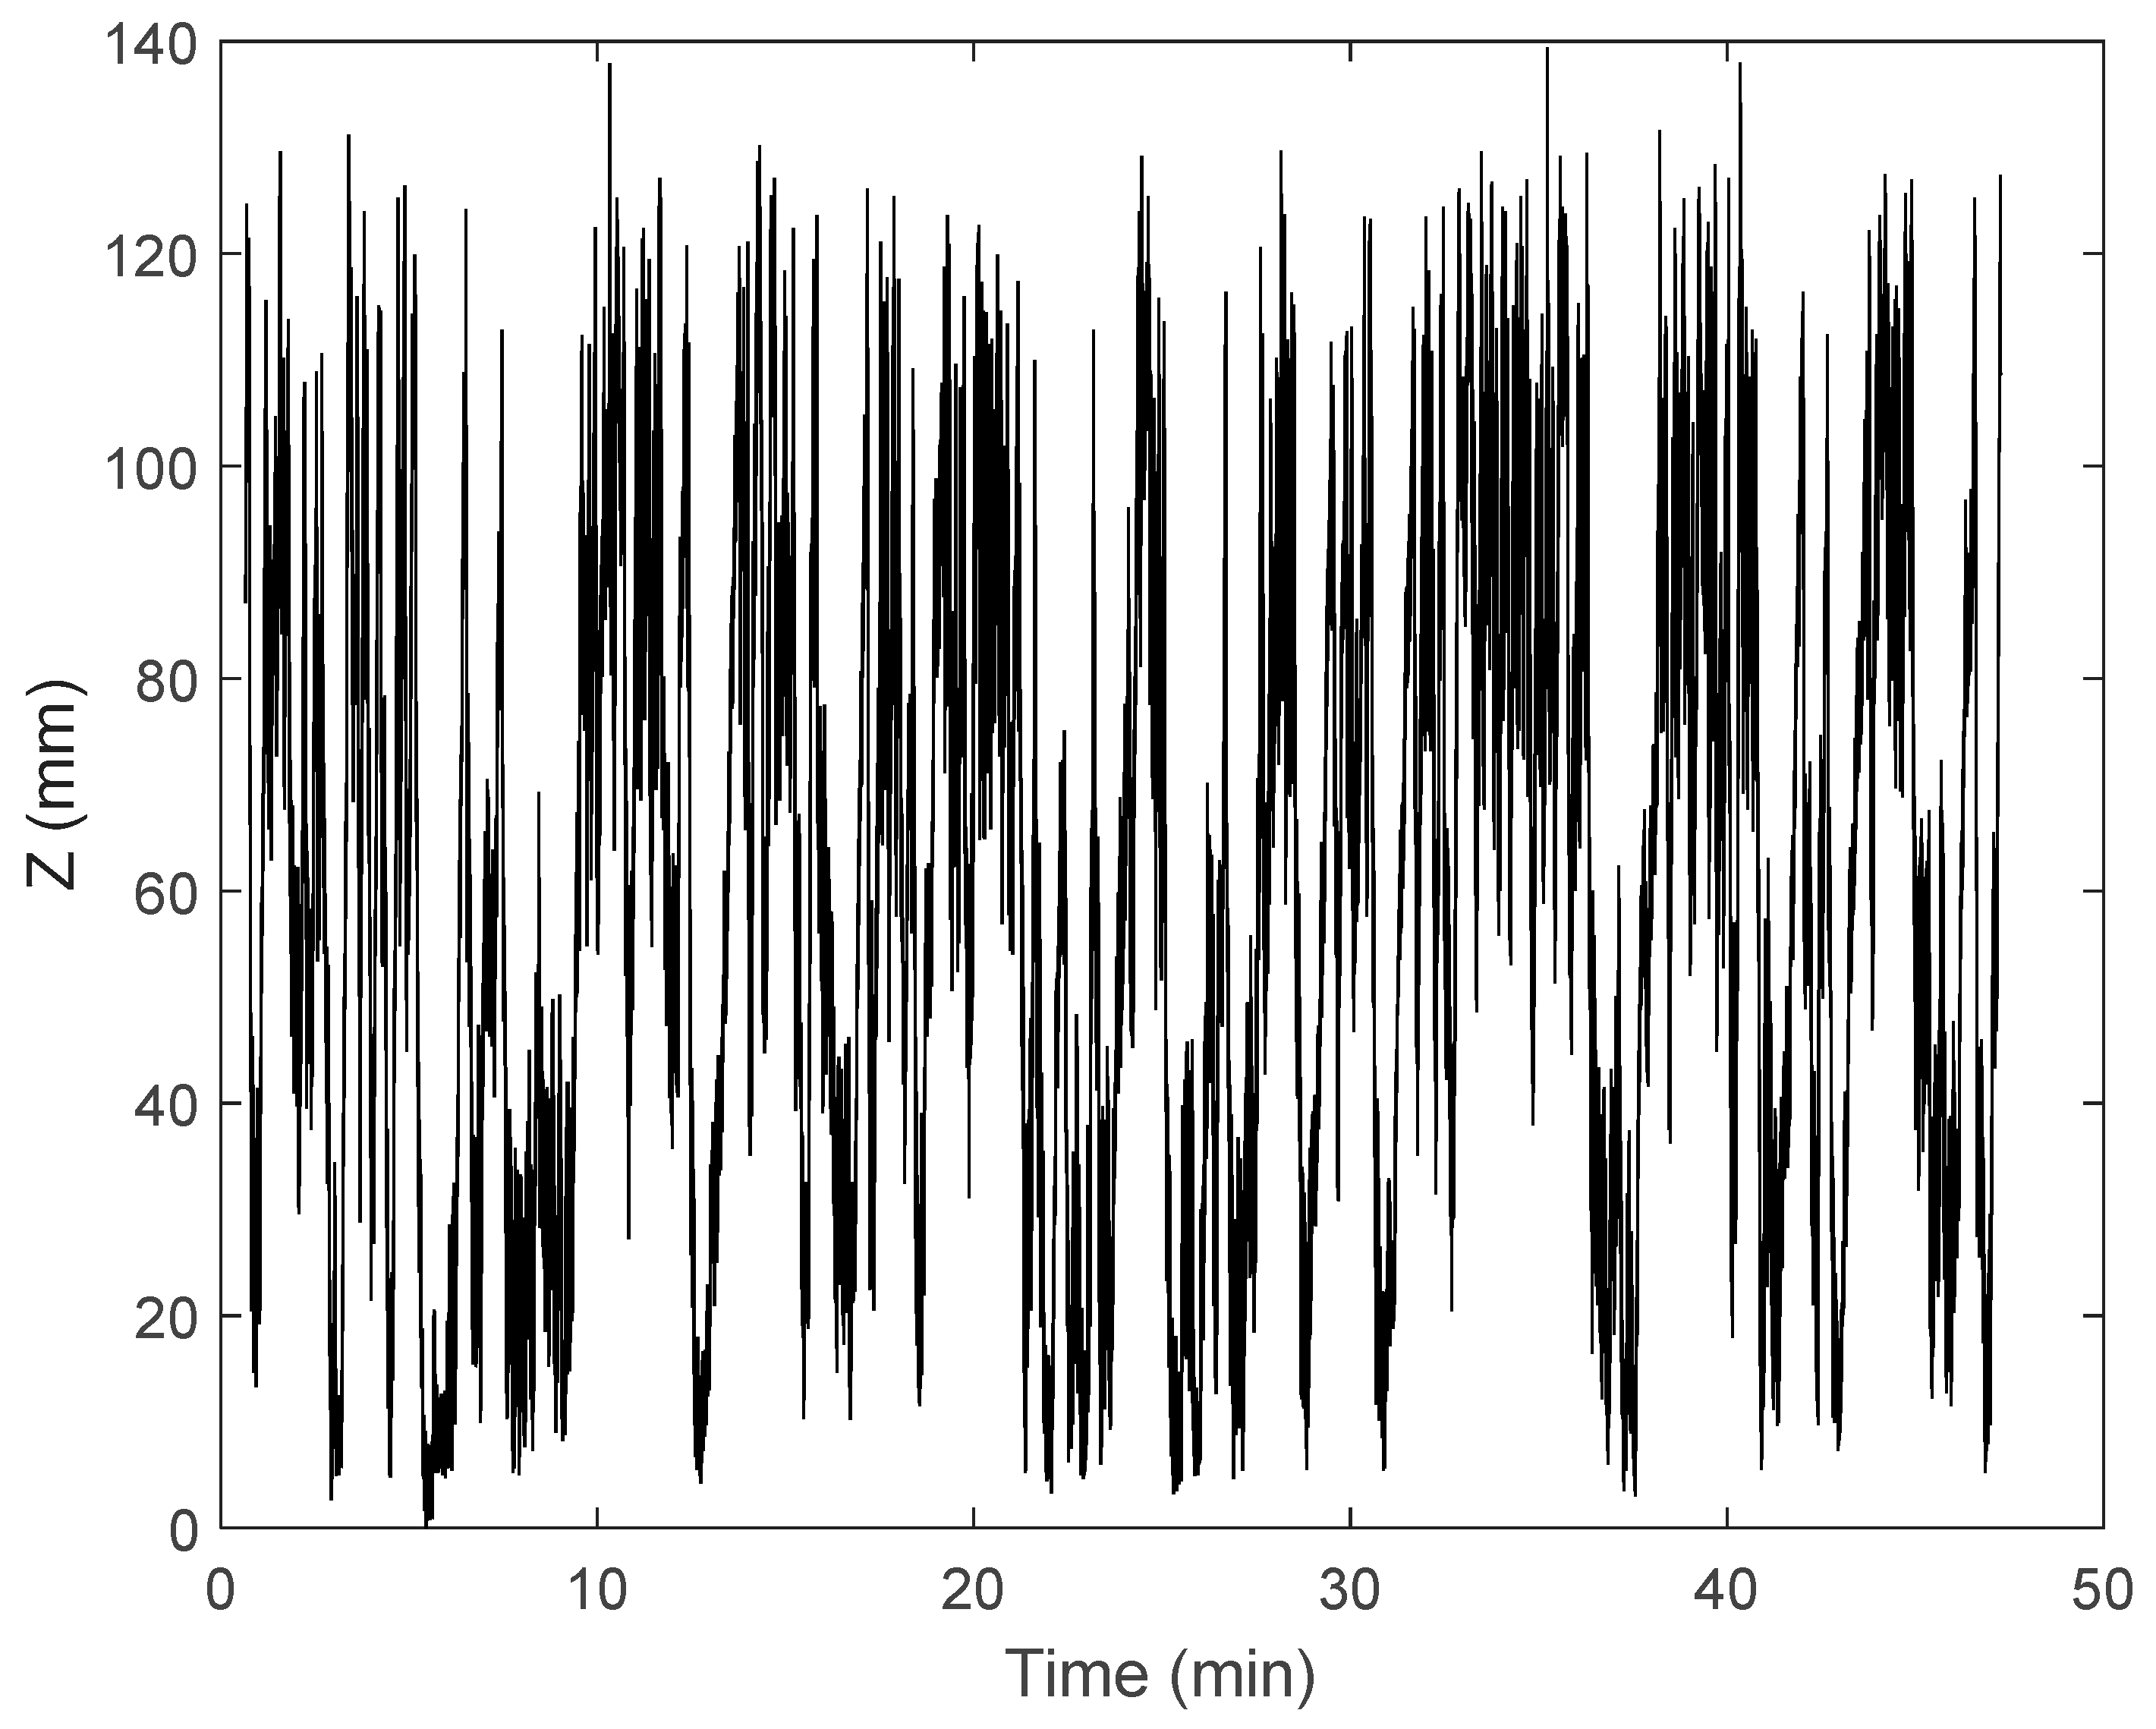
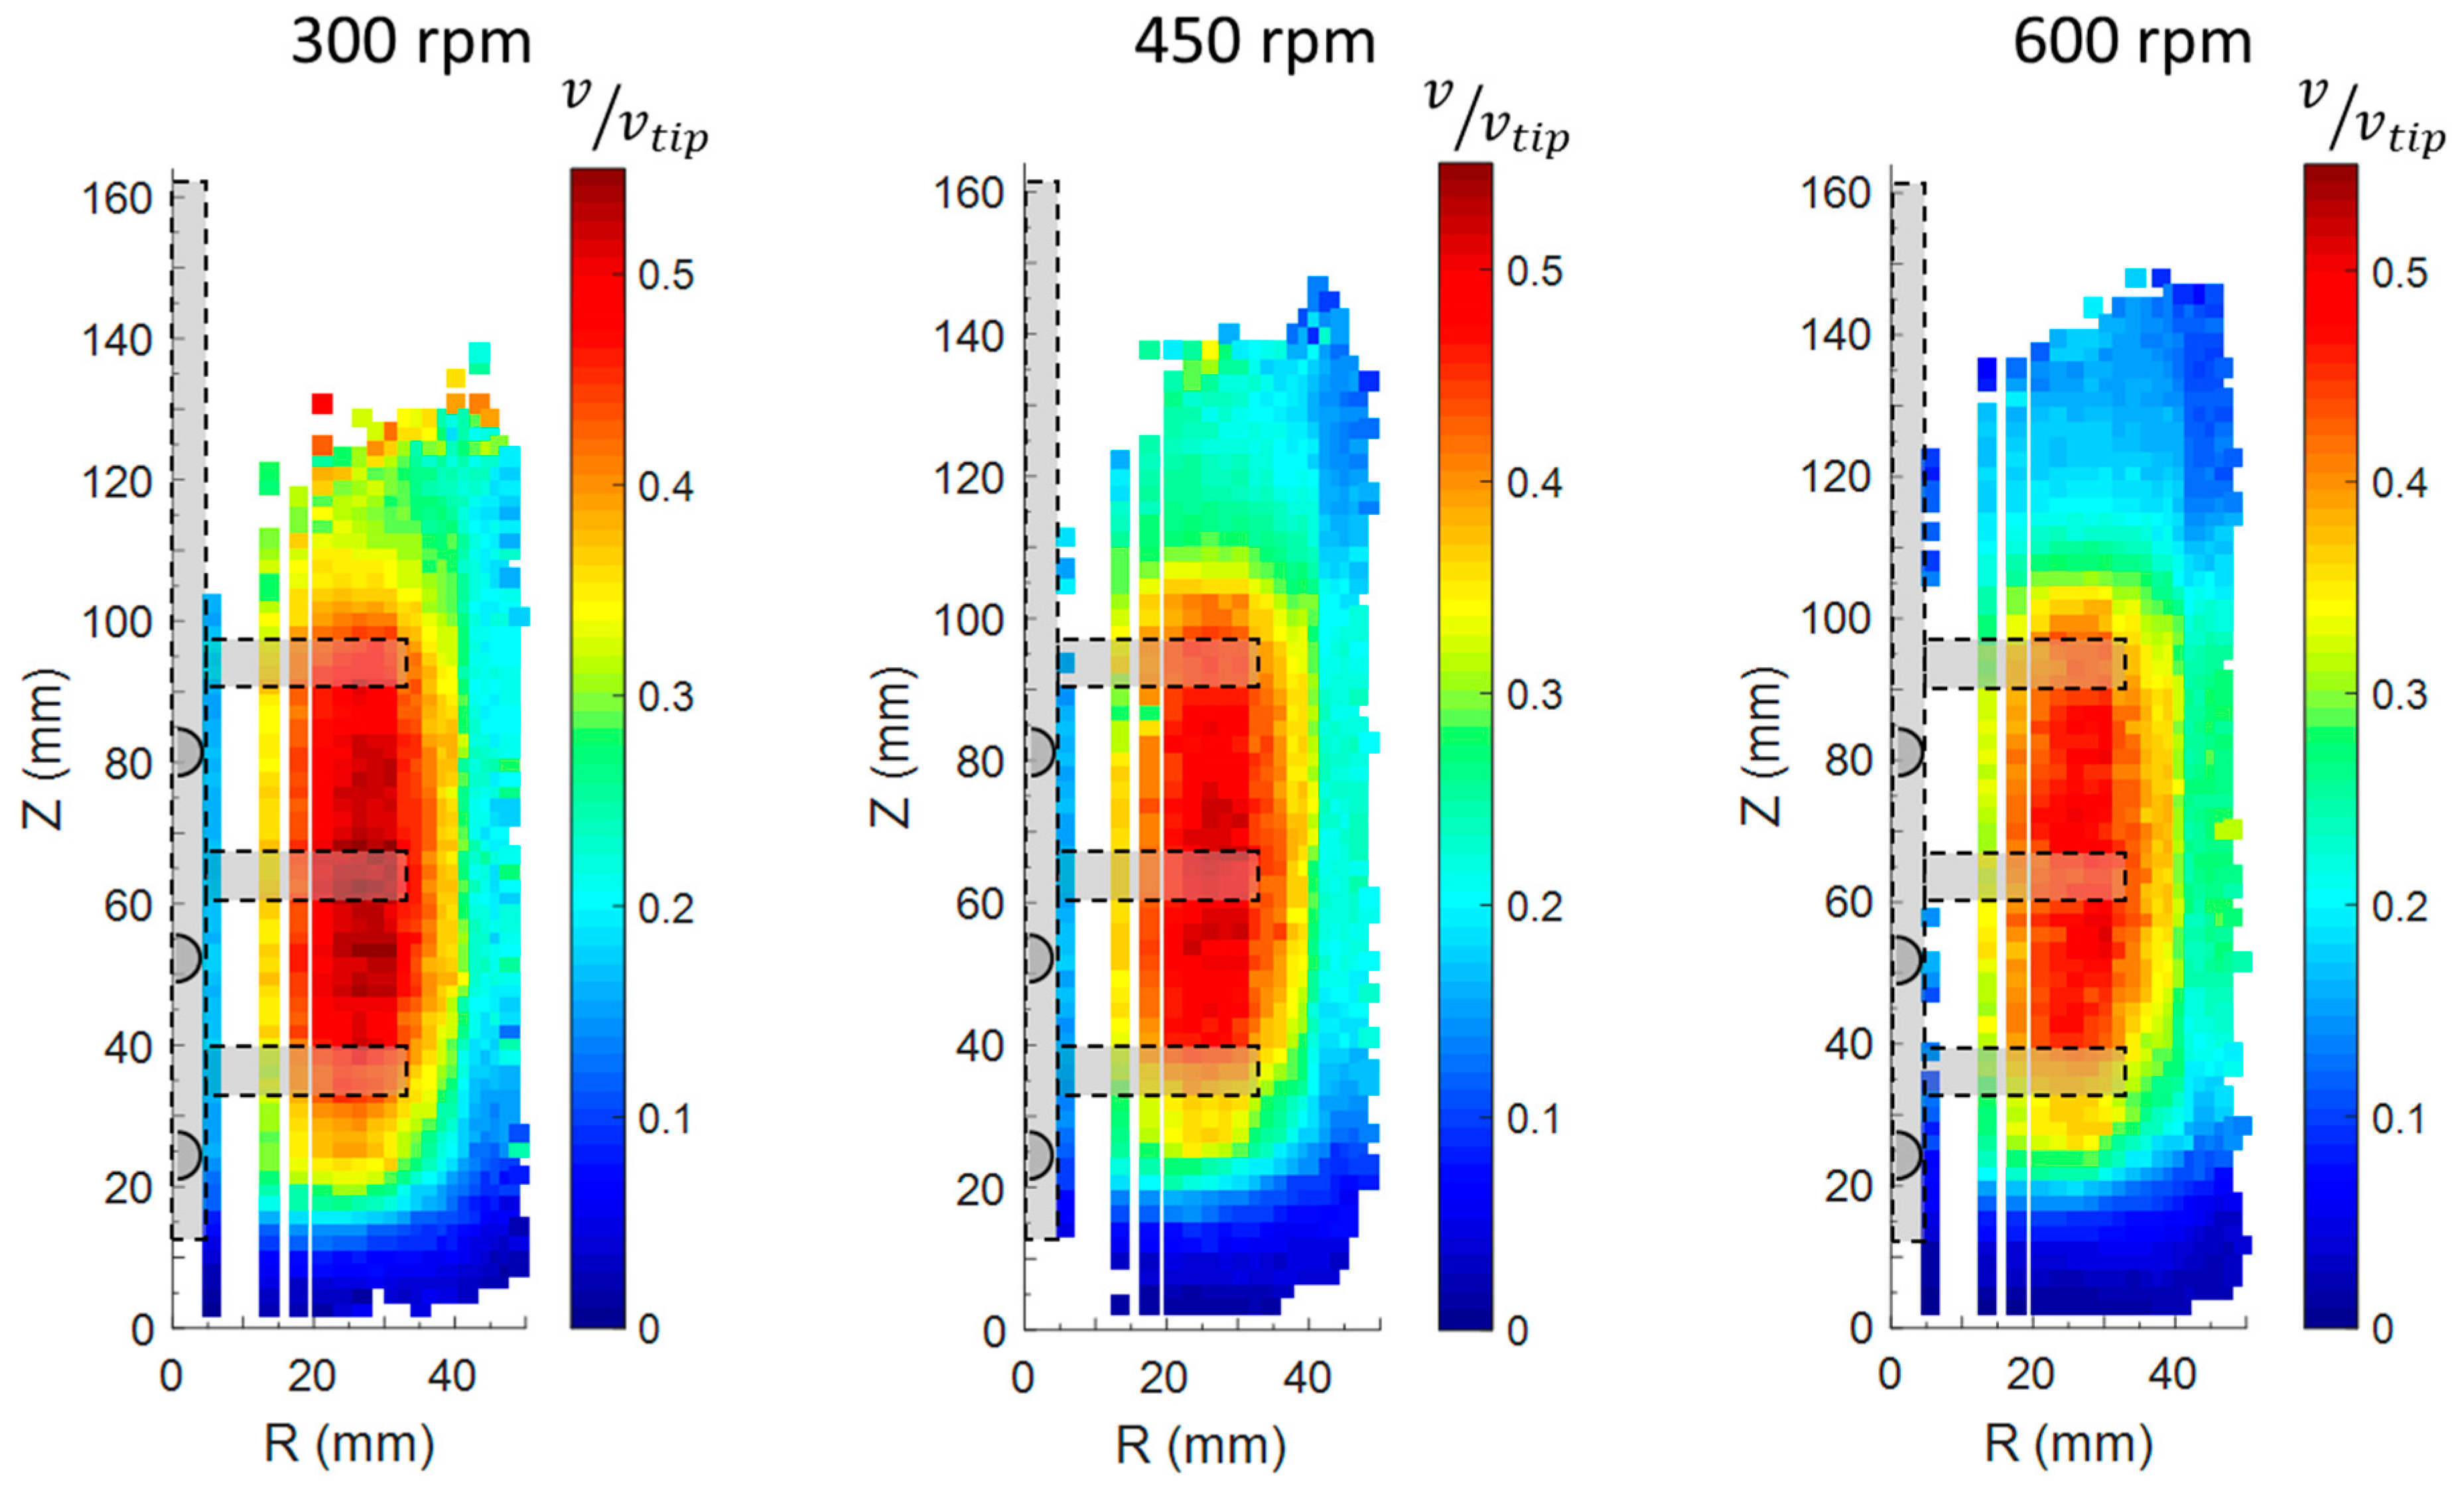
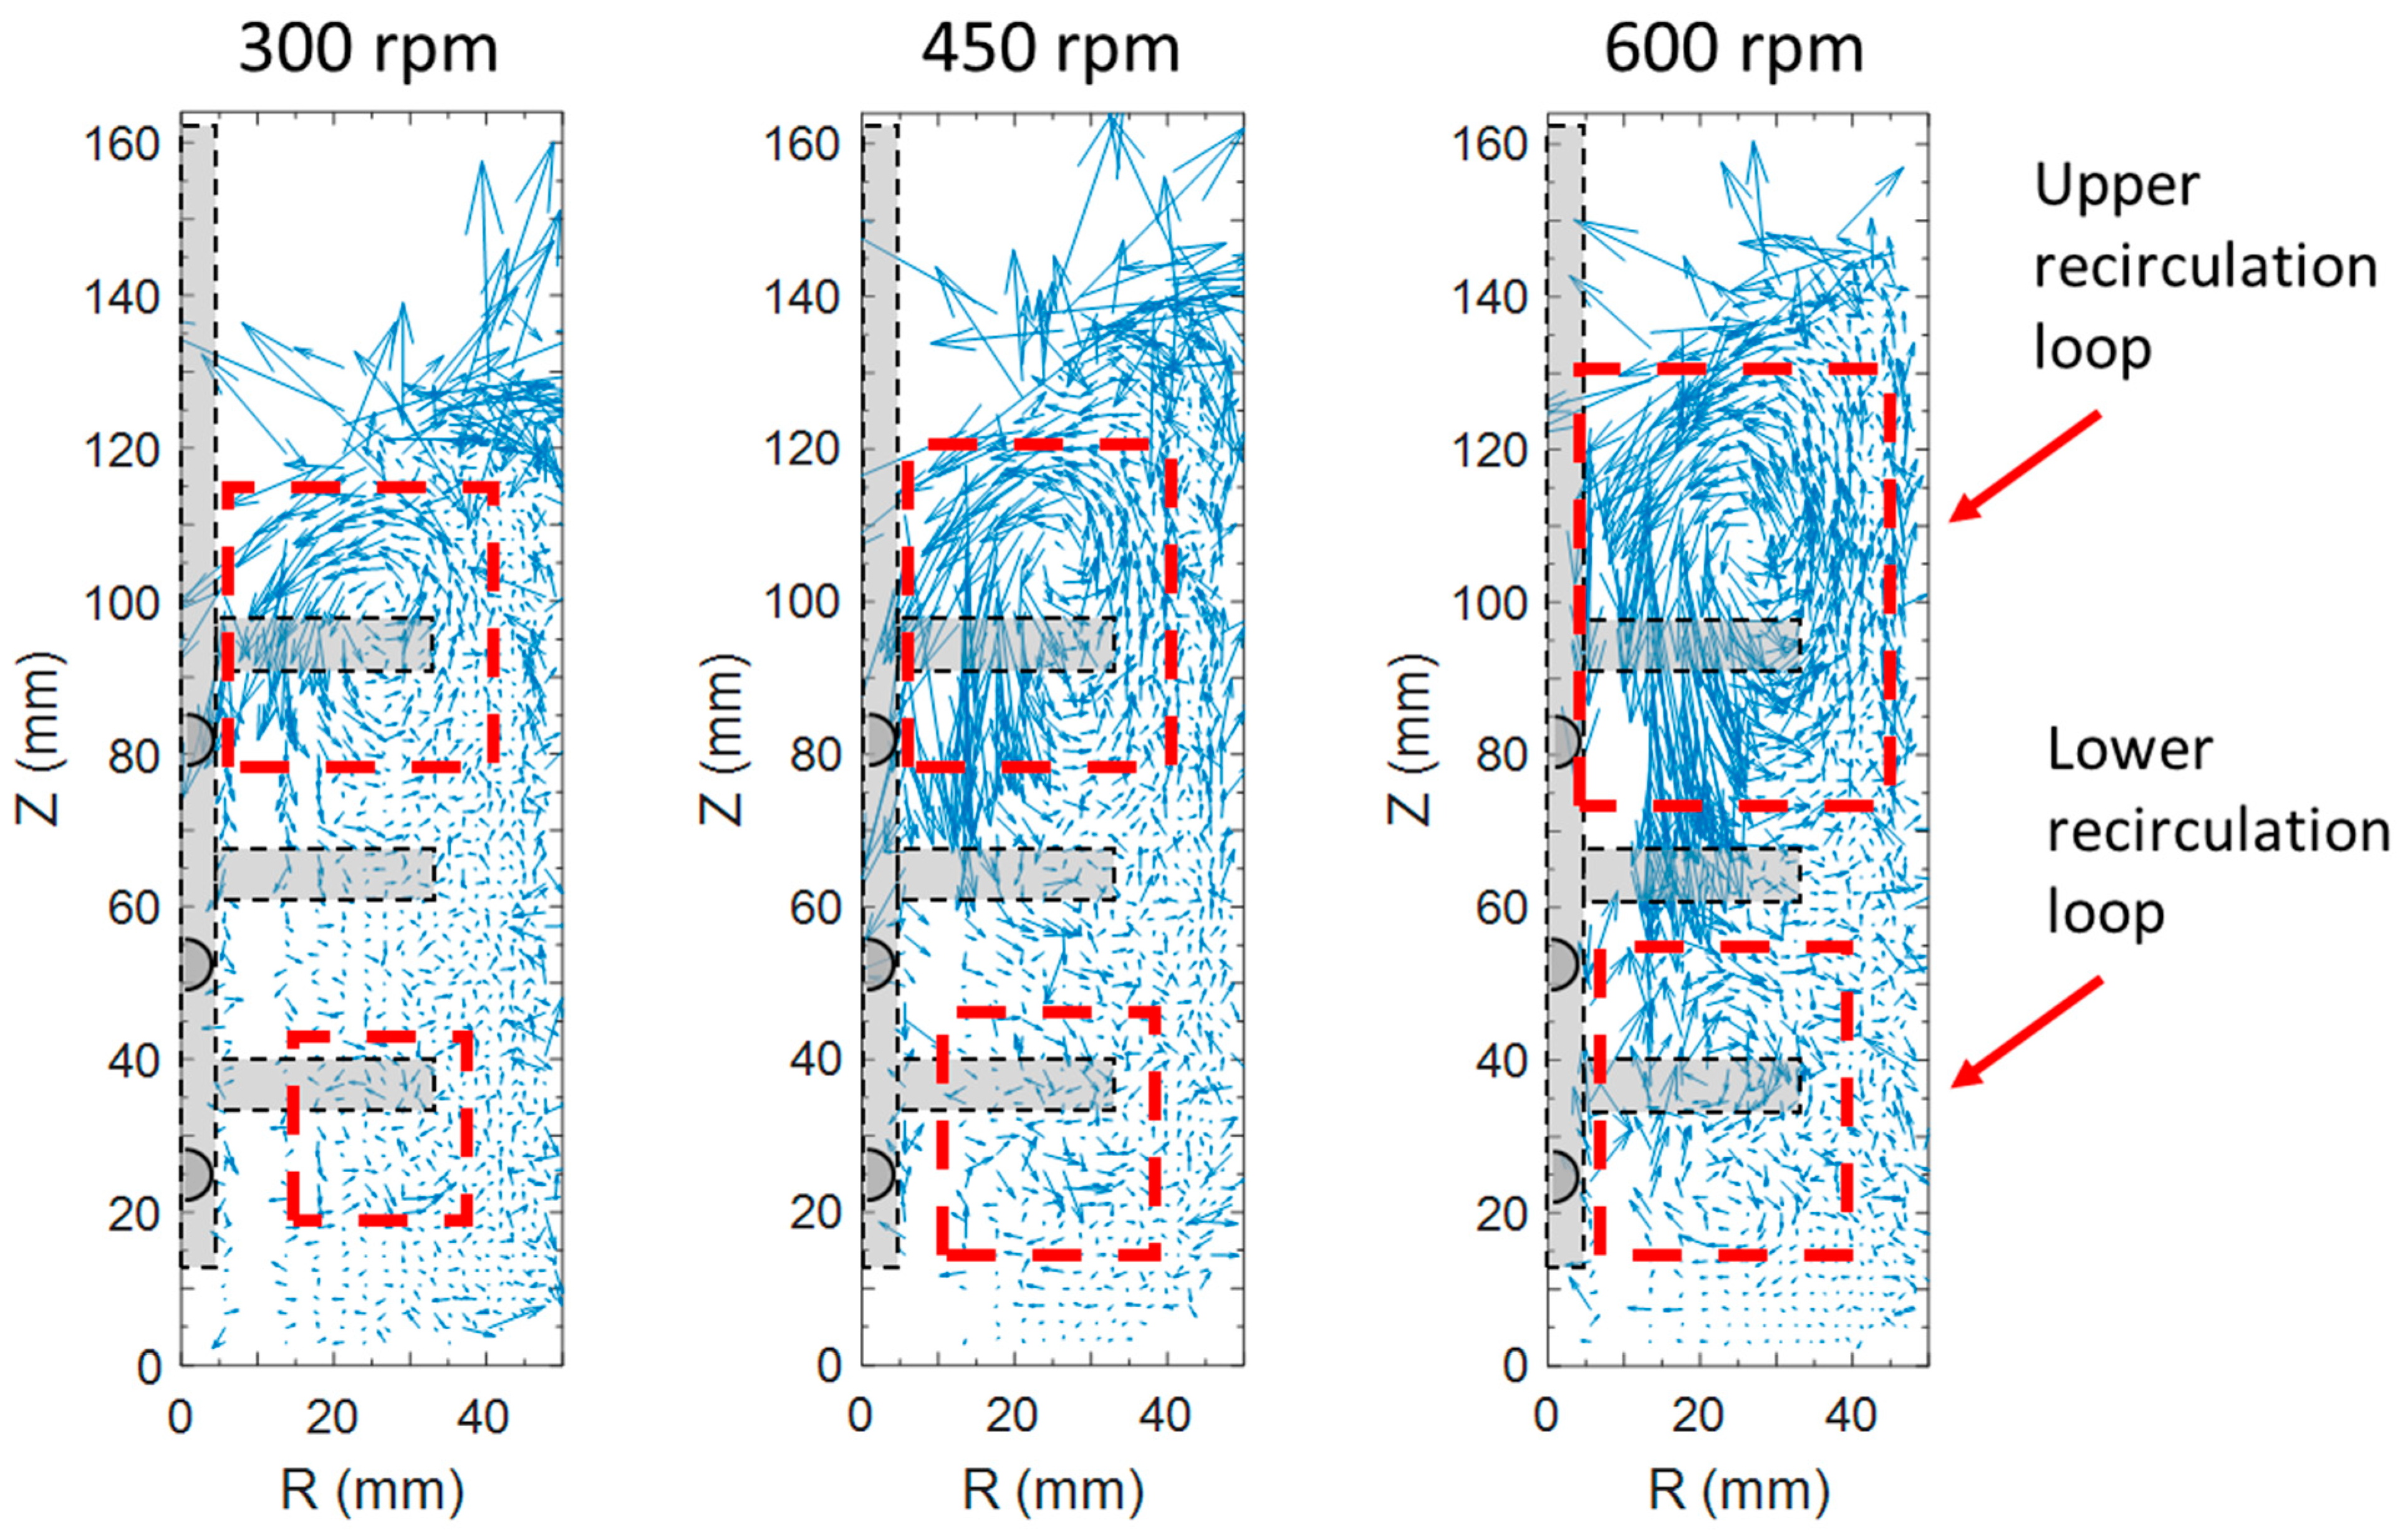
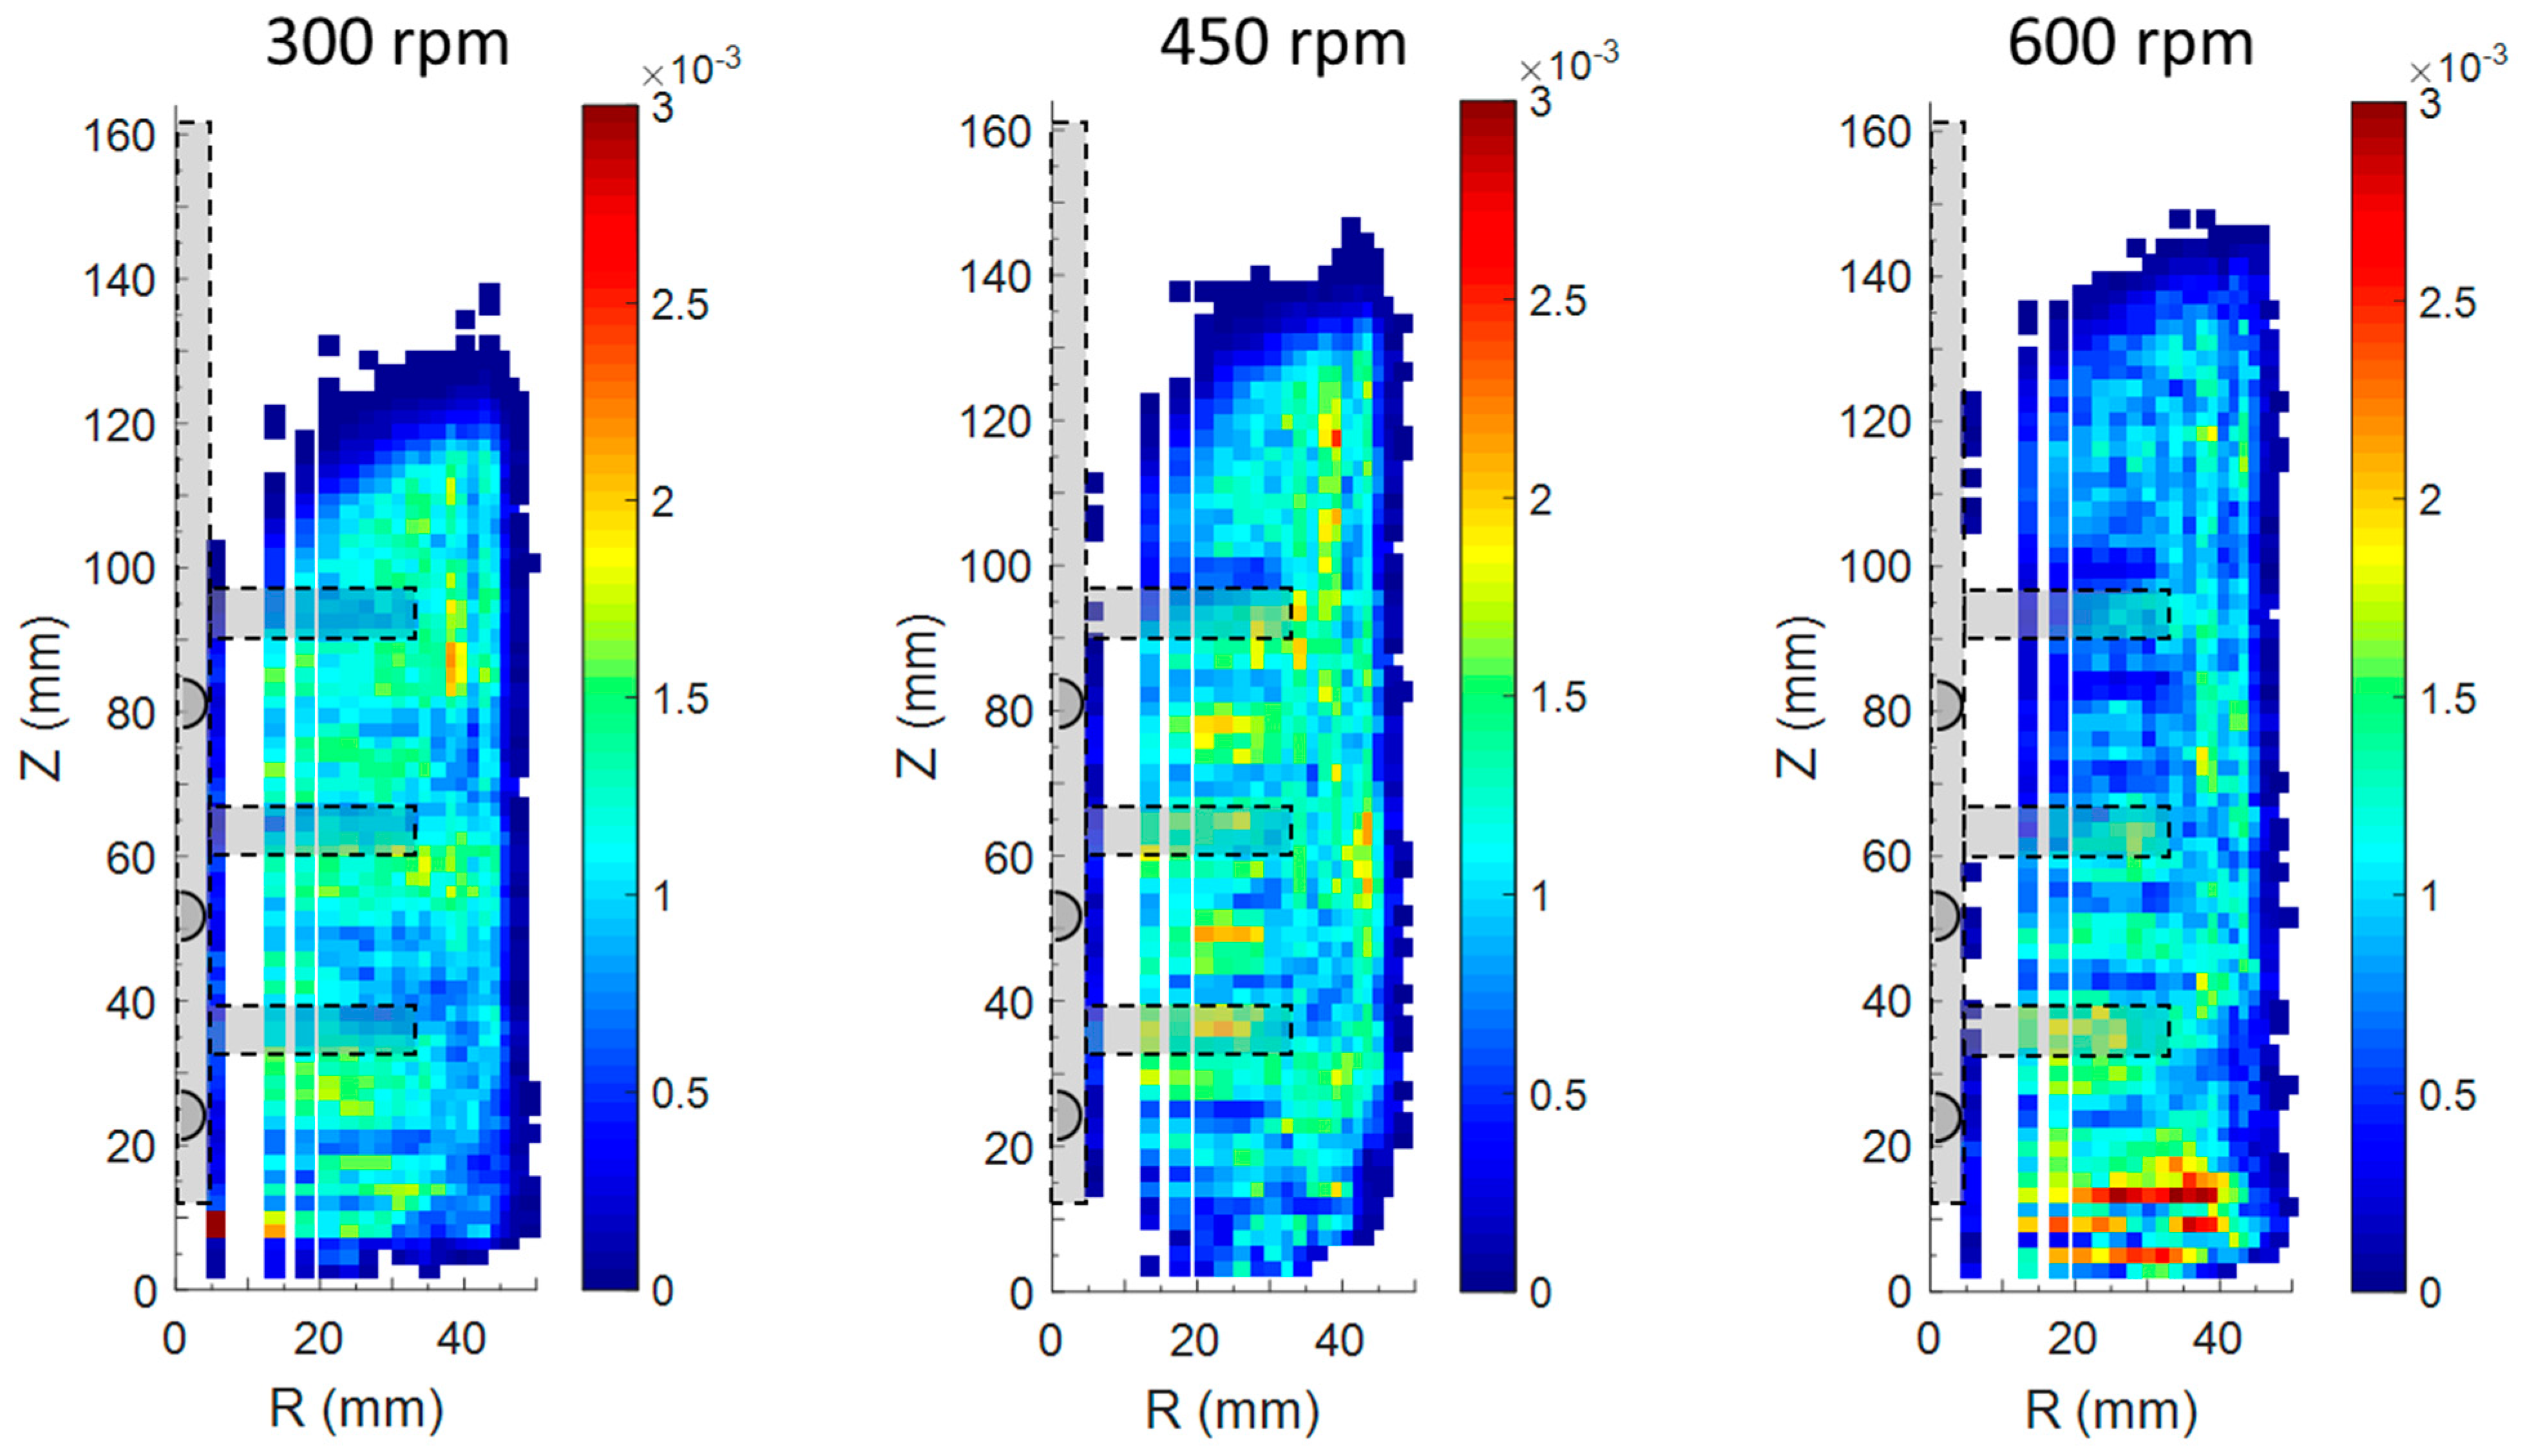
3.1. Effect of Impeller Speed Evaluated from PEPT Experiments

The effect of the impeller speed on the grinding media motion is discussed for the bead loading of 2.4 kg and the impeller clearance of 12.7 mm. The impeller speed was varied from 300 to 600 rpm corresponding to tip speeds of 1.1 m/s and 2.1 m/s, respectively. Figure 4 shows the colour maps of the normalised velocity (magnitude of velocity divided by the corresponding impeller tip speed) within the attritor vessel. For a better comprehension of the velocity field, the positions of the impeller arms with respect to the vessel are showed in Figure 4. The colour scale indicates in red and blue high velocity and low velocity, respectively.
For all the three impeller speeds, the normalised velocity was significantly higher around the impeller-pin locations than in the area beneath the impeller shaft. In the latter area of the equipment the contact between the beads and the impeller pins was indirect and it resulted in a poor exchange of momentum. This caused the formation of a stagnant region where the media motion was feeble. Comparing the three velocity flow fields of Figure 4 two observations can be emphasised. Firstly, the position of the region of the highest dimensionless velocity (around the pins’ location) and its size did not change noticeably when increasing the impeller speed. This agrees with the findings of [11] who observed an increase in media velocity only within the impeller swept zone (where the pins are located) and markedly little variation outside of it. Secondly, from 300 rpm to 600 rpm the media bed was gradually rising upwards towards the top of the vessel due to the increasing centrifugal force generated by the impeller rotation. In fact, as reported by previous PEPT investigations on wet stirred media mills [9,11] an increase of the impeller speed results in the media bed expansion and in the net movement of the media along the vertical attritor axis.
The effect of the impeller speed on both the media bed expansion and the flow recirculation patterns was better illustrated by the velocity vectors. Figure 5 displays the velocity vector maps, calculated by using the axial and the radial components of the velocity, at different impeller speeds for the bead loading of 2.4 kg and the bottom clearance of 12.7 mm.
For example, at 300 rpm the maximum bed height was about 125 mm (76% of the pot height), at 450 rpm was 139 mm (85% of the pot height) whereas at 600 rpm it was 145 mm (88% of the pot height). Hence, an expansion of the media along the vertical axis of approximately 20 mm occurred when the impeller speed was doubled. The velocity vector maps also highlight the presence of two media flow patterns: an upper recirculation loop, visible for all impeller speeds, and a lower recirculation loop more evident at the higher impeller speeds than the lower. The upper recirculation loop clearly developed and reinforced with the increase of the impeller speed as a major fraction of media was lifted up by the impeller pins and then recirculated back to the impeller zone. This suggests that a better dispersion and distribution of the material to be ground across the media bed may be achieved at high impeller speeds, leading to potential positive effects on the grinding efficiency. Even the size of the lower recirculation loop increased with the impeller speed, but its pattern became evident only at the maximum speed of 600 rpm.
For all the cases, in the location beneath the bottom arms (0 < Z < 20 mm) the velocity vectors were remarkably short and not significantly influenced by the increase of the impeller speed. Hence, according to the velocity maps the beads at the bottom of the attritor seemed to be trapped in a dead region of the mill. These observations imply that the transfer of energy between the impeller and the bottom beads was still ineffective and/or impeded by the boundary effect of the vessel base. This was better highlighted in Figure 6 by the calculation of the normalised tracer occupancy, defined as the cumulative time spent by the tracer particle in a cell of the grid divided by the total time of the experiment. This quantity can be considered as an indicator of the tracer accessibility within the different zones of the equipment.
At 300 rpm and 450 rpm the normalised occupancy was quite uniform, suggesting a similar recirculation of the beads within the vessel and the absence of preferential paths. Both the upper part of the media bed and the bottom corners of the grinding chamber showed low values of occupancy because the tracer in proportion spent less time in these zones compared to the rest of the pot. On the other hand, at 600 rpm the normalised occupancy map revealed the presence of a region of high occupancy at the bottom of the vessel where the tracer was trapped for long time. The possible explanation for the area of high occupancy is that at 600 rpm the lower recirculation loop obstructed the re-admission of the tracer in the upper part of the bed. The difficult re-admission of the tracer could also explain the longer relative time spent by the tracer at the mill bottom compared to the rest of the pot.

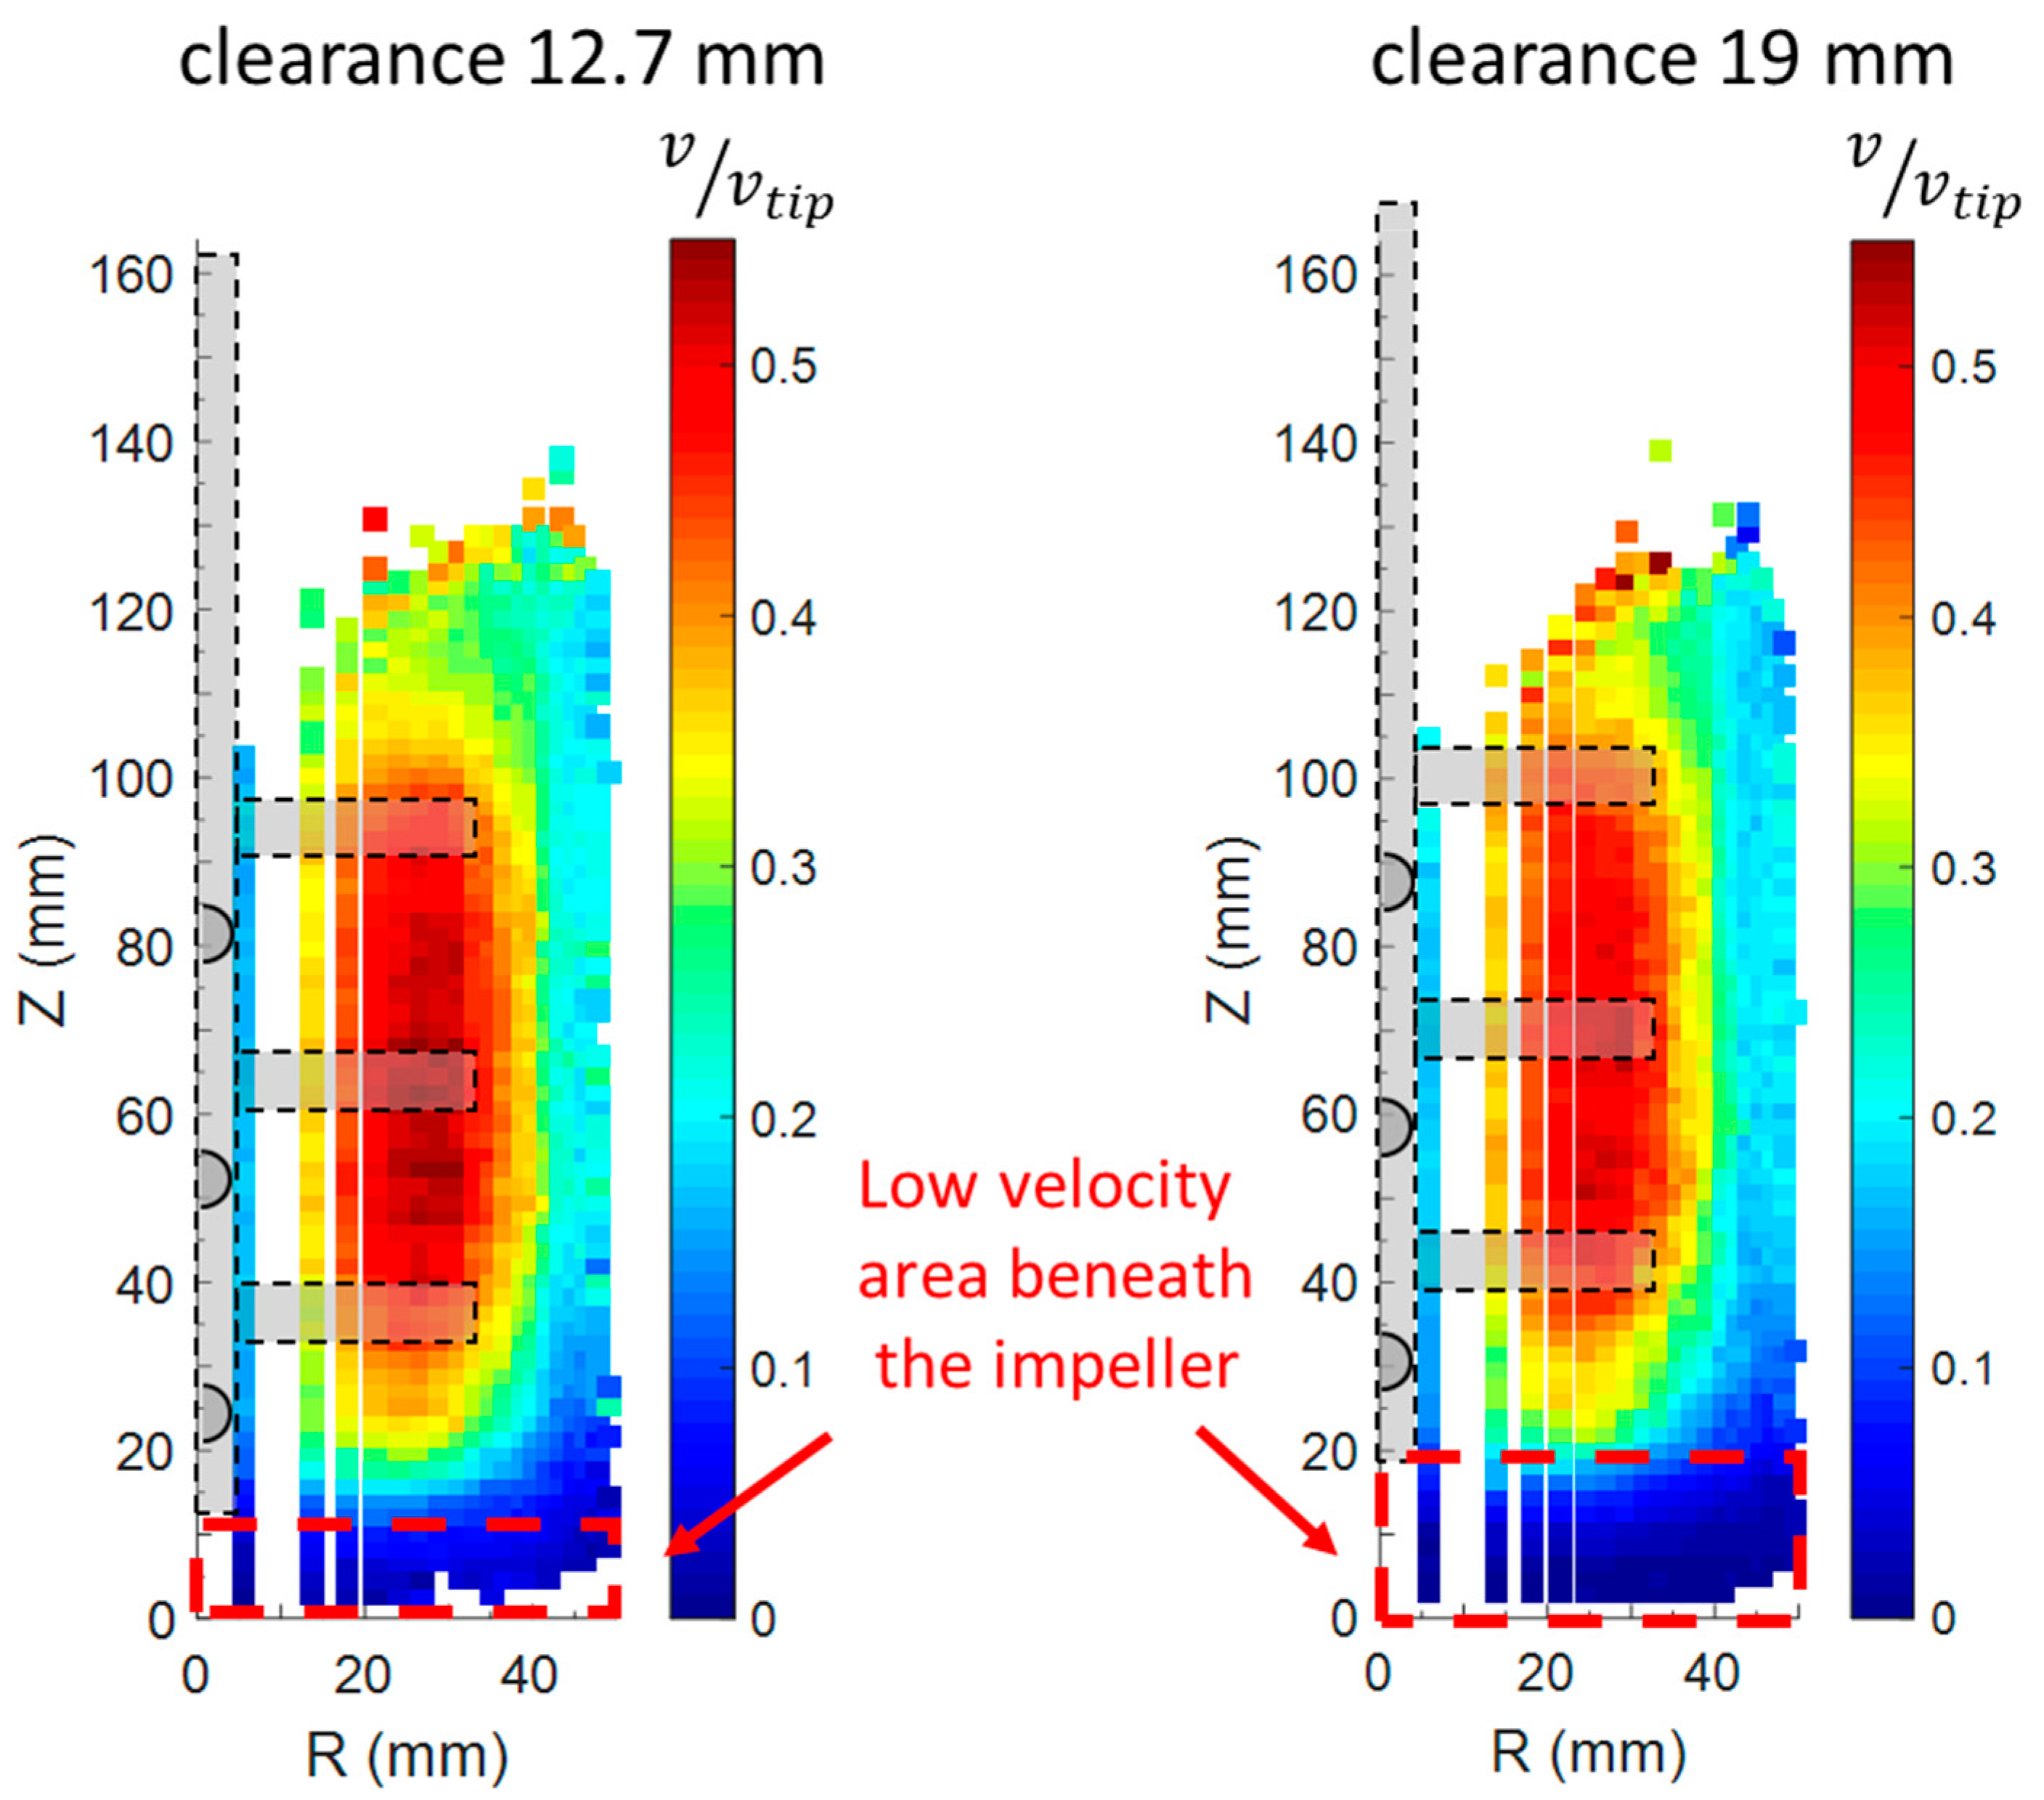
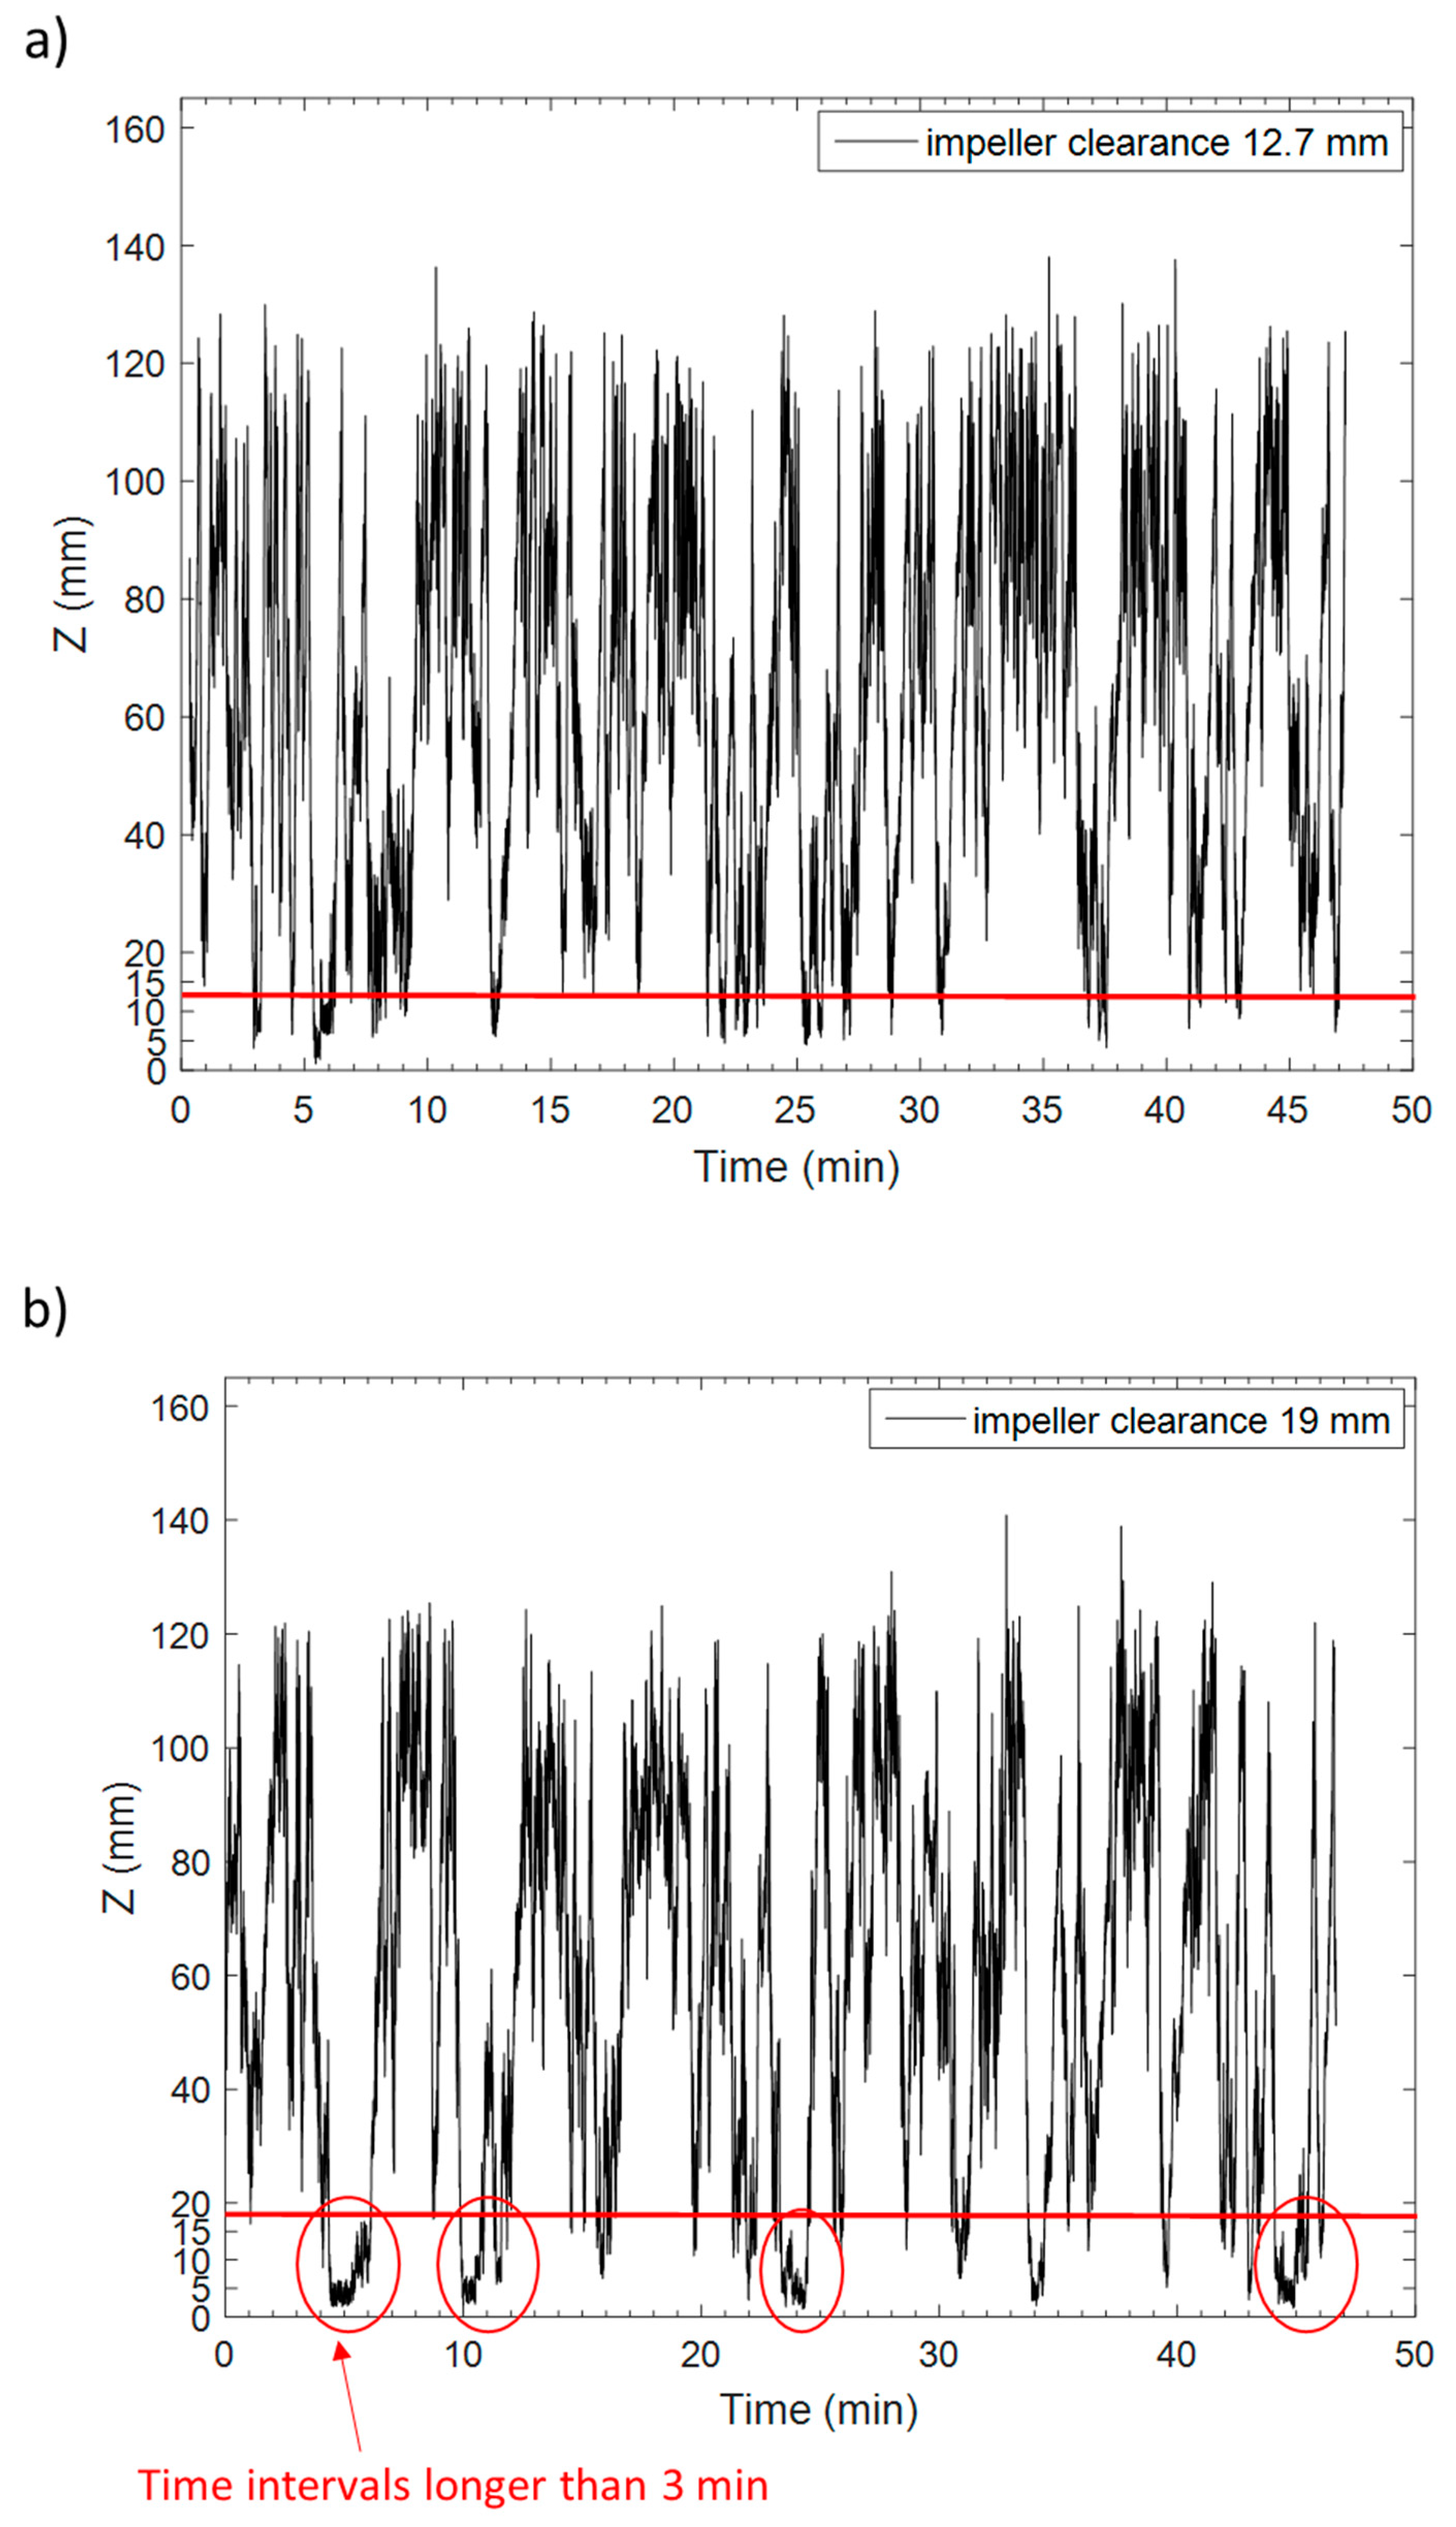
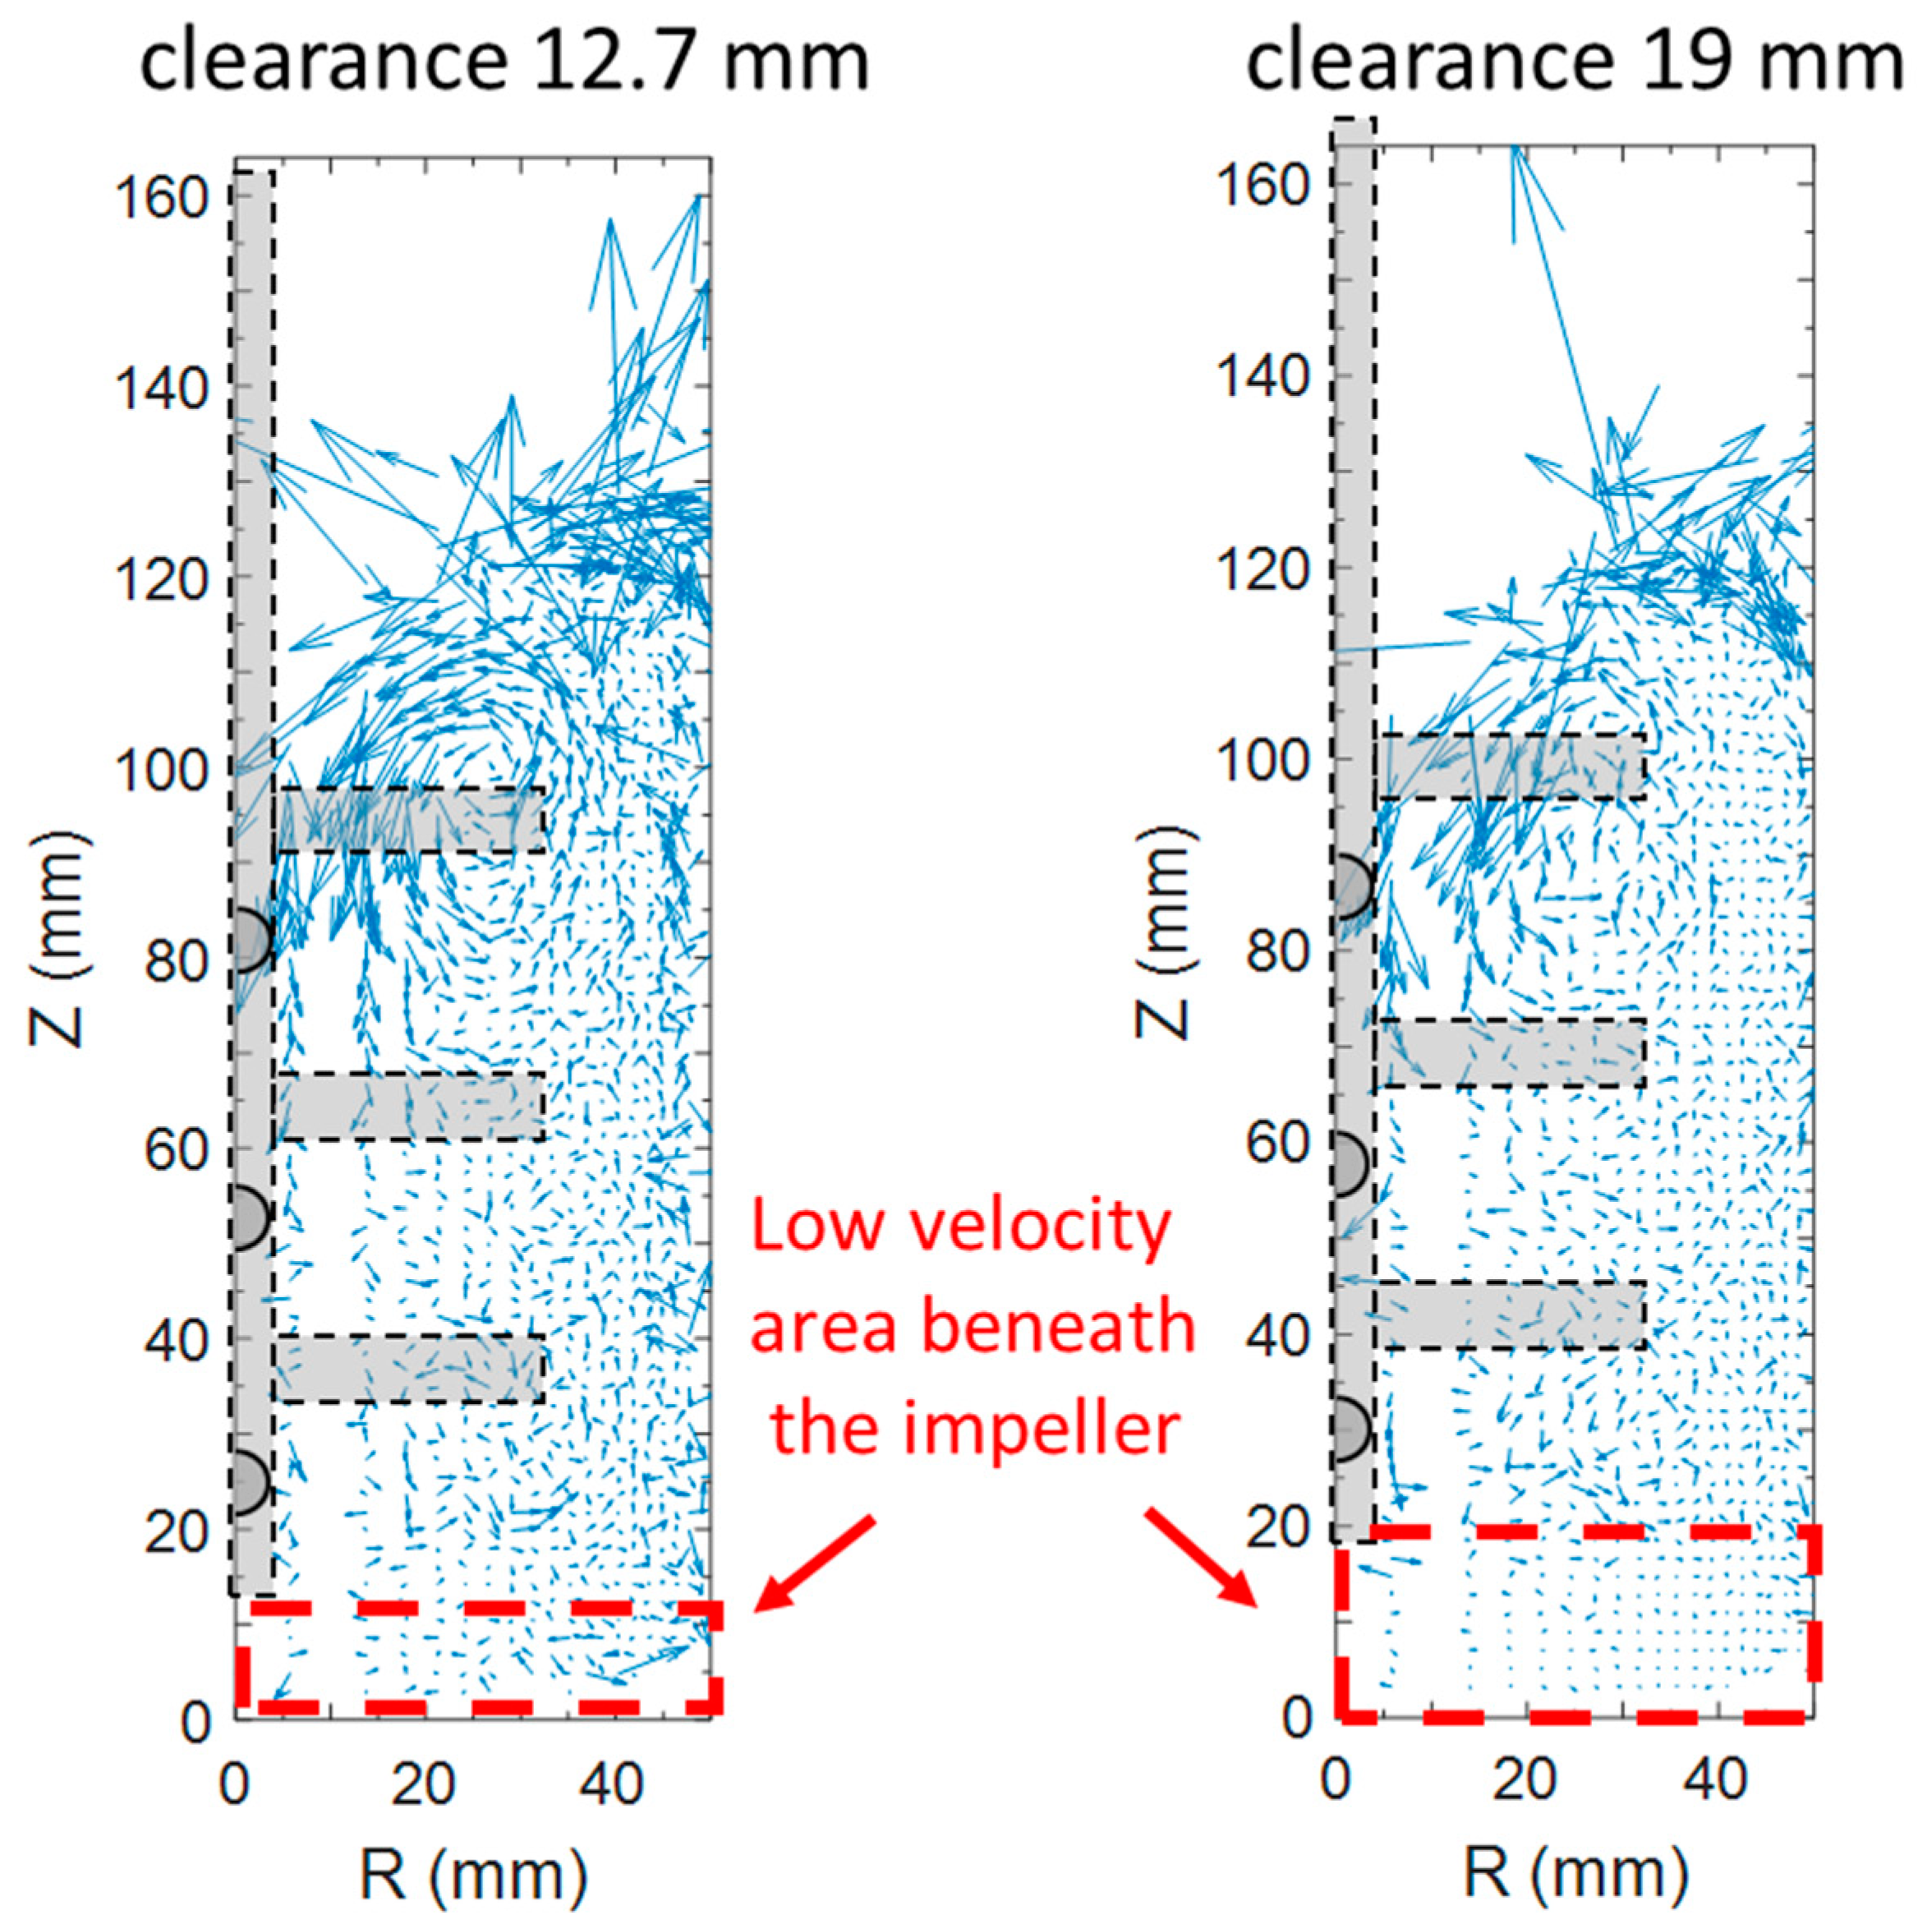
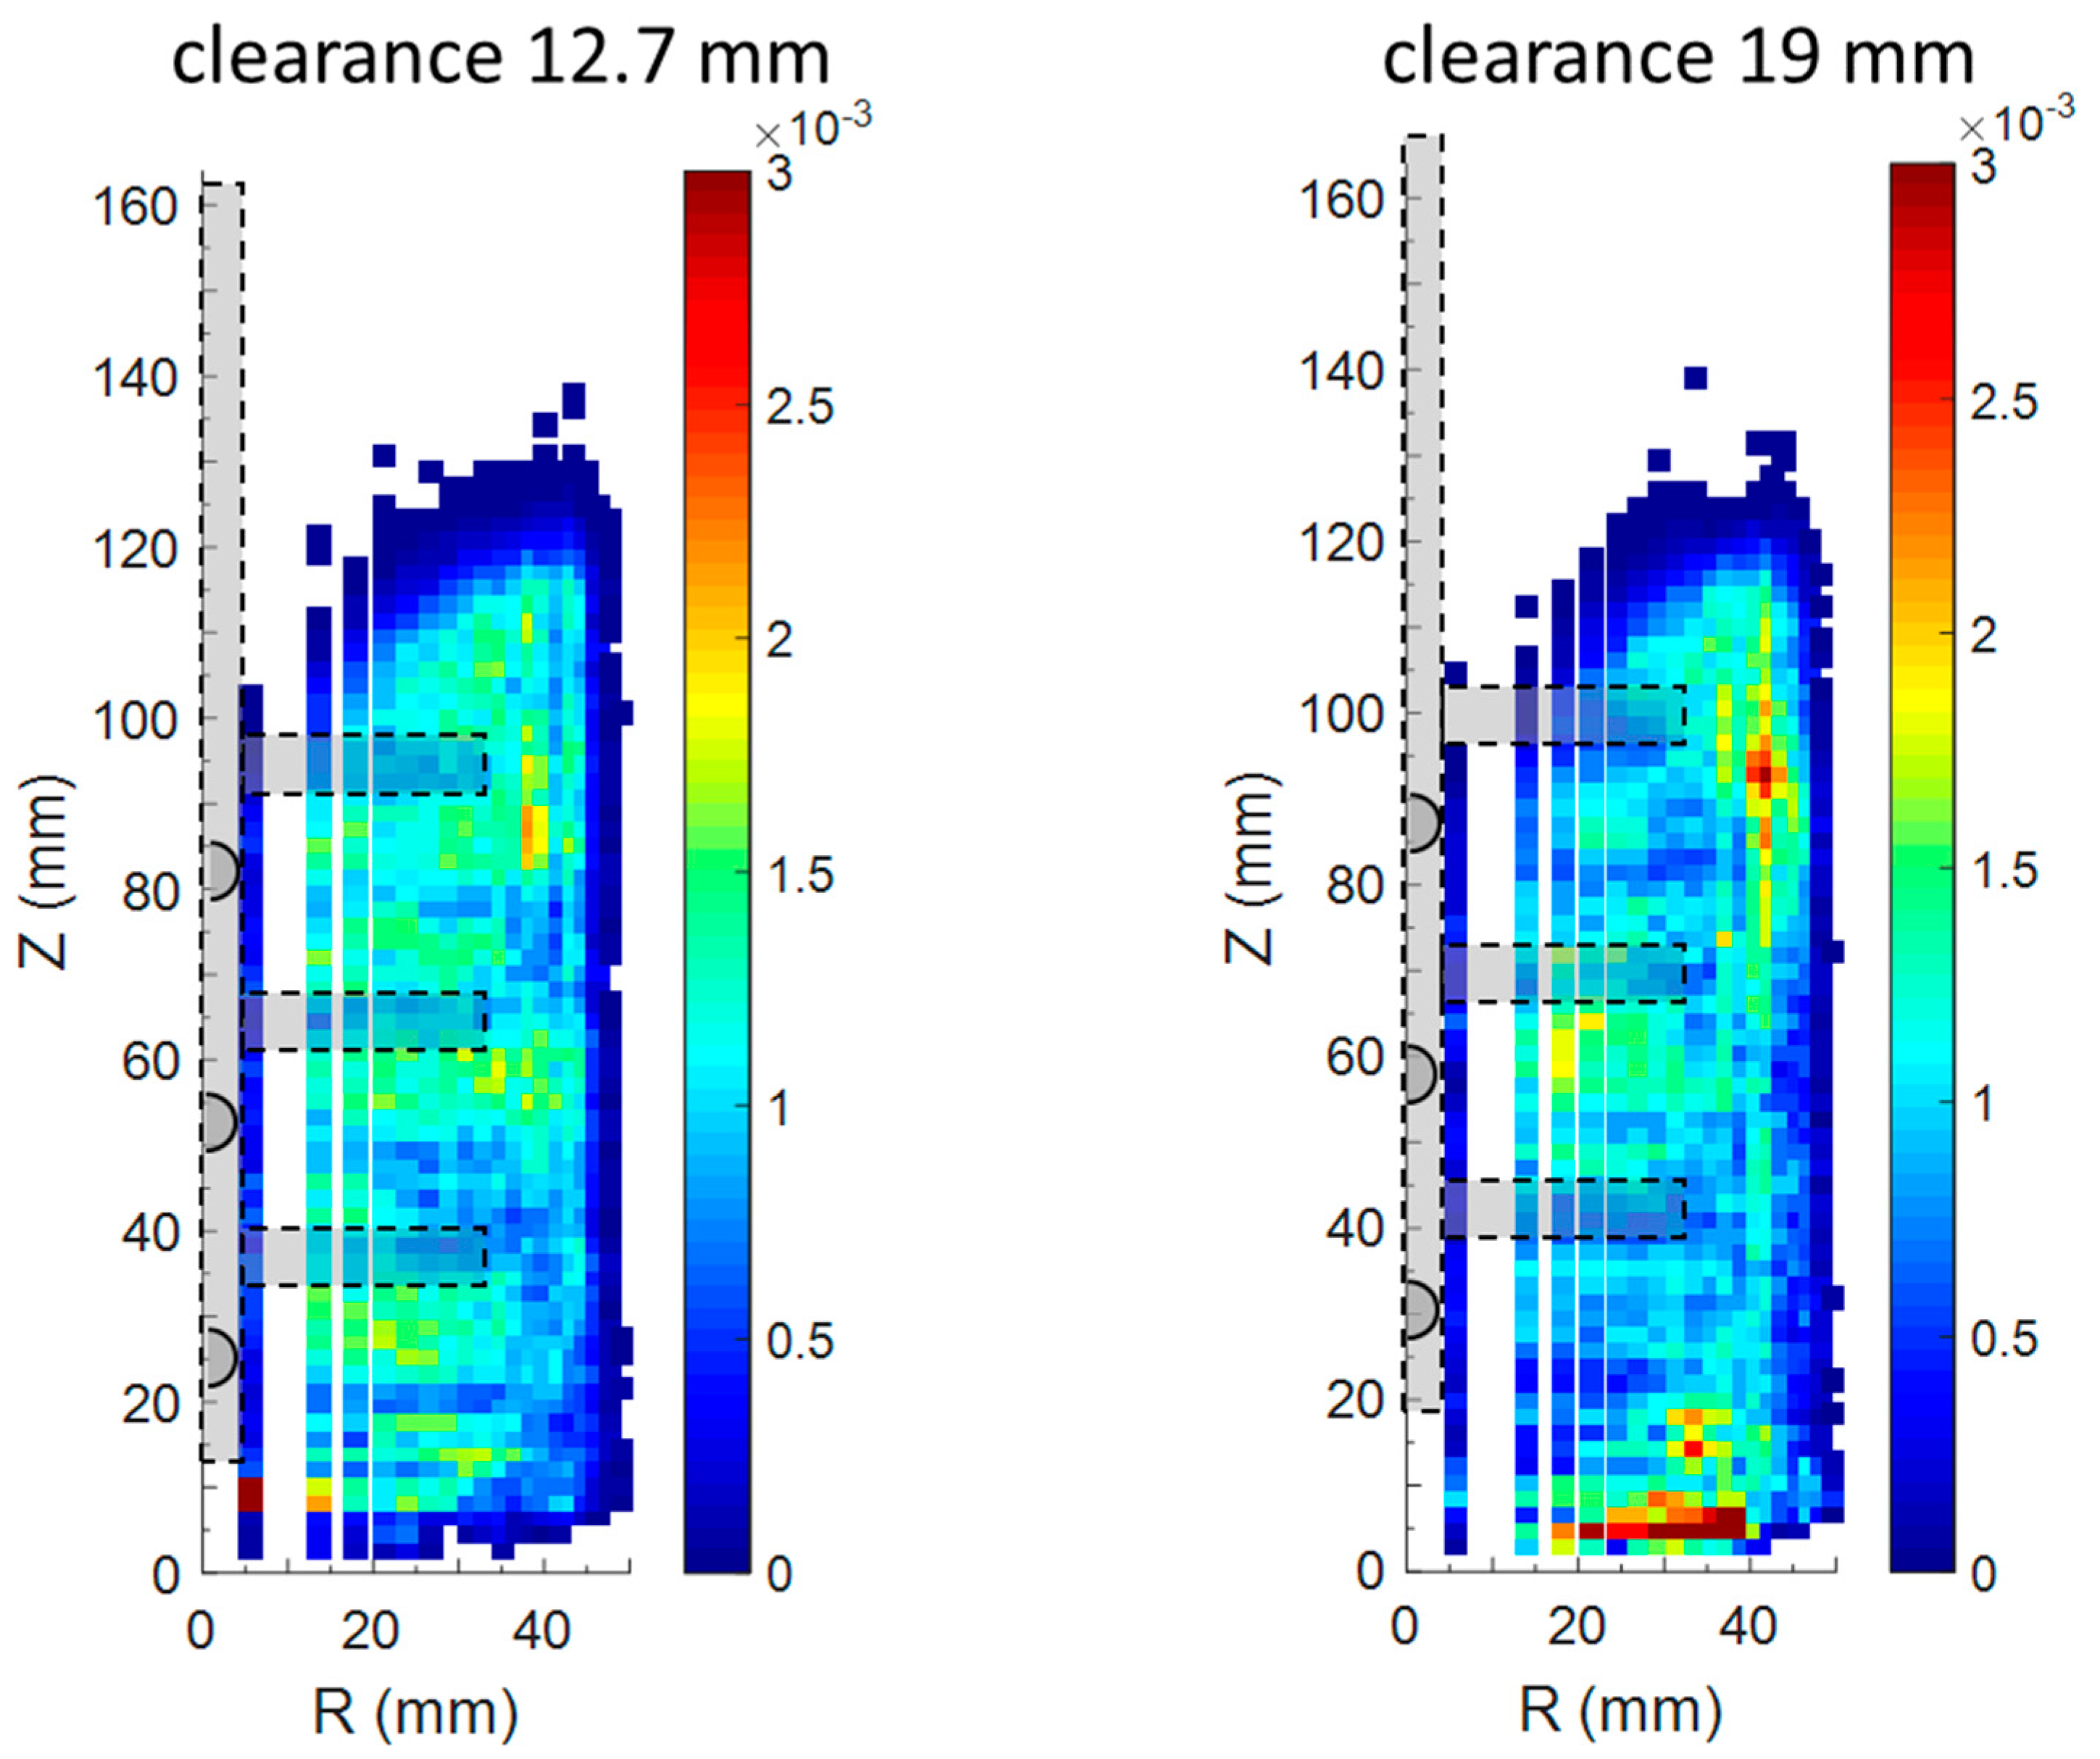
3.2. Effect of the Impeller Clearance Evaluated from PEPT Experiments

As noted above, the bottom of the vessel is an important zone of the mill where the beads had low mobility. The clearance influences the media packing at the bottom of the attritor, therefore, an appropriate value for it should be chosen to avoid jamming, which ultimately translates in high-torque spikes for the shaft. The media motion in the low mobility locations was further investigated as function of the impeller clearance defined as the distance from the base of the impeller to the vessel bottom, as shown in Figure 1b. Two values of clearance were considered for the following discussion: 12.7 mm (1/2 inch) and 19 mm (3/4 inch) which represent the minimum and maximum possible clearance, respectively. By setting the first value, two layers of media (5 mm in diameter) can potentially line-up below the impeller shaft, whereas using the second value there is enough space to accommodate an additional layer of beads, for a total of three layers. The dimensionless velocity maps are illustrated in Figure 7 for the two impeller clearances for the bead loading of 2.4 kg and the impeller speed of 300 rpm. The clearance of 12.7 mm resulted in a slightly higher bead velocity around the impeller pins compared to the clearance of 19 mm and in quite the same bed height. The lower value of clearance also led to the formation of a smaller region at low velocity below the bottom impeller pin compared to the clearance of 19 mm, as highlighted in Figure 7. The reasons for this are fundamentally two: firstly, the lower clearance implies less space available for the bead layers to line-up and thus a smaller region of beads moving at low velocity is expected. Secondly, presumably because of the geometric ratio between the bead size and the bottom distance a media packing with less contact-points was created below the impeller base, resulting in a better bead circulation.
The flow patterns for the two values of the impeller clearance are illustrated in Figure 8 by means of the velocity vector maps. For the same conditions of impeller speed and bead loading, the clearance of 12.7 mm gave rise to a more pronounced upper recirculation loop with higher velocity compared to the value of 19 mm. A possible explanation is that the impeller is immersed slightly deeper in the bed therefore maintains better contact at the top of the bed in the region of the vortex.
A very distinctive part of the velocity map can be observed for the 19 mm clearance with very short arrows existing in the region ranging approximately from 0 < Z < 20 mm, in agreement with the low velocity shown by Figure 7. The short velocity arrows also suggest a poor inter-exchange of media from the bottom of the vessel towards the rest of the pot because of the difficulties of breaking through the ordered balls-configuration of the bottom. This supposition is confirmed by the plot of the normalised occupancy illustrated in Figure 9. For both the impeller clearances the tracer covered most of the pot volume almost uniformly except for the bottom vessel where higher occupancy was observed for the clearance of 19 mm.
Thus, from Figure 9 it can be inferred that for the higher value of clearance once the tracer was able to access to the bottom layers of media it was trapped for a long time before it could be ejected from this region. This is demonstrated in Figure 10 by plotting the axial tracer position (Z) against the time of the PEPT experiment for the two impeller clearance values. Figure 10 highlights that the clearance of 19 mm resulted in roughly the same frequency of tracer visits to the bottom of the mill, but every tracer visit was noticeably longer, up to three minutes, compared to the lower impeller clearance. Therefore, considering that the same bead loading and recording time was used for these two experiments, the data so far presented suggest that the use of the minimum clearance will reduce the size of the region at low velocity located at the attritor bottom.

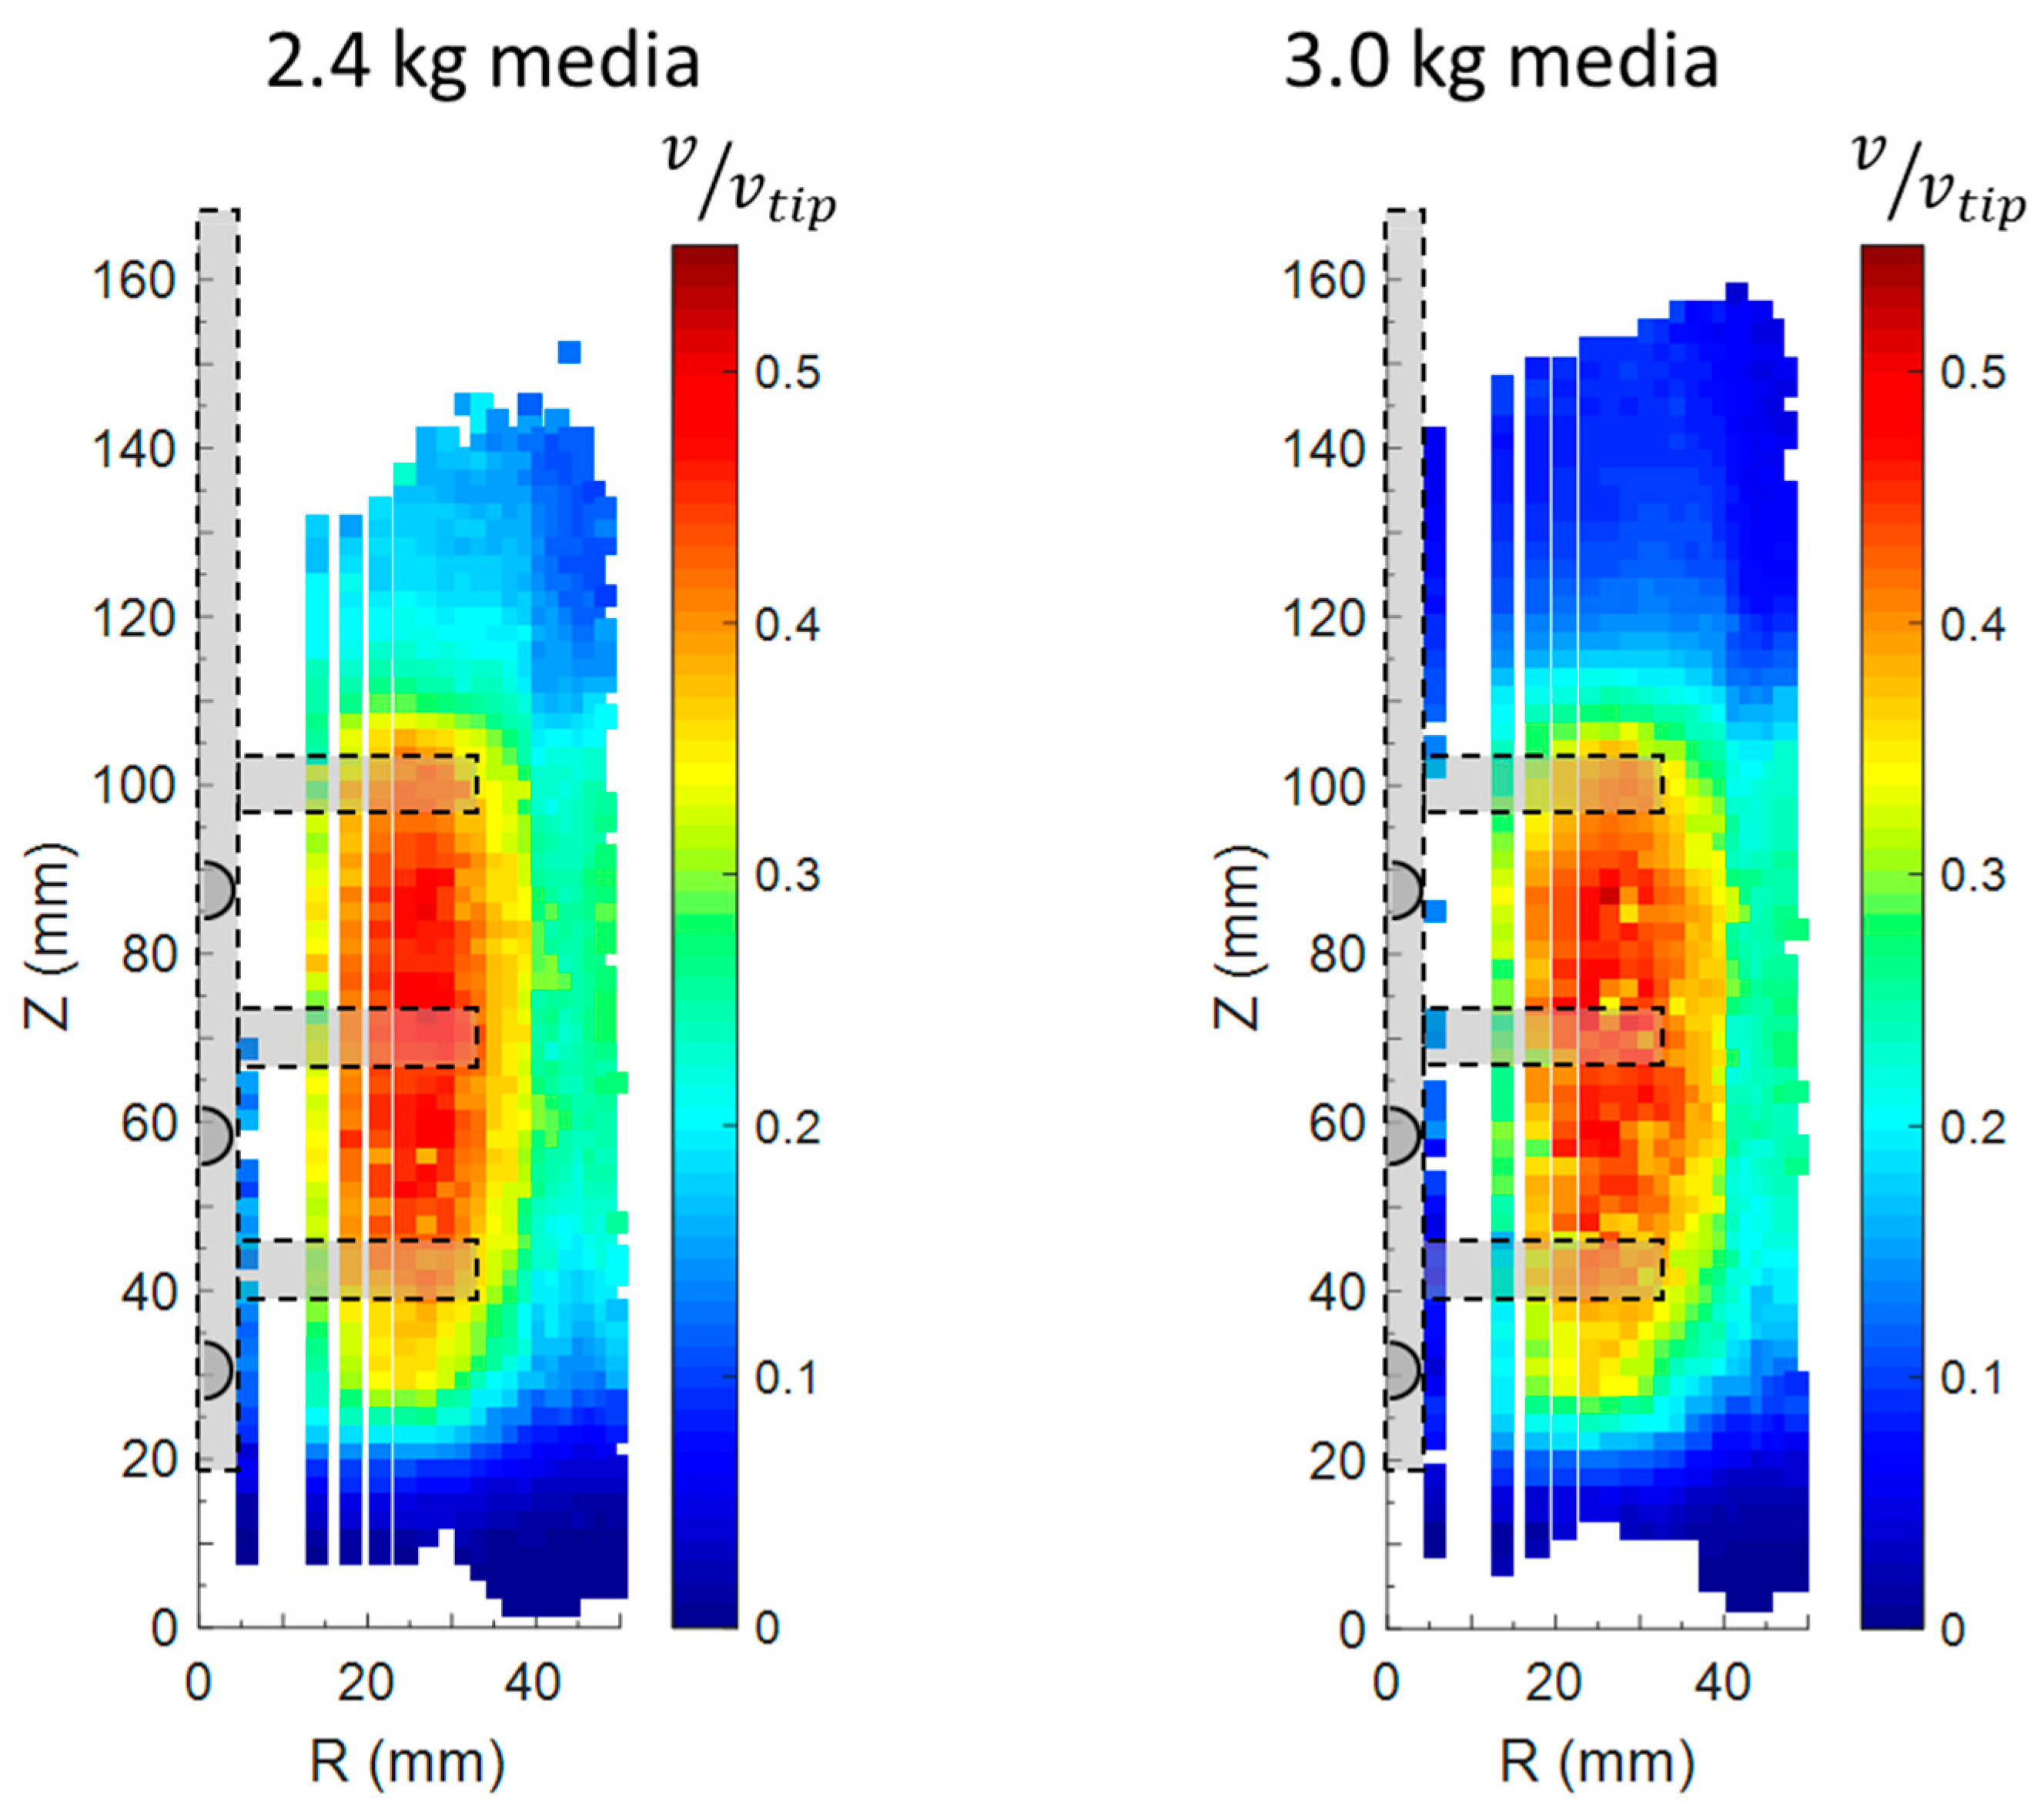
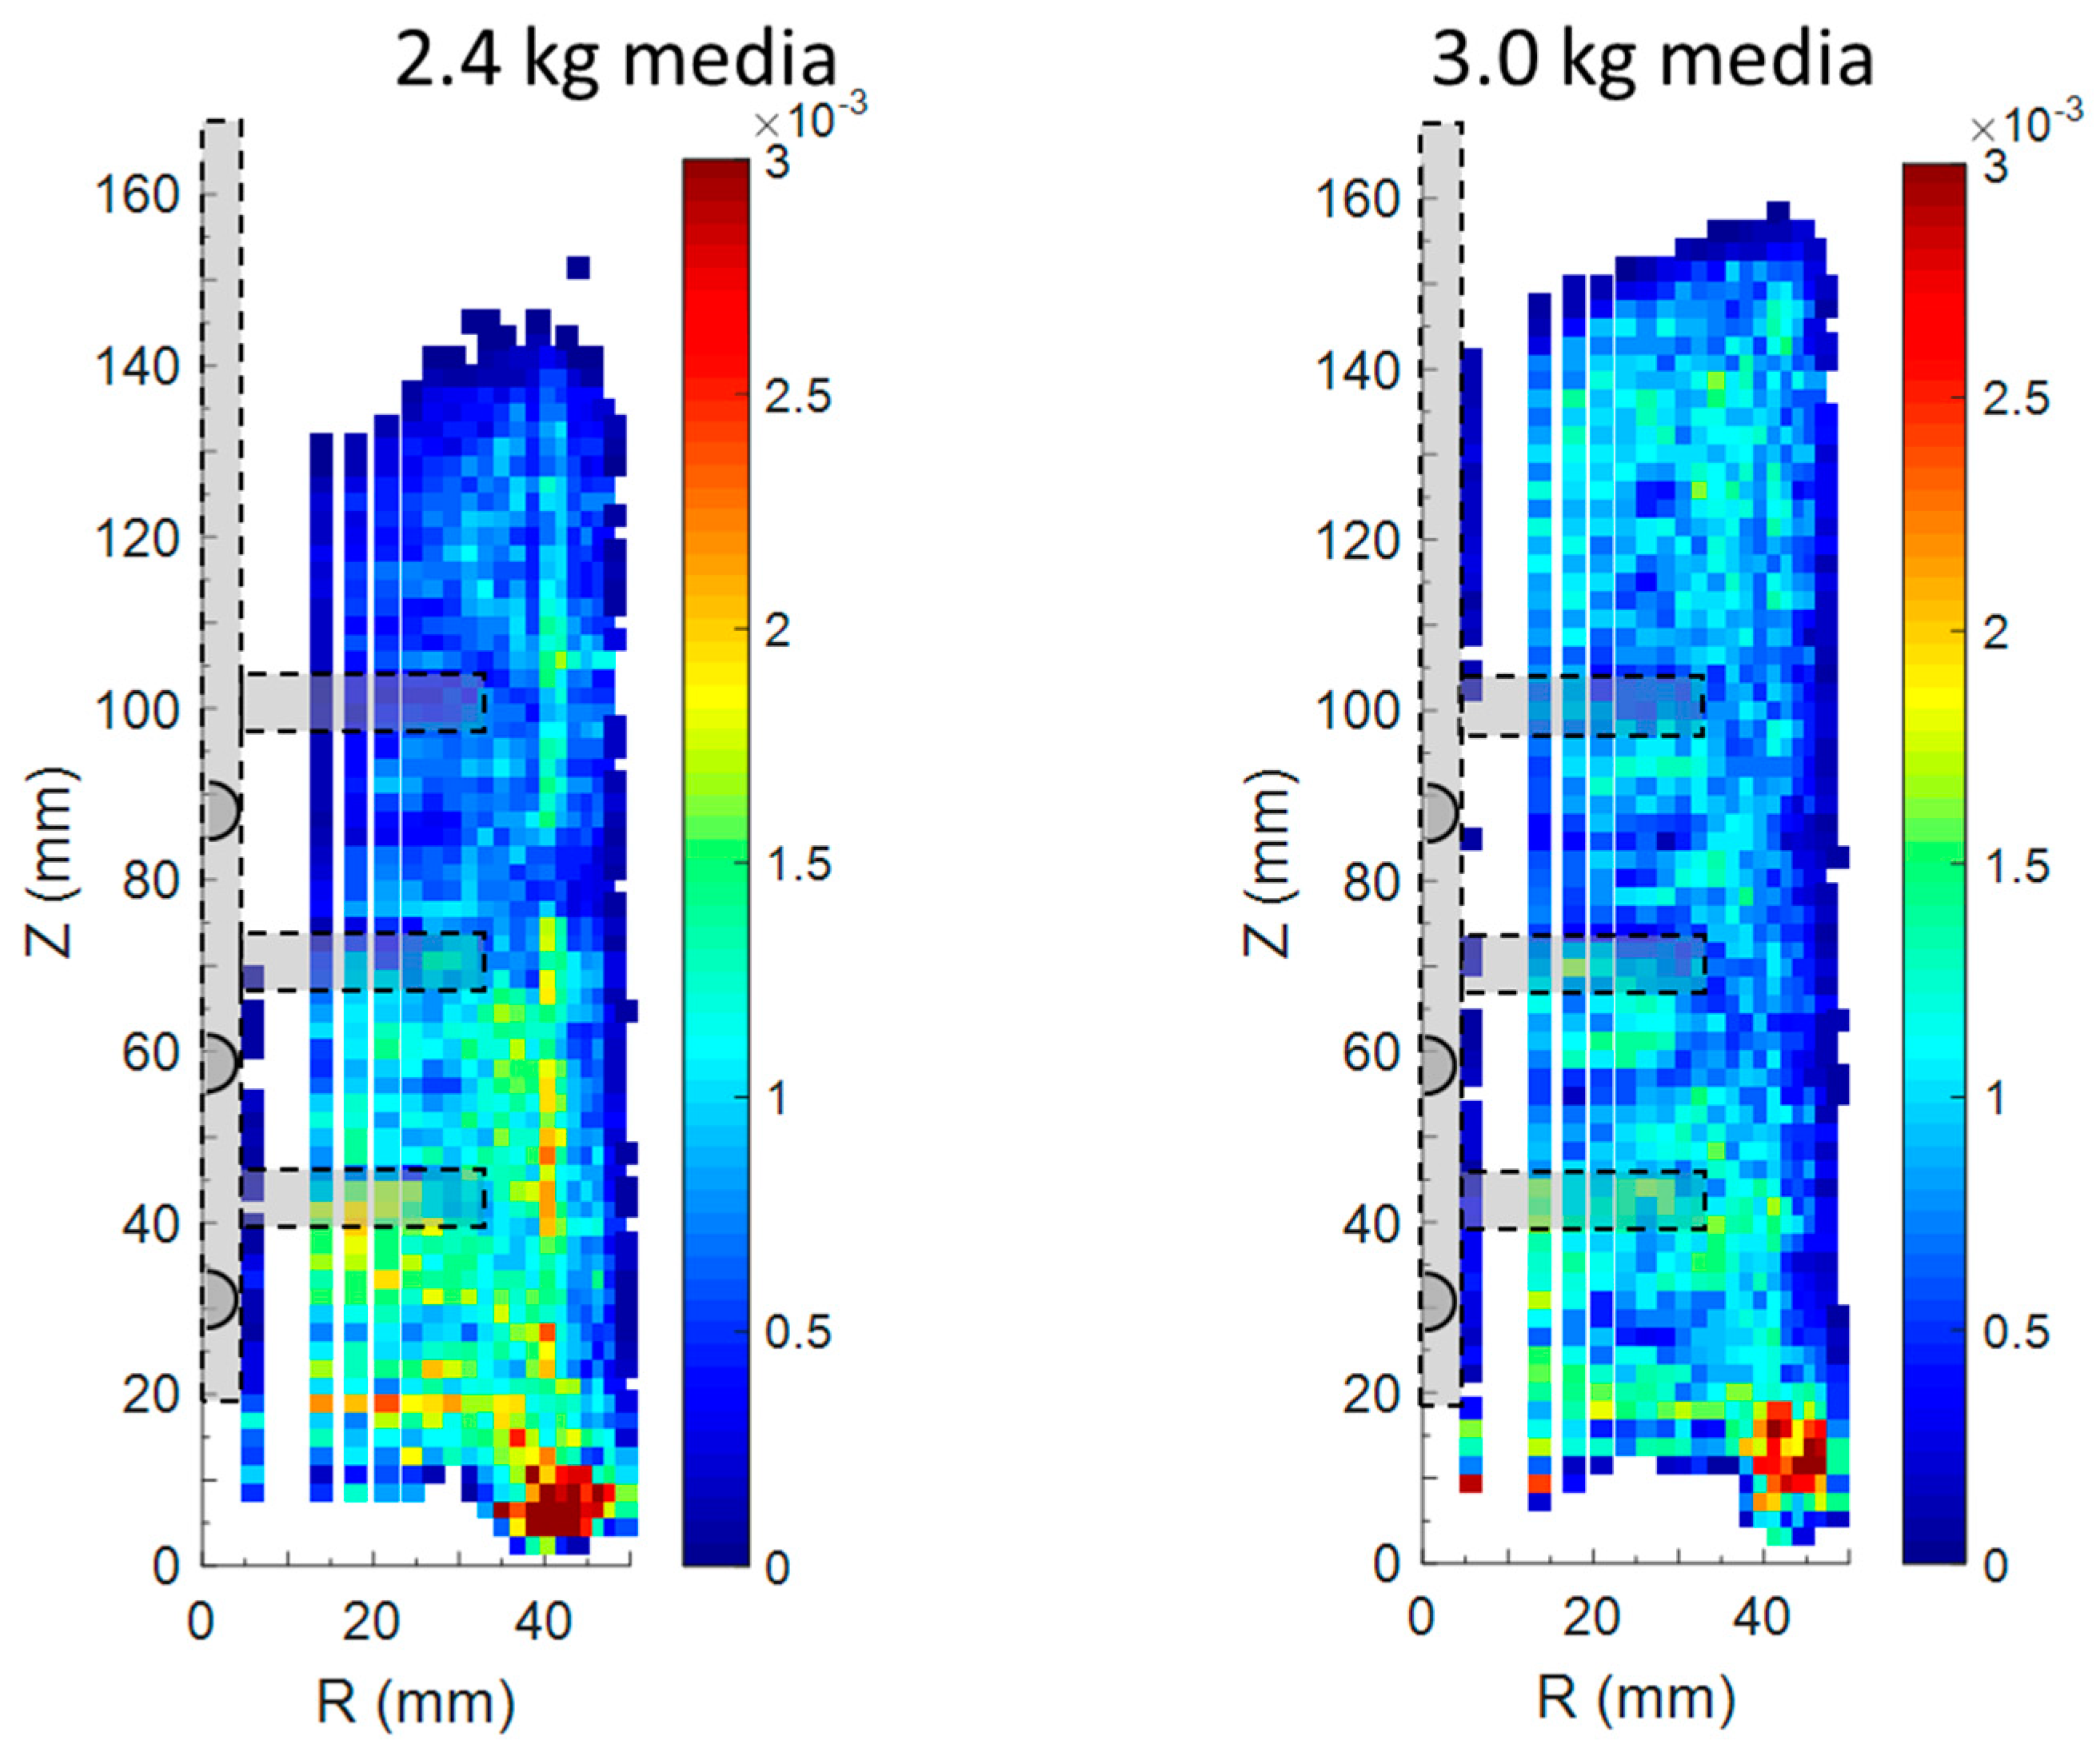
3.3. Effect of the Media Loading Evaluated from PEPT Experiments

In this section, the influence of the bead loading on the flow field is discussed only for the impeller speed of 600 rpm and the clearance of 19 mm. Figure 11 shows the dimensionless velocity magnitude for the bead loading of 2.4 kg and 3.0 kg, respectively.
The increase in the media loading did not affect either the maximum speed or the extent of the region at high velocity but an increase in the average machine power consumption from 0.16 KW to 0.18 KW was observed when the 3.0 kg of media were utilised. Presumably, extra machine power consumption was required to drive and lift the additional beads and provide to them kinetic and potential energy. The increase of the media loading also caused an increase of the bed height with media moving at low velocity above the top impeller pin.
To gather complementary information on the effect of the bead loading on the flow field the normalised occupancy was calculated and reported in Figure 12. The occupancy plot revealed that the tracer distribution within the pot was more homogeneous for the higher than the lower bead loading. This is slightly counter-intuitive since an increase of the bed weight should increase the constraint of the media movements as well. No significant differences in occupancy were observed at the bottom of the attritor where for both the bead loadings the tracer spent a considerably higher amount of time compared to other parts of the pot. Noticeably, for both the media loading a lack of data was seen in the region defined by Z < 10 mm and R < 40 mm (white region at the bottom of the vessel), where the tracer never accessed during the entire time of the experiments. For both these two loadings, at the beginning of the experiments the tracer position was at about 2/3 of the media bed (Z~100 mm), hence the effect of the initial tracer position on the lack of data is excluded. Presumably, this data deficiency is not associated to the effect of the media loading, but instead, as highlighted by the Figure 9 and Figure 10, it may be related to the selection of the clearance.

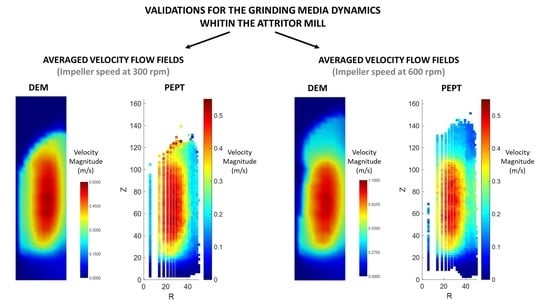
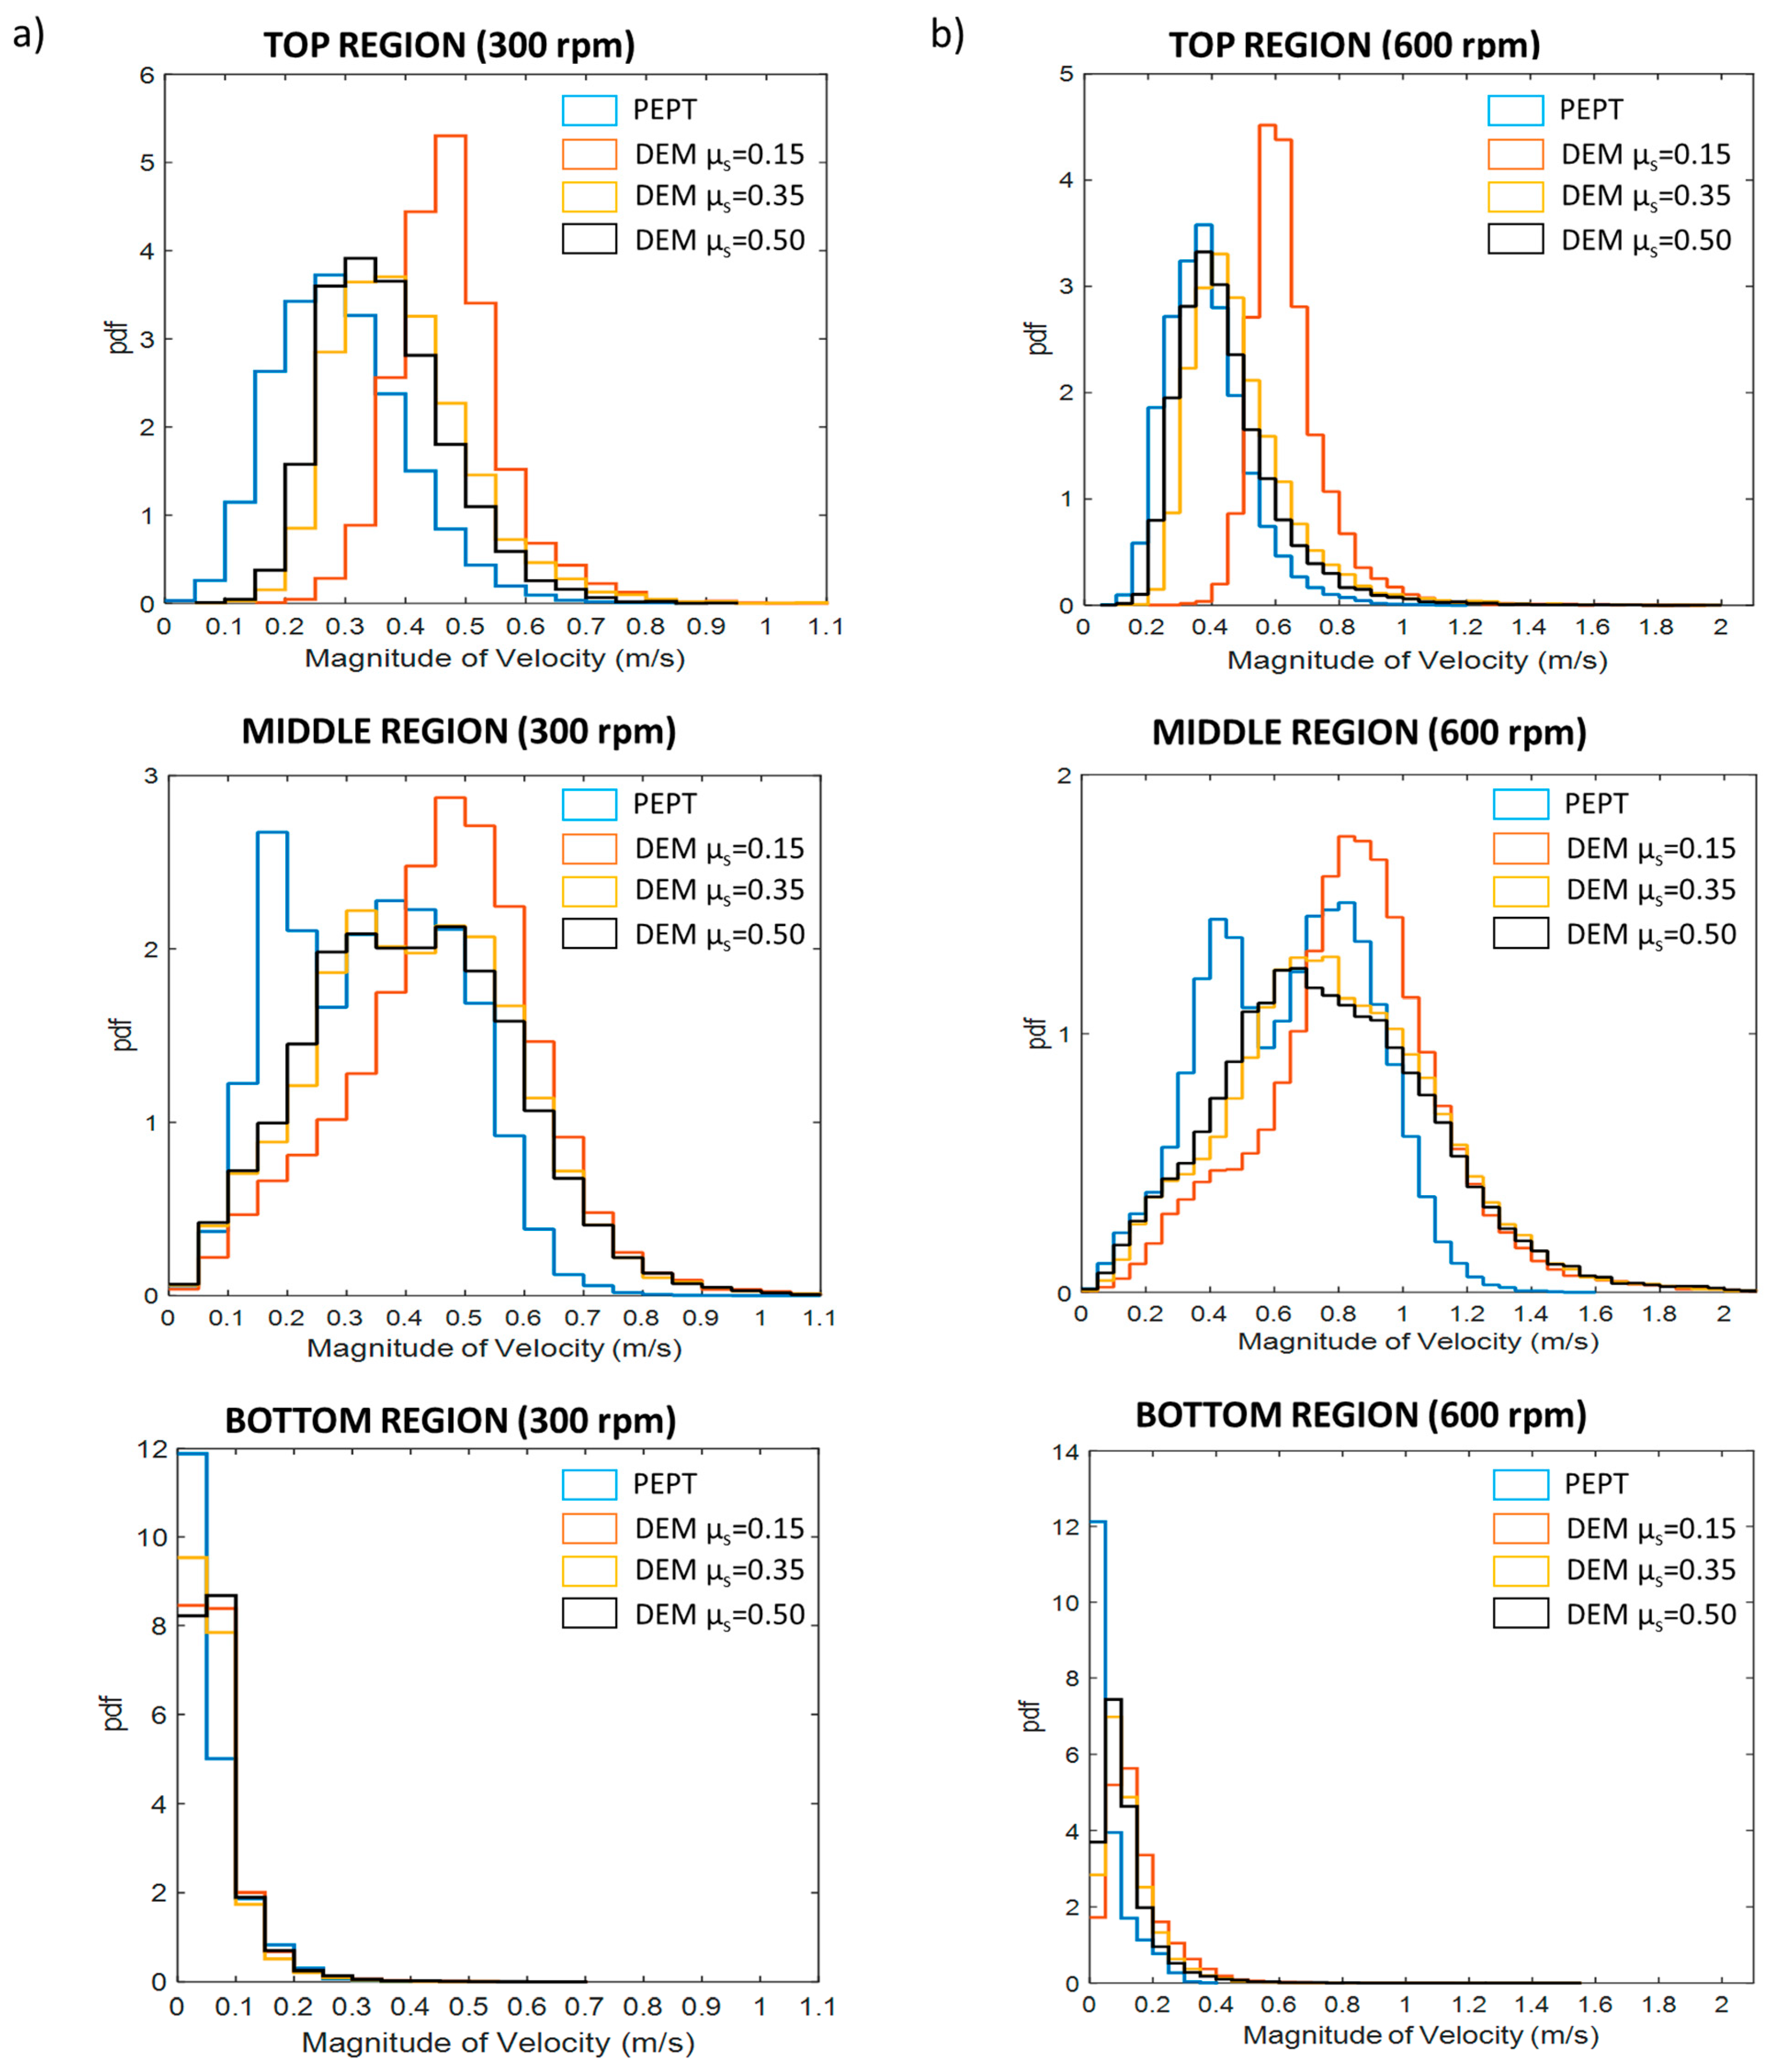
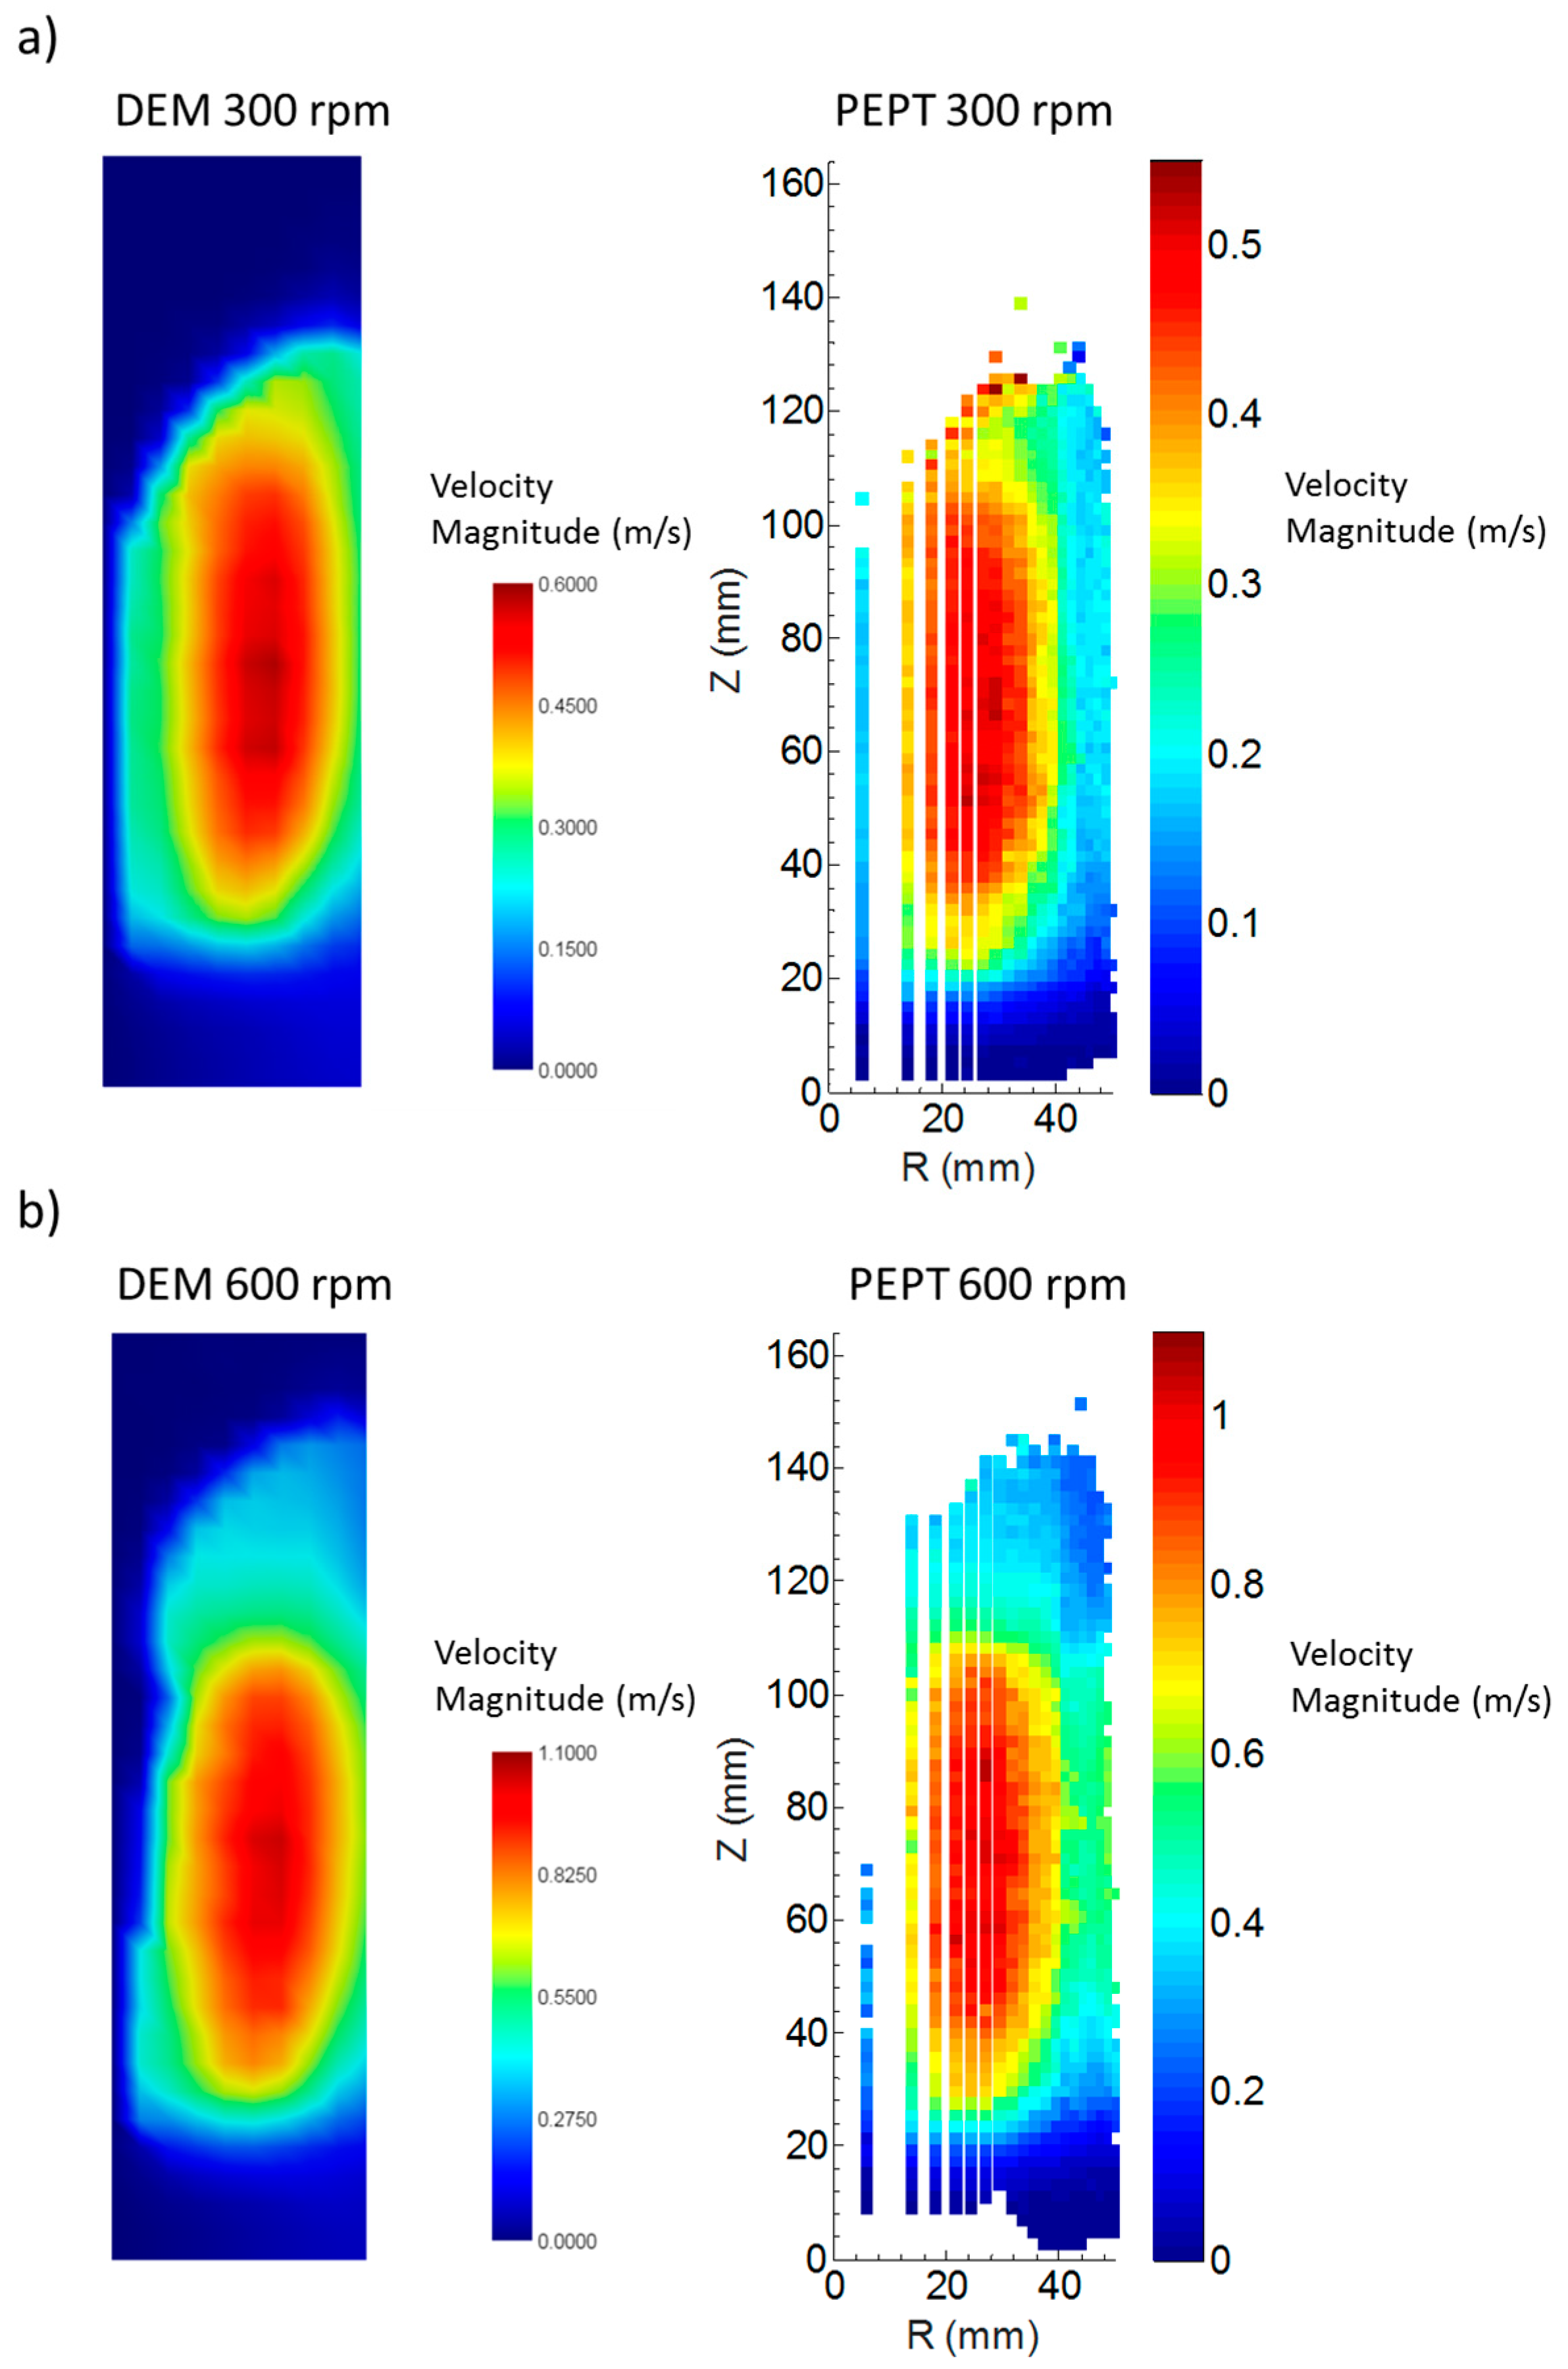
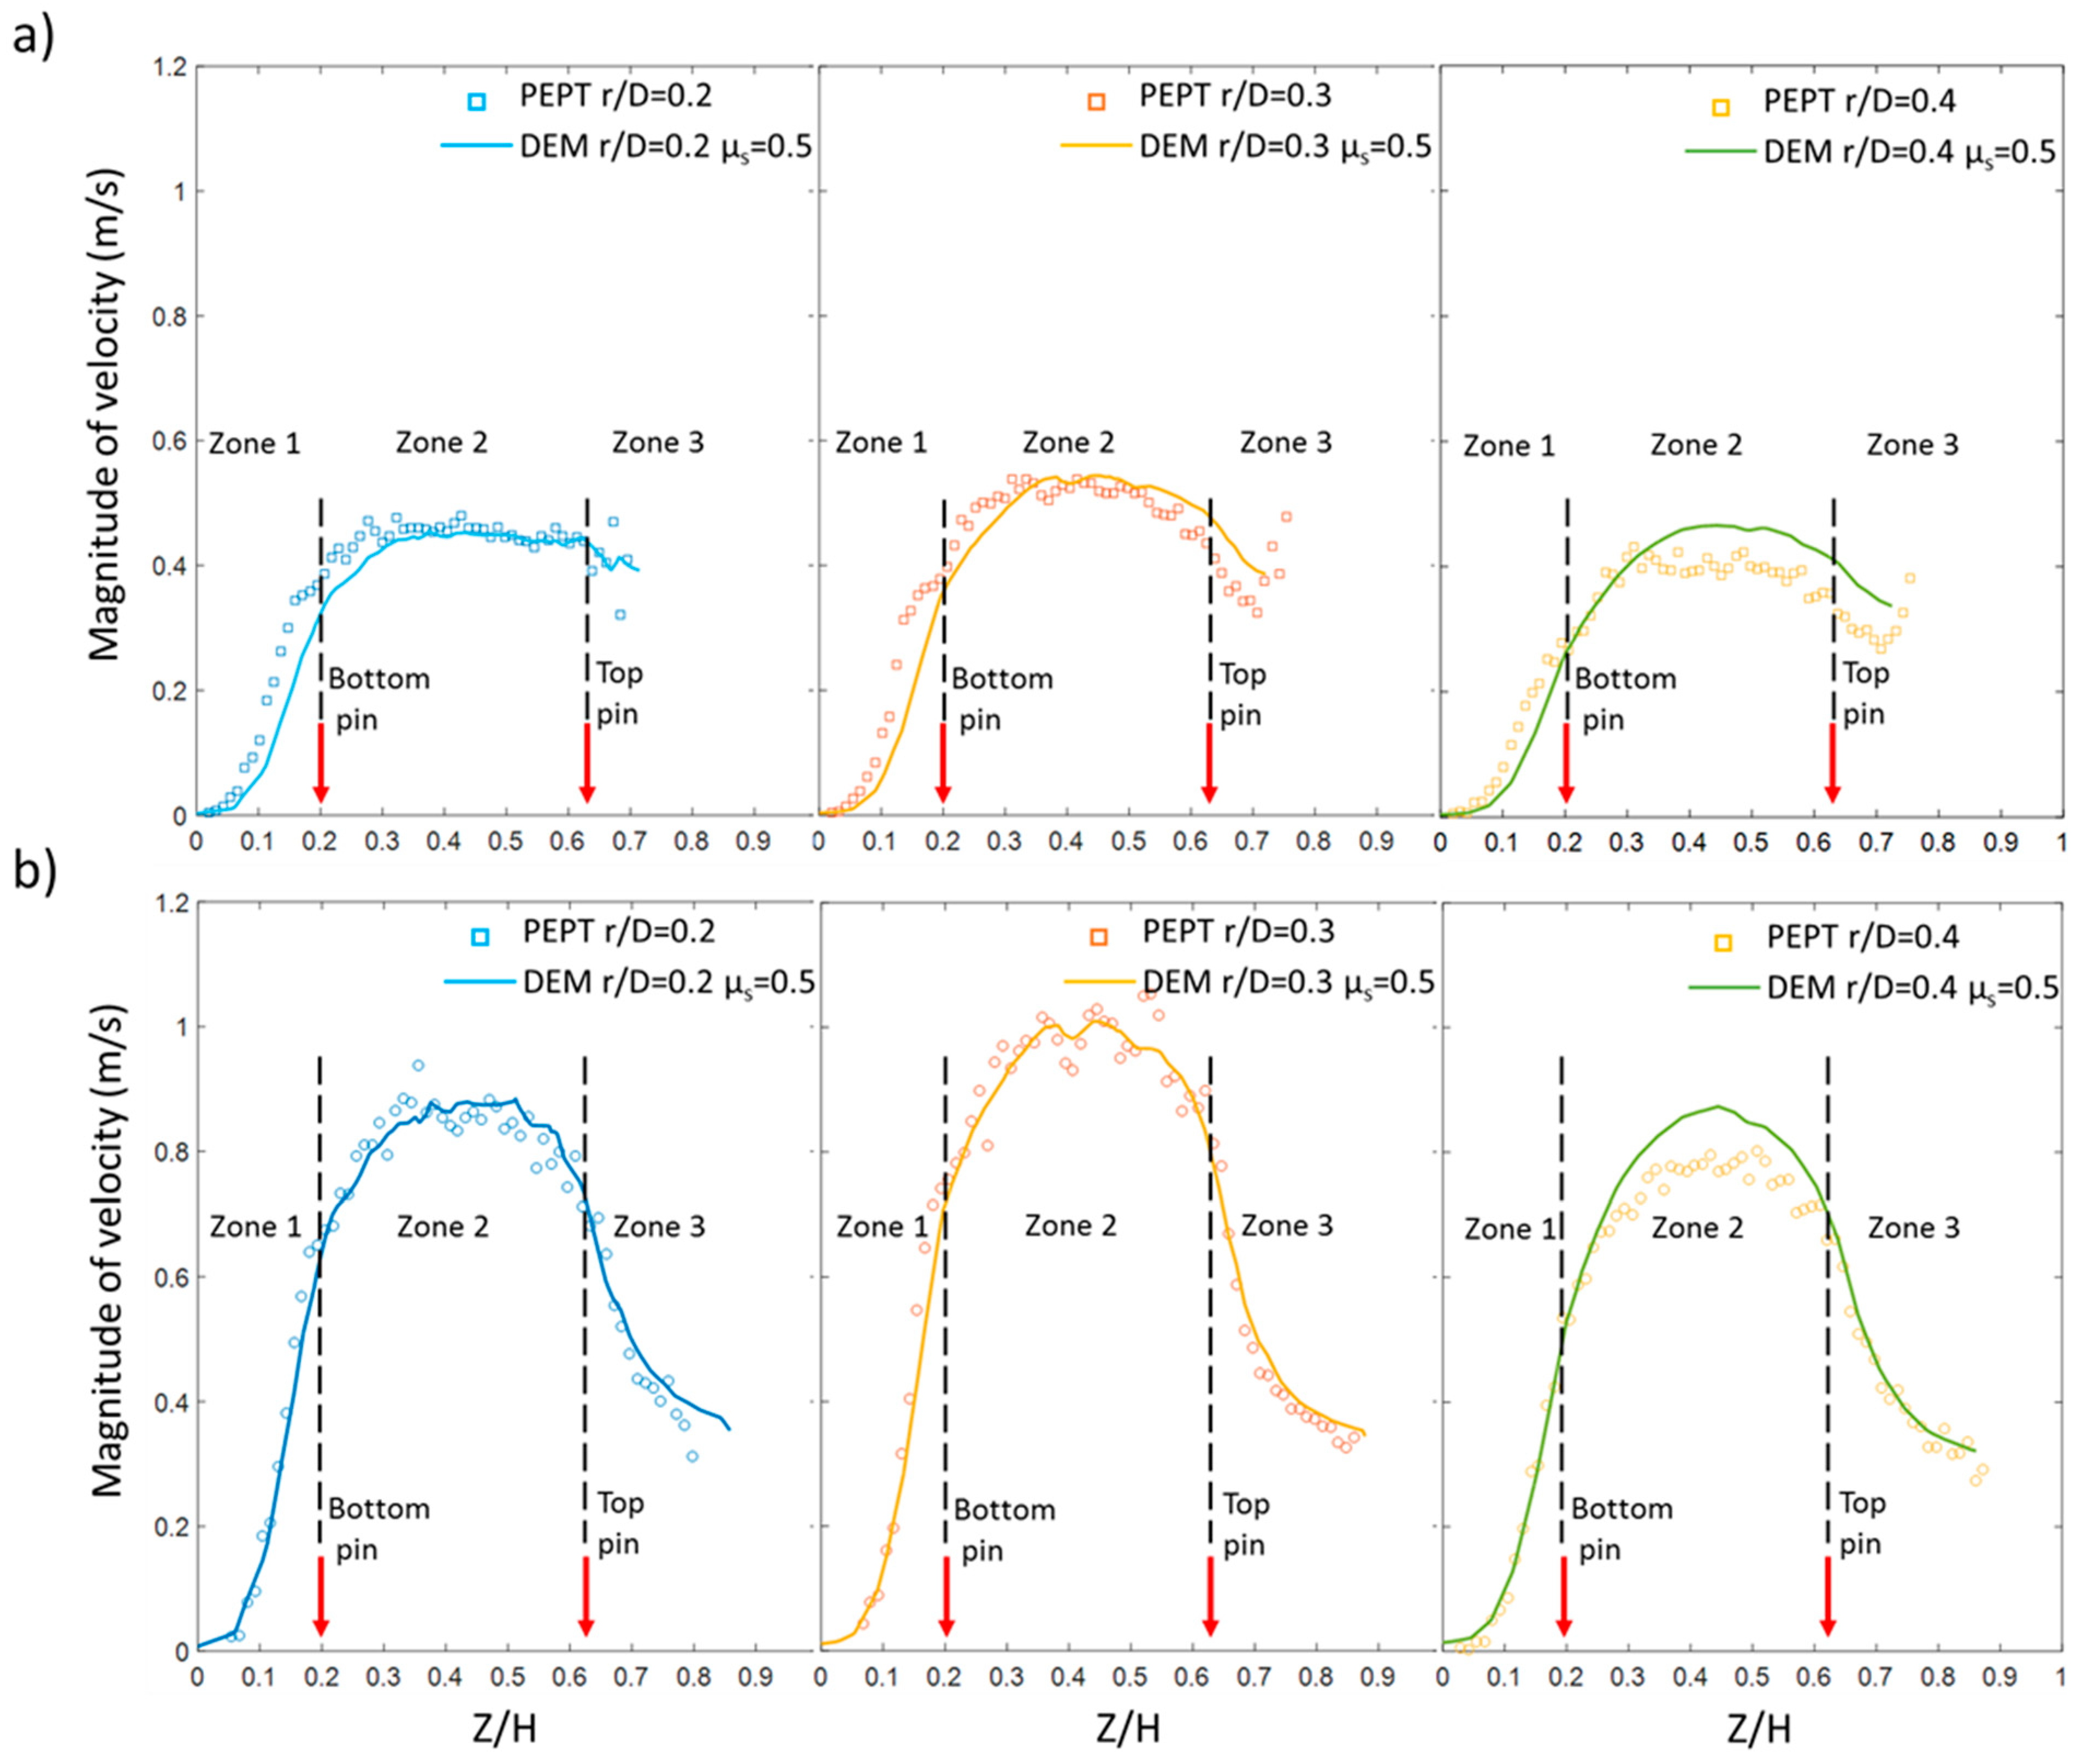
4. Validation of a Static Friction Adjusted-DEM Model by Using Positron Emission Particle Tracking (PEPT) Measurements

Contrary to the PEPT experiments where a single radioactively labelled particle, the tracer, is followed for long time to be representative of the entire system, in a DEM simulation the position and the velocity of every particle can be calculated at the same time. Therefore, due to the nature of the DEM method and the high number of beads present in the system a simulation time of five seconds, corresponding to a minimum of 25 impeller rotations, ensured the generation of steady state and high-quality data. Among the experiments reported in Table 1 two setups were selected for the comparison between PEPT and DEM: 1) bead loading of 2.4 kg, clearance of 19 mm, impeller speed of 300 rpm (experiment number 4 of Table 1) and 2) bead loading of 2.4 kg, clearance of 19 mm, impeller speed of 600 rpm (experiment number 5 of Table 1). For these two cases, the simulations were performed to replicate the exact settings (bead size, geometry, bead loading, impeller speed, clearance) used for the PEPT experiments. The static friction coefficient for the yttria-stabilised zirconia beads was not known a priori and, hence, three values of the friction coefficient (0.15, 0.35 and 0.50) were utilised in the simulations. The best friction coefficient value was then selected by comparing the probability density function (pdf) of the bead velocity calculated by DEM simulations against the one derived from PEPT experiments. As shown so far, by changing one of the operating parameters (impeller speed, bead loading and impeller clearance) different changes of the beads motion will occur in different regions of the mill. For this reason, instead of evaluating the probability density function of the bead velocity for the entire mill, it would be more meaningful to evaluate it for three regions of the equipment which influence directly the grinding media flow. These three regions, illustrated in Figure 13, are: 1) the region above the top impeller pin, 2) the middle region where all the impeller pins are located and 3) the region beneath the impeller base. Figure 13 also shows the velocity histogram for the entire attritor mill as well as for the top, middle and bottom regions calculated using the PEPT data. The plot highlights that the velocity histogram calculated for the entire mill can be seen as the sum of three velocity histograms.
The division of the attritor mill in sub-regions helped both the understanding of the grinding media dynamics and the assessment of the best friction coefficient. The histograms of velocity in the three regions were remarkably dissimilar because of the different mechanisms driving the media motion. In the bottom region, the bead motion was expected to be constrained by the high packing and as consequence of that the beads moved at low velocity. In the middle region, the impeller pins drove the bead motion through continuous collisions, ensuring a wide range of velocity. In the top region, the beads were not directly in contact with the impeller and, hence, the average velocity was substantially lower compared to the middle region. Figure 14 compares the probability density functions of the velocity magnitude for PEPT experiments and DEM simulations as a function of the friction coefficient for two impeller speeds. For the PEPT, the probability density functions of the velocity were calculated using the entire dataset before the azimuthal averaging, whereas for the DEM simulations the last ten consecutive time steps were used.
For both the impeller speeds, the DEM simulations were able to qualitatively match the trends for the probability density function of the velocity derived from PEPT measurements by modifying the static friction coefficient. The friction coefficients of 0.35 and 0.50 led to similar velocity distributions, whereas the lowest friction coefficient equal to 0.15 significantly overestimated the velocity compared to the PEPT data for all the three considered regions. The effect of the friction coefficient on the velocity distribution was greater for the top and middle regions than for the bottom region presumably because of the different conditions of stress within the attritor. In fact, both in the top and the middle regions the grinding media are characterised by moderate bulk density and high shear rate, leading to a fluid-like behaviour of the grinding media [49]. At the bottom region the grinding media are instead characterised by high bulk density and low shear rates and, hence, the grinding media shows a solid-like bulk behaviour [49]. Although generally good prediction was ensured by the static friction coefficient of 0.50, there were some differences in the velocity probability density functions of the DEM simulations and PEPT data. At both the impeller speeds, the DEM slightly overpredicted the velocity within the three regions. As previously observed by [34] in a study of the particle motion within a paddle mixer, the differences between PEPT measurements and DEM simulations are likely to arise from the way the two techniques calculate the bead velocity; PEPT tracks a single bead for long time, while DEM uses the velocity of the entire bead-population over a limited number of simulation time steps. The overprediction of the velocity by DEM could possibly be further reduced if the effect of other commonly calibrated input parameters such as rolling friction or coefficient of restitution was considered; this, however, will considerably increase the number of simulations required for the calibration. It should also be stressed that the predictions of the simulations are expected to improve after the data are averaged for the entire simulation time because of the high number of particle velocities available. Based on the plots of Figure 14 the static friction coefficient of 0.50 was selected as the best value for the three regions and, therefore, used to generate the following results.
The PEPT and the DEM results were further analysed, after an averaging procedure, by a qualitative visualisation of the velocity flow fields and by a quantitative comparison based on the extraction of the velocity magnitude along the height of the attritor at different radial positions. The DEM data were time averaged over 5 s of simulation, by means of a coarse graining method (CG) using the Iota software described above, and projected on a vertical plane passing through the centre of the vessel. The PEPT data were azimuthally averaged as previously explained in Figure 3.
From the qualitative comparison, the simulations captured well the main structures of the flow field which can be summarised in three elements: bed height, position of the regions at low and high velocity and extent of these regions. Indeed, as can be seen from Figure 15 the simulations predicted those three elements at both impeller speeds of 300 rpm and 600 rpm. The colour scale in both DEM- and PEPT- velocity maps indicate low velocity and high velocity with dark blue and red colour, respectively. However, the dark blue region at the top of the DEM-velocity map is an artefact that can lead to misinterpretation. The blue colour in this region does not correspond to beads moving at low velocity, but instead indicates the absence of beads in that region and consequently a velocity equal to zero. This arises from the coarse graining methodology, which requires a volume domain for the average of the simulation data. Taking this into account, Figure 15 demonstrates an excellent agreement between the two techniques, highlighting that the maximum bead velocity was close to 50% of the tip speed value. For example, at 300 rpm the maximum bead velocity was 0.6 m/s (nearly 55% of the tip speed), whereas at 600 rpm it was 1.1m/s (nearly 52% of the tip speed). These data highlight the limitations of using the tip speed as the only parameter to describe the complex velocity field of the granular material. It is further noted that the DEM model was able to reproduce the bed expansion and the shape of the upper part of the packed-bed which is formed due to the generation of a large vortex at the attritor centre as observed in other studies [9,11].
To quantify the agreement between the DEM predictions and the experimental measurements, the media velocity along the vessel height was extracted for two impeller speeds (300 rpm and 600 rpm) at different radial positions. Three dimensionless radial positions (r/D) were considered in Figure 16: r/D = 0.2 which corresponds to a position before the impeller tip, r/D = 0.3 which corresponds to the impeller tip position and r/D = 0.4 which is a position beyond the impeller tip. Figure 16 a) shows the comparison between DEM simulations (continuous line) and PEPT measurements (empty squares) for the impeller speed of 300 rpm.
As expected, the velocity was maximum near the tips of the impeller arms and it was minimum in proximity of the wall where the friction and the high bead-bead contacts reduced the velocity. Both techniques suggest that the velocity profile could be described by three distinct zones: in zone 1, which extends from 0 < (Z/H) < 0.2, the velocity sharply increases; in zone 2, which extends from 0.2 < (Z/H) < 0.6, the velocity reaches a plateau and remains fairly constant; in zone 3, beyond Z/H=0.6, the velocity starts to decrease. The bottom pin, located exactly at Z/H equal to 0.2, was responsible for the sharp velocity increase in zone 1, whereas the rest of the pins ensured the steadiness of the motions in zone 2. Then, the velocity decreases in zone 3 beyond the top pin because the beads’ motion is not directly driven by the impeller, but instead it is controlled by the gravity force and bead–bead friction.
The velocity profile substantially changed for the impeller speed of 600 rpm, as shown in Figure 16b). For this impeller speed, the velocity plateau of zone 2 was smaller and zone 3 was larger compared to the impeller speed of 300 rpm. The increase in size of the latter region was due to the bed expansion as previously also described in Figure 4 and Figure 5. The DEM predictions were in excellent agreement with the PEPT measurements except for a small area of the vessel close to the wall (r/D = 0.4) where for both the impeller speeds the simulations overestimated the speed by about 10%. This small difference in velocity can be caused either by deficiencies of the PEPT technique or by the limitations of using an oversimplified validation procedure based on just one parameter, the static friction coefficient.

5. Conclusions

Positron emission particle tracking (PEPT) was used to investigate the grinding media dynamics in a laboratory-scale attritor mill in absence of powder. The media motion was studied as a function of typical operating parameters: impeller speed, impeller clearance and bead fill level. The PEPT experiments showed that the impeller speed had the strongest influence on the velocity field. An increase of this parameter led toward a development of the upper and lower recirculation loops which are expected to improve the distribution of the material to be ground inside the mill. The impeller clearance was found to affect the size of the region of very low velocity located below the impeller bottom pin. When the impeller clearance was set at the maximum value of 19 mm high tracer occupancy was observed at the bottom of the attritor. This suggests that the increase in clearance favoured the tight packing of the beads which consequently reduced the exchange of beads between this part of the equipment and the rest of the pot. The PEPT experiments also showed that the bead loading had only a minor effect on the beads motion. The increase of the beads weight from 2.4 kg to 3.0 kg did not modify either the maximum velocity or the size of the area of high velocity, but increased the machine power consumption. Among the presented data two PEPT experiments were selected and compared to a Discrete Element Method model of the attritor under the same conditions. A novel methodology, based on the calculation of the probability density function of the bead velocity in three regions of the attritor, was used for the selection of the static friction coefficient. Based on this methodology, for the correct representation of the global beads motion inside the mill the understanding of the motion in sub-regions of the equipment is required. Even after the optimisation of the static friction coefficient to the value of 0.50 differences with the measured velocity were still present. However, after the time and spatial average of the data, the agreement between DEM simulations and PEPT measurements was excellent from both a qualitative and quantitative point of view as remarked by the velocity maps and the profile of velocities along the vessel height. This highlights the capability of the DEM to model complex systems which involves grinding media flow as well as the possibility, once the model is validated, to extract meaningful information on the collision energy spectra of the mill. Despite the overall very good comparison, for a small portion of the vessel, near the wall, the simulations overpredicted by about 10% the beads velocity. This minor discrepancy can be attributed to either deficiencies of the PEPT measurements or to an over simplified validation procedure. An improvement of the current validation strategy can be certainly achieved by adjusting at the same time the static friction coefficient, the Young’s modulus and the coefficient of restitution, but a substantial increase of the computational effort will be necessary. This validated DEM-model will be used for future work to establish relationships between the milling conditions and the material properties after milling. In this framework, the DEM model will support the development of more robust methodologies for the transfer of product formulations to either different milling equipment or at different scales.

Author Contributions

D.D., J.V., A.I., A.A., E.H.S., M.M.; methodology, D.D.; software, D.D., J.V., A.I., A.A., E.H.S., M.M.; formal analysis, D.D.; investigation, D.D.; data curation, D.D.; writing—original draft preparation, D.D., J.V., A.I., A.A., E.H.S., M.M.; writing—review and editing, M.M.; project administration, M.M.; funding acquisition.

Funding

D.D. is currently an Engineering Doctorate (EngD) post-graduate student with the University of Birmingham, UK. D.D. acknowledges the support and funding from the Engineering & Physical Sciences Research Council (EPSRC) UK, grant number EP/L015153/1, and Johnson Matthey PLC.

Conflicts of Interest

The authors declare no conflict of interest.

References

  1. Jankovic, A. Variables affecting the fine grinding of minerals using stirred mills. Miner. Eng. 2003, 16, 337–345. [Google Scholar] [CrossRef]
  2. Shi, F.; Morrison, R.; Cervellin, A.; Burns, F.; Musa, F. Comparison of energy efficiency between ball mills and stirred mills in coarse grinding. Miner. Eng. 2009, 22, 673–680. [Google Scholar] [CrossRef]
  3. Cleary, P.W.; Sinnott, M.D.; Pereira, G.G. Computational prediction of performance for a full scale Isamill: Part 1—Media motion and energy utilisation in a dry mill. Miner. Eng. 2015, 7, 220–238. [Google Scholar] [CrossRef]
  4. Altun, O.; Benzer, H.; Enderle, U. Effects of operating parameters on the efficiency of dry stirred milling. Miner. Eng. 2013, 43, 58–66. [Google Scholar] [CrossRef]
  5. Rydin, R.W.; Maurice, D.; Courtney, T.H. Milling dynamics: Part I. Attritor dynamics: Results of a cinematographic study. Metall. Trans. A 1993, 24, 175–185. [Google Scholar] [CrossRef]
  6. Govender, I.; Cleary, P.W.; Mainza, A.N. Comparisons of PEPT derived charge features in wet milling environments with a friction-adjusted DEM model. Chem. Eng. Sci. 2013, 97, 162–175. [Google Scholar] [CrossRef]
  7. Rosenkranz, S.; Breitung-Faes, S.; Kwade, A. Experimental investigations and modelling of the ball motion in planetary ball mills. Powder Technol. 2011, 212, 224–230. [Google Scholar] [CrossRef]
  8. Hawkesworth, M.R.; Parker, D.J.; Fowles, P.; Crilly, J.F.; Jefferies, N.L.; Jonkers, G. Nonmedical applications of a positron camera, Nuclear Instruments and Methods in Physics Research Section A: Accelerators, Spectrometers. Detect. Assoc. Equip. 1991, 310, 423–434. [Google Scholar] [CrossRef]
  9. Conway-Baker, J.; Barley, R.W.; Williams, R.A.; Jia, X.; Kostuch, J.; McLoughlin, B.; Parker, D.J. Measurement of the motion of grinding media in a vertically stirred mill using positron emission particle tracking (PEPT). Miner. Eng. 2002, 15, 53–59. [Google Scholar] [CrossRef]
  10. Barley, R.W.; Conway-Baker, J.; Pascoe, R.D.; Kostuch, J.; McLoughlin, B.; Parker, D.J. Measurement of the motion of grinding media in a vertically stirred mill using positron emission particle tracking (PEPT) Part II. Miner. Eng. 2004, 17, 1179–1187. [Google Scholar] [CrossRef]
  11. Riley, M.; Pinkney, S.; Blackburn, S.; Rowson, N.A. Spatial distributions of media kinetic energy as measured by positron emission particle tracking in a vertically stirred media mill. Miner. Eng. 2016, 98, 177–186. [Google Scholar] [CrossRef]
  12. Yang, Y.; Rowson, N.; Tamblyn, R.; Ingram, A. Effect of operating parameters on fine particle grinding in a vertically stirred media mill. Sep. Sci. Technol. 2017, 52. [Google Scholar] [CrossRef]
  13. Wilkinson, S.K.; Turnbull, S.A.; Yan, Z.; Stitt, E.H.; Marigo, M. A parametric evaluation of powder flowability using a Freeman rheometer through statistical and sensitivity analysis: A discrete element method (DEM) study. Comput. Chem. Eng. 2017, 97, 161–174. [Google Scholar] [CrossRef]
  14. Yan, Z.; Wilkinson, S.K.; Stitt, E.H.; Marigo, M. Investigating mixing and segregation using discrete element modelling (DEM) in the Freeman FT4 rheometer. Int. J. Pharm. 2016, 513, 38–48. [Google Scholar] [CrossRef]
  15. Marigo, M.; Davies, M.; Leadbeater, T.; Cairns, D.L.; Ingram, A.; Stitt, E.H. Application of Positron Emission Particle Tracking (PEPT) to validate a Discrete Element Method (DEM) model of granular flow and mixing in the Turbula mixer. Int. J. Pharm. 2013, 446, 46–58. [Google Scholar] [CrossRef]
  16. Pantaleev, S.; Yordanova, S.; Janda, A.; Marigo, M.; Ooi, J.Y. An experimentally validated DEM study of powder mixing in a paddle blade mixer. Powder Technol. 2017, 311, 287–302. [Google Scholar] [CrossRef]
  17. Yan, Z.; Wilkinson, S.K.; Stitt, E.H.; Marigo, M. Discrete element modelling (DEM) input parameters: Understanding their impact on model predictions using statistical analysis. Comp. Part. Mech. 2015, 2, 283–299. [Google Scholar] [CrossRef]
  18. Weerasekara, N.S.; Powell, M.S.; Cleary, P.W.; Tavares, L.M.; Evertsson, M.; Morrison, R.D.; Quist, J.; Carvalho, R.M. The contribution of DEM to the science of comminution. Powder Technol. 2013, 248, 3–24. [Google Scholar] [CrossRef]
  19. Powell, M.S.; Govender, I.; McBride, A.T. Applying DEM outputs to the unified comminution model. Miner. Eng. 2008, 21, 744–750. [Google Scholar] [CrossRef]
  20. Yang, R.Y.; Jayasundara, C.T.; Yu, A.B.; Curry, D. DEM simulation of the flow of grinding media in IsaMill. Miner. Eng. 2006, 19, 984–994. [Google Scholar] [CrossRef]
  21. Cleary, P.W.; Morrison, R.D. Understanding fine ore breakage in a laboratory scale ball mill using DEM. Miner. Eng. 2011, 24, 352–366. [Google Scholar] [CrossRef]
  22. Sinnott, M.; Cleary, P.W.; Morrison, R. Analysis of stirred mill performance using DEM simulation: Part 1– Media motion, energy consumption and collisional environment. Miner. Eng. 2006, 19, 1537–1550. [Google Scholar] [CrossRef]
  23. Santhanam, P.R.; Ermoline, A.; Dreizin, E.L. Discrete element model for an attritor mill with impeller responding to interactions with milling balls. Chem. Eng. Sci. 2013, 101, 366–373. [Google Scholar] [CrossRef]
  24. Daraio, D.; Villoria, J.; Ingram, A.; Stitt, E.H.; Marigo, M. Investigating grinding media dynamics inside a vertical stirred mill using the discrete element method: Effect of impeller arm length. Powder Technol. 2019. [Google Scholar] [CrossRef]
  25. Santhanam, P.R.; Dreizin, E.L. Predicting conditions for scaled-up manufacturing of materials prepared by ball milling. Powder Technol. 2012, 221, 403–411. [Google Scholar] [CrossRef]
  26. Cleary, P.W.; Owen, P.J. Using DEM to understand scale-up for a HICOM® mill. Miner. Eng. 2016, 92, 86–109. [Google Scholar] [CrossRef]
  27. Powell, M.S.; Weerasekara, N.S.; Cole, S.; LaRoche, R.D.; Favier, J. DEM modelling of liner evolution and its influence on grinding rate in ball mills. Miner. Eng. 2011, 24, 341–351. [Google Scholar] [CrossRef]
  28. Rikio, S.; Junya, K.; Fumio, S. Analysis of Effect of Pin Configuration on Beads Motion in a Stirred Mill by DEM. J. Soc. Powder Technol. Jpn. 2009, 46, 180–186. [Google Scholar]
  29. Zeng, Y.; Jia, F.; Chen, P.; Qiu, H.; Han, Y.; Meng, X.; Xiao, Y. Effects of convex rib height on spherical particle milling in a lab-scale horizontal rice mill. Powder Technol. 2019, 342, 1–10. [Google Scholar] [CrossRef]
  30. Jayasundara, C.T.; Yang, R.Y.; Guo, B.Y.; Yu, A.B.; Govender, I.; Mainza, A.; van der Westhuizen, A.; Rubenstein, J. CFD–DEM modelling of particle flow in IsaMills—Comparison between simulations and PEPT measurements. Miner. Eng. 2011, 24, 181–187. [Google Scholar] [CrossRef]
  31. Ashrafizadeh, H.; Ashrafizaadeh, M. Influence of processing parameters on grinding mechanism in planetary mill by employing discrete element method. Adv. Powder Technol. 2012, 23, 708–716. [Google Scholar] [CrossRef]
  32. Nakamura, H.; Fujii, H.; Watano, S. Scale-up of high shear mixer-granulator based on discrete element analysis. Powder Technol. 2013, 236, 149–156. [Google Scholar] [CrossRef]
  33. Hassanpour, A.; Tan, H.; Bayly, A.; Gopalkrishnan, P.; Ng, B.; Ghadiri, M. Analysis of particle motion in a paddle mixer using Discrete Element Method (DEM). Powder Technol. 2011, 206, 189–194. [Google Scholar] [CrossRef]
  34. Pasha, M.; Hassanpour, A.; Ahmadian, H.; Tan, H.S.; Bayly, A.; Ghadiri, M. A comparative analysis of particle tracking in a mixer by discrete element method and positron emission particle tracking. Powder Technol. 2015, 270, 569–574. [Google Scholar] [CrossRef]
  35. Fan, X.; Parker, D.J.; Smith, M.D. Labelling a single particle for positron emission particle tracking using direct activation and ion-exchange techniques, Nuclear Instruments and Methods in Physics Research Section A: Accelerators, Spectrometers. Detect. Assoc. Equip. 2006, 562, 345–350. [Google Scholar] [CrossRef]
  36. Parker, D.J.; Allen, D.A.; Benton, D.M.; Fowles, P.; McNeil, P.A.; Tan, M.; Beynon, T.D. Developments in particle tracking using the Birmingham Positron Camera, Nuclear Instruments and Methods in Physics Research Section A: Accelerators, Spectrometers. Detect. Assoc. Equip. 1997, 392, 421–426. [Google Scholar] [CrossRef]
  37. Parker, D.J.; Forster, R.N.; Fowles, P.; Takhar, P.S. Positron emission particle tracking using the new Birmingham positron camera, Nuclear Instruments and Methods in Physics Research Section A: Accelerators, Spectrometers. Detect. Assoc. Equip. 2002, 477, 540–545. [Google Scholar] [CrossRef]
  38. Parker, D.J.; Hawkesworth, M.R.; Broadbent, C.J.; Fowles, P.; Fryer, T.D.; McNeil, P.A. Industrial positron-based imaging: Principles and applications, Nuclear Instruments and Methods in Physics Research Section A: Accelerators, Spectrometers. Detect. Assoc. Equip. 1994, 348, 583–592. [Google Scholar] [CrossRef]
  39. PEPT Date—University of Birmingham. Available online: https://www.birmingham.ac.uk/research/activity/physics/particle-nuclear/positron-imaging-centre/pept-data/pept-data.aspx (accessed on 7 October 2019).
  40. Chiti, F.; Bakalis, S.; Bujalski, W.; Barigou, M.; Eaglesham, A.; Nienow, A.W. Using positron emission particle tracking (PEPT) to study the turbulent flow in a baffled vessel agitated by a Rushton turbine: Improving data treatment and validation. Chem. Eng. Res. Des. 2011, 89, 1947–1960. [Google Scholar] [CrossRef]
  41. Cundall, P.A.; Strack, O.D.L. A discrete numerical model for granular assemblies. Géotechnique 1979, 29, 47–65. [Google Scholar] [CrossRef]
  42. Jayasundara, C.T.; Yang, R.Y.; Yu, A.B. Effect of the size of media on grinding performance in stirred mills. Miner. Eng. 2012, 33, 66–71. [Google Scholar] [CrossRef]
  43. Zhou, Y.C.; Wright, B.D.; Yang, R.Y.; Xu, B.H.; Yu, A.B. Rolling friction in the dynamic simulation of sandpile formation. Phys. A Stat. Mech. Appl. 1999, 269, 536–553. [Google Scholar] [CrossRef]
  44. Yang, R.Y.; Zou, R.P.; Yu, A.B. Microdynamic analysis of particle flow in a horizontal rotating drum. Powder Technol. 2003, 130, 138–146. [Google Scholar] [CrossRef]
  45. Cleary, P.W. Predicting charge motion, power draw, segregation and wear in ball mills using discrete element methods. Miner. Eng. 1998, 11, 1061–1080. [Google Scholar] [CrossRef]
  46. Yamamoto, Y.; Soda, R.; Kano, J.; Saito, F. Application of DEM modified with enlarged particle model to simulation of bead motion in a bead mill. Particuology 2014, 14, 103–108. [Google Scholar] [CrossRef]
  47. Misra, A.; Cheung, J. Particle motion and energy distribution in tumbling ball mills. Powder Technol. 1999, 105, 222–227. [Google Scholar] [CrossRef]
  48. Weinhart, T.; Labra, C.; Luding, S.; Ooi, J.Y. Influence of coarse-graining parameters on the analysis of DEM simulations of silo flow. Powder Technol. 2016, 293, 138–148. [Google Scholar] [CrossRef]
  49. Babic, M. Average balance equations for granular materials. Int. J. Eng. Sci. 1997, 35, 523–548. [Google Scholar] [CrossRef]
  50. Goldhirsch, I. Stress, stress asymmetry and couple stress: From discrete particles to continuous fields. Granul. Matter 2010, 12, 239–252. [Google Scholar] [CrossRef]
Figure 1. Experimental rig: (a) attritor mill HD1 (Union Process, Akron, OH, USA) with a schematic of the vessel showing the pin positions for the clearance of 12.7 mm (1/2 inch) and (b) PEPT scanner (University of Birmingham, Birmingham, UK).
Applsci 09 04816 g001
Figure 2. Example for a PEPT raw dataset representing the tracer particle position along the Z direction (vertical axis) over time for the impeller speed of 300 rpm.
Applsci 09 04816 g002
Figure 3. Schematic of the 2D grid utilised for the azimuthal average of the PEPT data.
Applsci 09 04816 g003
Figure 4. PEPT dimensionless velocity magnitude (v/vtip) at the different impeller speeds of 300 rpm, 450 rpm and 600 rpm. Test case using the bead loading of 2.4 kg and the bottom clearance of 12.7 mm.
Applsci 09 04816 g004
Figure 5. PEPT velocity vector maps for the impeller speed of 300 rpm, 450 rpm and 600 rpm highlighting the recirculation patterns within the attritor. Test case using the bead loading of 2.4 kg and the bottom clearance of 12.7 mm.
Applsci 09 04816 g005
Figure 6. PEPT normalised tracer occupancy plot at the impeller speed of 300 rpm, 450 rpm and 600 rpm. Test case using the bead loading of 2.4 kg and the bottom clearance of 12.7 mm.
Applsci 09 04816 g006
Figure 7. PEPT dimensionless velocity magnitude (v/vtip) for two values of clearance: 12.7 mm and 19 mm. Test case using the bead loading of 2.4 kg and the impeller speed of 300 rpm.
Applsci 09 04816 g007
Figure 8. PEPT velocity vector maps for two values of clearance: 12.7 mm and 19 mm. Test case using the bead loading of 2.4 kg and the impeller speed of 300 rpm.
Applsci 09 04816 g008
Figure 9. PEPT normalised tracer occupancy plot for two values of clearance: 12.7 mm and 19 mm. Test case using the bead loading of 2.4 kg and the impeller speed of 300 rpm.
Applsci 09 04816 g009
Figure 10. Axial tracer position (Z) as function of the time of the PEPT experiments for two impeller clearance values: (a) 12.7 mm and (b) 19 mm. The impeller position is represented by the red straight line.
Applsci 09 04816 g010
Figure 11. PEPT dimensionless velocity magnitude (v/vtip) for two bead loading: 2.4 kg and 3.0 kg of media. Test case using the clearance of 19 mm and the impeller speed of 600 rpm.
Applsci 09 04816 g011
Figure 12. PEPT normalised tracer occupancy plot for two bead loading: 2.4 kg and 3.0 kg of media. Test case using the clearance of 19 mm and the impeller speed of 600 rpm.
Applsci 09 04816 g012
Figure 13. Histogram of the velocity magnitude for the attritor mill and for three sub-domains of the mill: top region, middle region and bottom region. PEPT test case using the bead loading of 2.4 kg, the impeller clearance of 19 mm and the impeller speed of 300 rpm.
Applsci 09 04816 g013
Figure 14. Probability density functions (pdf) of the velocity magnitude calculated for the top, middle and bottom regions. Comparison between PEPT data and DEM simulations as function of the static friction coefficient for the impeller speed of (a) 300 rpm and (b) 600 rpm.
Applsci 09 04816 g014
Figure 15. Comparison of the velocity flow field for DEM simulations and PEPT data at the impeller speed of (a) 300 rpm and (b) 600 rpm.
Applsci 09 04816 g015
Figure 16. Velocity magnitude along the dimensionless attritor height (Z/H) for three dimensionless radial positions (r/D: 0.2, 0.3, 0.4). Comparison between DEM results and PEPT data at the impeller speed of (a) 300 rpm and (b) at 600 rpm.
Applsci 09 04816 g016
Table 1. Detail of the mill dimensions.
Dimensions (mm)Material
Mill chamber Yttria-stabilised zirconia
Height164
Diameter90
Impeller arms Yttria-stabilised zirconia
Diameter66
Grinding media Yttria-stabilised zirconia
Diameter5
Table 2. Experimental conditions: impeller speed, bead loading and impeller bottom clearance.
NImpeller Speed
(rpm)
Bead Loading
(kg)
% Chamber Filling (volumetric)Bottom Clearance (mm)
16003.07712.7
23003.07712.7
33003.07715.9
43002.46119
56002.46119
66003.07719
73003.07719
84502.76919
93002.46112.7
104502.46112.7
116002.46112.7
123002.76915.9
Table 3. DEM input parameters.
Material ParametersSymbolsValues
Media ball radius (mm)r2.5
Media ball density (Kg/m3)ρ5950
Young modulus (Pa)E2.1 × 10 7
Poisson’s ratio (-)ν0.3
Coefficient of restitution (-)ε0.7
Static friction coefficient (-)μs0.15, 0.35, 0.50
Rolling friction coefficient (-)μr0

