4.2.1. Heavy-Hitters Data Acquisition Module
HH-DAM is responsible for performing two tasks. Firstly, it captures packets from some observation point in the network devices. That means a monitoring task needs to be carried out to collect and report network states in the data plane. Secondly, it generates a dataset for HH identification from the collected packets. In HH-DAM, since we do not implement the monitoring task, we build up the HH-identification dataset from a publicly accessible traffic trace collected in a university DCN, named UNIV1 [
64]. UNIV1 was processed and organised into flow records by using the flowRecorder tool with an expiration time (
fito) set to 15 s and 150 s. We wrote this tool in Python to turn IP packets, either in the form of PCAP (Packet CAPture) files or sniffed live from a network interface, into flow records that are stored in a CSV (Comma-Separated Values) file. Our flowRecorder supports the measurement of flow features in both unidirectional and bidirectional modes. Depending on the properties of the observed (incoming) packets, either new flow records were created or the flow features of existing ones were updated.
Table 3 and
Table 4 show the UNIV1 flows dataset size distributions obtained using flowRecorder with
fito = 15 s and
fito = 15 s. To get details and use this tool, we invite the reader to review [
25].
Regarding the monitoring task, it is important to highlight that to avoid the SDN controller overload regarding traffic and processing caused by gathering statistics from a central point and aiming at getting better performance in collecting and reporting the network flows state, we plan in a future work to use Inband Network Telemetry (INT) [
65] by using the Programmable, Protocol-independent Packet Processor (P4). P4 was created as a common language to describe how packets should be processed by all manner of programmable packet-processing targets, from general-purpose CPUs, NPUs, FPGAs, and high-performance programmable ASICs [
59]. The main advantages of P4 are:
(i) protocol independence meaning that collecting network devices information should be protocol agnostic,
(ii) target independence indicating programmers should be able to describe packet-processing functionality independently of the underlying hardware; and
(iii) reconfigurability in the field highlighting programmers should be able to change the way switches process packets after their deployment in the network.
4.2.2. Heavy-Hitters Data Acquisition Module
HH-DANM is in charge of storing and generating a network traffic state model targeted to identify HHs smartly. To carry out this module, we performed a clustering-based analysis, on the UNIV1 dataset, targeted to determine the optimal threshold that would separate the flows into HHs and non-HHs. We performed this analysis since there is no generally accepted and widely recognised uniform threshold for HHs detection. Indeed, different works use different thresholds without detailed or systematic justification. Some examples of such unjustified citation chains include Xu et al. [
66], Munir et al. [
67] ⇒ Hong et al. [
68] ⇒ Alizadeh et al. [
69]; Cui et al. [
62] ⇒ Wu et al. [
70] ⇒ Greenberg et al. [
71]; and Al-Fares [
15] Peng-Xiao et al. [
2] ⇒ Benson et al. [
64]. Cluster analysis belongs to unsupervised ML techniques. It examines unlabelled data by either constructing a hierarchical structure or forming a set of groups. Data points belonging to the same cluster exhibit features with similar characteristics. In HH-DANM, we have decided to use K-means mainly because of its simplicity, speed, and accuracy. In addition, several research works report on its high efficacy when deployed on network traffic data [
50].
There are several methods to determine the optimal number of clusters that K-means needs to operate, such as V-measure, Adjusted rank Index, V-score, and Homogeneity [
72]. However, these methods are usually used with labelled datasets. Since our datasets are not labelled, we have decided to use the Silhouette score that does not require labelled data. In addition, the Silhouette method was also shown to be an effective approach for determining the number of clusters in data as well as for validation by Bishop [
36] and Estrada-Solano [
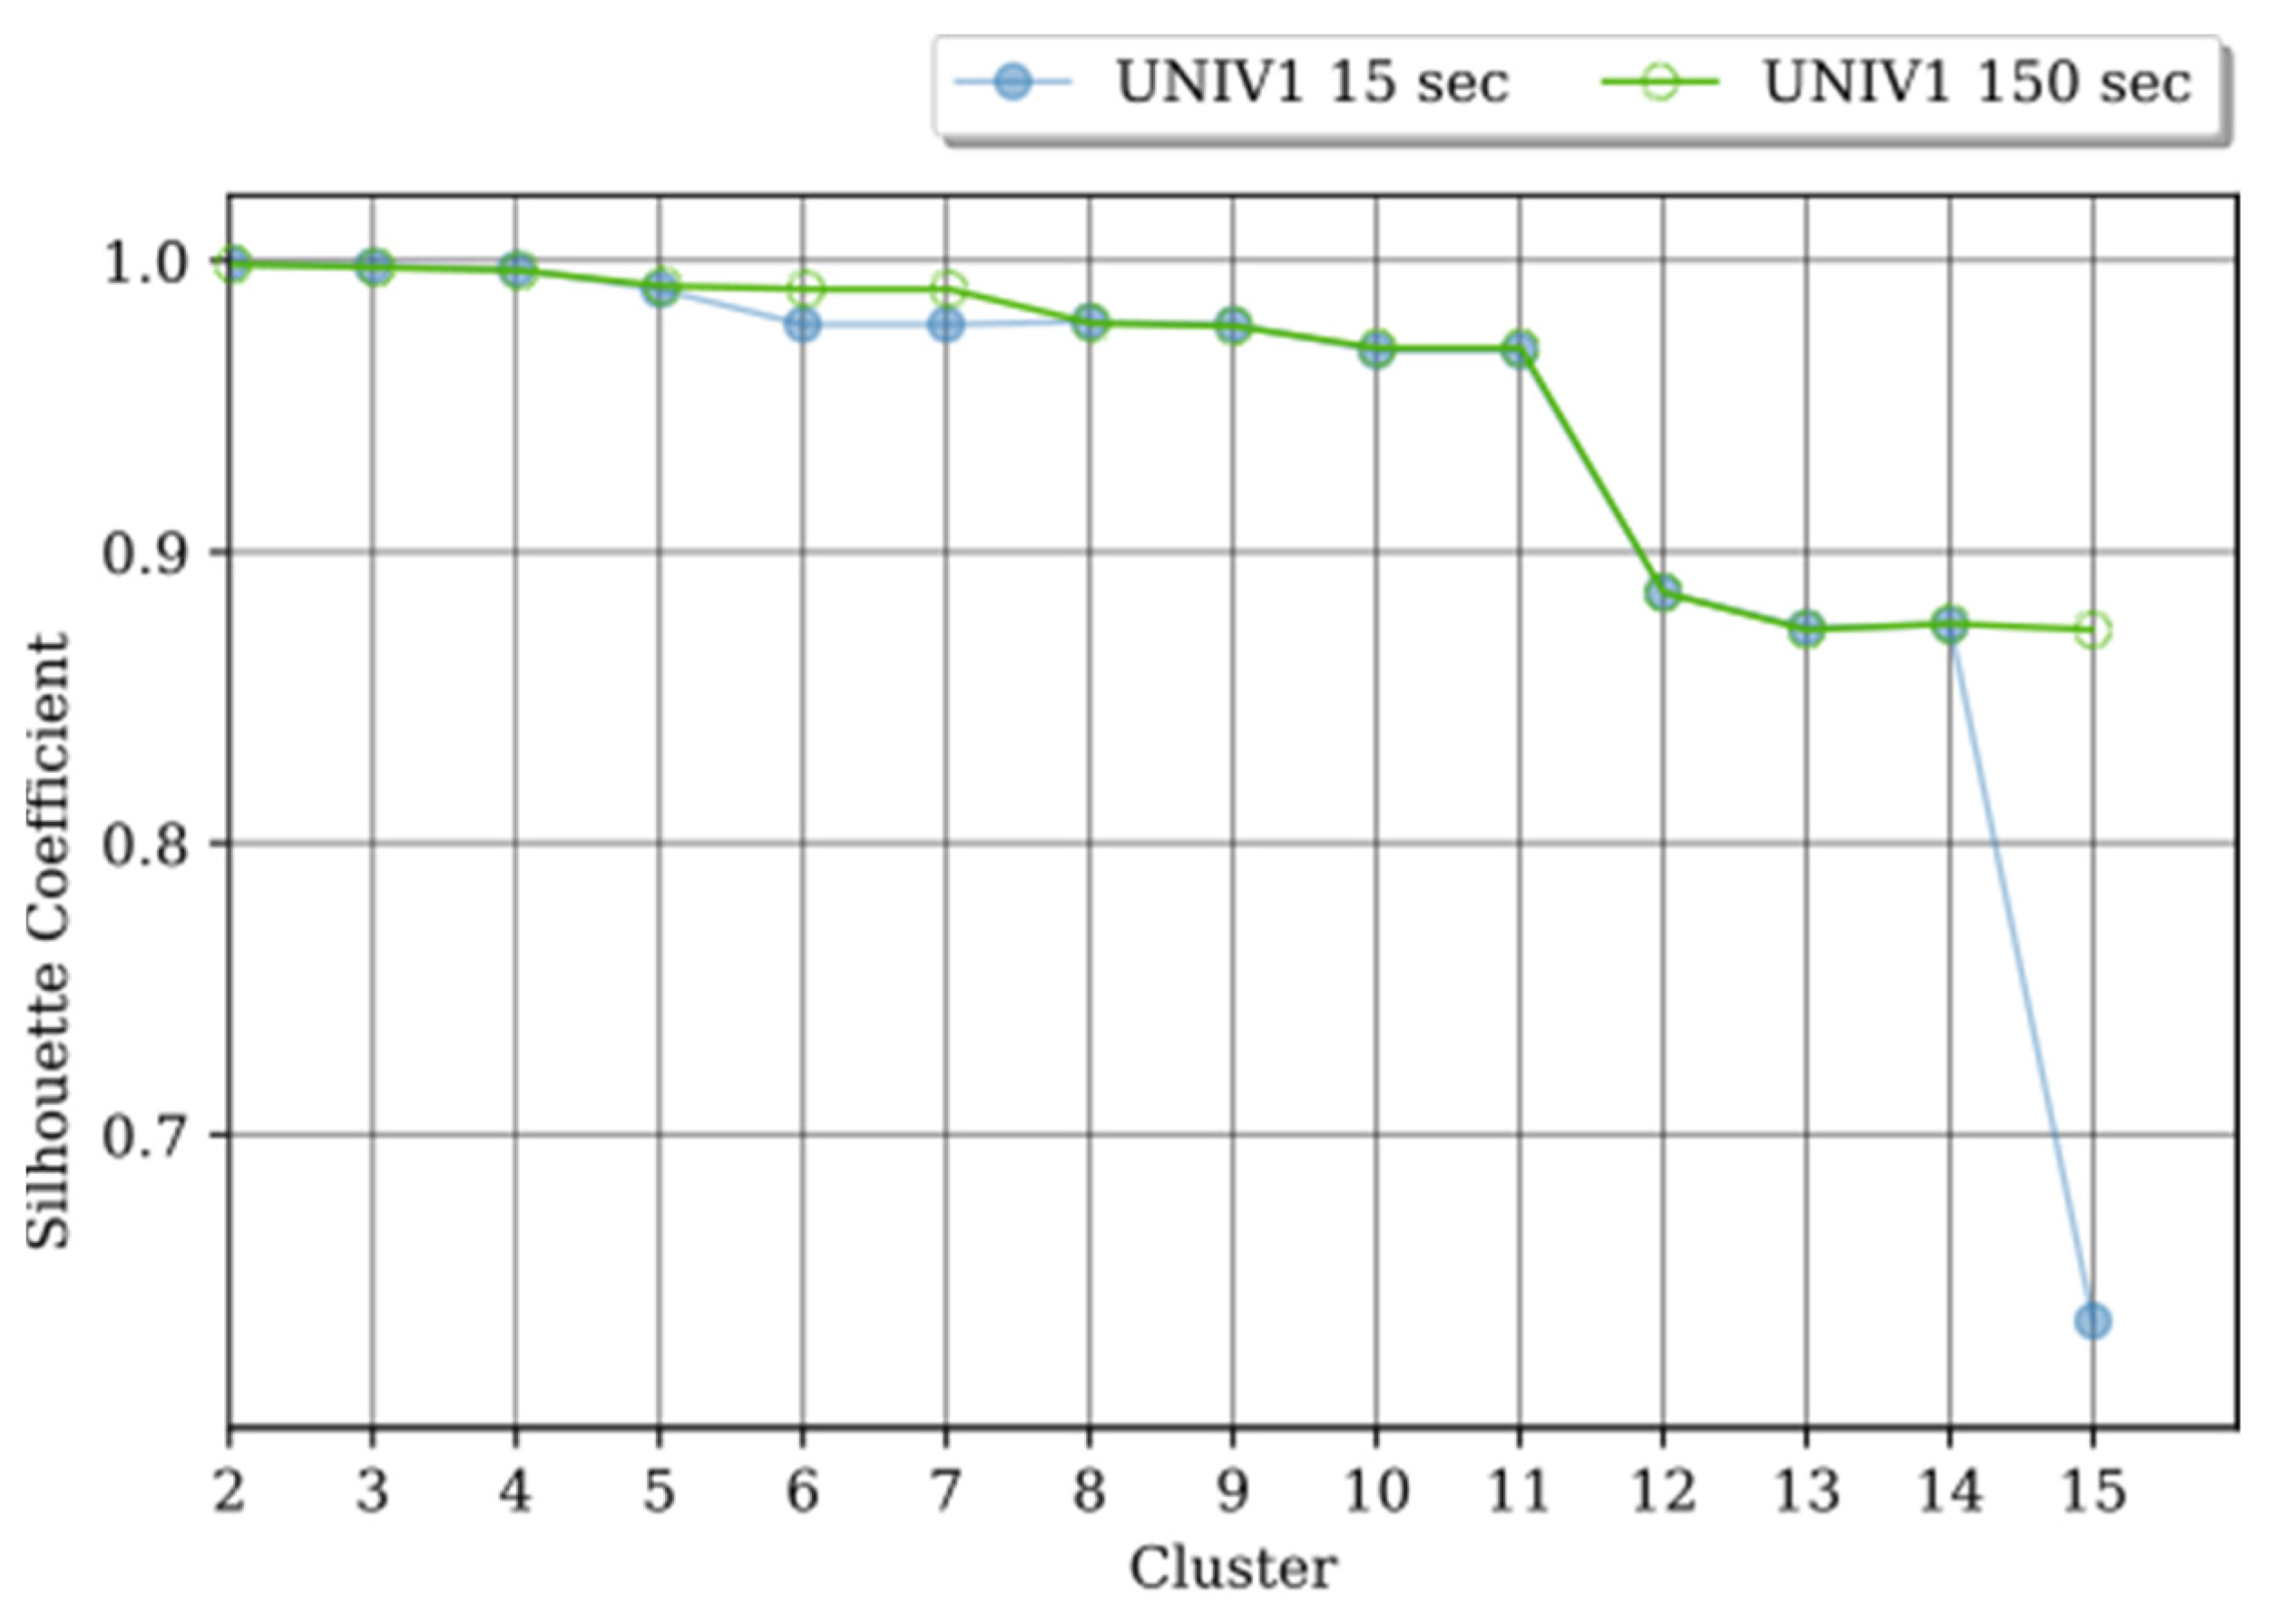
73]. In HH-DANM, we applied the Silhouette method by varying
k from 2 to 15. This method uses a coefficient (
Si) that measures how well a point is clustered and estimates the average distance between clusters. The values of
Si range between -1 and 1. The closer the values are to 1, the better the points are clustered. As
Figure 4 shows, in our analysis the
Si range is quite wide, with values that vary between 0.6 and the maximum, 0.99. In both
fito = 15 s and
fito = 150 s, the possible optimal
k is between
k = 2 to
k = 11.
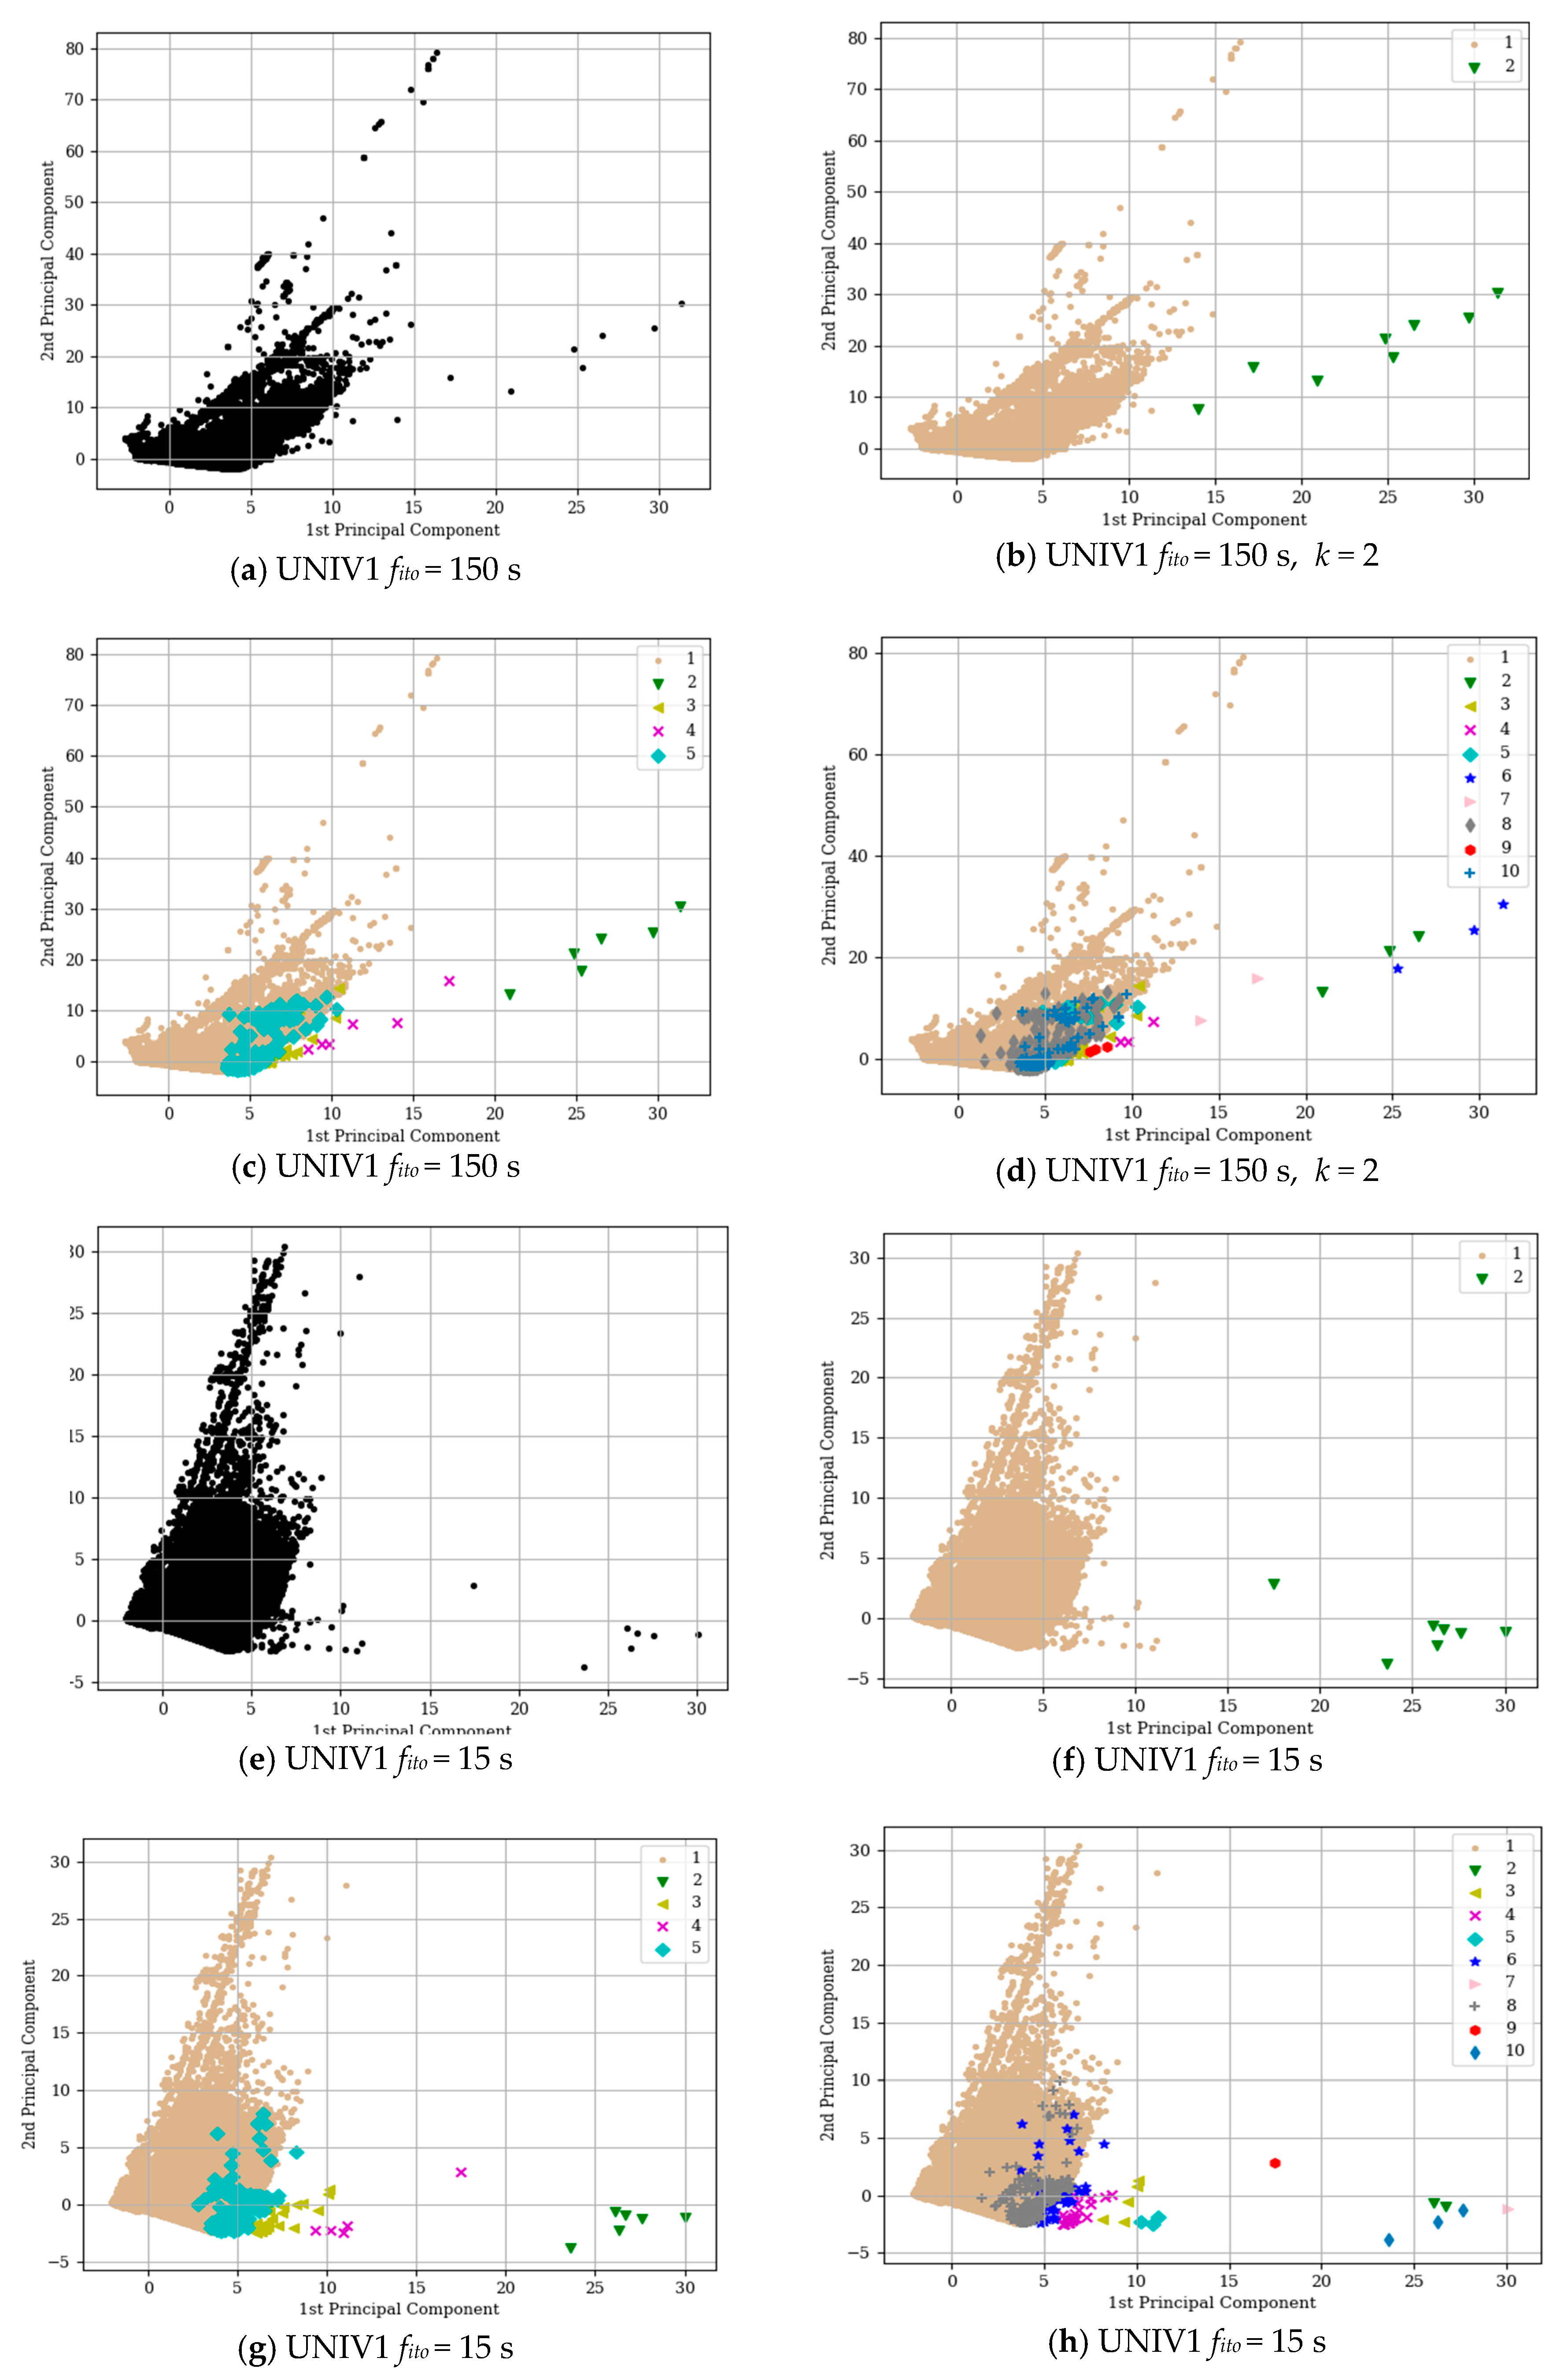
Both UNIV1 with
fito = 15 s and
fito = 150 s, got the highest
Si for
k = 2. With
k = 2, there is a significant distance between classes, as
Figure 5b,f shows by the Principal Component Analysis (PCA) that performs linear transformations process resulting in primary components [
36]. However, despite the promising
Si value and the evident distance between the classes, the imbalance between clusters is also evident, i.e., one cluster contains a large number of flows while the other, extremely few. The specific numbers of this distribution are provided in
Table 5. This distribution can produce an important deterioration of the classifier performance in particular with patterns belonging to the less represented classes.
Another promising
Si value is for k = 5, in which for both datasets it is almost 1. We applied K-means clustering with
k = 5.
Figure 5c,g show PCA with
k = 5. Our analysis focuses on the relationship between statistical features of the flows, in particular, their size, number of packets, and duration.
Table 5 summarises the relationship between them. While
k= 5 provides better results than clustering with
k = 2, in terms of flow distribution, the imbalance is still noticeable. The results show class I as the most dominant class while class II to V seem to be outliers. This distance is evident from both
Figure 5c,g as well as in
Table 6.
We also performed the cluster analysis using
k = 10. The new clusters seem to appear by splitting the old classes, in particular classes II to V. However, as
Figure 5d,h show, the flows belonging to class I seems to keep the same shape and number of flows. This motivated us to analyse class I in detail. The analysis of flows belonging to class I followed the same steps that were applied previously. We have decided to use
k = 5.
Table 7 summarises the results that were obtained. Overall, the results show there is no clear threshold that separates flows into HHs and non-HHs. This is because the flow sizes have a diverse character that leads to more than two natural clusters. We stress that the threshold selection should include a detailed analysis of the network and its traffic. However, a pattern in the clusters I, II, IV, and V regarding flow size and the number of packets is evident, as
Table 7 shows. Therefore, we suggest the use of the following thresholds for HH identification in traffic similar to UNIV1, Duque-Torres et al [
74]: flow size
θs = 7 KB and packet count
θpkt = 14.
Aiming at corroborating the applicability of our proposal, we evaluated the time that HH-DANM spends to identify the flows in UNIV1 by using the above-defined thresholds. As such, we analysed the time required to get 14 packets and an accuracy of over 96%.
Table 8 summarizes the results obtained, provides statistical information about the flow duration for the first 14 packets, and reveals diverse facts. Firstly, the majority of flows can be identified in a short time. In particular, this time is less than 0.9 s for 80% of flows for
fito = 15 s and
fito = 150 s. Secondly, approximately 95% of flows are classified in a time less than 6 s for f ito = 15 s and
fito = 150 s. Thirdly, roughly, for f ito = 15 s and
fito = 150 s, only 4% of flows are identified in a time higher than 16 s. Fourthly, approximately, for f ito = 15 s and
fito = 150 s, just 2% of flows are identified in a time higher than 23 s. Finally, some flows (worst cases) required up to 480 s to collect the required minimum volume of flow data and/or packets. Considering these facts, we argue that our proposal is applicable in real scenarios. Furthermore, it is possible to get less time by decreasing the accuracy; it is by establishing a trade-off between accuracy and identification time.
Finally, in the evaluation of HH-DANM, we compared its True Positive Rate (TPR) with the provided by classification techniques used by Poupart et al. [
75]. In particular, they used Neural Networks (NN), Gaussian Processes Regression (GPR), and Online Bayesian Moment Matching (oBMM) to classify HHs.
Table 9 shows the comparison results, revealing that HH-DANM (using the suggested values, flow size
θs = 7 KB and packet count
θpkt = 14 [
76]) achieves similar results to the approaches based on NN, GPR, and oBMM. However, there are some significant considerations. Firstly, unlike GPR and NN based approaches that do not hold their performance when the threshold changes, our approach achieves the same performance regardless of thresholds. Secondly, the approaches based on NN and oBMM tend to be affected by class imbalances more than GPR-based ones, which explains why their accuracy often suffers as the classification threshold increases. In HH-DANM, the class imbalance is not a concern since it uses the same number of packets to identify any flow.
4.2.3. Heavy-Hitters Application Module
HH-APM is responsible for sending instructions about what the network (i.e., the SDN controller) needs to do, when a HH or non-HH is identified. Once the HHs are identified, the Controller instructs the forwarder devices to do a variety of network managerial related activities aiming at improving the overall network performance. To carry out HH-APM and routing the non-HHs identified, we propose the use of MiceDCER (Mice Data Center Efficient Routing) [
35].
MiceDCER is an algorithm, proposed by our research group in a previous work [
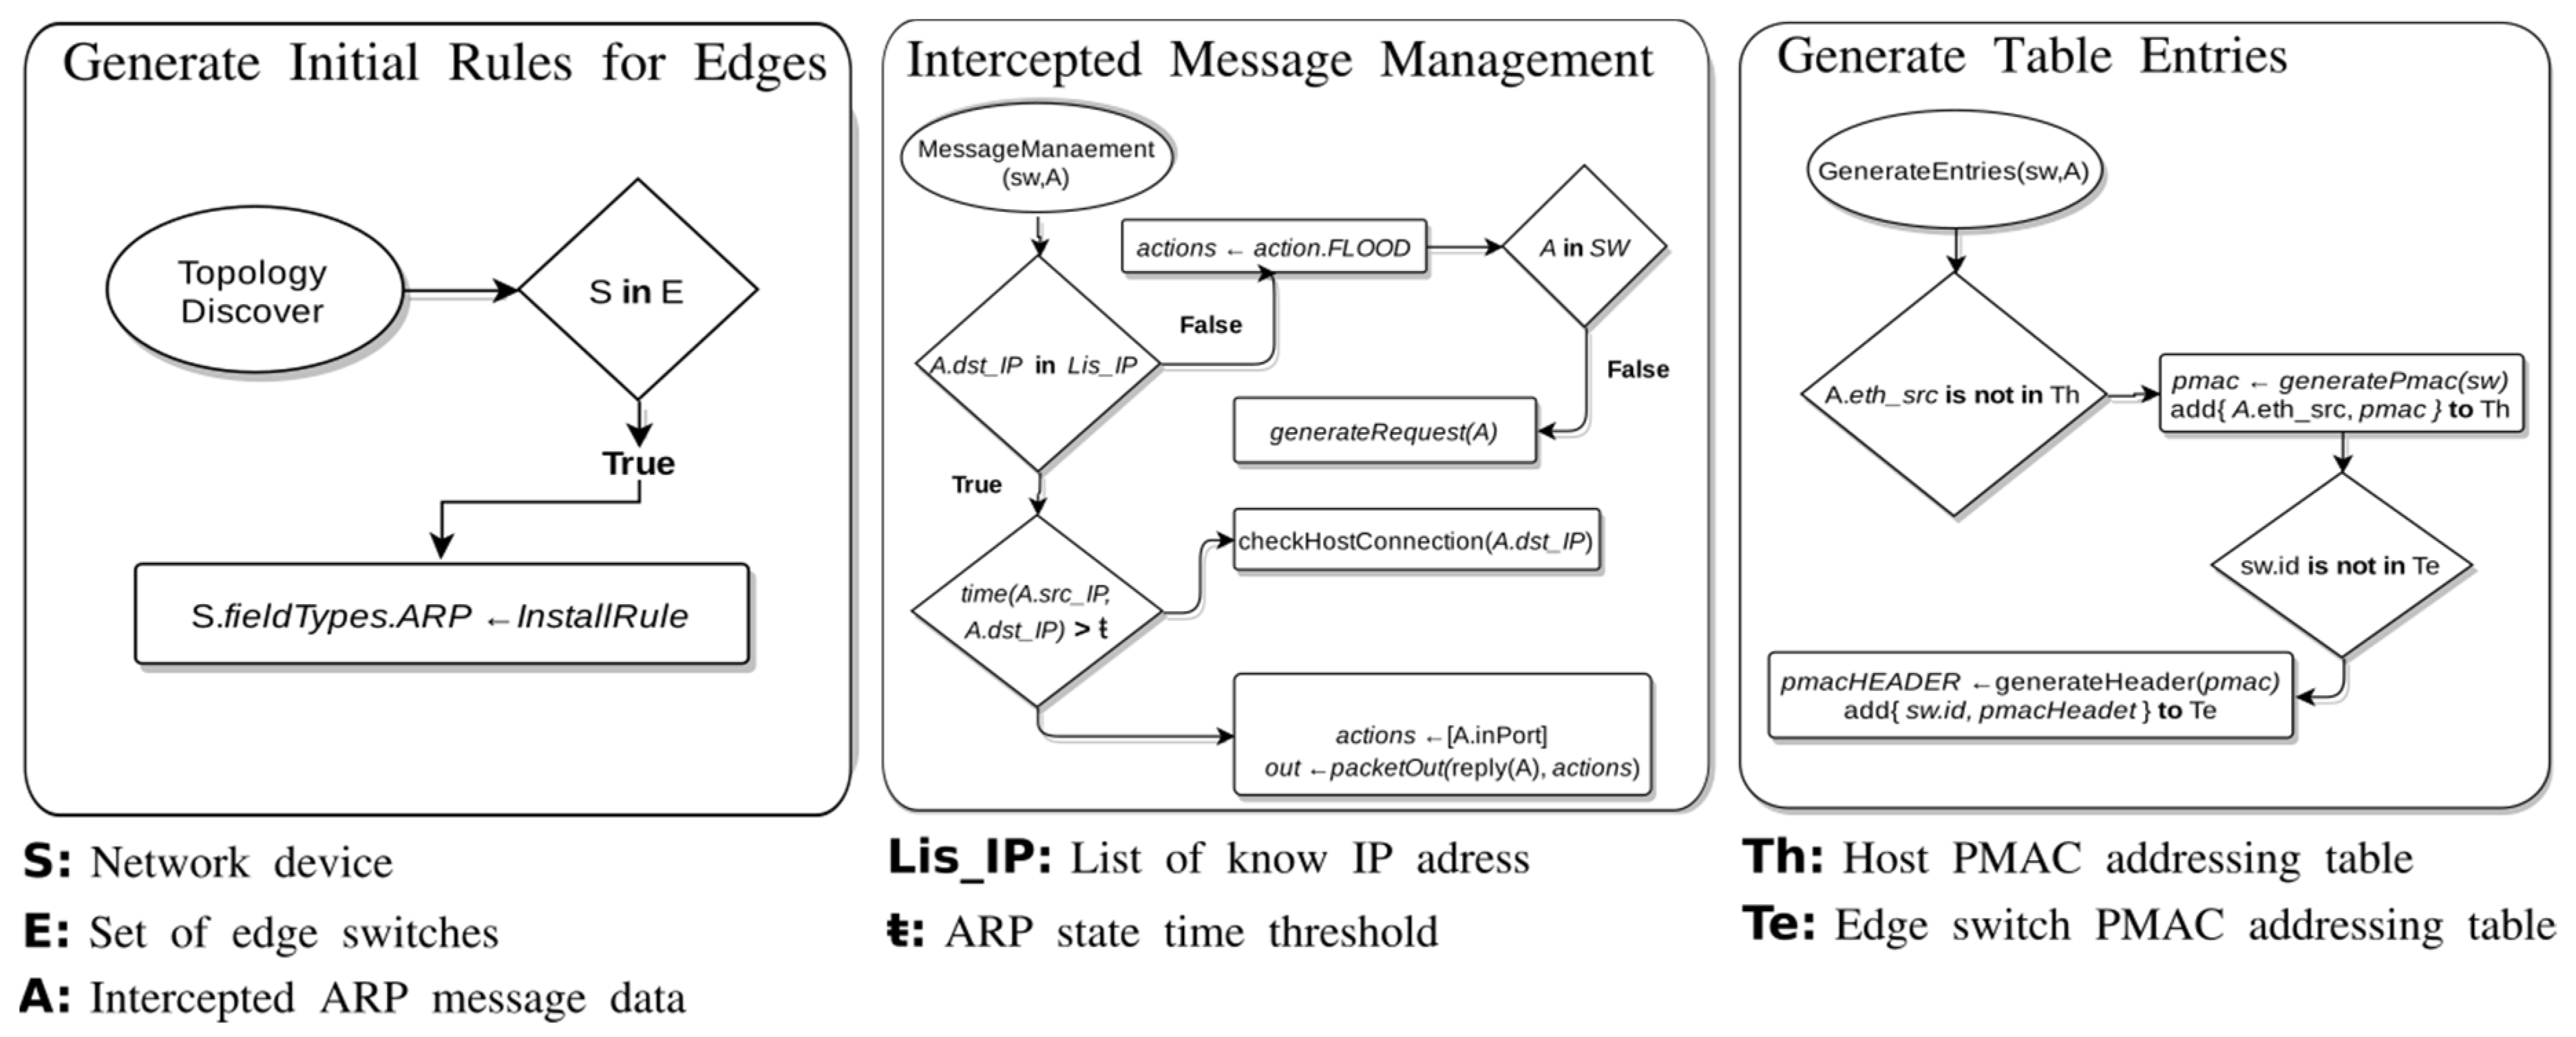
35], that efficiently routes non-HHs in SDDCN by assigning internal Pseudo-MAC (PMAC) addresses to the ToR switches and hosts. MiceDCER generates the PMAC of the switches that received the flow intercepted by the controller based on their position in the topology. PMACs are stored in a table that associates them with the corresponding actual MAC (Media Access Control) address of each switch. Also, MiceDCER reduces the number of routing rules by installing wildcard rules based on the information carried by the ARP packets. In a high-abstraction level, MiceDCER-based HH-APM performs three significant procedures:
Generation of initial rules for the edge switches,
Intercepted message management, and
Generation of table entries.Figure 6 shows the flowcharts of each procedure performed by MiceDCER. The
Generation of initial rules for the edge switches is carried out by installing routing rules for the edge switches with the ARP field type. These initial rules allow the controller to intercept the ARP messages that arrive at the switch. To install rules on the switch tables, the algorithm performs the procedure
Intercepted message management. In this procedure, a verification is carried out about the intercepted IP destination address of the ARP request message. If the controller does not recognise such address, then the controller instructs the switch that received the message intercepted to flood and instructs the other edge switches to flood with requests. If the controller recognises the IP address, it sends a reply ARP message back to the source host.
The Generation of table entries procedure has two major processes. Firstly, it verifies if the source IP address of the intercepted message is stored in the host PMACs table. Secondly, if the source IP (Internet Protocol) address is not stored, then this procedure proceeds to generate the PMAC and save it into the table, associating it with the source IP address. Finally, it is important to mention that MiceDCER asks the controller for updating the defined rules and generating new PMACs when topology modifications occur in the network.
Aiming at evaluating our MiceDCER-based HH-APM, MiceDCER was compared with IP-based and MAC-based routing. The evaluation was performed in a FatTree topology that consists of
p pods, which are management units interconnected by the
(p/2)2 switches that make up the core layer. Each pod consists of
p/ edge switches and
p/2 aggregate switches, and each ToR switch, connects to
p/2 end hosts [
63]. Therefore, a
p -ary FatTree topology supports
p3/4 hosts.
Table 10 summarizes the number of rules generated by MiceDCER, IP-based and MAC-based routing when
p is 16, 20, 24, 28, 32, 36, 40, and 48. The evaluation results reveal that, in the edge layer, MAC-based and IP-based routing install more rules than our HH–APM running MiceDCER. Considering these results, we can conclude that MiceDCER reduces the number of rules per edge switch significantly when compared with other routing solutions. The results also reveal that, in the aggregate layer, MAC-based routing installs much more rules than MiceDCER. The IP-based routing installs approximately the double of rules than MiceDCER does. Thus, we can conclude that MiceDCER reduces the number of rules per aggregate switch significantly when compared with the MAC-based and IP-based routing. In the core switch layer, the results expose again that MAC-based routing installs more rules than MiceDCER. In turn, the IP-based routing installs about the same amount of rules as MiceDCER. We can conclude that MiceDCER reduces or at least generates the same number of routing rules to install in the core switches. For more information about MiceDCER, its design, implementation, and evaluation, we refer the reader to Amezquita-Suarez [
35].

 ,
, 


