1. Introduction
The three aerodynamic forces acting on a high-speed driving vehicle, namely, the drag, lift (or downforce), and side force, have a significant impact on the driving stability, power performance and energy efficiency of the vehicle. The aerodynamic drag acts in the opposite direction of the driving direction of the vehicle and can considerably influence the maximum speed, fuel economy, and energy efficiency of the vehicle. Therefore, various devices for aerodynamic drag reduction, such as front grill shutters [
1,
2], wheel deflectors [
3], and underbody fairings [
4,
5,
6] have been widely applied. The downforce acts in the direction opposite to that of the lift and tends to push the vehicle toward the ground. Therefore, the downforce increases the road grip of the tire, thereby increasing the vehicle stability during turning and braking. As a result, most high-performance vehicles are equipped with rear spoilers to increase the downforce [
7,
8].
In general, with any increase in the downforce, the aerodynamic drag tends to increase as well; the increased downforce and aerodynamic drag lead to an increase in the driving resistance, which degrades the power performance and reduces the fuel economy [
9]. Therefore, most automakers develop vehicles by finding a tradeoff between the aerodynamic drag and downforce through passive aerodynamic optimization [
10].
Recently, various researchers have attempted to improve the driving stability by employing moving aerodynamic surfaces [
11]. One of the typical research topics is the use of an active rear spoiler, which can control the downforce by changing the deployment height or tilting angle of the rear spoiler. Such variable spoilers can adjust the downforce in accordance with the driving velocity; however, they have a large weight, undesirable package layout, and complicated operating mechanism. In addition, owing to the inertia of the spoiler itself, it takes several seconds to change the spoiler position; thus, it is difficult to achieve a real-time response to rapid braking and turning.
Some researchers have also focused on employing aerodynamic control via air blowing or suction. Baek [
12] performed numerical studies pertaining to the aerodynamic drag reduction by using a realistic vehicle model [
13]. The authors conducted numerical experiments involving a change in the blowing position and strength, and a drag reduction of 7.5% could be realized. Alimi [
14] investigated the technique of active flow control by using harmonic vortex generator jets for laminar boundary layer separation. Heinemann et al. [
15] carried out experimental studies on active flow control via high-speed blowing, using a 1:4 scaled model vehicle. These authors demonstrated a reduction of 5% in the rear axle lift with a negligible increase of 1% in the drag.
The improvement of vehicle performance by controlling the downforce and aerodynamic drag is of particular interest in the domain of motor sports aerodynamics, such as for Formula-1 (F-1). In 2010, McLaren applied the RW80 duct, known as the F-duct, to an F-1 vehicle, and it was reported that the F-duct could increase the top speed to approximately 3–7 km/h by controlling the downforce and aerodynamic drag [
16]. The F-duct could control the vehicle aerodynamic performance without excessive energy consumption because it employed high-speed ram air; however, its use was prohibited owing to FIA (Federation Internationale de L’Automobile) regulations. Recently, Lamborghini introduced the active aerodynamic control technology, termed active Lamborghini aerodynamics (ALA), in which the F-duct concept is adopted to one of their premium vehicles. In the ALA, ram air with a high total pressure is guided to the slit at the bottom surface of the rear spoiler and discharged to realize flow separation. Without flow discharge, no flow separation occurs at the rear spoiler, and the downforce is maximized. Thus, the grip force of the vehicle is increased, and superior dynamic stability can be obtained. This technique is advantageous because when flow discharge is present, flow separation occurs at the lower surface of the rear spoiler; the downforce and aerodynamic drag are reduced, consequently increasing the power performance in terms of the top speed and other parameters.
Most studies on active aerodynamic control via blowing have been focused on drag reduction by preventing the flow separation through blowing or suction. Although a reduction of approximately 7–10% in the aerodynamic drag can be realized by blowing, the main drawback is the large amount of electric energy consumed to inject a high momentum air flow by the fan [
12,
15]. In contrast, in the ALA, the ram air with a high total pressure is guided to the discharge position through the duct. Consequently, the momentum of the discharged flow is relatively small; however, a high efficiency can be expected because this operation does not consume any additional energy.
To this end, the purpose of this study is to understand the physics underlying the aerodynamic drag and downforce reduction of this flow discharging technology by using computational fluid dynamics (CFD) techniques. High fidelity methods such as LES (Large Eddy Simulation) or DNS (Direct Numerical Method) would provide more reliable results for complex unsteady flow fields such as flow separation and so on. However, due to the request of huge amount of computational resources, limited application is currently available. In contrast, the method using the RANS equation has been widely used thanks to its advantages of low computational cost, acceptable accuracy, and fast turnaround time. Zhang et al. [
17] investigated the aerodynamic performance of a detailed full scale sedan vehicle using various turbulence models such as unsteady Reynolds-averaged Navier–Stokes (URANS) and LES and compared it with wind tunnel test values. The study concluded that LES is useful for resolving detail flow structures, but RANS is still useful for predicting aerodynamic performance. Goodarzi et al. [
18] conducted flow analysis on NACA0015 airfoil using RANS with a Spalart-Allmaras turbulence model in the range of high angle of attack of 18–20 degrees where the flow separation occurred. In addition, Yousefi et al. [
19] conducted a study on active aerodynamic control through blowing and suction using the RANS with the
k-w SST model for NACA0012 airfoil, and showed good agreement with wind tunnel test values. Based on the results of the literature survey, this study also intends to perform flow analysis using the URANS with
k-w SST model. The F-Duct and the ALA system are excessively complicated to be studied as complete systems, and the associated technical data are not available in the public domain. Therefore, to understand the concept of flow control using the flow discharge, a simplified two-dimensional vehicle and spoiler model is used.
3. Results
3.1. Velocity of Flow Discharging from the Spoiler
In contrast to the existing methods, in which the control air flow is forcibly injected through the fan, the aerodynamic control method considered herein is based on the flow discharge from the rear spoiler, and thus, the discharge velocity is limited by the flow path and geometry, as shown in
Figure 2. Therefore, rather than conducting a parametric study for all ranges of the discharge speed, it is more efficient to perform an investigation by inferring the discharge speed ranges in advance. For this purpose, an approximate spoiler model was used to form the ram air flow path and predict the velocity of the discharging flow.
Figure 2 shows the simulation domain, simplified rear spoiler, and schematic flow path of the ram air inside the rear spoiler. The high-speed ram air flows into the rear spoiler and discharges to the slit at the underside of the spoiler.
Figure 3 shows the discharge speed with respect to the vehicle driving speed (U) and slit area. For the slit areas of 3 × 1353 mm
2, 6 × 1353 mm
2, and 10 × 1353 mm
2, the discharge flow velocity (Vb) is approximately 40%, 45%, and 47% of the vehicle driving speed, respectively. Considering the pressure drop caused by the structure of the spoiler, which is not reflected in this simulation, the discharge flow rate was set as 40% of the vehicle driving speed.
3.2. Aerodynamic Characteristics of the Rear Spoiler
The two-dimensional spoiler used in this study is a Y = 0 section of the simplified rear spoiler of
Figure 2. It has a chord length of 200 mm and maximum thickness of 14%, with a 9% camber, as shown in
Figure 4. To generate the downforce, the spoiler was used upside down, and the incidence angle was set to 10.26°.
First, flow simulations using the spoiler were performed as a reference case of the active aerodynamic control by varying the inflow speed from 100 km/h to 300 km/h.
Figure 5 shows the aerodynamic drag and downforce coefficients with respect to the various driving speeds.
Based on the spoiler chord length, the inflow speeds of 100–300 km/h correspond to the Reynolds numbers of 3.8 × 10
5–1.14 × 10
6. In
Figure 5, the Reynolds effect can be clearly seen: With any increase in the Reynolds number, the downforce increases, and the aerodynamic drag decreases.
Figure 6 shows the normalized velocity magnitude (velocity magnitude divide by vehicle driving velocity) and surface pressure distribution around the spoiler with respect to some representative vehicle speeds. With an increase in the velocity, the flow separation area decreases, and the pressure recovery area increases; consequently, the Reynolds effect mentioned above can be visually confirmed. To determine the flow discharge position for the reduction of the downforce and aerodynamic drag, the lower surface of the spoiler can be divided as follows based on the surface pressure distribution:
A suction peak appears in Section A around the leading edge, and pressure recovery occurs with flow deceleration in Section B. Although separation area varies slightly depending on the inflow speed, it can be seen that flow separation occurs after Section C, which is approximately 75% of the chord length.
Because the downforce is produced by the pressure difference between the upper and lower surfaces of the spoiler, a pressure increase is required at the lower surface of the spoiler to reduce the downforce. In addition, to reduce the aerodynamic drag, it is necessary to increase the pressure in Sections B and C while decreasing the pressure in Section A considering the characteristics of the high-camber spoiler. Consequently, it is expected that the downforce and drag can be reduced by increasing the pressure in Sections B and C through flow discharge. Therefore, 25%, 50%, and 75% of the chord (0.25C, 0.50C, and 0.75C, hereafter) were set as the flow discharge positions, and their effect on the aerodynamic performance was observed.
3.3. Flow Discharge for Isolated Spoiler
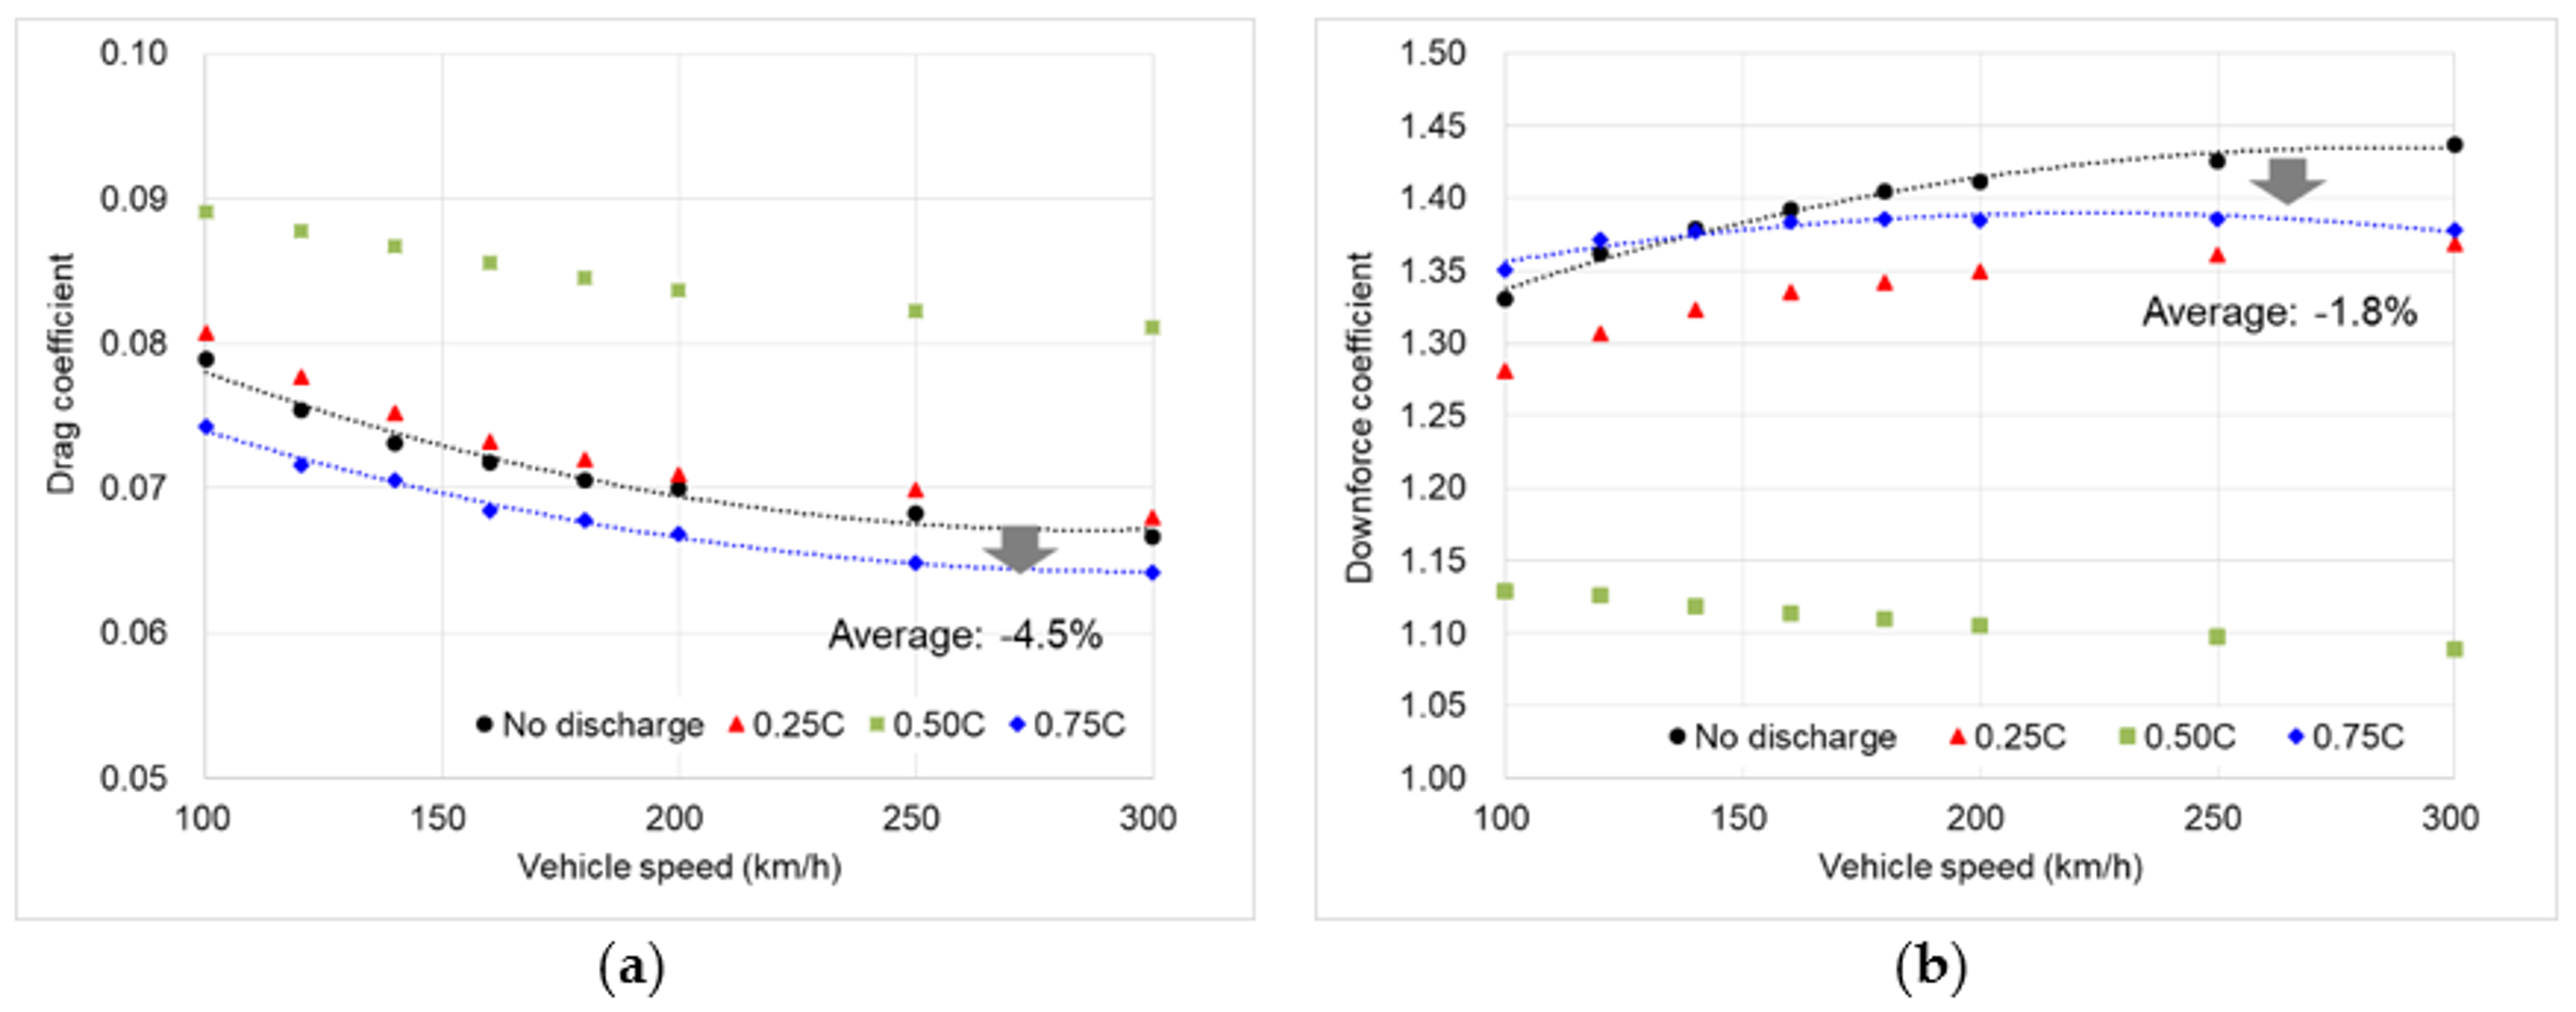
Figure 7 shows the aerodynamic drag and downforce coefficients for the discharge positions of 0.25C, 0.50C, and 0.75C when Vb is 40% of the vehicle driving speed. For the discharge positions of 0.25C and 0.50C, the downforce is reduced; however, the aerodynamic drag is increased. In addition, it can be seen that discharging at 0.75C can reduce the drag and downforce by an average of 4.5% and 1.8%, respectively, in the speed range of 100–300 km/h. To analyze the effect of flow discharging on the vehicle aerodynamic performance, the surface pressure distributions for the various discharge positions at the vehicle driving speed of 300 km/h were compared.
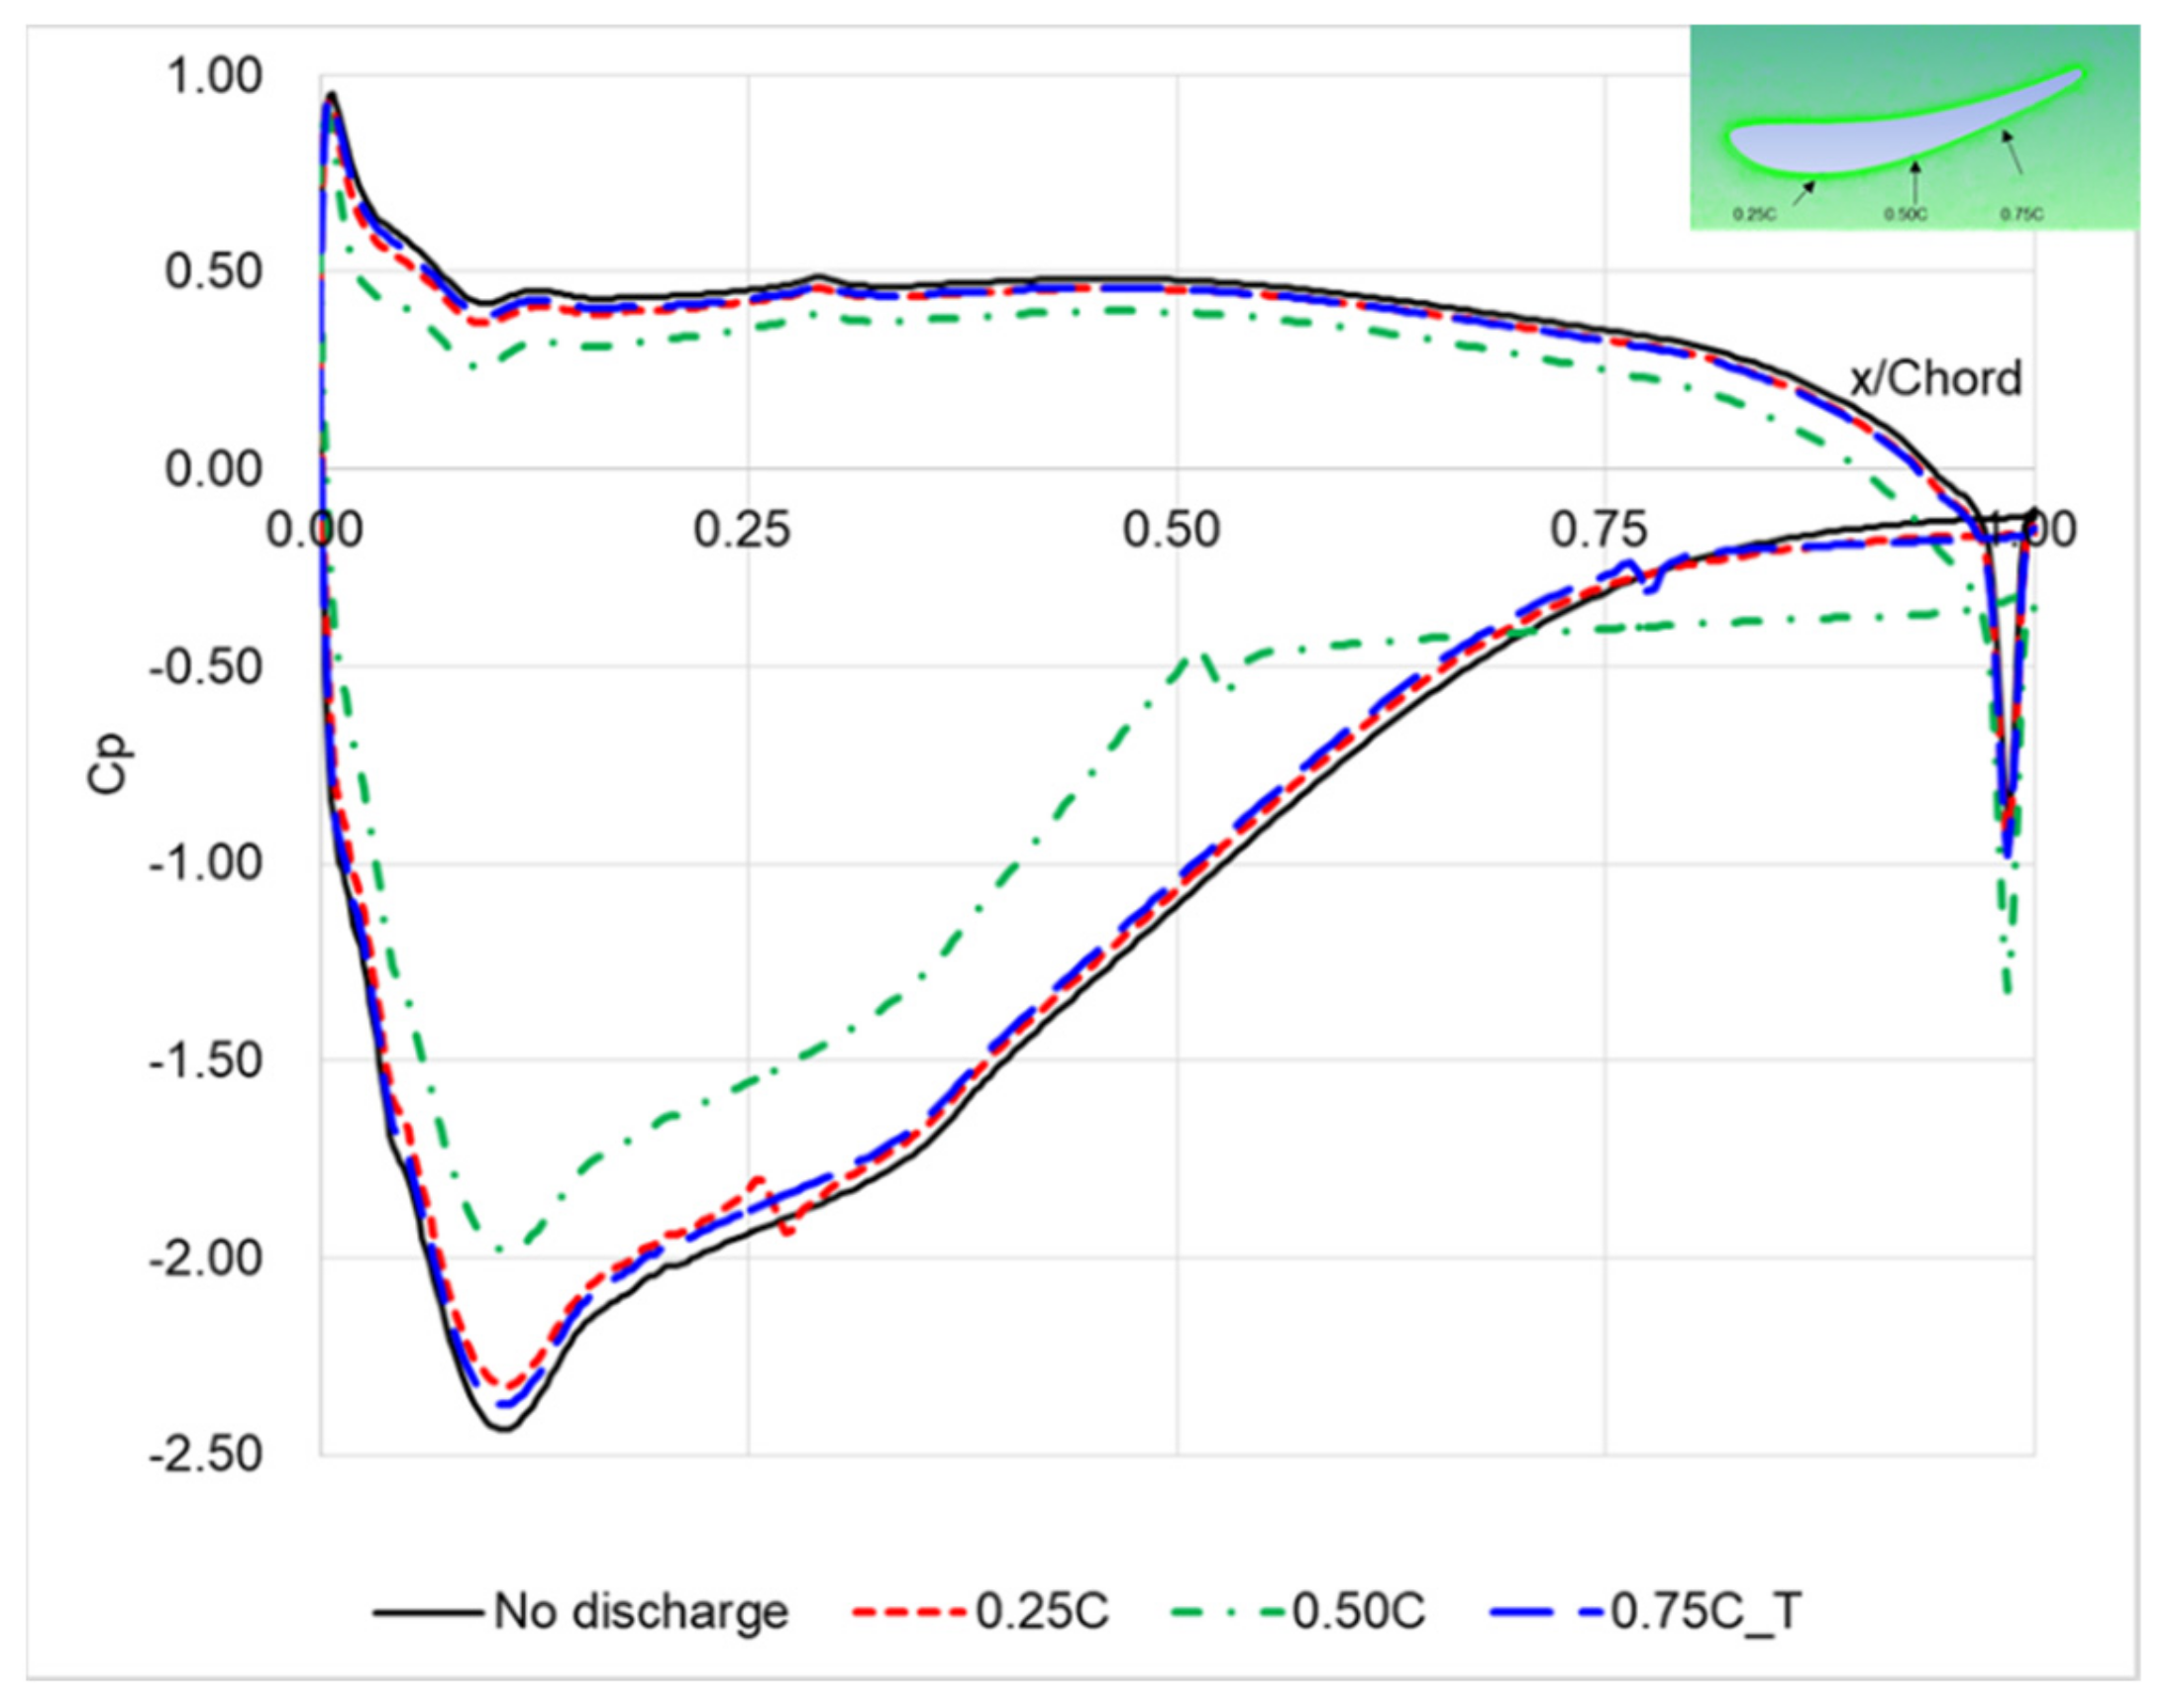
Figure 8 shows the comparison of the surface pressure distributions for the three discharge positions when the vehicle speed is 300 km/h. In the case of discharging at 0.50C, a nearly constant pressure distribution appears after the discharge point, suggesting that flow separation has occurred. As a result, the suction peak is drastically decreased, and the pressure at the lower side of the spoiler increases dramatically, which indicates that the downforce is reduced. The pressure increase in Section B is favorable for drag reduction; however, the overall drag increases due to the decrease in the suction peak in Section A and the pressure decrease in Section C. Furthermore, when discharging at 0.25C and 0.75C, the surface pressure distributions are nearly similar to that without flow discharging. However, the pressure in the Section B is slightly increased, and the suction peak in the Section A is not large, which results in a slight increase in the drag and decrease in the downforce. In the case of discharging at 0.75C, the suction peak in Section A is slightly larger than that when discharging at 0.25C, resulting in a drag reduction effect.
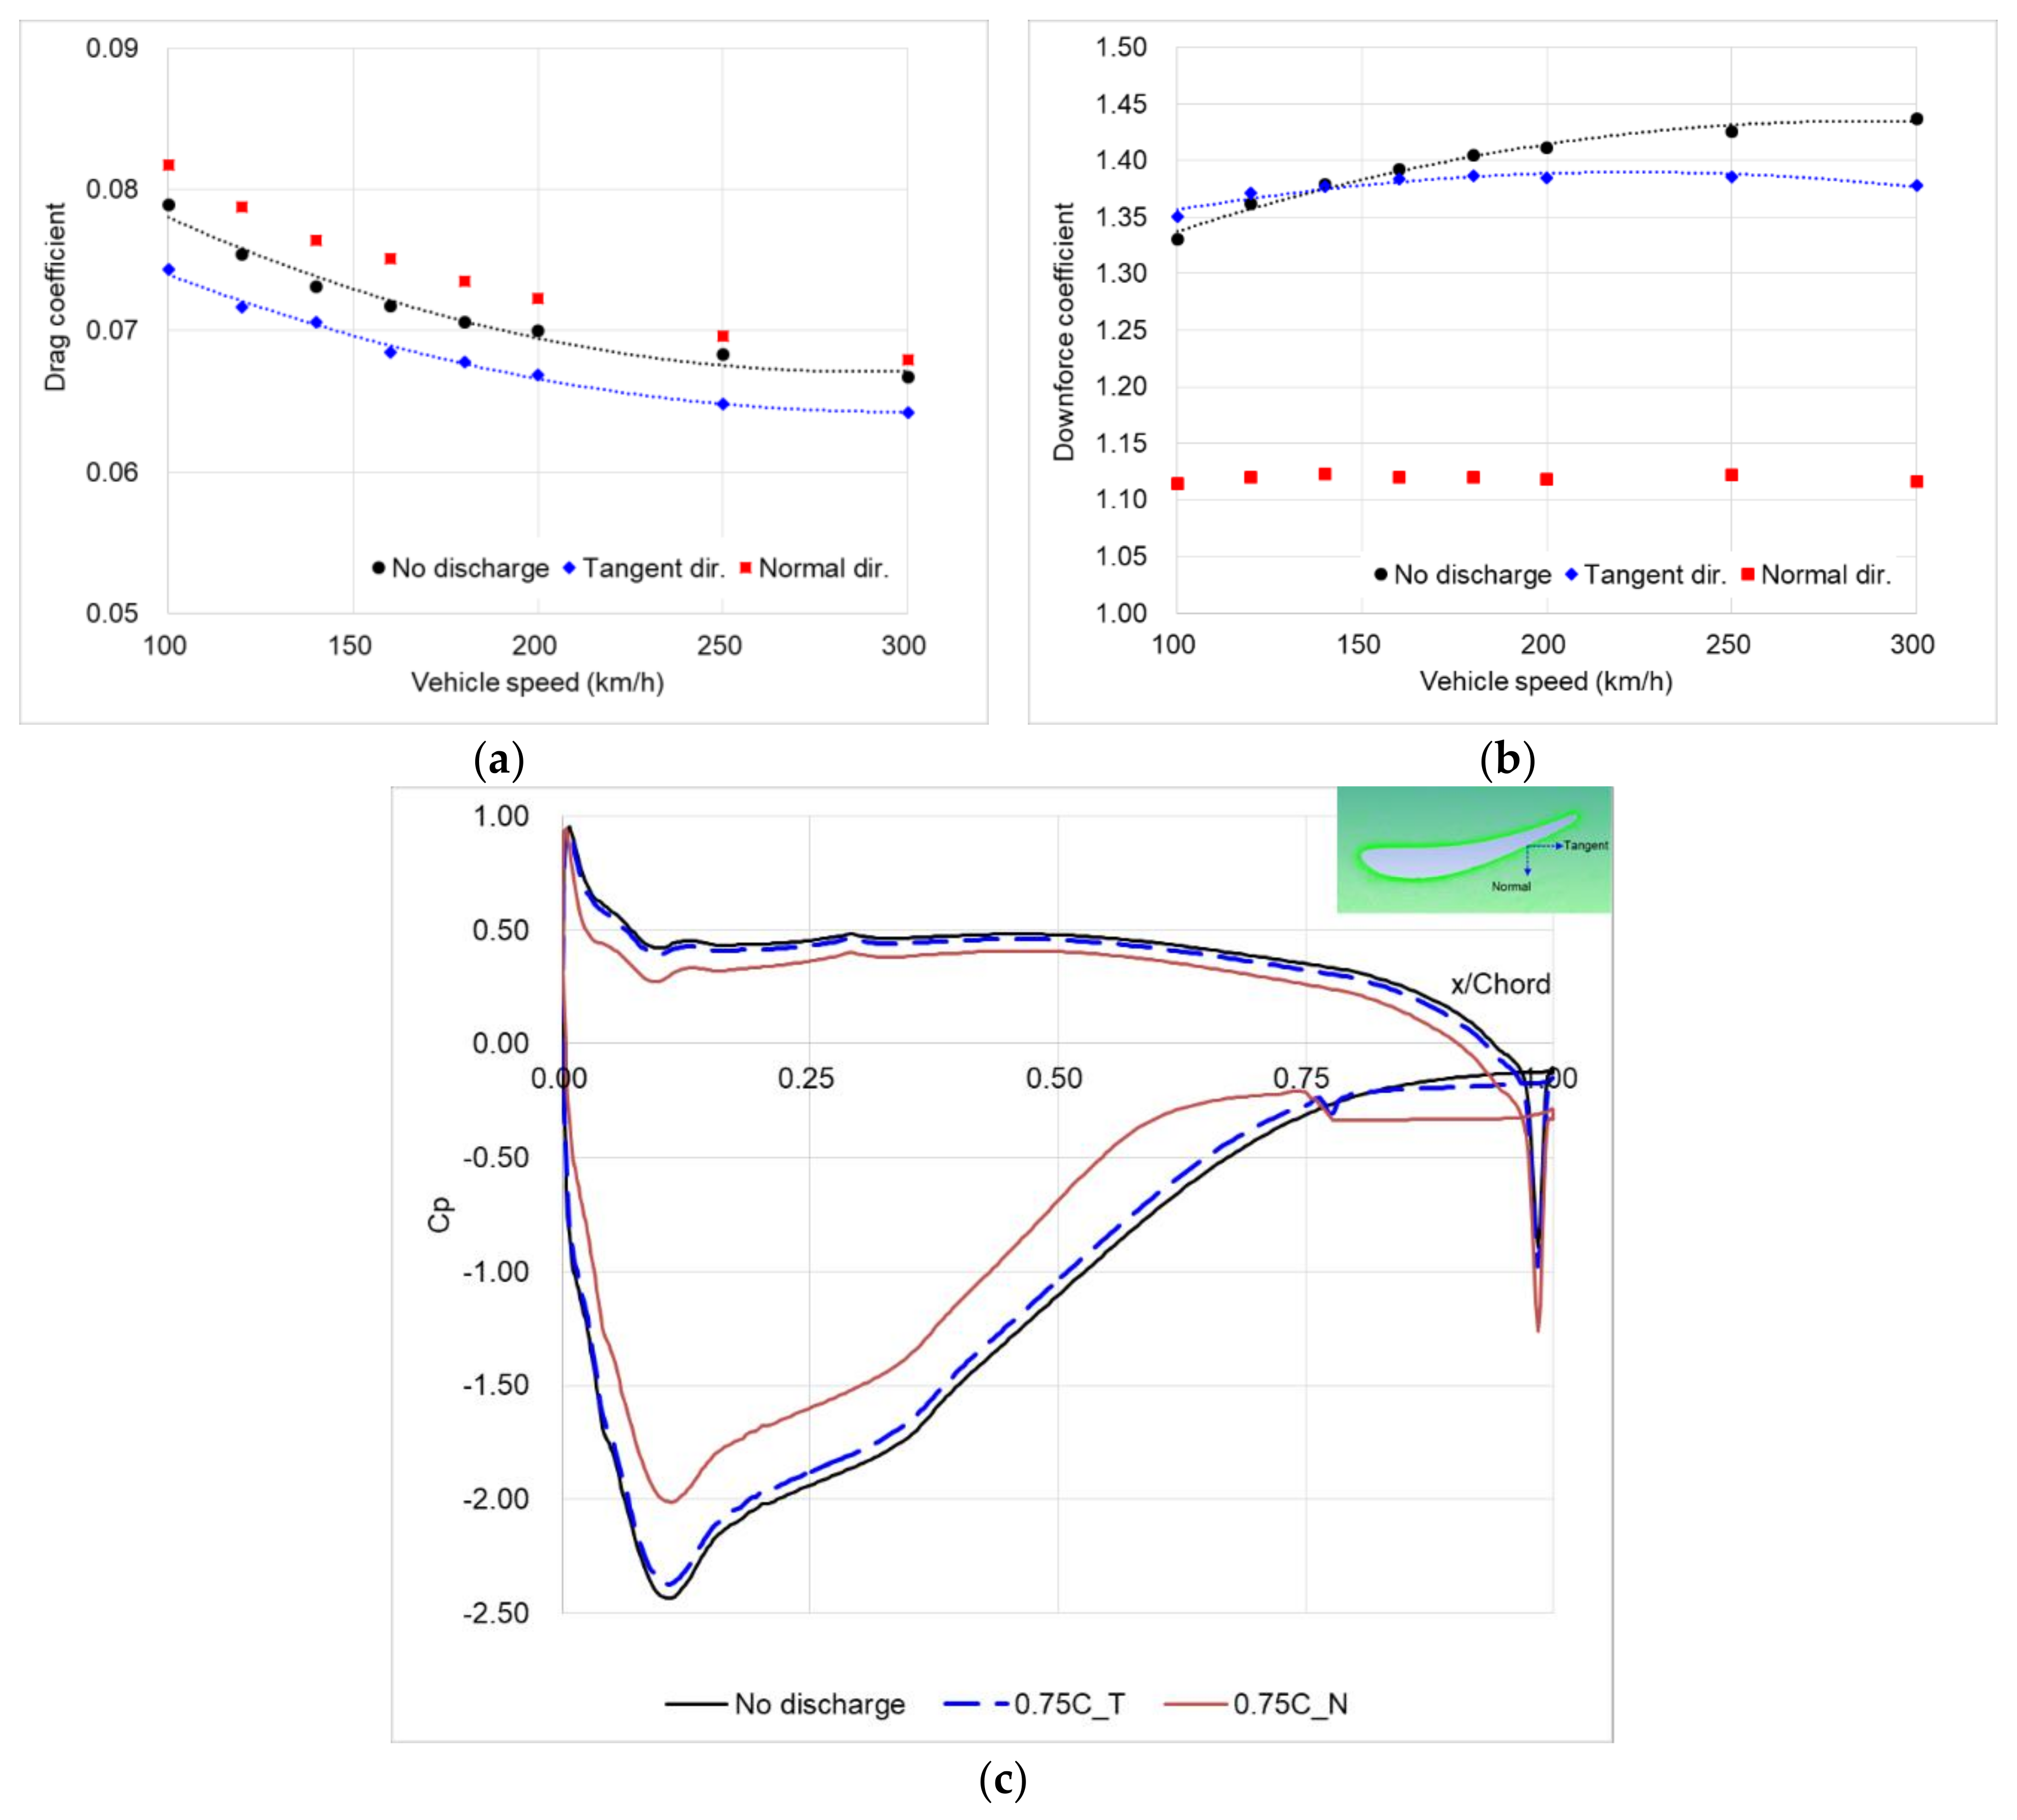
The effect of discharge direction was investigated by changing the discharge directions tangentially and normally to the vehicle driving direction. The discharge position was 0.75C, and the vehicle driving speed varied from 100–300 km/h. As shown in
Figure 9, the aerodynamic drag and downforce were reduced in the case of tangential discharge. For the discharge in the vertical direction, flow separation appears immediately after the discharge position, and the pressure distribution is similar to that of the discharge at 0.50C, as shown in
Figure 8.
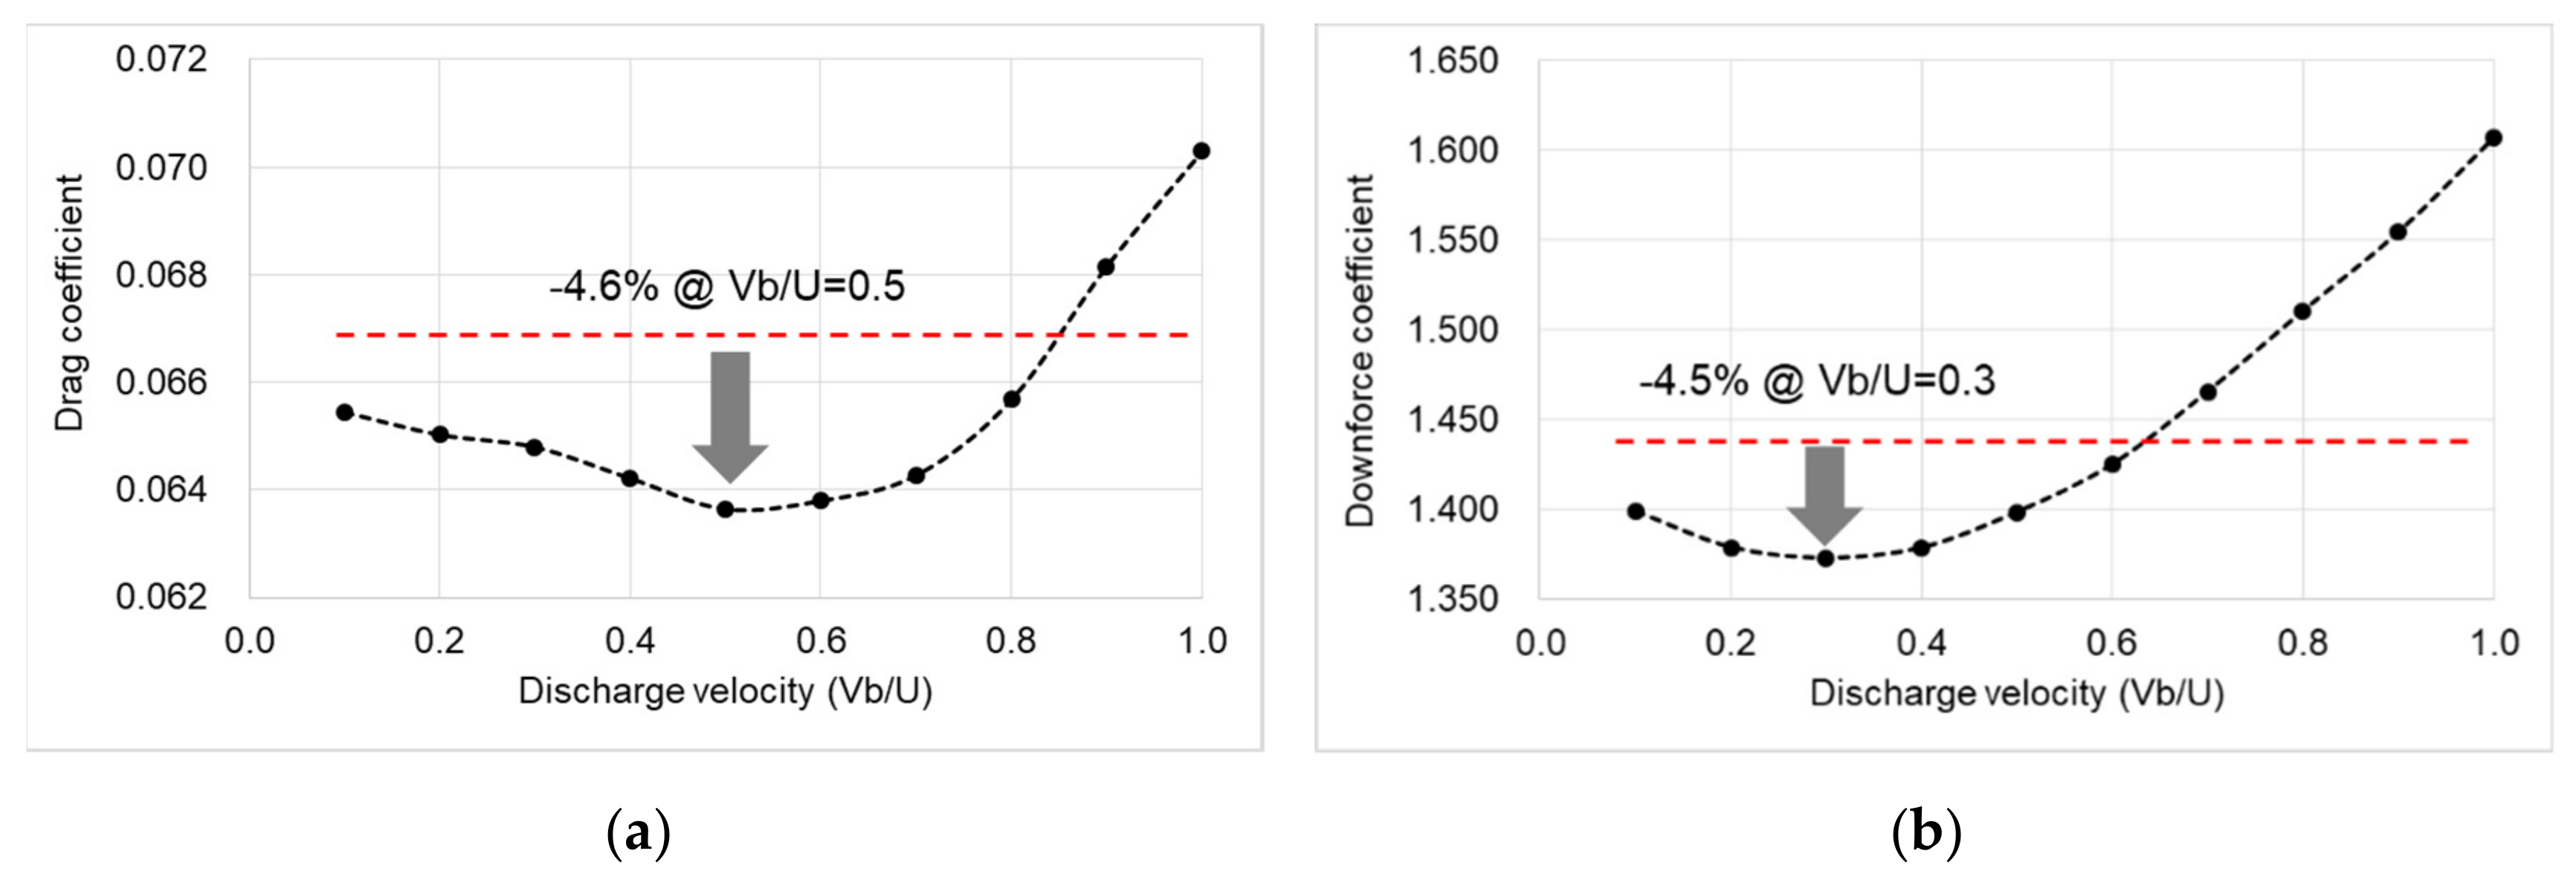
To investigate the effect of the discharge speed, a case study was performed by changing Vb in the range of 10% to 100% of the vehicle driving speed (U). As shown in
Figure 10, the aerodynamic drag tended to decrease with increase in the discharge speed, resulting in a maximum drag reduction of 4.6% at Vb/U = 0.5, followed by an increase in the drag. The downforce also decreases with an increase in the discharge speed. After decreasing by 4.5% at Vb/U = 0.3, the downforce begins to increase.
As shown in
Figure 11, increasing the discharge velocity decreases the pressure near the trailing edge of the lower surface by delaying the flow separation, which causes flow acceleration in the leading edge. Therefore, it was shown that the pressure decreases in the lower surface of the spoiler result in an increase in the drag and downforce.
Thus, from the result of isolated spoiler, it can be concluded that flow discharge with Vb/U of 0.3–0.4 at the location of flow separation can reduce aerodynamic drag and downforce by increasing pressure of spoiler lower surface.
3.4. Flow Discharge on Vehicle with Spoiler
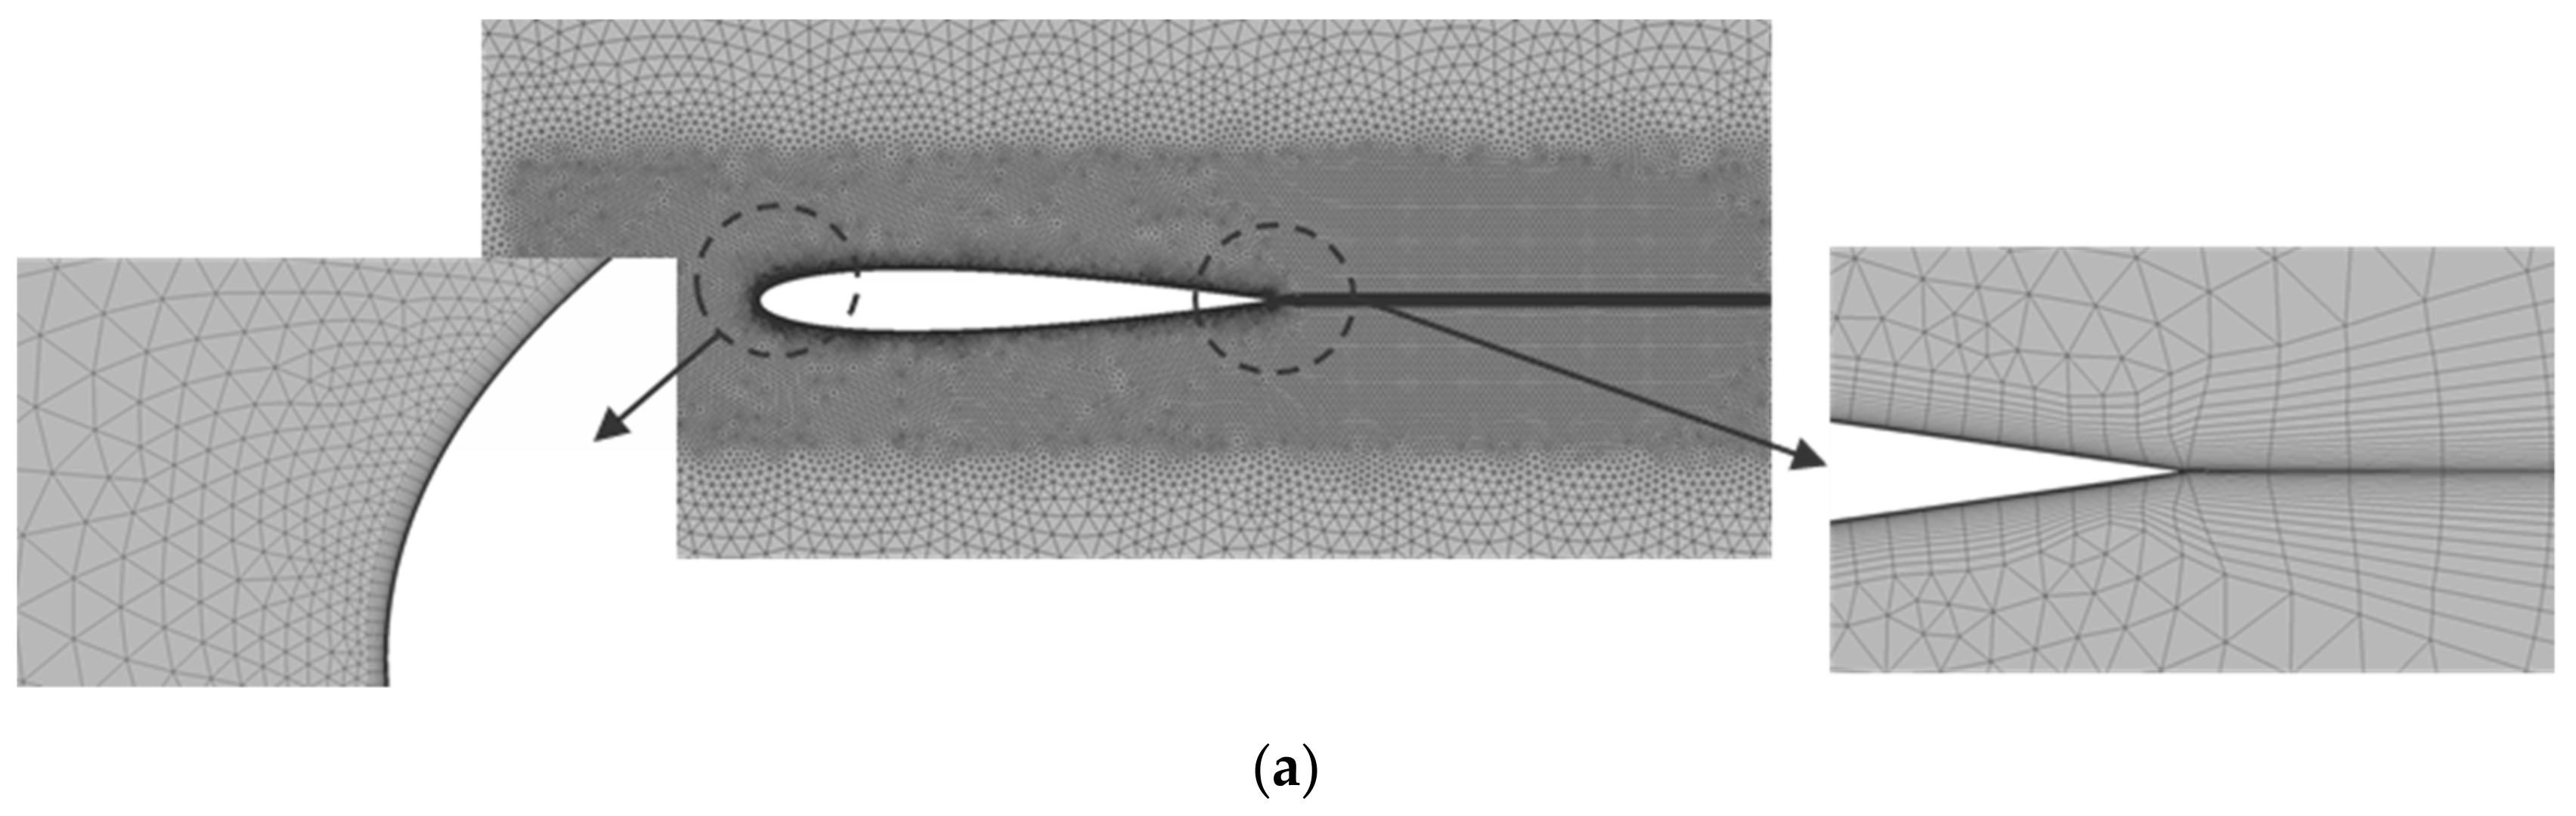
To investigate the physics underlying the reduction in the drag and downforce via flow discharging in a vehicle with a rear spoiler, a two-dimensional simplified vehicle model was analyzed.
Figure 12 shows the two-dimensional simplified vehicle and spoiler configuration and a partial view of the computational mesh used for analysis.
In the isolated spoiler, the flow discharge at 0.25C and 0.75C exhibited a pressure distribution similar to that in the case with no discharge; however, the discharge at 0.50C exhibited a large pressure difference due to the flow separation. Thus, for the configuration of a vehicle with a spoiler, numerical tests were conducted for flow discharge at 0.50C and 0.75C.
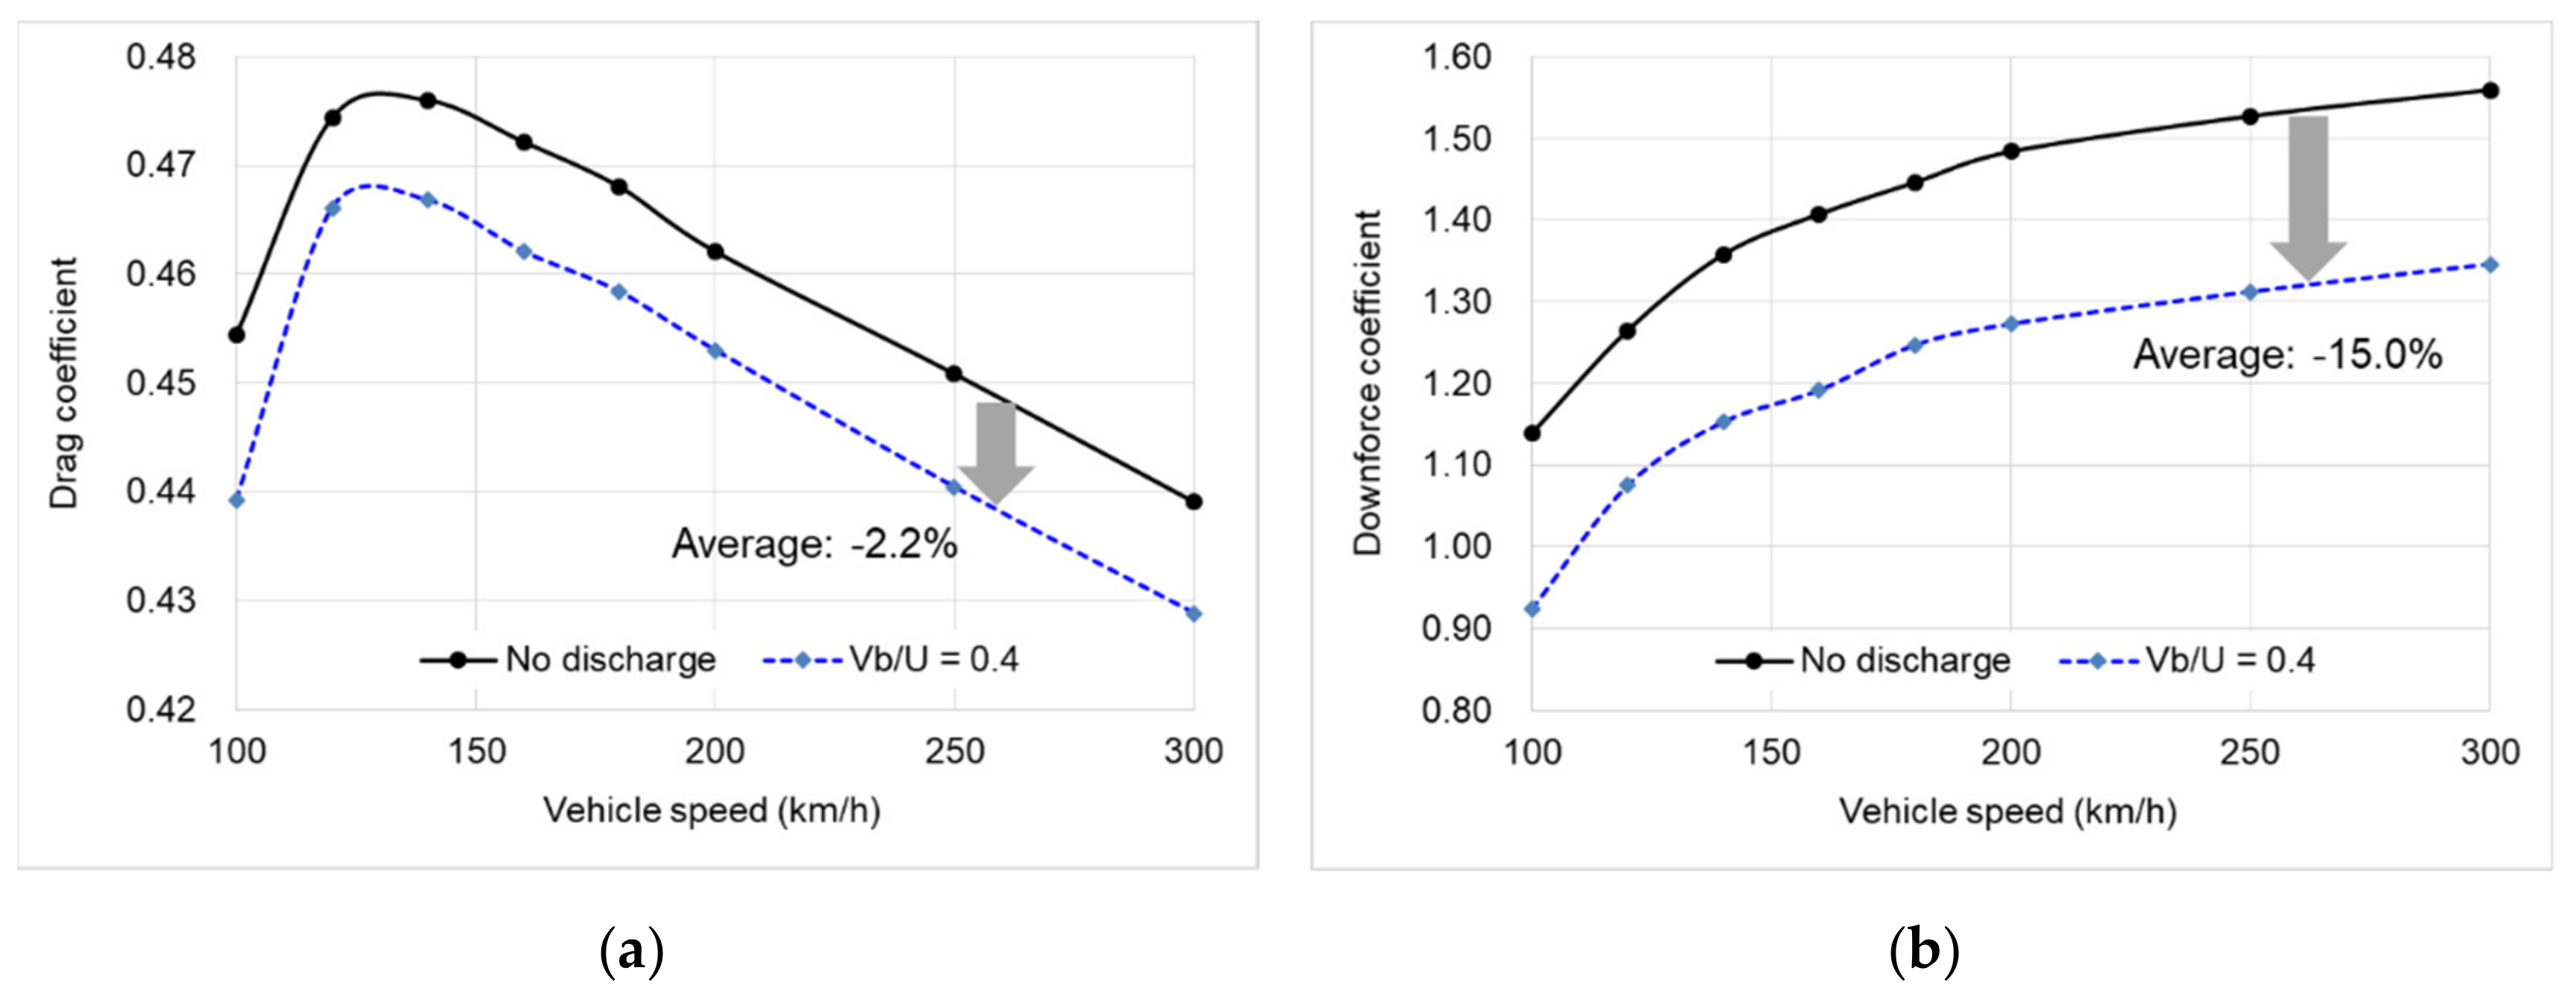
Figure 13 shows the aerodynamic coefficients for different vehicle driving speeds when the flow is discharged at 0.50C with Vb/U = 0.4. In the isolated spoiler, the drag tended to increase rapidly when the flow was injected at 0.5C; however, in case of the vehicle with a spoiler, the drag and downforce decreased by 2.1% and 15% on average, respectively, for the velocity range of 100–300 km/h.
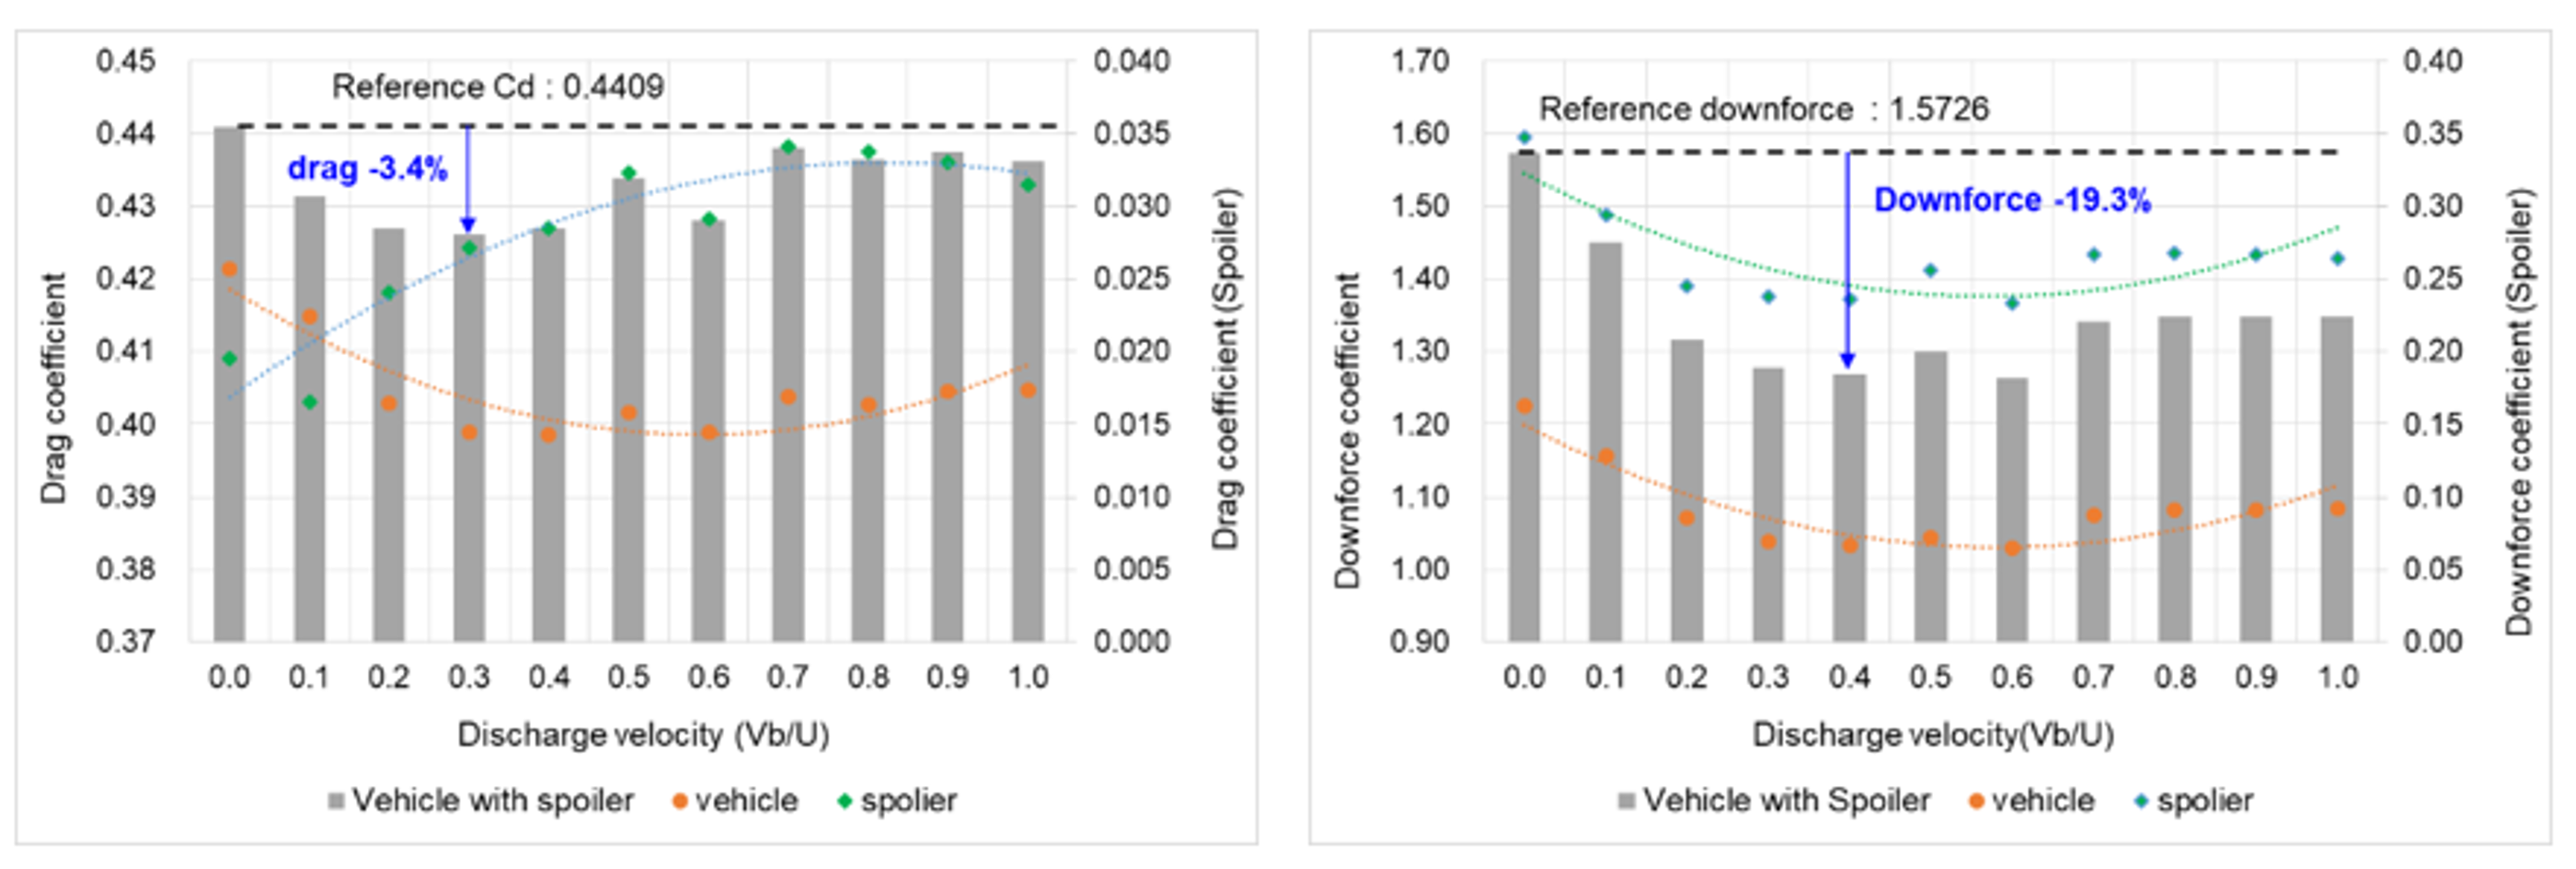
Figure 14 shows the aerodynamic coefficients for various discharge speeds at the vehicle driving speed of 300 km/h. The aerodynamic drag and downforce were reduced for most discharge flow velocities. For discharge speeds of 30–40% the driving speed, the drag and downforce decreased by 3.4% and 19.3%, respectively. Similar to in the case of the isolated spoiler, the drag of the spoiler itself increased; however, the drag of the vehicle decreased, resulting in the reduction of the drag of the entire system. This phenomenon indicates that the flow separation from the spoiler leads to a change in the wake of the vehicle.
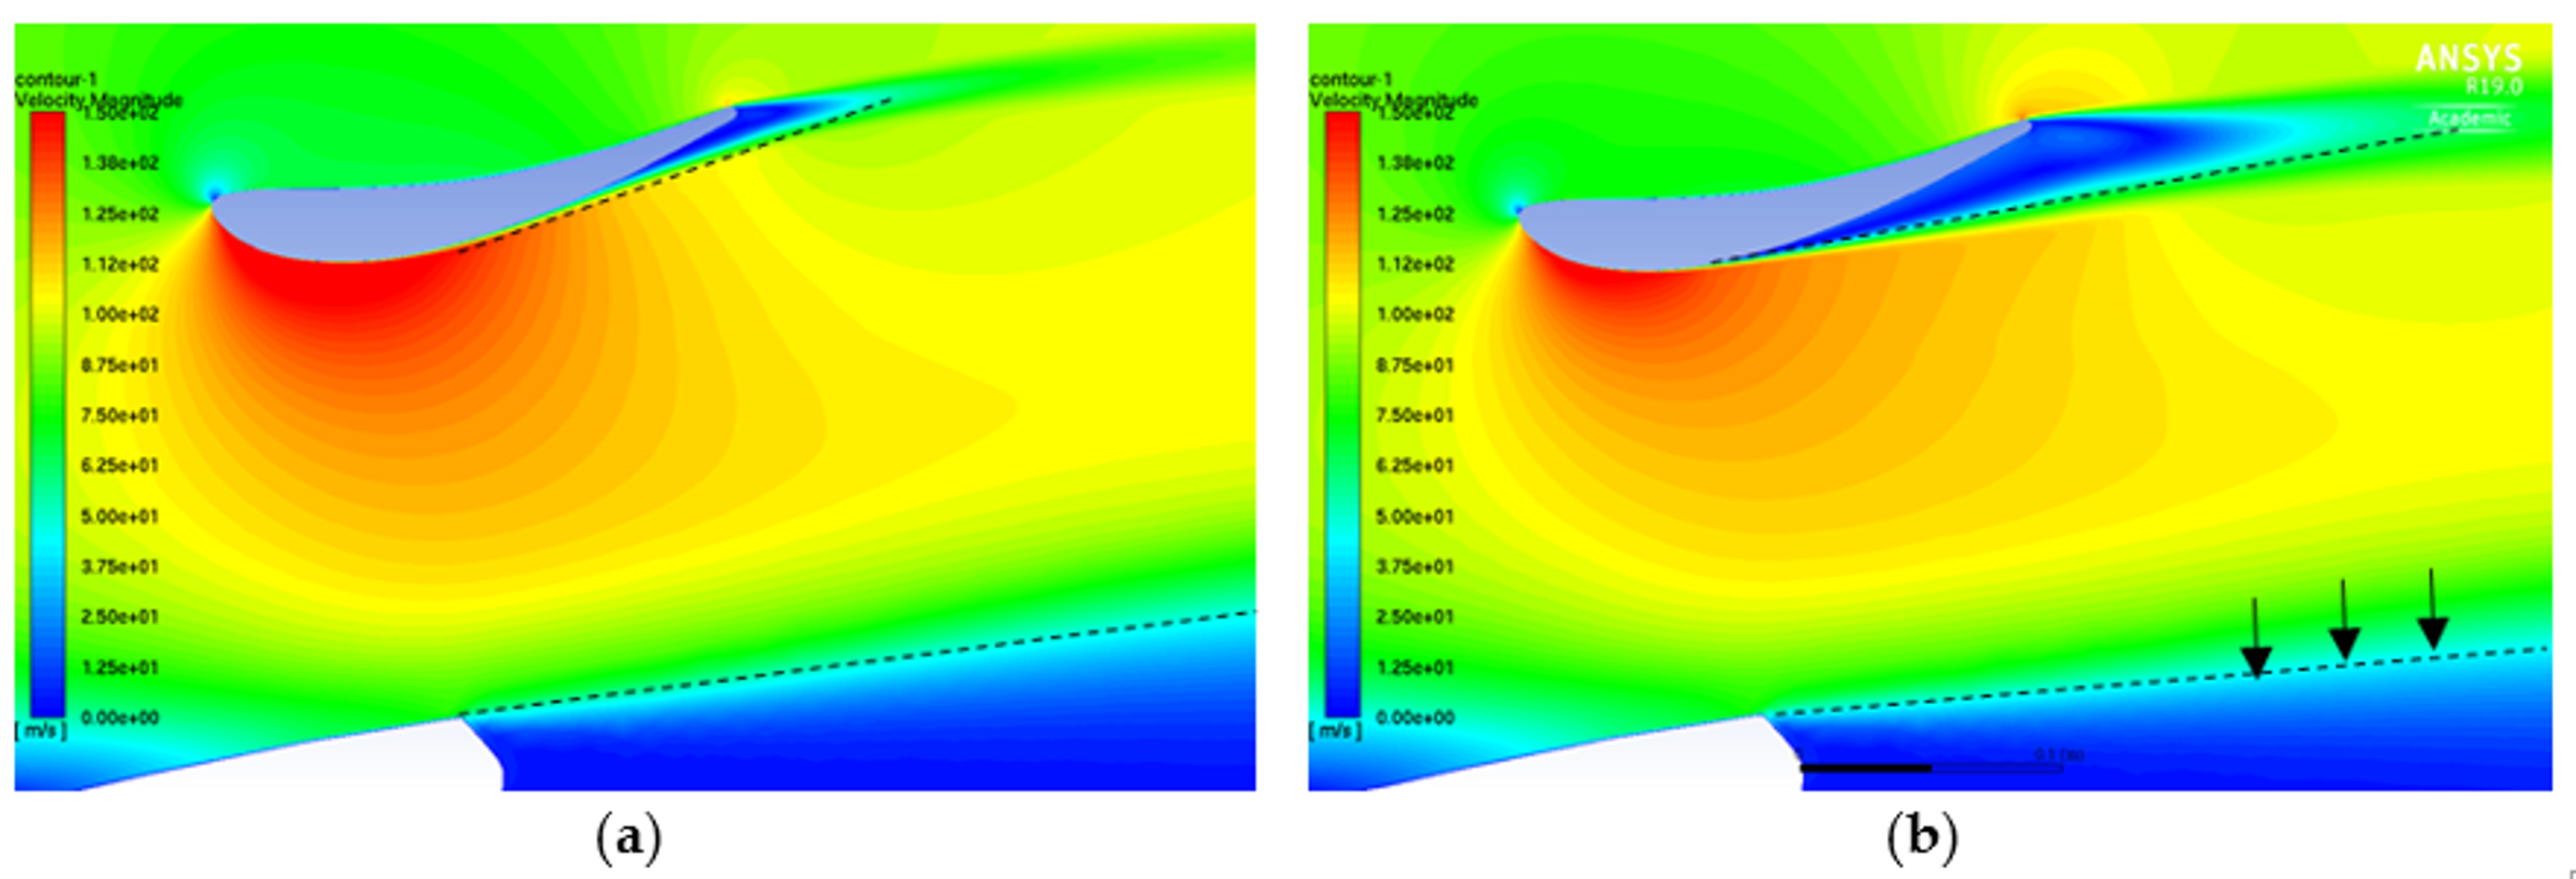
To verify this aspect, the velocity distributions before and after flow discharging were compared, as shown in
Figure 15. Without flow discharge, separation occurred at approximately 75% chord of the spoiler, and the separation area was relatively narrow. In the case of the vehicle, the trunk lid kick-up design weakened the downwash flow, and lifted the wake of the vehicle upwards. In contrast, the flow discharge at 0.50C led to flow separation and increased the separation area of the spoiler. It is apparent that the increased separation area of the spoiler moved the vehicle wake toward the ground and reduced the wake area of the vehicle, thereby reducing the aerodynamic drag of the entire system.
Figure 16 shows the aerodynamic performance pertaining to different vehicle driving speeds when flow discharging occurs at 0.75C. The aerodynamic drag and downforce were reduced by an average of 2.1% and 6.4%, respectively, for the entire range (100–300 km/h) of the vehicle speed.
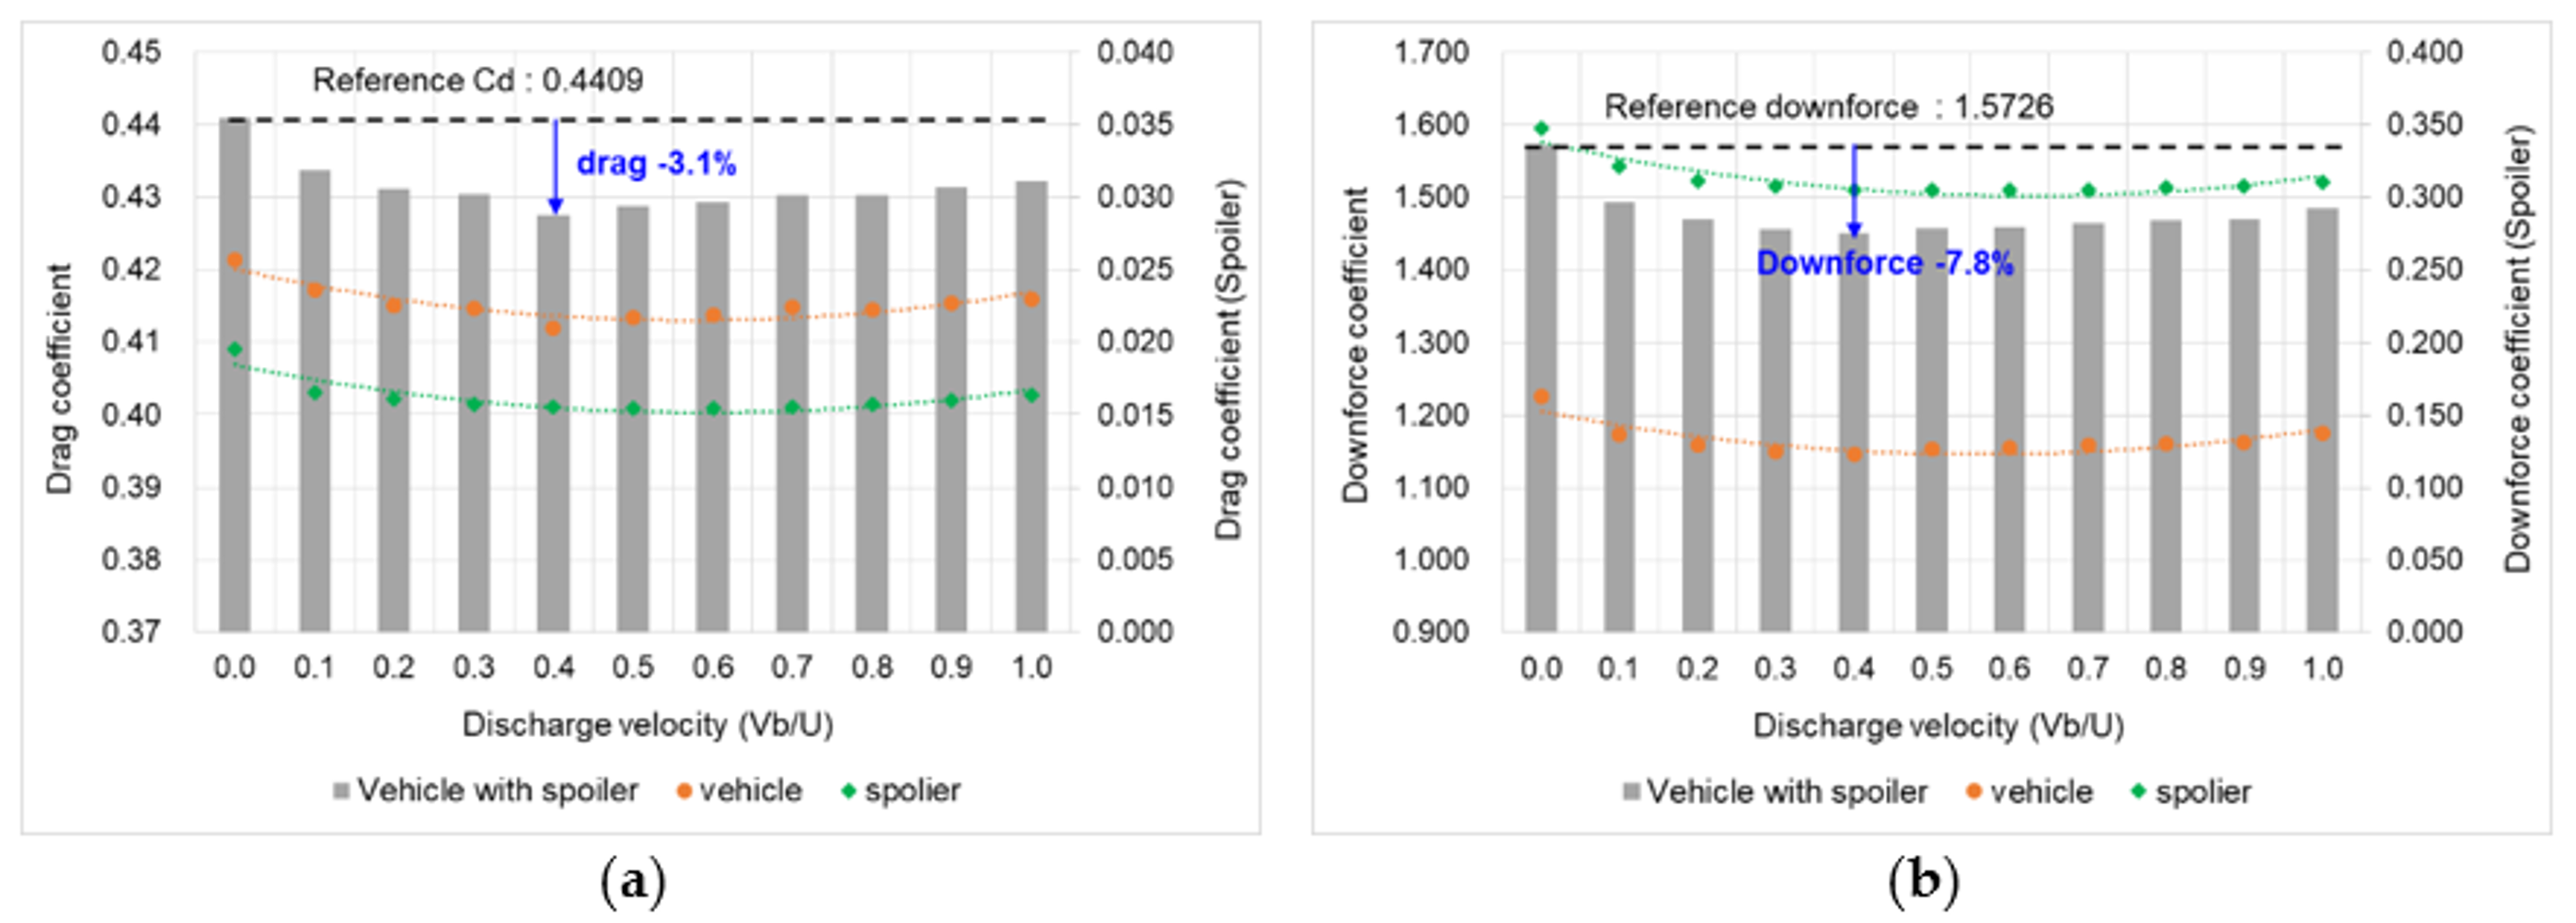
To investigate the effect of the discharge velocity, numerical tests were conducted considered the vehicle speed of 300 km/h.
Figure 17 shows the change in the aerodynamic coefficients. The aerodynamic drag and downforce of the spoiler and vehicle tended to decrease; however, the reduction in the downforce was not significant compared to that when discharging occurs at 0.50C. The maximum reduction was observed at Vb/U = 0.4, during which the drag and downforce decreased by 3.1% and 7.8%, respectively.
4. Conclusions
In this study, active aerodynamic control using flow discharge was investigated using a two-dimensional simplified vehicle with a spoiler configuration. The discharge flow velocity was limited by the geometric shape of the spoiler because the ram air is used as the discharge flow, and under the conditions considered in this work, it was noted that the discharge flow rate was approximately 40% of the vehicle driving speed.
The aerodynamic drag and downforce were simulated with respect to the discharge position and discharge direction for a single spoiler shape. In the case of the flow discharge at 0.50C, strong flow separation occurred, and thus the drag increased sharply. However, when the flow was discharged with a speed of Vb/U = 0.4 at 0.75C, where the flow separation began, the pressure increased at the lower surface of the spoiler, including leading-edge suction. This pressure increase at the lower surface of the spoiler and the cambered spoiler shape resulted in a simultaneous reduction in the aerodynamic drag and downforce.
When the flow was discharged at the position of 0.50C, the aerodynamic drag of the spoiler itself increased owing to the occurrence of the strong flow separation, which is similar to the corresponding phenomenon for a single spoiler. However, the aerodynamic drag of the vehicle decreased owing to the interaction of the spoiler separation flow and the wake of the vehicle, resulting in an average drag reduction of 2.2% for the entire system. At this time, the downforce reduced by up to 15%. The flow discharge at 0.75C led to a decrease of 2.1% and 6.4% in the aerodynamic drag and downforce, respectively. Overall, it was observed that flow discharging at a position of 0.50C is effective for realizing a reduction in the downforce and aerodynamic drag for a simplified vehicle-spoiler configuration.
In this study, a simplified two-dimensional configuration was used to enable the performance of hundreds of iterative calculations with reasonable computational resources. However, in an actual three-dimensional shape, the pressure difference between the upper and lower surfaces of the spoiler leads to the generation of a wingtip vortex. In general, the wingtip vortices cause upwash flow in the spoiler and change the effective angle of attack, thereby creating induced drag, which is the so called “three-dimensional effect.” Therefore, the reduction in the downforce can further decrease the aerodynamic drag, thereby indicating that the drag reduction effect in this case would be greater than that in the two-dimensional case. Future research can thus focus on investigating the three-dimensional effect of the flow discharge.


