Article

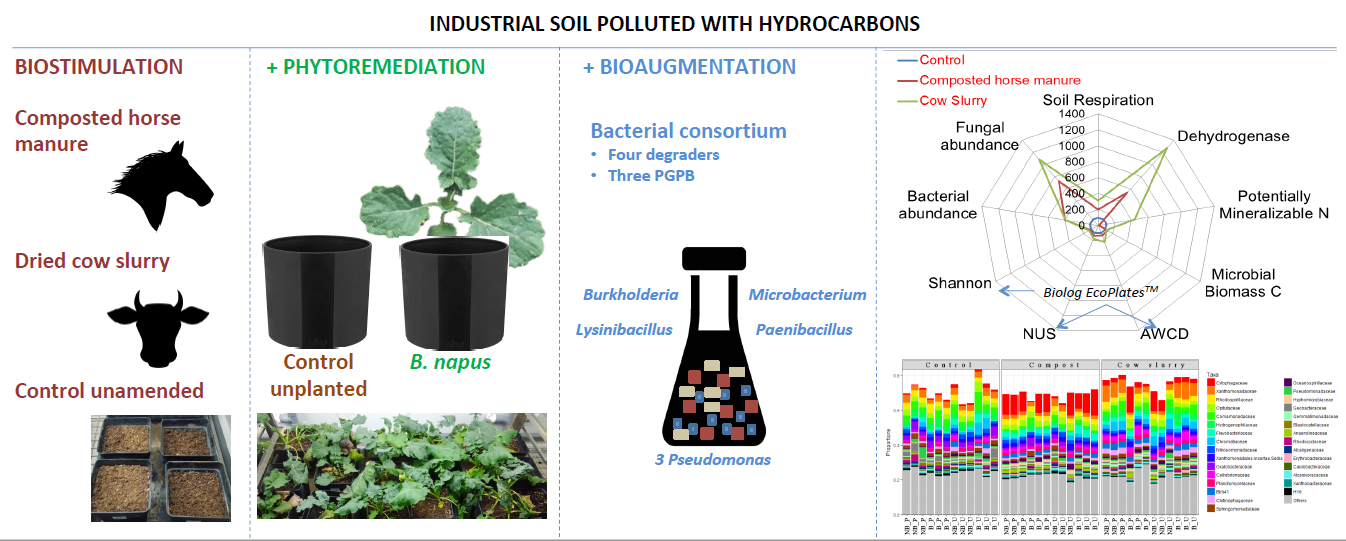
Remediation of Organically Contaminated Soil Through the Combination of Assisted Phytoremediation and Bioaugmentation

1
NEIKER-Tecnalia, Department of Conservation of Natural Resources, Soil Microbial Ecology Group, c/ Berreaga 1, E-48160 Derio, Spain
2
Department of Plant Biology and Ecology, University of the Basque Country, P.O. Box 644, 48080 Bilbao, Spain
3
Instituto BIOFISIKA (CSIC, UPV/EHU), Department of Biochemistry and Molecular Biology, University of the Basque Country, P.O. Box 644, 48080 Bilbao, Spain
*
Author to whom correspondence should be addressed.
Appl. Sci. 2019, 9(22), 4757; https://doi.org/10.3390/app9224757
Submission received: 21 October 2019 / Revised: 3 November 2019 / Accepted: 4 November 2019 / Published: 7 November 2019

Abstract

:
Here, we aimed to bioremediate organically contaminated soil with Brassica napus and a bacterial consortium. The bioaugmentation consortium consisted of four endophyte strains that showed plant growth-promoting traits (three Pseudomonas and one Microbacterium) plus three strains with the capacity to degrade organic compounds (Burkholderia xenovorans LB400, Paenibacillus sp. and Lysinibacillus sp.). The organically contaminated soil was supplemented with rhamnolipid biosurfactant and sodium dodecyl benzenesulfonate to increase the degradability of the sorbed contaminants. Soils were treated with organic amendments (composted horse manure vs. dried cow slurry) to promote plant growth and stimulate soil microbial activity. Apart from quantification of the expected decrease in contaminant concentrations (total petroleum hydrocarbons, polycyclic aromatic hydrocarbons), the effectiveness of our approach was assessed in terms of the recovery of soil health, as reflected by the values of different microbial indicators of soil health. Although the applied treatments did not achieve a significant decrease in contaminant concentrations, a significant improvement of soil health was observed in our amended soils (especially in soils amended with dried cow slurry), pointing out a not-so-uncommon situation in which remediation efforts fail from the point of view of the reduction in contaminant concentrations while succeeding to recover soil health.

Graphical Abstract

1. Introduction

Bioremediation, or the use of microorganisms to detoxify or remove contaminants, has great potential for the remediation of contaminated soils [1,2,3]. Bioremediation can be performed through: (i) natural attenuation, or the natural process of contaminant degradation; (ii) biostimulation, or the modification of the environmental conditions to stimulate the biodegradation ability of indigenous microorganisms; and (iii) bioaugmentation, or the introduction of exogenous microorganisms with the capacity to degrade the target contaminants [4,5,6].
Industrial soils are most frequently affected by the presence of more than one contaminant, thus hindering the application of biological remediation techniques. For instance, in petroleum contaminated soils, aliphatic and aromatic hydrocarbons [including polycyclic aromatic hydrocarbons (PAHs)] are often mixed [7]. Among petroleum-derived contaminants, PAHs are of particular concern since they can seriously affect human health [8].
Rhizoremediation (i.e., the use of plants and their associated microorganisms to remediate contaminated soils, usually as a result of the stimulation of the catalytic activities of soil microorganisms by plant roots) has great potential for the remediation of organically-contaminated soils [9,10], owing to the fact that plant roots emit exudates that provide nutrients and energy for rhizobacteria, which makes rhizospheric microbial communities more abundant and active than those in bulk soil [11,12]. In particular, rhizoremediation has been suggested to be the primary mechanism responsible for hydrocarbon degradation in soil [13]. Actually, some root exudates, such as oxalic acid and citric acid, have the ability to desorb PAHs, thus facilitating their degradation by soil bacterial populations [7].
On the other hand, bacterial consortia with the metabolic ability to degrade organic contaminants are often added to contaminated soils in a process called bioaugmentation [5,14]. In addition to contaminant-degrading bacterial strains, plant growth-promoting rhizobacteria and bacterial endophytes (i.e., strains isolated from the interior of plant tissues) have demonstrated their potential for phytoremediation, owing to their ability to stimulate plant growth and/or protect plants against contaminant toxicity through several mechanisms [15,16]. Thus, it has been reported [17] that endophyte inoculation can improve the physiological status of Festuca rubra plants by increasing the content of carotenoids, chlorophylls and the Fv/Fm ratio (an estimate of the photosynthetic efficiency of photosystem II) by 69, 65 and 37%, respectively, while also enhancing the values of a variety of microbial indicators of soil health.
Furthermore, organic amendments, such as animal manure and compost, are recurrently used to improve soil physicochemical (e.g., porosity, aeration, water holding capacity, structural stability, nutrient availability) and biological (e.g., microbial biomass and activity) properties [18,19], as well as to promote plant colonization and growth, during biological remediation processes. Composting organic amendments can minimize chemical and especially biological risks, such as, for instance, the presence of potential human pathogens [20].
An often-mentioned paradigm within the soil remediation field is that “the ultimate goal of any soil remediation process must be not only to reduce the concentration of the target contaminants but, most importantly, to also improve soil health” [4,21,22,23,24,25]. In this respect, many physicochemical methods of soil remediation are known to cause a negative impact on soil health. As a matter of fact, some of them have been tagged as more damaging to the soil ecosystem than the contaminants themselves [4]. Indeed, many soil remediation methods actively reduce the concentration of the contaminants at the expense of negatively affecting the integrity of the soil ecosystem, i.e., soil health. Moreover, during the biodegradation of organic contaminants, highly toxic intermediate transformation products can be produced, leading to adverse and frequently unknown consequences for soil health [4]. Unfortunately, most soil remediation works only aim at reducing the concentration of the target contaminants below regulatory limits, most of which have been established from tests that lack the required level of ecological relevance.
Accordingly, relevant indicators of soil health must always be included in remediation monitoring programs aimed at evaluating the effectiveness of the applied treatments (effectiveness in terms of soil health improvement). As compared to physicochemical properties, microbial parameters are increasingly being used as indicators of soil health, owing to their sensitivity, fast response, ecological relevance, and capacity to provide information that integrates different environmental factors [24,25,26].
In this study, we aimed to remediate an organically-contaminated industrial soil using a combination of assisted rhizoremediation and bioaugmentation. We hypothesized that the combination of approaches such as (i) assisted rhizoremediation with Brassica napus plants, and (ii) bioaugmentation with a bacterial consortium with the metabolic ability to degrade hydrocarbons and promote the growth of plants, would both reduce the concentration of soil contaminants and improve soil health. For that reason, we assessed the effectiveness of the applied remediation treatments in terms of both (i) reduction in contaminant concentrations and (ii) improvement of soil health.

2. Materials and Methods

2.1. Experimental Design

The soil used in this study was collected (to a depth of 1 m, as previous information showed that the plume of contamination reached 1 m deep) from a chronically contaminated site near Bilbao, Spain. The soil was mechanically sieved (<20 mm mesh), air dried until constant weight, and finally sieved again to <6 mm. The analysis of soil contaminants was carried out by a certified laboratory (SYNLAB Analytics & Services B. V, Rotterdam, The Netherlands). PAHs were extracted in hexane/acetone by agitation and determined by Gas Chromatography-Mass Spectrometry (GC-MS) [27]. C10-C40 hydrocarbon fractions were extracted in hexane/acetone and determined by Gas Chromatography-Flame Ionization Detector [28]. C5-C10 hydrocarbon fractions were extracted in methanol and determined by GC-MS [29].
In order to facilitate the bioavailability and degradability of recalcitrant contaminant fractions, before placing the soil in the experimental pots (see below), rhamnolipids (10 mg kg−1 DW soil, Sigma-Aldrich R90-10G) and sodium dodecyl benzenesulfonate (50 mg kg−1 DW soil, Sigma-Aldrich 289957) were added to the soil and then hand-mixed thoroughly to ensure a homogeneous mixture.
In this study, 12 treatments were tested (in triplicate; a total of 36 pots; Table 1). Two organic amendments were individually applied to the contaminated soil as biostimulating agents (bioremediation via biostimulation): composted horse manure (C: 34%, N: 2.0%; C/N ratio = 17) and dried cow slurry (C: 42%, N: 2.8%; C/N ratio = 15). Amendment doses were adjusted to reach a final organic matter (OM) concentration of 20%. A control soil with no organic amendment was also established.
Experimental pots containing 2 kg of the biostimulated organically-contaminated industrial soil were placed in a growth chamber under the following controlled conditions: 25/22 °C day/night, 65% relative humidity, and 300 μmol photon m−2 s−1, with a 14-h photoperiod. Half of the pots were planted with Brassica napus for rhizoremediation purposes. In a previous rhizoremediation experiment [30], we found B. napus plants to have a key role in the recovery of the health of soils contaminated with metals and diesel. Approximately, 20 seeds per pot were superficially buried in the soil and, after seed germination, only 6 homogeneous plants per pot were left (the rest were manually removed).
Fifty days after initiation of the treatments (to allow enough time for plant development), bioaugmentation with a bacterial consortium was performed in half of the pots. The bacterial strains used for this consortium were: (i) Burkholderia xenovorans LB400 DSM-17367, Paenibacillus sp. and Lysinibacillus sp., three strains previously characterized by their ability to degrade hydrocarbons; and (ii) four endophyte strains (one Microbacterium sp. and three Pseudomonas sp.) which, in previous studies [17], showed their plant growth-promoting traits. The strains were grown overnight in Luria-Bertani broth (Sigma-Aldrich L3022) at 28 °C on a rotary shaker (125 rpm, Sartorius, Certomat® BS-1). Subsequently, the bacterial cells were collected by centrifugation (6000× g, 5 min, 4 °C), washed twice with sterile phosphate-buffered saline (PBS), and resuspended in sterile 0.85% KCl to obtain a final inoculum density of approximately 109 CFU ml−1 (OD660 = 1.25) [12]. Before their application to the experimental soil, all the individual strains (a total of 7 strains) were mixed together, in equal proportion, to form the bioaugmentation consortium. Bioaugmented pots received 100 mL of the bacterial consortium solution, while non-bioaugmented soils received the same volume of sterile 0.85% KCl. The bioaugmentation process was repeated weekly for 6 consecutive weeks.
Three months after the beginning of the experiment, plant shoots were harvested and dried at 70 ºC. Soil samples were taken and stored at 4 °C prior to analysis.

2.2. Soil Physicochemical Properties

The concentration of total petroleum hydrocarbons (TPHs) and, specifically, PAHs in soil samples was determined by the abovementioned certified laboratory. Soils were sieved to <2 mm and oven dried at 105 °C for 48 h for the determination of dry weight. Soil OM content was determined according to the modified Walkley-Black method as described by Nelson and Sommers [31]. In brief, 0.5 g of soil was weighed out into 100 mL digestion tubes and 20 mL concentrated H2SO4 was added. The tubes were kept at 150 °C for 30 min in a pre-heated block digestor (Kjeldahl block digestor, Tecator Inc). The tubes were taken out and the solution was brought to room temperature. The contents were quantitatively transferred to a 500 mL conical flask and titrated with a 0.5 M Fe (NH4)2 (SO4)2 solution. Soil pH and electrical conductivity (EC) were determined in water at 1:2.5 w/v and 1:5 w/v, respectively. Water soluble organic carbon (CWS) was determined as follows: 1 g of soil was suspended in 5 mL of deionized water and, then, the suspension was horizontally shaken at 175 rpm for 1 h. After centrifugation at 3500 rpm, organic carbon (C) was determined according to Wu et al. [32]. Total C and nitrogen (N) were analysed by combustion at 950 °C with a TruSpec CHN analyser (LECO Corporation, Michigan USA) according to ISO 10694 [33] and ISO-13878 [34], respectively. These soil physicochemical properties are often determined in bioremediation studies [35,36].

2.3. Soil Biological Properties

Microbial biomass C (CMB) was determined by the fumigation-extraction method [37]: briefly, 5 g of soil was fumigated for 24 h with amylene-stabilized CHCl3 and extracted in 20 mL of 0.5 M K2SO4. Then, 3.5 mL of chromium reagent [chromium (VI) oxide (0.06% w/v); sulfuric acid (65% v/v)] was added to 2 mL of extract and incubated at 150 ºC for 60 min. The organic C concentration was determined spectrophotometrically at 445 nm. Microbial biomass C was calculated as the difference between the organic C concentration of the fumigated and unfumigated extracts [32].
DNA was extracted from soil (0.25 g) using a DNA PowerSoil™ Isolation Kit (MO Bio Laboratories, CA) according to the manufacturer’s instructions. Prior to DNA extraction, soil samples were washed twice in 120 mM K2HPO4 (pH 8.0) to wash away extracellular DNA [38]. Extracted DNA concentrations were determined using a TapeStation 4200 (Agilent Technologies).
Real-time qPCR was carried out to measure total bacterial (16S rRNA) and fungal (18S rRNA) gene copy abundances [39]. Each 25 μL reaction mixture contained 1.0 μL of template DNA, 12.5 μL of SYBR PremixExTaq (Takara Bio, Inc.), 1.5 μL of each primer (at a concentration of 30 and 20 μM for bacteria and fungi, respectively), 0.5 μL of ROXTM dye, and 8.0 μL of sterile deionized water. Each sample was measured in triplicate. The primers and qPCR conditions are shown in Table S1 [40,41]. The minimum R2 value obtained in the calibration curves was 0.986. The minimum efficiency in the PCR was 96.9%.
Soil respiration (R) was determined by measuring CO2 evolution in hermetic flasks incubated at 30 °C for 72 h according to ISO 16072 [42]. Potentially mineralizable N (NPM) was determined as follows [43]: briefly, deionized water was added to 2.5 g of fresh weight (FW) soil. The suspension was incubated for 7 days in a water bath at 40 °C. Then, 6.25 mL of 4 M KCl and 1 mL of dichloroisocyanurate (50 mg in 50 mL deionized water) were added to incubated and non-incubated soils. After 30 min at room temperature, absorbance was read at 670 nm.
The activities of β-glucosidase (EC 3.2.1.21), β-glucosaminidase (EC 3.2.1.30), xylosidase (EC 3.2.1.37), acid phosphatase (EC 3.1.3.2), L-Ala-aminopeptidase (EC 3.4.11.12) and L-Leu-aminopeptidase (EC 3.4.11.1) were determined according to ISO/TS 22939 [44], using fluorogenic substrates [4-methylumbelliferyl (MUF) and 7-amino-4-methylcoumarin (AMC)] in 96-microwell plates. Briefly, 100 µL of the soil suspension (2.5 g in 150 mL water) was dispensed onto the plates. The four MUF-activities (β-glucosidase, β-glucosaminidase, xylosidase, acid phosphatase) were assayed at pH 6.1 in 150 mM MES [2-(N-morpholino) ethanesulfonic acid] buffer. The two AMC-activities (L-Ala-aminopeptidase, L-Leu-aminopeptidase) were assayed at pH 7.8 in 75 mM Tris-HCl buffer. The plates were continuously stirred and kept at 30 °C. Fluorescence was measured five times at 20 min intervals. Arylsulphatase (EC 3.1.6.1) activity was determined according to Dick et al. [45]. Urease (EC 3.5.1.5) activity was measured following Kandeler and Gerber [46]. Dehydrogenase (EC 1.1) activity was determined according to ISO 23753-2 [47]. Community-level physiological profiles (CLPPs) of cultivable heterotrophic bacteria were determined with Biolog EcoPlates™ following Epelde et al. [48]. Data were calculated from Gompertz regressions (three parameters) of the obtained curves as proposed by Preston-Mafham et al. [49].
To determine the effect of treatments on the structure of soil prokaryotic communities, amplicon libraries were prepared using a dual indexing approach with sequence-specific primers [50] targeting the V4 region of the 16S rRNA gene: 519F (CAGCMGCCGCGGTAA) adapted from Øvreås et al. [51] and 806R (GGACTACHVGGGTWTCTAAT) adapted from Caporaso et al. [52]. Briefly, adapter-linked forward and reverse primers were used in the first amplification step using the following reaction in a total volume of 20 μL: 1 μL template community DNA, 1 μM each of the forward and reverse primers, and 1× HotStarTaq DNA Polymerase (Qiagen QI203443). The following PCR parameters were used: initial denaturation at 95 °C for 15 min, followed by 25 cycles of 95 °C for 20 s, 55 °C for 30 s, 72 °C for 30 s, with a final extension at 72 °C for 7 min. Amplicon libraries were cleaned using AMPure XP (Beckman Coulter Genomics). Barcoded primers were used in the second amplification step (10 cycles) in a total volume of 50 μL [50]. Sequencing was carried out with an Illumina MiSeq V2 platform and pair-ended 2 × 250 nt at Tecnalia, Spain. The read paired ends were merged, quality filtered (i.e., primer trimming, removal of singletons and chimeric sequences) and clustered into operational taxonomic units (OTUs) [53]. CREST was used for making taxonomical assignments [53]. Sequencing data were submitted to the European Nucleotide archive (accession PRJEB32948). The abovementioned microbial properties are often analysed in bioremediation studies [54,55].

2.4. Statistical Analyses
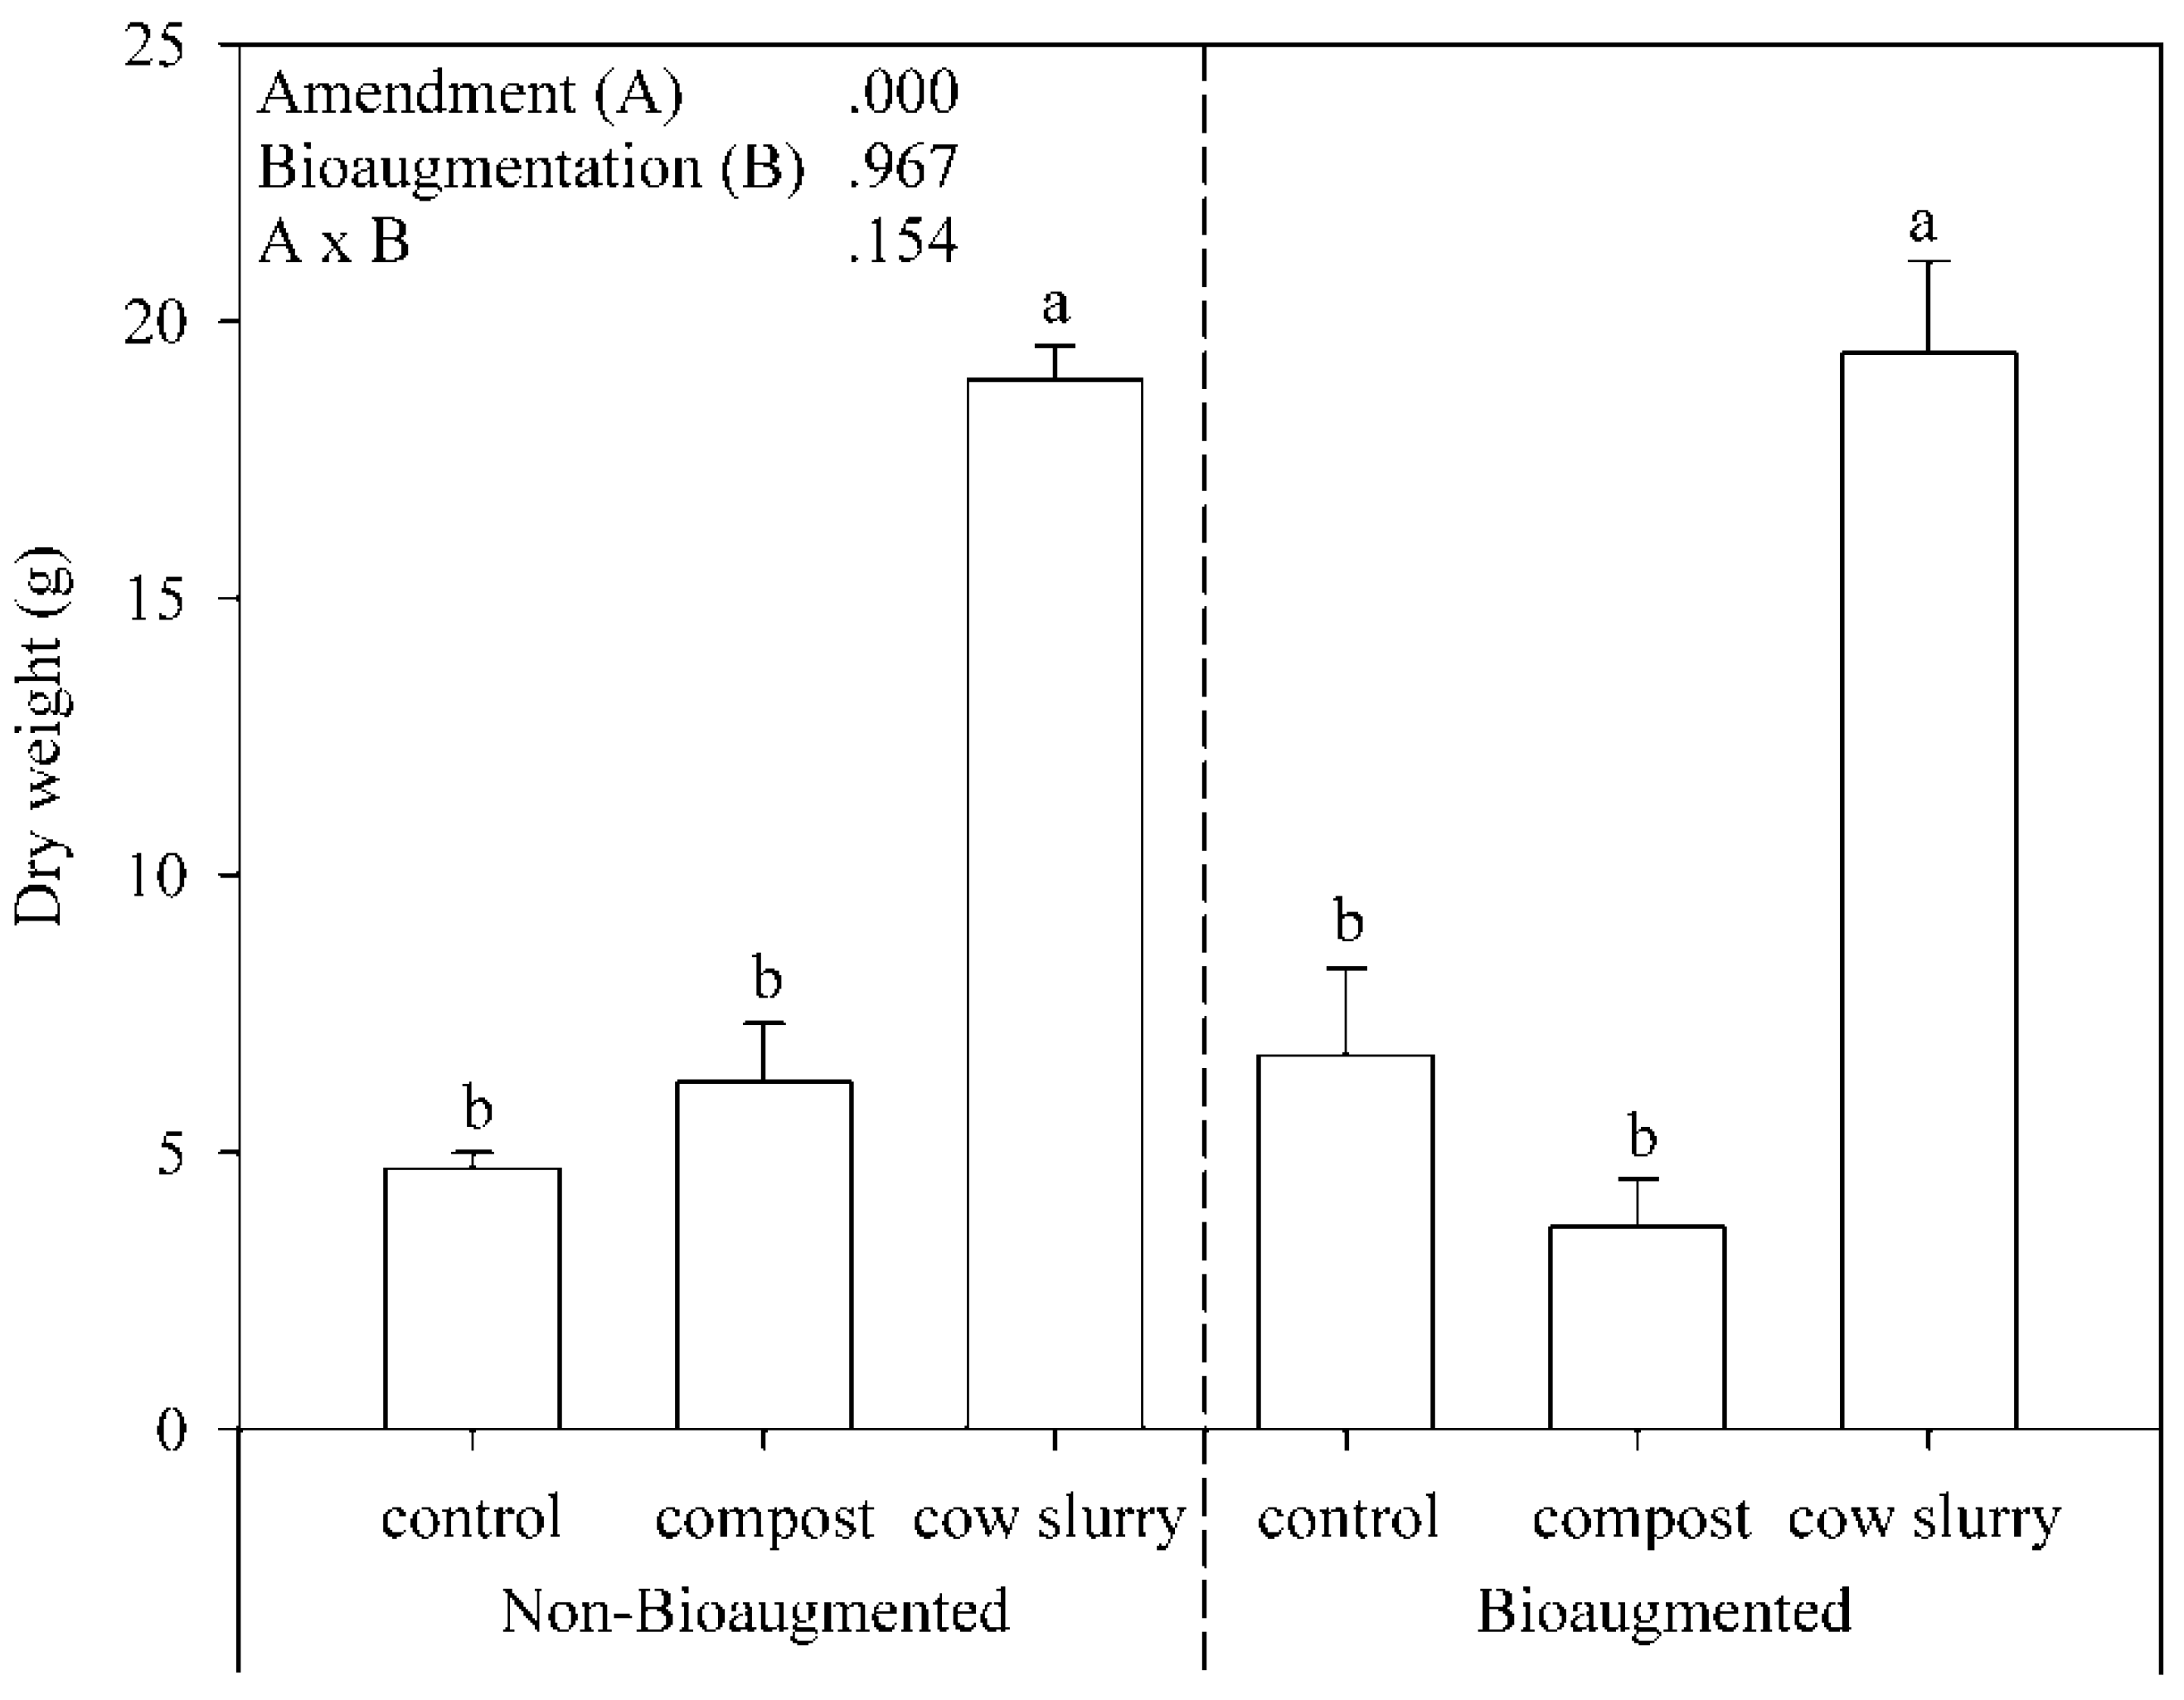
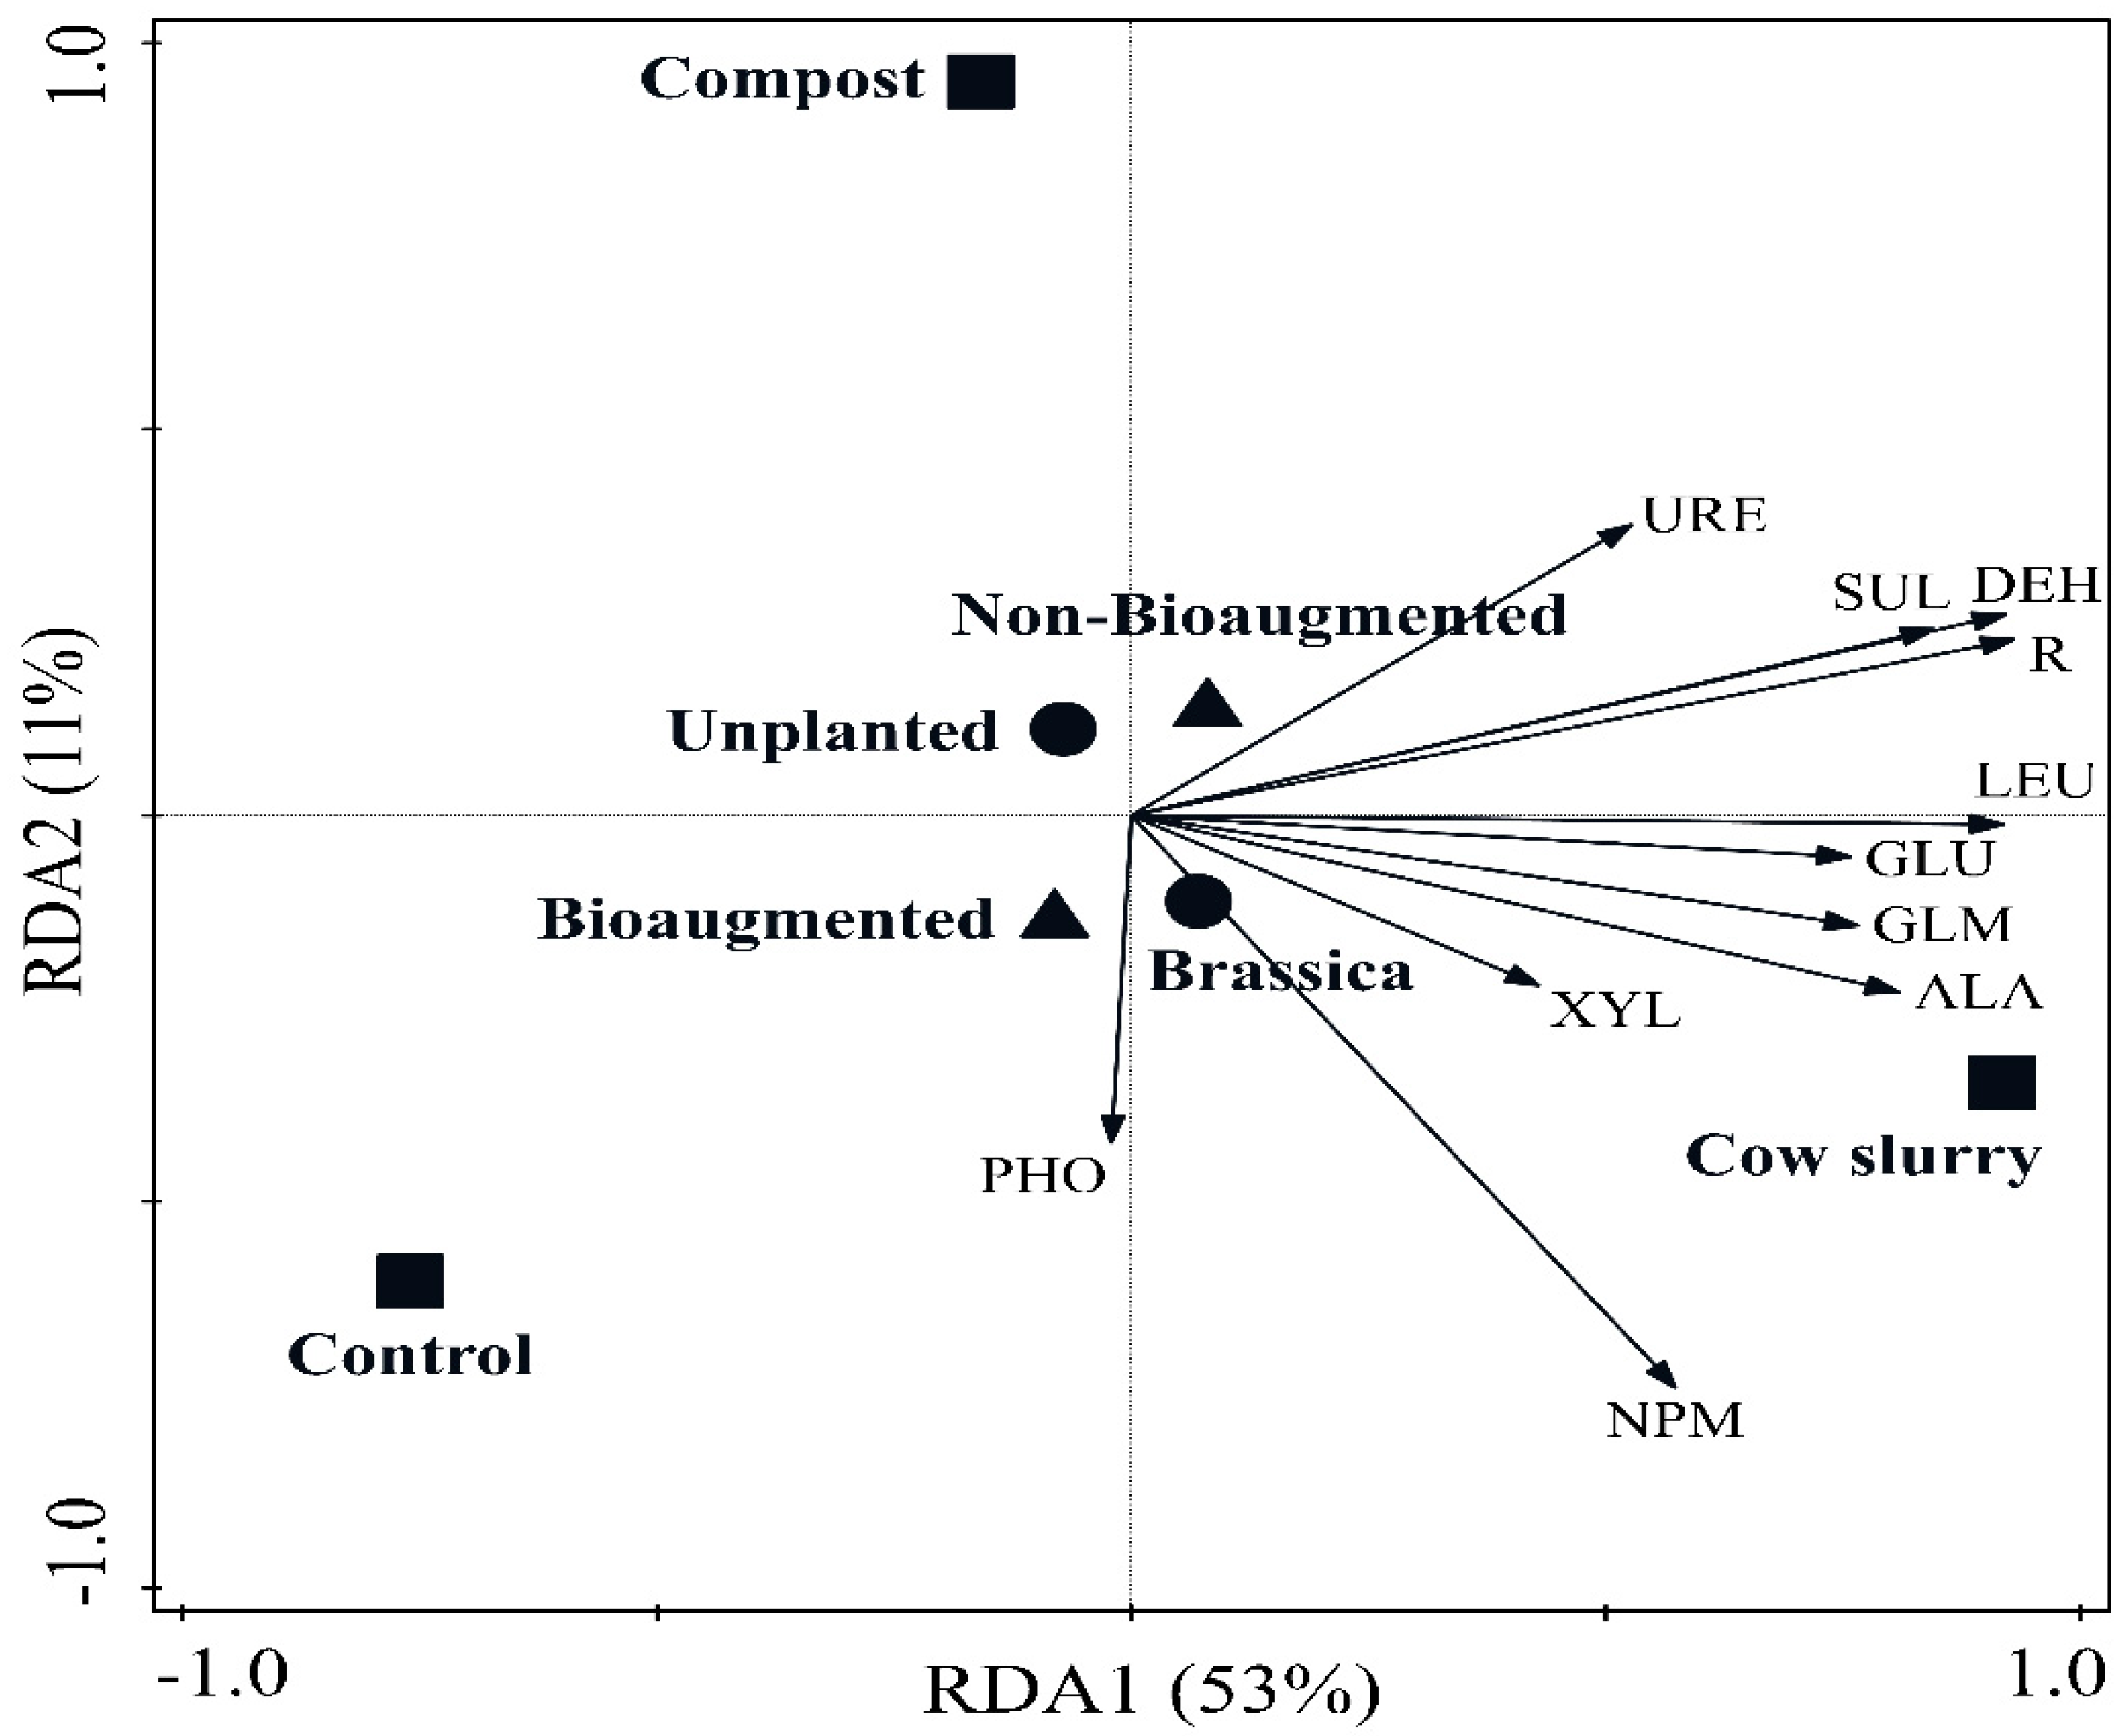
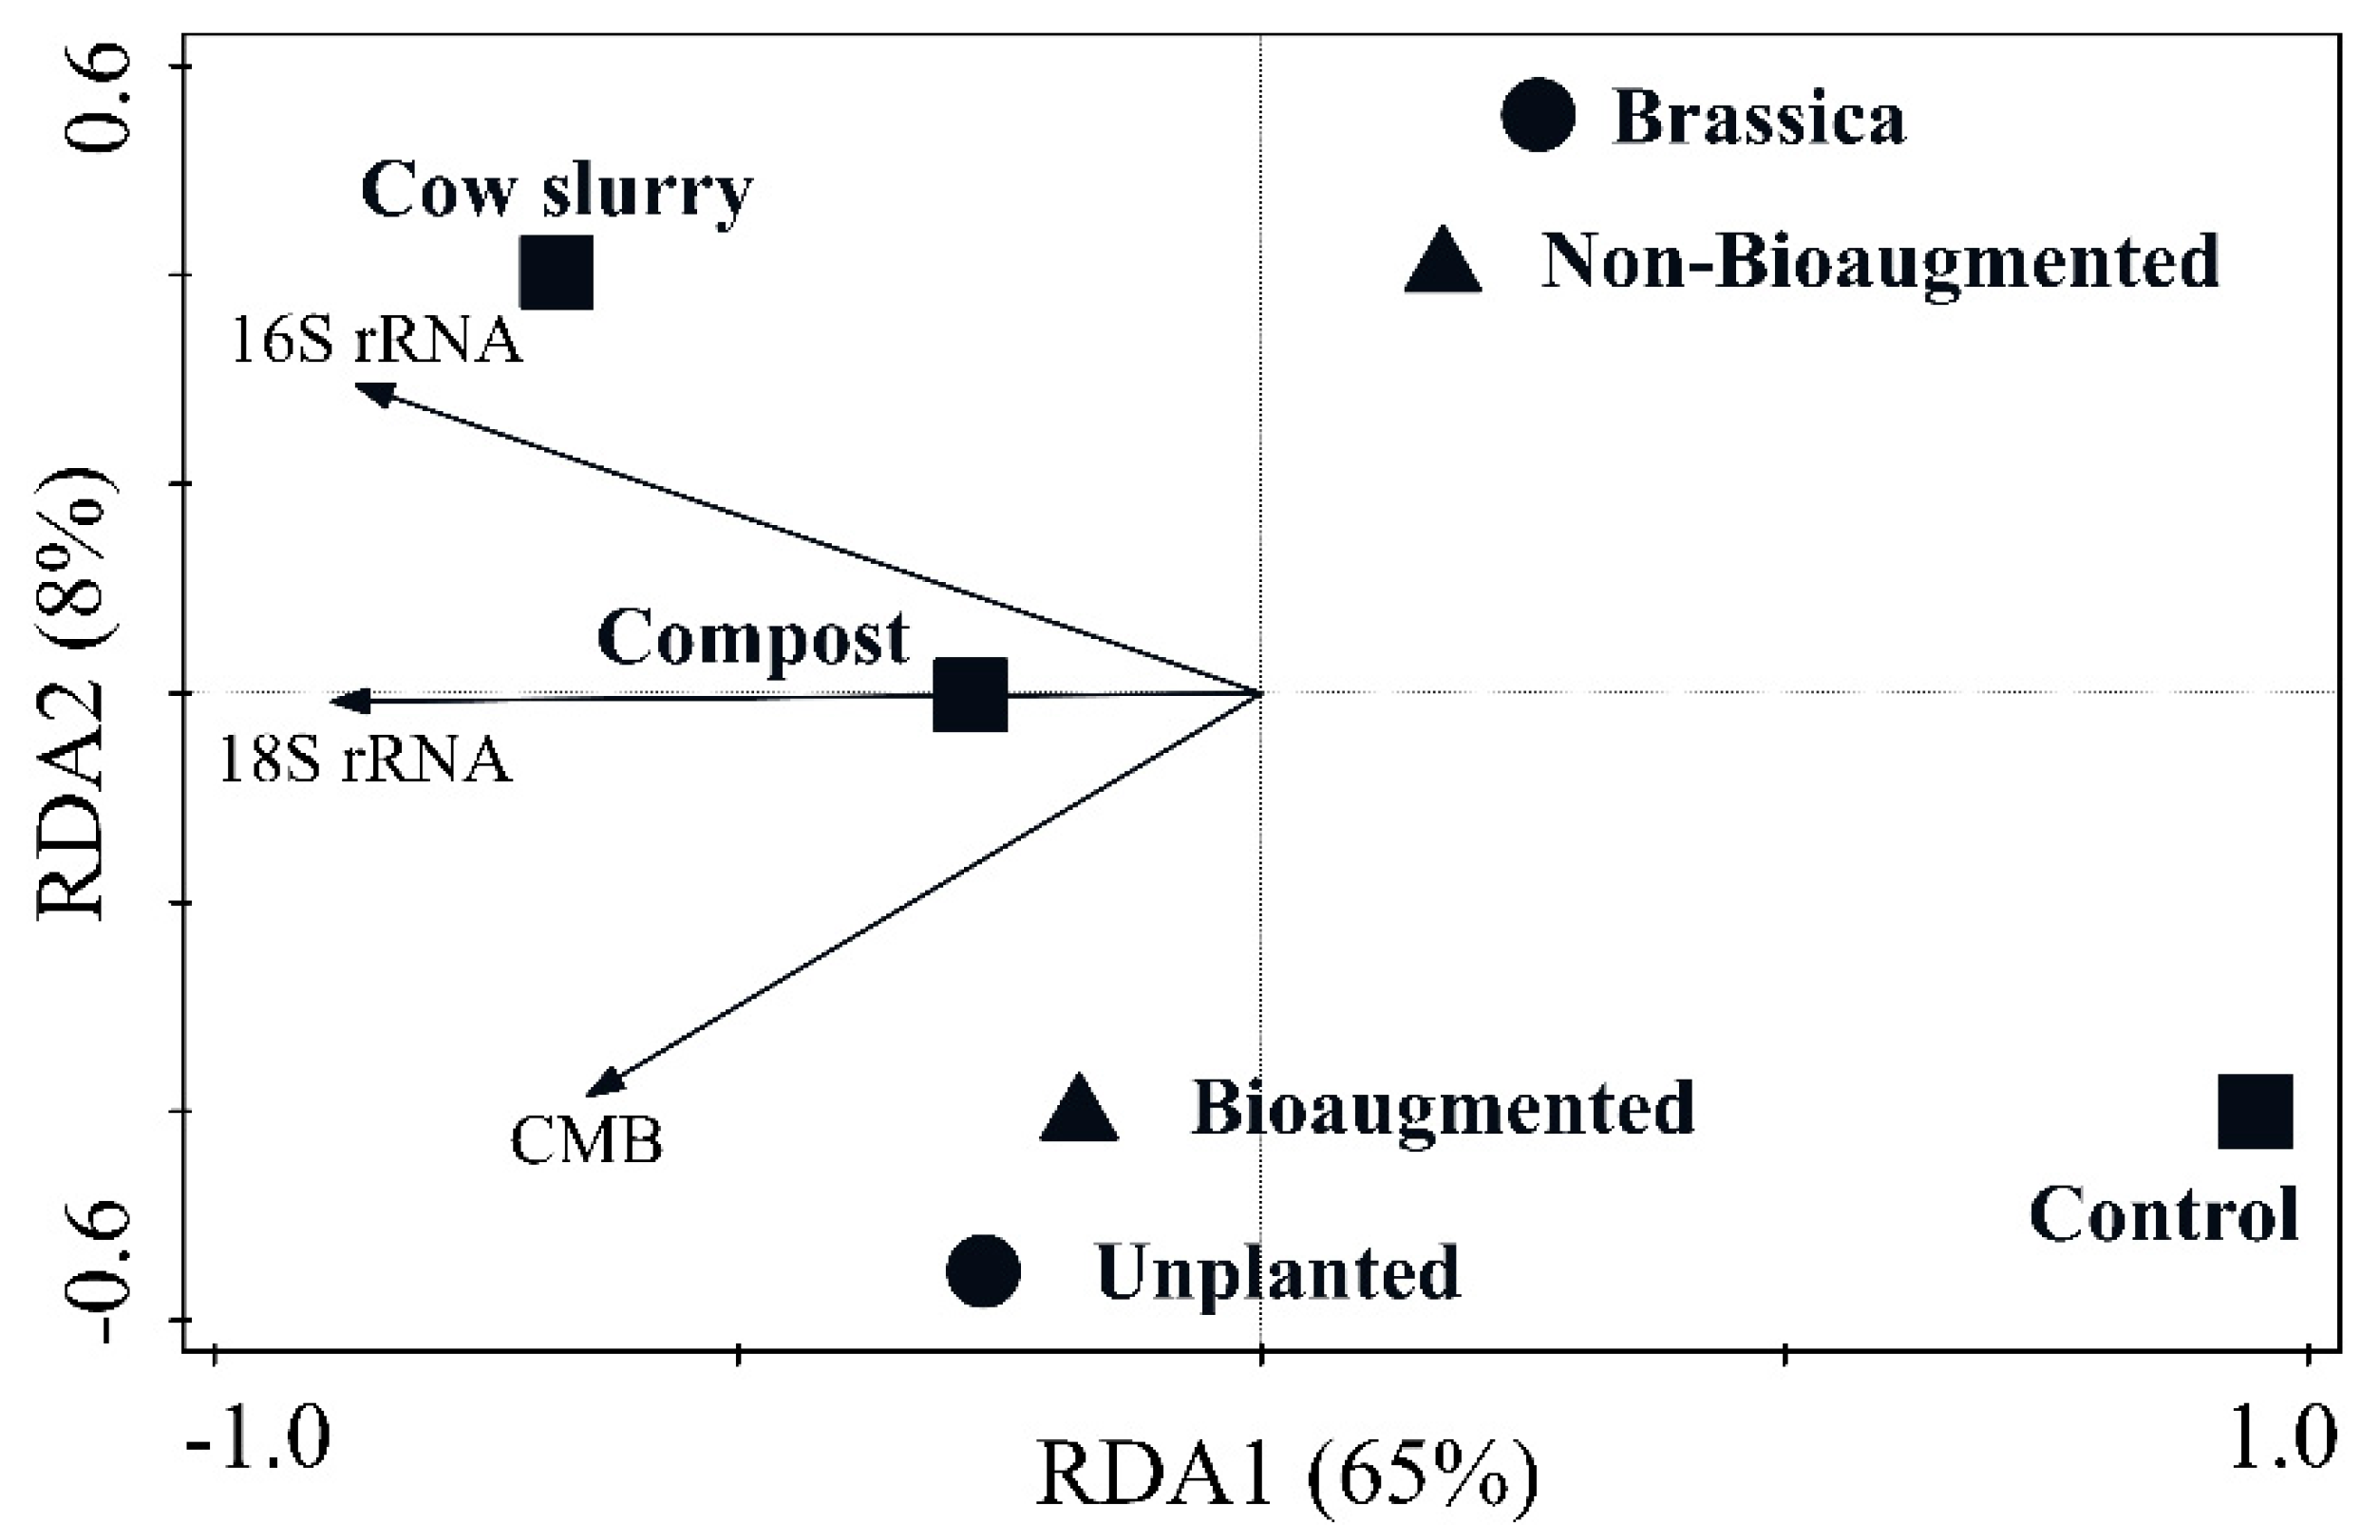
To explore the relationships between treatments and values of the soil parameters, redundancy analyses (RDA) and variation partitioning analyses were carried out using Canoco 5.0 [56]. Data were checked for normality (Kolmogorov–Smirnov test) and homogeneity of variance (Cochran C test). The effects of the experimental factors (Brassica napus “plant” growth vs. unplanted; “bioaugmentation” with the bacterial consortium vs. non-bioaugmentation; and “amendment” application of composted horse manure or dried cow slurry vs. unamended control) and their interactions on soil microbial parameters were evaluated by three-way ANOVA using SPSS 20.0 Statistics Software (SPSS, Chicago, IL, USA). When double and triple interactions were significant, differences (p < 0.05) among factors or levels of factors were tested using Duncan’s test. Differences in plant dry weight were evaluated by two-way ANOVA (San Francisco, CA, USA).
Determination of α-diversity indices, multivariate statistics and visualization of 16S rRNA amplicon sequencing data were performed with the R package vegan [57]. Rarefied richness estimates (calculated by interpolating the expected richness at the lowest sample-specific sequencing depth) were used to compensate for variations in the read numbers across samples. Decostand function was used to transform OTU distributions into relative abundances. Subsequent calculations of the Bray–Curtis dissimilarity matrices for comparisons of the OTU community compositions were performed as described by Lanzén et al. [50].

3. Results

The analysis of the soil collected from the industrial site revealed that the soil was contaminated with 8500 mg kg−1 DW (dry weight) soil of total petroleum hydrocarbons (TPHs) and 5200 mg kg−1 DW of PAHs. Concentration values for the individual PAHs and hydrocarbon fractions were (mg kg−1 DW soil): naphthalene = 120; acenaphthene = 78; fluorine = 82; phenanthrene = 500; anthracene = 140; fluoranthene = 830; pyrene = 570; benzo(a)anthracene = 550; chrysene = 520; benzo(b)fluoranthene = 570; benzo(k)fluoranthene = 250; benzo(a)pyrene = 400; dibenzo(a.h)anthracene = 89; benzo(ghi)perylene = 220; indeno(1.2.3-cd)pyrene = 240; sum of 10 PAH-VROM = 3800; C10-C12 hydrocarbon fraction = 100; C12-C16 hydrocarbon fraction = 380; C16-C21 hydrocarbon fraction = 2400; and C21-C40 hydrocarbon fraction = 5600. At the end of the experiment, prior to their interpretation, soil contaminant concentrations were corrected to take into account the “dilution factor” resulting from the application of the organic amendments. Contaminant concentrations at the end of the experiment are shown in Table 2. Statistically significant differences were detected for the “Plant x Bioaugmentation” interaction: values of TPHs were significantly lower in bioaugmented planted pots than in non-bioaugmented planted pots; by contrast, values of total-PAHs were higher in bioaugmented planted pots than in non-bioaugmented planted pots. Similarly, statistically significant differences in contaminant concentrations were detected for the “Plant x Amendment” interaction: in planted pots, the addition of dried cow slurry resulted in higher values of total-PAHs with respect to (i) pots amended with composted horse manure and (i) unamended controls (and also with respect to unplanted pots amended with dried cow slurry). In any case, it was concluded that the applied treatments failed at reducing the concentrations of the target soil contaminants (TPHs and PAHs) since, at the end of the experiment, there were no significant differences among treatments, including the untreated control (unplanted, non-bioaugmented control). Then, the observed reduction in contaminant concentrations, compared to the initial values (see above), was most likely due to soil manipulation, not to the applied remediation treatments.
On the other hand, significantly higher values of plant DW were observed in pots amended with dried cow slurry, compared to pots amended with composted horse manure or unamended controls (Figure 1). Values of total N and CWS were higher in soils amended with composted horse manure (0.39 ± 0.01% and 636 ± 46 mg C kg−1 soil) and dried cow slurry (0.37 ± 0.03% and 565 ± 65 mg C kg−1 soil) than in control unamended soils (0.28 ± 0.02% and 317 ± 28 mg C kg−1 soil) (Table 3). Values of soil pH were slightly, not relevantly, higher in soils amended with composted horse manure, whereas a slight increase in electrical conductivity (EC) was observed in soils amended with dried cow slurry (1.7 ± 0.1 dS m−1) with respect to control soils (1.4 ± 0.1 dS m−1; p < 0.06) (Table 3).
The application of organic amendments, especially dried cow slurry, increased the values of most of the microbial parameters determined here. Microbial activity parameters (see below) were significantly higher in soils amended with dried cow slurry, followed by soils amended with composted horse manure and, finally, unamended controls (Figure 2; F = 16.1, p < 0.002) (Table 4). According to the variation partitioning analysis, “amendment” application accounted for 64% of the explained variation, while “bioaugmentation” and “plant” growth explained only 1.3 and 2.2% of the variation, respectively. Significantly highest values of soil respiration (4 ± 0.3 mg C kg−1 soil) were, in general, obtained in soils amended with dried cow slurry (Table 4). Lowest values of soil respiration (1.57 ± 0.3 mg C kg−1 soil) were detected in unamended controls [planted pots showed significantly higher values (1.85 ± 0.07 mg C kg−1 soil) than unplanted pots (1.30 ± 0.01 mg C kg−1 soil)] (Table 4). Bioaugmentation led to lower values of soil respiration in planted pots amended with composted horse manure and dried cow slurry, compared to unamended controls. Regarding NPM, values were higher (106 ± 24 mg N-NH4+ kg−1 DW soil) in soils amended with dried cow slurry (lowest values—6 ± 3 mg N-NH4+ kg−1 DW soil - were obtained in soils amended with composted horse manure). NPM values were higher in planted vs. unplanted soils (120 ± 13 and 90 ± 25 mg N-NH4+ kg−1 DW soil, respectively). Bioaugmentation did not cause significant differences among treatments in regard to NPM. Concerning soil enzyme activities, the “amendment” factor was significant for all soils, with highest values being detected in soils amended with dried cow slurry. The “plant” factor was significant for 6 enzyme activities (out of 9), with generally higher values observed in planted vs. unplanted pots. No clear effect of the “bioaugmentation” factor was observed for soil enzyme activities.
Regarding parameters that provide information on soil microbial biomass, according to the RDA, values increased in amended soils (Figure 3). The first axis explained 65% of the variance (F = 21.7; p < 0.002). The variation partitioning analysis showed that the “amendment” factor was the most important: it explained 58% of the variation, while “plant” and “bioaugmentation” factors explained only 12 and 5% of the variation, respectively. Unexpectedly, in unamended controls, CMB values were higher in unplanted (1.652 ± 342 mg C kg−1 DW soil) than in planted (977 ± 24 mg C kg−1 DW soil) soils (Table 5). In general, the bioaugmentation treatment resulted in higher CMB values. Both the 16S rRNA (total bacteria) and 18S rRNA (total fungi) gene copy numbers increased in amended soils with respect to controls. The highest gene copy numbers were found in bioaugmented planted soils amended with dried cow slurry: 3.9×10⁸ ± 7.7×10⁷ for 16S rRNA and 30e 5 ± 2.7e5 for 18S rRNA.
Regarding microbial diversity parameters, the duration of the lag phase and t1/2 values (time corresponding to the middle of the exponential phase), calculated from the growth curves of the BiologTM CLPPs, were significantly shorter in soils amended with dried cow slurry (Table 6). In amended controls and soils amended with composted horse manure, planted pots showed significantly lower values of lag phase and t1/2, compared to unplanted pots. The highest slopes of the CLPPs growth curves were observed in soils amended with dried cow slurry (Table 6). In unplanted soils, AWCDt1/2 and AWCDmax values were lower in bioaugmented vs. non-bioaugmented pots. Finally, values of NUSt1/2 and Shannon’s diversity were significantly lower in soils amended with dried cow slurry, compared to unamended controls. According to the RDA performed with the slope values of all the substrate utilization profiles, values were higher in planted soils and soils amended with dried cow slurry (Figure 4). The variation partitioning revealed that the “plant” and “amendment” factors explained 19 and 15% of the variability, respectively.
As far as structural microbial diversity is concerned, our metabarcoding data revealed no significant differences among treatments in terms of Shannon’s diversity. On the contrary, Simpson’s diversity was lower in soils amended with composted horse manure (0.9898), compared to unamended controls (0.9922) and soils amended with dried cow slurry (0.9929) (Table S2). Pielou’s evenness was higher in soils amended with dried cow slurry (0.76), compared to unamended controls (0.74) and soils amended with composted horse manure (0.74). Rarefied richness was significantly lower in soils amended with composted horse manure (4080), compared to unamended controls (3770) and soils amended with dried cow slurry (3750). The clustering analysis (Figure 5) clearly separated unamended controls, soils amended with composted horse manure, and soils amended with dried cow slurry. These results were also reflected in the distribution of the most abundant families (Figure 6). The most abundant families were Cytophagaceae (especially in soils amended with composted horse manure), Xanthomonadaceae (in soils amended with dried cow slurry), Rhodospirillaceae, Opitutaceae and Comamonadaceae (in both unamended controls and soils amended with dried cow slurry). Regarding the bacterial strains used in our bioaugmentation consortium, Pseudomonadaceae doubled its abundance in bioaugmented vs. non-bioaugmented soils. This increase was not observed for Bukholderia, Lysinibacillus, Paenibacillus or Microbacterium.

4. Discussion

4.1. Contaminant Concentrations

In this study, different remediation strategies were applied in an attempt to (i) decrease the concentration of the target contaminants (TPHs, PAHs) in the studied industrial soil, and (ii) improve soil health. Apart from biostimulating soil microbial biomass and activity, the application of organic amendments provides beneficial macro- and micronutrients for plant establishment and growth, and often improves soil physicochemical characteristics (and, hence, soil health).
The industrial activity in the studied site, where the soil was collected from, began in the early 1970s and lasted until the mid-2000s, so it appears conceivable that a significant portion of the organic contaminants present in the collected soil were strongly bonded to the soil matrix and recalcitrant to biodegradation. Then, prior to the application of these remediation treatments, the contaminated industrial soil was supplemented with rhamnolipid biosurfactant and sodium dodecyl benzenesulfonate (an ionic surfactant) to increase the bioavailability, and then degradability, of the sorbed recalcitrant organic contaminants. Regrettably, as mentioned above, the applied remediation treatments were not able to significantly reduce the concentration of the target contaminants. Actually, at the end of the experiment, there were no significant differences among treatments, including the untreated control (unplanted, non-bioaugmented control). Then, the observed reduction in contaminant concentrations, compared to the initial values (see above), was most likely due to soil manipulation, not to the applied remediation treatments. One of the possible reasons for this lack of contaminant degradation might be that the concentrations of the surfactants used here (rhamnolipids: 10 mg kg−1 soil; sodium dodecyl benzenesulfonate: 50 mg kg−1 soil) were not high enough to achieve the desired objective. We chose these surfactant concentrations following Wang et al. [58] who reported highest reductions in PAH concentrations in a long-term contaminated soil using these very same concentrations. Nonetheless, in another study [59], the most effective degradation of carbendazim (a stable benzimidazole fungicide) was achieved at 50 mg rhamnolipid kg−1 soil (in contrast, the application of 150 mg rhamnolipid kg−1 soil inhibited carbendazim degradation). Other authors [60] observed that the application of rhamnolipids at 150 mg kg-1 soil was most appropriate for the remediation of a diesel-oil contaminated soil through bioaugmentation with a bacterial consortium. The most appropriate (most effective) dose of surfactant depends on many different factors, including the nature, concentration and recalcitrance of the target contaminants, as well as the soil type and its physicochemical characteristics. On the other hand, the application of organic amendments to soil, in addition to promoting plant growth and stimulating soil microbial activity, can sometimes result in a chemostabilization effect on some contaminants, thus hindering their degradation. This chemostabilization effect has nevertheless been more reported for toxic heavy metals [61].

4.2. Soil Health

In our study, the application of organic amendments, particularly dried cow slurry, enhanced the values of soil microbial parameters. Likewise, the biomass (DW) of B. napus plants was approximately three-fold higher in pots amended with dried cow slurry, with respect to pots amended with composted horse manure and unamended controls. No clear differences were observed between soils amended with composted horse manure and dried cow slurry in terms of soil physicochemical properties (Table 3). On the other hand, the values of the C/N ratio were relatively similar for both amendments: 17 for composted horse manure (C: 34%, N: 2.0%) and 15 for dried cow slurry (C: 42%, N: 2.8%). Besides, as described above, the doses of these two organic amendments were adjusted so that the final OM content was equal in both cases, i.e., 20% OM. However, due to the inherent nature and state of stabilization (maturation) of the amendments used here, it is indeed likely that dried cow slurry contained a higher content of easily oxidizable OM, as well as of easily assimilated N, than composted horse manure, explaining its stronger stimulatory effect on plant growth and microbial biomass and activity. In agreement with this, all the parameters calculated here from Biolog EcoPlatesTM data were affected by the type of organic amendment, with cultivable heterotrophic bacterial communities being more active, in terms of C substrate utilization rates, in soils amended with dried cow slurry (nonetheless, they showed a lower Shannon’s diversity). It is not unusual to observe a reduction in soil microbial diversity (together with an increase in soil microbial biomass and activity) as a result of the application of organic amendments, probably due to the fact that the more efficient species in terms of their capacity to rapidly use easily metabolizable carbon substrates provided by the amendments outcompete those with a lower capacity, thus leading to a less diverse community.
The values of Pielou’s evenness, calculated from amplicon next generation sequencing data, showed a more uniform microbial community in soils amended with dried cow slurry (in turn, rarefied richness values were higher in soils amended with composted horse manure). Importantly, our clustering analysis (Figure 5) clearly separated unamended controls, soils amended with composted horse manure, and soils amended with dried cow slurry.
According to our metabarcoding data, the three bacterial strains used here for bioaugmentation purposes in an attempt to stimulate the degradation of the target contaminants (Burkholderia xenovorans LB400, Paenibacillus sp., Lysinibacillus sp.) did not thrive in the experimental soil, which could further explain the lack of contaminant degradation observed in our study. Indeed, the relative abundance of these three genera (Burkholderia, Paenibacillus, Lysinibacillus) did not increase in bioaugmented vs. non-bioaugmented soils. In fact, “bioaugmentation” was the least important factor explaining the variability of the data, as indicated by the variation partitioning analyses. Bioaugmentation is a bioremediation strategy which, in many cases, fails to deliver the intended reduction in contaminant concentrations due to the lack of survival and growth of the inoculated strains, owing to their poor competitive fitness under those specific environmental conditions. Thus, although bioaugmentation with Rhodococcus erythropolis did initially enhance hydrocarbon degradation in soil, its effectiveness strongly decreased over time as the proportion of Rhodococci was reduced from 25 to 1% of the total bacterial community (80 days after their inoculation), pointing out the difficulty to achieve the desired goal in bioaugmentation initiatives [62]. Other authors [63] also found that the bacteria inoculated to degrade PAHs in a contaminated soil decreased considerably in number or even disappeared over time (after approximately 100 days). In any case, other authors [64] have previously combined phytoremediation strategies with bacterial bioaugmentation. In a soil contaminated with hydrocarbons and heavy metals, these authors [64] reported that phytoremediation with alfalfa (Medicago sativa L.) combined with bacterial bioaugmentation (Pseudomonas aeruginosa) resulted in the highest degree of TPH removal (68%), compared to bioaugmentation alone (59%) and phytoremediation alone (47%).
Unexpectedly, the values of soil respiration, some enzyme activities, AWCD and NUSmax (from Biolog EcoPlatesTM data) decreased in bioaugmented soils, while values of CMB increased. This increase in microbial biomass could be due to the supply of easily metabolizable substrates and nutrients resulting from the lysis (death) of the inoculated bacteria. Although there are methods aimed at improving the survival of inoculated bacteria in bioaugmented soils, such as encapsulation in agar, alginate, open-ended tubes, etc. [65,66,67], their effectiveness is variable, unreliable and, to a considerable extent, unpredictable.
The growth of B. napus plants did not lead to contaminant degradation but had a stimulatory effect on soil microbial properties, as previously reported [68]. Specifically, under our experimental conditions, plant growth had a stimulatory effect on soil respiration and NPM, suggesting a beneficial influence of root exudates on the activity of rhizosphere microbial communities [11,12]. Likewise, some enzyme activities (dehydrogenase, β-glucosidase, acid phosphatase) showed higher values in planted vs. unplanted soils. Instead, inexplicably, CMB values were higher in unplanted vs. planted soils.

5. Conclusions

All the applied treatments failed at achieving a reduction in the concentration of the target contaminants (TPHs, PAHs), but some (especially, biostimulation with organic amendments) did succeed at improving soil health. Particularly, the application of dried cow slurry enhanced soil health. In consequence, and taking into consideration an often-mentioned remediation paradigm which states that “the goal of any remediation treatment must be not only to reduce the concentration of the target contaminants but, most importantly, to also improve soil health”, our results point out a not-so-uncommon situation in which remediation efforts fail from the point of view of the reduction in contaminant concentrations while succeeding to improve soil health. Then, it cannot be concluded that our remediation attempts were completely successful (we achieved no significant decrease in contaminant concentrations) but, in a sense, they were partly successful because they resulted in an improved health of the long-term contaminated industrial soil.
This abovementioned situation is the opposite of that often encountered when applying many physicochemical methods of soil remediation, i.e., a reduction in contaminant concentrations is achieved at the expense of negatively affecting soil health. Sadly, despite the abovementioned paradigm, we are used to “remediating” a contaminated site using techniques that strongly (at times, irreversibly) alter the functionality of the treated soil, and claim to have been successful if contaminant concentrations have been reduced below regulatory limits. It is evident that when soil contaminants are causing negative effects on human health, we must remove those contaminants whatever the costs for the soil ecosystem (though, preferably, with the minimum harm to the soil ecosystem and the environment in general). But, in many cases, due to their lack of solubility, mobility, bioavailability, bioaccessibility, etc., or to the lack of a relevant exposure route from the contaminants to humans, the damage caused by some remediation methods on the integrity of the soil ecosystem might be more detrimental than the actual harm caused by the contaminants themselves. In this respect, biological remediation methods are usually less damaging, if at all, to the integrity of the soil ecosystem.
Finally, to achieve a significant reduction in the concentration of the target contaminants in the studied industrial soil (i.e., the most important objective from an anthropocentric and, in particular, legal point of view) using the same biological remediation strategies tested here, much research is particularly needed on (i) the nature and dose of application of the surfactants required to increase the bioavailability and degradability of recalcitrant organic contaminants; and (ii) the ecological fitness of the bacterial strains used for bioaugmentation (including competitive traits such as growth rate, mobility, capacity to express the specific degradation genes under those conditions, etc.).

Supplementary Materials

The following are available online at https://www.mdpi.com/2076-3417/9/22/4757/s1, Table S1: Primers and qPCR conditions for the determination of fungal and bacterial gene copy numbers, Table S2: Effect of treatments on metabarcoding (16S rRNA) diversity.

Author Contributions

Conceptualization: C.G., L.E., I.A., J.M.B.; Methodology: C.G., L.E., I.A., J.M.B.; Formal analysis: M.A., O.S.; Investigation: C.G., L.E., I.A., J.M.B.; Resources: C.G., J.M.B.; Data curation: C.G., L.E., I.A.; Writing—Original Draft Preparation: M.A., C.G.; Writing—Review & Editing: all; Supervision: C.G.; Project administration: C.G., Funding acquisition: C.G.

Funding

This study was supported by Spanish Ministry of Economy, Industry and Competitiveness through NANORRIZORREM-2 Project (AGL2016-76592-R).

Acknowledgments

We would like to thank Fernando Blanco for technical assistance.

Conflicts of Interest

The authors declare no conflicts of interest.

References

  1. Garbisu, C.; Alkorta, I. Bioremediation: Principles and future. J. Clean Technol. Environ. Toxicol. Occup. Med. 1997, 6, 351–366. [Google Scholar]
  2. Garbisu, C.; Alkorta, I. Utilization of genetically engineered microorganisms (GEMs) for bioremediation. J. Clean Technol. Biotechnol. 1999, 74, 599–606. [Google Scholar] [CrossRef]
  3. Garbisu, C.; Alkorta, I. Basic concepts on heavy metal soil bioremediation. Eur. J. Miner. Process. Environ. Prot. 2003, 3, 58–66. [Google Scholar]
  4. Alkorta, I.; Becerril, J.M.; Garbisu, C. Recovery of soil health: The ultimate goal of soil remediation processes. In Trends in Bioremediation and Phytoremediation; Plaza, G., Ed.; Research Signpost: Kerala, India, 2010; Chapter 1; pp. 1–9. ISBN 978-81-308-0424-8. [Google Scholar]
  5. Garbisu, C.; Garaiyurrebaso, O.; Epelde, L.; Grohmann, E.; Alkorta, I. Plasmid-mediated bioaugmentation for the bioremediation of contaminated soils. Front. Microbiol. 2017, 8, 1966. [Google Scholar] [CrossRef]
  6. Ferraro, A.; Dottorini, G.; Massini, G.; Miritana, V.M.; Signorini, A.; Lembo, G.; Fabbricino, M. Combined bioaugmentation with anaerobic ruminal fungi and fermentative bacteria to enhance biogas production from wheat straw and mushroom spent straw. Bioresour. Technol. 2018, 260, 364–373. [Google Scholar] [CrossRef] [PubMed]
  7. Correa-García, S.; Pande, P.; Séguin, A.; St-Arnaud, M.; Yergeau, E. Rhizoremediation of petroleum hydrocarbons: A model system for plant microbiome manipulation. Microb. Biotechnol. 2018, 11, 819–832. [Google Scholar] [CrossRef]
  8. Idowu, O.; Semple, K.T.; Ramadass, K.; Connor, W.O.; Hansbro, P.; Thavamani, P. Beyond the obvious: Environmental health implications of polar polycyclic aromatic hydrocarbons. Environ. Int. 2019, 123, 543–557. [Google Scholar] [CrossRef]
  9. Arthur, E.L.; Rice, P.J.; Rice, P.J.; Anderson, T.A.; Baladi, S.M. Phytoremediation—An overview. Crit. Rev. Plant Sci. 2005, 24, 109–122. [Google Scholar] [CrossRef]
  10. Gaskin, S.E.; Bentham, R.H. Rhizoremediation of hydrocarbon contaminated soil using Australian native grasses. Sci. Total Environ. 2010, 408, 3683–3688. [Google Scholar] [CrossRef]
  11. Kowalchuk, G.A.; Buma, D.S.; Boer, W.D.; Klinkhamer, P.G.L.; van Veen, J.A. Effects of above-ground plant species composition and diversity on the diversity of soil-borne microorganisms. Antonie Van Leeuwenhoek 2002, 81, 509–520. [Google Scholar] [CrossRef] [Green Version]
  12. Smalla, K.; Wieland, G.; Buchner, A.; Zock, A.; Parzy, J.; Kaiser, S.; Roskot, N.; Heuer, H.; Berg, G. Bulk and rhizosphere soil bacterial communities studied by denaturing gradient gel electrophoresis: Plant-dependent enrichment and seasonal shifts revealed. Appl. Environ. Microbiol. 2001, 67, 4742–4751. [Google Scholar] [CrossRef]
  13. Yateem, A.; Al-Sharrah, T.; Bin-Haji, A. Investigation of microbes in the rhizosphere of selected grasses for rhizoremediation of hydrocarbon-contaminated soils. Soil Sediment Contam. Int. J. 2007, 16, 269–280. [Google Scholar] [CrossRef]
  14. Heinaru, E.; Merimaa, M.; Viggor, S.; Lehiste, M.; Leito, I.; Truu, J. Biodegradation efficiency of functionally important populations selected for bioaugmentation in phenol- and oil-polluted area. FEMS Microbiol. Ecol. 2005, 51, 363–373. [Google Scholar] [CrossRef] [Green Version]
  15. Chen, L.; Luo, S.; Xiao, X.; Guo, H.; Chen, J.; Wan, Y.; Li, B.; Xu, T.; Xi, Q.; Rao, C.; et al. Application of plant growth-promoting endophytes (PGPE) isolated from Solanum nigrum L. for phytoextraction of Cd-polluted soils. Appl. Soil Ecol. 2010, 46, 383–389. [Google Scholar] [CrossRef]
  16. Zhang, Y.F.; He, L.Y.; Chen, Z.J.; Zhang, W.H.; Wang, Q.Y.; Qian, M.; Sheng, X.F. Characterization of lead-resistant and ACC deaminase-producing endophytic bacteria and their potential in promoting lead accumulation of rape. J. Hazard. Mater. 2011, 186, 1720–1725. [Google Scholar] [CrossRef]
  17. Burges, A.; Epelde, L.; Benito, G.; Artetxe, U.; Becerril, J.M.; Garbisu, C. Enhancement of ecosystem services during endophyte-assisted aided phytostabilization of metal contaminated mine soil. Sci. Total Environ. 2016, 562, 480–492. [Google Scholar] [CrossRef]
  18. Das, S.; Jeong, S.T.; Das, S.; Kim, P.J. Composted cattle manure increases microbial activity and soil fertility more than composted swine manure in a submerged rice paddy. Front. Microbiol. 2017, 8, 1702. [Google Scholar] [CrossRef]
  19. Fließbach, A.; Oberholzer, H.; Gunst, L.; Mäder, P. Soil organic matter and biological soil quality indicators after 21 years of organic and conventional farming. Agric. Ecosyst. Environ. 2007, 118, 273–284. [Google Scholar] [CrossRef]
  20. Evanylo, G.; Sherony, C.; Spargo, J.; Starner, D.; Brosius, M.; Haering, K. Agriculture, ecosystems and environment soil and water environmental effects of fertilizer-, manure-, and compost-based fertility practices in an organic vegetable cropping system. Agric. Ecosyst. Environ. 2008, 127, 50–58. [Google Scholar] [CrossRef]
  21. Epelde, L.; Becerril, J.M.; Mijangos, I.; Garbisu, C. Evaluation of the efficiency of a phytostabilization process with biological indicators of soil health. J. Environ. Qual. 2009, 38, 2041–2049. [Google Scholar] [CrossRef]
  22. Epelde, L.; Burges, A.; Mijangos, I.; Garbisu, C. Microbial properties and attributes of ecological relevance for soil quality monitoring during a chemical stabilization field study. Appl. Soil Ecol. 2014, 75, 1–12. [Google Scholar] [CrossRef]
  23. Hernández-Allica, J.; Becerril, J.M.; Zárate, O.; Garbisu, C. Assessment of the efficiency of a metal phytoextraction process with biological indicators of soil health. Plant Soil 2006, 281, 147–158. [Google Scholar] [CrossRef]
  24. Barrutia, O.; Garbisu, C.; Epelde, L.; Sampedro, M.C.; Goicolea, M.A.; Becerril, J.M. Plant tolerance to diesel minimizes its impact on soil microbial characteristics during rhizoremediation of diesel-contaminated soils. Sci. Total Environ. 2011, 409, 4087–4093. [Google Scholar] [CrossRef] [PubMed]
  25. Galende, M.A.; Becerril, J.M.; Barrutia, O.; Artetxe, U.; Garbisu, C.; Hernández, A. Field assessment of the effectiveness of organic amendments for aided phytostabilization of a Pb-Zn contaminated mine soil. J. Geochem. Explor. 2014, 145, 181–189. [Google Scholar] [CrossRef]
  26. Mijangos, I.; Albizu, I.; Epelde, L.; Amezaga, I.; Mendarte, S.; Garbisu, C. Effects of liming on soil properties and plant performance of temperate mountainous grasslands. J. Environ. Manag. 2010, 91, 2066–2074. [Google Scholar] [CrossRef]
  27. ISO. ISO 18287, 2006: Soil Quality—Determination of Polycyclic Aromatic Hydrocarbons (PAH)—Gas Chromatographic Method with Mass Spectrometric Detection (GC-MS); ISO: Geneva, Switzerland, 2006. [Google Scholar]
  28. ISO. ISO 16703, 2004: Soil Quality—Determination of Content of Hydrocarbon in the Range C10 to C40 by Gas Chromatography; ISO: Geneva, Switzerland, 2004. [Google Scholar]
  29. ISO. ISO 16558-1, 2015: Soil Quality—Risk-Based Petroleum Hydrocarbons. Part 1: Determination of Aliphatic and Aromatic Fractions of Volatile Petroleum Hydrocarbons Using Gas Chromatography (Static Headspace Method); ISO: Geneva, Switzerland, 2015. [Google Scholar]
  30. Lacalle, R.G.; Gómez-Sagasti, M.T.; Artetxe, U.; Garbisu, C.; Becerril, J.M. Brassica napus has a key role in the recovery of the health of soils contaminated with metals and diesel by nano-rhizoremediation. Sci. Total Environ. 2018, 618, 347–356. [Google Scholar] [CrossRef]
  31. Nelson, D.W.; Sommers, L.E. Total carbon, organic carbon and organic matter. In Methods of Soil Analysis; Part 3. Chemical Methods; Sparks, D.L., Page, A.L., Helmke, P.A., Loeppert, R.H., Soltanpour, P.N., Tabatabai, M.A., Johnston, C.T., Sumner, M.E., Eds.; SSSA and ASA: Madison, WI, USA, 1996; pp. 961–1010. [Google Scholar]
  32. Wu, J.; Joergensen, R.G.; Pommerening, B.; Chaussod, R.; Brookes, P.C. Measurement of soil microbial biomass C by fumigation-extraction: An automated procedure. Soil Biol. Biochem. 1990, 22, 1167–1169. [Google Scholar] [CrossRef]
  33. ISO. ISO 10694, 1995: Soil Quality—Determination of Organic and Total Carbon after Dry Combustión (Elementary Analysis); ISO: Geneva, Switzerland, 1995. [Google Scholar]
  34. ISO. ISO 13878, 1998: Soil Quality—Determination of Total Nitrogen Content by Dry Combustión (Elementary Analysis); ISO: Geneva, Switzerland, 1998. [Google Scholar]
  35. Hechmi, N.; Bosso, L.; El-Bassia, L.; Scelza, R.; Testa, A.; Jedidi, N.; Rao, M.A. Depletion of pentachlorophenol in soil microcosms with Byssochlamys nivea and Scopulariopsis brumptii as detoxification agents. Chemosphere 2016, 165, 547–554. [Google Scholar] [CrossRef]
  36. Wang, H.; Kuang, S.; Lang, Q.; Yu, W. Effects of aged oil sludge on soil physicochemical properties and fungal diversity revealed by high-throughput sequencing analysis. Archaea 2018, 9264259. [Google Scholar] [CrossRef]
  37. Vance, E.D.; Brookes, P.C.; Jenkinson, D.S. An extraction method for measuring soil microbial biomass C. Soil Biol. Biochem. 1987, 19, 703–707. [Google Scholar] [CrossRef]
  38. Kowalchuk, G.A.; Stephen, J.R.; DeBoer, W.; Prosser, J.I.; Embley, T.M.; Woldendorp, J.W. Analysis of ammonia-oxidizing bacteria of the beta subdivision of the class Proteobacteria in coastal sand dunes by denaturing gradient gel electrophoresis and sequencing of PCR-amplified 16S ribosomal DNA fragments. Appl. Environ. Microbiol. 1997, 63, 1489–1497. [Google Scholar] [Green Version]
  39. Dhanasekaran, S.; Doherty, T.M.; Kenneth, J. Comparison of different standards for real-time PCR-based absolute quantification. J. Immunol. Methods 2010, 354, 34–39. [Google Scholar] [CrossRef]
  40. Vainio, E.J.; Hantula, J. Direct analysis of wood-inhabiting fungi using denaturing gradient gel electrophoresis of amplified ribosomal DNA. Mycol. Res. 2000, 104, 927–936. [Google Scholar] [CrossRef]
  41. Lueders, T.; Manefield, M.; Friedrich, M.W. Enhanced sensitivity of DNA- and rRNA-based stable isotope probing by fractionation and quantitative analysis of isopycnic centrifugation gradients. Environ. Microbiol. 2004, 6, 73–78. [Google Scholar] [CrossRef]
  42. ISO. ISO-16072, 2002: Soil Quality—Laboratory Methods for Determination of Microbial Soil Respiration; ISO: Geneva, Switzerland, 2002. [Google Scholar]
  43. Powers, R.F. Mineralizable soil nitrogen as an index of nitrogen availability to forest trees. Soil Sci. Soc. Am. J. 1980, 44, 1314–1320. [Google Scholar] [CrossRef]
  44. ISO. ISO/TS 22939, 2010: Soil Quality—Measurement of Enzyme Activity Patterns in Soil Samples Using Fluorogenic Substrates in Micro-Well Plates; ISO: Geneva, Switzerland, 2010. [Google Scholar]
  45. Dick, R.P. Soil enzyme activities as integrative indicators of soil health. In Biological Indicators of Soil Health; Pankhurst, C.E., Doube, B.M., Gupta, V., Eds.; CAB International: Wallingford, UK, 1997; pp. 121–156. [Google Scholar]
  46. Kandeler, E.; Gerber, H. Short-term assay of soil urease activity using colorimetric determination of ammonium. Biol. Fertil. Soils 1988, 6, 68–72. [Google Scholar] [CrossRef]
  47. ISO. ISO-23753-2, 2005: Soil Quality—Determination of Dehydrogenase Activity in Soils—Part 2: Method Using Iodotetrazolium Chloride (INT); ISO: Geneva, Switzerland, 2005. [Google Scholar]
  48. Epelde, L.; Becerril, J.M.; Hernandez-Allica, J.; Barrutia, O.; Garbisu, C. Functional diversity as indicator of the recovery of soil health derived from Thlaspi caerulescens growth and metal phytoextraction. Appl. Soil Ecol. 2008, 39, 299–310. [Google Scholar] [CrossRef]
  49. Preston-Mafham, J.; Boddy, L.; Randerson, P.F. Analysis of microbial community functional diversity using sole-carbon-source utilisation profiles—A critique. FEMS Microbiol. Ecol. 2002, 42, 1–14. [Google Scholar]
  50. Lanzén, A.; Epelde, L.; Blanco, F.; Martin, I.; Artetxe, U.; Garbisu, C. Multi-targeted metagenetic analysis of the influence of climate and environmental parameters on soil microbial communities along an elevational gradient. Sci. Rep. 2016, 6, 28257. [Google Scholar] [CrossRef]
  51. Øvreås, L.; Forney, L.; Daae, F.L. Distribution of bacterioplankton in meromictic Lake Saelenvannet, as determined by denaturing gradient gel electrophoresis of PCR-amplified gene fragments coding for 16S rRNA. Appl. Environ. Microbiol. 1997, 63, 3367–3373. [Google Scholar] [Green Version]
  52. Caporaso, J.G.; Lauber, C.L.; Walters, W.A.; Berg-Lyons, D.; Huntley, J.; Fierer, N.; Owens, S.M.; Betley, J.; Fraser, L.; Bauer, M.; et al. Ultra-high-throughput microbial community analysis on the Illumina HiSeq and MiSeq platforms. ISME J. 2012, 6, 1621–1624. [Google Scholar] [CrossRef] [Green Version]
  53. Lanzén, A.; Jørgensen, S.L.; Huson, D.H.; Gorfer, M.; Grindhaug, S.H.; Jonassen, I.; Øvreås, L.; Urich, T. CREST—Classification Resources for Environmental Sequence Tags. PLoS ONE 2012, 7, e49334. [Google Scholar] [CrossRef]
  54. Cui, Z.; Zhang, X.; Yang, H.; Sun, L. Bioremediation of heavy metal pollution utilizing composite microbial agent of Mucor circinelloides, Actinomucor sp. and Mortierella sp. J. Environ. Chem. Eng. 2017, 5, 3616–3621. [Google Scholar] [CrossRef]
  55. Zhang, T.; He, J.; Feng, H.; Zhan, X. Improvement of soil nutrient and biological properties and establishment of Lycium barbarum L. in an impermeable saline-sodic soil using drip irrigation. Soil Res. 2019, 57, 75–84. [Google Scholar] [CrossRef]
  56. Ter Braak, C.J.F.; Šmilauer, P. CANOCO Reference Manual and CanoDraw for Windows User’s Guide: Software for Canonical Community Ordination; Microcomputer Power: Ithaca, NY, USA, 2002. [Google Scholar]
  57. Oksanen, J.; Blanchet, F.G.; Kindt, R.; Legendre, P.; Minchin, P.R.; O’Hara, R.B.; Simpson, J.L.; Solymos, P.; Stevens, M.H.H.; Szoecs, E.; et al. Vegan: Community Ecology Package. R Package Version 2.3-1. Available online: https://rdrr.io/rforge/vegan/ (accessed on 21 October 2019).
  58. Wang, L.; Li, F.; Zhan, Y.; Zhu, L. Shifts in microbial community structure during in situ surfactant-enhanced bioremediation of polycyclic aromatic hydrocarbon-contaminated soil. Environ. Sci. Pollut. Res. 2016, 23, 14451–14461. [Google Scholar] [CrossRef]
  59. Bai, N.; Wang, S.; Abuduaini, R.; Zhang, M.; Zhu, X.; Zhao, Y. Rhamnolipid-aided biodegradation of carbendazim by Rhodococcus sp. D-1: Characteristics, products, and phytotoxicity. Sci. Total Environ. 2017, 590–591, 343–351. [Google Scholar] [CrossRef]
  60. Szulc, A.; Ambrozewicz, D.; Sydow, M.; Lawniczak, L.; Piotrowska-Cyplik, A.; Marecik, R.; Chrzanowski, L. The influence of bioaugmentation and biosurfactant addition on bioremediation efficiency of diesel-oil contaminated soil: Feasibility during field studies. J. Environ. Manag. 2014, 132, 121–128. [Google Scholar] [CrossRef]
  61. Galende, M.A.; Becerril, J.M.; Gómez-Sagasti, M.T.; Barrutia, O.; Epelde, L.; Garbisu, C.; Hernández, A. Chemical stabilization of metal-contaminated mine soil: Early short-term soil-amendment interactions and their effects on biological and chemical parameters. Water Air Soil Pollut. 2014, 225, 1863. [Google Scholar] [CrossRef]
  62. Masy, T.; Demanèche, S.; Tromme, O.; Thonart, P.; Jacques, P.; Hiligsmann, S.; Vogel, T.M. Hydrocarbon biostimulation and bioaugmentation in organic carbon and clay-rich soils. Soil Biol. Biochem. 2016, 99, 66–74. [Google Scholar] [CrossRef]
  63. Koshlaf, E.; Shahsavari, E.; Haleyur, N.; Osborn, A.M.; Ball, A.S. Effect of biostimulation on the distribution and composition of the microbial community of a polycyclic aromatic hydrocarbon-contaminated landfill soil during bioremediation. Geoderma 2019, 338, 216–225. [Google Scholar] [CrossRef]
  64. Agnello, A.C.; Bagard, M.; van Hullebusch, E.D.; Esposito, G.; Huguenot, D. Comparative bioremediation of heavy metals and petroleum hydrocarbons co-contaminated soil by natural attenuation, phytoremediation, bioaugmentation and bioaugmentation-assisted phytoremediation. Sci. Total Environ. 2016, 563–564, 693–703. [Google Scholar] [CrossRef] [PubMed]
  65. Mertens, B.; Boon, N.; Verstraete, W. Slow-release inoculation allows sustained biodegradation of gamma-hexachlorocyclohexane. Appl. Environ. Microbiol. 2006, 72, 622–627. [Google Scholar] [CrossRef] [PubMed]
  66. Power, B.; Liu, X.; Germaine, K.J.; Ryan, D.; Brazil, D.; Dowling, D.N. Alginate beads as a storage, delivery and containment system for genetically modified PCB degrader and PCB biosensor derivatives of Pseudomonas fluorescens F113. J. Appl. Microbiol. 2011, 110, 1351–1358. [Google Scholar] [CrossRef]
  67. Van Elsas, J.D.; Heijnen, C.E. Methods for the introduction of bacteria into soil: A review. Biol. Fertil. Soils 1990, 10, 127–133. [Google Scholar] [CrossRef]
  68. Epelde, L.; Becerril, J.M.; Kowalchuk, G.A.; Deng, Y.; Zhou, J.Z.; Garbisu, C. Impact of metal pollution and Thlaspi caerulescens growth on soil microbial communities. Appl. Environ. Microbiol. 2010, 76, 7843–7853. [Google Scholar] [CrossRef]
Figure 1. Dry weight (g) of B. napus plants. Compost: amended with composted horse manure; Cow slurry: amended with dried cow slurry. a and b refer to statistically significant (p < 0.05) differences according to the Duncan’s test (as mentioned in M&M).
Applsci 09 04757 g001
Figure 2. Biplot of the redundancy analysis (RDA) performed on soil microbial activity parameters. URE: urease; SUL: arylsulphatase; DEH: dehydrogenase; LEU: L-Leu-aminopeptidase; GLU: β-glucosidase; GLM: β-glucosaminidase; ALA: L-Ala-aminopeptidase; XYL: xylosidase; PHO: acid phosphatase; R: respiration; NPM: potentially mineralizable N. Compost: amended with composted horse manure; Cow slurry: amended with dried cow slurry.
Applsci 09 04757 g002
Figure 3. Biplot of the redundancy analysis (RDA) performed on soil microbial biomass parameters. 16S rRNA and 18S rRNA gene copy numbers determined by qPCR; CMB: microbial biomass C. Compost: amended with composted horse manure; Cow slurry: amended with dried cow slurry.
Applsci 09 04757 g003
Figure 4. Biplot of the redundancy analysis (RDA) performed on the slopes calculated from Biolog EcoPlatesTM growth curves. Units: 100 × absorbance units h−1. The 10 substrates that explained the highest percentage of the variability are shown. Compost: amended with composted horse manure; Cow slurry: amended with dried cow slurry.
Applsci 09 04757 g004
Figure 5. Hierarchical clustering based on Bray Curtis dissimilarities of OTUs from 16S rRNA metabarcoding. B: bioaugmented; NB: non-bioaugmented; U: unplanted; P: planted soils. Compost: amended with composted horse manure; Cow slurry: amended with dried cow slurry.
Applsci 09 04757 g005
Figure 6. Bar plots representing the distribution of the 30 most abundant bacterial taxa at family level obtained from 16S rRNA metabarcoding. B: bioaugmented; NB: non-bioaugmented; U: unplanted; P: planted soils. Compost: amended with composted horse manure; Cow slurry: amended with dried cow slurry.
Applsci 09 04757 g006
Table 1. Experimental treatments.
RhizoremediationBioaugmentationBiostimulation
Brassica napusBioaugmentedControl
Dried cow slurry
Composted horse manure
Non-bioaugmentedControl
Dried cow slurry
Composted horse manure
UnplantedBioaugmentedControl
Dried cow slurry
Composted horse manure
Non-bioaugmentedControl
Dried cow slurry
Composted horse manure
Table 2. Contaminant concentrations. Units: mg kg−1 DW soil. 1: naphthalene; 2: acenaphthene; 3: fluorene; 4: phenanthrene; 5: anthracene; 6: fluoranthene; 7: pyrene; 8: benzo(a)anthracene; 9: chrysene; 10: benzo(b)fluoranthene; 11: benzo(k)fluoranthene; 12: benzo(a)pyrene; 13: dibenzo(a.h)anthracene; 14: benzo(ghi)perylene; 15: indeno(1.2.3-cd)pyrene; 16: sum of 10 PAH-VROM; 17: C10-C12 hydrocarbon fraction; 18: C12-C16 hydrocarbon fraction; 19: C16-C21 hydrocarbon fraction; 20: C21-C40 hydrocarbon fraction. TPHs: total petroleum hydrocarbons (C10-C40). Total-PAHs: sum of 16 PAHs-EPA. Compost: amended with composted horse manure; Cow slurry: amended with dried cow slurry.
Treatment TPHsTotal-PAHs123456789
BrassicaNon-bioaugmentedControl4367 ± 15142467 ± 5862 ± 441 ± 342 ± 3257 ± 1568 ± 3400 ± 17273 ± 12250 ± 10227 ± 6
Compost3253 ± 9792237 ± 25461 ± 638 ± 339 ± 4240 ± 3165 ± 4366 ± 44248 ± 25224 ± 25199 ± 25
Cow slurry3496 ± 9212698 ± 34881 ± 1947 ± 849 ± 8300 ± 5178 ± 12441 ± 57300 ± 40277 ± 29243 ± 26
BioaugmentedControl2900 ± 3612633 ± 30672 ± 644 ± 649 ± 6290 ± 3584 ± 12440 ± 56300 ± 40267 ± 32217 ± 40
Compost2277 ± 1412806 ± 21179 ± 1251 ± 754 ± 7321 ± 3192 ± 13476 ± 44317 ± 32289 ± 25232 ± 12
Cow slurry2888 ± 3483420 ± 63594 ± 2369 ± 1970 ± 19407 ± 86106 ± 24574 ± 106388 ± 71342 ± 63274 ± 34
UnplantedNon-bioaugmentedControl3400 ± 4003067 ± 11584 ± 1153 ± 656 ± 7340 ± 3689 ± 10507 ± 31347 ± 21310 ± 10267 ± 23
Compost3172 ± 4403009 ± 37389 ± 1554 ± 857 ± 9342 ± 4992 ± 14488 ± 68333 ± 43305 ± 37260 ± 39
Cow slurry3268 ± 2372432 ± 26361 ± 841 ± 744 ± 8262 ± 4171 ± 11395 ± 43270 ± 33251 ± 30198 ± 24
BioaugmentedControl3767 ± 14152767 ± 11576 ± 448 ± 150 ± 1303 ± 687 ± 10457 ± 12310 ± 10283 ± 15257 ± 12
Compost3375 ± 3732928 ± 12286 ± 1263 ± 2357 ± 8317 ± 2486 ± 5468 ± 19317 ± 12297 ± 7244 ± 21
Cow slurry3192 ± 3422622 ± 22865 ± 943 ± 545 ± 6277 ± 3575 ± 10426 ± 40293 ± 29270 ± 29236 ± 35
Plant (P)nsnsnsnsnsnsnsnsnsnsns
Bioaugmentation (B)ns0.041ns0.0350.0300.0440.0090.0260.0380.039ns
Amendment (A)nsnsnsnsnsnsnsnsnsnsns
P x B0.0300.010nsns0.0090.0040.0050.0040.0050.012ns
P x Ans0.0010.0000.0030.0030.0010.0060.0010.0010.0010.001
B x Ansnsnsnsnsnsnsnsnsnsns
P x B x Ansnsnsnsnsnsnsnsnsnsns
1011121314151617181920
BrassicaNon-bioaugmentedControl277 ± 6120 ± 0193 ± 641 ± 299 ± 1117 ± 61767 ± 5884 ± 7273 ± 321367 ± 3792667 ± 1079
Compost244 ± 32107 ± 14171 ± 2436 ± 289 ± 13105 ± 121667 ± 18683 ± 5232 ± 491057 ± 3911871 ± 550
Cow slurry293 ± 33125 ± 11205 ± 2042 ± 3105 ± 8125 ± 112014 ± 237108 ± 25266 ± 561227 ± 3831900 ± 475
BioaugmentedControl287 ± 32127 ± 15193 ± 2143 ± 596 ± 8120 ± 101933 ± 20889 ± 2243 ± 25950 ± 1321600 ± 200
Compost305 ± 21130 ± 14211 ± 1944 ± 4107 ± 7125 ± 82074 ± 21185 ± 10211 ± 19732 ± 881253 ± 78
Cow slurry361 ± 63156 ± 29247 ± 4047 ± 7121 ± 18148 ± 232470 ± 475116 ± 26285 ± 59996 ± 1661482 ± 114
UnplantedNon-bioaugmentedControl333 ± 6147 ± 6230 ± 046 ± 1113 ± 6137 ± 62233 ± 58102 ± 8287 ± 211200 ± 2001800 ± 200
Compost317 ± 37138 ± 19224 ± 1947 ± 6113 ± 9134 ± 122196 ± 244111 ± 15277 ± 511126 ± 2491627 ± 141
Cow slurry274 ± 30119 ± 15190 ± 2444 ± 7101 ± 12119 ± 161786 ± 23792 ± 10258 ± 171121 ± 1221786 ± 132
BioaugmentedControl303 ± 23133 ± 6210 ± 1744 ± 5107 ± 12127 ± 122033 ± 5897 ± 14273 ± 591260 ± 4682133 ± 839
Compost317 ± 12138 ± 7220 ± 050 ± 5120 ± 3138 ± 72115 ± 70124 ± 18338 ± 931200 ± 1541708 ± 122
Cow slurry293 ± 24125 ± 11205 ± 1143 ± 4107 ± 5125 ± 111900 ± 17489 ± 15251 ± 201045 ± 1191786 ± 237
Plant (P)nsnsns0.0410.029nsnsnsnsnsns
Bioaugmentation (B)0.046nsnsnsnsnsnsnsnsnsns
Amendment (A)nsnsnsnsnsnsnsnsnsnsns
P × B0.0210.0240.032nsnsns0.011nsnsns0.012
P × A0.0030.0050.0020.0480.0050.0040.0010.0010.036nsns
B × Ansnsnsnsnsnsnsnsnsnsns
P × B × Ansnsnsnsnsnsnsnsnsnsns
Table 3. Effect of treatments on soil properties. EC: electrical conductivity (dS m−1); CWS: water soluble organic C (mg C kg−1 soil); C: total C (%); N: total N (%). Compost: amended with composted horse manure; Cow slurry: amended with dried cow slurry.
Treatment pHECCWSCN
BrassicaNon-bioaugmentedControl7.5 ± 0.21.6 ± 0.3344 ± 3913.1 ± 1.50.26 ± 0.02
Compost7.8 ± 0.01.6 ± 0.4680 ± 7012.8 ± 1.50.38 ± 0.04
Cow slurry7.6 ± 0.11.6 ± 0.1568 ± 3418.3 ± 6.80.40 ± 0.07
BioaugmentedControl7.6 ± 0.11.4 ± 0.2328 ± 8314.1 ± 1.60.28 ± 0.02
Compost7.7 ± 0.01.5 ± 0.4650 ± 9716.5 ± 2.60.39 ± 0.01
Cow slurry7.7 ± 0.11.7 ± 0.4490 ± 7314.2 ± 0.70.37 ± 0.01
UnplantedNon-bioaugmentedControl7.7 ± 0.01.3 ± 0.0316 ± 3915.2 ± 4.60.28 ± 0.04
Compost7.7 ± 0.01.9 ± 0.3645 ± 11014.3 ± 1.80.38 ± 0.02
Cow slurry7.6 ± 0.01.9 ± 0.2648 ± 3413.4 ± 0.50.36 ± 0.00
BioaugmentedControl7.6 ± 0.11.5 ± 0.1278 ± 13416.9 ± 2.60.31 ± 0.04
Compost7.7 ± 0.11.4 ± 0.4572 ± 7916.9 ± 2.50.40 ± 0.04
Cow slurry7.5 ± 0.01.7 ± 0.1553 ± 12213.8 ± 2.40.34 ± 0.03
Plant (P)nsnsnsnsns
Bioaugmentation (B)nsnsnsnsns
Amendment (A)0.003ns0.000ns0.000
P × Bnsnsnsnsns
P × A0.041nsnsnsns
B × Ansnsnsnsns
P × B × Ansnsnsnsns
Table 4. Effect of treatments on soil microbial activity. Mean values (n = 3) ± SD. Probability values from three-way ANOVA (ns: non-significant) for the effects of plant growth, bioaugmentation, amendment and their interactions are shown below. When the triple interaction is significant, the means with different letters are significantly (p < 0.05) different according to Duncan’s test. R: respiration (mg C kg−1 DW soil h−1); NPM: potentially mineralizable N (mg N-NH4+ kg−1 DW soil); GLU: β-D-glucosidase; GLM: glucosaminidase; PHO: acid phosphatase; XYL: xylosidase (µmol MUF kg−1 DW h−1); LEU: L-Leu aminopeptidase; ALA: L-Ala aminopeptidase (µmol AMC kg−1 DW h−1); DEH: dehydrogenase (mg INTF kg-1 DW soil h-1); SUL: arylsulphatase (mg NP kg−1 DW soil h−1); URE: urease (mg N-NH4+ kg−1 DW soil h−1). Compost: amended with composted horse manure; Cow slurry: amended with dried cow slurry.
Treatment RNPMGLUGLMPHOXYLLEUALADEHSULURE
BrassicaNon-bioaugmentedControl1.8 ± 0.2 f31 ± 4349 ± 60223 ± 19 fg2054 ± 381 bc72 ± 10 e330 ± 48497 ± 5217 ± 449 ± 617 ± 6
Compost3.4 ± 0.1 c3 ± 0478 ± 51337 ± 16 de2091 ± 98 bc123 ± 19 de443 ± 20650 ± 6099 ± 471 ± 719 ± 1
Cow slurry4.1 ± 0.1 a130 ± 14728 ± 109515 ± 65 b2387 ± 181 b221 ± 4 b787 ± 321239 ± 92278 ± 21106 ± 520 ± 3
BioaugmentedControl1.9 ± 0.3 f35 ± 4327 ± 37205 ± 17 g2117 ± 120 bc71 ± 6 e343 ± 13568 ± 2024 ± 346 ± 209 ± 3
Compost2.9 ± 0.2 d10 ± 7382 ± 45293 ± 59 ef1628 ± 109 bc94 ± 8 de370 ± 76558 ± 7796 ± 1276 ± 713 ± 0
Cow slurry3.7 ± 0.1 b111 ± 8620 ± 121480 ± 43 bc2431 ± 341 b189 ± 24 bc736 ± 211239 ± 57290 ± 3699 ± 1016 ± 4
UnplantedNon-bioaugmentedControl1.3 ± 0.1 g25 ± 1322 ± 46181 ± 31 g1143 ± 84 c61 ± 6 e269 ± 25467 ± 4416 ± 848 ± 213 ± 2
Compost2.6 ± 0.1 de3 ± 2406 ± 54325 ± 24 e1521 ± 90 bc122 ± 17 de433 ± 8640 ± 5285 ± 675 ± 218 ± 2
Cow slurry4.2 ± 0.2 a108 ± 4568 ± 78684 ± 86 a1771 ± 154 bc220 ± 37 b866 ± 1681380 ± 310198 ± 4685 ± 1121 ± 2
BioaugmentedControl1.3 ± 0.1 g16 ± 9356 ± 152411 ± 76 cd4703 ± 184 a407 ± 100 a207 ± 97827 ± 56613 ± 748 ± 213 ± 2
Compost2.4 ± 0.1 e7 ± 1304 ± 63177 ± 39 g1217 ± 113 c66 ± 22 e341 ± 54536 ± 2981 ± 1464 ± 322 ± 3
Cow slurry4.3 ± 0.1 a73 ± 36401 ± 24485 ± 17 bc1566 ± 35 bc141 ± 11 cd718 ± 40987 ± 73198 ± 2882 ± 421 ± 7
Plant (P)0.0000.0010.0030.034ns0.001nsns0.0000.0150.046
Bioaugmentation (B)0.005ns0.0080.0330.0240.0360.005nsnsnsns
Amendment (A)0.0000.0000.0000.0000.0030.0000.0000.0000.0000.0000.000
P × B0.026nsnsns0.0060.000nsnsnsns0.007
P × A0.0000.0270.0230.0010.0040.000nsns0.0000.022ns
B × A0.0230.0090.0910.0000.0000.000ns0.040nsnsns
P × B × A0.021nsns0.0000.0010.000nsnsnsnsns
Table 5. Effect of treatments on soil microbial biomass. Mean values (n = 3) ± SD. Probability values from three-way ANOVA (ns: non-significant) for the effects of plant growth, bioaugmentation, amendment and their interactions are shown below. When the triple interaction is significant, the means with different letters are significantly (p < 0.05) different according to Duncan’s test. CMB: microbial biomass C (mg C kg−1 DW soil); Bacterial and fungal abundances (gene copy numbers by qPCR). Compost: amended with composted horse manure; Cow slurry: amended with dried cow slurry.
Treatment CMBBacterial AbundanceFungal Abundance
BrassicaNon-bioaugmentedControl960 ± 2020.9 × 108 ± 3 × 1070.9 × 105 ± 0.3 × 10⁵ e
Compost1159 ± 2602.1 × 108 ± 4.7 × 1072.4 × 105 ± 0.5 × 10⁵ cde
Cow slurry1505 ± 2262.7 × 108 ± 5.4 × 1078.2 × 105 ± 1.6 × 10⁵ cde
BioaugmentedControl994 ± 2551.1 × 108 ± 3.1 × 1071.7 × 105 ± 1.7 × 10⁵ de
Compost1672 ± 1062.4 × 108 ± 2.5 × 1078.6 × 105 ± 0.1 × 10⁵ cd
Cow slurry1882 ± 3043.9 × 108 ± 7.7 × 10730 × 105 ± 2.7 × 10⁵ a
UnplantedNon-bioaugmentedControl1410 ± 3120.9 × 108 ± 1.6 × 1072.3 × 105 ± 0.4 × 10⁵ cde
Compost1855 ± 2213.5 × 108 ± 9.4 × 10716.9 × 105 ± 4.7 × 10⁵ b
Cow slurry1630 ± 1223.4 × 108 ± 6.5 × 10725.2 × 105 ± 9.7 × 10⁵ a
BioaugmentedControl1894 ± 2921.0 × 108 ± 2.1 × 1074.6 × 105 ± 1.4 × 10⁵ cde
Compost2639 ± 4632.3 × 108 ± 4.2 × 1079.5 × 105 ± 3.1 × 10⁵ c
Cow slurry1908 ± 4983.0 × 108 ± 4.4 × 10717.7 × 105 ± 5.9 × 10⁵ b
Plant (P)0.000ns0.004
Bioaugmentation (B)0.000ns0.048
Amendment (A)0.0010.0000.000
P × Bns0.0080.000
P × A0.011nsns
B × Ansnsns
P × B × Ansns0.000
Table 6. Effect of treatments on CLPPs from Biolog EcoPlatesTM. Mean values (n = 3) ± SD. Probability values from three-way ANOVA (ns: non-significant) for the effects of plant growth, bioaugmentation, amendment and their interactions are shown below. When the triple interaction is significant, means with different letters are significantly different (p < 0.05) according to the Duncan’s test. lag: lag-phase of the growth-curve; t½: time corresponding to the middle of the exponential phase of the growth curve; slope: slope of the average well colour development (AWCD) curve; NUSmax: maximum number of used substrates; NUSt1/2: number of used substrates at t1/2; AWCDmax: maximum average well colour development; AWCDt1/2: average well colour development at t1/2; H’: Shannon’s diversity index. Compost: amended with composted horse manure; Cow slurry: amended with dried cow slurry.
Treatment lagt1/2SlopeAWCDt1/2AWCDmaxNUSt1/2NUSmaxH’
BrassicaNon-bioaugmentedControl19 ± 0.045.1 ± 3.42.46 ± 0.3 ab0.54 ± 0.01.43 ± 0.0 a20 ± 1.130 ± 0.0 ab4.15 ± 0.08
Compost19 ± 0.044.1 ± 1.02.10 ± 0.1 bc0.49 ± 00.01.19 ± 0.1 cde17 ± 1.029 ± 0.0 bc3.90 ± 0.10
Cow slurry15 ± 0.036.4 ± 0.82.60 ± 0.3 a0.44 ± 0.01.16 ± 0.0 de18 ± 0.530 ± 0.6 a4.01 ± 0.05
BioaugmentedControl19 ± 0.047.3 ± 1.82.04 ± 0.1 c0.47 ± 0.01.25 ± 0.1 bcde19 ± 0.730 ± 0.6 ab4.14 ± 0.06
Compost19 ± 0.043.1 ± 2.42.23 ± 0.2 bc0.47 ± 0.01.21 ± 0.0 cde18 ± 1.029 ± 1.0 bc3.93 ± 0.19
Cow slurry15 ± 0.034.1 ± 0.82.64 ± 0.3 a0.42 ± 0.01.12 ± 0.0 ef16 ± 0.830 ± 0.0 ab3.84 ± 0.07
UnplantedNon-bioaugmentedControl20 ± 0.060.1 ± 6.41.58 ± 0.1 d0.52 ± 0.01.33 ± 0.0 abc20 ± 2.130 ± 0.6 ab4.12 ± 0.21
Compost20 ± 0.057.8 ± 1.81.65 ± 0.1 d0.54 ± 0.01.38 ± 0.1 ab21 ± 0.729 ± 0.0 bc4.23 ± 0.01
Cow slurry15 ± 0.038.8 ± 3.92.18 ± 0.3 bc0.49 ± 0.01.28 ± 0.0 bcd18 ± 1.730 ± 0.6 ab4.00 ± 0.15
BioaugmentedControl20 ± 0.055.3 ± 6.11.39 ± 0.2 de0.39 ± 0.11.01 ± 0.1 f18 ± 2.228 ± 0.6 c3.99 ± 0.13
Compost20 ± 0.064.1 ± 3.11.16 ± 0.1 e0.40 ± 0.01.00 ± 0.1 f19 ± 1.927 ± 1.0 d4.10 ± 0.15
Cow slurry15 ± 0.037.3 ± 3.52.34 ± 0.1 abc0.47 ± 0.01.25 ± 0.0 bcde18 ± 1.130 ± 0.0 ab3.98 ± 0.08
Plant (P)0.0010.0000.000nsns0.0410.001ns
Bioaugmentation (B)nsnsns0.0000.000ns0.003ns
Amendment (A)0.0000.0000.000nsns0.0030.0000.026
P × Bnsnsns0.0100.001ns0.045ns
P × A0.0180.0000.0240.0020.001nsnsns
B × Ansns0.0500.0180.004nsnsns
P × B × Ansns0.027ns0.006ns0.023ns

