Abstract
Air bubble is a manufacturing defect that is common to composite wind turbine blades, which might evolve into cracks, leading to failure under load. The evolution and critical state of air bubble are studied to establish a condition assessment method for blade quality control. A method that is based on rheological theory is proposed to recognize the critical state by temperature jump. The air bubble is regarded as a null set and the temperature distribution of bubble defect is affected by the volumetric strain energy under tensile load. An infrared camera can detect a temperature jump when mechanical characteristics drastically change due to crack formation. A tensile fatigue test was carried out to verify the accuracy of this method. The relative error between the measured and calculated temperature rise at the critical moment was less than 7%. Additionally, the specimen with [0/90]s ply angles is more favorable to maintain the structural stability than the others. The method in this paper establishes a quantitative relationship between the meso-defect and macro mechanical properties. The defect severity of wind turbine blade can be defined by infrared imaging technology.
1. Introduction
Wind energy is the fastest growing renewable energy resource [1]. Wind power could supply 12% of global electricity demand by 2020, according to a report by the European Wind Energy Association [2]. Wind blade manufacturing expenses account for about 20% of the total manufacturing cost, and the cost of running and maintenance account for 25%–30% of the cost of manufacturing. The quality and performance of the blade are determinants of long-term safe and stable operation of the wind turbine [3]. Most wind turbine blades are made of glass fiber reinforced polymer composite. The remaining air in the fiber layer might be trapped when the resin flows, which is easy to leave some air bubbles in the fiber layers [4,5]. The failure of structure with air bubble defect is a process of damage accumulation. Under the alternating wind load, plastic deformation of air bubble in blade occurs caused by the stress concentration, which might cause the nucleation and growth coalescence of micro-crack [6,7]. The surface work of air bubble is provided by the volumetric strain energy of matrix in a limited region around the bubble. The process of working A causes temperature rise [8]. During the process of air bubble defect evolves into macro crack, the stress at the defect tip gradually increases and both the temperature and the stress reach their maximums at this location. Therefore, the typical sign of the formation of early macro cracks can be recognized by studying the relationship between the temperature field and the stress field. Thus, it is important for the judgment on early damage of wind turbine blade to study the evolution of air bubble defect, which can provide a quantitative basis of early damage assessment and factory inspection of wind turbine blades.
At present, the mechanics theory model simulation and experimental analysis have been applied to analyze the defect evolution of composites as the most common research techniques [9,10]. The study on defect evolution is related to several mechanics theories, such as fracture mechanics, damage mechanics, and computational mechanics [11,12]. As a bridge between the macro mechanics properties and the micro components, the meso-mechanical model of air bubble defect is important for the understanding of fatigue damage, because the quantitative relationship between the properties and geometry of micro components and the macro mechanics properties can be established by the meso-mechanical model [13,14]. The meso mechanical model that is based on the failure analysis can establish the relationship between the meso field and macro field; however, the properties of the meso components are hard to obtain. Thus, the meso mechanical model is always established using FEA approach [15,16]. The accuracy of meso mechanical model based on the finite element method is usually unsatisfactory, due to the inappropriate boundary condition and load [13]. The boundary condition and load/force are crucial, as they determine whether the model is consistent with the actual situation. The accuracy of mechanical model would be unsatisfactory if they are not appropriate [17]. Researchers have conducted a lot of fatigue tests and the scanning electron microscopy is used to observe the fracture surface of the composites in order to obtain the main failure mode of composites and summarize the evolution rules of mechanics properties based on the experimental data, as for the GFRP [18,19,20]. When compared to metal, it is much harder to research the fatigue of composites due to that the composites is anisotropic and the rules of defect evolution and fatigue damage mode are not unique [21,22]. Besides, the current study methods are not suitable for analyzing the meso-defects in wind turbine blade, due to the limitations that are caused by the type of defect, the boundary conditions, and the structure of defect. Thus, a new theoretical analysis method needs to be proposed to study the evolution of air bubble defect according to the feature of air bubble and the ply configuration of wind turbine blade.
A study method that is based on the rheological theory is proposed in this paper in order to solve the current problems of study on defect evolution and damage properties of the wind turbine blade. The whole GFRP composite is regarded as a set and the bubble is regarded as a null set. The volumetric strain energy is changed under the tensile load, which causes a temperature jump at the location of defect. The temperature jump can be used to represent the process of evolution [23]. The air bubbles are randomly distributed in wind turbine blade composites with different types and size scales. This disorder effect can be strongly amplified under tensile load. At the same time, the mechanical characteristics will dramatically change and “evolution cause mutation” is claimed to occur. Temperature is an effective parameter for representing the structure state. Thus, the temperature detection of the evolution process of bubble defects is also one of the best monitoring and diagnostic methods. A lot of achievements are reported regarding the study of defect evolution based on the rheological theory, such as the study on oil shale and polypropylene [24,25]. The analysis method that is based on temperature jump is feasible to represent the health condition of material structure. A non-destructive test technology is needed to measure the temperature.
The infrared thermal imaging technology can capture thermal radiation signal at a particular wave band and convert it into temperature, and then provide a visible thermal image of the target. This technology is always used to recognize the type, distribution, and geometry of the defect. The researchers obtain their research results by processing the thermal image or extracting the feature of temperature-time curve [26,27,28]. However, in this paper, the research object is the quantitative relationship between temperature and stress, which can be used to identify the critical moment when the bubble evolves into crack. Thus, the infrared thermal imaging technology is just a tool for obtaining the temperature and testifying the accuracy of the relation equation. An infrared thermal camera can record the temperature jump then the rules of evolution of grown-in defect in wind turbine blade under external load can be obtained.
One of the practical missions of studying the evolution of bubble defects in wind turbine blade is to ascertain how the evolution of bubble defects inside the material affects the macroscopic mechanical properties of the material [25,26,27,28,29]. Besides, the ply configuration is the basis of structural design and it greatly affects the success or failure of the structural design. The thermal dissipation of structure and the temperature distribution are also affected by the ply configuration. Therefore, in this paper, two defective specimens with different lay-up angles are manufactured for tensile fracture test to analyze the influence of bubble defects on the mechanical properties and establish a quantitative relation between the temperature distribution and the defect, and then obtain an effective and accurate criterion of damage assessment of wind turbine blade. In this paper, a function of temperature jump during the process of evolution was constructed to establish the relation between the temperature and the strength factor of critical stress at the critical moment when the air bubble evolves into crack. At the critical moment, the air bubble defect evolved into crack, so it is feasible to apply a calculation formula of stress field of macro crack to obtain a functional relation equation between the critical temperature rise and the critical stress. The equation can be used to recognize the temperature variation of wind turbine blade and judge the conditions of defect. The experiment verified the analytic solution. The method can not only detect the early damage of some complex systems in wind turbine blade, but also reveal the rules of evolution of the structure with the air bubble defect.
2. Temperature Jump of the Evolution of Air Bubble Defect
Energy transformation in the bubble during the evolution process created a local temperature field. The component B containing air bubble is regarded as a complex temperature system of union of the real sets and the null sets [30].
Here, the symbol represents the set of elements in the set, represents the temperature field without air bubble, represents the temperature field of air bubble, and A represents the available energy density of the temperature field B.
Let W denote the energy in the unit volume of the process zone within unit time. Let D denote the energy dissipation density. Subsequently, we define D and A in relation to W, such that a differential change of energy state corresponds to
A can be described by the following formula:
Here, H represents the entropy of the system (i.e., the degree of the chaos of the fibers inside the material). F represents the deformation gradient (i.e., the deformation rate). The parameters H and F, which reflect the number of fibers fractured inside the composite, can directly indicate the available energy density A of the system. The more fractured the fibers are, the more chaotic the fibers inside the material and the bigger the value of H. Fibers fracture also consumes most of the energy, increasing in temperature. Differentiating Equation (3), it can be obtained that:
W and the stress σ(t) can both be expressed by the volume variable V and the deformation gradient F as
Here,, which indicates the rate of change of the overall volume V0 relative to the overall area S (including the increased area of the inner surface of the defect). V is a dynamic variable. The current value of parameter λ represents a provided energy state, which is closely related to the Hamilton quantity of the system. From Equation (5), we can obtain:
Yuan Longwei expressed the locality of bubble defects as a temperature field and a stress field , as Equation (7) [30]
Here, represents the released energy. Equation (7) are further differentiated:
Therefore, we can further obtain:
and then
Here, the negative sign indicates work that is done by the system. In the evolution process of a bubble, both and F have a differential increment. Subsequently, from Equations (7) and (10),
From this Equation (11), the quantitative relationship between the temperature rise and the stress change during the evolution of bubble defects is established. However, the formula does not take into account the material properties of wind turbine blades and the effects of temperature changes on the evolution of bubble defects, is introduced as the disturbance temperature distribution that is caused by the evolution of bubble defects to complete the solution of the temperature field distribution. After is introduced, the temperature parameter is:
Here, represents the temperature distribution at the tip of the bubble defect under the external load. represents the disturbance temperature distribution that is caused by the evolution of bubble defects. When a bubble defect that has evolved into a macroscopic crack exceeds a given threshold, a critical state is reached, which results in “evolution-induced mutation”.
Assuming that the macroscopic crack that evolved from the bubble defect is the centre crack and is in the x-axis direction, the coordinate origin is the centre of the bubble, and the bubble diameter is . The relevant bubble defect groups on the left and right sides of the bubble are symmetrically present, and the average diameter is . During the evolution process, in addition to the localized temperature field that formed at the tip of the prefabricated bubble, a temperature field is formed around the bubble defects on the left and right sides of the front of the prefabricated bubble, and the average centre of the field is at an angle of with respect to the x-axis.
Although the prefabricated bubble is a three-dimensional structure, the evolution of the bubble is still applicable to the plane stress condition, due to it only existing inside a single fiber layer and the depth of solidification of each layer is only approximately 0.2–0.5 mm. Thus, the bulk modulus k, the crack opening displacement can be described as:
Here, represents the thermal expansion coefficient, v represents the poisson coefficient, represents the shear modulus , E represents the elastic modulus, and the crack opening displacement can be obtained [30]:
As the bubble only exists in a certain plane, and because is known to have a continuous second-order partial derivative and satisfy the Laplace equation, it can be approximated by the harmonic function. Therefore, the real part representation of the analytic function of the complex variable l can be used as
Subsequently, x and y can be expressed in dimensionless coordinates as
Afterwards,
The tensile direction during the test is assumed to be the x-axis direction, and the bubble defect temperature field reaches the critical condition due to the external energy work in the process. The temperature increase is recorded as 2ΔT(x). Applying the Gauchy-type integral of
With the gradual evolution of bubble defects, the temperature is also increasing during the process. The temperature field is assumed to be affected by a uniform heat flux of strength q, and the direction is perpendicular to the plane of the bubble. We know that
According to Equations (18) and (19):
Among them, the dimensionless temperature gradient is provided as
is involved to represent the ratio of the diameter of the bubble defect to the length of the macroscopic crack, which is . represents the initial thermal energy of bubble. The singular integral equation can be used to obtain the temperature jump in the dimensionless coordinates as
Above:
Due to:
Subsequently,
Owing to
The stress intensity factor is affected by the crack opening displacement during the evolution of the bubble directly affects and affects the expansion criterion that the bubble defect evolves into the critical state. The temperature jump does not directly affect the stress intensity factor and the change of stress. Therefore, the displacement jumps and , which are caused by the temperature jump , are used to construct the displacement jump function:
Additionally
The displacement jump function that is caused by the temperature jump of the bubble defect expressed by the dimensionless coordinates is expressed as . Therefore, the stress intensity factor at the macroscopic crack caused by the bubble defect can be written as [30]:
The critical expansion criterion when the bubble defect evolves into a macroscopic crack can be written as
Here, is the conversion coefficient between the local coordinate system and the stress in the global coordinate system.
In the case of cracks evolving from bubbles, the relationship between the critical temperature and the critical stress intensity factor can be written as:
Then, the critical temperature rise at the defect (i.e., the temperature jump) is
Bubble defects eventually evolve into macroscopic cracks under load. Therefore, in studying the critical stress during the conversion into macroscopic cracks, the calculation formula of crack tip stress can be used:
This stress is the value at the moment the bubble defect evolves into a crack. θ is the angle between the direction of crack propagation and the centre of the bubble, and at the moment when the angle θ just appears, the critical stress can be obtained by Equation (36).
At this moment, bubble defects have evolved into macroscopic cracks. As the crack is assumed to occur in the x direction, θ = 0° at the critical moment. The corresponding critical moment of stress is the critical moment when bubble defects evolve into macroscopic cracks.
The expression of KIC can be derived from Equation (37), as
Substituting Equation (37) into Equation (36), we obtain
Subsequently, substituting Equation (38) into Equation (36), we derive the relationship between the critical temperature rise and the critical stress from the bubble defect evolving into the macroscopic crack:
Here, represents the initial radius of the bubble defect, r represents the distance between the centre of bubble and the tip of crack, represents the angle between the direction of crack propagation and the centre of the bubble, represents the crack opening displacement that is calculated by Equation (14), T0 is the initial temperature, is the stress at the critical moment, and is the temperature variation.
It is evident from Equation (39) that the temperature variation can be calculated at the critical moment.
3. Experimental Results and Discussing
3.1. Specimen and Test Configuration
The load of a wind turbine blade was extremely complicated during operation. The main direction of the laminated fibers should be consistent with the direction of tension and compression of the component, due to the high strength and stiffness of the fibers in the axial direction. Laminates of 0°, ±45°, and 90° could sustain axial, shear, and lateral loads, respectively. Therefore, the most common ply angles of wind turbine blade were [45/−45]s and [0/90]s. The crack opening displacements, as well as the temperature variation at the critical moment, were also affected by the ply angles.
Four glass fiber reinforced polymer (GFRP) specimens were constructed with representatives of blade materials and construction processes though scale were reduced. The glass fiber cloth was woven roving. The epoxy resin was used as a matrix. The cure method of specimen was vacuum formed with a vacuum hot press. The specimen was fabricated by hand-laminated paste. Air bubbles were directly introduced into the resin during the mixing process prior to infusion with gel balls. Gel ball was a hollow water soaked ball whose surface could be easily vaporized by heating. The volatility of gel ball can be used to fabricate the defective specimen. When the specimen was cured, the gel ball reduced to a tiny size leaving the remaining size as bubbles. The size and location of bubble in the specimen was almost identical to that of gel ball before heating [29]. Gel ball with diameter of 1mm was inserted in the second layer of specimen and stay at the center of cross section. The specimens were manufactured with fiber directions of both [0/90]s and [45/−45]s. Table 1 lists the Lay-up angle, properties of bubbles, and serial number of specimens. The specimens with 30 layers were cut to approximtely 30 mm wide by 200 mm long. The thickness of each fiber layer was 0.5 mm. Table 2 lists the physical properties of glass fibers and bubbles.

Table 1.
Serial number of specimens and their defects.
Table 2.
Physical properties of glass fibers and bubbles.
As shown in Figure 1, matte black varnish with high thermal emissivity was painted on the surface of specimen A1 and A2 to improve the accuracy of temperature measurement. An infrared thermal camera InfRecR300, whose accuracy was 0.1 °C, was used to record the surface temperature of the specimen. The sampling frequency was at as 0.3 Hz.
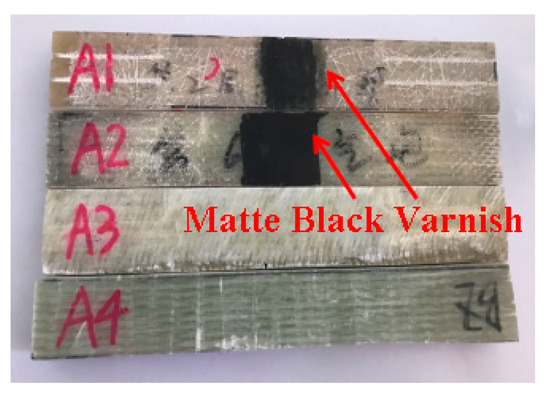
Figure 1.
Tensile test specimen.
In Figure 2, a servo hydraulic material testing machine MTS810, whose max dynamic load was 250 KN and max static load was 333 KN, carried out the tensile fracture tes. The frequency of fatigue load was set as 8 Hz and the stress ratio was set as 0.1. Two reinforced sheets were installed at both sides of the specimen and a special pattern was manufactured on the fixture to prevent the relative sliding between the fixture and the specimen.
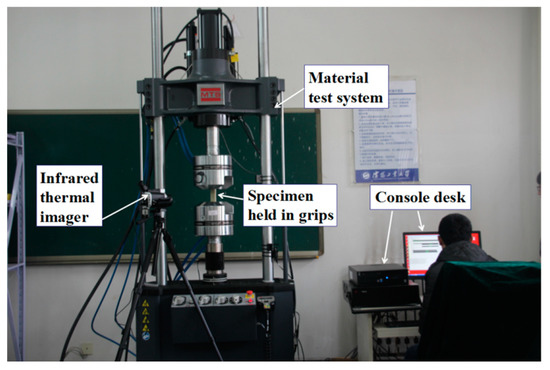
Figure 2.
Experimental setup.
3.2. Experimental Procedure
As shown in Figure 2, the specimen was fixed on the centre line of the fixtures and the air bubble was on the centre of thermal image. The focus of camera was adjusted according to image scale and quality. The distance between the specimen and the infrared camera lens was set as 28 cm. The temperature display limit was set as automatic mode to ensure that the temperature change was distinguished and the image was clear.
The in-door temperature was 28.6 °C and the test was carried out after the human temperature influence disappeared, which means that there should be no initial temperature difference on the surface of specimen.
The test was based on the national criterion GB/T 1446-2005, whose title was “the generals of test methods for properties of fiber-reinforced plastics”. The test was also based on the national criterion GB/T 1447-2005, whose title was “Fiber-reinforced plastics composites-Determination of tensile properties”. Cyclic loading with a different rate was considered. As a result, no matter how much the loading rate was, the internal friction would still cause a temperature rise around the defect. This is why the infrared thermal imaging can be used to detect the bubble in blade.
A pre-tension test was carried out to check the fixation and the instrument condition. The pre-tension was casted to eliminate the initial jitter phenomenon and ensure that the fixture was good. The pre-load was set as the lower limit of fatigue load.
Subsequently, the bottom of specimen was fixed and a 100 KN tensile load was casted on the top. Displacement control was adopted and the expectation was set as 0.17 mm/s. During the tensile fatigue test, the crack opening displacement, which can be used to calculate the critical stress by Equation (14), was recorded by a microscope when the crack appeared.
3.3. Experimental Results
3.3.1. Mechanics Performance of Defective and Indefective Specimens
The fracture test was carried out on the specimens with and without defect. Lots of specimens were manufactured and tested during the process of research. The results were obtained based on the statistical data. Figure 3a shows the typical load curves evolving in time, and Figure 3b shows the stress curves evolving in time.
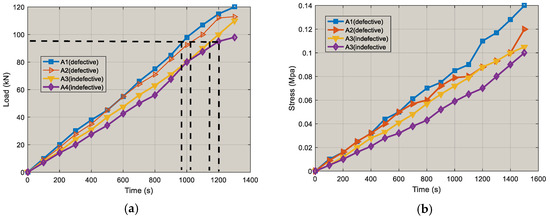
Figure 3.
(a) Load vs. time graph of the tensile test. (b) Stress vs. time graph of the tensile test.
The black dotted line in Figure 3a manifests that the hold time of indefective specimens (A3,A4) was longer than that of defective specimens (A1,A2) under load. As shown in Figure 3b, the stress of defective specimens were obviously larger than that of indefective specimens, which manifested in the defective specimen being more fragile than indefective specimen under same loading condition, even the bubbles were so tiny that they could not be observed by naked eyes. Accordingly, it is crucial to defect the early defect of wind turbine blade in order to prolong the service life of blade.
3.3.2. The Results of Infrared Thermography
Plastic deformation is a main factor leading to the accumulation of fatigue damage, which can cause irreversible change of meso-structure. Most of plastic deformation energy is given off as heat, which can reflect the energy transition indirectly when the fatigue damage accumulates. Thus, the evolution of defects can be regarded as the change process of temperature field, which can be recorded by an infrared thermal camera. The bubble was fabricated with the gel ball. The location of the bubble was consistent with the position to place gel ball.
In this paper, two thermal pictures were taken for every specimen at typical moments, such as the moment when the air bubble appears in a thermal image and TCI (The Time to Crack Initiation). Another two thermal pictures were taken during the evolution process.
As shown in Figure 4, during the whole test process in 1350 s, the highest temperature of the whole specimen was always on the air bubble. The temperature rose quickly from 0 s to 822 s, due to the thermal dissipation that is caused by the rapid transfer of stress.
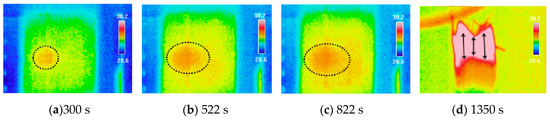
Figure 4.
Thermal images of specimen A1 at different moments.
As shown in Figure 4a, the temperature rose from 28.6 °C (i.e., the initial temperature) to 29.1 °C in 300 s, due to the release of energy accumulated in air bubble. The temperature variation mainly appeared in a circular area with a radius of 2 cm from the centre of the bubble. The bubble image was blurry, due to the bubble being located near the edge of the specimen. However, it was clear that the temperature in the centre of air bubble was always the highest, due to the stress disturbance with localized features. The stress region that was transmitted through this centre point was broader. Since the ply angles of A1 was [45/−45]s, the bridging between fibers was good, and the stress was not completely concentrated on a certain fiber, but was dispersed to the surroundings.
In Figure 4b,c, the temperature of air bubble kept rising.
In Figure 4d, a large amount of energy accumulated during the entire evolution process was violently released due to the sudden rupture of the bubble. The bubble radius increased from 2 mm to 3.5 mm and the temperature jump occurred. The measured temperature variation was approximately 4.4 °C at the critical moment when the air bubble evolved into macro-cracks. The specimen was in a failure state, and the 45° fibers were all pulled out from the matrix. The tremendous changes of the friction caused a tremendous change of the temperature. The fibers at the rupture of the bubble were distributed at 45°, which indicated that macro crack was formed at this time.
In Figure 5a, at the initial stage of test, the overall temperature difference of the specimen A2 was not obvious. The highest temperature value was approximately 0.2 °C higher than the initial temperature. The profile of bubble was blurry. As the bubble was extremely small, the temperature variation of the bubble was not obvious, the specimen was a uniform temperature distribution, and the difference between the maximum temperature and minimum temperature was only 0.6 °C.
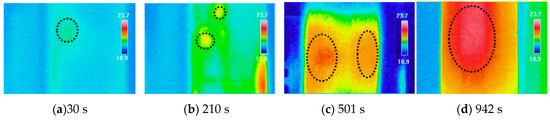
Figure 5.
Thermal images of specimen A2 at different moments.
As shown in Figure 5b, the profile of bubble was clearer, due to the internal temperature variation that was caused by the accumulation of energy. As the radius of the bubble increased, the internal stress was uniformly transmitted to the fibers. Some fibers broke at this moment, and the stress was continuously transmitted to the outside. The radius of air bubble and the number of broken fibers continuously increased. The localized micro plastic deformation caused by the high stress concentration was accumulated continuously.
In Figure 5c, the profile of bubble was clear and the temperature distribution was obviously uneven. The damage dramatically grew, but the damage tolerance was limited; therefore, the load was transmitted into the matrix, which caused an uneven temperature distribution. The temperature of air bubble was 2.6 °C higher than the initial temperature. The stress was gradually transmitted into the other meso-defects around the bubble.
The stress disturbance phenomenon was enhanced and the temperature jump appeared in Figure 5d. The temperature was approximately 3.6 °C higher than the initial value. Since the ply angles of A2 was [0/90]s, the temperature diffusion was also distributed in the fiber direction of 0° to 90°. Thus, the field of temperature variation was an ellipse.
By comparing A1 with A2, it can be seen that, although the ply angles [0/90]s had a broader distribution range of temperature variation, the failure did not occur to A2 under the same load. Thus, the ply angles [0/90]s can effectively restrain the stress transmission, which can be used to improve the stability of the wind turbine blade.
In Figure 6, a large field of temperature variation occurred under cyclic loading. The 45°/−45° ply angles were obviously shown on the right part of thermal image. By comparing A3 with A4, it can be seen that the plastic deformation increased and the range of temperature variation became broader in A3 under cyclic loading, due to the reduction of the shear strength that was caused by the intensive friction among fibers. Thus, the temperature variation was no longer concentrated. Besides, the angle between two connected fibers was not unique, which caused more than one thermal dissipation path. There was an irregularly shaped section of temperature rise in the middle area of A3, which manifested in the energy being accumulated in this section being caused by higher thermal dissipation among the meso components. The final damage of the specimen was not caused by the normal stress after the tensile stress, but by the misalignment damage caused by slippage under shearing action.
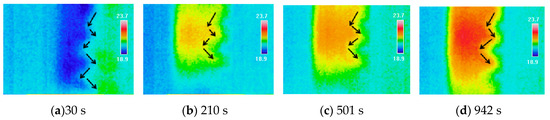
Figure 6.
Thermal images of specimen A3 at different moments.
As shown in Figure 7a, at the beginning of test, the temperature slightly increased, due to that large load being sustained by the edge of specimen and the load capacity at this position being weak.
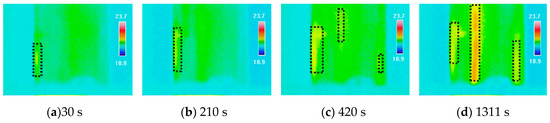
Figure 7.
Thermal images of specimen A4 at different moments.
In Figure 7b, the temperature on the edge of specimen obviously rose and it was 1 °C higher than that of the other parts of the specimen. A fiber whose direction was 90° with a slight temperature variation was observed in the middle of the specimen, which was far from the edge of the specimen. There was no temperature increase that occurred in other sections between this fiber and the edge. The results showed that, although the fiber distribution was manufactured as uniform as possible to eliminate the test error, some fibers with low carrying capacity were inevitable. As a brittle material, although the strength and modulus of the fiber were much higher than those of the matrix, the fiber was still more fragile than matrix under cyclic loading.
In Figure 7c, the first temperature rise appears in the fiber direction of 0°. The thermal energy dissipation and its propagation direction were clearly shown in the thermal image. At 420 s, the uneven distribution of the temperature became apparent and the temperature rise profile was clear. The temperature at the edge of the specimen was 0.5 °C higher than that in the direction of the temperature rise propagation. As shown in the image, most of the fibers were connected and the integral destruction did not occur. Although some fibers in the specimen fractured due to the poor manufacturing quality, the specimen still had a carrying capacity and its appearance was normal.
As shown in Figure 7d, the temperature in the middle section of the specimen, which was 1.6 °C higher than that at the edge of the specimen, rose rapidly. None of the fibers in other parts fractured and the field of the temperature rise was relatively concentrated. The effect of internal fiber interactions was not obvious. The temperature variation appeared in the fiber direction of 0° direction, but stopped in the fiber direction of 0.2°, which manifested in the stress distributed along this fiber being restrained by the 90° fiber. The stress cannot continue to transfer along this direction and it was concentrated on the fiber. The temperature jump did not occur, which showed that the [0/90]s layer played a critical role in determining the stability of the wind turbine blade structure.
In Figure 4, Figure 5, Figure 6 and Figure 7, the principle of thermal energy dissipation and stress transfer caused by internal friction in the fiber structure were reflected by the series of infrared thermal images. The whole process of plastic deformation of bubble defects could be observed from the infrared thermal images under cyclic loading, even though the ply angles of specimens were different. Among all of the specimens with different ply angles, the friction phenomenon was more obvious and the stress transfer was faster when the ply angles of specimen were [45/−45]. The probability of sudden failure was also higher. The temperature jump did not appear in specimens without the bubble defect. Thus, it is feasible that the infrared thermal imaging can be used to detect the blade defects in a wind turbine. It can not only detect the type and position of defects, but also record the serial thermal images of failure precursor. The defects in the wind turbine blade can be efficiently and quickly detected by this method and the blade can be repaired before it fails.
As shown in Figure 3, among all of the specimens, the stress of A2 was largest. The stress variation of specimen A2 was obvious, especially in the later stage of loading. It was obvious that the air bubbles affected the overall structure of specimen. The stress of specimen A4 was generally lower than that of the other three specimens, which indicated that [0/90]s was the most appropriate ply configuration for structural stability.
The images that were captured by the infrared camera were actually infrared thermal image of temperature field. By analyzing the infrared thermal image, it can be seen that the stress change and the rules of temperature field distribution were proportional to time. Within 0–500 s, no damage occurred in any specimens and the temperature smoothly increased. Within 500–800 s, the evolve process started and the profile of bubble became clear. After 800 s, the stress of all specimens substantially increased, and the infrared thermal image also showed a sharp increase in temperature. Thus, no matter what ply configuration was, no matter whether a defect existed, there was always a moment when most of the fibers were fractured and large-scale fiber misalignment occurred. At that moment, the thermal dissipation of structure increased suddenly. This phenomenon was caused by the internal friction. The temperature went higher and the deformation of structure became clearer on the infrared thermal image. Finally, the meso-defect evolved into crack.
According to Figure 3 and the thermal images, at the moment when the temperature rose fastest, the stress also arrived at the peak value. If the stress at this moment was substituted into equation 39, the critical temperature increase can be obtained, which was consistent with the temperature rise in the infrared thermal image.
3.3.3. Observation of the Defect with a Microscope
As introduced in Section 2, there will always be a critical moment when the temperature jump occurs. The temperature jump could be captured by thermal camera. As shown in Figure 8, a laser scanning confocal microscope OLS4100 was used to observe the fibers distribution at the critical moments in order to observe the actual damage inside the specimen, which consisted with the time of Figure 4d, Figure 5d, Figure 6d, and Figure 7d.
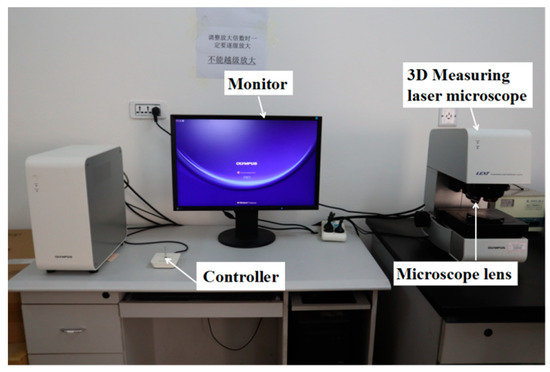
Figure 8.
Microscopic experimental setup.
At this critical moment (1350 s for A1, 942 s for A2, 1260 s for A3,1311 s for A4), the test was stopped and the specimen was taken off the test machine. The fracture surface was observed by microscope, and then Figure 9 was obtained.
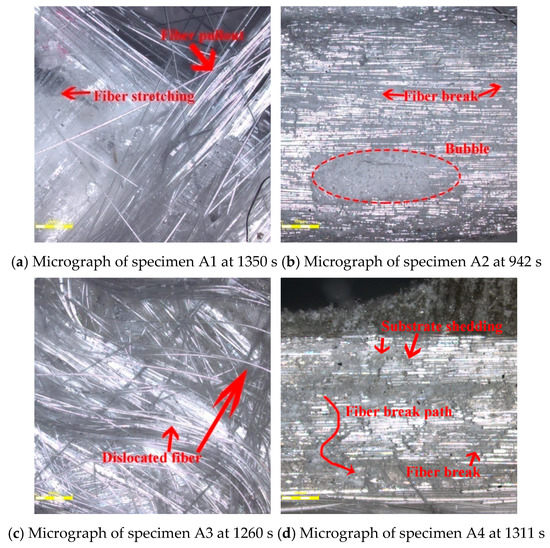
Figure 9.
Micrograph of specimens when a temperature jump occurred.
As shown in Figure 9a, a fracture surface of A1 was photographed by a microscope to show the situation of fiber fracture. The fracture occurred at the interlayer of the laminated fibers, which indicated that the bonding between the fractured fiber and the matrix was weak. Interface debonding occurred and the debond length increased with increasing load. Finally, the entire fiber was pulled out from the matrix. The fractured fiber that was released the stress at the crack tip and the stress field at the cross section was redistributed. The temperature continued to increase. Some energy was consumed by friction during the process of pulling. The fracture of fiber was accompanied by load transfer. The diameter of fiber did not substantially change, which indicates that the fiber instantaneously fractured and did not go through an elongation process. The reinforcement was disabled due to the hollow tubular structure of surrounding matrix. The interface misalignment can be caused by a small load, which caused that the bubble to evolve into crack. The distribution angles of some fibers changed after fracture, which indicated that the fibers had been pulled out from the matrix completely and they had lost their carrying capacity. Bending deformation of some fibers was seen in the pull-out section, which was local and occurred in a small range around the peeling position. Thus, its influence on the deformation and balance of the whole structure can be ignored. First crack and single-fiber fracture occurred in the weakest area under the tensile load. The specimen made a collapsing sound. As the load increased, more and more adjacent fibers fractured and the specimen continued to make a sound until the final failure occurred. Multiple bundles of fibers simultaneously fractured with a split-filamentary form.
In Figure 9b, a micrograph of the bubble in specimen A2 was captured, which showed that the fibers around the bubble were completely fractured. The bubble volume expanded and the internal air moved. A new bubble occurred when the bonding between fibers and matrix became fragile, which caused the fibers to fracture and propelled the bubble to evolve into crack. The meso-structure was loose and the degrees of fibers fracture were not uniform, due to the bubble. Some of the fibers became thinner and the bubble was easier to extend due to that a lot of fibers were pulled out. Some fibers around the bubble also fractured, which indicated that some of the load was dispersed on the surrounding fibers and the stress distribution was not uniform.
As shown in Figure 9c, a micrograph of fracture surface of A3 was captured after the test. Most of the fibers were still distributed at a 45° angle. Some fibers were fractured and some fibers changed the orientation. In some region, the interface debonding and fibers deformation occurred. There was no defect in A3. Thus, the internal stress distribution was mainly determined by the carrying capacity of the fibers and the bonding between the fibers and matrix. When the fibers began to sustain stress, the deformation was mainly the stretching of the fiber macro-molecular chain. The deformation of the fiber was almost in a straight line. With the load increased, the misalignment and slippage of macro-molecular chain occurred caused by the fracture of secondary bond. Fiber deformation became obvious and some parts of the fiber were disintegrated. The carrying capacity of fiber was weakened by fracture and the interaction of fractured fibers, which caused the final failure.
In Figure 9d, a micrograph of fracture surface of A4 was captured. The fibers in lay-up were all fractured and no fibers were pulled out from the matrix, which indicated that the bonding between fibers and matrix was firm. Although the fibers were fractured, the matrix can still protect the fibers and distributed the load to restrain the crack growth. Some energy was absorbed by slight debonding and slippage, which improved the mechanics performance of the composites. The stress could not traverse the fibers due to the firm bonding, so the stress transferred along the surface of fibers. The distribution of the fractured fibers had an S shape. Peeling occurred in some part of the matrix. The temperature slowly rose before the specimen fractured. During the process of defect evolution, the composites strength decreased and the deformation became obvious. The energy was also absorbed by the composites. Thus, the temperature inside the composites increased. More than one part of fiber were fractured, due to the uneven strengthen distribution along the lengthwise direction. Thus, the fibers in 90 lay-up had a greater fracture point than the one in [45/−45]s lay-up.
The temperature rise at the critical moment can be calculated by Equation (39), which can be used to identify the critical moment. As shown in Figure 9a and Figure 9b, the air bubble at this moment had evolved into crack actually. According to the fibers distribution and Equation (3), the degree of chaos of fibers (H) and the deformation rate of bubble (F) represented the effective energy efficiency density (A) directly. The more fibers were fractured, the bigger H and F were. Most of the energy was consumed by fractured fibers, which caused the reduction of A and the scattered distribution of fibers. The temperature rise at this moment was consistent with the result of Equation (39), which verified the accuracy of the quantitative relationship between temperature rise and stress.
4. Discussions
As shown in Figure 10, the temperature rise in A1 and A2 was recorded. The calculated temperature rise was compared with the measured result.
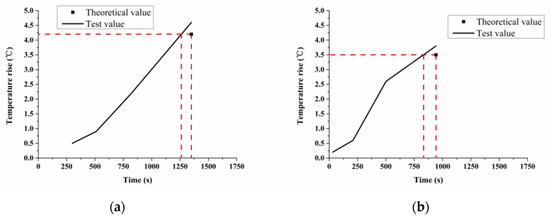
Figure 10.
Temperature rise vs. time graph. (a) Comparison of the calculated and measured temperature jump of specimen A1; (b) Comparison of the calculated and measured temperature jump of specimen A2.
As shown in Figure 10a, for specimen A1, the calculated temperature jumps at the critical moment was 4.26 °C under the load provided in this paper. The measured temperature jump at the moment was 4.5 °C. The relative error between them was 5.33%.
In Figure 10b, for specimen A2, the calculated temperature jumps at the critical moment was 3.5 °C. The measured temperature jump at the moment was 3.75 °C. The relative error between them was 6.67%.
The error was caused by the variation of environmental temperature and the human factors during the manufacturing process. The ply angles of A1 and A2 were different. However, both of the two calculation errors were less than 7%. Thus, Equation (39) can be applied to analyze the influence of different ply angles on the structure failure. No matter what the ply angle was, the bubble in the specimen ruptured and evolved into crack. The measured temperature rise was consistent with the calculated result.
As shown in the thermal images, the load should be transferred into different fibers and the load distribution on these fibers should be uniform in order to restrain the damage growth. This result was important for prolonging the service life of wind turbine blade.
As shown in the micrographs, the reinforcement effect of fibers was affected by not only the ply configuration, but also the degree of bonding.
The bubble evolution can be observed by an infrared thermal camera. The quantitative relationship between temperature and stress could be a theoretical reference of the quality inspection for wind turbine blade.
5. Conclusions
According to the rheological theory, the dimensionless temperature jump at the critical moment was calculated with the singular integral equation. The theoretical temperature rise was compared with the measured temperature rise, which was recorded by an infrared thermal camera at the critical moment during the process of tensile fatigue test. The relative error between the measured and calculated value was less than 7%, which indicated that the rules of temperature rise during the process of air bubble defect evolution can be revealed by the functional relation between the temperature and the stress at the critical moment when the air bubble evolved into crack under external load.
As shown in the infrared thermal images, different fiber distributions had different sensitivities to air bubble defect. The specimen with fiber orientation [−45/45]s ply angles had more crack propagation paths and directions, which caused the thermal energy to be widely distributed, and all the traverse fibers of the specimen were fractured in the end. As for the specimen with [0/90]s ply angles, the thermal dissipation mainly concentrated upon the fracture location of longitudinal fibers around the air bubble. The temperature of other parts slightly increased and the distribution was uniform. Thus, the laminates with [0/90]s ply angles were more favorable in maintaining the structural stability.
By comparing the temperature changing regularities of defective and indefective specimens under the same external load, it can be illustrated that the thermal dissipation of air bubble defect was faster than that of the specimen without defect, which caused a higher rate of temperature rise of the specimen containing defect. During the process of evolution of air bubble defect, the thermal dissipation of structure that was caused by the friction between fibers and matrix under tensile load gradually increased and the temperature increased. Thus, the infrared thermal imaging technology can be used to detect the process of air bubble defect evolution and recognize the critical state.
By experiment and contrastive analysis of micrographs, a result was obtained that the slippage between fibers and matrix as well as the interface debonding were caused by the air bubble. With the increasing load, the length of interface debonding increased and the stress disturbance transferred to the fibers around the air bubble. The thermal dissipation of structure increased, which was caused by the friction between matrix and fibers under tensile load. The temperature kept increasing and the structure deformation occurred, the bubble evolved into crack in the end.
Author Contributions
The individual contributions of authors are specified as follows. conceptualization, B.Z.; methodology, B.Z.; software, X.Z.; validation, B.Z., X.Z. and H.L.; formal analysis, X.Z.; investigation, X.Z.; resources, H.L.; data curation, X.Z.; writing—original draft preparation, X.Z.; writing—review and editing, B.Z.; visualization, X.Z.; supervision, B.Z.; project administration, B.Z.; funding acquisition, H.L.
Funding
This research was funded by “National Natural Science Foundation of China, grant number 51575361”, “Key Laboratory of Vibration and Control of Aero-Propulsion System Ministry of Education, Northeastern University, grant number VCAME201905” and “Project of Innovative Talents in Colleges and Universities of Liaoning Province, grant number 2017 737 (006973, 2018640230)”.
Acknowledgments
This research was funded by National Natural Science Foundation of China (Grant No. 51575361) and by Key Laboratory of Vibration and Control of Aero-Propulsion System Ministry of Education, Northeastern University (Grant No. VCAME201905). This project was also supported by Project of Innovative Talents in Colleges and Universities of Liaoning Province (Grant No.: 2017 737(006973, 2018640230)).
Conflicts of Interest
The authors declare no conflict of interest.
References
- Dai, J.C.; Xin, Y.; Li, W. Development of wind power industry in China: A comprehensive assessment. Renew. Sustain. Energy Rev. 2018, 97, 156–164. [Google Scholar] [CrossRef]
- Millais, C.; Teske, S. A blueprint to achieve 12% of the world’s electricity from wind power by 2020. Wind Force 2004, 1, 17–20. [Google Scholar]
- Hu, Y.P.; Dai, J.C. Research Status and Development trend on Large Scale Wind Turbine Blades. J. Mech. Eng. 2013, 10, 140–151. [Google Scholar] [CrossRef]
- Rikard, B.H. Damage and Defect Description. In Defects and Damage in Composite Materials and Structures; CRC Press: British, UK, 2014; pp. 21–22. [Google Scholar]
- Wang, R.G. Modulating void action and residual stress variation of composite materials during curing process. Acta Mater. Compos. Sin. 2002, 05, 95–101. [Google Scholar]
- Ye, G.; Neal, B. Development of an ultrasonic NDT system for automated in-situ inspection of wind turbine blades. In Proceedings of the 7th European Workshop on Structural Health Monitoring, Nantes, France, 8 July 2014. [Google Scholar]
- Soch, G. Experimental investigations of fatigue cracks nucleation, growth and coalescence in structural steel. Int. J. Fatigue 2003, 25, 139–147. [Google Scholar] [CrossRef]
- Xuan, F.J. Effective energy dissipation analysis method for fatigue damage of laminated composites. Acta Mater. Compos. Sin. 1997, 14, 115–123. [Google Scholar]
- Wang, J.; Callus, P.J.; Bannister, M.K. Experimental and numerical investigation of the tension and compression strength of un-notched and notched quasi-isotropic laminates. Compos. Struct. 2004, 64, 297–306. [Google Scholar] [CrossRef]
- Tserpes, K.I.; Labeas, G. Strength prediction of bolted joints in graphite/epoxy composite laminates. Compos. Part B Eng. 2002, 33, 521–529. [Google Scholar] [CrossRef]
- Garg, A. Delamination-a damage mode in composite structures. Eng. Fract. Mech. 1988, 29, 557–584. [Google Scholar] [CrossRef]
- Batra, R.C. Damage and failure in low energy impact of fiber-reinforced polymeric composite laminates. Compos. Struct. 2012, 94, 540–547. [Google Scholar] [CrossRef]
- Zhan, B.M. A Virtual Experimental Approach to Estimate Composite Mechanical Properties: Modeling with an Explicit Finite Element Method. Comput. Mater. Sci. 2010, 49, 645–651. [Google Scholar] [CrossRef]
- Ryvkin, M.; Aboudi, J. A continuum approach to the analysis of the stress field in a fiber reinforced composite with a transverse crack. Int. J. Solids Struct. 2007, 44, 6826–6841. [Google Scholar] [CrossRef][Green Version]
- Ko, W.L. Finite Element Microscopic Stress Analysis of Cracked Composite Systems. J. Compos. Mater. 1978, 12, 97–115. [Google Scholar] [CrossRef]
- Zhao, L. Strength Prediction of Composites Based On Unit Cell Analytic Model And Progressive Damage Analysis. Master’s Thesis, Harbin Institute of Technology, Harbin, China, 2012. [Google Scholar]
- Mishnaevskv, L.L., Jr.; Schmauder, S. Continuum Mesomechanical Finite Element Modeling in Materials Development: A State-of-the-Art Review. Appl. Mech. Rev. 2001, 54, 49–68. [Google Scholar] [CrossRef]
- Yao, Y.; Chen, S.H. The effect of a graded inter-phase on the mechanism of stress transfer in a fiber-reinforced composite. Mech. Mater. 2013, 58, 35–54. [Google Scholar] [CrossRef]
- Swolfs, Y.; Gorbatikh, L.; Verpoest, I. Stress concentrations in hybrid unidirectional fiber-reinforced composites with random fiber packing. Compos. Sci. Technol. 2013, 85, 10–16. [Google Scholar] [CrossRef]
- Perez-martin, M.J. Impact behavior of hybrid glass/carbon epoxy composites. J. Appl. Mech.-Trans. 2013, 80. [Google Scholar] [CrossRef]
- Sathishkumar, T.P. Hybrid fiber reinforced polymer composites-a review. J. Reinf. Plast. Compos. 2014, 33, 454–471. [Google Scholar] [CrossRef]
- Haque, A.; Ramasetty, A. The theoretical study of stress transfer in carbon nanotube reinforced polymer matrix composites. Compos. Struct. 2005, 71, 68–77. [Google Scholar] [CrossRef]
- Yuan, L.W. Experimental research of the temperature field at crack tip during the process of crack growth. Nat. Sci. J. Xiangtan Univ. 1992, 3, 44–60. [Google Scholar]
- Xiao, H.T.; Zhou, W.H. Mesoscopic analysis of rheological growth of rock cracks. J. Rock Mech. Eng. 1999, 18, 623–626. [Google Scholar]
- Zhou, Z.G. Experimental Research on Influence of Voids on COD. J. Wuhan Univ. Technol. 2001, 9, 326–328. [Google Scholar]
- Meng, L.Y. Study on Detection of Infrared Thermal Imaging of Bonding Between Covering and Web of Wind Turbine Blade. Optoelectron. Technol. 2015, 03, 174–178. [Google Scholar]
- Huo, Y. Quantitative infrared prediction method for defect depth in carbon fiber reinforced plastics composite. Acta Phys. Sin. 2012, 61, 199–205. [Google Scholar]
- Pantano, A.; Montinaro, N.; Cerniglia, D.; Micciulla, F.; Bistare, S.; Cataldo, A.; Bellucci, S. Novel non-destructive evaluation technique for the detection of poor dispersion of carbon nanotubes in nanocomposites. Compos. Part B Eng. 2019, 163, 52–58. [Google Scholar] [CrossRef]
- Reddy, G.; Krishna, V.; Shanker, K. Tensile and Water Absorption Properties of FRP Composite Laminates without Voids and with Voids. Procedia Eng. 2017, 173, 1684–1691. [Google Scholar] [CrossRef]
- Yuan, L.W. Constitutive equation with ordered parameters for viscoelastic material contained defects. Acta Mech. Solida Sin. 1996, 4, 320–330. [Google Scholar]
© 2019 by the authors. Licensee MDPI, Basel, Switzerland. This article is an open access article distributed under the terms and conditions of the Creative Commons Attribution (CC BY) license (http://creativecommons.org/licenses/by/4.0/).