Spotted Hyena Optimizer and Ant Lion Optimization in Predicting the Shear Strength of Soil


Abstract
1. Introduction
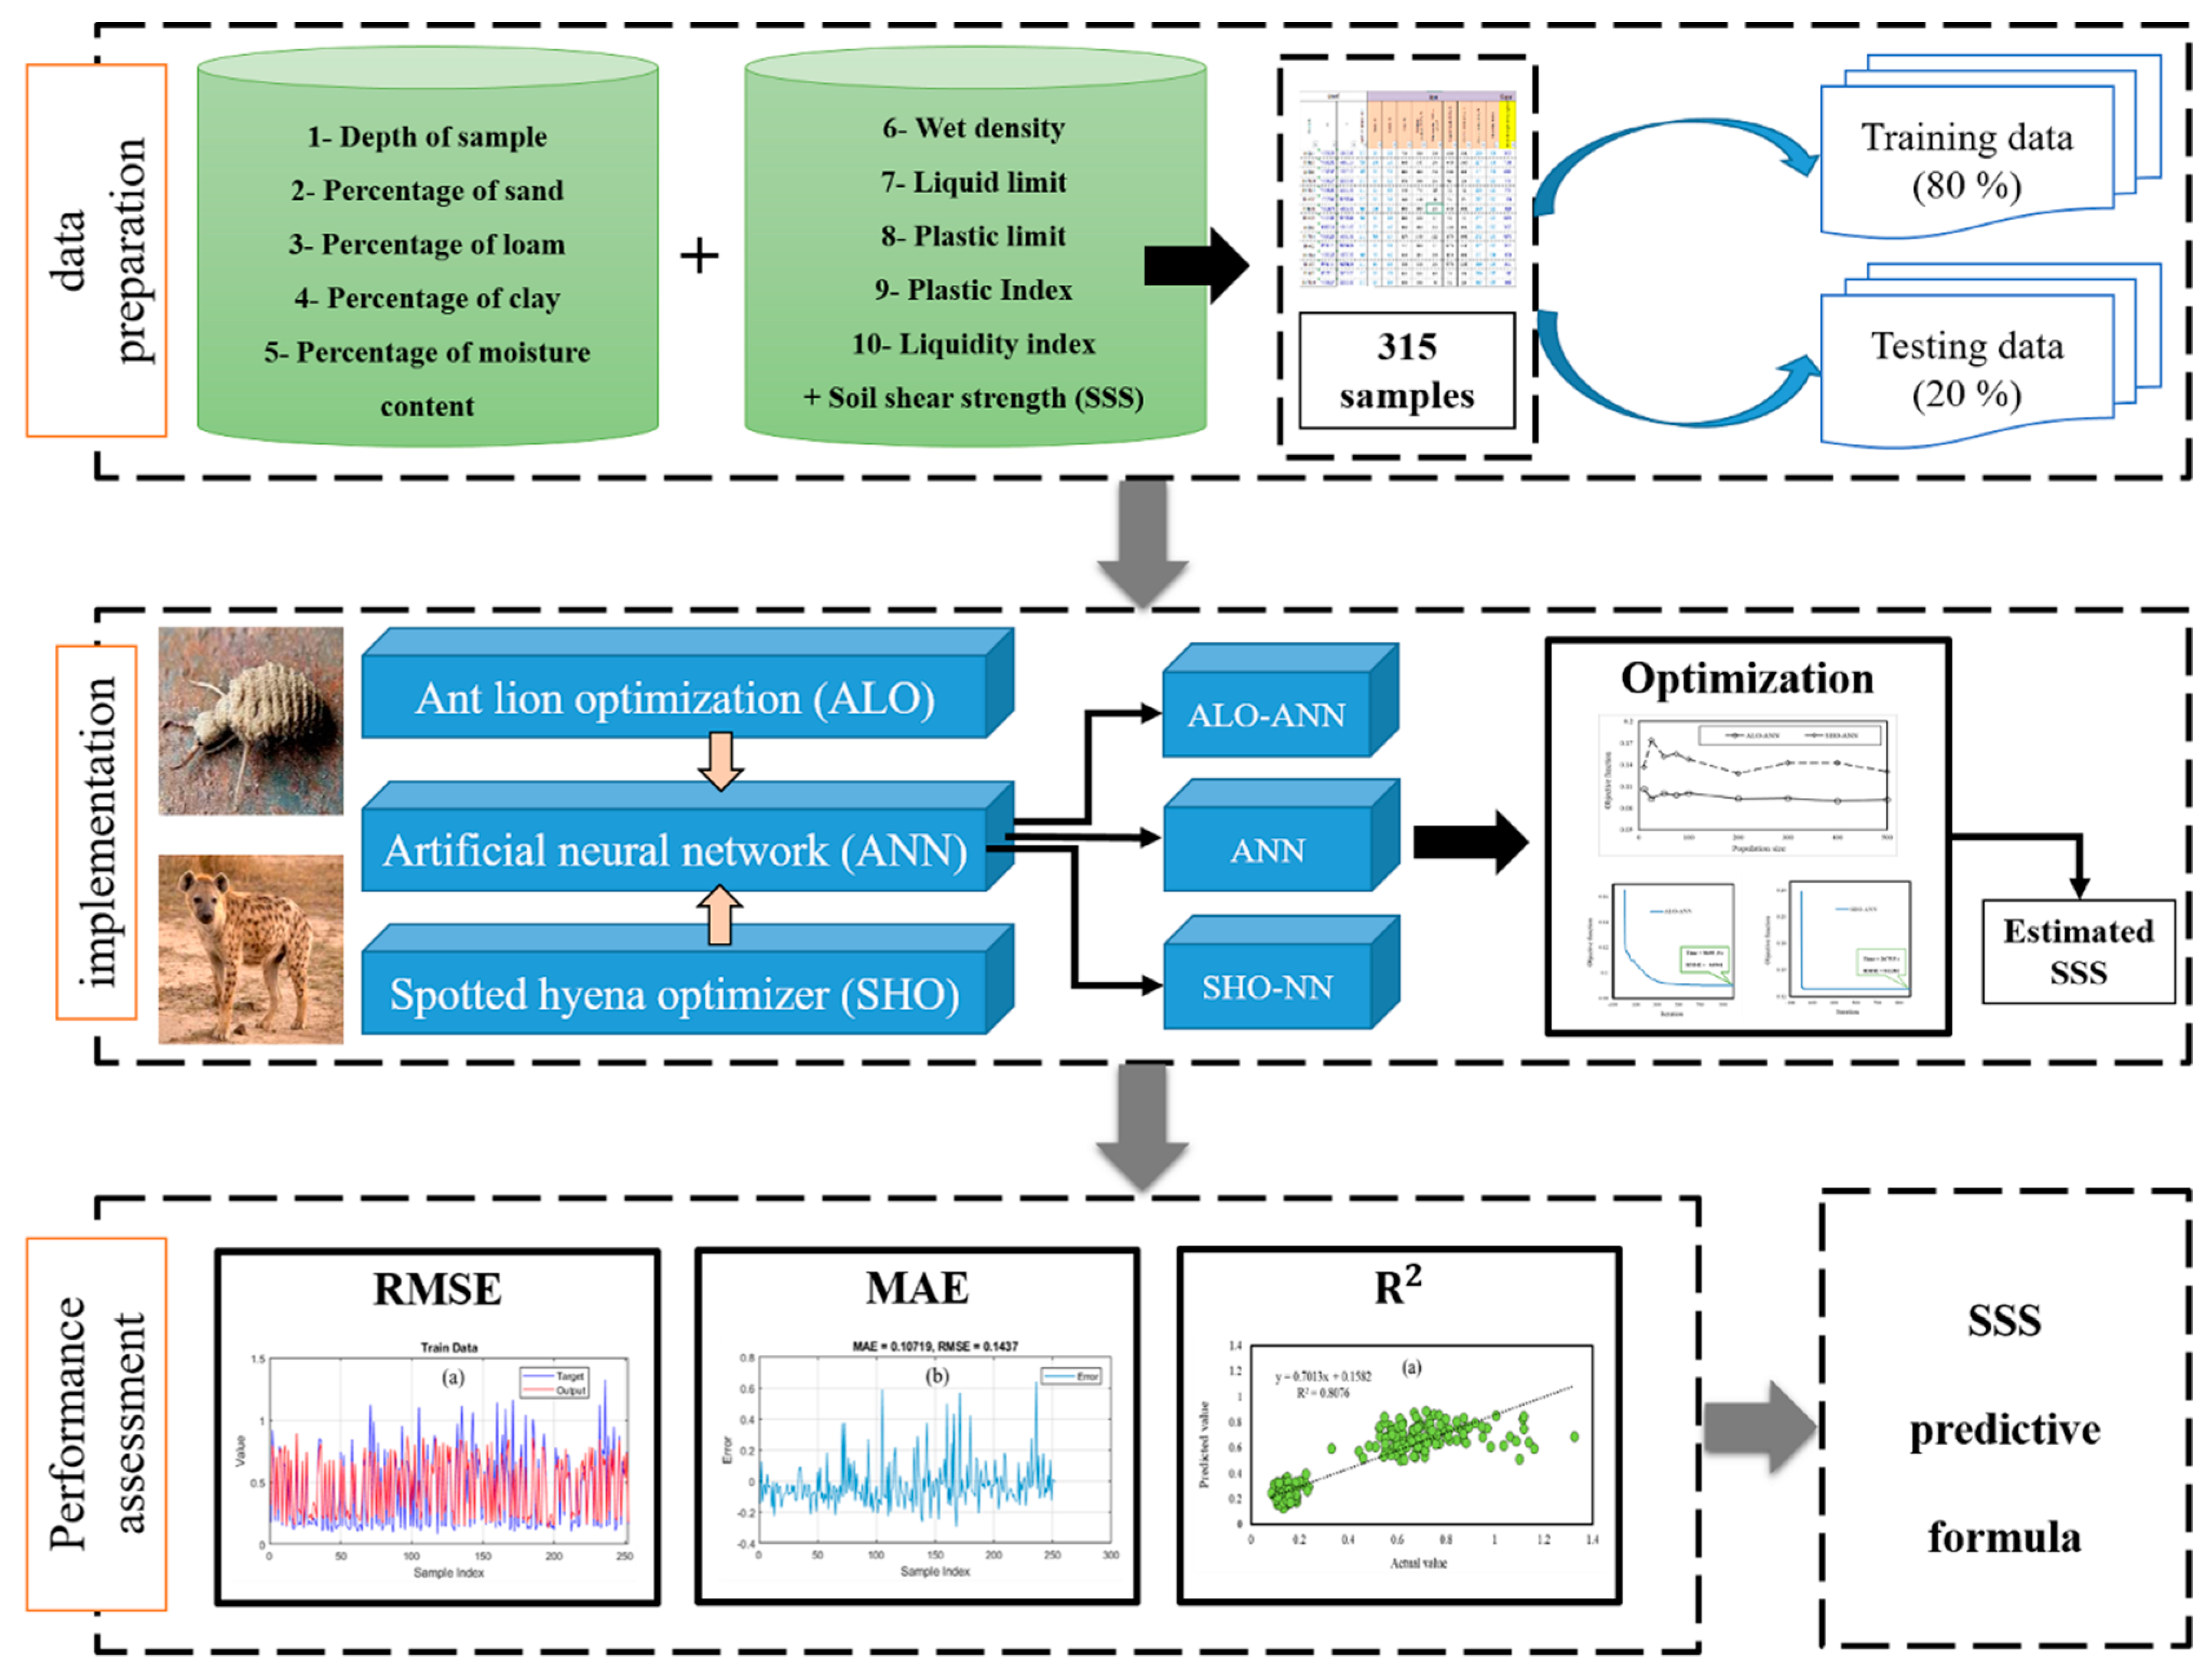
2. Methodology
2.1. Artificial Neural Network
2.2. Metaheuristic Algorithms
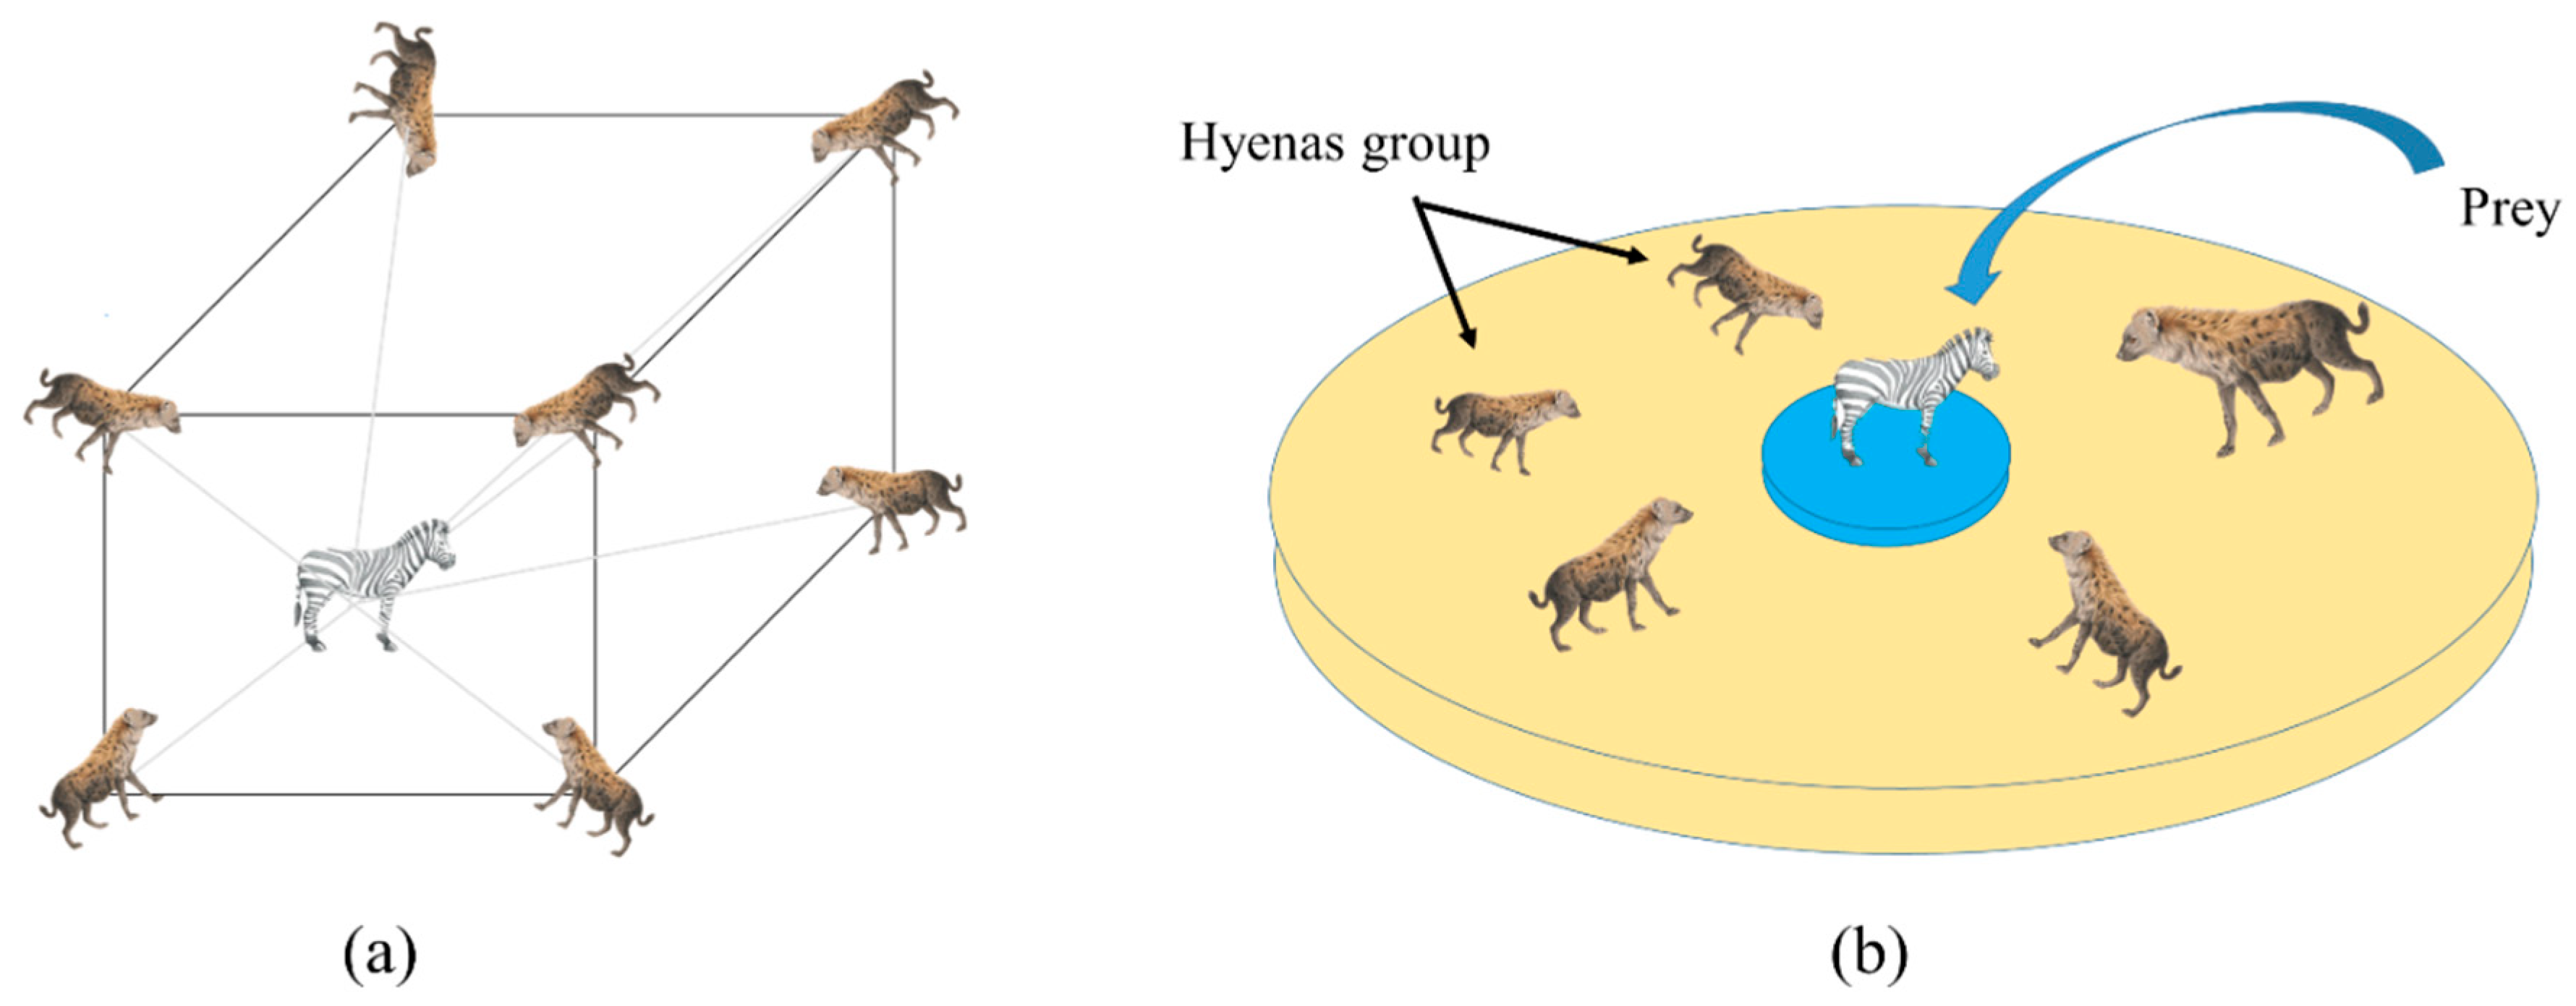
2.2.1. Spotted Hyena Optimizer
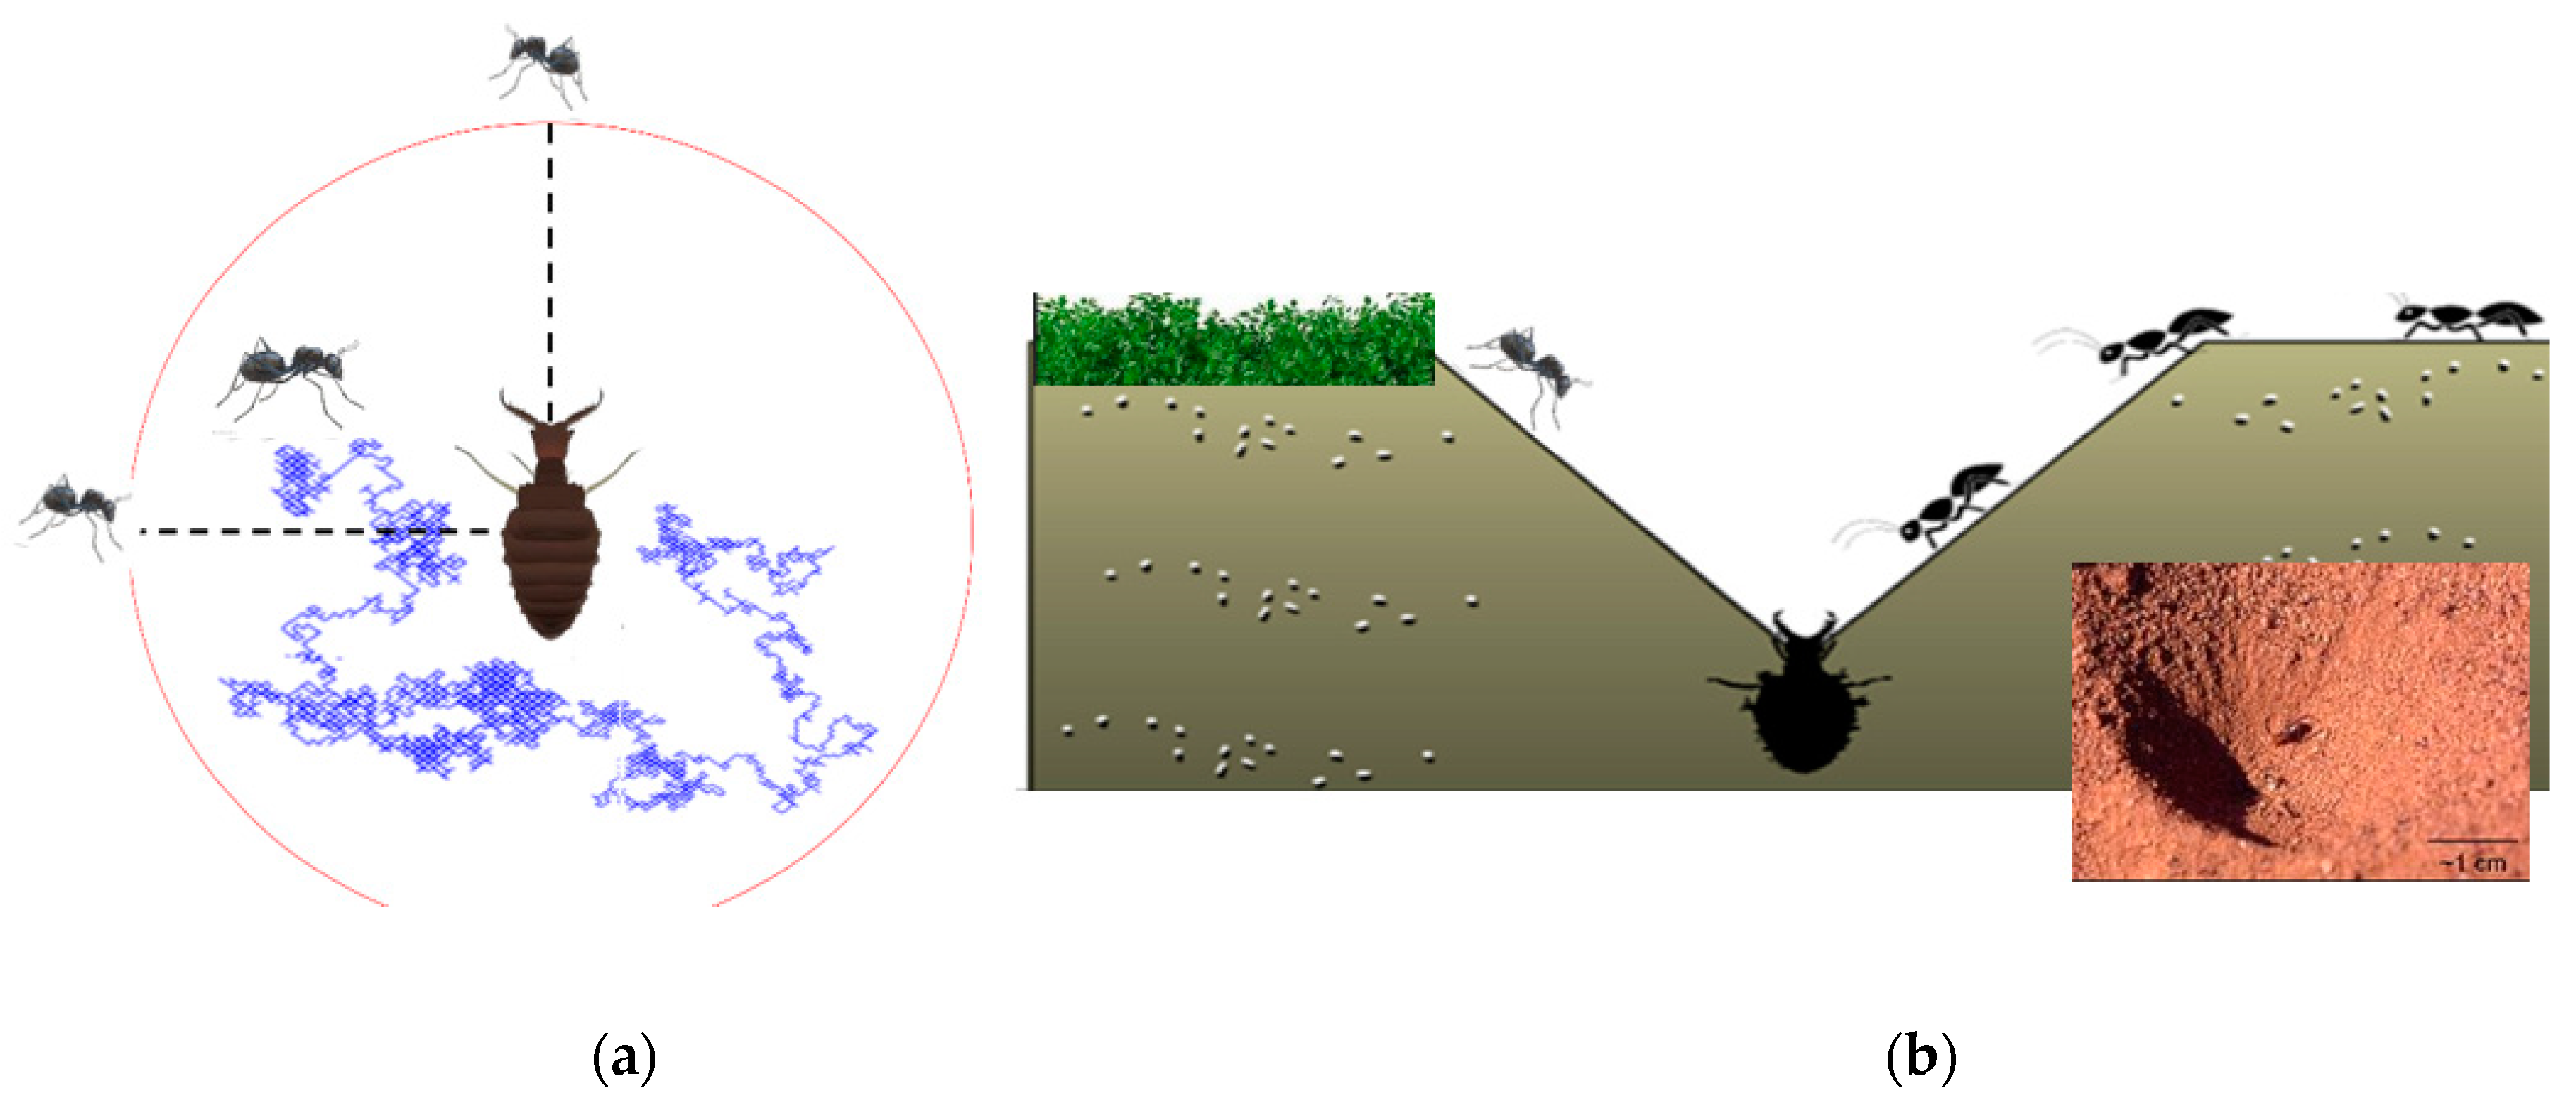
2.2.2. Ant Lion Optimization
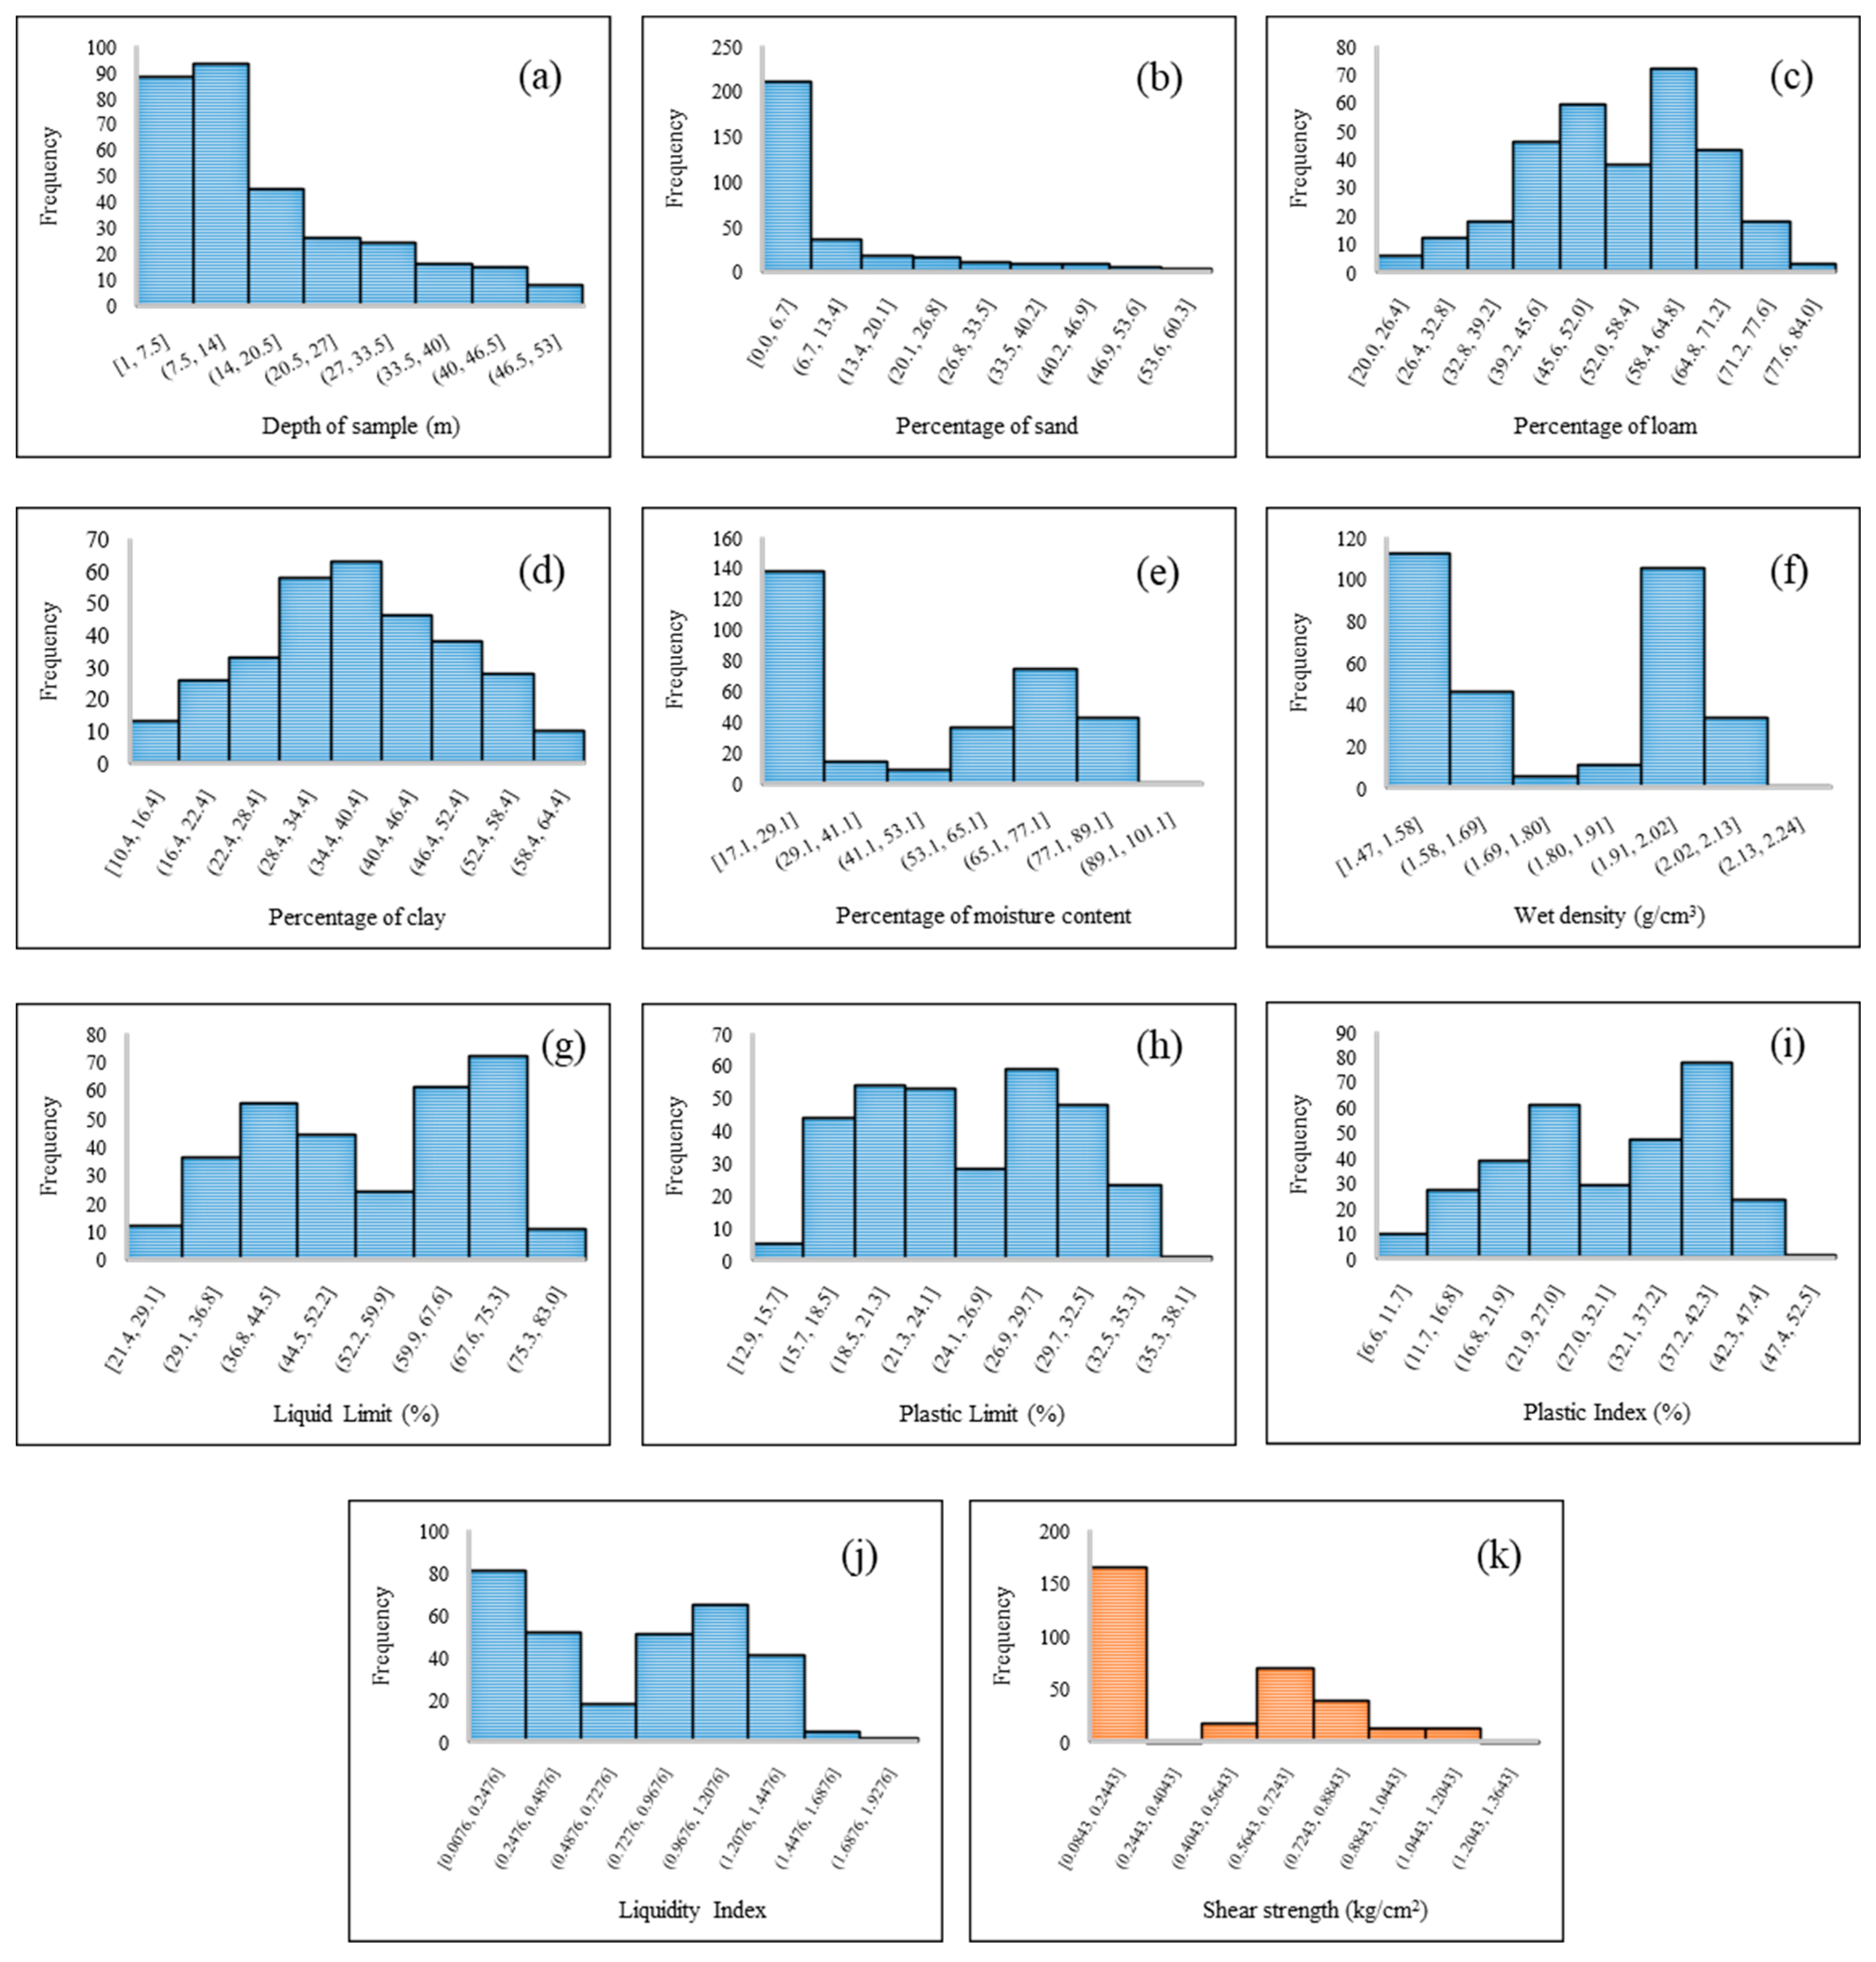
3. Data Collection and Statistical Analysis
4. Results and Discussion
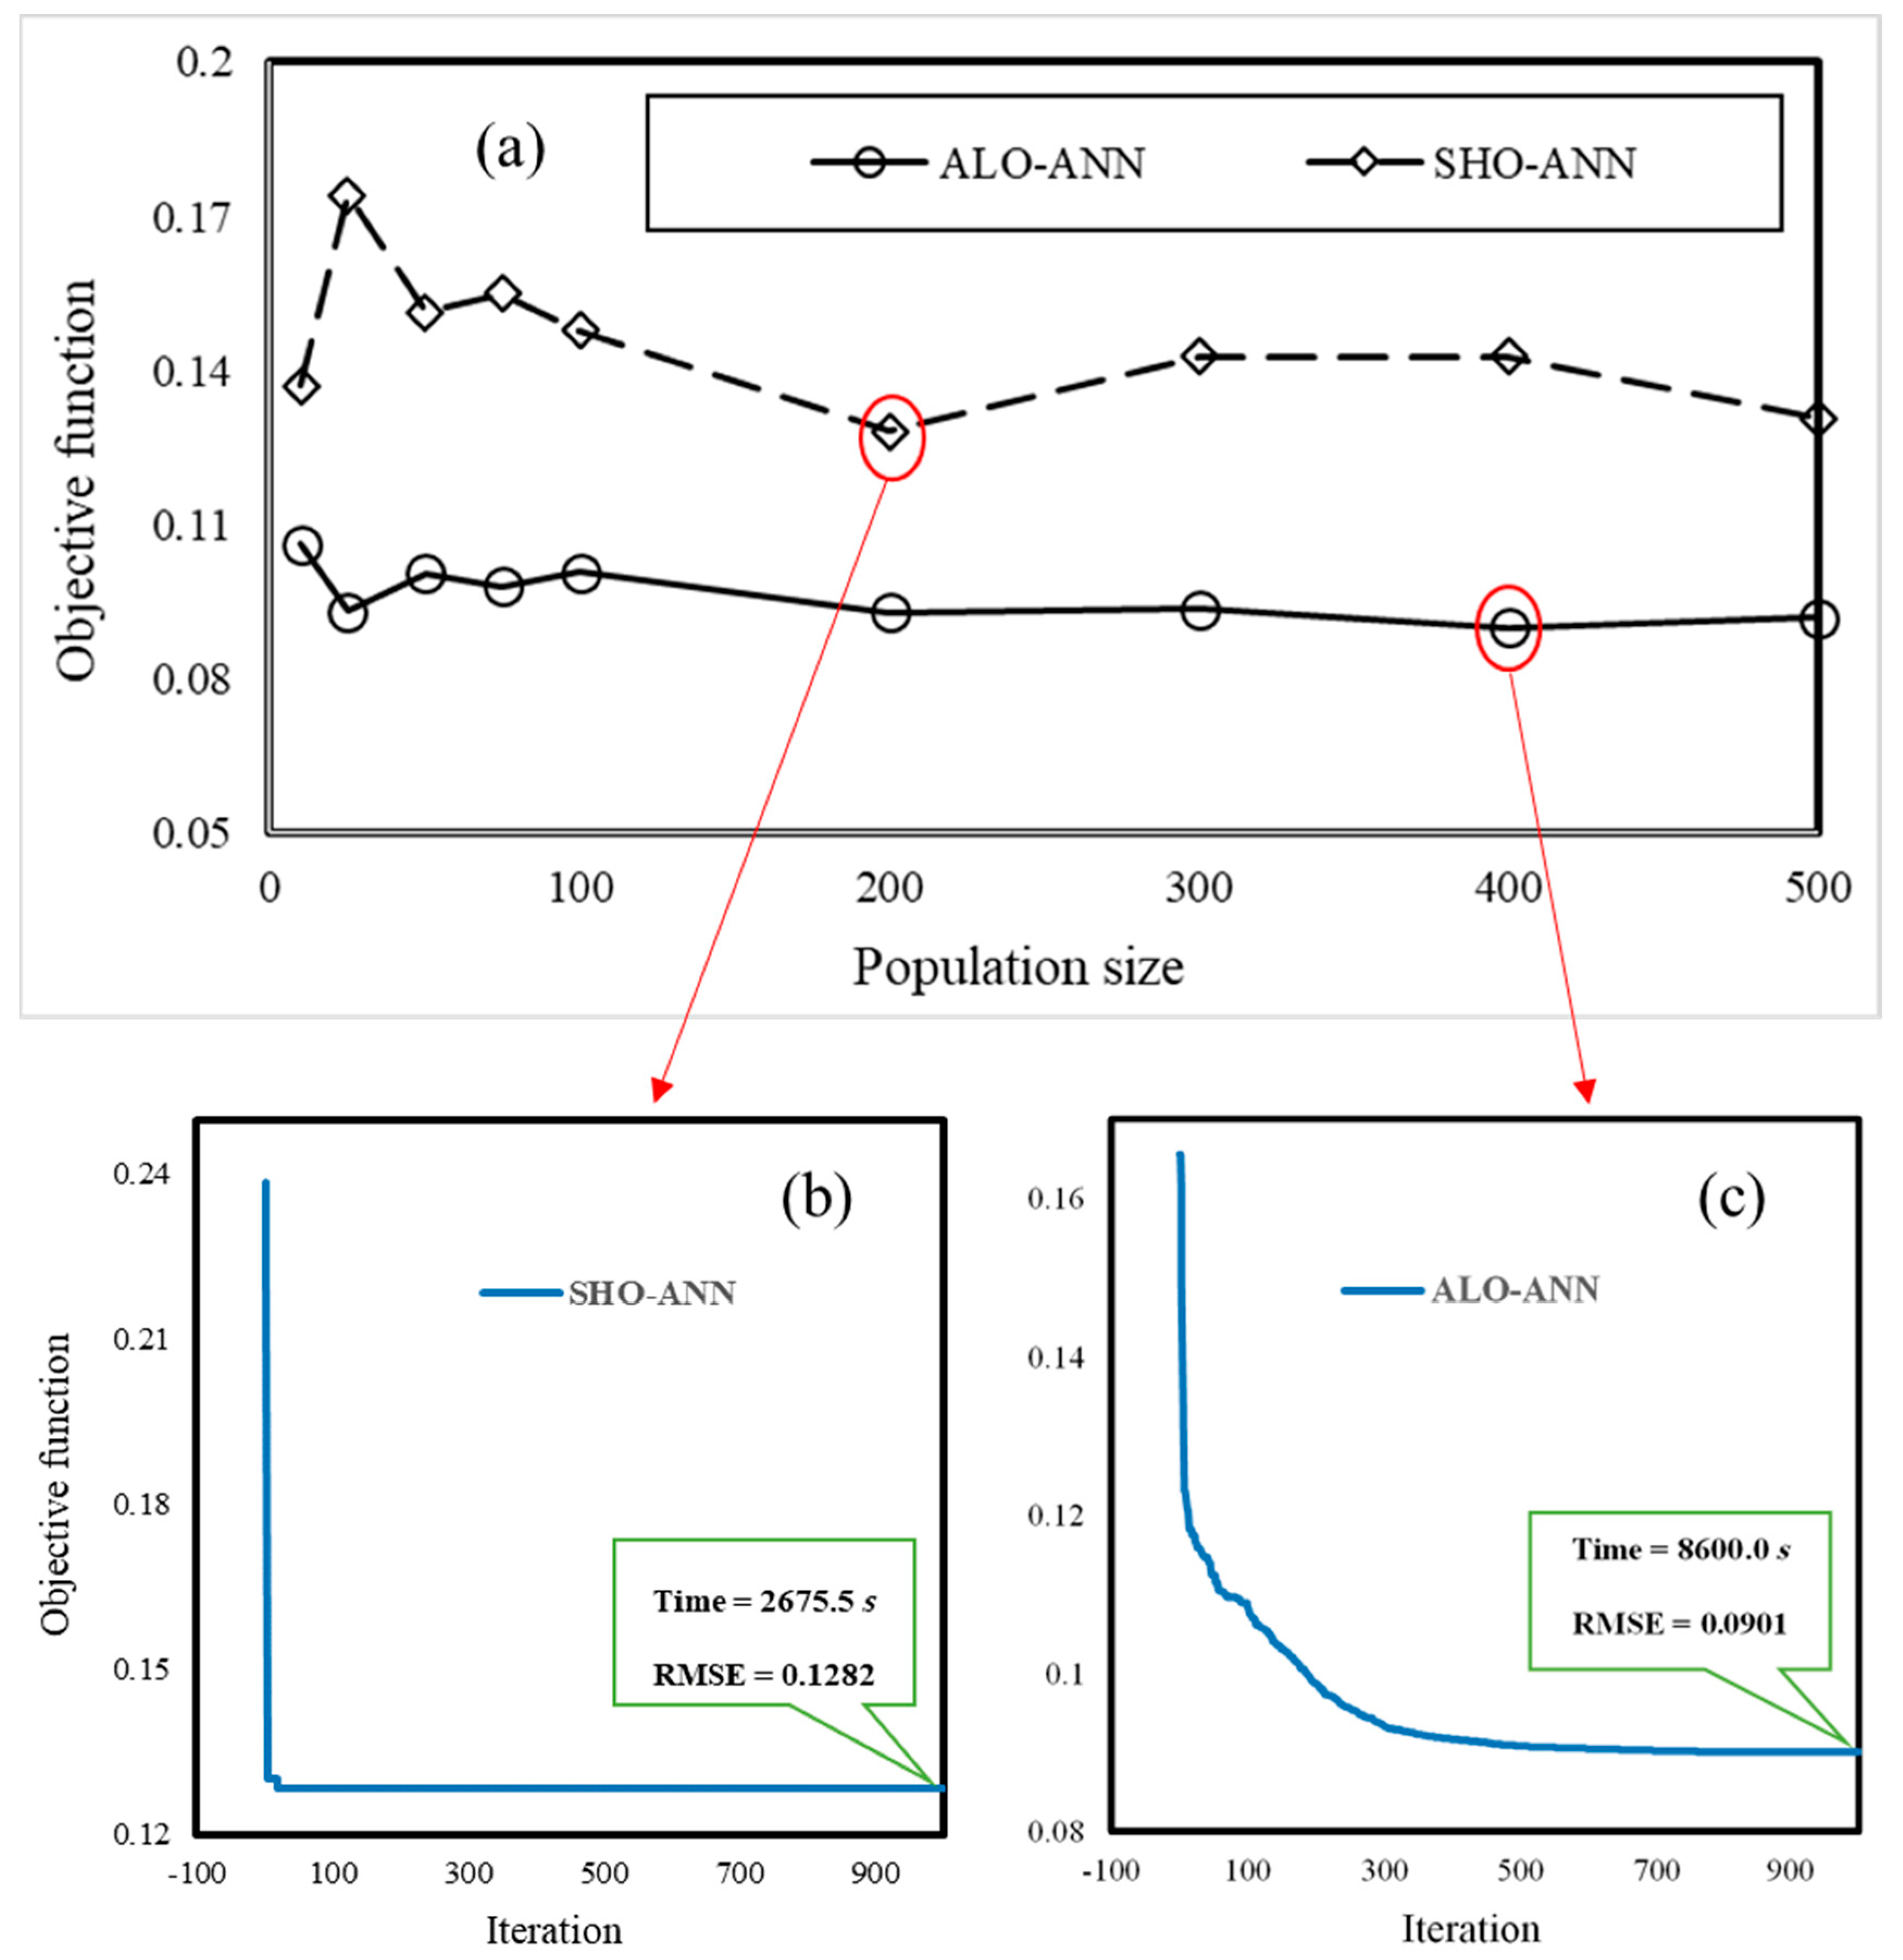
4.1. Optimizing the MLP using ALO and SHO
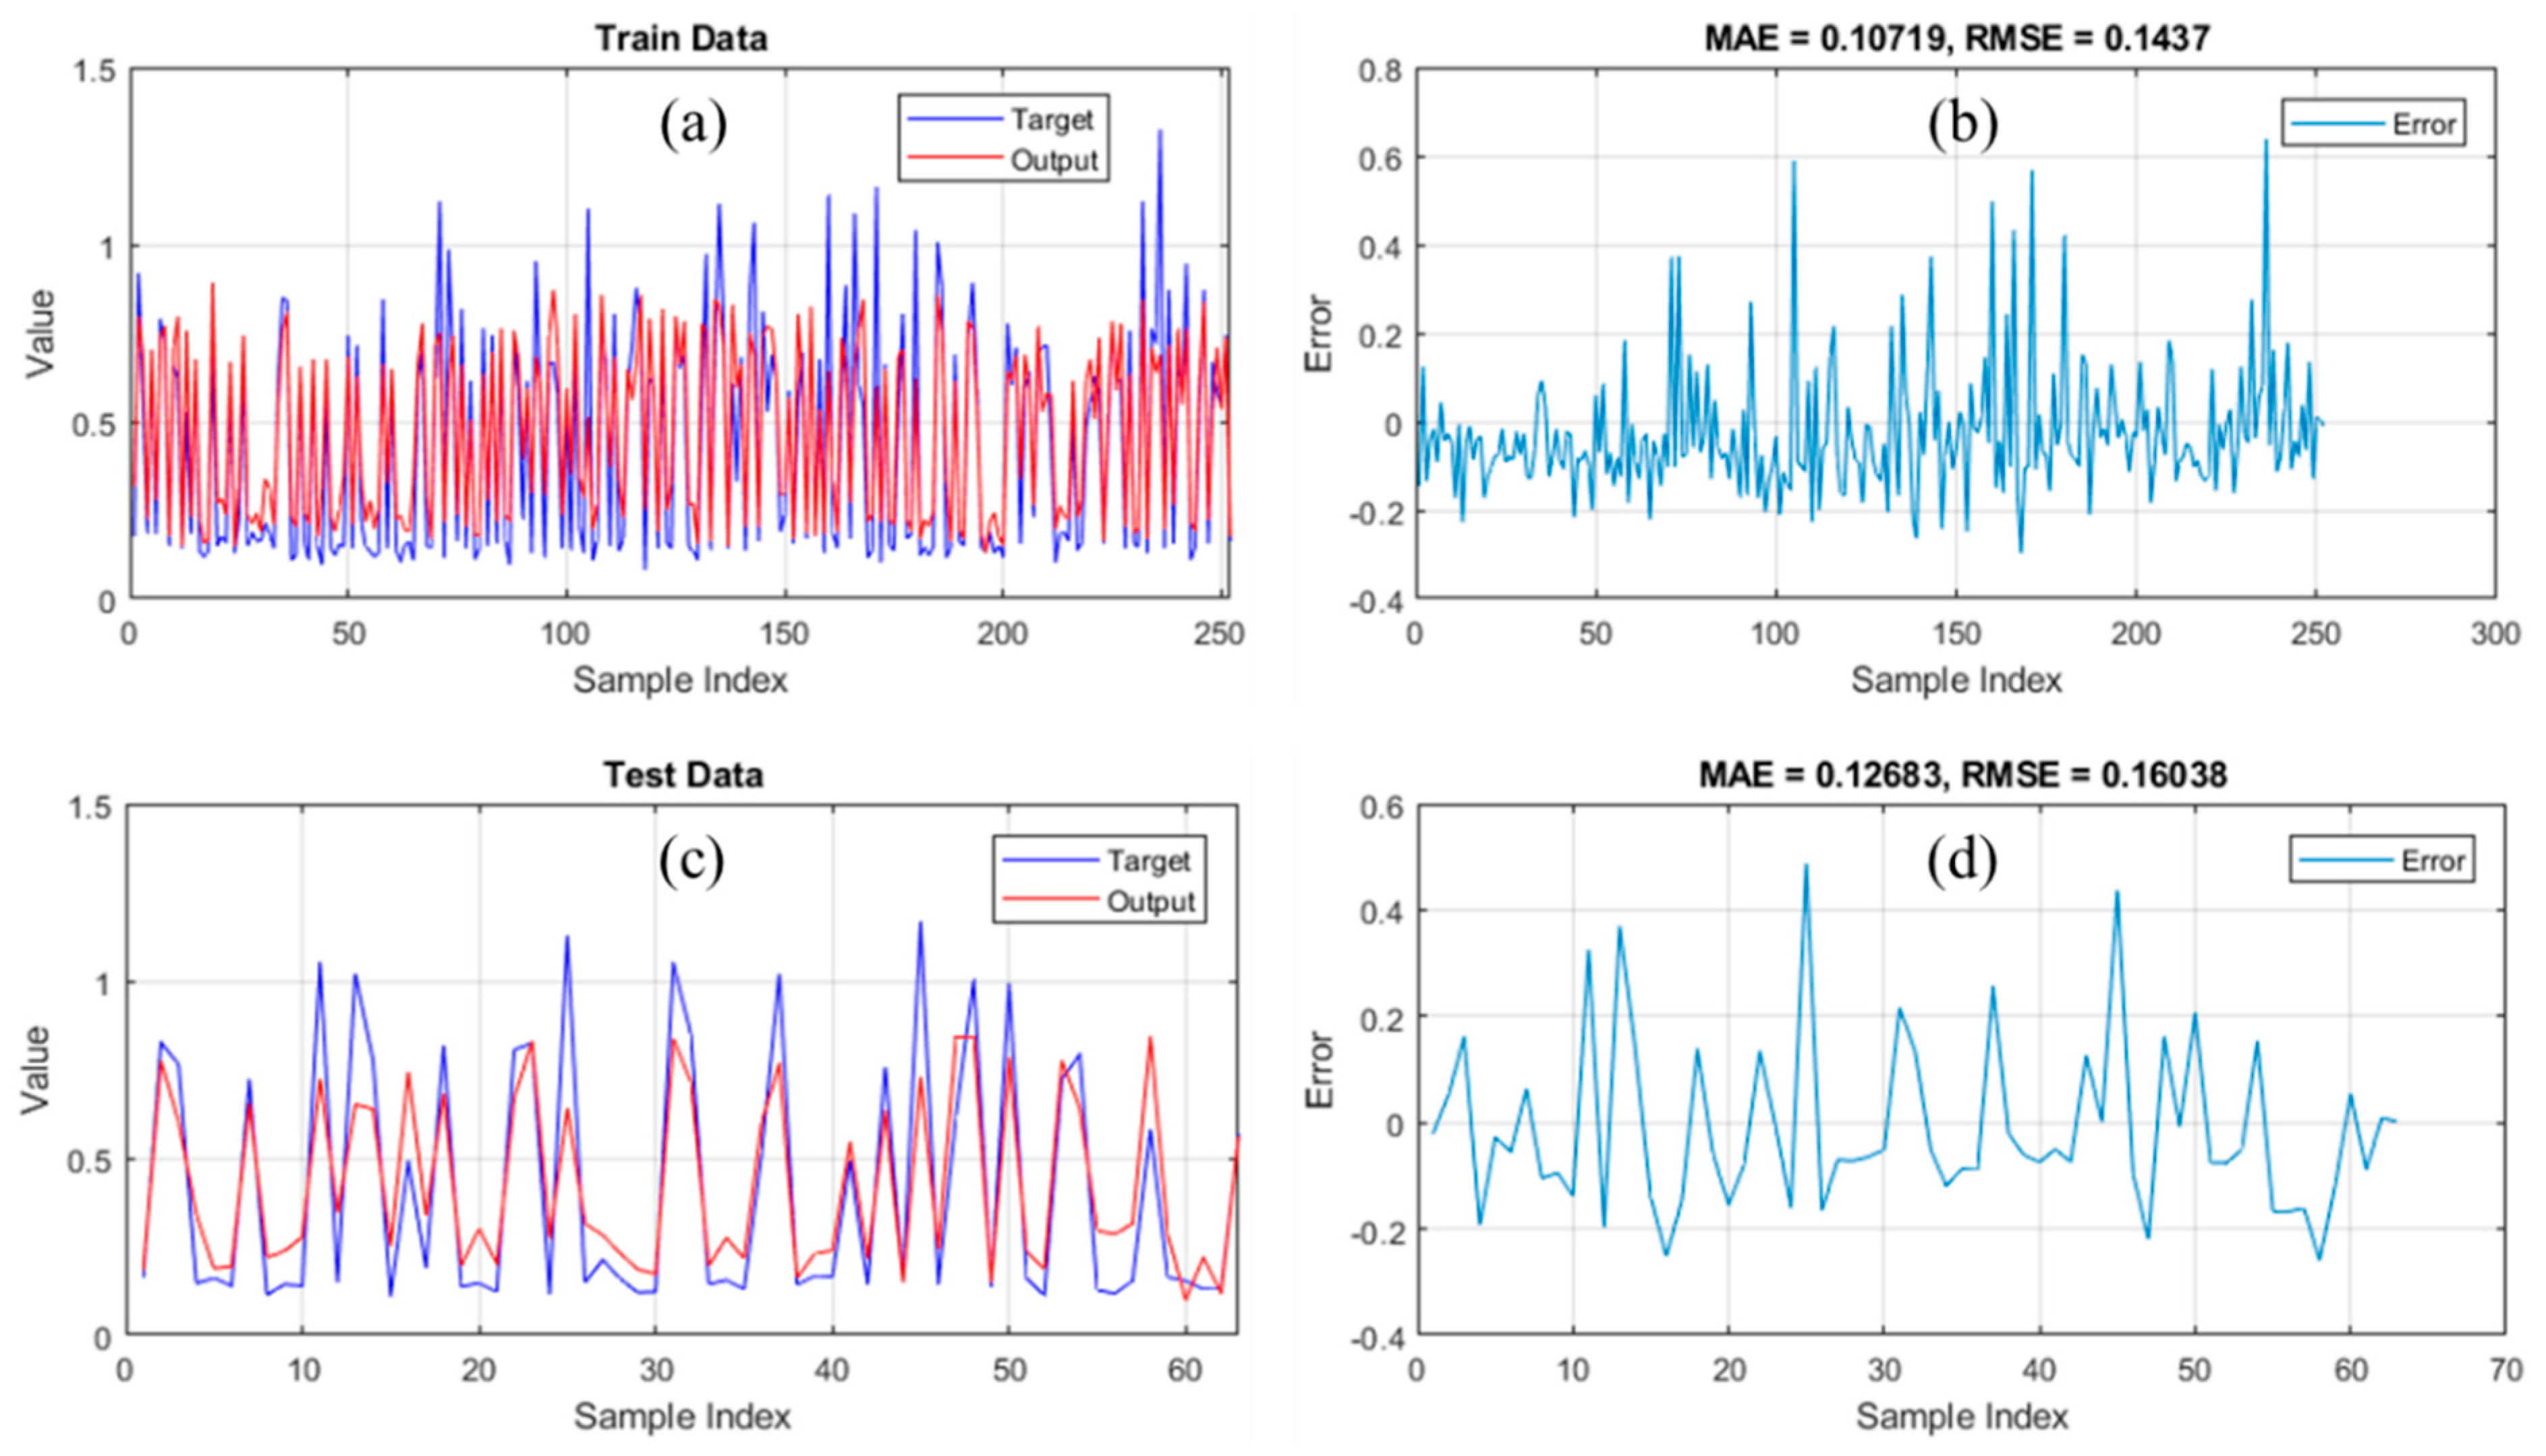
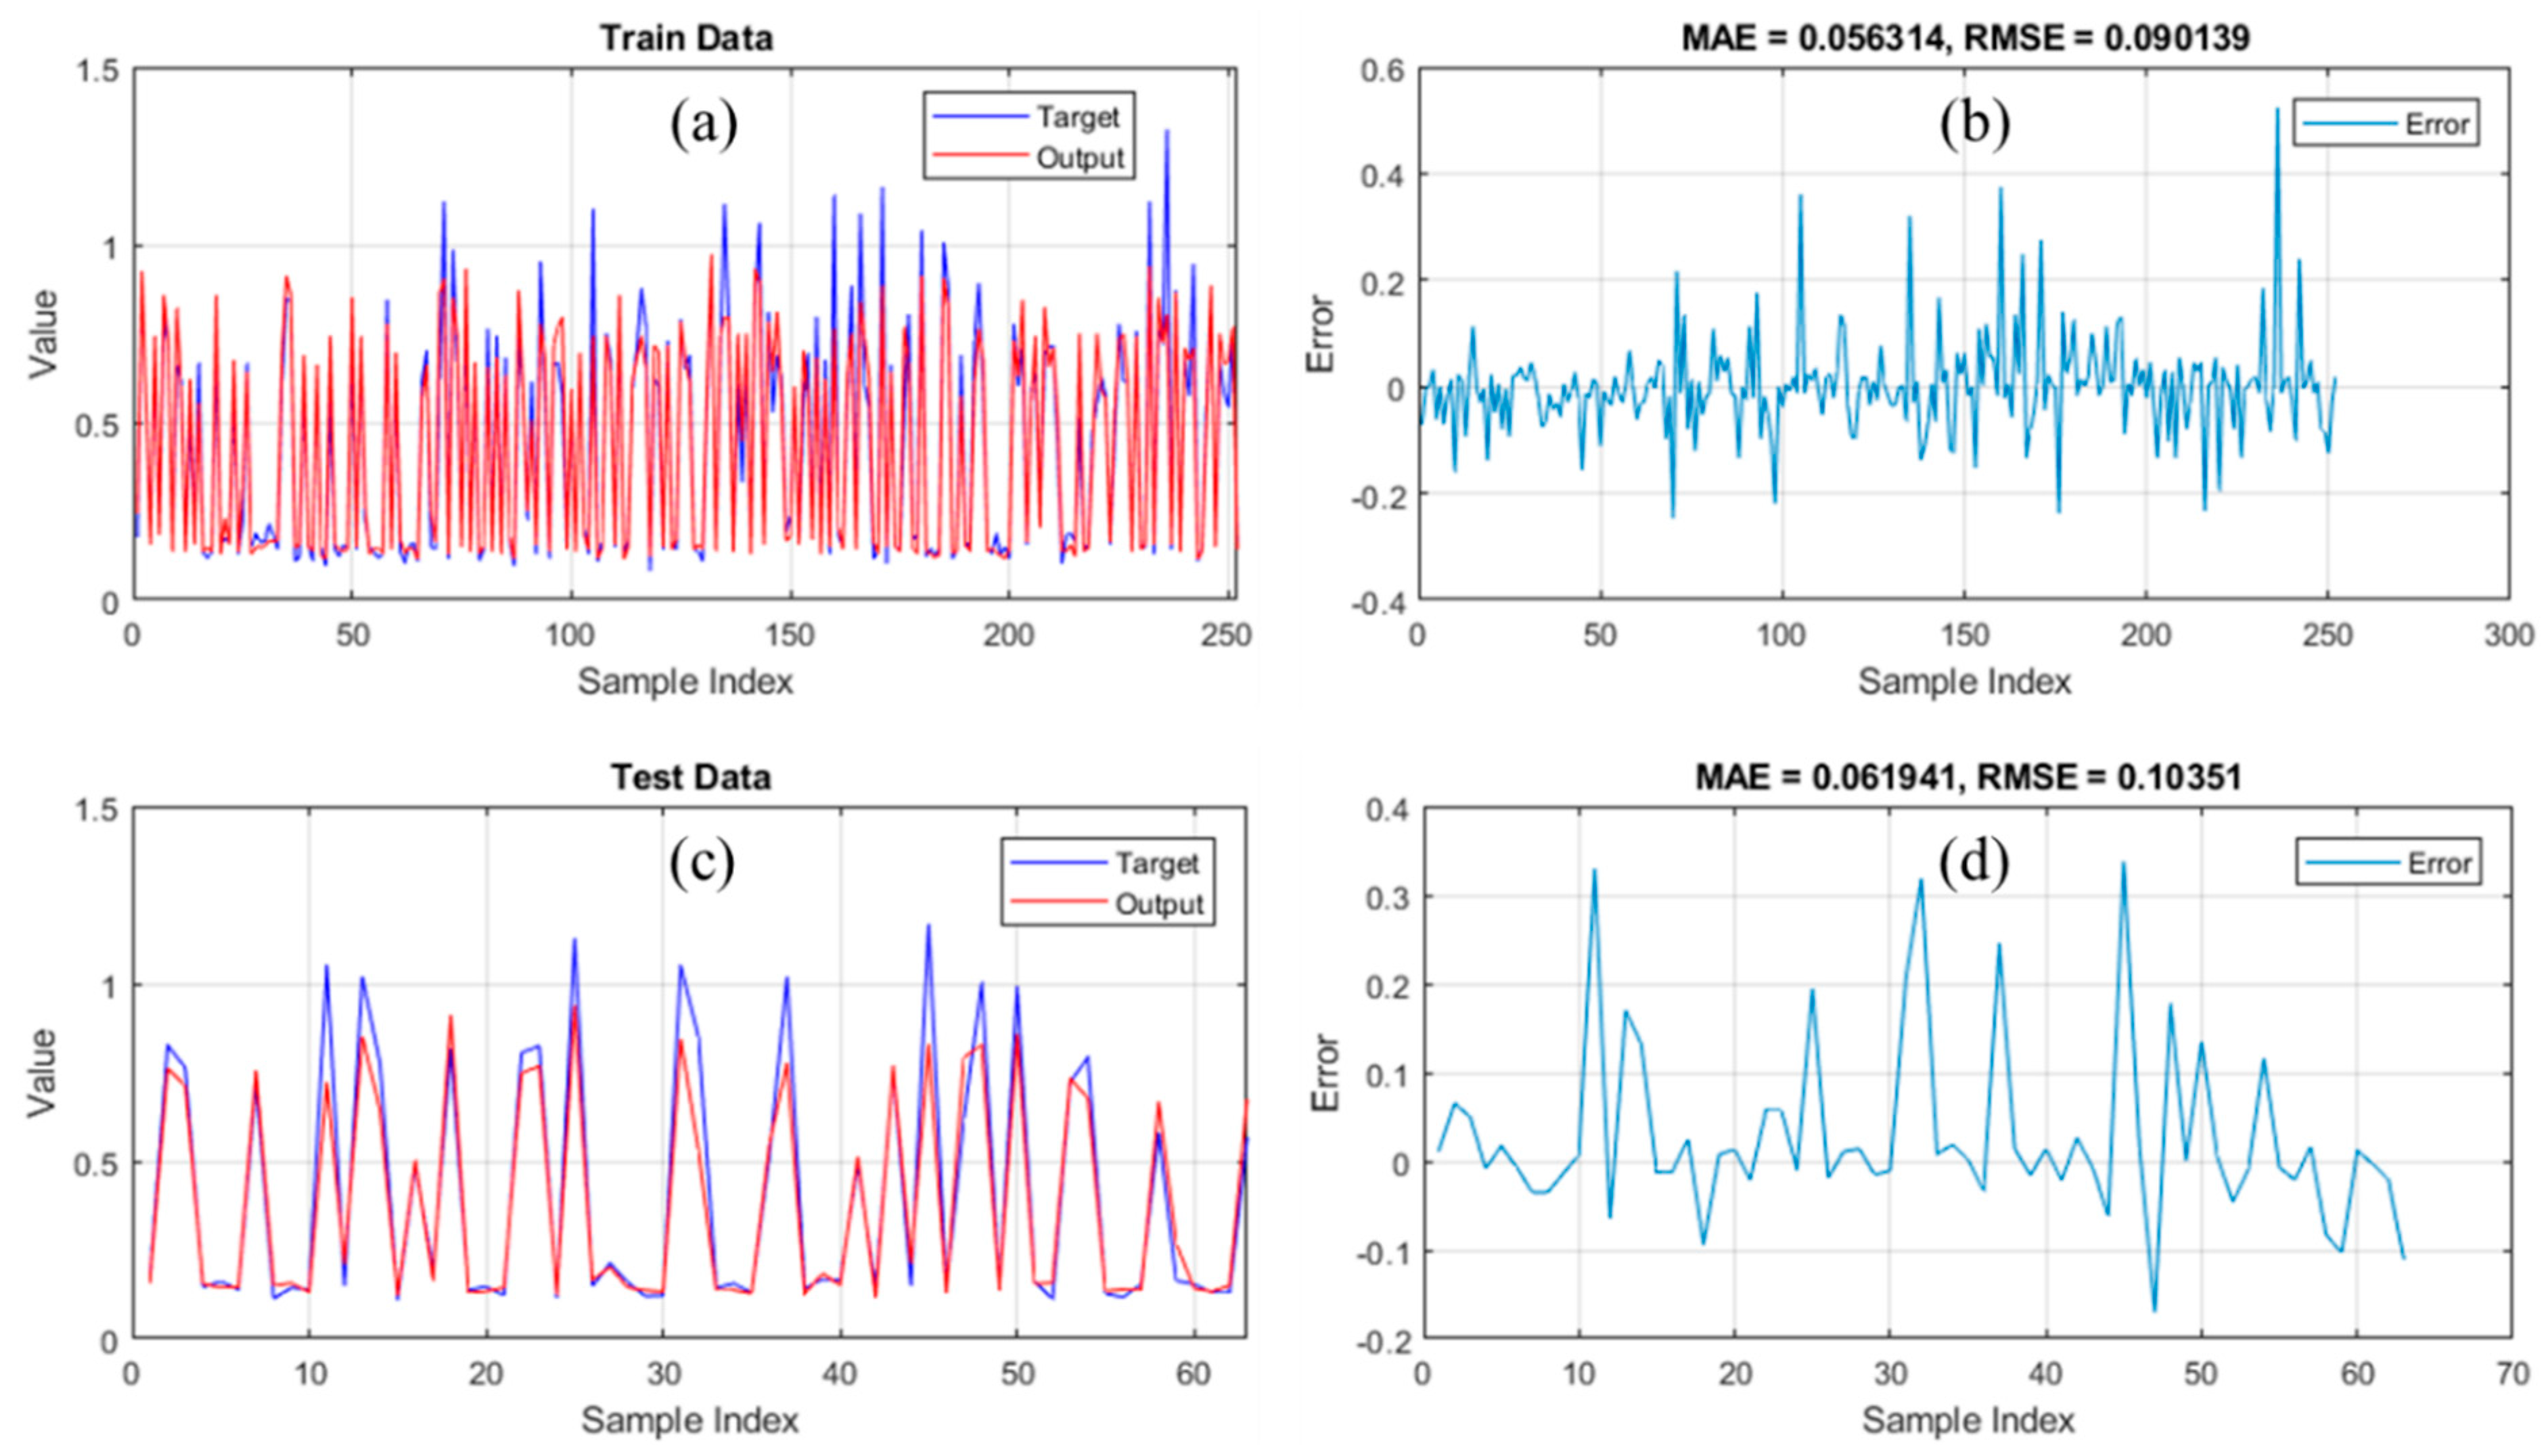
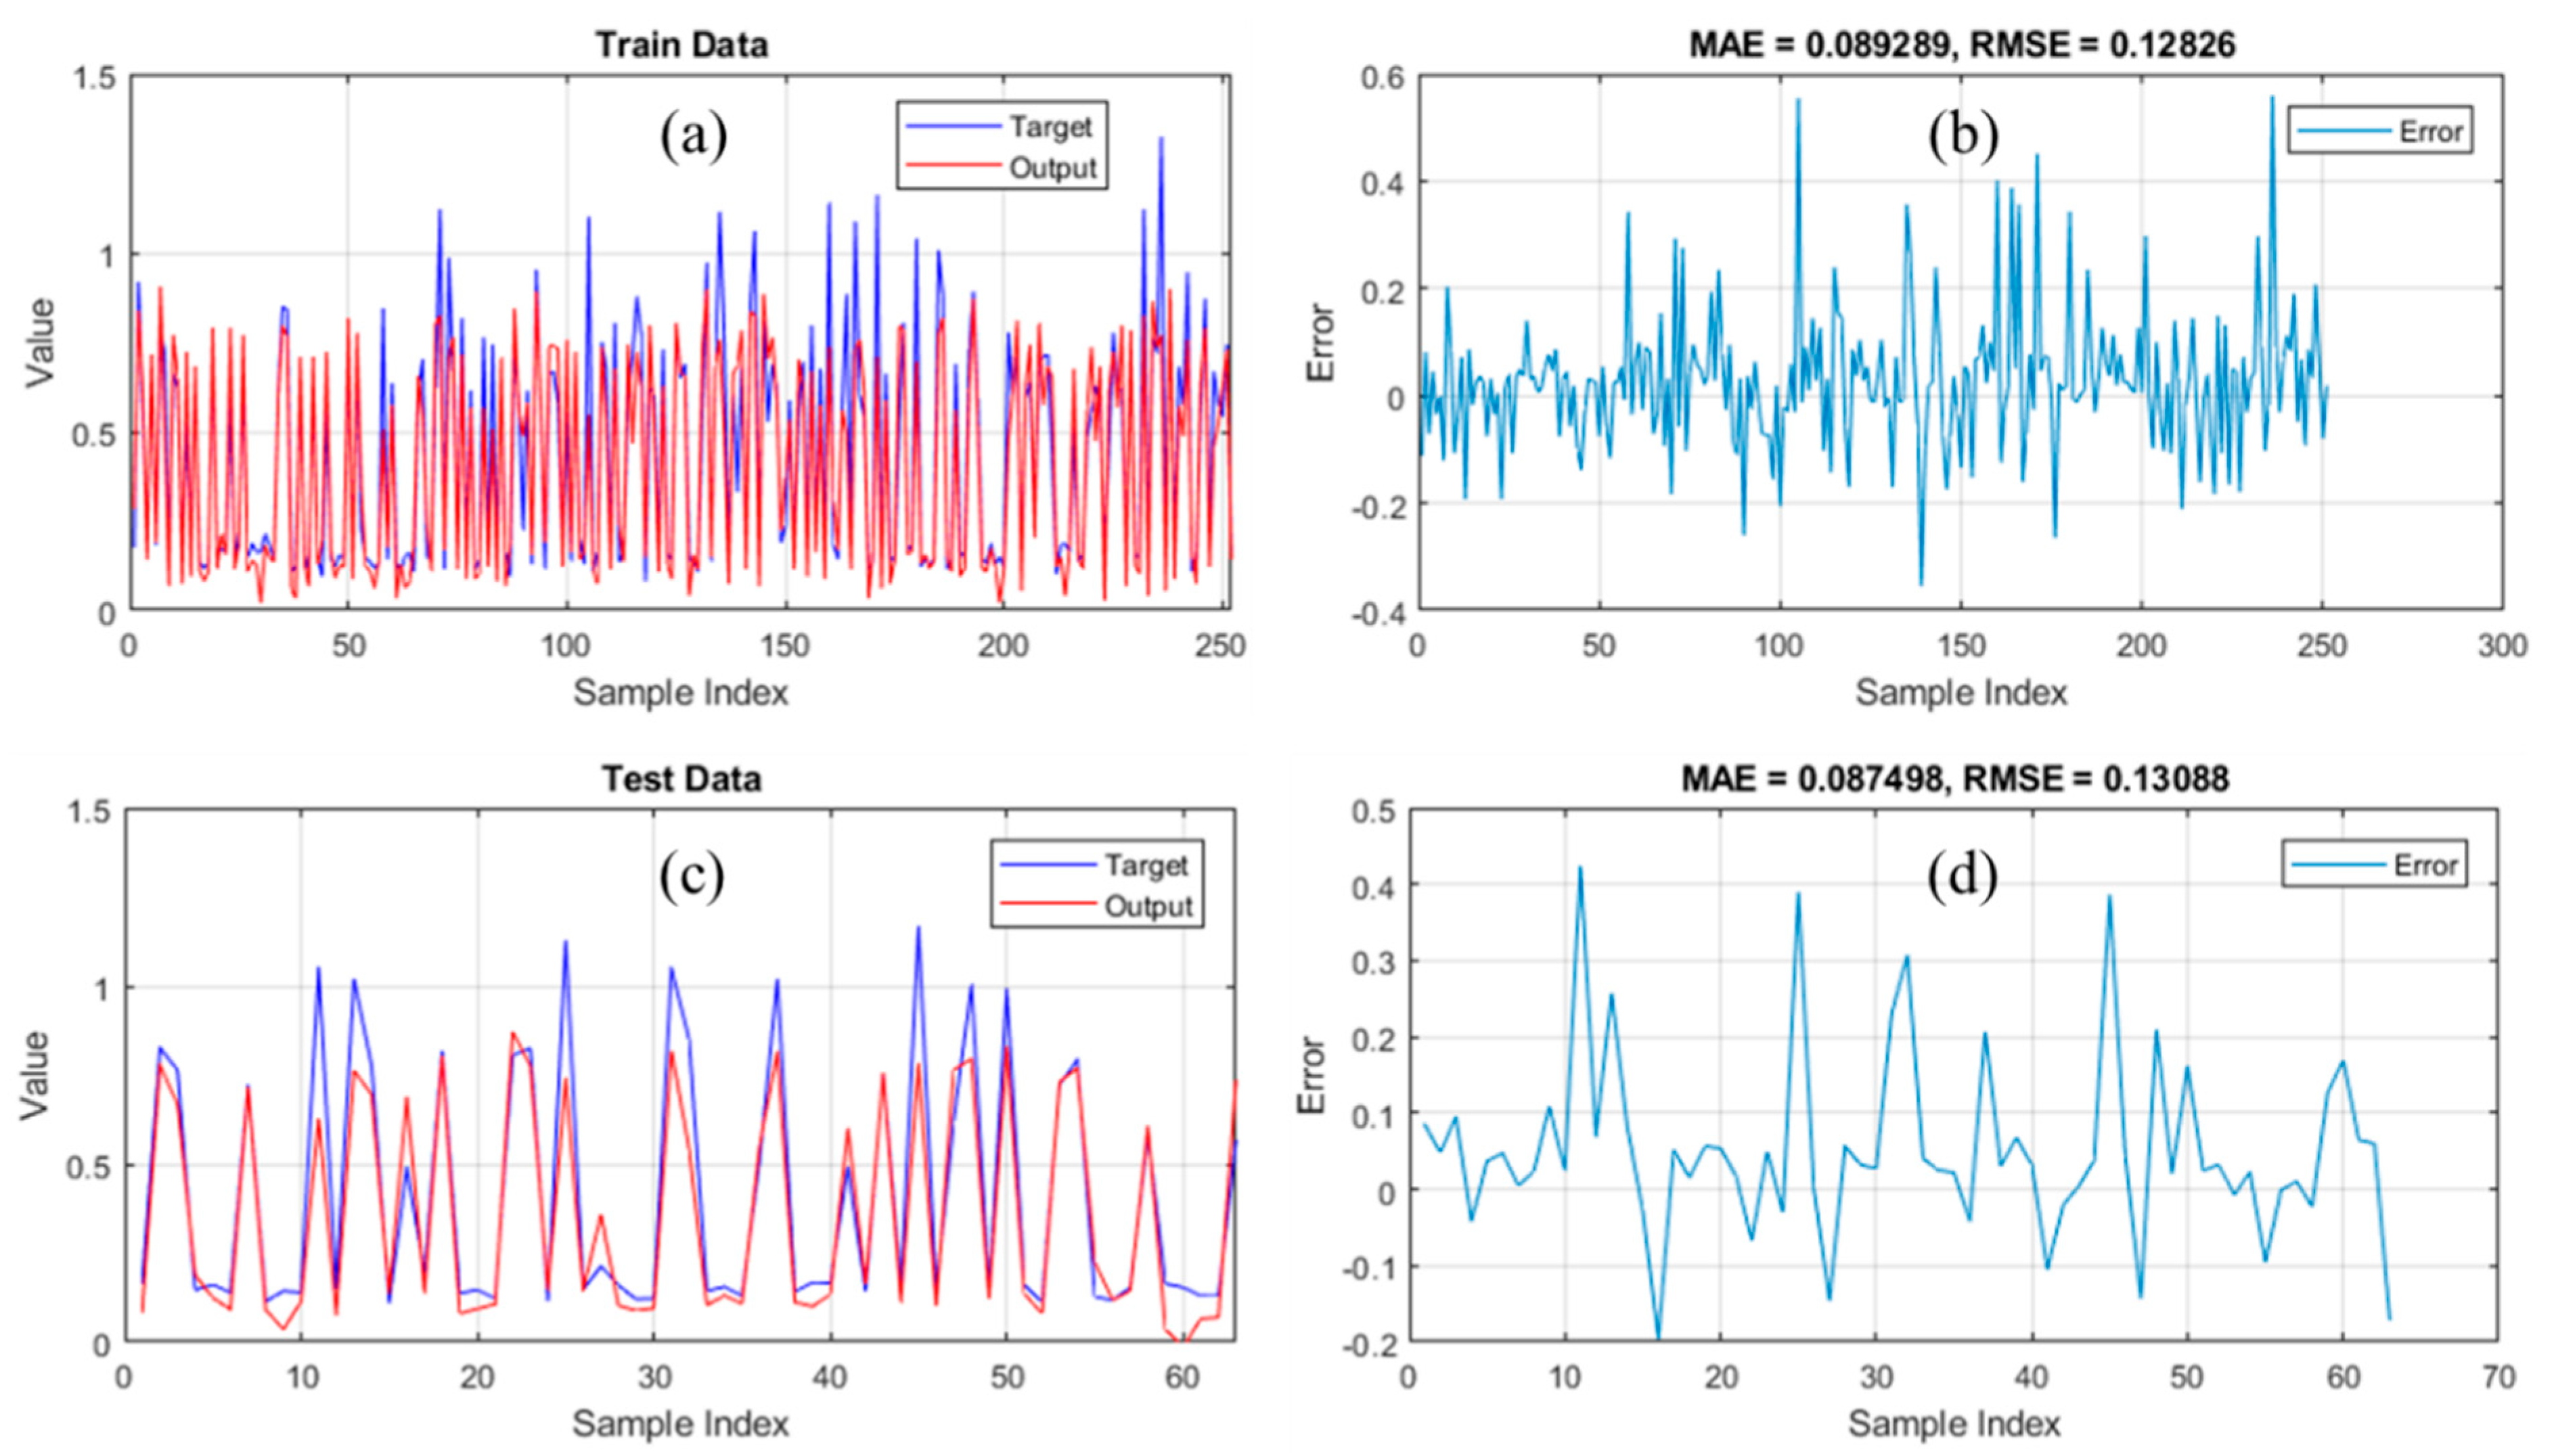
4.2. Quality Assessment of Predictive Models
5. Conclusions
Author Contributions
Funding
Acknowledgments
Conflicts of Interest
References
- Moavenian, M.; Nazem, M.; Carter, J.; Randolph, M. Numerical analysis of penetrometers free-falling into soil with shear strength increasing linearly with depth. Comput. Geotech. 2016, 72, 57–66. [Google Scholar] [CrossRef]
- Moayedi, H.; Hayati, S. Modelling and optimization of ultimate bearing capacity of strip footing near a slope by soft computing methods. Appl. Soft Comput. 2018, 66, 208–219. [Google Scholar] [CrossRef]
- Alnaqi, A.A.; Moayedi, H.; Shahsavar, A.; Nguyen, T.K. Prediction of energetic performance of a building integrated photovoltaic/thermal system thorough artificial neural network and hybrid particle swarm optimization models. Energy Convers. Manag. 2018, 183, 137–148. [Google Scholar] [CrossRef]
- Vanapalli, S.; Fredlund, D. Comparison of different procedures to predict unsaturated soil shear strength. In Advances in Unsaturated Geotechnics; ASCE: Reston, VA, USA, 2000; pp. 195–209. [Google Scholar]
- Aksoy, H.S.; Gor, M. High-speed railway embankments stabilization by using a plant based biopolymer. Fresenius Environ. Bull. 2017, 25, 7626–7633. [Google Scholar]
- Das, B.M.; Sobhan, K. Principles of Geotechnical Engineering; Cengage Learning: Boston, MA, USA, 2013. [Google Scholar]
- Nhu, V.-H.; Hoang, N.-D.; Duong, V.-B.; Vu, H.-D.; Bui, D.T. A hybrid computational intelligence approach for predicting soil shear strength for urban housing construction: A case study at Vinhomes Imperia project, Hai Phong city (Vietnam). Eng. Comput. 2019, 1–14. [Google Scholar] [CrossRef]
- Nam, S.; Gutierrez, M.; Diplas, P.; Petrie, J. Determination of the shear strength of unsaturated soils using the multistage direct shear test. Eng. Geol. 2011, 122, 272–280. [Google Scholar] [CrossRef]
- Rassam, D.W.; Williams, D.J. A relationship describing the shear strength of unsaturated soils. Can. Geotech. J. 1999, 36, 363–368. [Google Scholar] [CrossRef]
- Gan, J.; Fredlund, D.; Rahardjo, H. Determination of the shear strength parameters of an unsaturated soil using the direct shear test. Can. Geotech. J. 1988, 25, 500–510. [Google Scholar] [CrossRef]
- Bui, D.T.; Moayedi, H.; Gör, M.; Jaafari, A.; Foong, L.K. Predicting slope stability failure through machine learning paradigms. ISPRS Int. J. Geo-Inf. 2019, 8, 395. [Google Scholar] [CrossRef]
- Moayedi, H.; Bui, D.T.; Gör, M.; Pradhan, B.; Jaafari, A. The feasibility of three prediction techniques of the artificial neural network, adaptive neuro-fuzzy inference system, and hybrid particle swarm optimization for assessing the safety factor of cohesive slopes. ISPRS Int. J. Geo-Inf. 2019, 8, 391. [Google Scholar] [CrossRef]
- Müller, R.; Larsson, S.; Spross, J. Extended multivariate approach for uncertainty reduction in the assessment of undrained shear strength in clays. Can. Geotech. J. 2013, 51, 231–245. [Google Scholar] [CrossRef]
- Vanapalli, S.; Fredlund, D. Empirical procedures to predict the shear strength of unsaturated soils. In Proceedings of the Eleventh Asian Regional Conference on Soil Mechanics and Geotechnical Engineering, Seoul, Korea, 16–20 August 1999; pp. 93–96. [Google Scholar]
- Zhai, Q.; Rahardjo, H.; Satyanaga, A.; Dai, G. Estimation of unsaturated shear strength from soil–water characteristic curve. Acta Geotech. 2019, 1–14. [Google Scholar] [CrossRef]
- Al Aqtash, U.; Bandini, P. Prediction of unsaturated shear strength of an adobe soil from the soil–water characteristic curve. Constr. Build. Mater. 2015, 98, 892–899. [Google Scholar] [CrossRef]
- Garven, E.; Vanapalli, S. Evaluation of empirical procedures for predicting the shear strength of unsaturated soils. In Unsaturated Soils 2006; ASCE: Reston, VA, USA, 2006; pp. 2570–2592. [Google Scholar]
- Kiran, S.; Lal, B.; Tripathy, S. Shear strength prediction of soil based on probabilistic neural network. Indian J. Sci. Technol. 2016, 9. [Google Scholar] [CrossRef]
- Jokar, M.H.; Mirasi, S. Using adaptive neuro-fuzzy inference system for modeling unsaturated soils shear strength. Soft Comput. 2018, 22, 4493–4510. [Google Scholar] [CrossRef]
- Kanungo, D.; Sharma, S.; Pain, A. Artificial Neural Network (ANN) and Regression Tree (CART) applications for the indirect estimation of unsaturated soil shear strength parameters. Front. Earth Sci. 2014, 8, 439–456. [Google Scholar] [CrossRef]
- Besalatpour, A.; Hajabbasi, M.; Ayoubi, S.; Afyuni, M.; Jalalian, A.; Schulin, R. Soil shear strength prediction using intelligent systems: Artificial neural networks and an adaptive neuro-fuzzy inference system. Soil Sci. Plant Nutr. 2012, 58, 149–160. [Google Scholar] [CrossRef]
- Taherdangkoo, M.; Taherdangkoo, R. Modified BNMR algorithm applied to Loney’s solenoid benchmark problem. Int. J. Appl. Electromagn. Mech. 2014, 46, 683–692. [Google Scholar] [CrossRef]
- Qiu, P.; Hu, R.; Hu, L.; Liu, Q.; Xing, Y.; Yang, H.; Qi, J.; Ptak, T. A Numerical Study on Travel Time Based Hydraulic Tomography Using the SIRT Algorithm with Cimmino Iteration. Water 2019, 11, 909. [Google Scholar] [CrossRef]
- Moayedi, H.; Mehrabi, M.; Mosallanezhad, M.; Rashid, A.S.A.; Pradhan, B. Modification of landslide susceptibility mapping using optimized PSO-ANN technique. Eng. Comput. 2018, 35, 967–984. [Google Scholar] [CrossRef]
- Gao, W.; Dimitrov, D.; Abdo, H. Tight independent set neighborhood union condition for fractional critical deleted graphs and ID deleted graphs. Discret. Contin. Dyn. Syst. Ser. S 2018, 12, 711–721. [Google Scholar] [CrossRef]
- Nguyen, H.; Mehrabi, M.; Kalantar, B.; Moayedi, H.; Abdullahi, M.A.M. Potential of hybrid evolutionary approaches for assessment of geo-hazard landslide susceptibility mapping. Geomat. Nat. Hazards Risk 2019, 10, 1667–1693. [Google Scholar] [CrossRef]
- Gao, W.; Guirao, J.L.G.; Basavanagoud, B.; Wu, J. Partial multi-dividing ontology learning algorithm. Inf. Sci. 2018, 467, 35–58. [Google Scholar] [CrossRef]
- Moayedi, H.; Mehrabi, M.; Kalantar, B.; Abdullahi Mu’azu, M.A.; Rashid, A.S.; Foong, L.K.; Nguyen, H. Novel hybrids of adaptive neuro-fuzzy inference system (ANFIS) with several metaheuristic algorithms for spatial susceptibility assessment of seismic-induced landslide. Geomat. Nat. Hazards Risk 2019, 10, 1879–1911. [Google Scholar] [CrossRef]
- Tien Bui, D.; Khosravi, K.; Li, S.; Shahabi, H.; Panahi, M.; Singh, V.; Chapi, K.; Shirzadi, A.; Panahi, S.; Chen, W. New hybrids of anfis with several optimization algorithms for flood susceptibility modeling. Water 2018, 10, 1210. [Google Scholar] [CrossRef]
- Bui, D.T.; Hoang, N.-D.; Nhu, V.-H. A swarm intelligence-based machine learning approach for predicting soil shear strength for road construction: A case study at Trung Luong National Expressway Project (Vietnam). Eng. Comput. 2019, 35, 955–965. [Google Scholar]
- Pham, B.T.; Hoang, T.-A.; Nguyen, D.-M.; Bui, D.T. Prediction of shear strength of soft soil using machine learning methods. Catena 2018, 166, 181–191. [Google Scholar] [CrossRef]
- McCulloch, W.S.; Pitts, W. A logical calculus of the ideas immanent in nervous activity. Bull. Math. Biophys. 1943, 5, 115–133. [Google Scholar] [CrossRef]
- ASCE Task Committee. Artificial neural networks in hydrology. II: Hydrologic applications. J. Hydrol. Eng. 2000, 5, 124–137. [Google Scholar] [CrossRef]
- Moayedi, H.; Hayati, S. Applicability of a CPT-Based Neural Network Solution in Predicting Load-Settlement Responses of Bored Pile. Int. J. Geomech. 2018, 18, 06018009. [Google Scholar] [CrossRef]
- Seyedashraf, O.; Mehrabi, M.; Akhtari, A.A. Novel approach for dam break flow modeling using computational intelligence. J. Hydrol. 2018, 559, 1028–1038. [Google Scholar] [CrossRef]
- Gao, W.; Guirao, J.L.G.; Abdel-Aty, M.; Xi, W. An independent set degree condition for fractional critical deleted graphs. Discret. Contin. Dyn. Syst. Ser. S 2019, 12, 877–886. [Google Scholar] [CrossRef]
- Gao, W.; Wang, W.; Dimitrov, D.; Wang, Y. Nano properties analysis via fourth multiplicative ABC indicator calculating. Arab. J. Chem. 2018, 11, 793–801. [Google Scholar] [CrossRef]
- Gao, W.; Wu, H.; Siddiqui, M.K.; Baig, A.Q. Study of biological networks using graph theory. Saudi J. Biol. Sci. 2018, 25, 1212–1219. [Google Scholar] [CrossRef] [PubMed]
- Hecht-Nielsen, R. Theory of the backpropagation neural network. In Neural Networks for Perception; Elsevier: Washington, DC, USA, 1992; pp. 65–93. [Google Scholar]
- Moré, J.J. The Levenberg-Marquardt algorithm: Implementation and theory. In Numerical Analysis; Springer: Berlin/Heidelberg, Germany, 1978; pp. 105–116. [Google Scholar]
- Rizeei, H.M.; Pradhan, B.; Saharkhiz, M.A. An integrated fluvial and flash pluvial model using 2D high-resolution sub-grid and particle swarm optimization-based random forest approaches in GIS. Complex Intell. Syst. 2018, 5, 283–302. [Google Scholar] [CrossRef]
- Mojaddadi, H.; Pradhan, B.; Nampak, H.; Ahmad, N.; Ghazali, A.H.B. Ensemble machine-learning-based geospatial approach for flood risk assessment using multi-sensor remote-sensing data and GIS. Geomat. Nat. Hazards Risk 2017, 8, 1080–1102. [Google Scholar] [CrossRef]
- Dhiman, G.; Kumar, V. Multi-objective spotted hyena optimizer: A Multi-objective optimization algorithm for engineering problems. Knowl. Based Syst. 2018, 150, 175–197. [Google Scholar] [CrossRef]
- Luo, Q.; Li, J.; Zhou, Y. Spotted hyena optimizer with lateral inhibition for image matching. Multimed. Tools Appl. 2019, 78, 1–20. [Google Scholar] [CrossRef]
- Jia, H.; Li, J.; Song, W.; Peng, X.; Lang, C.; Li, Y. Spotted Hyena Optimization Algorithm with Simulated Annealing for Feature Selection. IEEE Access 2019, 71943–71962. [Google Scholar] [CrossRef]
- Kaur, A.; Kaur, S.; Dhiman, G. A quantum method for dynamic nonlinear programming technique using Schrödinger equation and Monte Carlo approach. Mod. Phys. Lett. B 2018, 32, 1850374. [Google Scholar] [CrossRef]
- Mirjalili, S. The ant lion optimizer. Adv. Eng. Softw. 2015, 83, 80–98. [Google Scholar] [CrossRef]
- Špoljarić, T.; Pavić, I. Performance analysis of an ant lion optimizer in tuning generators’ excitation controls in multi machine power system. In Proceedings of the 2018 41st International Convention on Information and Communication Technology, Electronics and Microelectronics (MIPRO), Opatija, Croatia, 21–25 May 2018; pp. 1040–1045. [Google Scholar]
- Kose, U. An ant-lion optimizer-trained artificial neural network system for chaotic electroencephalogram (EEG) prediction. Appl. Sci. 2018, 8, 1613. [Google Scholar] [CrossRef]
- Mirjalili, S.; Jangir, P.; Saremi, S. Multi-objective ant lion optimizer: A multi-objective optimization algorithm for solving engineering problems. Appl. Intell. 2017, 46, 79–95. [Google Scholar] [CrossRef]
- ASTM. Standard Test Method for Laboratory Miniature Vane Shear Test for Saturated Fine-Grained Clayey Soil; ASTM: West Conshohocken, PA, USA, 2005. [Google Scholar]
- Schmertmann, J.H. Guidelines for Cone Penetration Test: Performance and Design; Federal Highway Administration: Washington, DC, USA, 1978.
- Clayton, C.R. The Standard Penetration Test (SPT): Methods and Use; Construction Industry Research and Information Association (CIRIA): London, UK, 1995. [Google Scholar]
- Mirjalili, S. Dragonfly algorithm: A new meta-heuristic optimization technique for solving single-objective, discrete, and multi-objective problems. Neural Comput. Appl. 2016, 27, 1053–1073. [Google Scholar] [CrossRef]
- Heidari, A.A.; Mirjalili, S.; Faris, H.; Aljarah, I.; Mafarja, M.; Chen, H. Harris hawks optimization: Algorithm and applications. Future Gener. Comput. Syst. 2019, 97, 849–872. [Google Scholar] [CrossRef]
- Karaboga, D. An Idea Based on Honey Bee Swarm for Numerical Optimization; Technical report-tr06; Computer Engineering Faculty, Erciyes University: Kayseri, Turkey, 2005. [Google Scholar]
- Atashpaz-Gargari, E.; Lucas, C. Imperialist competitive algorithm: An algorithm for optimization inspired by imperialistic competition. In Proceedings of the 2007 IEEE Congress on Evolutionary Computation, Singapore, 25–28 September 2007; pp. 4661–4667. [Google Scholar]
- Wang, G.-G.; Deb, S.; Coelho, L.D.S. Elephant herding optimization. In Proceedings of the 2015 3rd International Symposium on Computational and Business Intelligence (ISCBI), Bali, Indonesia, 7–9 December 2015; pp. 1–5. [Google Scholar]
- Eberhart, R.; Kennedy, J. Particle swarm optimization. In Proceedings of the IEEE International Conference on Neural Networks, Perth, Western Australia, 27 November–1 December 1995; pp. 1942–1948. [Google Scholar]
- Francis, R.; Meganathan, D. An improved ANFIS with aid of ALO technique for THD minimization of multilevel inverters. J. CircuitsSyst. Comput. 2018, 27, 1850193. [Google Scholar] [CrossRef]
- Li, J.; Luo, Q.; Liao, L.; Zhou, Y. Using Spotted Hyena Optimizer for Training Feedforward Neural Networks. In International Conference on Intelligent Computing; Springer: Wuhan, China, 2018; pp. 828–833. [Google Scholar]


| Features | Descriptive Index | |||||||
|---|---|---|---|---|---|---|---|---|
| Mean | Standard Error | Median | Standard Deviation | Sample Variance | Skewness | Minimum | Maximum | |
| Depth of sample (m) | 16.21 | 0.71 | 13.00 | 12.57 | 157.94 | 1.02 | 1.00 | 52.00 |
| Sand (%) | 8.40 | 0.73 | 2.40 | 13.04 | 169.92 | 1.85 | 0.00 | 57.30 |
| Loam (%) | 54.01 | 0.70 | 56.10 | 12.46 | 155.30 | −0.30 | 20.00 | 83.70 |
| Clay (%) | 37.28 | 0.66 | 37.60 | 11.68 | 136.35 | 0.01 | 10.40 | 63.90 |
| Moisture content (%) | 48.47 | 1.35 | 49.90 | 23.90 | 571.41 | 0.12 | 17.10 | 90.30 |
| Wet density (g/cm3) | 1.77 | 0.01 | 1.69 | 0.21 | 0.05 | 0.09 | 1.47 | 2.15 |
| Liquid limit (%) | 54.47 | 0.84 | 54.90 | 14.89 | 221.65 | −0.23 | 21.40 | 79.90 |
| Plastic limit (%) | 24.72 | 0.30 | 24.40 | 5.39 | 29.05 | 0.02 | 12.90 | 35.90 |
| Plastic Index (%) | 29.75 | 0.56 | 30.40 | 10.00 | 99.92 | −0.27 | 6.60 | 49.70 |
| Liquidity index | 0.70 | 0.03 | 0.79 | 0.46 | 0.22 | 0.04 | 0.01 | 1.73 |
| Shear strength (kg/cm2) | 0.43 | 0.02 | 0.21 | 0.32 | 0.10 | 0.55 | 0.08 | 1.33 |
© 2019 by the authors. Licensee MDPI, Basel, Switzerland. This article is an open access article distributed under the terms and conditions of the Creative Commons Attribution (CC BY) license (http://creativecommons.org/licenses/by/4.0/).
Share and Cite
Moayedi, H.; Tien Bui, D.; Anastasios, D.; Kalantar, B. Spotted Hyena Optimizer and Ant Lion Optimization in Predicting the Shear Strength of Soil. Appl. Sci. 2019, 9, 4738. https://doi.org/10.3390/app9224738
Moayedi H, Tien Bui D, Anastasios D, Kalantar B. Spotted Hyena Optimizer and Ant Lion Optimization in Predicting the Shear Strength of Soil. Applied Sciences. 2019; 9(22):4738. https://doi.org/10.3390/app9224738
Chicago/Turabian StyleMoayedi, Hossein, Dieu Tien Bui, Dounis Anastasios, and Bahareh Kalantar. 2019. "Spotted Hyena Optimizer and Ant Lion Optimization in Predicting the Shear Strength of Soil" Applied Sciences 9, no. 22: 4738. https://doi.org/10.3390/app9224738
APA StyleMoayedi, H., Tien Bui, D., Anastasios, D., & Kalantar, B. (2019). Spotted Hyena Optimizer and Ant Lion Optimization in Predicting the Shear Strength of Soil. Applied Sciences, 9(22), 4738. https://doi.org/10.3390/app9224738