Article

Effect of Initial Granular Structure on the Evolution of Contact Force Chains

1
Department of Infrastructure Safety Research, Korea Institute of Civil Engineering and Building Technology, Goyang 10223, Korea
2
Department of Civil Engineering, Kyung Hee University, Yongin 17104, Korea
*
Author to whom correspondence should be addressed.
Appl. Sci. 2019, 9(22), 4735; https://doi.org/10.3390/app9224735
Submission received: 7 October 2019 / Revised: 26 October 2019 / Accepted: 28 October 2019 / Published: 6 November 2019
(This article belongs to the Section Civil Engineering)

Abstract

:
The effect of initial granular structural conditions on load transmission patterns was experimentally investigated. Two types of granular structures were prepared by laminating cylindrical model particles of different diameters, to which photoelastic sheets were attached. Two-dimensional, reflective photoelasticity tests were performed under two granular conditions: (1) a uniform structure without initial defects and (2) with initial local imperfections at the bottom of the granular assembly. Two granular assemblies were tested for uniaxial compressive loading and shallow foundation loading conditions. For macroscopic analyses of the load–displacement relationship, the photoelastic response of individual particles was measured to microscopically observe the distribution of the main contact force chains within each granular assembly. Furthermore, the effect of initial local defects on the bearing capacity of granular assemblies was examined by confirming particle movement and the expansion of initial local defects in the granular assembly via particle image velocimetry (PIV). As a result, a completely different form of internal contact force chain was developed from the beginning of loading to the final failure stage, depending upon whether or not initial local instability existed in the granular assembly. In particular, a significant effect on the bearing capacity was found under shallow foundation loading conditions.

1. Introduction

When assessing the bearing capacity of geotechnical foundations, traditional approaches are based on the limit-state equilibrium. This view first assumes a fully plastic state, and then roughly assumes a plastic failure surface. The stress equilibrium is subsequently found on the failure surface and the ultimate strength in a given situation is obtained. Lastly, the pre-failure state is evaluated by considering the factor of safety. However, a controversial question has arisen: does the bearing capacity of soils composed of granular assemblies coincide with the traditional view? Various studies have reported that the bearing capacity behavior of such granular assemblies differs from the traditional view [1,2,3,4,5,6].
Since the introduction of granular physics in the 1990s, which can accommodate the distribution of contact forces for a large number of particles that occur inside a granular assembly, studies have been conducted on contact force networks. Through recent studies on the processes underlying changes in the distribution of contact forces inside granular assemblies, it has been found that chain structures or networks have specific orientations with respect to the external load within the granular assembly. In particular, the contact force is distributed in the direction of the major principal stress [7,8,9,10]. It has also been reported that local buckling in granular assemblies ultimately contributes to the formation of macroscopic shear bands [11,12,13,14,15,16,17]. Furthermore, many studies on the effects of contact force chain factors (e.g., the interparticle friction coefficient, loading regime, packing density, contact model, boundary condition, grain shape, etc.) have been conducted [18,19,20].
Although various studies on the behavior of granular materials at the microscale have been conducted, most have been based on discrete element method (DEM) simulations; to date, experimental studies and quantitative evaluations of the effect of the initial structure of granular assemblies on the supportive structure and force chain formation remain insufficient. When the same load is applied, the behavior of a granular assembly, including the arrangement of discrete elements and the inherent structural instability, can be completely different from the behavior of a granular assembly with regular structures, which do not include initial structural instabilities.
In this study, when a granular assembly stacked with model particles was subjected to uniaxial compression loading or shallow foundation loading, the effect of the initial granular structure on the macroscopic load transmission was studied using a photoelastic model. Two initial granular structures were reproduced by laminating model particles that were made by attaching thin photoelastic sheets to cylindrical model particles. Two-dimensional (2-D) reflective photoelasticity tests were performed under a granular condition with a uniform structure and without initial defects, as well as under a condition with initial local imperfections in the lower part of the granular assembly. Digital photographic images were taken continuously during the experiment. The obtained images were analyzed using the red, green, and blue (RGB) photoelasticity image analysis protocol developed by Park and Jung [21], and the particle forces transmitted through the main contact force chain were analyzed quantitatively. While the load–displacement relationship was analyzed macroscopically, the force distribution inside the granular assembly was observed microscopically. Additionally, a particle image velocimetry (PIV) technique was employed to confirm the movement of particles and the expansion of the initial local defects in the granular assembly.

2. Materials and Methods

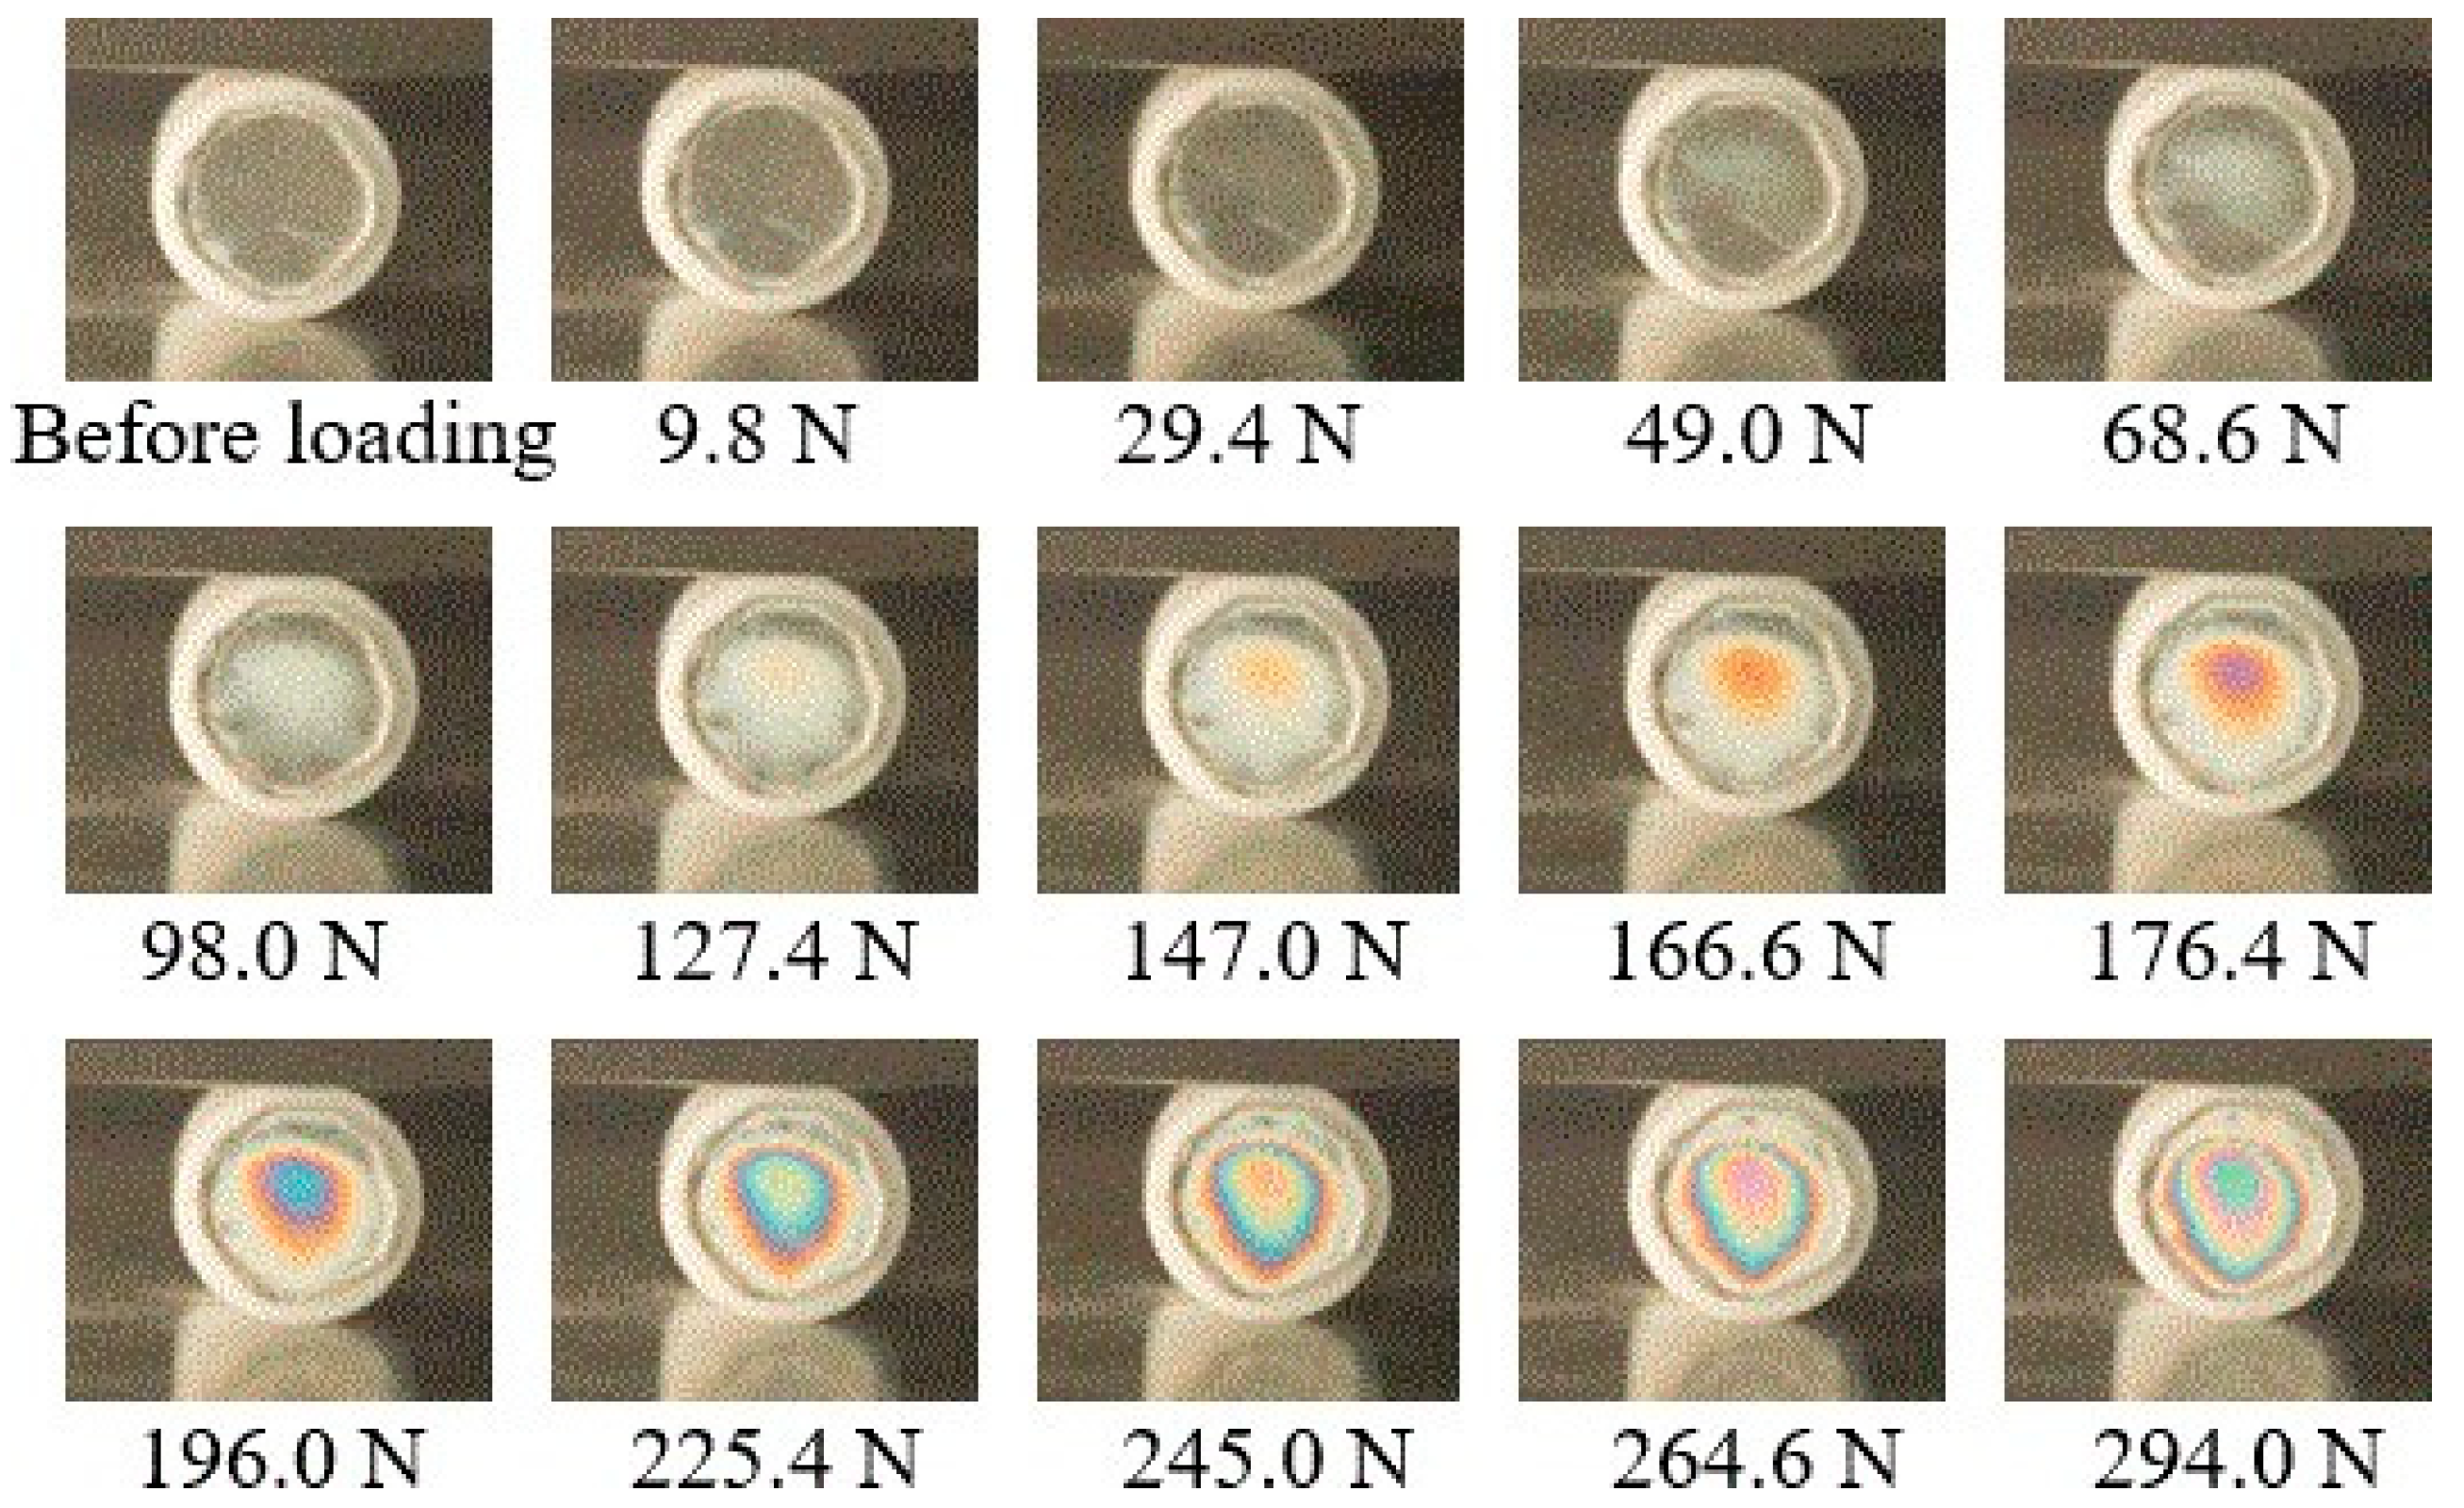
2.1. Digital Photoelasticity

In order to microscopically study the dynamics of granular assemblies, discrete element simulations, X-ray and CT-based methods, experimental observations of displacement fields using model particles, and photoelastic-based contact force chain confirmation methods can be employed. Among these, the photoelastic technique is an experimental method based on photo-physical properties that exhibit fringe patterns when polarized light passes through a photoelastic material subjected to an external force. This method has attracted much attention in the field of granular physics because it can intuitively visualize stress and strain distributions.
In the past, quasi-assemblies were evaluated qualitatively because it was nearly impossible to evaluate the stress of a granular assemblies composed of thousands of particles using traditional photoelastic theory [22,23,24,25]. More recently, a method for evaluating the stress of such assemblies has been proposed, thereby enabling quantitative analysis [26,27]. Monochromatic light sources have been popularly used in previous experimental studies [26,27,28], whereas nowadays, using digital images with true color has become prevalent thanks to significant progress in computer vision technology. To use the full-color digital images for the photoelastic analysis of the model soil particles, a new technique using the white light source that is cheaper than the monochromatic light source is indispensable. RGB photoelasticity was firstly introduced by Ajovalasit and Petrucci [29], which allows the determination of the photoelastic responses, usually using a single acquisition of the isochromatic fringes in white light by a color camera [30,31,32]. Park and Jung [21] also proposed a method of RGB photoelastic analysis to quantitatively evaluate the scalar components of the force of reflective photoelastic particles under white light. This method is especially suitable when the fringe order cannot be confirmed or when the contact points are unclear, and allows for the quantitative evaluation of the main force transmission structure to be performed easily and quickly.

2.2. Photoelastic Model Particles and Test Program

2.2.1. Photoelastic Model Particles

The granular assembly used in this experiment was composed of cylindrical model particles. As shown in Figure 1, particles with a diameter of 20 mm and height of 15 mm were made using polycarbonate (PC), and particles with a diameter of 10 mm and height of 15 mm were made using polytetrafluoroethylene (PTFE). Photoelastic sheets (0.5 mm- and 1 mm-thick; PS-1D and PS-1C, Vishay Intertechnology, Inc., Malvern, PA, USA) were cut manually into circles with diameters of 18 mm and 8 mm, respectively, and attached to PC and PTFE model particles using Loctite® 401 flex gel (Henkel AG & Company, KGaA, Düsseldorf, Germany). The elastic modulus (E) and Poisson’s ratio (v) of the photoelastic sheets were 2.5 GPa and 0.38, respectively, and the E and v of the PC and PTFE were 13.5 GPa and 2.25 GPa, and 0.35 and 0.42, respectively. Unfortunately, no photoelastic response was observed for the 20-mm diameter shape throughout the experiment. This may be because enough force to observe the photoelastic response was not transmitted to the bottom layer, which consisted of particles with 20-mm diameters, or perhaps the wrong photoelastic sheet was selected. In this study, only the structural effects of the particles with 20-mm diameters on the particles with 10-mm diameters in the upper part of the laminates could be found. Therefore, this study was limited by the fact that the force applied to the particles with 20-mm diameters (PC particles) could not be analyzed quantitatively. In order to confirm the suitability of the manufactured model particles, the color patterns of the photoelastic sheets were observed by repeatedly loading and unloading the PTFE model particles, to which photoelastic sheets are attached, up to 294 N. Since the color patterns showed consistency at the same loading level during the loading and unloading process, it was determined that the model particles were suitable for repeated use and for maintaining elasticity within the applied load level.
In this study, the scalar component of force was measured using Park and Jung’s [21] quantitative method, which is suitable for a reflective, photoelastic granular assembly. Instead of the conventional method, wherein the fringe order is calculated at the point of contact, using this approach, the force from the color intensity in the center of a particle is analyzed (Figure 2). Considering that the force distribution and color intensity within the forced-particle were not homogeneous, the coefficient between the applied force and the corresponding color change was determined by correlating the average contact forces transmitted through a particle with the descriptive statistics, i.e., means and standard deviations, of the RGB color intensity in the center of the particle. The raw image was digitally transformed into separate greyscale images of the red, green, and blue colors. Once a square central region of interest (ROI) inside the particle was digitally selected, the RGB color intensities of pixels belonging to the ROI were extracted. The means and standard deviations of each RGB color intensities were plotted against the applied particle force. According to Park and Jung [21], each RGB color intensity showed three-segmented linear relationships with the particle force, and the best linear regression results were obtained using the red color. The best empirical correlation of the force with a single particle for each RGB color intensity may then be applied to calculate the forces of the individual particles in the overall assembly. Finally, the spatial distribution of the contact force chain can be quantitatively evaluated for the entire granular assembly. A detailed explanation of this methodology is provided by Park and Jung [21].

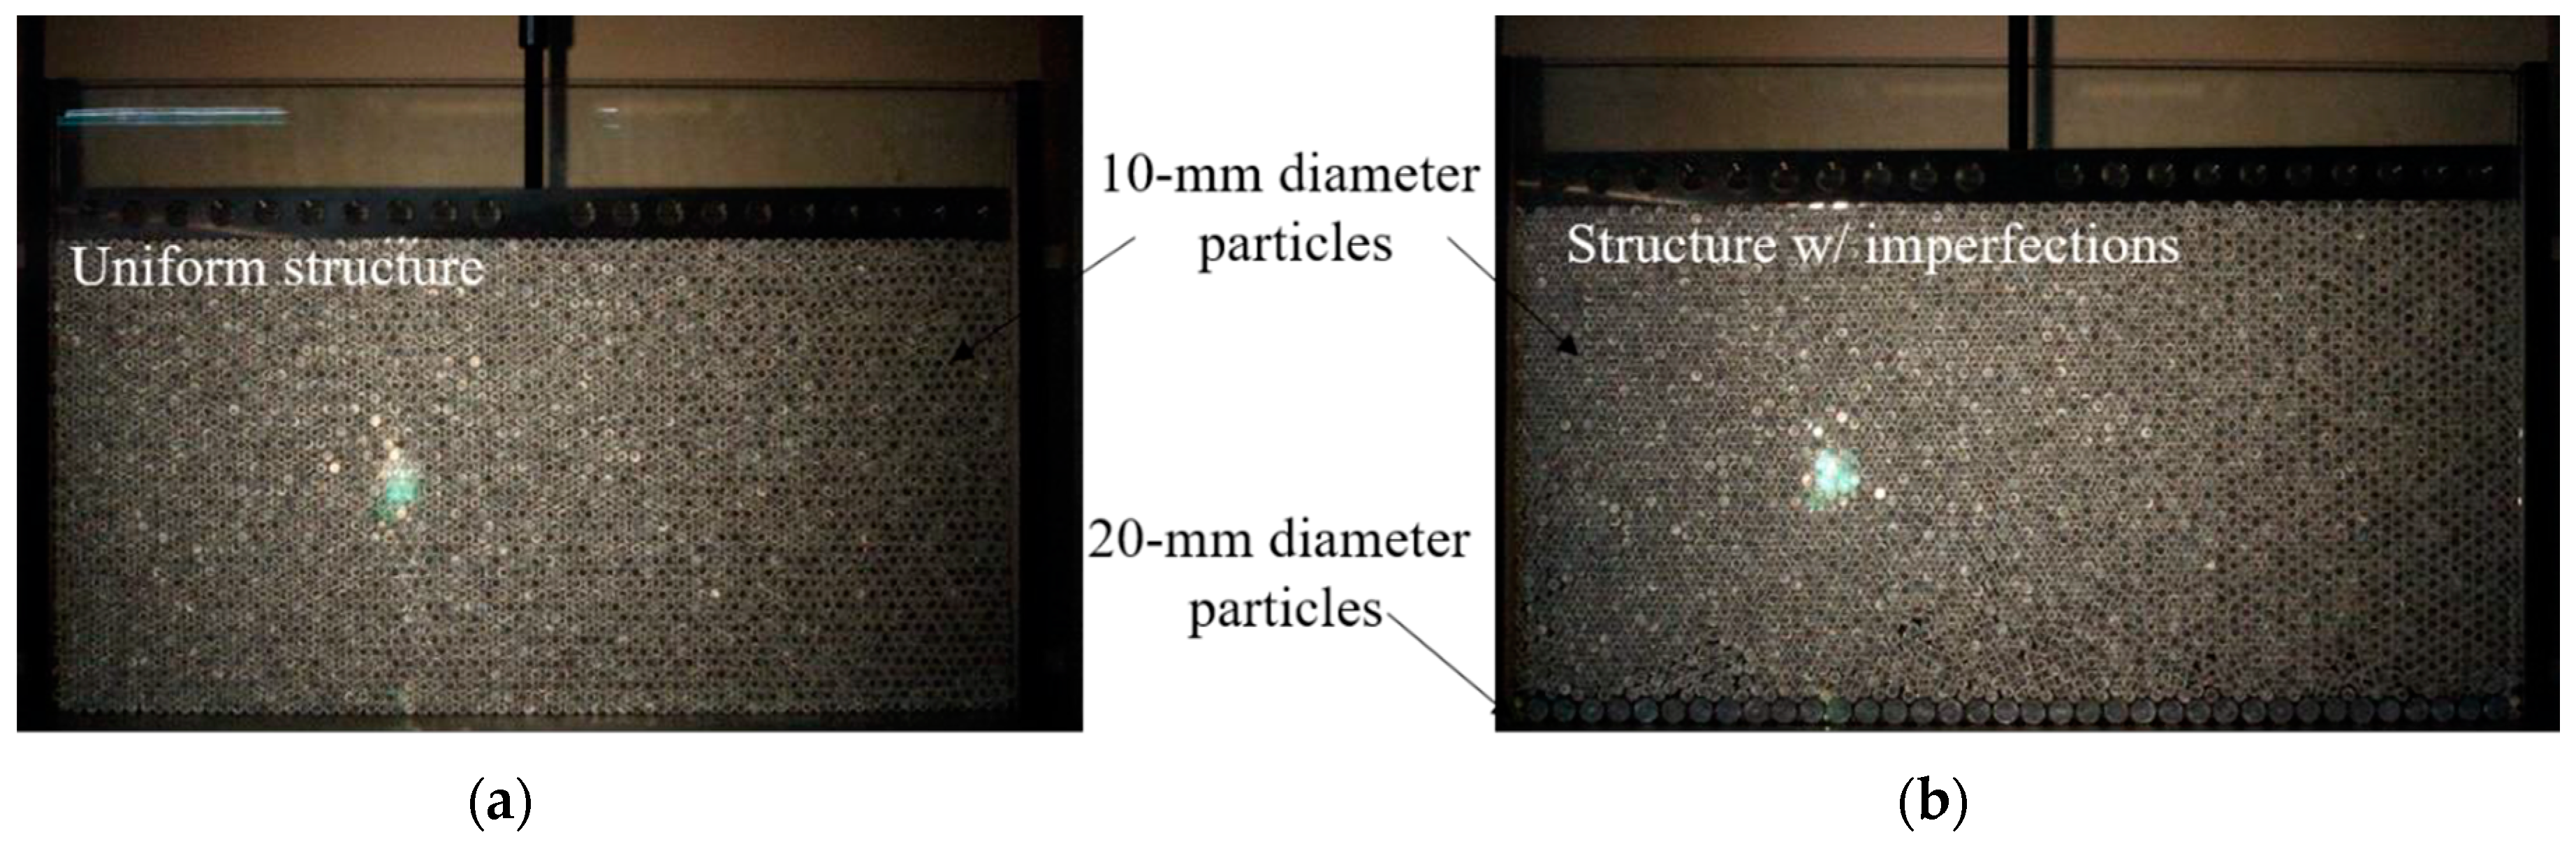
2.2.2. Experimental Setup and Test Program

Figure 3 shows the test apparatus, which included a loading frame and an LF/Z-2 reflective polariscope (Vishay Intertechnology, Inc.). Model particles with diameters of 10 mm and 20 mm were stacked in a hexagonal rhombohedral structure inside of a steel frame with a width of 770 mm (Figure 3a). Approximately 3,000 particles were stacked to a height of 380 mm. As shown in Figure 3b, white light that passed through the polarized plate was reflected by the photoelastic sheet on the surface of the particle and an image was obtained using a camera for digital RGB analysis. A detailed description of the reflective polariscopes was provided by Byeon and Jung [33]. Photoelastic images were obtained using a Canon EOS-650D camera equipped with an EF-S 55-250 mm/4-5.6 IS II lens (Canon, Inc., Japan). The focal length was 55 mm, and the resolution of the image was 300 pixels per inch (PPI), which is high enough to capture a photoelastic response.
The purpose of this study was to investigate the effect of initial granular structure on the load transmission structure. To this end, two granular assemblies, the first with a uniform structure and no initial defects and the second with local and structural imperfections in the lower part of the assembly were prepared. Figure 4a shows the uniform structure condition in which particles with 10-mm diameters were stacked. The granular assembly, which consisted only of the aforementioned particles stacked on a smooth bottom, formed a typical cubic tetrahedral packing with a coordination number of 8. As shown in Figure 4b, particles with 20-mm diameters were first layered on the bottom of the frame, onto which particles with 10-mm diameters were stacked. The 10-mm diameter particle layer, which was bounded by the 20-mm diameter particle layer, was in a relatively unstable state during initial stacking. Therefore, this granular assembly could be regarded as a two-layer structure with local defects.
Two initial particle assembly cases were tested under two loading conditions: uniaxial compression and shallow foundation loading. As shown in Figure 4, the axial displacement of the loading device could be controlled using gears. The load, which was applied through a loading plate, and the axial displacement of the loading plate could be precisely measured by installing a Linear Variable Differential Transformer (LVDT) on the load cell at the loading bar and on the upper part of the loading plate. Load cell and LVDT data were obtained through a data logger at 0.1-second intervals. During the loading test, the rate of axial displacement of the loading plate was controlled to 0.07 mm/sec.
In order to simulate shallow foundation loading, a 10-cm-wide model foundation plate, which was connected to the loading device, was installed at the top of the granular assembly during shallow foundation experiments. To simulate overburden pressure, which may affect the bearing capacity of a shallow foundation, metal plates with certain weights were manufactured and placed on the right and left sides of the model foundation plate, as shown in Figure 4b. The pressure applied by the pair of metal plates to the upper surface of the granular assembly was approximately 10 kN/m2; the pairs of plates was used during experimentation.
The experimental conditions are summarized in Table 1. Test ID in Table 1 is expressed as a combination of two letters representing the loading condition (uniaxial (U) or shallow (S)) and the packing condition (uniform structure without imperfections (U) or a structure with imperfections (I)). The experiment was repeated 2–3 times for each case. During the experiment, digital images were captured through the front acrylic walls, and subsequently used for digital RGB photoelastic analysis.
The force in the granular assembly was transmitted from particle to particle by contact. The photoelastic test was used to identify the path of force transmission within the granular assembly that changed during the test. Figure 5 shows a typical photoelastic image, which can be used to visually identify the main force transmission pathway. In addition to qualitative evaluations, image analysis was performed using the method developed by Park and Jung [21] to quantitatively evaluate the contact force chain in the granular assembly. However, there remains some disagreement as to which particle should be used as the main contact force chain [26,34,35]. In this study, and according to the findings of Park and Jung [21], particles that had a force greater than 100 N were considered to be the main contact force chains, which agreed well with visual observations.

3. Results and Discussion

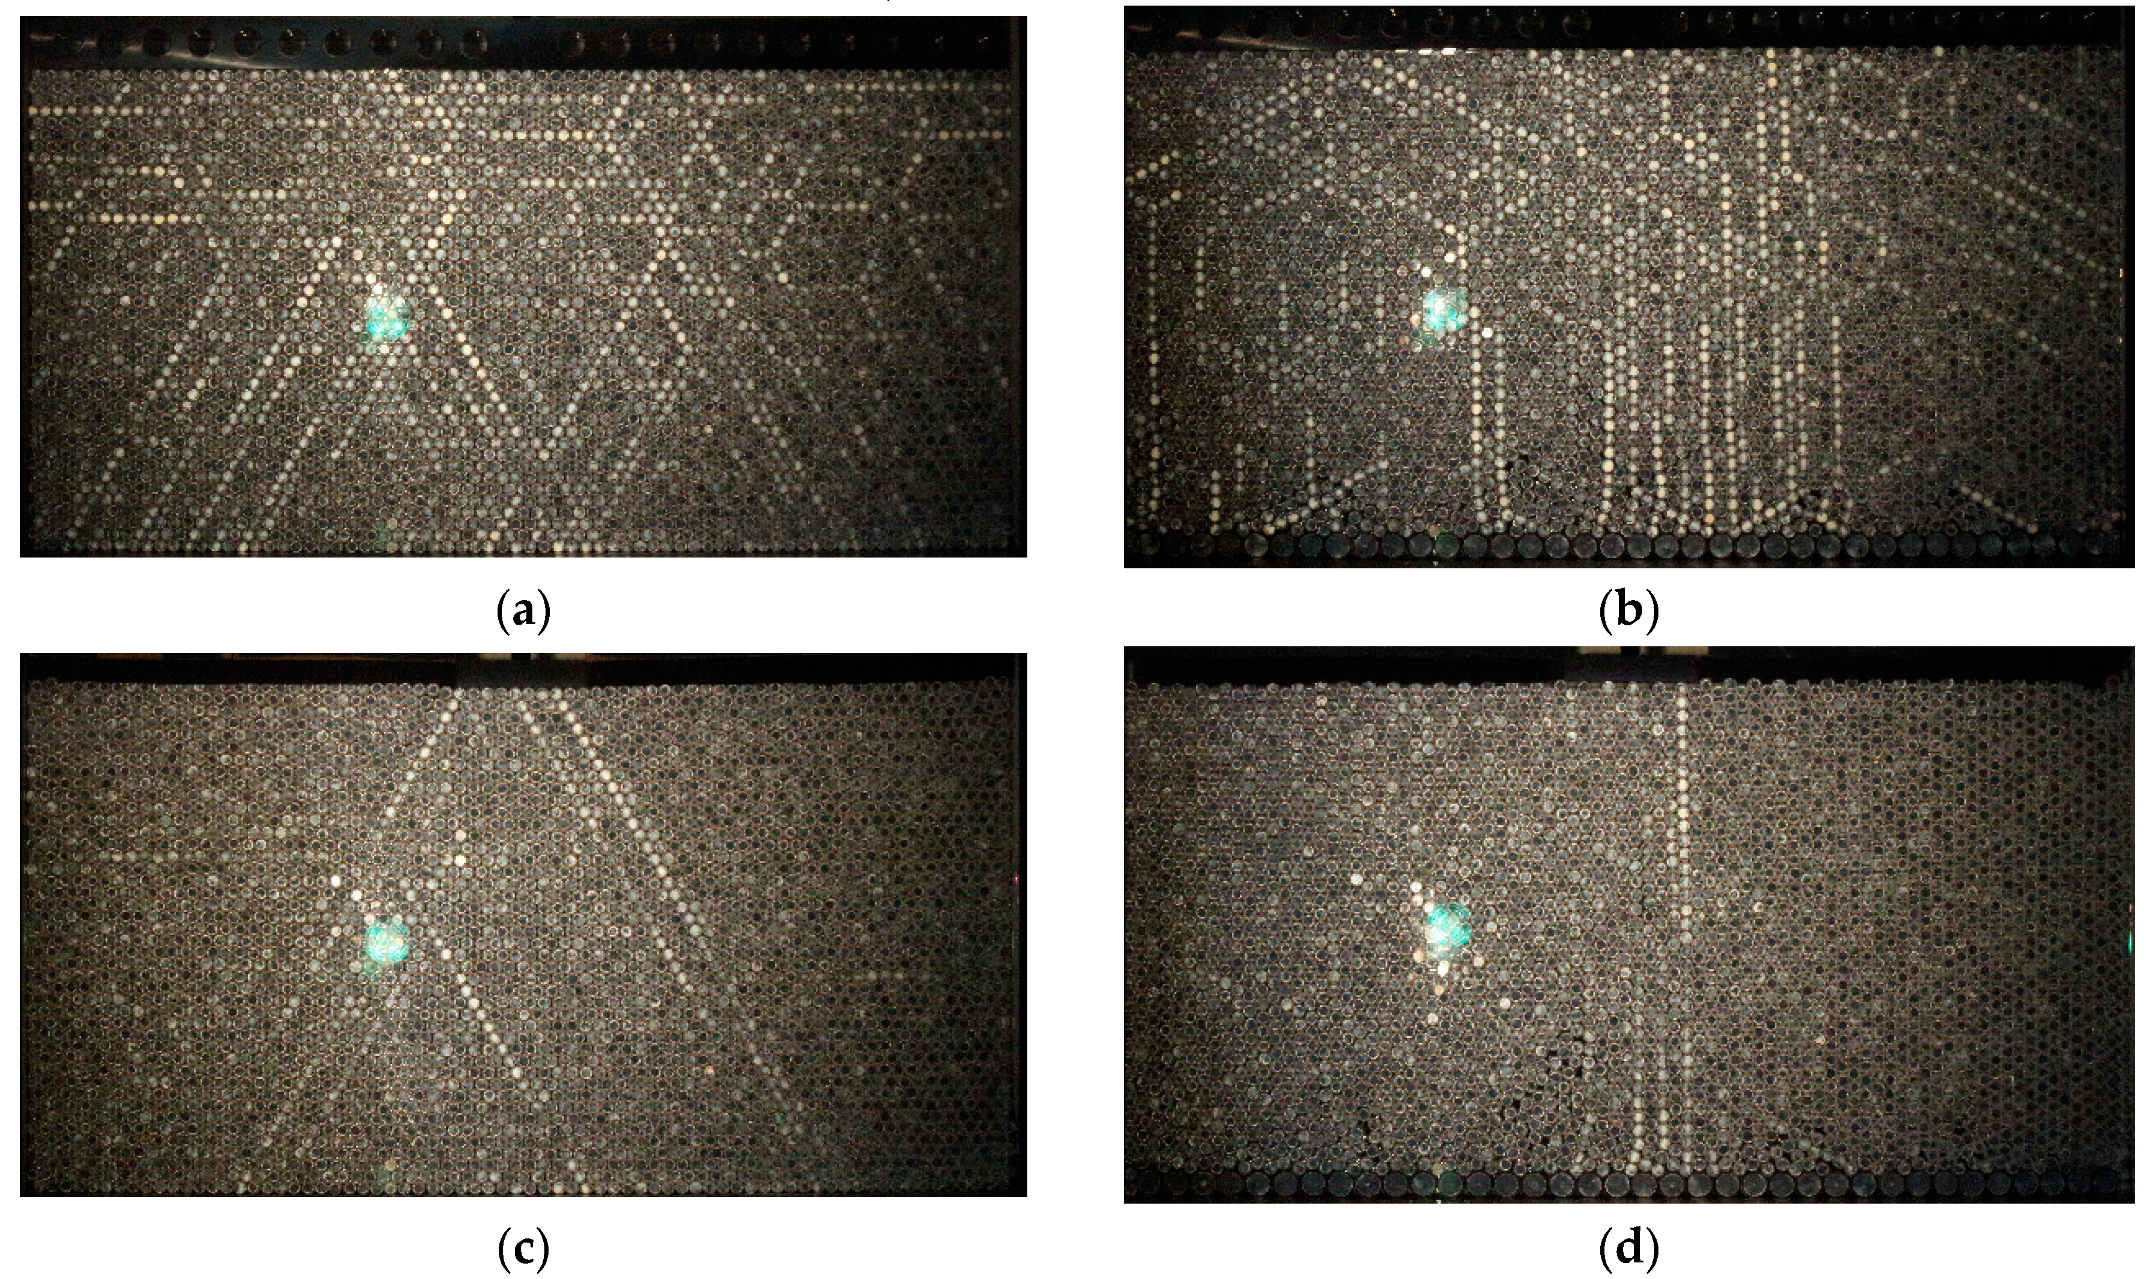
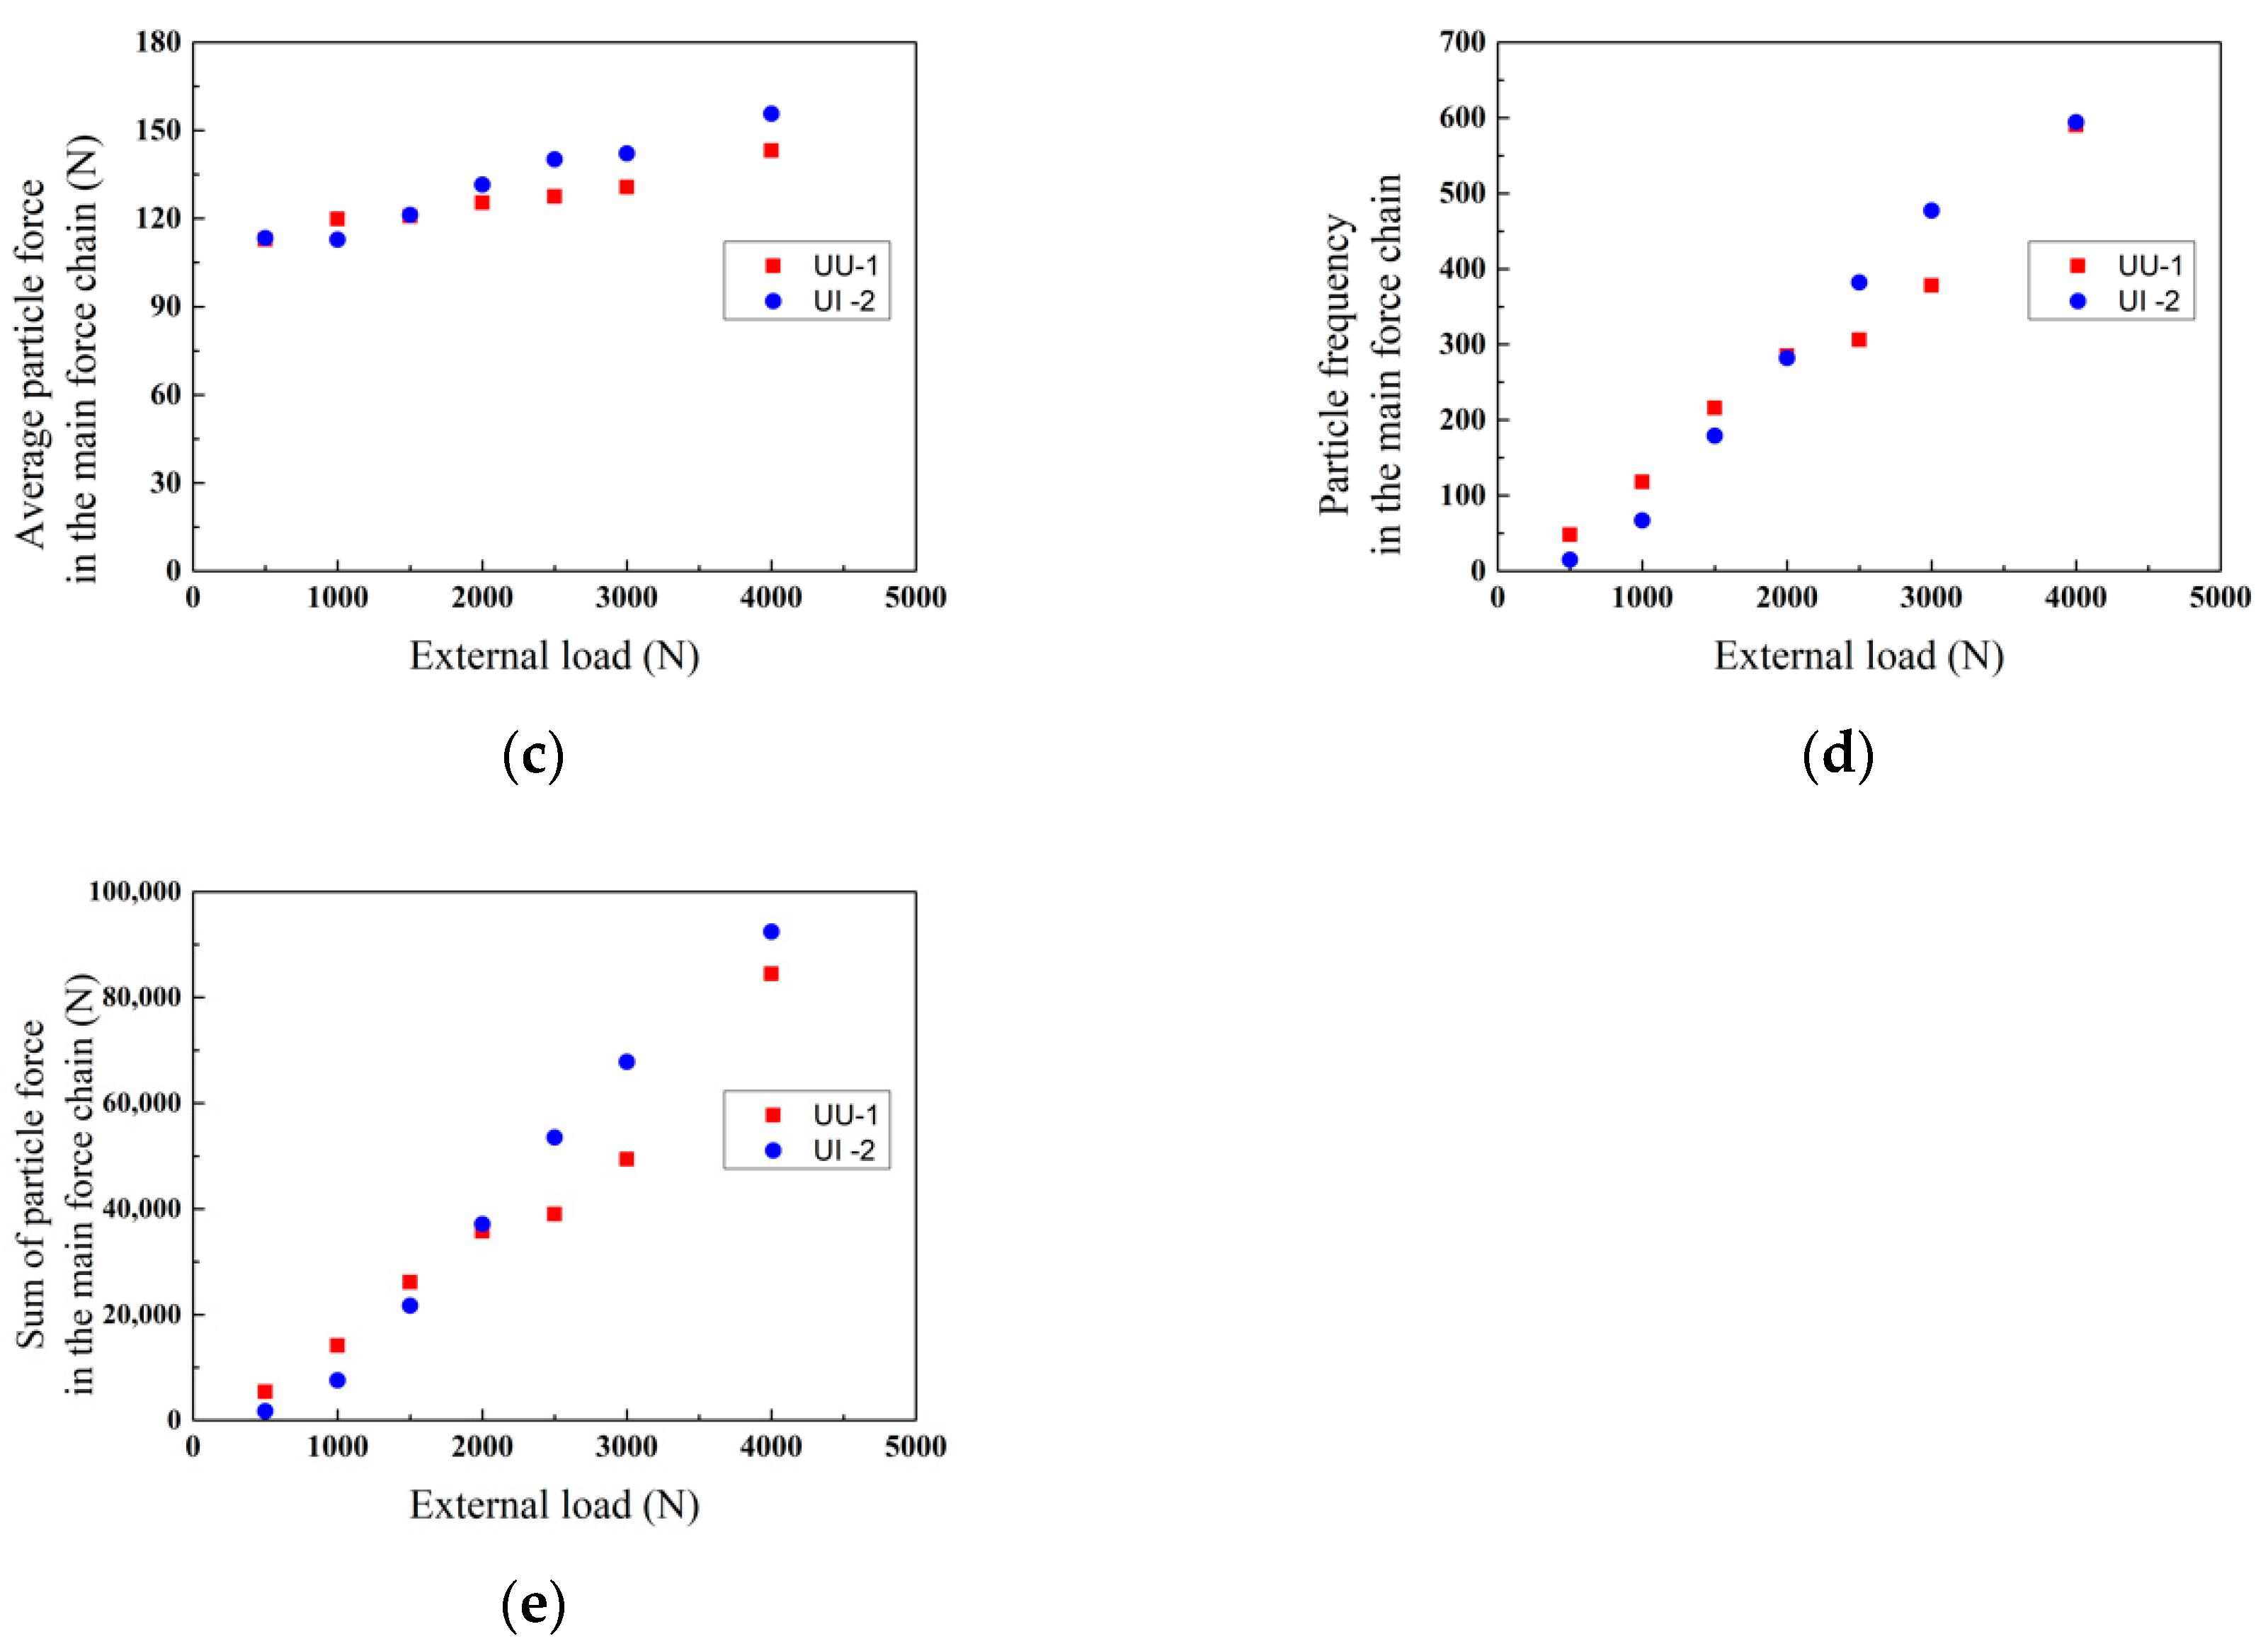
3.1. Effect of Initial Granular Assembly Conditions on the Structure of the Contact Force Chain

Figure 6a shows the macroscopic load–displacement curves for all uniaxial loading tests under the condition in which lateral displacement was constrained. The load was measured by the load cell connected to the loading rod, and the displacement was measured by the LVDT connected to the top of the loading plate. As shown in Figure 6a, the stiffness of the uniaxial compression test increased regardless of the initial granular conditions (e.g., the behavior of typical granular materials). Although the values differed slightly for each experiment, the difference among them was insignificant. In the case of UU (uniaxial loading of a uniform structure) and UI (uniaxial loading of an imperfect structure), failure did not occur during the vertical loading up to 4000 N. Figure 6b shows selected data from the microscopic photoelastic response comparison. Each step observed is shown in Figure 7b–f and Figure 8b–f.
Interestingly, although there was no significant difference in the macroscopic load–displacement curves of the UU and UI conditions shown in Figure 6, the distribution of the internal contact force chain structure of the granular assembly in the photoelastic images was markedly different. Figure 7 and Figure 8 show that the chain structures measured from the photoelastic response in UU and UI changed with the load level. As shown in Figure 7, in the case of UU, where there were no initial defects, contact force chains were formed in the left and right diagonal directions according to the particle arrangement when a load was applied (Figure 7b,c). Subsequently, as the load increased, the number of linear contact force chain structures, which were developed diagonally around the upper part of the granular assembly, increased. Simultaneously, a horizontal chain structure gradually occurred gradually near the upper plate (Figure 7d,e). When the load reached 4000 N, it can be seen that the force was distributed evenly inside of the granular assembly (Figure 7f). It is worth noting that one can find the great similarity between the pattern of the distribution of the contact force chains shown in Figure 7 and the experimental data of Dantu [23] showing the transmission of contact forces along the lines inclined at 60 degrees relative to each other in the assembly consisting of the equal cylinders.
In the case of a granular assembly where initial local structural defects existed, as shown in Figure 8, when a uniaxial compressive load was applied (UI), the support behavior was significantly different from that of a granular assembly where there were no structural defects (UU, Figure 7). It can be seen that the contact force chain structure was aligned with the main stress direction (i.e., the vertical direction), and not diagonally. This result is consistent with previous findings by other researchers [7,8,9,10,36]. However, it is worth noting that in this study, the contact chain structure was clearly arranged in the direction of major principal stress only when there was an initial structural defect. Afterward, as the load increased, the number of vertical contact force chains increased, and the photoelastic reaction simultaneously become brighter. At load levels of ≥2000 N, it was observed that contact force chains began to form near the foundation plate in the diagonal direction, as well as the vertical direction. However, the number of diagonally developed contact force chains was much lower than that shown in Figure 7 (i.e., under UU conditions).
Figure 9 shows the results of quantitative detection of the particle force in the photoelastic images of UU and UI using digital RGB photoelastic analysis. Figure 9a,b show the average particle force and the sum of the force that the particles receive for the detected overall granular assembly, as the load increased. As is shown, the UU and UI results were similar, regardless of the presence of local defects in the granular assembly. Figure 9c shows the average force of the particles that were classified as the main force chain, and the results indicate that the UI received a larger average particle force than the UU condition for the same load. In the case of UU, this can be interpreted to mean that all of the particles shared the external load evenly, while in the case of the UI, only specific structures (i.e., vertically arranged structures) share the load. Figure 9d shows the frequency of particles that were classified as the main force chain. At low load levels (< 2000 N), the particle frequency in the UU that was classified as the main force chain was greater than that in the UI, while at high load levels (> 2000 N), the particle frequency in the UI that was classified as the main force chain was higher than that in the UU. Figure 9e shows the sum of the forces of the particles that were classified as the main force chains. Initially, the main force chain of the UU structure seemed to support the external load better than the main force chain of the UI structure. However, as the load increased, the main force chain of the UI structure showed better support of the external load than the main force chain of the UU structure.

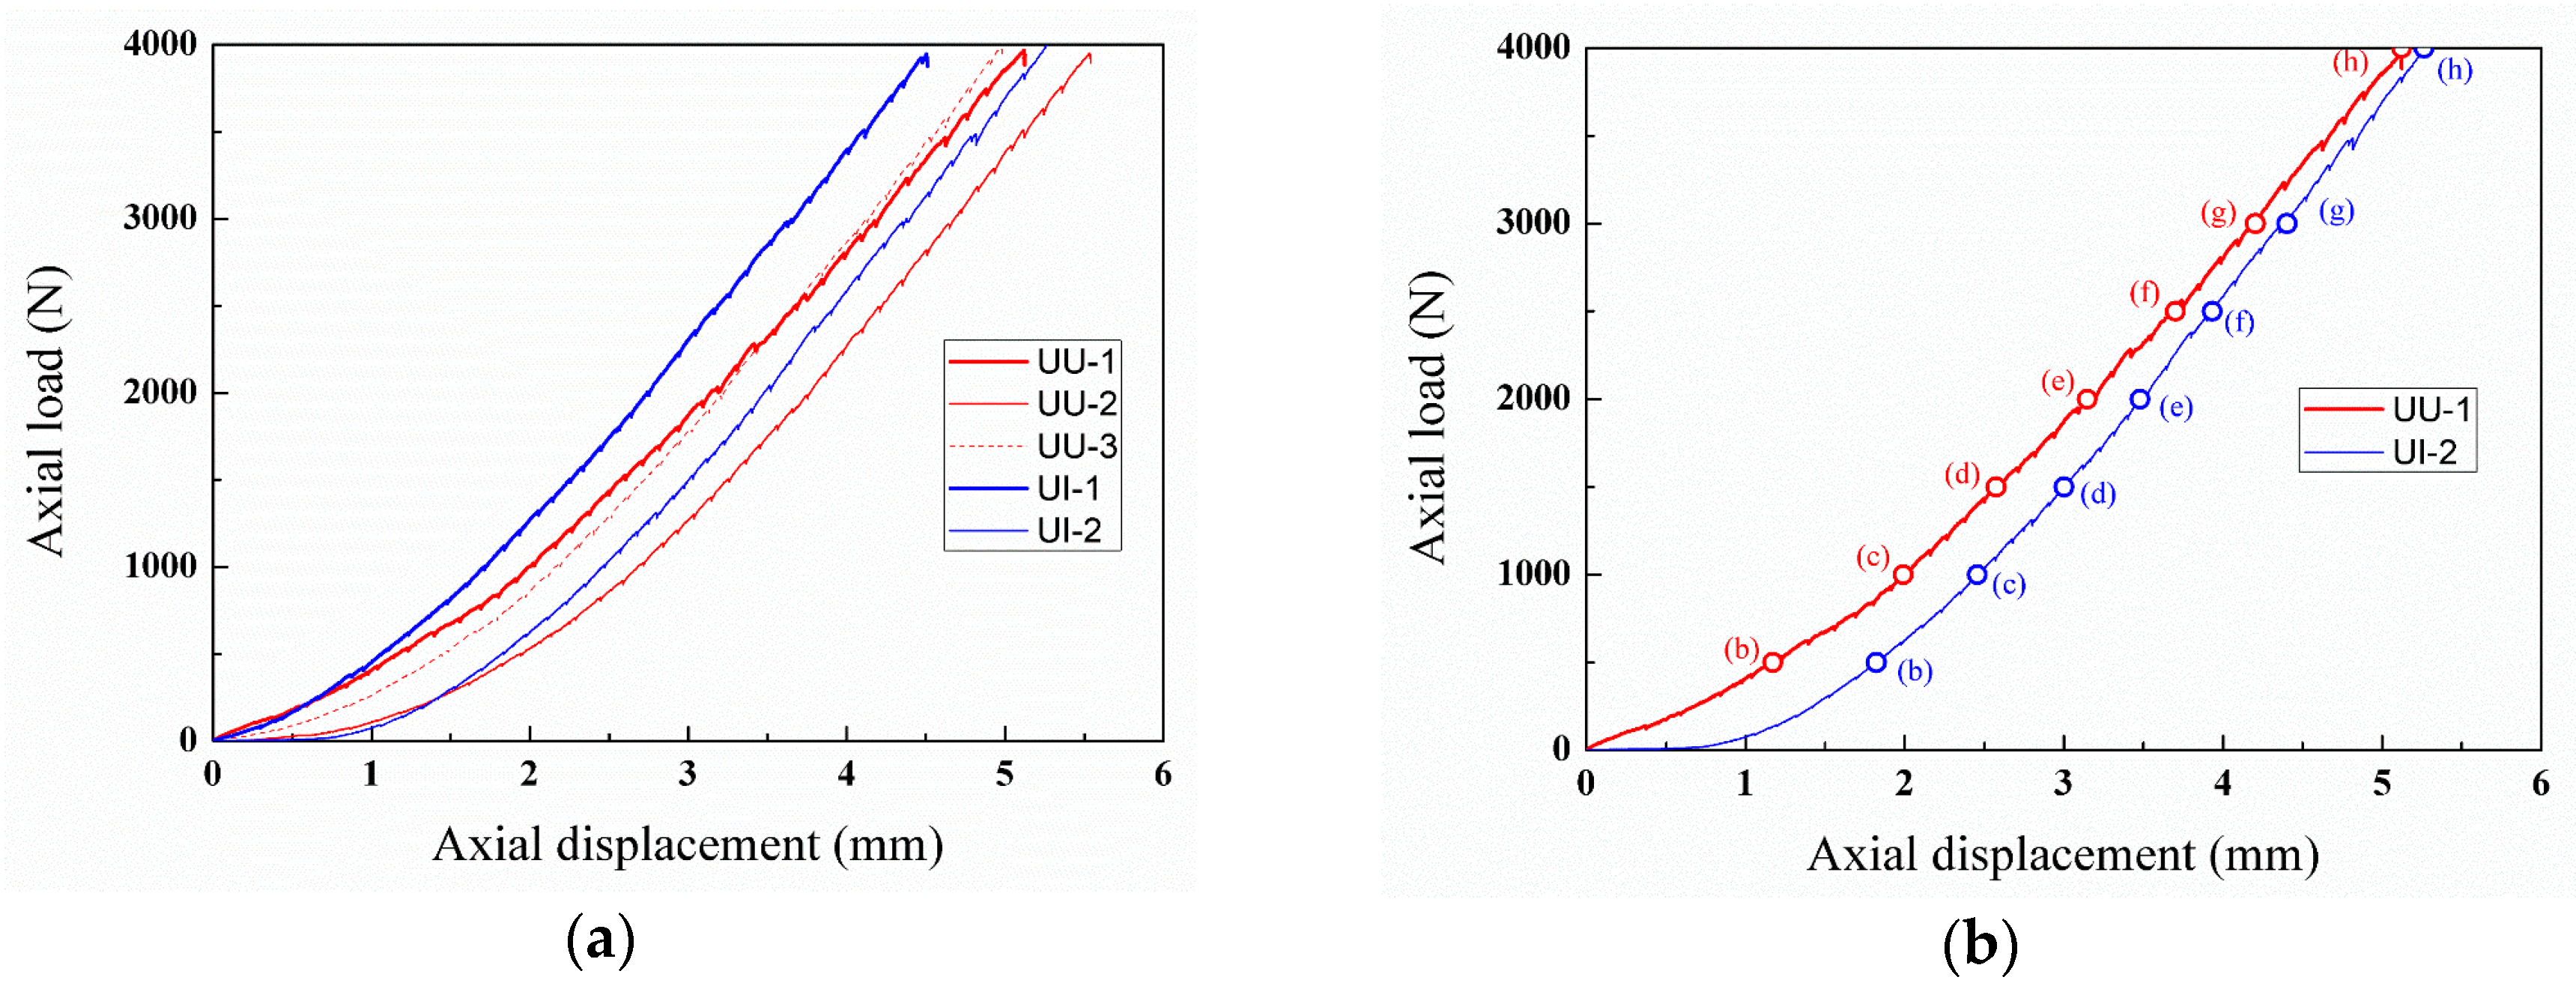
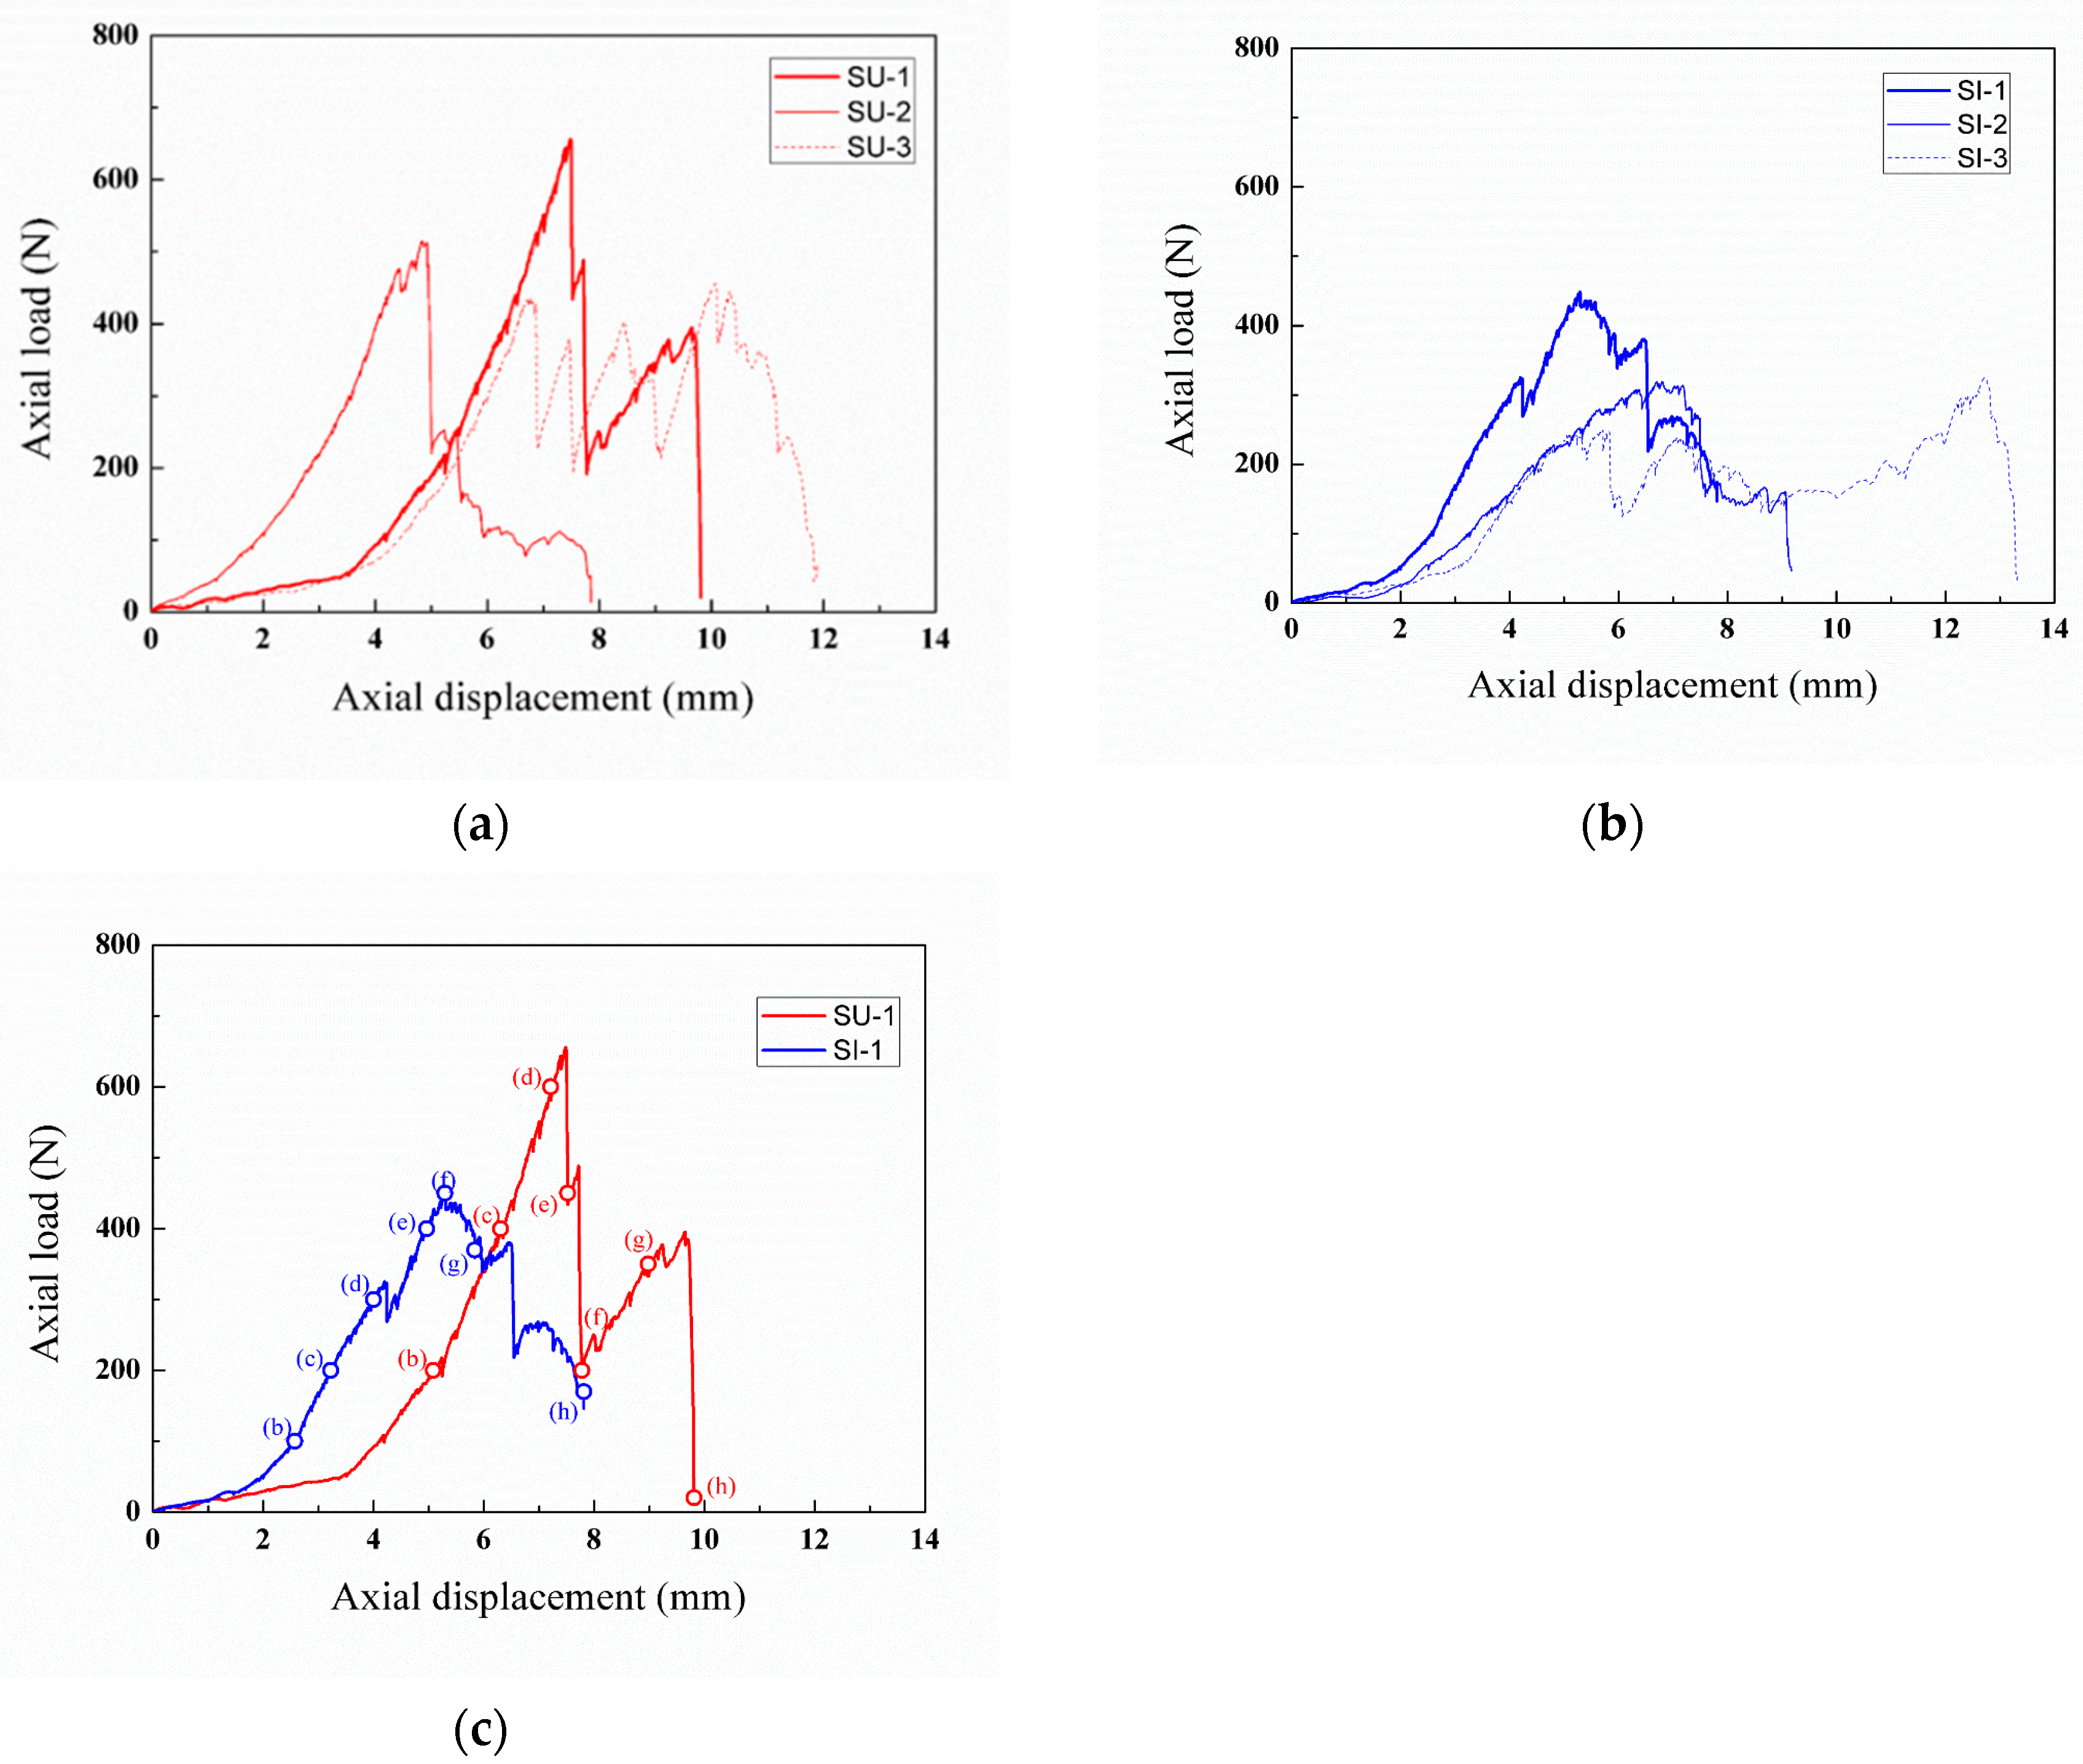
3.2. Effect of Initial Granular Assembly Conditions on the Bearing Capacities of Shallow Foundations

Figure 10 shows the load–displacement curves obtained by applying a shallow foundation load to the two granular assemblies. Unlike the uniaxial compressive load condition shown in Figure 8, a very irregular load–displacement relationship was observed when a shallow foundation load was applied. Figure 10c shows selected data for comparing photoelastic responses. In the initial part of the load–displacement curve, there was a pattern of increasing stiffness under all granular conditions with or without initial defects, but then the load rapidly decreased as the first peak occurred. Afterward, the second peak was observed; a new peak occurred at a lower load than the first peak value, and the load decreased rapidly. The maximum peak load was 649.6 N for SU and 441.0 N for SI, which indicates that the value for SI was ~68% of that for SU. In particular, in the case of the SI (Figure 10c), the load tends to increase after relatively brief decrease at a stage marked by (d) in Figure 10c. This phenomenon can be explained by incipient failure, which has previously been noted by Tordesillas et al. [37]. According to Tordesillas et al. [37], the final bearing capacity is determined by the incipient failure. In particular, it has been confirmed that incipient failure is caused by local buckling of the contact force chain structure inside the granular assembly.
Figure 11 shows the change in work, which was obtained by integrating the load–displacement curve shown in Figure 10c. In the case of SU, more work was involved than for SI and more energy was accumulated. As with the load–displacement curve, the work increased rapidly at the beginning of loading, but the rate of work decreased significantly after the first peak occurred. This may be because the accumulation of elastic energy due to the buckling of the contact force chain at the time of the first peak was different from the accumulation before the peak occurred. The final work of the SU and SI conditions were 2000 N ⋅mm and 1700 N ⋅ mm, respectively, which indicates that SI can only store ~80% of the energy as SU. This disparity may be due to the differences in the load transmission processes that occur in SU and SI. Each step observed during photoelastic analyses is shown in Figure 10c and Figure 11.
In addition to the aforementioned macroscopic observations, image analysis was also performed for shallow foundation loading to compare the load support patterns and supportive loads according to the presence of imperfections. Figure 12 and Figure 13 show the results obtained by analyzing the images recorded during the loading tests for SU and SI. In the case of shallow foundation loading, as well as uniaxial loading, it can be seen that the load transmission structure of the granular assembly varied significantly depending upon the presence of imperfections. The formation and collapse of the contact force chain structures shown in Figure 12 and Figure 13 tend to follow the load–displacement curves shown in Figure 10c.
In the case of SU (shown in Figure 12), wherein there was no initial defect, when loading began, contact force chains began to be formed diagonally at both ends of the foundation plate, showing good agreement with Dantu [23]. In particular, the similarity is that the force chains generated at an angle of 60 degrees depending on the stacked tetrahedral structure. Afterward, the most obvious contact force transmission structure was observed (Figure 12d). It can be seen that the number of particles corresponding to the main force chain gradually decreased with decreasing load. Additionally, after the step shown in Figure 12e, the particle arrangement shifted to the left side of the foundation surface, which caused the void between particles to increase and dilatancy to occur. Meanwhile, on the right side, a distinct contact force chain was observed. In the final stage of loading (Figure 12h), all contact force chains disappeared, and wedge-shaped failure surfaces were observed at the bottom.
With shallow foundation loading, the wedge-shaped final failure geometry was similar to the results obtained using the basic limit equilibrium that is used conventionally. Nevertheless, in the case of SI, wherein local imperfections existed in the lower part of the granular assembly (Figure 13), the main contact force transmission structure formed in the vertical direction, as in the case of uniaxial loading. Thereafter, as loading progressed, the number of particles corresponding to the main force chain increased and formed in a direction perpendicular to the loading surface, as in uniaxial loading. Additionally, it was confirmed that the region where the main force chain occurred was the size of the width of the foundation and failed. As in the case of SU, dilatancy was observed near the end of the foundation width in the final loading step shown in Figure 13f. However, micromechanical studies have shown that the instability of a loaded granular assembly is due to the buckling of contact force chain structures formed with the assembly [16,38].
Tordesillas and Muthuswamy [38] applied loads to an initial connection state of an ideal particle and a state wherein instability was applied to the contact force chain structure by arbitrarily generating a 2º buckling angle. Furthermore, the force generated during the elastic–plastic buckling behavior was confirmed by the equation and results of their DEM. This result, combined with those of a more recent study by Tordesillas et al. [37], suggest that particle rotation can cause the buckling of contact force chain and incipient failure of the entire load–displacement curve, thus affecting the final bearing capacity.
Table 2 summarizes the quantitative results of the particle force detection in photoelastic images of SU and SI using digital RGB photoelastic analysis. In the case of SU, the maximum support load measured by the load cell was 649.6 N. As a result of image analysis, it was found that the average particle force in the entire granular assembly also increased up to 40 N. In the case of SI, the maximum support load measured by the load cell was 441.0 N. It was found that the average particle force in the entire granular assembly was also the maximum (34 N). Additionally, the tendency of the total force calculated from each particle exhibited the maximum values in images (d) and (f) in the cases of SU and SI, respectively, and this tendency agreed well with the results of load cell measurements. The frequency of the particles that were classified as the main force chain and the sum of the forces of the particles also agreed well with the variation in load.
Under shallow foundation loading, when imperfections existed, the peak load reduction rate measured by the load cell was ~75% (compared to the uniform structure), and the peak load reduction rate obtained from the image analysis was estimated to ~82% (in terms of the total force). Interestingly, this result was very similar to the calculations theoretically described by Tordesillas and Muthuswamy [38], who found that the load transmission of a granular assembly was reduced by ~18% when there was an instability, as compared with no instability.
Unlike uniaxial loading, shallow foundation loading allows the rearrangement (particularly rotation) of particles to occur more freely because the upper part of the assembly is not completely constrained. If local imperfections exist rather than homogeneous granular conditions, the granular assembly becomes unstable, and this can cause the particles to rotate actively, even under small loads. It is believed that the rotation of particles may have caused buckling of the contact force chain structure and more active dilatancy of the granular material in this study. As a result, it seems that the initial conditions of the granular assembly (compared to uniaxial compressive loading) have a greater effect on the bearing capacity of shallow foundation loading.

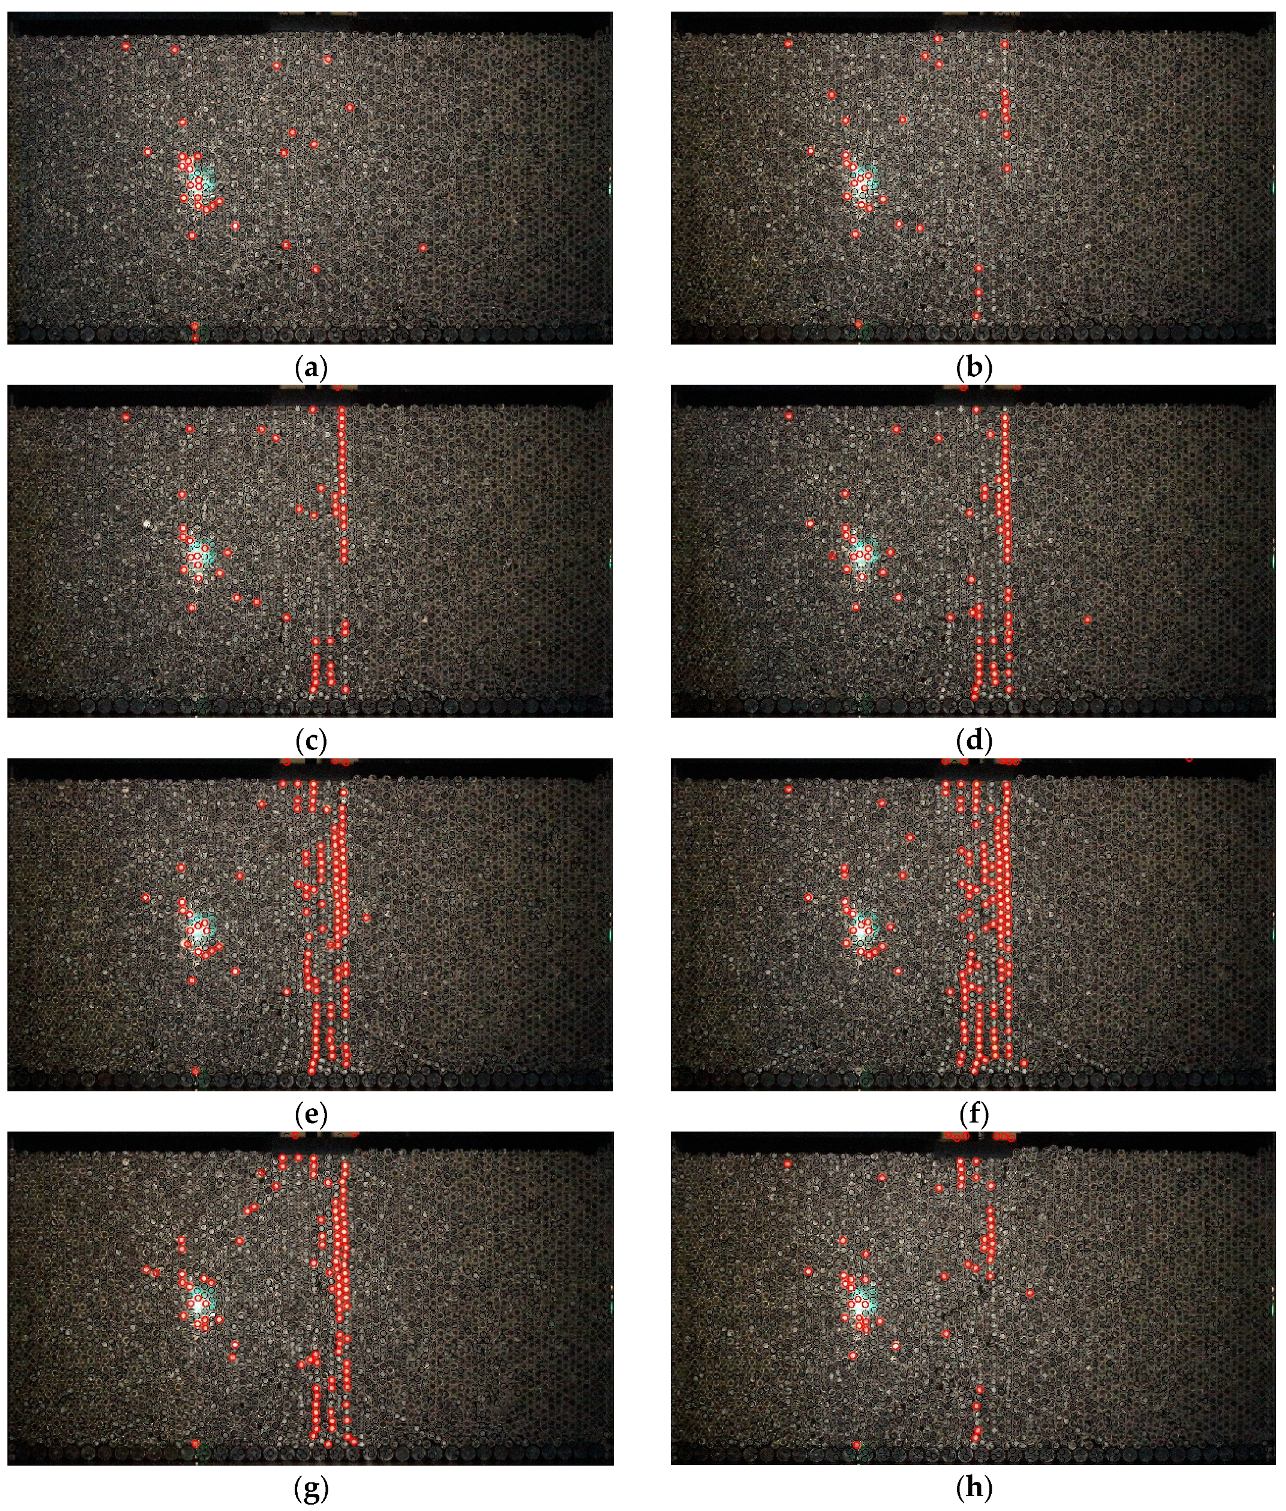
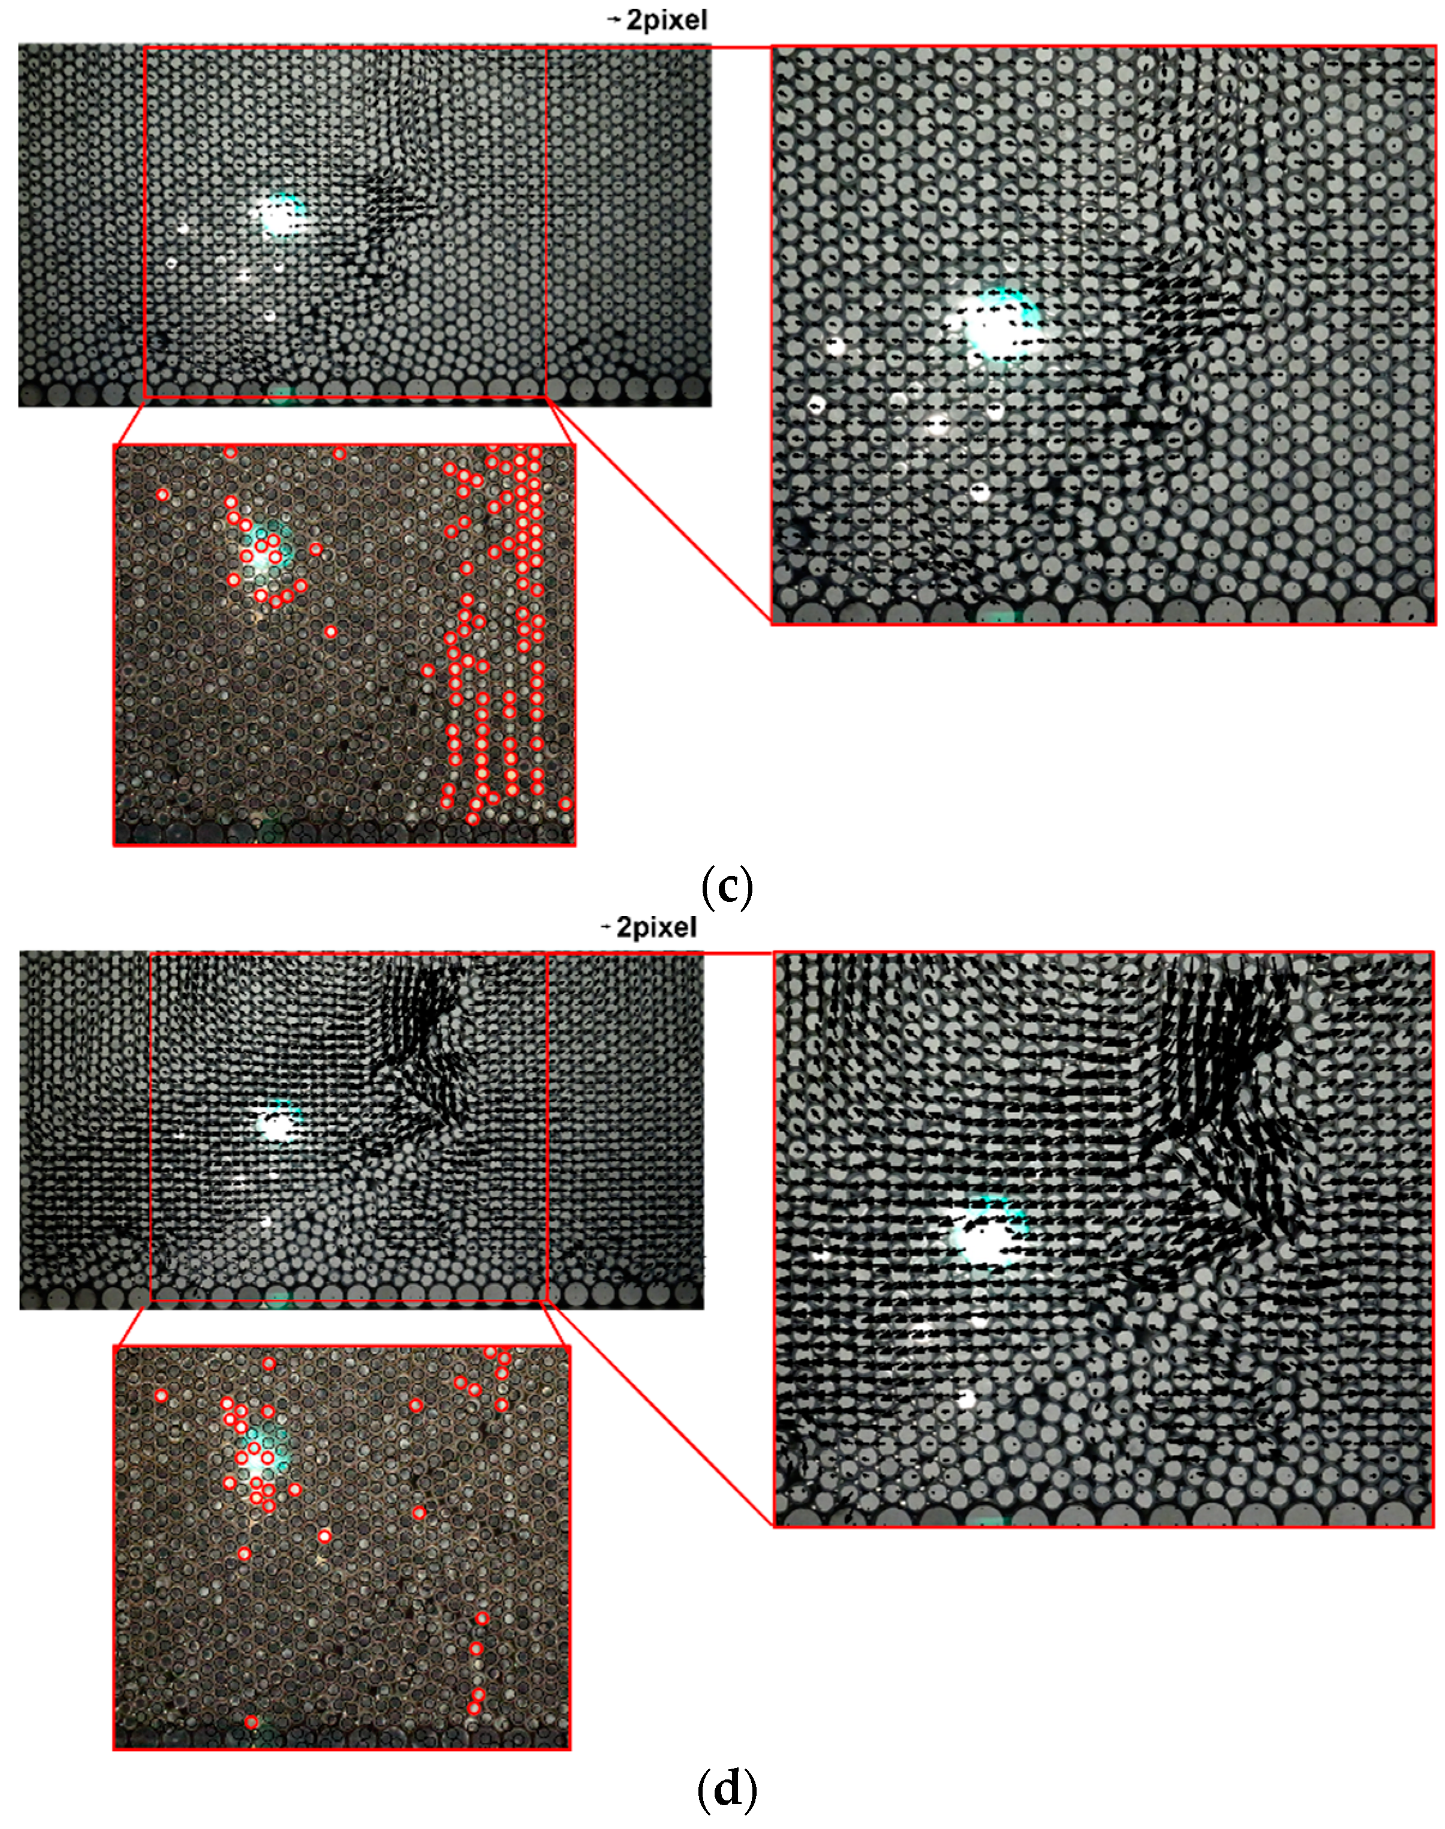
3.3. Evolution of Structural Imperfections under Shallow Foundation Loading

In order to observe the evolution of local imperfections in the lower part of granular assemblies during testing for SI, a general digital image was recorded with an additional camera without a photoelastic filter. Figure 14 shows an image of the lower part of the granular assembly captured by the additional camera. As can be seen in the image, even during the initial state of loading, the arrangement of particles was uneven in the lower part of the assembly, and the number of contact points of some particles decreased with a large void. Although it is difficult to observe large changes in the void until the step shown in Figure 14b, the particle arrangement suddenly collapsed in the step shown Figure 14c after the first peak of the load–displacement curve, which caused the void to gradually expand into the center of the assembly. Finally, in Figure 14d, it can be seen that the void expanded into a zigzag pattern to form a final failure surface.
In order to confirm particle movement and the expansion of imperfections, PIV was used [39,40]. The PIV analysis was performed for the same load and displacement stages as shown in Figure 13, and Figure 15 shows the four incremental displacement vectors as a result of PIV analysis together with contact force chains. However, the value was removed for the area affected by the reflection of light. The size of the vector shown in Figure 15 was enlarged to aid in the visual identification of the amount and direction of particle movement. The magnitude of the reference vector in Figure 15a–c shows that the particles actually moved by only two pixels. In the case of Figure 15d, the particle movement is much larger, and thus the size of the vectors was expressed at 1/2 the size of those in Figure 15a–c.
As shown in Figure 15a, movement of particles in the upper part of the granular assembly was active during the early stage of loading. This is the process by which external loads on the foundation are transmitted to the particle assembly. Figure 15b,c show that as the load increased, particle movement propagated throughout the interior of the assembly. Interestingly, the movement of particles first occurred in the counterclockwise direction on the right side of the initial defects, and then proceeded in a clockwise direction on the left side of the initial defects. Through this process, the initial defects existing in the lower part of the granular assembly were expanded throughout the entire assembly. As seen in Figure 15d, the active movement of particles occurred around the zigzag-shaped failure plane observed in Figure 14d. Therefore, it was confirmed that the local substructural defects inside the assembly expanded throughout the granular assembly during loading and the contact chains of the particles buckled which resorts to failure.

4. Conclusions

In this study, the effect of initial granular structural defects on the support behavior of granular assemblies was confirmed through photoelastic model testing when assemblies, which were stacked with model particles, were subjected to uniaxial compressive or shallow foundation loading. The macroscopic analysis of the load–displacement relationship and the microscopic observation of the force transmission path inside the granular assemblies revealed that when the granular assembly was subjected to uniaxial compressive loading, there was no significant difference in the macroscopic load–displacement curve, regardless of the initial structural defects of the assembly. However, the distribution of the internal granular contact force chain structure in the photoelastic image was found to differ completely. In the case of homogeneous granular assemblies, contact force chains formed diagonally under loading, and the structure gradually expanded. However, in granular assemblies with initial structural defects, contact chains formed in the direction of the major principal stress, and the main force transmission structure was maintained and expanded until the end of the loading process. As a result of quantitative analysis of the photoelastic images, in the case of the granular assembly without initial defects, the particles were distributed evenly to support the external load, while in the case of the assembly with defects, only specific structures (i.e., vertically arranged structures) were found to share the load.
When the granular assembly was subjected to a shallow foundation loading, a large difference was found in the macroscopic load–displacement curve depending upon the presence of initial structural defects. The maximum peak load of the granular assembly with initial defects was approximately 68% of the maximum peak load of the assembly without defects. The structures of the internal contact force chains in the photoelastic images were also found to differ substantially between the two assemblies. In the case of the granular assembly without initial defects, contact chains that spread diagonally at both ends of the foundation were observed, while in the case of the assembly with initial defects, it was confirmed that the contact force chain structure had a foundational width and was formed in the vertical direction (i.e., the major principal stress direction), as in the uniaxial compressive load.
The expansion of local imperfections in the lower part of granular assemblies was observed when shallow foundation loading was applied by using PIV. From the initial state before loading, irregular voids in the lower part of the assembly expanded toward the central part of the assembly along with the load. Expanded zigzag-shaped voids broke the contact force chains of the particles. Likewise, according to the presence of an initial local instability with the granular assembly, a completely different type of contact force chain structure developed from the initial loading stage to the final failure stage. In particular, it was confirmed that the presence of imperfections greatly affected the bearing capacity during shallow foundation loading and buckling of the contact force chain structure due to particle rearrangement and rotation was found to occur more frequently. As a result, it appears that the behavior of the granular assembly (under uniaxial compressive loading) is significantly affected by the initial structural conditions of the assembly. However, since this experiment was performed under very limited conditions, it is necessary to verify the various cases and generalize the conclusions with respect the effect of initial defects on granular support behavior.

Author Contributions

Conceptualization, Y.-H.J. and K.-H.P.; methodology, K.-H.P.; software, K.-H.P. and T.-Y.K.; validation, Y.-H.J., K.-H.P. and T.-Y.K.; formal analysis, Y.-H.J. and K.-H.P.; investigation, K.-H.P.; resources, Y.-H.J.; writing—original draft preparation, K.-H.P.; writing—review and editing, Y.-H.J.; visualization, K.-H.P. and T.-Y.K.; supervision, Y.-H.J.

Funding

This research was supported by the National Research Council of Science & Technology Postdoctoral Research Fellowship for Young Scientists at the Korea Institute of Civil Engineering and Building Technology and the National Research Foundation of Korea (NRF) grant funded by the Korea government (MSIT) (No. 2019R1A2C1089155).

Acknowledgments

The support of Jin-Tae Han, research fellow of the Korea Institute of Civil Engineering & Building Technology, is greatly appreciated. Sang-Young Shin of Kumho E&C conducted the experiments presented in this paper.

Conflicts of Interest

The authors declare no conflict of interest.

References

  1. Antony, S.J. Evolution of force distribution in three-dimensional granular media. Phys. Rev. E 2000, 63, 11302. [Google Scholar] [CrossRef] [PubMed]
  2. Bardet, J.-P. Observations on the effects of particle rotations on the failure of idealized granular materials. Mech. Mater. 1994, 18, 159–182. [Google Scholar] [CrossRef]
  3. Bourrier, F.; Nicot, F.; Darve, F. Physical processes within a 2D granular layer during an impact. Granul. Matter 2008, 10, 415–437. [Google Scholar] [CrossRef] [Green Version]
  4. Calvetti, F.; Combe, G.; Lanier, J. Experimental micromechanical analysis of a 2D granular material: Relation between structure evolution and loading path. Mech. Cohesive-frictional Mater. An Int. J. Exp. Model. Comput. Mater. Struct. 1997, 2, 121–163. [Google Scholar] [CrossRef]
  5. Ciamarra, M.P.; Coniglio, A.; Nicodemi, M. Shear instabilities in granular mixtures. Phys. Rev. Lett. 2005, 94, 188001. [Google Scholar] [CrossRef]
  6. Kondic, L.; Fang, X.; Losert, W.; O’Hern, C.S.; Behringer, R.P. Microstructure evolution during impact on granular matter. Phys. Rev. E 2012, 85, 11305. [Google Scholar] [CrossRef] [Green Version]
  7. Oda, M.; Kazama, H.; Konishi, J. Effects of induced anisotropy on the development of shear bands in granular materials. Mech. Mater. 1998, 28, 103–111. [Google Scholar] [CrossRef]
  8. Peters, J.F.; Muthuswamy, M.; Wibowo, J.; Tordesillas, A. Characterization of force chains in granular material. Phys. Rev. E 2005, 72, 41307. [Google Scholar] [CrossRef]
  9. Majmudar, T.S.; Behringer, R.P. Contact force measurements and stress-induced anisotropy in granular materials. Nature 2005, 435, 1079–1082. [Google Scholar] [CrossRef]
  10. Tordesillas, A.; Zhang, J.; Behringer, R. Buckling force chains in dense granular assemblies: Physical and numerical experiments. Geomech. Geoengin. An Int. J. 2009, 4, 3–16. [Google Scholar] [CrossRef]
  11. Oda, M.; Kazama, H. Microstructure of shear bands and its relation to the mechanisms of dilatancy and failure of dense granular soils. Geotechnique 1998, 48, 465–481. [Google Scholar] [CrossRef]
  12. Rechenmacher, A.L. Grain-scale processes governing shear band initiation and evolution in sands. J. Mech. Phys. Solids 2006, 54, 22–45. [Google Scholar] [CrossRef]
  13. Rechenmacher, A.; Abedi, S.; Chupin, O. Evolution of force chains in shear bands in sands. Geotechnique 2010, 60, 343. [Google Scholar] [CrossRef]
  14. Thornton, C.; Zhang, L. A numerical examination of shear banding and simple shear non-coaxial flow rules. Philos. Mag. 2006, 86, 3425–3452. [Google Scholar] [CrossRef]
  15. Aharonov, E.; Sparks, D. Stick-slip motion in simulated granular layers. J. Geophys. Res. Solid Earth 2004, 109. [Google Scholar] [CrossRef]
  16. Tordesillas, A. Force chain buckling, unjamming transitions and shear banding in dense granular assemblies. Philos. Mag. 2007, 87, 4987–5016. [Google Scholar] [CrossRef]
  17. Chen, F.; Zhuang, Q.; Zhang, H. Mechanical analysis and force chain determination in granular materials using digital image correlation. Appl. Opt. 2016, 55, 4776–4783. [Google Scholar] [CrossRef]
  18. Muthuswamy, M.; Tordesillas, A. How do interparticle contact friction, packing density and degree of polydispersity affect force propagation in particulate assemblies? J. Stat. Mech. Theory Exp. 2006, 2006, P09003. [Google Scholar] [CrossRef]
  19. Xiu, T.-X.; Wang, W.; Liu, K.; Wang, Z.-Y.; Wei, D.-Z. Characteristics of force chains in frictional interface during abrasive flow machining based on discrete element method. Adv. Manuf. 2018, 6, 355–375. [Google Scholar] [CrossRef] [Green Version]
  20. Maeda, K.; Sakai, H.; Kondo, A.; Yamaguchi, T.; Fukuma, M.; Nukudani, E. Stress-chain based micromechanics of sand with grain shape effect. Granul. Matter 2010, 12, 499–505. [Google Scholar] [CrossRef]
  21. Park, K.H.; Jung, Y.H. Quantitative Detection of Contact Force Chains in a Model Particle Assembly Using Digital RGB Photoelastic Measurements. KSCE J. Civ. Eng. 2019. accepted. [Google Scholar]
  22. Wakabayashi, T. Photo-elastic method for determination of stress in powdered mass. J. Phys. Soc. Japan 1950, 5, 383–385. [Google Scholar] [CrossRef]
  23. Dantu, P. Contribution à l’étude mécanique et géométrique des milieux pulvérulents. In Proceedings of the 4th ICSMFE, London, UK, 12–24 August 1957. [Google Scholar]
  24. Drescher, B.A. Photoelastic verification of a mechanical model for the flow of a granular material. J. Mech. Phys. Solids 1972, 20, 337–340. [Google Scholar] [CrossRef]
  25. Liu, C.; Nagel, S.R.; Schecter, D.A.; Coppersmith, S.N.; Majumdar, S.; Narayan, O.; Witten, T.A. Force fluctuations in bead packs. Science (80-.) 1995, 269, 513–515. [Google Scholar] [CrossRef]
  26. Howell, D.; Behringer, R.P.; Veje, C. Stress fluctuations in a 2D granular Couette experiment: A continuous transition. Phys. Rev. Lett. 1999, 82, 5241. [Google Scholar] [CrossRef]
  27. Hayman, N.W.; Ducloué, L.; Foco, K.L.; Daniels, K.E. Granular Controls on Periodicity of Stick-Slip Events: Kinematics and Force-Chains in an Experimental Fault. Pure Appl. Geophys. 2011, 168, 2239–2257. [Google Scholar] [CrossRef] [Green Version]
  28. Daniels, K.E.; Kollmer, J.E.; Puckett, J.G. Photoelastic force measurements in granular materials. Rev. Sci. Instrum. 2017, 88. [Google Scholar] [CrossRef]
  29. Ajovalasit, A.; Petrucci, G. Analisi automatica delle frange fotoelastiche in luce bianca. In Proceedings of the XVIII AIAS Conference; Istituto di Ingegneria Meccanica, Universitàdi Salerno: Salerno, Italy, 1990; pp. 395–407. [Google Scholar]
  30. Ajovalasit, A.; Barone, S.; Petrucci, G. Towards RGB photoelasticity: Full-field automated photoelasticity in white light. Exp. Mech. 1995, 35, 193–200. [Google Scholar] [CrossRef]
  31. Ajovalasit, A.; Petrucci, G.; Scafidi, M. RGB photoelasticity: Review and improvements. Strain 2010, 46, 137–147. [Google Scholar] [CrossRef]
  32. Ajovalasit, A.; Petrucci, G.; Scafidi, M. RGB photoelasticity applied to the analysis of membrane residual stress in glass. Meas. Sci. Technol. 2011, 23, 25601. [Google Scholar] [CrossRef]
  33. Byeon, B.-H.; Jung, Y.-H. Measurement of stress and displacement fields in particle assembly subjected to shallow foundation loading via photoelasticity technique. J. Korean Soc. Civ. Eng. 2013, 33, 1947–1955. [Google Scholar] [CrossRef]
  34. Cates, M.E.; Wittmer, J.P.; Bouchaud, J.-P.; Claudin, P. Jamming and static stress transmission in granular materials. Chaos An Interdiscip. J. Nonlinear Sci. 1999, 9, 511–522. [Google Scholar] [CrossRef] [PubMed]
  35. Blumenfeld, R. Stresses in isostatic granular systems and emergence of force chains. Phys. Rev. Lett. 2004, 93, 108301. [Google Scholar] [CrossRef] [PubMed]
  36. Josselin de Jong, G.D.; Verruijt, A. Etude Photo Elastique d’un Depilement de Disques. Cah. Grpe. Fr. Etud. Rheol 1969, 2, 73–86. [Google Scholar]
  37. Tordesillas, A.; Steer, C.A.H.; Walker, D.M. Force chain and contact cycle evolution in a dense granular material under shallow penetration. Nonlinear Process. Geophys. 2014, 21, 505–519. [Google Scholar] [CrossRef] [Green Version]
  38. Tordesillas, A.; Muthuswamy, M. On the modeling of confined buckling of force chains. J. Mech. Phys. Solids 2009, 57, 706–727. [Google Scholar] [CrossRef]
  39. Adrian, R.J. Particle-imaging techniques for experimental fluid mechanics. Annu. Rev. Fluid Mech. 1991, 23, 261–304. [Google Scholar] [CrossRef]
  40. Kwak, T.Y.; Woo, S.I.; Kim, J.; Chung, C.-K. Model test assessment of the generation of underground cavities and ground cave-ins by damaged sewer pipes. Soils Found. 2019. [Google Scholar] [CrossRef]
Figure 1. Cylindrical model particles with photoelastic sheets.
Applsci 09 04735 g001
Figure 2. Detection of changes in fringe order patterns of a single particle according to particle force (N).
Applsci 09 04735 g002
Figure 3. Testing apparatus: (a) loading frame; (b) reflective polariscope.
Applsci 09 04735 g003
Figure 4. Stacked particle assemblies in a frame: (a) Uniform structure assembly with 10-mm diameter particles; (b) assembly with 10-mm diameter particles overlying 20-mm particles and with structural imperfections.
Applsci 09 04735 g004
Figure 5. Typical photoelastic images during: (a) uniaxial loading with a uniform structure, F = 2000 N; (b) uniaxial loading with imperfections, F = 2000 N; (c) shallow foundation loading with a uniform structure, F = 400 N; (d) shallow foundation loading with imperfections, F = 400 N.
Applsci 09 04735 g005
Figure 6. Load–displacement curves for UU and UI subjected to uniaxial loading: (a) overall data; (b) selected data for comparison.
Applsci 09 04735 g006
Figure 7. Contact force chains detected by red, green, and blue (RGB) photoelastic digital image analysis during uniaxial loading of a uniform structure: (a) before loading; (b) F = 500 N; (c) F = 1000 N; (d) F = 1500 N; (e) F = 2000 N;(f) F = 2500 N; (g) F = 3000 N; (h) F = 4000 N. Primary contact force chains are marked as red circles, particles with forces <100 N are shown as black circles.
Applsci 09 04735 g007
Figure 8. Contact force chains detected by RGB photoelastic digital image analysis during uniaxial loading of an imperfection structure: (a) before loading; (b) F = 500 N; (c) F = 1000 N; (d) F = 1500 N; (e) F = 2000 N; (f) F = 2500 N; (g) F = 3000 N; (h) F = 4000 N.
Applsci 09 04735 g008
Figure 9. Changes in particle forces during load tests: (a) average particle force in the overall assembly; (b) sum of the particle force in the overall assembly; (c) average particle force in the main contact force chains; (d) frequency of the particles in the main contact force chains; (e) sum of the particle force in the main contact force chains.
Applsci 09 04735 g009aApplsci 09 04735 g009b
Figure 10. Load–displacement curves for SU and SI under shallow foundation loading: (a) uniform structure; (b) structure with imperfections; (c) selected data for comparison.
Applsci 09 04735 g010
Figure 11. Changes in work during loading.
Applsci 09 04735 g011
Figure 12. Contact force chains detected by RGB photoelastic digital image analysis during shallow foundation loading: (a) before loading; (b) F = 200 N, d = 5.08 mm; (c) F = 400 N, d = 6.3 mm; (d) F = 600 N, d = 7.21 mm; (e) F = 450 N, d = 7.52 mm; (f) F = 200 N, d = 7.78 mm; (g) F = 3500 N, d = 8.98 mm; (h) F = 20 N, d = 9.81 mm.
Applsci 09 04735 g012
Figure 13. Contact force chains detected by RGB photoelastic digital image analysis during shallow foundation loading with imperfections: (a) before loading; (b) F = 100 N, d = 2.57 mm; (c) F = 200 N, d = 3.22 mm; (d) F = 300 N, d = 4.00 mm; (e) F = 400 N, d = 4.96 mm; (f) F = 450 N, d = 5.29 mm; (g) F = 370 N, d = 5.83 mm; (h) F = 170 N, d = 7.81 mm.
Applsci 09 04735 g013
Figure 14. Evolution of structural imperfections under shallow foundation loading: (a) 0 mm (Figure 13a); (b) 3.22 mm (Figure 13c); (c) 4.96 mm (Figure 13e); (d) 5.83 mm (Figure 13g).
Applsci 09 04735 g014aApplsci 09 04735 g014b
Figure 15. Evolution of imperfections with displacement vectors resulting from particle image velocimetry (PIV) for structures with imperfections under shallow foundation loading: (a) 0–2.57 mm (Figure 13a,b), (b) 3.22–4.00 mm (Figure 13c,d), (c) 4.96–5.29 mm (Figure 13e,f), (d) 5.83–7.81 mm (Figure 13g,h).
Applsci 09 04735 g015aApplsci 09 04735 g015b
Table 1. Test loading and packing (structural) conditions.
Test IDLoading ConditionPacking ConditionNo. of Repetitions
UUUniaxial (U)Uniform structure
w/o imperfection (U)
3
UIStructure
w/ imperfections (I)
2
SUShallow foundation (S)Uniform structure
w/o imperfection (U)
3
SIStructure
w/ imperfections (I)
3
Table 2. Summary of quantitative detection of granular assemblies under shallow foundations.
Test ID: SUImages
(a)(b)(c)(d)(e)(f)(g)(h)
Axial load (N)020040060045020035020
Displacement (mm)05.086.37.217.527.788.989.81
Average particle force
in overall assembly (N)
3333364037333533
Particle frequency
in overall assembly
2,9102,8832,8682,8812,8302,8692,8832,934
Total force
in overall assembly
96,03095,139103,248115,240104,71094,677100,90596,822
Average particle force in the main force chain
(N)
-136127127130130133146
Particle frequency
in the main force chain
-44109186139557738
Total force
in the main force chain
-5,98413,84323,62218,0707,15010,2415,548
Test ID: SI(a)(b)(c)(d)(e)(f)(g)(h)
Axial load (N)0100200300400450370170
Displacement (mm)02.573.2244.965.295.837.81
Average particle force
in overall assembly (N)
3232313033343232
Particle frequency in
overall assembly
28872878281327202752277127652828
Total force
in overall assembly
92,38492,09687,20381,60090,81694,21488,48090,496
Average particle force
in the main force chain (N)
-123124130129130129132
Particle frequency
in the main force chain
-34587511414110255
Total force
in the main force chain
-41827192975014,70618,33013,1587260

