A Review of Neurotransmitters Sensing Methods for Neuro-Engineering Research

 ,
,  and
and
Abstract
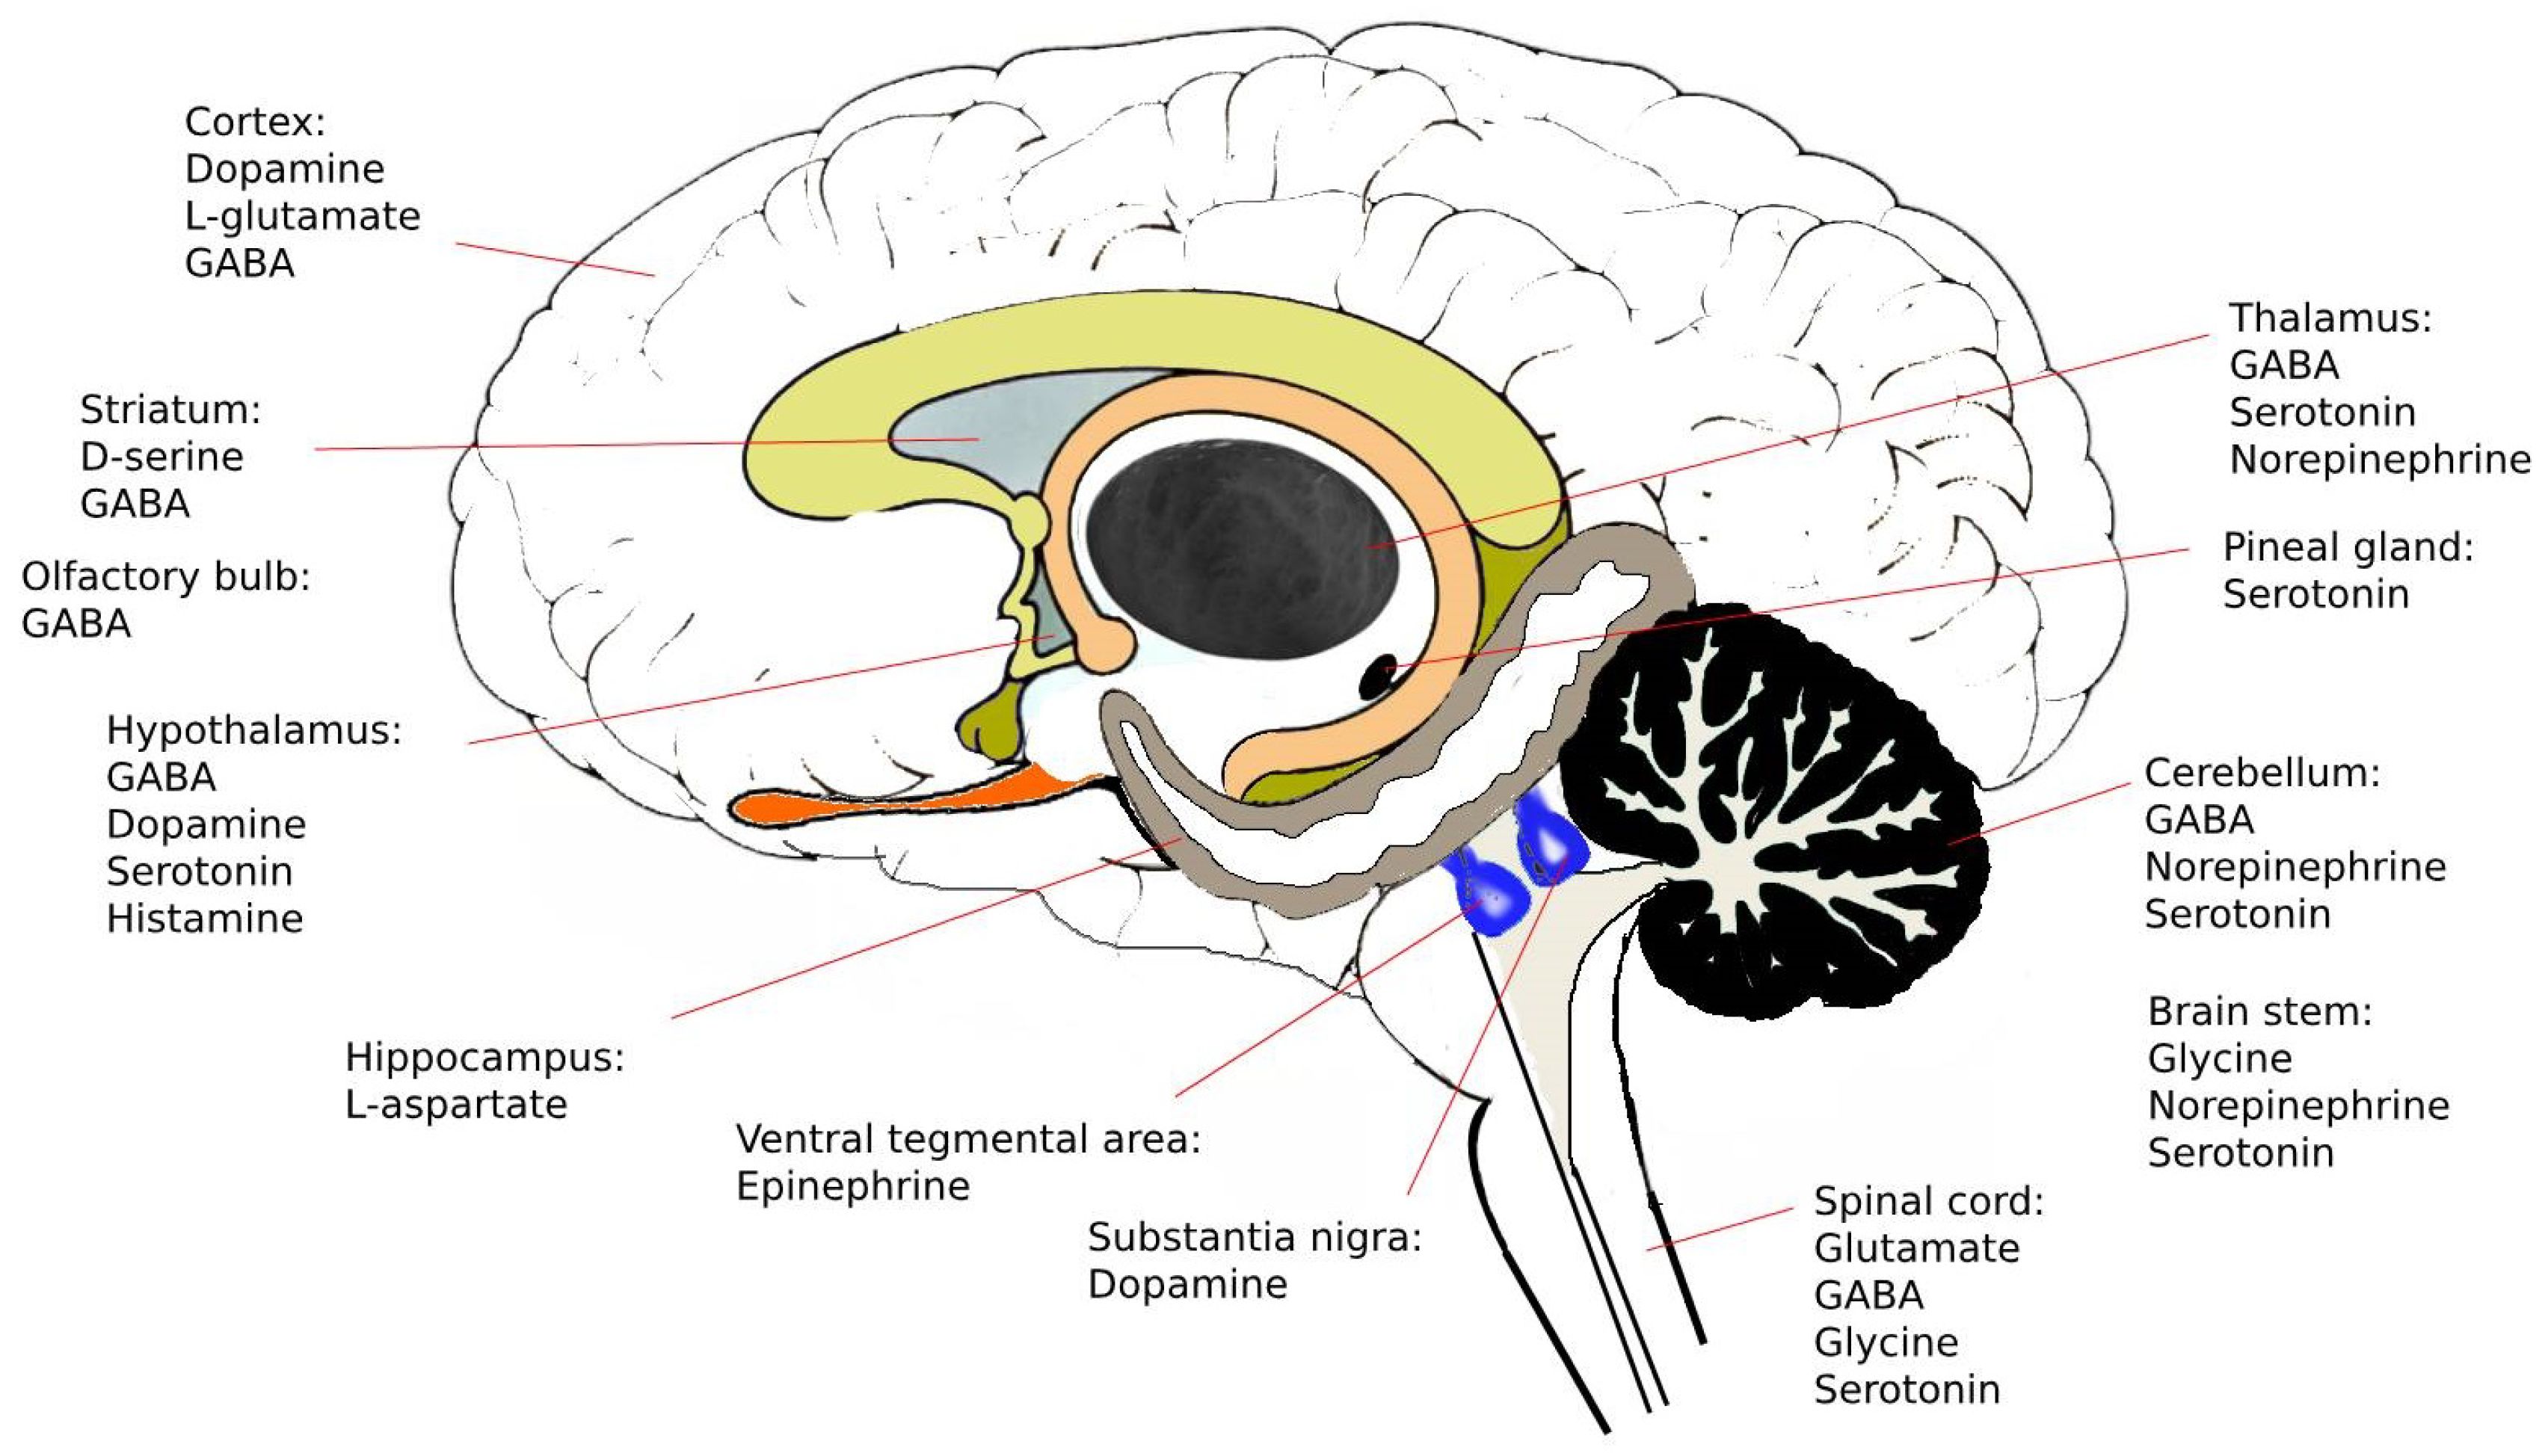
1. Introduction
- It must be synthesized and released by the same neuron and stocked at the presynaptic terminal;
- Its release induces a specific behavior on the postsynaptic neuron;
- Exogenous administration must generate the same effect;
- Its induced action on the postsynaptic cell can be stopped by a specific mechanism.
1.1. Amino-Acids Neurotransmitters
1.1.1. Glutamate
1.1.2. L-Aspartate
1.1.3. Gamma-Aminobutyric Acid (GABA)
- GABA initially enables an excitatory effect on neurons due to the expression of transporters.
- Glutamategic synapses are formed after the GABAergic neurons.
- GABA and glutamate excitatory action enables oscillation of intracellular calcium that modulates synapse formation.
1.1.4. Glycine
1.1.5. D-Serine
1.2. Monoamine Neurotransmitters
1.2.1. Dopamine
1.2.2. Norepinephrine and Epinephrine
1.2.3. Serotonin
1.2.4. Histamine
1.3. Other Chemical Substances
1.4. Concluding Remarks on Neurotransmitters
2. Neurotransmitter Detection Methods
2.1. Nuclear Medicine Tomographic Imaging
2.1.1. Positron Emission Tomography (PET)
2.1.2. Single-Photon Emission Computed Tomography (SPECT)
2.2. Optical Sensing Techniques
2.2.1. Surface-Enhanced Raman Spectroscopy (SERS)
2.2.2. Fluorescence
2.2.3. Förster Resonance Energy Transfer (FRET) and Photoinduced Electron Transfer (PIET)
2.2.4. Chemiluminescence
2.2.5. Optical Fiber Biosensing
2.2.6. Colorimetry
2.3. Electrochemistry
2.3.1. Fast-Scan Cyclic Voltammetry (FSCV)
2.3.2. Amperometry
2.4. High Performance Liquid Chromatography (HPLC)
2.5. Microdialysis
2.6. Other Detection Techniques
Tandem Mass Spectrometry
3. Neurotransmitter Detection Techniques’ Guidelines
4. Conclusions
Author Contributions
Funding
Acknowledgments
Conflicts of Interest
References
- Wu, F.; Yu, P.; Mao, L. Analytical and Quantitative in Vivo Monitoring of Brain Neurochemistry by Electrochemical and Imaging Approaches. ACS Omega 2018, 3, 13267–13274. [Google Scholar] [CrossRef] [PubMed]
- Shariatgorji, M.; Nilsson, A.; Goodwin, R.J.; Källback, P.; Schintu, N.; Zhang, X.; Crossman, A.R.; Bezard, E.; Svenningsson, P.; Andren, P.E. Direct targeted quantitative molecular imaging of neurotransmitters in brain tissue sections. Neuron 2014, 84, 697–707. [Google Scholar] [CrossRef] [PubMed]
- Cornett, D.S.; Reyzer, M.L.; Chaurand, P.; Caprioli, R.M. MALDI imaging mass spectrometry: Molecular snapshots of biochemical systems. Nat. Methods 2007, 4, 828. [Google Scholar] [CrossRef] [PubMed]
- Dey, N.; Ali, A.; Podder, S.; Majumdar, S.; Nandi, D.; Bhattacharya, S. Dual-Mode Optical Sensing of Histamine at Nanomolar Concentrations in Complex Biological Fluids and Living Cells. Chem.–A Eur. J. 2017, 23, 11891–11897. [Google Scholar] [CrossRef]
- Finnema, S.J.; Scheinin, M.; Shahid, M.; Lehto, J.; Borroni, E.; Bang-Andersen, B.; Sallinen, J.; Wong, E.; Farde, L.; Halldin, C.; et al. Application of cross-species PET imaging to assess neurotransmitter release in brain. Psychopharmacology 2015, 232, 4129–4157. [Google Scholar] [CrossRef]
- Bailey, D.; Pichler, B.; Gückel, B.; Barthel, H.; Beer, A.; Botnar, R.; Gillies, R.; Goh, V.; Gotthardt, M.; Hicks, R.; et al. Combined PET/MRI: From status quo to status go. summary report of the fifth international workshop on PET/MR imaging; February 15–19, 2016; Tübingen, Germany. Mol. Imaging Biol. 2016, 18, 637–650. [Google Scholar] [CrossRef]
- Sanghavi, B.J.; Wolfbeis, O.S.; Hirsch, T.; Swami, N.S. Nanomaterial-based electrochemical sensing of neurological drugs and neurotransmitters. Microchim. Acta 2015, 182, 1–41. [Google Scholar] [CrossRef]
- Ghasemi, F.; Hormozi-Nezhad, M.R.; Mahmoudi, M. Identification of catecholamine neurotransmitters using fluorescence sensor array. Anal. Chim. Acta 2016, 917, 85–92. [Google Scholar] [CrossRef]
- Mirzaei, M.; Sawan, M. Microelectronics-based biosensors dedicated to the detection of neurotransmitters: A review. Sensors 2014, 14, 17981–18008. [Google Scholar] [CrossRef]
- Soleymani, J. Advanced materials for optical sensing and biosensing of neurotransmitters. TrAC Trends Anal. Chem. 2015, 72, 27–44. [Google Scholar] [CrossRef]
- Özel, R.E.; Hayat, A.; Andreescu, S. Recent developments in electrochemical sensors for the detection of neurotransmitters for applications in biomedicine. Anal. Lett. 2015, 48, 1044–1069. [Google Scholar] [CrossRef] [PubMed]
- Şanlı, N.; Tague, S.E.; Lunte, C. Analysis of amino acid neurotransmitters from rat and mouse spinal cords by liquid chromatography with fluorescence detection. J. Pharm. Biomed. Anal. 2015, 107, 217–222. [Google Scholar] [CrossRef] [PubMed]
- Thal, L.B.; Bailey, D.M.; Kovtun, O.; Rosenthal, S.J. Quantum dot toolbox in membrane neurotransmitter transporter research. In Chemical and Synthetic Approaches in Membrane Biology; Springer: New York, NY, USA, 2017; pp. 219–230. [Google Scholar]
- Evtugyn, G.A.; Hianik, T.; Nikoleli, G.P.; Nikolelis, D.P. Biosensors for Detection of Neurotransmitters and Neurodegenerative Related Diseases. Front. Clin. Drug Res.-CNS Neurol. Disord. 2017, 5, 184. [Google Scholar]
- Kandel, E.R.; Schwartz, J.H.; Jessell, T.M.; Siegelbaum, S.A.; Hudspeth, A.J. Principles of Neural Science; McGraw-hill: New York, NY, USA, 2000; Volume 4. [Google Scholar]
- Kovács, G.L. The Endocrine Brain: Pathophysiological Role of Neuropeptide-Neurotransmitter Interactions. EJIFCC 2004, 15, 107. [Google Scholar]
- Sapolsky, R. Biology and Human Behavior: The Neurological Origins of Individuality; Great Courses: Chantilly, VA, USA, 2006. [Google Scholar]
- Shepherd, G.M. The Synaptic Organization of the Brain; Oxford University Press: Oxford, UK, 2003. [Google Scholar]
- Sanes, D.H.; Reh, T.A.; Harris, W.A. Development of the Nervous System; Academic Press: Cambridge, MA, USA, 2011. [Google Scholar]
- Malenka, R.C.; Bear, M.F. LTP and LTD: An embarrassment of riches. Neuron 2004, 44, 5–21. [Google Scholar] [CrossRef]
- Araque, A.; Parpura, V.; Sanzgiri, R.P.; Haydon, P.G. Tripartite synapses: Glia, the unacknowledged partner. Trends Neurosci. 1999, 22, 208–215. [Google Scholar] [CrossRef]
- Fields, R.D.; Stevens-Graham, B. New insights into neuron-glia communication. Science 2002, 298, 556–562. [Google Scholar] [CrossRef]
- Bradford, H. Glutamate, GABA and epilepsy. Prog. Neurobiol. 1995, 47, 477–511. [Google Scholar] [CrossRef]
- Tanaka, K.; Watase, K.; Manabe, T.; Yamada, K.; Watanabe, M.; Takahashi, K.; Iwama, H.; Nishikawa, T.; Ichihara, N.; Kikuchi, T.; et al. Epilepsy and exacerbation of brain injury in mice lacking the glutamate transporter GLT-1. Science 1997, 276, 1699–1702. [Google Scholar] [CrossRef]
- Chapman, A.G. Glutamate and epilepsy. J. Nutr. 2000, 130, 1043S–1045S. [Google Scholar] [CrossRef]
- Moghaddam, B. Bringing order to the glutamate chaos in schizophrenia. Neuron 2003, 40, 881–884. [Google Scholar] [CrossRef]
- Nadler, J.V. Aspartate release and signalling in the hippocampus. Neurochem. Res. 2011, 36, 668–676. [Google Scholar] [CrossRef] [PubMed]
- Cavallero, A.; Marte, A.; Fedele, E. l-Aspartate as an amino acid neurotransmitter: Mechanisms of the depolarization-induced release from cerebrocortical synaptosomes. J. Neurochem. 2009, 110, 924–934. [Google Scholar] [CrossRef] [PubMed]
- Baughman, R.W.; Gilbert, C.D. Aspartate and glutamate as possible neurotransmitters in the visual cortex. J. Neurosci. 1981, 1, 427–439. [Google Scholar] [CrossRef] [PubMed]
- Baughman, R.W.; Gilbert, C.D. Aspartate and glutamate as possible neurotransmitters of cells in layer 6 of the visual cortex. Nature 1980, 287, 848–850. [Google Scholar] [CrossRef]
- Kimura, H.; Okamoto, K.; Sakai, Y. Pharmacological evidence for L-aspartate as the neurotransmitter of cerebellar climbing fibres in the guinea-pig. J. Physiol. 1985, 365, 103–119. [Google Scholar] [CrossRef]
- Wiklund, L.; Toggenburger, G.; Cuénod, M. Aspartate: Possible neurotransmitter in cerebellar climbing fibers. Science 1982, 216, 78–80. [Google Scholar] [CrossRef]
- Bradford, S.; Nadler, J. Aspartate release from rat hippocampal synaptosomes. Neuroscience 2004, 128, 751–765. [Google Scholar] [CrossRef]
- Girault, J.A.; Barbeito, L.; Spampinato, U.; Gozlan, H.; Glowinski, J.; Besson, M.J. In vivo release of endogenous amino acids from the rat striatum: Further evidence for a role of glutamate and aspartate in corticostriatal neurotransmission. J. Neurochem. 1986, 47, 98–106. [Google Scholar] [CrossRef]
- Lada, M.W.; Vickroy, T.W.; Kennedy, R.T. Evidence for neuronal origin and metabotropic receptor-mediated regulation of extracellular glutamate and aspartate in rat striatum in vivo following electrical stimulation of the prefrontal cortex. J. Neurochem. 1998, 70, 617–625. [Google Scholar] [CrossRef]
- Young, A.; Bradford, H. Excitatory amino acid neurotransmitters in the corticostriate pathway: Studies using intracerebral microdialysis in vivo. J. Neurochem. 1986, 47, 1399–1404. [Google Scholar] [CrossRef] [PubMed]
- Maura, G.; Carbone, R.; Raiteri, M. Aspartate-releasing nerve terminals in rat striatum possess D-2 dopamine receptors mediating inhibition of release. J. Pharmacol. Exp. Ther. 1989, 251, 1142–1146. [Google Scholar] [PubMed]
- Ben-Ari, Y. Excitatory actions of gaba during development: The nature of the nurture. Nat. Rev. Neurosci. 2002, 3, 728–739. [Google Scholar] [CrossRef] [PubMed]
- Cancedda, L.; Fiumelli, H.; Chen, K.; Poo, M.M. Excitatory GABA action is essential for morphological maturation of cortical neurons in vivo. J. Neurosci. 2007, 27, 5224–5235. [Google Scholar] [CrossRef] [PubMed]
- Bowery, N.; Smart, T. GABA and glycine as neurotransmitters: A brief history. Br. J. Pharmacol. 2006, 147, S109–S119. [Google Scholar] [CrossRef] [PubMed]
- Hernandes, M.S.; Troncone, L.R. Glycine as a neurotransmitter in the forebrain: A short review. J. Neural Transm. 2009, 116, 1551–1560. [Google Scholar] [CrossRef]
- Gundersen, R.; Vaagenes, P.; Breivik, T.; Fonnum, F.; Opstad, P. Glycine—An important neurotransmitter and cytoprotective agent. Acta Anaesthesiol. Scand. 2005, 49, 1108–1116. [Google Scholar] [CrossRef] [PubMed]
- Cummings, K.A.; Popescu, G.K. Glycine-dependent activation of NMDA receptors. J. Gen. Physiol. 2015, 145, 513–527. [Google Scholar] [CrossRef]
- Betz, H.; Laube, B. Glycine receptors: Recent insights into their structural organization and functional diversity. J. Neurochem. 2006, 97, 1600–1610. [Google Scholar] [CrossRef]
- Mustafa, A.K.; Kim, P.M.; Snyder, S.H. D-Serine as a putative glial neurotransmitter. Neuron Glia Biol. 2004, 1, 275–281. [Google Scholar] [CrossRef][Green Version]
- Snyder, S.H.; Kim, P.M. D-amino acids as putative neurotransmitters: Focus on D-serine. Neurochem. Res. 2000, 25, 553–560. [Google Scholar] [CrossRef] [PubMed]
- Wolosker, H.; Dumin, E.; Balan, L.; Foltyn, V.N. D-amino acids in the brain: D-serine in neurotransmission and neurodegeneration. FEBS J. 2008, 275, 3514–3526. [Google Scholar] [CrossRef] [PubMed]
- Miller, R.F. D-Serine as a glial modulator of nerve cells. Glia 2004, 47, 275–283. [Google Scholar] [CrossRef] [PubMed]
- Schell, M.J.; Molliver, M.E.; Snyder, S.H. D-serine, an endogenous synaptic modulator: Localization to astrocytes and glutamate-stimulated release. Proc. Natl. Acad. Sci. USA 1995, 92, 3948–3952. [Google Scholar] [CrossRef] [PubMed]
- Heresco-Levy, U.; Javitt, D.C.; Ebstein, R.; Vass, A.; Lichtenberg, P.; Bar, G.; Catinari, S.; Ermilov, M. D-serine efficacy as add-on pharmacotherapy to risperidone and olanzapine for treatment-refractory schizophrenia. Biol. Psychiatry 2005, 57, 577–585. [Google Scholar] [CrossRef]
- Kantrowitz, J.T.; Malhotra, A.K.; Cornblatt, B.; Silipo, G.; Balla, A.; Suckow, R.F.; D’Souza, C.; Saksa, J.; Woods, S.W.; Javitt, D.C. High dose D-serine in the treatment of schizophrenia. Schizophr. Res. 2010, 121, 125–130. [Google Scholar] [CrossRef]
- Björklund, A.; Dunnett, S.B. Dopamine neuron systems in the brain: An update. Trends Neurosci. 2007, 30, 194–202. [Google Scholar] [CrossRef]
- Wise, R.A. Dopamine, learning and motivation. Nat. Rev. Neurosci. 2004, 5, 483–494. [Google Scholar] [CrossRef]
- Meisenzahl, E.; Schmitt, G.; Scheuerecker, J.; Möller, H.J. The role of dopamine for the pathophysiology of schizophrenia. Int. Rev. Psychiatry 2007, 19, 337–345. [Google Scholar] [CrossRef]
- Howes, O.D.; Kapur, S. The dopamine hypothesis of schizophrenia: Version III—the final common pathway. Schizophr. Bull. 2009, 35, 549–562. [Google Scholar] [CrossRef]
- Silverberg, A.B.; Shah, S.D.; Haymond, M.W.; Cryer, P.E. Norepinephrine: Hormone and neurotransmitter in man. Am. J. Physiol.-Endocrinol. Metab. 1978, 234, E252. [Google Scholar] [CrossRef] [PubMed]
- Purves, D.; Augustine, G.J.; Fitzpatrick, D.; Hall, W.; LaMantia, A.; McNamara, J.; White, L. Neuroscience Third Edition; Sinauer Associates: Sunderland, MA, USA, 2004; pp. 129–165. [Google Scholar]
- Moret, C.; Briley, M. The importance of norepinephrine in depression. Neuropsychiatr. Disease Treat. 2011, 7, 9. [Google Scholar]
- Tanaka, M.; Yoshida, M.; Emoto, H.; Ishii, H. Noradrenaline systems in the hypothalamus, amygdala and locus coeruleus are involved in the provocation of anxiety: Basic studies. Eur. J. Pharmacol. 2000, 405, 397–406. [Google Scholar] [CrossRef]
- Rhoadesand, R.; Bell, D. Medical Physiology: Principles for Clinical Medicine; Lippincott Williams & Wilkins: Philadelphia, PA, USA, 2009. [Google Scholar]
- Khurana, I. Essentials of Medical Physiology; Elsevier: Intia, India, 2008. [Google Scholar]
- Lucki, I. The spectrum of behaviors influenced by serotonin. Biol. Psychiatry 1998, 44, 151–162. [Google Scholar] [CrossRef]
- Vaswani, M.; Linda, F.K.; Ramesh, S. Role of selective serotonin reuptake inhibitors in psychiatric disorders: A comprehensive review. Prog. Neuro-Psychopharmacol. Biol. Psychiatry 2003, 27, 85–102. [Google Scholar] [CrossRef]
- Stahl, S.M. Mechanism of action of serotonin selective reuptake inhibitors: Serotonin receptors and pathways mediate therapeutic effects and side effects. J. Affect. Disord. 1998, 51, 215–235. [Google Scholar] [CrossRef]
- Meltzer, H.Y. Clinical studies on the mechanism of action of clozapine: The dopamine-serotonin hypothesis of schizophrenia. Psychopharmacology 1989, 99, S18–S27. [Google Scholar] [CrossRef]
- Haas, H.; Panula, P. The role of histamine and the tuberomamillary nucleus in the nervous system. Nat. Rev. Neurosci. 2003, 4, 121–130. [Google Scholar] [CrossRef]
- Fernández-Novoa, L.; Cacabelos, R. Histamine function in brain disorders. Behav. Brain Res. 2001, 124, 213–233. [Google Scholar] [CrossRef]
- Yokoyama, H. The role of central histaminergic neuron system as an anticonvulsive mechanism in developing brain. Brain Dev. 2001, 23, 542–547. [Google Scholar] [CrossRef]
- Tansey, E. Henry Dale and the discovery of acetylcholine. C. R. Biol. 2006, 329, 419–425. [Google Scholar] [CrossRef] [PubMed]
- Perry, E.; Walker, M.; Grace, J.; Perry, R. Acetylcholine in mind: A neurotransmitter correlate of consciousness? Trends Neurosci. 1999, 22, 273–280. [Google Scholar] [CrossRef]
- Ferman, T.J.; Boeve, B.F. Dementia with Lewy bodies. Neurol. Clin. 2002, 25, 741–760. [Google Scholar] [CrossRef] [PubMed]
- Marrosu, F.; Portas, C.; Mascia, M.S.; Casu, M.A.; Fà, M.; Giagheddu, M.; Imperato, A.; Gessa, G.L. Microdialysis measurement of cortical and hippocampal acetylcholine release during sleep-wake cycle in freely moving cats. Brain Res. 1995, 671, 329–332. [Google Scholar] [CrossRef]
- Burnstock, G. Historical review: ATP as a neurotransmitter. Trends Pharmacol. Sci. 2006, 27, 166–176. [Google Scholar] [CrossRef] [PubMed]
- Mustafa, A.K.; Gadalla, M.M.; Snyder, S.H. Signaling by gasotransmitters. Sci. Signal. 2009, 2, re2. [Google Scholar] [CrossRef] [PubMed]
- Reis, W.; Biancardi, V.; Zhou, Y.; Stern, J. Carbon monoxide excitatory effect in vasopressin neurons of heart failure rats involves nitric oxide/GABA signaling (686.24). FASEB J. 2014, 28, 686.24. [Google Scholar]
- Cirino, G.; Vellecco, V.; Bucci, M. Nitric oxide and hydrogen sulfide: The gasotransmitter paradigm of the vascular system. Br. J. Pharmacol. 2017, 174, 4021–4031. [Google Scholar] [CrossRef]
- Wang, R. Hydrogen sulfide: The third gasotransmitter in biology and medicine. Antioxid. Redox Signal. 2010, 12, 1061–1064. [Google Scholar] [CrossRef]
- Bowser, M.T.; Kennedy, R.T. In vivomonitoring of amine neurotransmitters using microdialysis with on-line capillary electrophoresis. Electrophoresis 2001, 22, 3668–3676. [Google Scholar] [CrossRef]
- Ciriacks Klinker, C.; Bowser, M.T. 4-Fluoro-7-nitro-2, 1, 3-benzoxadiazole as a fluorogenic labeling reagent for the in vivo analysis of amino acid neurotransmitters using online microdialysis- capillary electrophoresis. Anal. Chem. 2007, 79, 8747–8754. [Google Scholar] [CrossRef] [PubMed]
- Shou, M.; Ferrario, C.R.; Schultz, K.N.; Robinson, T.E.; Kennedy, R.T. Monitoring dopamine in vivo by microdialysis sampling and on-line CE-laser-induced fluorescence. Anal. Chem. 2006, 78, 6717–6725. [Google Scholar] [CrossRef] [PubMed]
- Uutela, P.; Karhu, L.; Piepponen, P.; Käenmäki, M.; Ketola, R.A.; Kostiainen, R. Discovery of dopamine glucuronide in rat and mouse brain microdialysis samples using liquid chromatography tandem mass spectrometry. Anal. Chem. 2008, 81, 427–434. [Google Scholar] [CrossRef] [PubMed]
- Xu, H.; Wang, D.; Zhang, W.; Zhu, W.; Yamamoto, K.; Jin, L. Determination of isatin and monoamine neurotransmitters in rat brain with liquid chromatography using palladium hexacyanoferrate modified electrode. Anal. Chim. Acta 2006, 577, 207–213. [Google Scholar] [CrossRef]
- De Bundel, D.; Sarre, S.; Van Eeckhaut, A.; Smolders, I.; Michotte, Y. Critical evaluation of acetylcholine determination in rat brain microdialysates using ion-pair liquid chromatography with amperometric detection. Sensors 2008, 8, 5171–5185. [Google Scholar] [CrossRef]
- Yamamoto, K.; Sato, K.; Chikuma, T.; Kato, T. A highly sensitive and stable detection of acetylcholine by HPLC-osmium-horseradish peroxidase redox polymer electrode coated on a gold radial flow ring disk. Anal. Chim. Acta 2004, 521, 209–213. [Google Scholar] [CrossRef]
- Liu, Z.; Welin, M.; Bragee, B.; Nyberg, F. A high-recovery extraction procedure for quantitative analysis of substance P and opioid peptides in human cerebrospinal fluid. Peptides 2000, 21, 853–860. [Google Scholar] [CrossRef]
- Tatemoto, K. Neuropeptide Y: History and overview. In Neuropeptide Y and Related Peptides; Springer: Berlin/Heidelberg, Germany, 2004; pp. 1–21. [Google Scholar]
- Colmers, W.F.; El Bahh, B. Neuropeptide Y and epilepsy. Epilepsy Curr. 2003, 3, 53–58. [Google Scholar] [CrossRef][Green Version]
- Llaudet, E.; Hatz, S.; Droniou, M.; Dale, N. Microelectrode biosensor for real-time measurement of ATP in biological tissue. Anal. Chem. 2005, 77, 3267–3273. [Google Scholar] [CrossRef]
- Koh, W.C.A.; Rahman, M.A.; Choe, E.S.; Lee, D.K.; Shim, Y.B. A cytochrome c modified-conducting polymer microelectrode for monitoring in vivo changes in nitric oxide. Biosens. Bioelectron. 2008, 23, 1374–1381. [Google Scholar]
- Eto, K.; Ogasawara, M.; Umemura, K.; Nagai, Y.; Kimura, H. Hydrogen sulfide is produced in response to neuronal excitation. J. Neurosci. 2002, 22, 3386–3391. [Google Scholar] [CrossRef] [PubMed]
- Gazzaniga, M.; Ivry, R.; Mangun, G. Cognitive Neuroscience: The Biology of the Mind; WW Norton & Co.: New York, NY, USA, 1998. [Google Scholar]
- Huettel, S.A.; Song, A.W.; McCarthy, G. Functional Magnetic Resonance Imaging; Sinauer Associates: Sunderland, MA, USA, 2004; Volume 1. [Google Scholar]
- Drevets, W.C.; Price, J.C.; Kupfer, D.J.; Kinahan, P.E.; Lopresti, B.; Holt, D.; Mathis, C. PET measures of amphetamine-induced dopamine release in ventral versus dorsal striatum. Neuropsychopharmacology 1999, 21, 694–709. [Google Scholar] [CrossRef]
- Dewey, S.L.; Smith, G.S.; Logan, J.; Brodie, J.D.; Fowler, J.S.; Wolf, A.P. Striatal binding of the PET ligand 11C-raclopride is altered by drugs that modify synaptic dopamine levels. Synapse 1993, 13, 350–356. [Google Scholar] [CrossRef] [PubMed]
- Vollenweider, F.X.; Vontobel, P.; Hell, D.; Leenders, K.L. 5-HT modulation of dopamine release in basal ganglia in psilocybin-induced psychosis in man—A PET study with [11C] raclopride. Neuropsychopharmacology 1999, 20, 424–433. [Google Scholar] [CrossRef]
- Dewey, S.L.; Smith, G.S.; Logan, J.; Alexoff, D.; Ding, Y.S.; King, P.; Pappas, N.; Brodie, J.D.; Ashby, C.R. Serotonergic modulation of striatal dopamine measured with positron emission tomography (PET) and in vivo microdialysis. J. Neurosci. 1995, 15, 821–829. [Google Scholar] [CrossRef]
- Laruelle, M.; Abi-Dargham, A.; van Dyck, C.H.; Rosenblatt, W.; Zea-Ponce, Y.; Zoghbi, S.S.; Baldwin, R.M.; Charney, D.S.; Hoffer, P.B.; Kung, H.F.; et al. SPECT imaging of striatal dopamine release after amphetamine challenge. J. Nuclear Med. 1995, 36, 1182–1190. [Google Scholar]
- Laruelle, M.; Iyer, R.N.; Al-Tikriti, M.S.; Zea-Ponce, Y.; Malison, R.; Zoghbi, S.S.; Baldwin, R.M.; Kung, H.F.; Charney, D.S.; Hoffer, P.B.; et al. Microdialysis and SPECT measurements of amphetamine-induced dopamine release in nonhuman primates. Synapse 1997, 25, 1–14. [Google Scholar] [CrossRef]
- Knoll, G.F. Single-photon emission computed tomography. Proc. IEEE 1983, 71, 320–329. [Google Scholar] [CrossRef]
- Blackie, E.J.; Ru, E.C.L.; Etchegoin, P.G. Single-molecule surface-enhanced Raman spectroscopy of nonresonant molecules. J. Am. Chem. Soc. 2009, 131, 14466–14472. [Google Scholar] [CrossRef]
- Kneipp, K.; Wang, Y.; Kneipp, H.; Perelman, L.T.; Itzkan, I.; Dasari, R.R.; Feld, M.S. Single molecule detection using surface-enhanced Raman scattering (SERS). Phys. Rev. Lett. 1997, 78, 1667. [Google Scholar] [CrossRef]
- Tang, L.; Li, S.; Han, F.; Liu, L.; Xu, L.; Ma, W.; Kuang, H.; Li, A.; Wang, L.; Xu, C. SERS-active Au@ Ag nanorod dimers for ultrasensitive dopamine detection. Biosens. Bioelectron. 2015, 71, 7–12. [Google Scholar] [CrossRef] [PubMed]
- Dijkstra, R.J.; Scheenen, W.J.; Dam, N.; Roubos, E.W.; Ter Meulen, J. Monitoring neurotransmitter release using surface-enhanced Raman spectroscopy. J. Neurosci. Methods 2007, 159, 43–50. [Google Scholar] [CrossRef] [PubMed]
- Siek, M.; Kaminska, A.; Kelm, A.; Rolinski, T.; Holyst, R.; Opallo, M.; Niedziolka-Jonsson, J. Electrodeposition for preparation of efficient surface-enhanced Raman scattering-active silver nanoparticle substrates for neurotransmitter detection. Electrochim. Acta 2013, 89, 284–291. [Google Scholar] [CrossRef]
- Tiwari, V.S.; Khetani, A.; Monfared, A.M.T.; Smith, B.; Anis, H.; Trudeau, V.L. Detection of amino acid neurotransmitters by surface enhanced Raman scattering and hollow core photonic crystal fiber. In Proceedings Volume 8233, Reporters, Markers, Dyes, Nanoparticles, and Molecular Probes for Biomedical Applications IV; International Society for Optics and Photonics: Bellingham, WA, USA, 2012; p. 82330Q. [Google Scholar]
- De Benedetto, G.E.; Fico, D.; Pennetta, A.; Malitesta, C.; Nicolardi, G.; Lofrumento, D.D.; De Nuccio, F.; La Pesa, V. A rapid and simple method for the determination of 3, 4-dihydroxyphenylacetic acid, norepinephrine, dopamine, and serotonin in mouse brain homogenate by HPLC with fluorimetric detection. J. Pharm. Biomed. Anal. 2014, 98, 266–270. [Google Scholar] [CrossRef] [PubMed]
- Quay, W. Circadian rhythm in rat pineal serotonin and its modifications by estrous cycle and photoperiod. Gen. Comp. Endocrinol. 1963, 3, 473–479. [Google Scholar] [CrossRef]
- Davis, V.E.; Huff, J.; Brown, H. Determination of serotonin in tissues using an ion-exchange resin. Clin. Chim. Acta 1964, 9, 427–433. [Google Scholar] [CrossRef]
- Snyder, S.H.; Axelrod, J.; Zweig, M. A sensitive and specific fluorescence assay for tissue serotonin. Biochem. Pharmacol. 1965, 14, 831–835. [Google Scholar] [CrossRef]
- Maickel, R.P.; Cox, R.H.; Saillant, J.; Miller, F.P. A method for the determination of serotonin and norepinephrine in discrete areas of rat brain. Int. J. Neuropharmacol. 1968, 7, 275–281. [Google Scholar] [CrossRef]
- Das, M.L. A rapid, sensitive method for direct estimation of serotonin in whole blood. Biochem. Med. 1972, 6, 299–309. [Google Scholar] [CrossRef]
- Geeraerts, F.; Schimpfessel, L.; Crokaert, R. A simple routine-method to preserve and determine blood serotonin. Cell. Mol. Life Sci. 1974, 30, 837. [Google Scholar] [CrossRef]
- Flatmark, T.; Jacobsen, S.W.; Haavik, J. Fluorometric detection of tryptophan, 5-hydroxytryptophan, and 5-hydroxytryptamine (serotonin) in high-performance liquid chromatography. Anal. Biochem. 1980, 107, 71–74. [Google Scholar] [CrossRef]
- Peat, M.A.; Gibb, J.W. High-performance liquid chromatographic determination of indoleamines, dopamine, and norepinephrine in rat brain with fluorometric detection. Anal. Biochem. 1983, 128, 275–280. [Google Scholar] [CrossRef]
- Kruss, S.; Landry, M.P.; Vander Ende, E.; Lima, B.M.; Reuel, N.F.; Zhang, J.; Nelson, J.; Mu, B.; Hilmer, A.; Strano, M. Neurotransmitter detection using corona phase molecular recognition on fluorescent single-walled carbon nanotube sensors. J. Am. Chem. Soc. 2014, 136, 713–724. [Google Scholar] [CrossRef] [PubMed]
- Mann, F.; Herrmann, N.; Meyer, D.; Kruss, S. Tuning selectivity of fluorescent carbon nanotube-based neurotransmitter sensors. Sensors 2017, 17, 1521. [Google Scholar] [CrossRef]
- Day, R.N.; Periasamy, A.; Schaufele, F. Fluorescence resonance energy transfer microscopy of localized protein interactions in the living cell nucleus. Methods 2001, 25, 4–18. [Google Scholar] [CrossRef]
- Zadran, S.; Standley, S.; Wong, K.; Otiniano, E.; Amighi, A.; Baudry, M. Fluorescence resonance energy transfer (FRET)-based biosensors: Visualizing cellular dynamics and bioenergetics. Appl. Microbiol. Biotechnol. 2012, 96, 895–902. [Google Scholar] [CrossRef]
- Meyer, T.; Teruel, M.N. Fluorescence imaging of signaling networks. Trends Cell Biol. 2003, 13, 101–106. [Google Scholar] [CrossRef][Green Version]
- Hangauer, M.J.; Bertozzi, C.R. A FRET-Based Fluorogenic Phosphine for Live-Cell Imaging with the Staudinger Ligation. Angew. Chem. 2008, 120, 2428–2431. [Google Scholar] [CrossRef]
- Freeman, R.; Bahshi, L.; Finder, T.; Gill, R.; Willner, I. Competitive analysis of saccharides or dopamine by boronic acid-functionalized CdSe–ZnS quantum dots. Chem. Commun. 2009, 764–766. [Google Scholar] [CrossRef]
- Xiangzhao, A.; Qiang, M.; Xingguang, S. Nanosensor for dopamine and glutathione based on the quenching and recovery of the fluorescence of silica-coated quantum dots. Microchim. Acta 2013, 180, 269–277. [Google Scholar] [CrossRef]
- Lee, K.R.; Kang, I.J. Effects of dopamine concentration on energy transfer between dendrimer–QD and dye-labeled antibody. Ultramicroscopy 2009, 109, 894–898. [Google Scholar] [CrossRef] [PubMed]
- Medintz, I.L.; Stewart, M.H.; Trammell, S.A.; Susumu, K.; Delehanty, J.B.; Mei, B.C.; Melinger, J.S.; Blanco-Canosa, J.B.; Dawson, P.E.; Mattoussi, H. Quantum-dot/dopamine bioconjugates function as redox coupled assemblies for in vitro and intracellular pH sensing. Nat. Mater. 2010, 9, 676–684. [Google Scholar] [CrossRef] [PubMed]
- Clarke, S.J.; Hollmann, C.A.; Zhang, Z.; Suffern, D.; Bradforth, S.E.; Dimitrijevic, N.M.; Minarik, W.G.; Nadeau, J.L. Photophysics of dopamine-modified quantum dots and effects on biological systems. Nat. Mater. 2006, 5, 409–417. [Google Scholar] [CrossRef] [PubMed]
- Mu, Q.; Xu, H.; Li, Y.; Ma, S.; Zhong, X. Adenosine capped QDs based fluorescent sensor for detection of dopamine with high selectivity and sensitivity. Analyst 2014, 139, 93–98. [Google Scholar] [CrossRef]
- Zhao, J.; Zhao, L.; Lan, C.; Zhao, S. Graphene quantum dots as effective probes for label-free fluorescence detection of dopamine. Sens. Actuators B Chem. 2016, 223, 246–251. [Google Scholar] [CrossRef]
- Diaz-Diestra, D.; Thapa, B.; Beltran-Huarac, J.; Weiner, B.R.; Morell, G. L-cysteine capped ZnS: Mn quantum dots for room-temperature detection of dopamine with high sensitivity and selectivity. Biosens. Bioelectron. 2017, 87, 693–700. [Google Scholar] [CrossRef]
- Zhao, D.; Song, H.; Hao, L.; Liu, X.; Zhang, L.; Lv, Y. Luminescent ZnO quantum dots for sensitive and selective detection of dopamine. Talanta 2013, 107, 133–139. [Google Scholar] [CrossRef]
- Ankireddy, S.R.; Kim, J. Selective detection of dopamine in the presence of ascorbic acid via fluorescence quenching of InP/ZnS quantum dots. Int. J. Nanomed. 2015, 10, 113. [Google Scholar]
- Valizadeh, A.; Mikaeili, H.; Samiei, M.; Farkhani, S.M.; Zarghami, N.; Akbarzadeh, A.; Davaran, S. Quantum dots: Synthesis, bioapplications, and toxicity. Nanoscale Res. Lett. 2012, 7, 480. [Google Scholar] [CrossRef]
- Jiang, F.; Chen, D.; Li, R.; Wang, Y.; Zhang, G.; Li, S.; Zheng, J.; Huang, N.; Gu, Y.; Wang, C.; et al. Eco-friendly synthesis of size-controllable amine-functionalized graphene quantum dots with antimycoplasma properties. Nanoscale 2013, 5, 1137–1142. [Google Scholar] [CrossRef]
- Zhou, Y.; Qu, Z.B.; Zeng, Y.; Zhou, T.; Shi, G. A novel composite of graphene quantum dots and molecularly imprinted polymer for fluorescent detection of paranitrophenol. Biosens. Bioelectron. 2014, 52, 317–323. [Google Scholar] [CrossRef] [PubMed]
- Zhou, X.; Ma, P.; Wang, A.; Yu, C.; Qian, T.; Wu, S.; Shen, J. Dopamine fluorescent sensors based on polypyrrole/graphene quantum dots core/shell hybrids. Biosens. Bioelectron. 2015, 64, 404–410. [Google Scholar] [CrossRef] [PubMed]
- Ling, J.; Huang, C.Z. Energy transfer with gold nanoparticles for analytical applications in the fields of biochemical and pharmaceutical sciences. Anal. Methods 2010, 2, 1439–1447. [Google Scholar] [CrossRef]
- Tao, Y.; Lin, Y.; Ren, J.; Qu, X. A dual fluorometric and colorimetric sensor for dopamine based on BSA-stabilized Aunanoclusters. Biosens. Bioelectron. 2013, 42, 41–46. [Google Scholar] [CrossRef]
- Ellington, A.D.; Szostak, J.W. In vitro selection of RNA molecules that bind specific ligands. Nature 1990, 346, 818. [Google Scholar] [CrossRef]
- Walsh, R.; DeRosa, M.C. Retention of function in the DNA homolog of the RNA dopamine aptamer. Biochem. Biophys. Res. Commun. 2009, 388, 732–735. [Google Scholar] [CrossRef]
- Xu, J.; Li, Y.; Wang, L.; Huang, Y.; Liu, D.; Sun, R.; Luo, J.; Sun, C. A facile aptamer-based sensing strategy for dopamine through the fluorescence resonance energy transfer between rhodamine B and gold nanoparticles. Dyes Pigment. 2015, 123, 55–63. [Google Scholar] [CrossRef]
- Greene, L.A.; Rein, G. Release, storage and uptake of catecholamines by a clonal cell line of nerve growth factor (NGF) responsive pheochromocytoma cells. Brain Res. 1977, 129, 247–263. [Google Scholar] [CrossRef]
- Kobayashi, S.I.; Sekino, J.; Honda, K.; Imai, K. Application of high-performance liquid chromatography with a chemiluminescence detection system to determine catecholamines in urine. Anal. Biochem. 1981, 112, 99–104. [Google Scholar] [CrossRef]
- Ragab, G.H.; Nohta, H.; Zaitsu, K. Chemiluminescence determination of catecholamines in human blood plasma using 1, 2-bis (3-chlorophenyl) ethylenediamine as pre-column derivatizing reagent for liquid chromatography. Anal. Chim. Acta 2000, 403, 155–160. [Google Scholar] [CrossRef]
- Wang, S.; Du, L.; Wang, L.; Zhuang, H. Flow injection with inhibited chemiluminescence method for the determination of dopamine hydrochloride. Anal. Sci. 2004, 20, 315–317. [Google Scholar] [CrossRef] [PubMed]
- Nalewajko, E.; Ramírez, R.B.; Kojło, A. Determination of dopamine by flow-injection analysis coupled with luminol-hexacyanoferrate (III) chemiluminescence detection. J. Pharm. Biomed. Anal. 2004, 36, 219–223. [Google Scholar] [CrossRef] [PubMed]
- Yu, C.; Tang, Y.; Han, X.; Zheng, X. Sensitive assay for catecholamines in pharmaceutical samples and blood plasma using flow injection chemiluminescence analysis. Anal. Sci. 2006, 22, 25–28. [Google Scholar] [CrossRef] [PubMed][Green Version]
- Liu, Y.M.; Wang, C.Q.; Mu, H.B.; Cao, J.T.; Zheng, Y.L. Determination of catecholamines by CE with direct chemiluminescence detection. Electrophoresis 2007, 28, 1937–1941. [Google Scholar] [CrossRef] [PubMed]
- Wabaidur, S.M.; Alothman, Z.A.; Alam, S.M.; Lee, S.H. Flow injection–chemiluminescence determination of dopamine using potassium permanganate and formaldehyde system. Spectrochim. Acta Part A Mol. Biomol. Spectrosc. 2012, 96, 221–225. [Google Scholar] [CrossRef]
- Bezerra, V.S.; de Lima Filho, J.L.; Montenegro, M.C.B.; Araújo, A.N.; da Silva, V.L. Flow-injection amperometric determination of dopamine in pharmaceuticals using a polyphenol oxidase biosensor obtained from soursop pulp. J. Pharm. Biomed. Anal. 2003, 33, 1025–1031. [Google Scholar] [CrossRef]
- Chaurasia, C.S.; Chen, C.E.; Ashby, C.R. In vivo on-line HPLC-microdialysis: Simultaneous detection of monoamines and their metabolites in awake freely-moving rats. J. Pharm. Biomed. Anal. 1999, 19, 413–422. [Google Scholar] [CrossRef]
- Li, B.; Zhang, Z.; Jin, Y. Plant tissue-based chemiluminescence flow biosensor for determination of unbound dopamine in rabbit blood with on-line microdialysis sampling. Biosens. Bioelectron. 2002, 17, 585–589. [Google Scholar] [CrossRef]
- Leung, A.; Shankar, P.M.; Mutharasan, R. A review of fiber-optic biosensors. Sens. Actuators B Chem. 2007, 125, 688–703. [Google Scholar] [CrossRef]
- Buck, J.A. Fundamentals of Optical Fibers; John Wiley & Sons: Hoboken, NJ, USA, 2004. [Google Scholar]
- Marazuela, M.; Moreno-Bondi, M. Fiber-optic biosensors—An overview. Anal. Bioanal. Chem. 2002, 372, 664–682. [Google Scholar] [CrossRef]
- Wang, A.J.; Arnold, M.A. Dual-enzyme fiber-optic biosensor for glutamate based on reduced nicotinamide adenine dinucleotide luminescence. Anal. Chem. 1992, 64, 1051–1055. [Google Scholar] [CrossRef] [PubMed]
- Cordek, J.; Wang, X.; Tan, W. Direct immobilization of glutamate dehydrogenase on optical fiber probes for ultrasensitive glutamate detection. Anal. Chem. 1999, 71, 1529–1533. [Google Scholar] [CrossRef]
- Zibaii, M.; Latifi, H.; Asadollahi, A.; Bayat, A.H.; Dargahi, L.; Haghparast, A. Label Free Fiber Optic Apta-Biosensor for In-Vitro Detection of Dopamine. J. Lightwave Technol. 2016, 34, 4516–4524. [Google Scholar] [CrossRef]
- Lin, Y.; Chen, C.; Wang, C.; Pu, F.; Ren, J.; Qu, X. Silver nanoprobe for sensitive and selective colorimetric detection of dopamine via robust Ag–catechol interaction. Chem. Commun. 2011, 47, 1181–1183. [Google Scholar] [CrossRef] [PubMed]
- Kong, B.; Zhu, A.; Luo, Y.; Tian, Y.; Yu, Y.; Shi, G. Sensitive and selective colorimetric visualization of cerebral dopamine based on double molecular recognition. Angew. Chem. 2011, 123, 1877–1880. [Google Scholar] [CrossRef]
- Feng, J.J.; Guo, H.; Li, Y.F.; Wang, Y.H.; Chen, W.Y.; Wang, A.J. Single molecular functionalized gold nanoparticles for hydrogen-bonding recognition and colorimetric detection of dopamine with high sensitivity and selectivity. ACS Appl. Mater. Interfaces 2013, 5, 1226–1231. [Google Scholar] [CrossRef]
- Baron, R.; Zayats, M.; Willner, I. Dopamine-, L-DOPA-, adrenaline-, and noradrenaline-induced growth of Au nanoparticles: Assays for the detection of neurotransmitters and of tyrosinase activity. Anal. Chem. 2005, 77, 1566–1571. [Google Scholar] [CrossRef]
- Nezhad, M.R.H.; Tashkhourian, J.; Khodaveisi, J.; Khoshi, M.R. Simultaneous colorimetric determination of dopamine and ascorbic acid based on the surface plasmon resonance band of colloidal silver nanoparticles using artificial neural networks. Anal. Methods 2010, 2, 1263–1269. [Google Scholar] [CrossRef]
- Shang, L.; Dong, S. Detection of neurotransmitters by a light scattering technique based on seed-mediated growth of gold nanoparticles. Nanotechnology 2008, 19, 095502. [Google Scholar] [CrossRef]
- Wen, D.; Liu, W.; Herrmann, A.K.; Haubold, D.; Holzschuh, M.; Simon, F.; Eychmüller, A. Simple and Sensitive Colorimetric Detection of Dopamine Based on Assembly of Cyclodextrin-Modified Au Nanoparticles. Small 2016, 12, 2439–2442. [Google Scholar] [CrossRef]
- Chen, Z.; Zhang, C.; Zhou, T.; Ma, H. Gold nanoparticle based colorimetric probe for dopamine detection based on the interaction between dopamine and melamine. Microchim. Acta 2015, 182, 1003–1008. [Google Scholar] [CrossRef]
- Liu, J.M.; Wang, X.X.; Cui, M.L.; Lin, L.P.; Jiang, S.L.; Jiao, L.; Zhang, L.H. A promising non-aggregation colorimetric sensor of AuNRs–Ag+ for determination of dopamine. Sens. Actuators B Chem. 2013, 176, 97–102. [Google Scholar] [CrossRef]
- Zheng, Y.; Wang, Y.; Yang, X. Aptamer-based colorimetric biosensing of dopamine using unmodified gold nanoparticles. Sens. Actuators B Chem. 2011, 156, 95–99. [Google Scholar] [CrossRef]
- Yildirim, A.; Bayindir, M. Turn-on fluorescent dopamine sensing based on in situ formation of visible light emitting polydopamine nanoparticles. Anal. Chem. 2014, 86, 5508–5512. [Google Scholar] [CrossRef]
- Zhang, X.; Zhu, Y.; Li, X.; Guo, X.; Zhang, B.; Jia, X.; Dai, B. A simple, fast and low-cost turn-on fluorescence method for dopamine detection using in situ reaction. Anal. Chim. Acta 2016, 944, 51–56. [Google Scholar] [CrossRef]
- Wang, J. Analytical Electrochemistry; John Wiley & Sons: Hoboken, NJ, USA, 2006. [Google Scholar]
- Kissinger, P.T.; Hart, J.B.; Adams, R.N. Voltammetry in brain tissue—A new neurophysiological measurement. Brain Res. 1973, 55, 209–213. [Google Scholar] [CrossRef]
- Adams, R.N. Probing brain chemistry with electroanalytical techniques. Anal. Chem. 1976, 48, 1126A–1138A. [Google Scholar] [CrossRef]
- Lane, R.F.; Hubbard, A.T. Differential double pulse voltammetry at chemically modified platinum electrodes for in vivo determination of catechol amines. Anal. Chem. 1976, 48, 1287–1293. [Google Scholar] [CrossRef]
- Tse, D.C.; McCreery, R.L.; Adams, R.N. Potential oxidative pathways of brain catecholamines. J. Med. Chem. 1976, 19, 37–40. [Google Scholar] [CrossRef]
- Millar, J. In vivo detection of neurotransmitters with fast cyclic voltammetry. In Neurotransmitter Methods; Springer: Totowa, NJ, USA, 1997; pp. 251–266. [Google Scholar]
- Wightman, R.; Amatorh, C.; Engstrom, R.; Hale, P.; Kristensen, E.; Kuhr, W.; May, L. Real-time characterization of dopamine overflow and uptake in the rat striatum. Neuroscience 1988, 25, 513–523. [Google Scholar] [CrossRef]
- Jackson, B.P.; Dietz, S.M.; Wightman, R.M. Fast-scan cyclic voltammetry of 5-hydroxytryptamine. Anal. Chem. 1995, 67, 1115–1120. [Google Scholar] [CrossRef] [PubMed]
- John, C.E.; Jones, S.R. Fast scan cyclic voltammetry of dopamine and serotonin in mouse brain slices. In Electrochemical Methods for Neuroscience; CRC Press/Taylor & Francis: Boca Raton, FL, USA, 2007. [Google Scholar]
- Takmakov, P.; McKinney, C.J.; Carelli, R.M.; Wightman, R.M. Instrumentation for fast-scan cyclic voltammetry combined with electrophysiology for behavioral experiments in freely moving animals. Rev. Sci. Instrum. 2011, 82, 074302. [Google Scholar] [CrossRef] [PubMed]
- Phillips, P.E.; Wightman, R.M. Critical guidelines for validation of the selectivity of in-vivo chemical microsensors. TrAC Trends Anal. Chem. 2003, 22, 509–514. [Google Scholar] [CrossRef]
- Keithley, R.B.; Takmakov, P.; Bucher, E.S.; Belle, A.M.; Owesson-White, C.A.; Park, J.; Wightman, R.M. Higher sensitivity dopamine measurements with faster-scan cyclic voltammetry. Anal. Chem. 2011, 83, 3563–3571. [Google Scholar] [CrossRef]
- Heien, M.L.; Johnson, M.A.; Wightman, R.M. Resolving neurotransmitters detected by fast-scan cyclic voltammetry. Anal. Chem. 2004, 76, 5697–5704. [Google Scholar] [CrossRef]
- Bath, B.D.; Michael, D.J.; Trafton, B.J.; Joseph, J.D.; Runnels, P.L.; Wightman, R.M. Subsecond adsorption and desorption of dopamine at carbon-fiber microelectrodes. Anal. Chem. 2000, 72, 5994–6002. [Google Scholar] [CrossRef]
- Kuhr, W.G.; Wightman, R.M. Real-time measurement of dopamine release in rat brain. Brain Res. 1986, 381, 168–171. [Google Scholar] [CrossRef]
- Kuhr, W.G.; Wightman, R.M.; Rebec, G.V. Dopaminergic neurons: Simultaneous measurements of dopamine release and single-unit activity during stimulation of the medial forebrain bundle. Brain Res. 1987, 418, 122–128. [Google Scholar] [CrossRef]
- Blaha, C.D.; Lane, R.F. Chemically modified electrode for in vivo monitoring of brain catecholamines. Brain Res. Bull. 1983, 10, 861–864. [Google Scholar] [CrossRef]
- Lindquist, J. A study of seven different carbon paste electrodes. J. Electroanal. Chem. Interfacial Electrochem. 1974, 52, 37–46. [Google Scholar] [CrossRef]
- Crespi, F.; England, T.G.; Trist, D.G. Simultaneous, selective detection of catecholaminergic and indolaminergic signals using cyclic voltammetry with treated micro-sensor. J. Neurosci. Methods 1995, 61, 201–212. [Google Scholar] [CrossRef]
- Gerhardt, G.A.; Oke, A.F.; Nagy, G.; Moghaddam, B.; Adams, R.N. Nafion-coated electrodes with high selectivity for CNS electrochemistry. Brain Res. 1984, 290, 390–395. [Google Scholar] [CrossRef]
- Zen, J.M.; Chen, P.J. A selective voltammetric method for uric acid and dopamine detection using clay-modified electrodes. Anal. Chem. 1997, 69, 5087–5093. [Google Scholar] [CrossRef]
- Pihel, K.; Walker, Q.D.; Wightman, R.M. Overoxidized polypyrrole-coated carbon fiber microelectrodes for dopamine measurements with fast-scan cyclic voltammetry. Anal. Chem. 1996, 68, 2084–2089. [Google Scholar] [CrossRef]
- Roy, P.R.; Okajima, T.; Ohsaka, T. Simultaneous electroanalysis of dopamine and ascorbic acid using poly (N, N-dimethylaniline)-modified electrodes. Bioelectrochemistry 2003, 59, 11–19. [Google Scholar] [CrossRef]
- Heien, M.L.; Phillips, P.E.; Stuber, G.D.; Seipel, A.T.; Wightman, R.M. Overoxidation of carbon-fiber microelectrodes enhances dopamine adsorption and increases sensitivity. Analyst 2003, 128, 1413–1419. [Google Scholar] [CrossRef]
- Hafizi, S.; Kruk, Z.L.; Stamford, J.A. Fast cyclic voltammetry: Improved sensitivity to dopamine with extended oxidation scan limits. J. Neurosci. Methods 1990, 33, 41–49. [Google Scholar] [CrossRef]
- Wrona, M.Z.; Dryhurst, G. Oxidation chemistry of 5-hydroxytryptamine: Part II. Mechanisms and products formed at millimolar concentrations in acidic aqueous solution. J. Electroanal. Chem. Interfacial Electrochem. 1990, 278, 249–267. [Google Scholar] [CrossRef]
- Wrona, M.Z.; Dryhurst, G. Electrochemical oxidation of 5-hydroxytryptamine in acidic aqueous solution. J. Org. Chem. 1989, 54, 2718–2721. [Google Scholar] [CrossRef]
- Swamy, B.K.; Venton, B.J. Carbon nanotube-modified microelectrodes for simultaneous detection of dopamine and serotonin in vivo. Analyst 2007, 132, 876–884. [Google Scholar] [CrossRef]
- Gilbert, O.; Swamy, B.K.; Chandra, U.; Sherigara, B. Simultaneous detection of dopamine and ascorbic acid using polyglycine modified carbon paste electrode: A cyclic voltammetric study. J. Electroanal. Chem. 2009, 636, 80–85. [Google Scholar] [CrossRef]
- Bhattacharyya, L. Ion Chromatography—Principles and Applications. In Applications of Ion Chromatography for Pharmaceutical and Biological Products; Wiley Online Library: Hoboken, NJ, USA, 2012. [Google Scholar]
- Bruns, D. Detection of transmitter release with carbon fiber electrodes. Methods 2004, 33, 312–321. [Google Scholar] [CrossRef] [PubMed]
- Westerink, R.H. Exocytosis: Using amperometry to study presynaptic mechanisms of neurotoxicity. Neurotoxicology 2004, 25, 461–470. [Google Scholar] [CrossRef] [PubMed]
- Swartz, M.E. UPLC™: An introduction and review. J. Liquid Chromatogr. Relat. Technol. 2005, 28, 1253–1263. [Google Scholar] [CrossRef]
- Chester, T.L. Recent developments in high-performance liquid chromatography stationary phases. Anal. Chem. 2012, 85, 579–589. [Google Scholar] [CrossRef]
- Zenkevich, I.G. Encyclopedia of Chromatography; Taylor & Francis: New York, NY, USA, 2005. [Google Scholar]
- Zhao, X.E.; Suo, Y.R. Simultaneous determination of monoamine and amino acid neurotransmitters in rat endbrain tissues by pre-column derivatization with high-performance liquid chromatographic fluorescence detection and mass spectrometric identification. Talanta 2008, 76, 690–697. [Google Scholar] [CrossRef]
- Chatterjee, D.; Gerlai, R. High precision liquid chromatography analysis of dopaminergic and serotoninergic responses to acute alcohol exposure in zebrafish. Behav. Brain Res. 2009, 200, 208–213. [Google Scholar] [CrossRef]
- Kennedy, R.T.; Watson, C.J.; Haskins, W.E.; Powell, D.H.; Strecker, R.E. In vivo neurochemical monitoring by microdialysis and capillary separations. Curr. Opin. Chem. Biol. 2002, 6, 659–665. [Google Scholar] [CrossRef]
- Nirogi, R.; Mudigonda, K.; Kandikere, V.; Ponnamaneni, R. Quantification of acetylcholine, an essential neurotransmitter, in brain microdialysis samples by liquid chromatography mass spectrometry. Biomed. Chromatogr. 2010, 24, 39–48. [Google Scholar] [CrossRef]
- Watson, C.J.; Venton, B.J.; Kennedy, R.T. In Vivo Measurements of Neurotransmitters by Microdialysis Sampling; ACS Publications: Washington, DC, USA, 2006. [Google Scholar]
- Plock, N.; Kloft, C. Microdialysis—Theoretical background and recent implementation in applied life-sciences. Eur. J. Pharm. Sci. 2005, 25, 1–24. [Google Scholar] [CrossRef]
- Cai, H.L.; Zhu, R.H.; Li, H.D. Determination of dansylated monoamine and amino acid neurotransmitters and their metabolites in human plasma by liquid chromatography–electrospray ionization tandem mass spectrometry. Anal. Biochem. 2010, 396, 103–111. [Google Scholar] [CrossRef] [PubMed]
- González, R.R.; Fernández, R.F.; Vidal, J.L.M.; Frenich, A.G.; Pérez, M.L.G. Development and validation of an ultra-high performance liquid chromatography–tandem mass-spectrometry (UHPLC–MS/MS) method for the simultaneous determination of neurotransmitters in rat brain samples. J. Neurosci. Methods 2011, 198, 187–194. [Google Scholar] [CrossRef] [PubMed]
- Zhang, X.; Rauch, A.; Lee, H.; Xiao, H.; Rainer, G.; Logothetis, N.K. Capillary hydrophilic interaction chromatography/mass spectrometry for simultaneous determination of multiple neurotransmitters in primate cerebral cortex. Rapid Commun. Mass Spectrom. 2007, 21, 3621–3628. [Google Scholar] [CrossRef] [PubMed]
- Bourcier, S.; Benoist, J.F.; Clerc, F.; Rigal, O.; Taghi, M.; Hoppilliard, Y. Detection of 28 neurotransmitters and related compounds in biological fluids by liquid chromatography/tandem mass spectrometry. Rapid Commun. Mass Spectrom. 2006, 20, 1405–1421. [Google Scholar] [CrossRef] [PubMed]
- Zhao, X.E.; He, Y.; Yan, P.; Wei, N.; Wang, R.; Sun, J.; Zheng, L.; Zhu, S.; You, J. Sensitive and accurate determination of neurotransmitters from in vivo rat brain microdialysate of Parkinson’s disease using in situ ultrasound-assisted derivatization dispersive liquid–liquid microextraction by UHPLC-MS/MS. RSC Adv. 2016, 6, 108635–108644. [Google Scholar] [CrossRef]
- Zhao, X.E.; He, Y.; Li, M.; Chen, G.; Wei, N.; Wang, X.; Sun, J.; Zhu, S.; You, J. Analysis of amino acid and monoamine neurotransmitters and their metabolites in rat urine of Alzheimer’s disease using in situ ultrasound-assisted derivatization dispersive liquid-liquid microextraction with UHPLC–MS/MS. J. Pharm. Biomed. Anal. 2017, 135, 186–198. [Google Scholar] [CrossRef]
- Ceccarini, J.; Vrieze, E.; Koole, M.; Muylle, T.; Bormans, G.; Claes, S.; Van Laere, K. Optimized in vivo detection of dopamine release using 18F-fallypride PET. J. Nuclear Med. 2012, 53, 1565–1572. [Google Scholar] [CrossRef]
- Njagi, J.; Chernov, M.M.; Leiter, J.; Andreescu, S. Amperometric detection of dopamine in vivo with an enzyme based carbon fiber microbiosensor. Anal. Chem. 2010, 82, 989–996. [Google Scholar] [CrossRef]
- Nakatsuka, N.; Yang, K.A.; Abendroth, J.M.; Cheung, K.M.; Xu, X.; Yang, H.; Zhao, C.; Zhu, B.; Rim, Y.S.; Yang, Y.; et al. Aptamer–field-effect transistors overcome Debye length limitations for small-molecule sensing. Science 2018, 362, 319–324. [Google Scholar] [CrossRef]


| Name | Formula | Localization/ Concentrations * | Role and Pathology |
|---|---|---|---|
| Glutamate |  | Widespread in brain and spinal cord./ 1 µM [78], 1.4 µM [79] | Involved in learning, memory, vision, epilepsy, schizophrenia, excitotoxicity |
| L-aspartate |  | Hippocampus. / 0.3 µM [78]. | Activate NMDA receptor. Co-neurotransmitter with glutamate |
| GABA |  | Hypothalamus, cerebellum, spinal cordo, olfactory bulb and retina./ 0.2 µM [78], 0.17 µM [79] | Effects augmented by alcohol and antianxiety drugs, epilepsy, convulsions |
| Glycine |  | Brain stem, spinal cord and retina./ 1.6 µM [78], 6 µM [79] | Hyperexcitability, uncontrolled convulsions |
| D-serine |  | Striatum/ 28 µM [79], 15 µM [79] | Coagonist of NMDA receptor, schizpohrenia. |
| Dopamine |  | Hypothalamus, substantia nigra of midbrain./ 26 nM [80], 40 nM [81] | Good feeling, Parkinson’s disease and schizophrenia |
| Epinephrine |  | Tegmental and medulla | Fight-or-flight response |
| Norepinephrine |  | Locus coeruleus of the midbrain, brain stem, limbic system, cerebral cortex, thalamus./ 12 nM [82] | Good feeling, depression |
| Serotonin |  | midbrain, hypothalamus, limbic system, cerebellum, pineal gland, spinal cord./ 70 nM [81], 68 nM [82] | sleep, appetite, nausea, headaches, regulation of mood, schizophrenia, anxiety and depression. |
| Histamine |  | Hypothalamus | Act on on G-protein coupled receptors. Involved in Alzheimer’s and schizophrenia. |
| Acetylcholine |  | Basal nuclei and cortex, neuromuscular junctions./ 0.4–4 nM [83], 2.8 M [84] | Prolonged effects lead to tetanic muscle spasms, it is linked to Alzheimer’s |
| Substance P | widespread in brain, hypothalamus, limbic system, pituitary gland and spinal cord./ 23.5 pM [85] | Natural opiate | |
| Neuropeptide Y | ** | Hypothalamus | Increasing food intake, reduce anxiety and pain, affect the circadian rhythm and control epileptic seizures. [86,87] |
| Adenosine triphosphate |  | Basal nuclei, dorsal root ganglion./ 0.5–10 µM [88] | Involved in pain sensation |
| Carbone monoxide |  | brain, neuromuscular and neuromuscular synapses | regulates vasopressin neuronal activity |
| Nitric oxide |  | brain, spinal cord and adrenal gland./ 92 nM [89] | Relaxing factor, involved in myocardial infarction |
| Hydrogen sulfide |  | Hippocampus, Hypothalamus [90] | Involved in the regulation of vascular tone, myocardial contractility, and insulin secretion |
| Techniques | Advantages | Shortcomings | Reported LOD |
|---|---|---|---|
| PET | High spacial resolution | Complex manipulation Very high cost | Dopamine: 200 nM [216] |
| SPECT | High spacial resolution | Complex manipulation Very high cost | |
| SERS | Very high sensitivity and selectivity | Can be inaplicable in vivo depending on used material. | Choline: 2 µM Acetylcholine: 4 µM Dopamine: 100 nM Epinephrine: 100 µM |
| FSCV | High sensitivity | Low selectivity Electrode short lifetime | Dopamine: 50 nM |
| Amperometry | Low implementation cost | Low sensitivity and selectivity | Dopamine: 10 nM [217] |
| HPLC | High sensitivity and selectivity | High cost and complex manipulation | |
| Fluorescence | High sensitivity and selectivity | May not be usable in vivo | Dopamine: 10 pM |
| Chemiluminescence | |||
| Optical Fiber Sensing | High selectivity | Low sensitivity | Glutamate: 0.22 µM |
| Colorimetric | High sensitivity and selectivity, low cost | Not usable in vivo | Dopamine: 1.8 nM Noradrenaline: 20 µM Adrenaline: 2.5 µM |
© 2019 by the authors. Licensee MDPI, Basel, Switzerland. This article is an open access article distributed under the terms and conditions of the Creative Commons Attribution (CC BY) license (http://creativecommons.org/licenses/by/4.0/).
Share and Cite
Niyonambaza, S.D.; Kumar, P.; Xing, P.; Mathault, J.; De Koninck, P.; Boisselier, E.; Boukadoum, M.; Miled, A. A Review of Neurotransmitters Sensing Methods for Neuro-Engineering Research. Appl. Sci. 2019, 9, 4719. https://doi.org/10.3390/app9214719
Niyonambaza SD, Kumar P, Xing P, Mathault J, De Koninck P, Boisselier E, Boukadoum M, Miled A. A Review of Neurotransmitters Sensing Methods for Neuro-Engineering Research. Applied Sciences. 2019; 9(21):4719. https://doi.org/10.3390/app9214719
Chicago/Turabian StyleNiyonambaza, Shimwe Dominique, Praveen Kumar, Paul Xing, Jessy Mathault, Paul De Koninck, Elodie Boisselier, Mounir Boukadoum, and Amine Miled. 2019. "A Review of Neurotransmitters Sensing Methods for Neuro-Engineering Research" Applied Sciences 9, no. 21: 4719. https://doi.org/10.3390/app9214719
APA StyleNiyonambaza, S. D., Kumar, P., Xing, P., Mathault, J., De Koninck, P., Boisselier, E., Boukadoum, M., & Miled, A. (2019). A Review of Neurotransmitters Sensing Methods for Neuro-Engineering Research. Applied Sciences, 9(21), 4719. https://doi.org/10.3390/app9214719