Article

Comparative Fatigue Life Assessment of Wind Turbine Blades Operating with Different Regulation Schemes

1
School of Engineering and Science, Tecnologico de Monterrey, Ave. Eugenio Garza Sada 2501, Monterrey 64849, N.L., Mexico
2
Department of Electric, Electronics and Telecommunications, Universidad de Cuenca, Ave. 12 de Abril y Agustin Cueva, Cuenca 010203, Ecuador
*
Author to whom correspondence should be addressed.
Appl. Sci. 2019, 9(21), 4632; https://doi.org/10.3390/app9214632
Submission received: 18 July 2019 / Revised: 11 October 2019 / Accepted: 11 October 2019 / Published: 31 October 2019
(This article belongs to the Special Issue Fatigue and Fracture of Non-metallic Materials and Structures)

Abstract

:
A comparative evaluation of the fatigue damage occurring in the blades of small wind turbines, with different power regulation schemes, has been conducted for the first time. Three representative test cases were built, one based on stall regulation and two using pitch regulation. The power curves were tuned to be identical in all cases, in order to allow for a direct comparison of fatigue damage. A methodology combining a dynamic simulation of a wind turbine forced by stochastic wind speed time series, with the application of the IEC 61400-2 standard, was designed and applied for two levels of turbulence intensity. The effect of the wind regime was studied by considering Weibull-distributed wind speeds with a variety of parameter sets. Not unexpectedly, in typical wind regimes, stall regulation led to a generally higher fatigue damage than pitch regulation, for similar structural blade design, but the practical implications were smaller than thought previously. Given the need for cost-effective designs for small wind turbines, stall regulation may be a viable alternative for off-grid applications.

1. Introduction

In the past few decades, the use of renewable energy sources has increased significantly, due a combination of a gradual paradigm shift (driven by environmental degradation and the depletion of conventional fossil fuel reserves) and more competitive pricing in key technologies, in particular, solar photovoltaic and utility-scale wind. Regarding the latter, it is worth mentioning that the global installed wind power capacity in 2017 was 500 GW [1], and it is expected to reach 1013 GW by 2025 [2].
Small-scale wind energy generation, on the other hand, has remained a niche technology, in spite of its significant potential for supplying small and isolated loads [3], households, or off-grid communities with no access to the electricity distribution network, and it contributes to clean energy goals in residential, urban [4], and industrial settings [5]. Small-scale wind energy generation is often recognized to be a major component in overcoming energy poverty [6], both on a stand-alone basis and in conjunction with other generators, such as solar photovoltaic, diesel generators, and storage [7]. Small-scale wind energy generation is ideal for balancing solar generation and reducing the size of backup generators (if any) and storage facilities in hybrid systems. However, given the dramatic reduction observed over the last decade in the cost of solar photovoltaic panels and systems [8], the pressure for cost reduction in small wind systems has risen considerably. Though small wind turbines do not necessarily have to compete directly with solar photovoltaic panels and systems, but rather with the storage units and systems that they are likely to replace or downsize, the need for building cost-effective small wind turbines, capable of reliably functioning over 20 years or more, with minimal user intervention for maintenance and repair, continues to be a hot topic.
Unlike their utility-scale counterparts of the multiple-MW class, small wind systems generally operate unsupervised. Moreover, in autonomous applications, the energy security of the user community critically depends on the availability of the wind turbine, so reliability, rather than energy production, becomes the individual most important design consideration, apart from the need for building turbines and systems with a low initial investment cost. Given that the regulation of power and rotor speed is a major design decision for wind turbines, affecting reliability and cost alike, it is worth considering some alternatives. Early commercial turbine designs, such as the ones deployed in California during the 1980s, generally relied on stall regulation, a scheme where the turbine rotor aerodynamics is designed in such a way that flow detachment is obtained at a critical wind speed, leading to a drastic reduction in rotor torque and, thereby, limiting both power and rotor speed. This scheme was largely improved in the designs of the then emergent Danish manufacturers, leading to a scheme generally called the Danish concept [9]. This design choice survived in commercial designs well into the early 2000s, when large commercial wind turbines started to rely exclusively on pitch regulation, a scheme where the turbine blades are rotated around their long axes, either passively or actively, collectively or individually, in order to adjust the blade lift forces and thereby the rotor torque in a continuous way. Interestingly, there has recently been a renewed interest in stall regulation for multi-megawatt wind turbines, specifically designed for fatigue load mitigation; see [10] for a recent approach.
Pitch regulation is now practically an industry standard in large-scale wind turbines, but is still a rather incipient technology in the small wind world, although passively operated pitch schemes, used, e.g., in the Jacobs wind turbines, have been around for about half a century. Stall regulation, on the other hand, though largely extinct at the utility scale, has made a relatively recent re-appearance in small wind turbines. While the Danish concept relied on a fixed rotor speed (dictated by the fixed electricity frequency of the utility grid to which the turbine was interconnected), modern small wind systems are not limited by this restriction, given the availability of low-cost power electronics devices capable of adjusting the generator torque in a continuous way, thereby allowing for a variety of design choices, including the possibility of obtaining a flat nominal power curve, such as in pitch-controlled systems.
Currently, many commercial small wind turbines operate with yet a different power/rotor speed regulation system called furling [11], a robust scheme based on the interplay of aerodynamics forces and moments acting on the rotor, mounted somewhat eccentrically from the vertical rotation axis, and a tail vane. Furling has been demonstrated to allow for reliable designs withstanding two decades or more of operation; however, the trade-offs are considerable, including a sharp drop-off of the output power after the onset of furling, hysteresis between the operational curves for increasing and decreasing wind speeds, respectively, and a quite complex aerodynamic state during furling, particularly in a highly turbulent environment, typically encountered by small wind turbines. Furling will not be discussed in the current paper; the interested reader is referred to [11,12] for an introduction.
Independent of the regulation scheme selected, fatigue loading is always a major factor for wind turbine life, particularly the rotor blades. Fatigue loading arises as a combination of the stochastic nature of the wind field impinging on the rotor and rotational sampling [13] caused by the finite spatial coherence of the wind field. Excessive fatigue loads lead to a reduction in the blade life and increase maintenance costs and financial losses [14], making a careful design for fatigue an important part of the (small) wind turbine design process. Given that fatigue loading is a major concern in wind turbines, a large body of literature exists on the subject, with an emphasis on utility-scale turbines. While much of the knowledge on fatigue damage in wind turbine blades has been generated by testing, both of the composite materials commonly used [15,16] and of components and systems, design procedures based on a combination of simulations and standards are becoming more common. This is particularly important in the field of small wind turbines where extensive testing is not cost effective for manufacturers.
Ardila et al. [17] used load cases for power production and parked turbines recommended in the IEC 61400-1 standard [18] for the fatigue life assessment of a blade designed for a 5-MW wind turbine; their approach considers a combination of aeroelastic simulation tools such as FAST and HAWC2 for the generation of fatigue loading and fatigue assessment tools developed by the authors. As in most works, the Palmgren–Miner (PM) rule is used for cumulative damage calculation and the Goodman method for computing the allowed load cycle number, and the rainflow method is applied to determine the number of events with a given combination of mean stress and stress range. A similar approach was used by Hayata et al. [19], who also studied the fatigue life of the blade of a 5-MW wind turbine. Kong et al. [20], as part of an effort to design a 750-kW wind turbine in South Korea, developed a simplified fatigue design procedure, using empirical formulae for fatigue loading in combination with results from materials testing; Goodman diagrams obtained from laboratory testing and the PM rule were then used to calculate the expected fatigue life. The work in [16] presented common methods for calculating damage on the blades. The most common method is the Palmgren–Miner (PM) rule [21], in which, if the damage parameter, D, reaches the value of one, the existence of damage is concluded. Currently, there are several other methods, which are variations of the PM rule, such as the Marco–Starkey rule [22]. Currently, standardized methods for estimating the fatigue life of wind turbine rotors are available [23], providing the designer with a simplified conceptual framework useful for practical design decisions. As discussed by Evans et al. [24], the small wind turbine standard IEC-61400-2 [23] contemplates three possible methods for fatigue life assessment, one based on operational measurements, another using aeroelastic simulations, and, finally, a simplified procedure to be used by designers and small wind turbine manufacturers without access to sophisticated aeroelastic modeling tools. Evans et al. found that the simplified procedure in their study case produced extremely conservative results, leading to blade designs that are likely not cost-effective. Given the need for small wind turbine systems to reduce their costs while maintaining a level of reliability, other approaches are needed.
Derived from the observation above, the following two-fold objective of the present work was formulated: first, a practical simulation-based methodology for assessing fatigue life in small wind turbines, consistent with the recommendations of the standard IEC 61400-2, is proposed and demonstrated. This approach is believed to simplify the design process of small wind turbines greatly, allowing for a greater accuracy (as compared to the option of the simplified design method proposed in the standard) or a faster design process (as compared to conventional processes). Having introduced the methodology, a comparative study of the fatigue behavior of stall- and pitch-regulated small-scale wind turbines is carried out. The stall-regulated rotor was designed as part of the project P09 of the Mexican Center for Innovation in Wind Energy (CEMIE Eólico); the study of different power/rotor speed control schemes was part of the project P19 of the CEMIE Eólico. The design of the stall-regulated rotor resulted from an co-optimization of three objectives: (a) a high power coefficient at partial load (i.e., below nominal power), (b) overspeed control to guarantee structural stability up to 20 m/s without the need for additional braking systems, and (c) a high starting torque to overcome the generator cogging torque at low wind speeds. The third requisite somewhat restricted the power production at medium wind speeds, but enabled the rotor to work with a variety of generators. The detailed design considerations will be described elsewhere and are not part of the present work.
The comparative assessment of stall- and pitch-regulated small-scale wind turbines was partly motivated by the fact that the CEMIE Eólico considered both technologies. However, while investigating the subject, it became apparent that comparative assessments of the impact of power/rotor speed regulation on fatigue damage are very scarce. To the best knowledge of the authors, only Kennedy et al. [25] addressed this issue, albeit in the context of tidal, not wind turbines. As opposed to [25], in this work, all wind turbine designs studied have (almost) the same power curve, leading to an identical energy production for any given wind regime (at least under steady-state conditions) and allowing for a direct comparison of the analyzed schemes.
This paper is organized as follows: In 
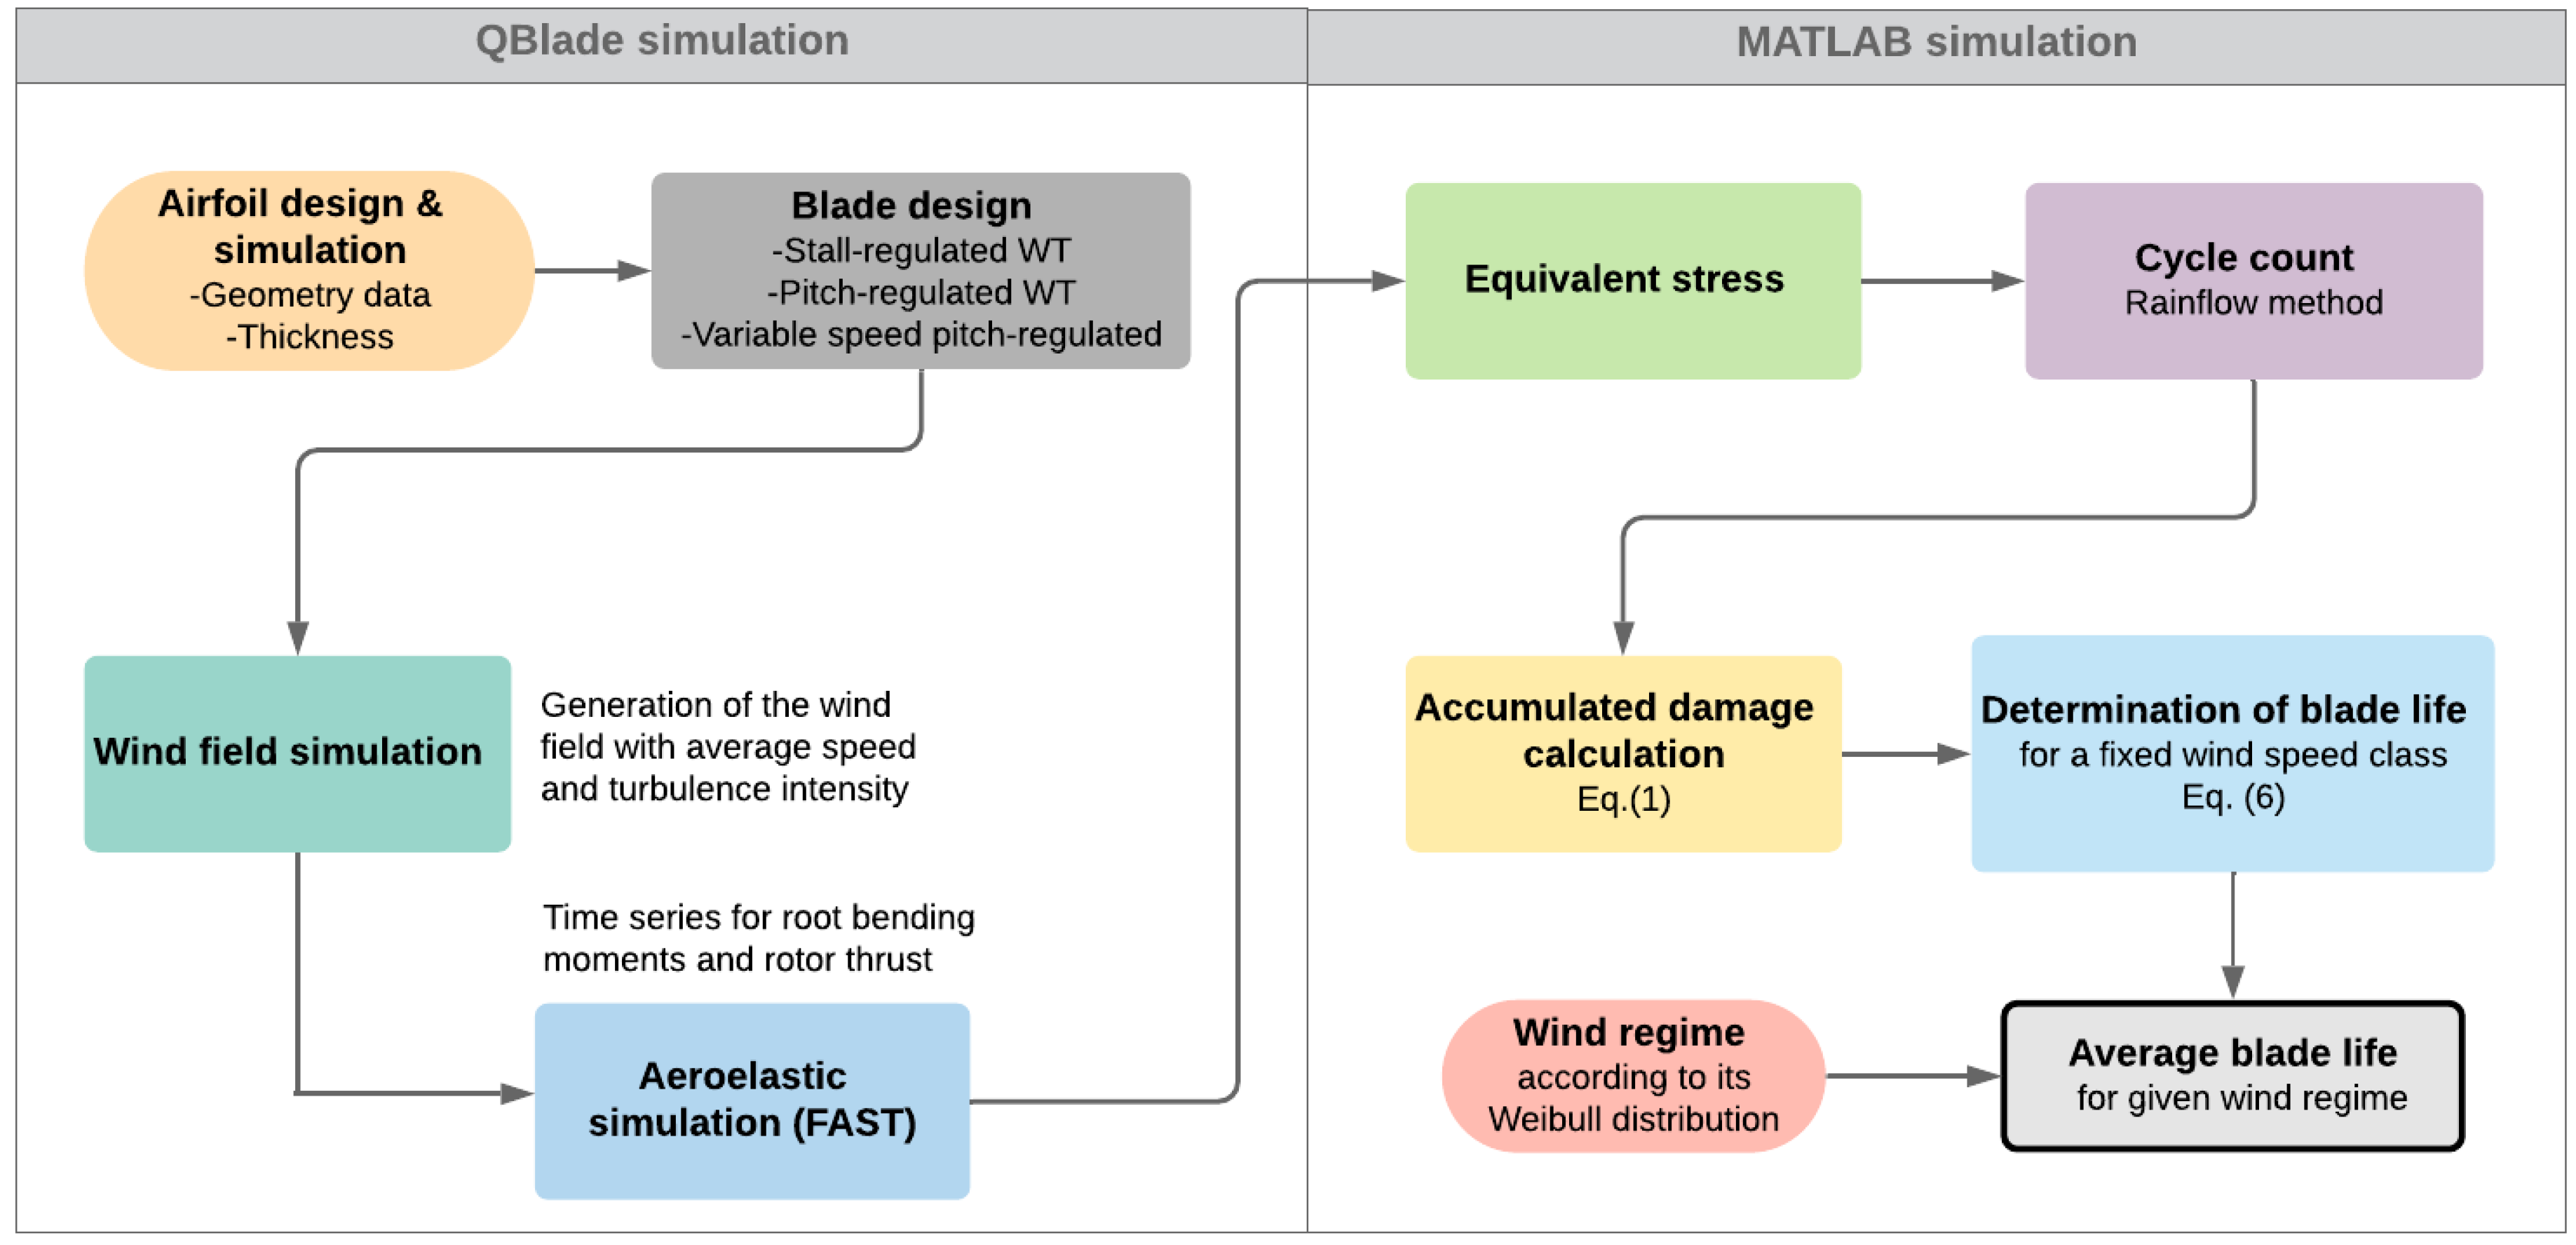
Section 2, the basic relations used to calculate the fatigue life of small wind turbine blades according to the simplified methodology in standard IEC 61400-2 are briefly reviewed, followed by an overview of the complete methodology, including the different design and simulation tools available in the public-domain suite QBlade [
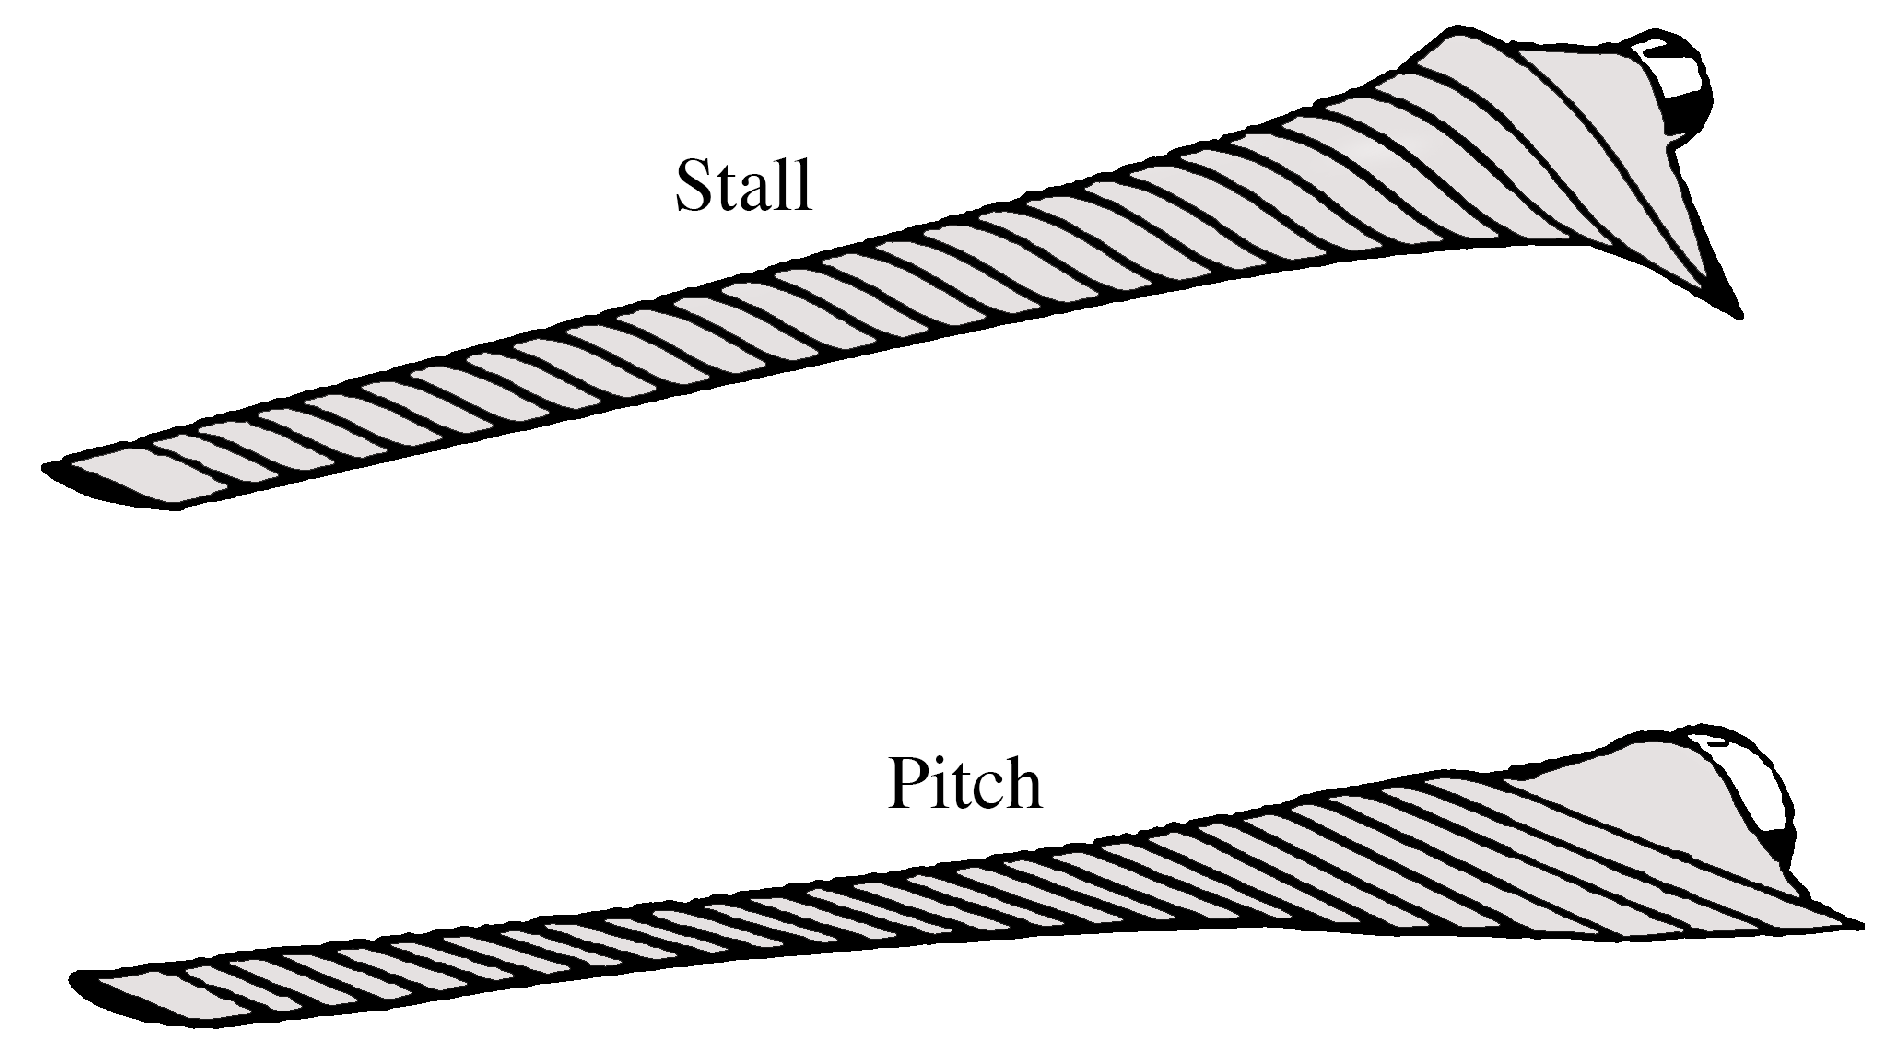
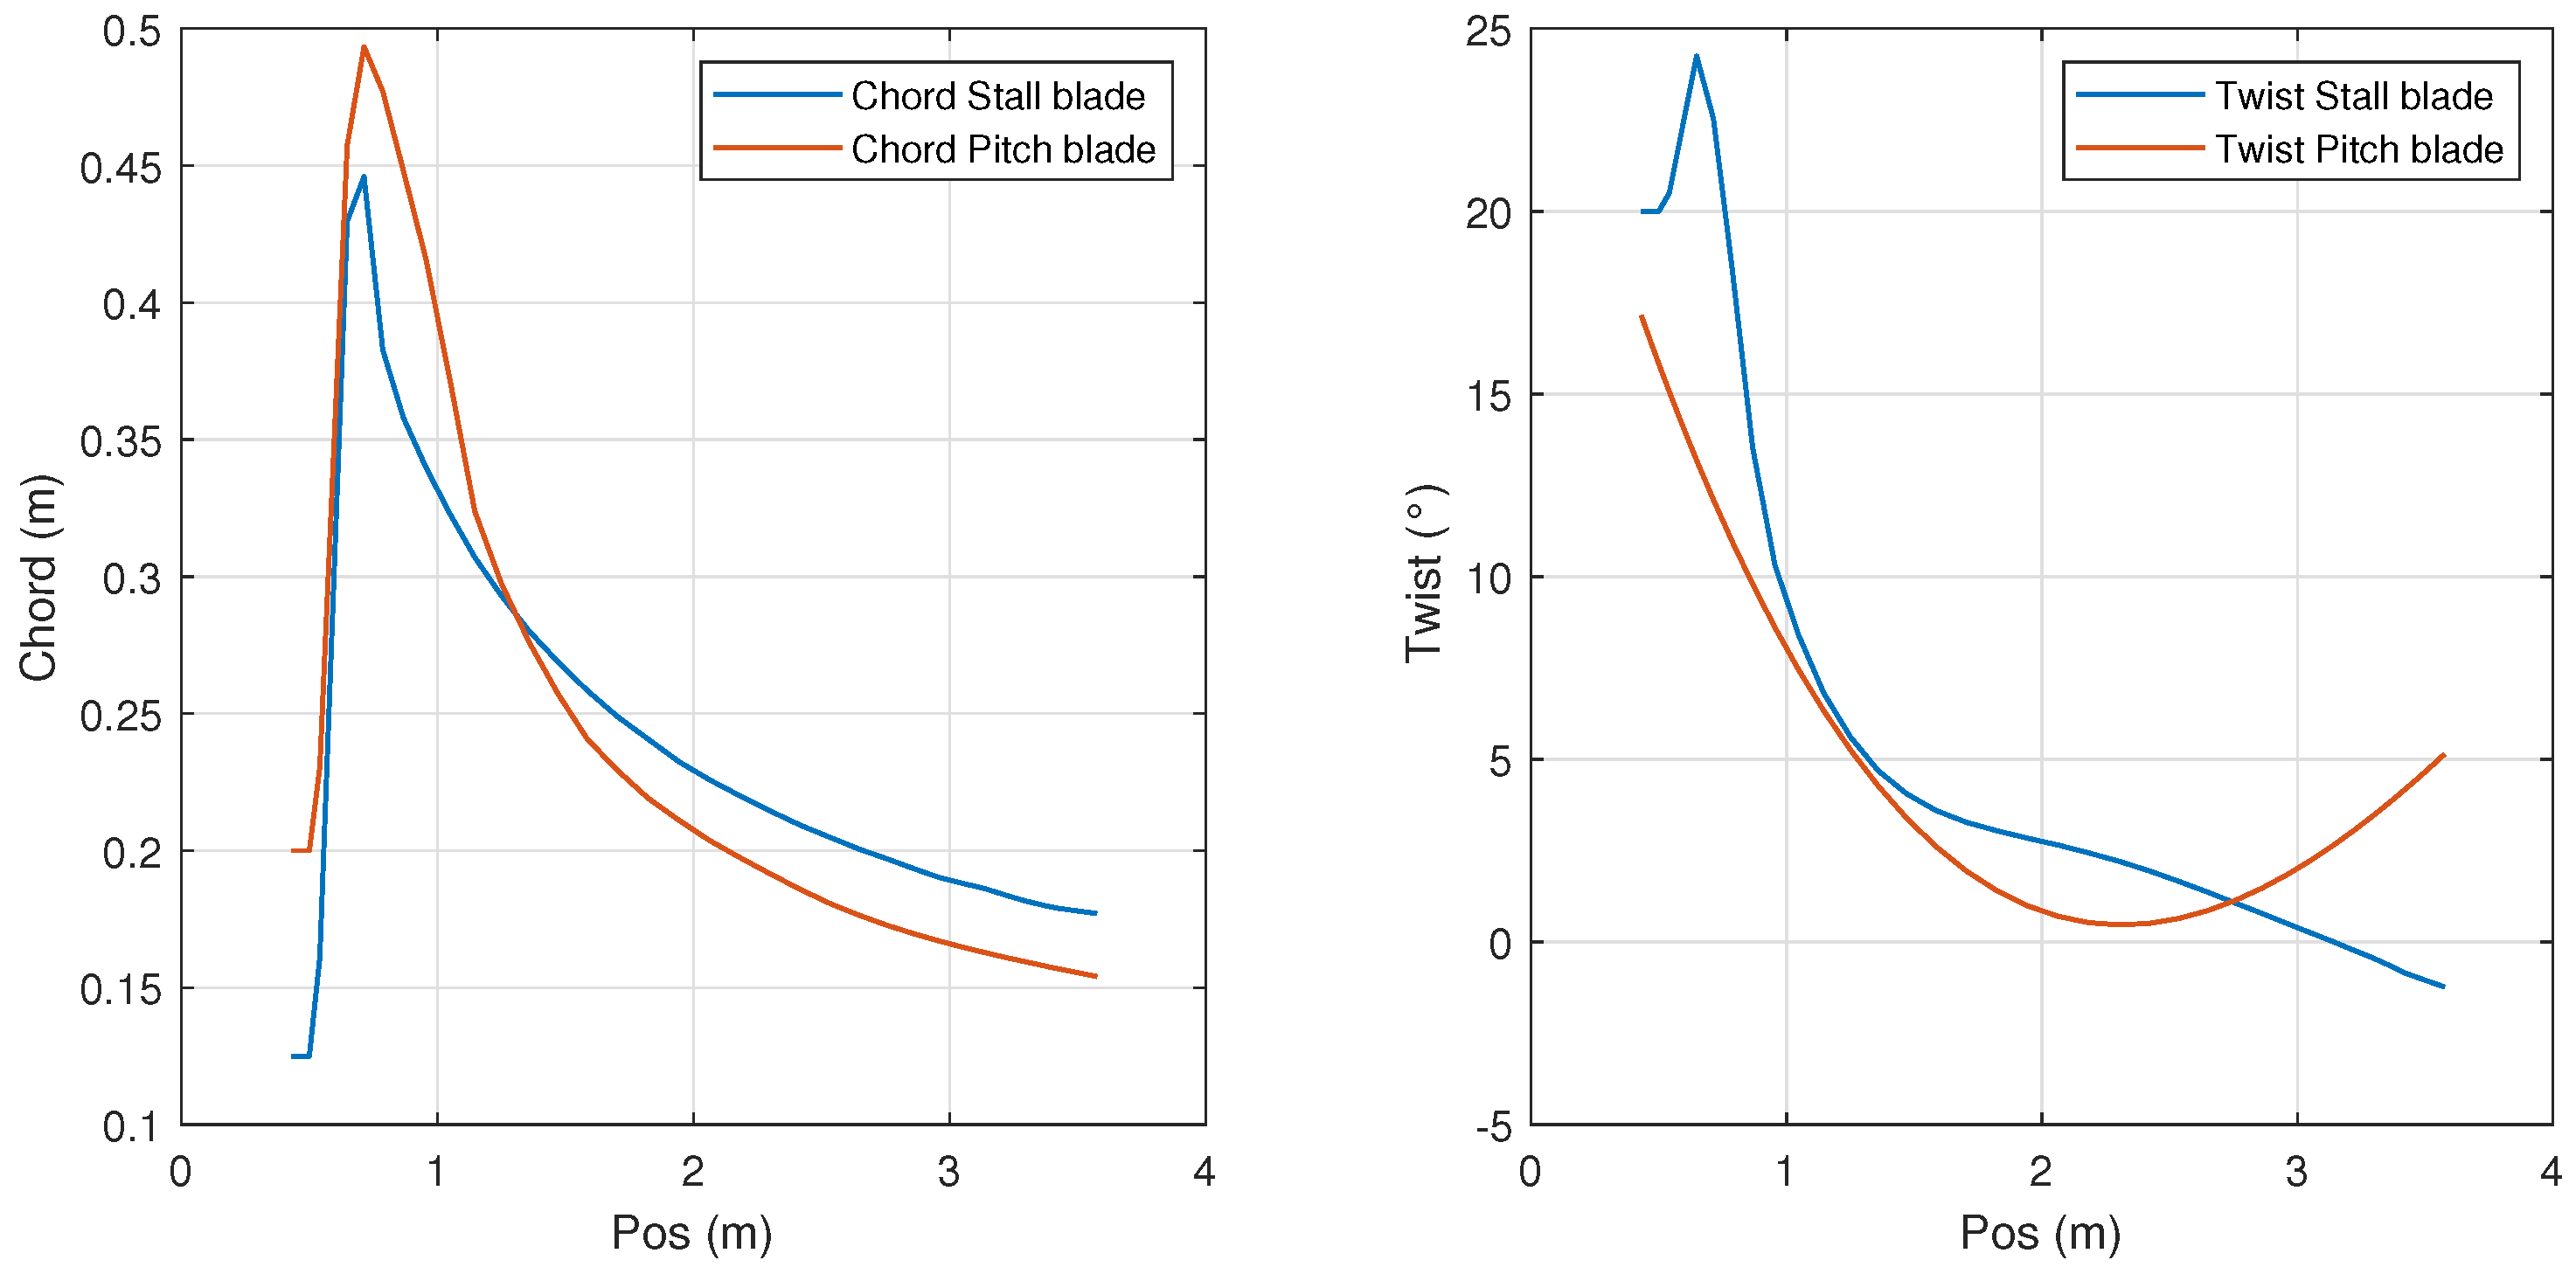
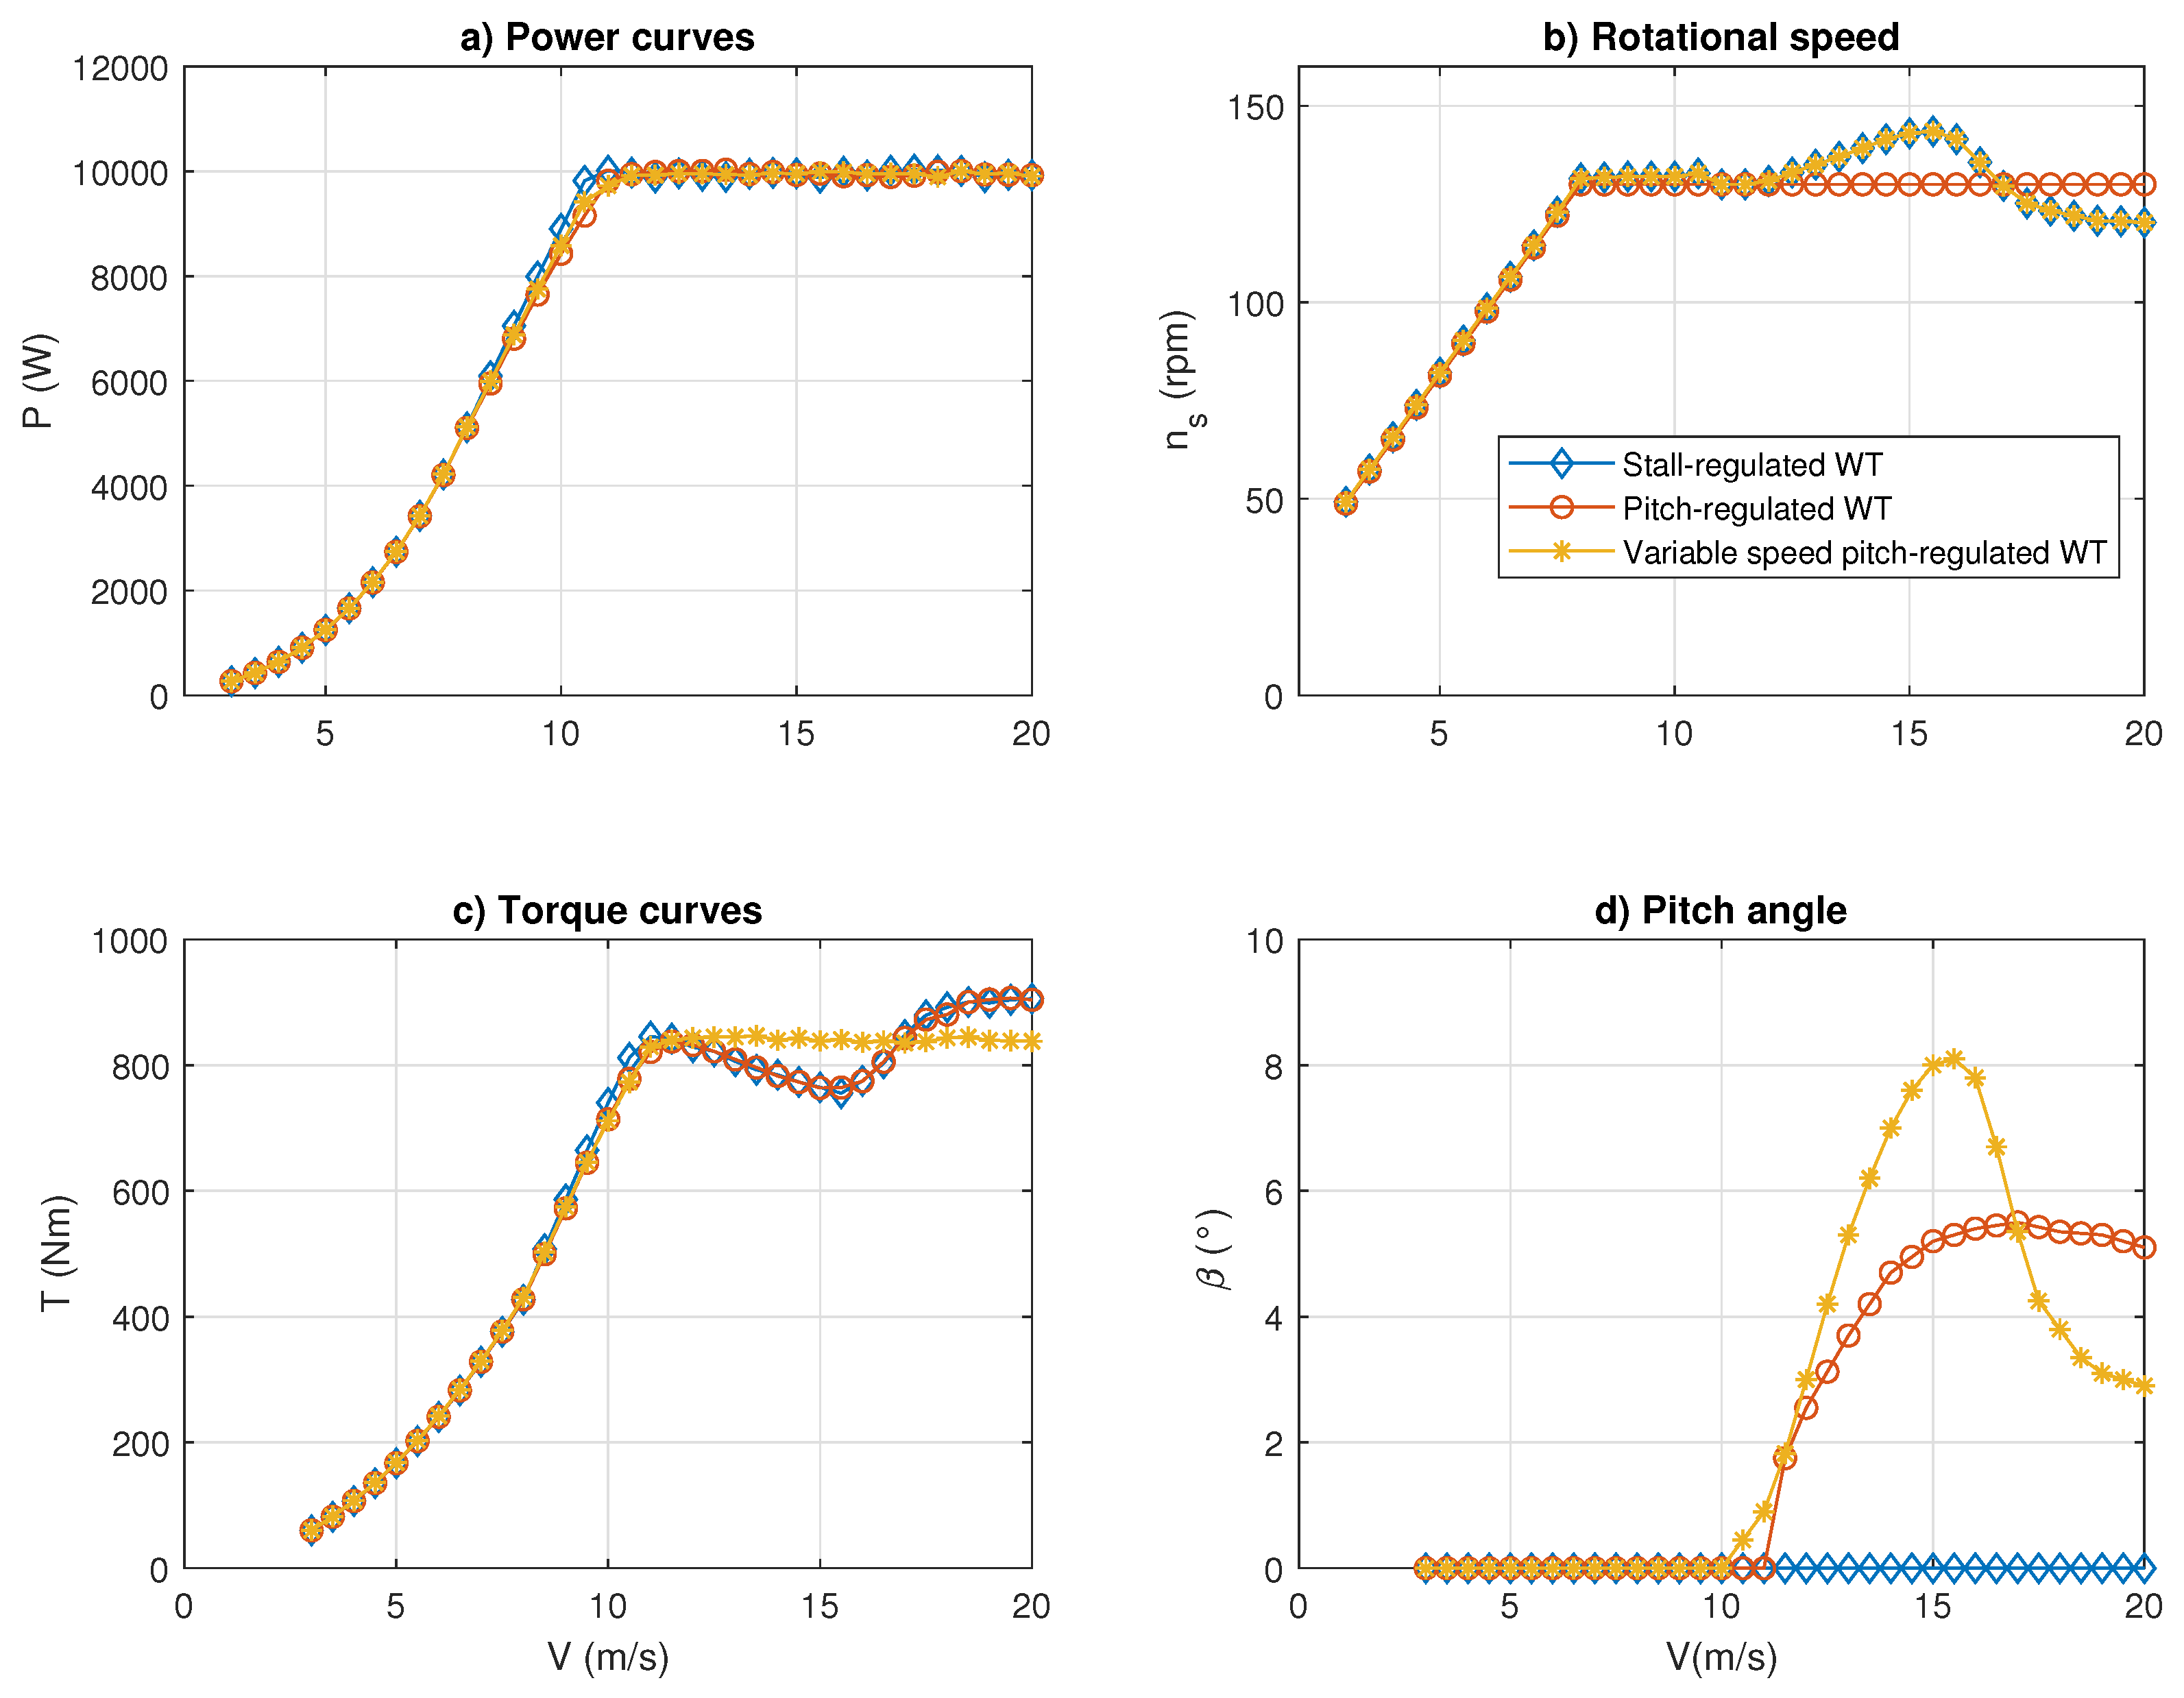
26]. A general description of the blade geometry and materials, as well as the design curves for power, rotor speed, and pitch angle is also provided for the case of the stall-regulated wind turbine and two pitch-regulated alternatives. The full information about the outer geometry of both blades is provided in the Appendix A. A brief description about the setup of the wind field generator and the dynamic simulation, using FAST, is also included. The results obtained with the methodology proposed in this work are presented and discussed in some detail in Section 3. The summary and conclusions are presented in Section 4.

2. Methodology

2.1. Blade Damage Model

Fatigue damage occurs when the residual strength of a piece of material subjected to periodic loading equals the maximum stress within a cycle period [27]; the residual strength is a function of the degradation of the properties of a material, occurring in response to static or dynamic loads. In the case of fatigue-only damage, there is a distinct number of load cycles N , after which the material fails if excited with a given stress amplitude and mean. In a homogeneous sample, often, a characteristic function governing the decay of the residual strength with the number of cycles can be determined, either experimentally or through micro-mechanical simulation, although the details of fracture mechanics, particularly in composite materials, turn even this well-defined problem into an undertaking with considerable complexity. In the case of more realistic geometries, such as composite beams, the complexities of a non-homogeneous stress field can be addressed by Progressive Failure Analysis (PFA) (see, e.g., [28,29]), while still assuming that the results for fatigue degradation obtained from a (small) homogeneous sample remain approximately valid, an approach (as most approximate engineering procedures) which is not without criticism. While PFA may or may not be completely adequate, engineering design approaches for wind turbine fatigue design, as already discussed in the literature review, are still considerably more simplified and simply focus on one critical location within the structure (generally located at the blade root), limiting themselves to calculating the number of cycles at which the blade root material (as determined from a small sample) fails. Though, in practice, the order in which different stress amplitudes and mean values occur might be of relevant, the standard procedures, such as the ones recommended in the IEC61400-2 norm, neglect such effects. Fatigue damage is measured by a metric such as the cumulative damage D in the Palmgren–Miner (PM) rule [16]:
D = i n i N i
where,
D : the cumulative damage ( D = 1 when a fault occurs)
n i : the number of load cycles for a given stress amplitude/mean combination
N i : the number of permissible load cycles for a given stress amplitude/mean combination
The fatigue life estimation then requires determining the number of load cycles n i [30]. As in most fatigue research, the rainflow method was used to extract the number of events for a given stress amplitude/mean combination from the relevant input time series. As mentioned above, the stress time series obtained from an aeroelastic simulation of the blade under normal operation conditions at different average wind speeds, as extracted at the blade root, was used as input to the rainflow counting algorithm in all occasions.
In order to calculate the permissible number of cycles for a given stress state, based on the Goodman method, the following formula was used [23]:
N = X t + | X c | - 2 γ M a σ 1 , m - X t + | X c | 2 γ M b / C 1 b σ 1 , a m
where,
X t : maximum tensile strength (MPa)
X c : maximum compression strength (MPa)
σ 1 , m : average atress of a cycle calculated by the rainflow method (MPa)
σ 1 , a : stress amplitude of a cycle calculated by the rainflow method (MPa)
m : slope of the S - N diagram
γ M a , M b : safety factors
The definition of the safety factors, as well as m, was given in [31]. The value assigned to m depends on the material of the blade. Table 1 shows some values assigned to m for three different materials. The safety factors are calculated according to:
γ M x = γ M 0 i C i x
where γ M 0 = 1.35 , and the values assigned to C i x are selected according to the material used in the blade manufacturing. Table 2 shows some values of C i x used for materials reinforced with polymeric fiber.

Equivalent Stress

The section experiencing the greatest stress along the rotor generally corresponds to the blade root, given that the blade bending moments are the largest here [32]. In the case of a circular root section of the blade, the equivalent stress can be written as follows [23,33]:
σ e q B = F z B A B + M x B 2 + M y B 2 W B
where,
F z B : axial force (rotor thrust) (N)
M x B : edgewise moment (N·m)
M y B : flapwise moment (N·m)
A B : root cross section (m 2 )
W B : modulus for the root section of the blade (m 3 )
The modulus for a circular area, with A B = 0.0123 m 2 , is calculated as follows:
W B = π 4 r e x t 4 - r i n t 4 r e x t = 6.54 × 10 - 5 m 3
where r i n t and r e x t are the interior and exterior radii of the blade root, respectively.

2.2. Methodology for Calculating Fatigue Damage

Figure 1 shows a general scheme of the proposed methodology used in this work. The primary output is the predicted fatigue damage D ( v i , TI , reg ) of the blade for a given average wind speed v i , a given level of Turbulence Intensity (TI) (high or low), and the turbine configuration, where “reg” stands for the turbine regulation scheme used,
T [ years ] = τ [ min ] 24 × 60 × 365 × D v i , TI , reg
where τ is the simulation time in minutes. In this work, τ = 10 min in all cases. An average fatigue life can then be calculated by convoluting the fatigue damage for a given wind speed class v i with a Weibull distribution function f Weibull ( v ; v s , k ) , where v s is the Weibull scale factor in m/s and the dimensionless quantity k is the Weibull shape factor. Note that the average wind speed v ¯ is related to the shape factor by v ¯ = v s Γ ( 1 + 1 / k ) , where Γ is the gamma function.
The proposed methodology combines two software packages, the public-domain suite QBlade and a set of codes implemented in MATLAB, shown on the left- and right-hand side of Figure 1, respectively. QBlade can be used for (1) simulating and designing airfoils, (2) simulating rotor aerodynamics using Blade Element Momentum (BEM) theory, (3) simulating steady-state operation based on prescribed curves for rotor speed vs. wind speed and blade pitch angle vs. wind speed, (4) simulating stochastic wind fields, and (5) conducting aeroelastic simulations using the rotor setup and operational characteristics defined in Steps (1)–(3). Step (5) is carried out with the tool FAST [34], developed by NREL and embedded in QBlade, whereas Step (1) is based on another public-domain tool, XFoil. In addition to Tools (1)–(5) QBlade allows for finite-element simulation of the mechanical state of the blade for given stationary load conditions, which can be used to conduct a preliminary structural design of the blade.
In all three turbine configurations studied in this work, the QBlade tools (1)–(3) were used iteratively to reach the given design objectives. In the case of the stall design, as mentioned before, additional evaluations were carried out outside of the QBlade framework for an optimization of the start-up behavior, which is not part of the present work. For all three turbine configurations, an electric nominal output power of 10 kW was specified, to be reached at a rotor speed of about 130 rpm. In the case of a pitch-regulated wind turbine, the requirement of a constant nominal rotor speed can be met always, at least theoretically, by adjusting the pitch angle correspondingly, although an optimal design is far from trivial. In a stall-regulated turbine, however, this additional degree of freedom is not available, so all regulation has to be conducted through the prescription of the rotor speed, which is achieved in practical terms by the control of the generator torque (for a modern application of small wind turbine control through generator torque control, see, e.g., [35]).

2.2.1. Blade Characteristics and Geometry

For the stall-regulated turbine simulated in this work, airfoils from the series DU-210_xx were considered. The selection of this series was in part motivated by its favorable starting performance. On the other hand, both pitch-regulated turbines were based on a design using one single airfoil, namely the NACA 4412. Figure 2 shows representative airfoils used for stall and pitch design, respectively. Figure 3 shows a 3D rendering of both blades. The chord and twist angle functions are shown in Figure 4. The blade designed for pitch control had a roughly optimal chord function, with a transition to a circular root section to allow for convenient flanging to the rotor hub (as usual in wind turbine engineering, an “optimal” blade is one with an optimal power extraction at a constant tip-speed ratio, considering negligible airfoil drag). The twist function was obtained from a performance optimization using QBlade, taking the twist function proposed in [36] as a starting point, and a smoothing process to allow for a manufacturable blade. The stall design, on the other hand, was based on the requirement that at a given wind speed, all blade sections simultaneously enter the stall regime, thereby leading to a sharp drop in the power coefficient of the rotor. This was achieved using the optimization feature provided by the QBlade suite. As discussed above, the DU210xx airfoil series was selected in part because of the relative sharp drop in the lift coefficient for angles of attack larger than a critical angle (the stall angle), which greatly facilitates a good rotor stall behavior. The other reason for choosing the DU201xx airfoil series lies with its favorable starting performance, as mentioned before.
The geometry of the stall blade considered previous designs from the authors. Table A1 shows the densities, Young’s module, the maximum tension strength X t , and the maximum compression strength X c . Table A2 shows information about the geometry of the stall blade, as well as the aerodynamic profiles for each section and the Reynolds numbers. The blades have a length of 3.58 m, divided into 30 sections or blade stations. The blades were manufactured with two distinct kinds of Fiber Glass-Reinforced Polymeric (FGRP) and epoxy resin. The root and shell of the blade were built from tri-axial material, while the crossbar used a bidirectional material.
The design of the pitching blade was inspired by a blade design published by Hansen et al. [36]. To adapt this model to the present work, the original blade, with a total length of 40 m and divided into 14 sections, was scaled to match the length of the stall-regulated blade. The geometry was interpolated to 30 blade stations. To reach the final blade design, the scaled and interpolated chord function was used directly, whereas the twist distribution was used as a starting point for a final twist optimization using QBlade [26]. The same characteristics of the materials used in the stall blade were considered at a given blade section. The data of the geometry of the pitching blade are shown in Table A3. Finally, for both blade designs, the same Reynolds numbers were considered. The masses of the blades were 19.835 kg for the stall blade and 21.642 kg for the pitching blade. Figure 3 illustrates the blade geometry for each case.

2.2.2. Steady-State Aerodynamic Simulation and Operational Characteristics

Blade Element Momentum (BEM) theory, as implemented in QBlade [26], was used to determine the aerodynamic behavior of the blades. BEM is based on the balances of the linear and angular momentum between the air mass flowing through annular rotor disk sections and the aerodynamic forces and moments acting on the blade sections located at a given radial position, determined from empirical or simulated airfoil data, plus a number of empirical corrections, such as for rotor thrust under heavy loading conditions and tip and rotor losses. The local differences in Reynolds number along the blade radius can be taken into account by simulating each required airfoil with a different Reynolds number, depending on the blade station where this airfoil is going to be placed. While in utility-scale wind turbines, the effect of making this distinction is marginal, given the large Reynolds numbers prevailing at most parts of the blades, in small-scale wind turbines, this differentiation is critical, particularly near the root where the Reynolds number may be as low as several tens of thousands. The solution of the local momentum equations allows obtaining the rotor torque, the extracted mechanical power, and the rotor thrust. The main parameters of the BEM simulations were: (1) air density: ρ = 1.225 kg / m 3 , (2) air viscosity: 1.456 × 10 - 4 kg m · s , and (3) elements and iterations: 40 and 100, respectively.
The output of the BEM calculations was then combined with prescribed functions for the rotor speed n ( v ) and the blade pitch angle β ( v ) as a function of the free-stream wind speed v to define the steady-state operational characteristics of each wind turbine, assuming a constant efficiency of all other components such as the electric generator. The determination of these functions was conducted outside QBlade and was based on the considerations described at the beginning of Section 2.2. The following results were obtained (see Figure 5 for an illustration and Table 3 for a summary of the turbine characteristics): in all cases, the regulation scheme was designed to obtain optimal operation at partial load, from just after cut-in up to a free-stream wind speed of 8 m/s; in this regime, all turbines operated at an optimal wind speed ratio λ opt of about six, where λ = Ω R / v , Ω being the rotor speed and R the rotor radius. From 8 m/s–10 m/s the regulation of all three turbines continued to be identical, with the shaft frequency now being set to its nominal value of 130 rpm and the pitch angle remaining at zero degrees in all cases. The effect of reducing the rotor speed was the same for all, a reduction in the power coefficient (the proxy for turbine efficiency), which made up for part of the cubic increase in power density with wind speed, resulting in a practically linear power curve in this section (Figure 5a). For wind speeds higher than 10 m/s, the three regulation schemes now started to differentiate themselves, as described below:
  • Stall-regulated wind turbine: The pitch angle cannot be varied in this design, so it remained at zero degrees for all wind speeds. By operating the wind turbine at its maximum power point up to a wind speed 8 m/s and then setting the rotational speed to a constant value of 130 rpm, the turbine slope of the P(v) curve was limited, and a smooth transition to the nominal regime starting around 11–12 m/s was guaranteed. This design ensured a reliable operation of the turbine, avoiding large excursions in the opposing torque and the possibility of overheating. For higher wind speeds, the rotor speed had to be increased slightly (up to about 145 rpm for v = 14.5 m/s) to compensate for a slight drop in the power coefficient, resulting from the stall design. In practice, this is achieved by a slight reduction in generator torque. This small increase in rotor speed (from 130 rpm–145 rpm) is hardly a concern from a structural load perspective. Note that a classical stall-regulated wind turbine, based on the Danish concept, would have a drop in output power, since the rotor speed cannot be changed under that scheme. For higher wind speeds, the rotor speed has to be lowered again, with the lowest value occurring at v = 20 m/s, where n is reduced to about 120 rpm. For still higher wind speeds, practical limits are encountered with heat dissipation at the electric generator, so, typically, an additional braking system is recommended for v > 20 m/s. In the current case, a passive emergency pitching system was designed, the description of which is, however, outside the scope of the present study.
  • Pitch-regulated wind turbine with constant rpm at nominal power: This scheme is operated in close analogy with a utility-sized wind turbine, where the power curve is roughly determined by two regimes: one with zero pitch angle and linearly increasing rotor speed (the partial load or optimal regime) and the nominal load regime where the rotor speed is held constant (by rotor torque control), and all remaining regulation is done by pitching. In the current case, the two mentioned regimes exist, but a third −hybrid− regime was introduced, where a constant rotor speed coexists with a zero pitch angle. This “stall-regulation”-type behavior was achieved by deviating from optimal operation at a relatively low wind speed (8 m/s), well below the turbine design wind speed of 11 m/s, where the nominal power was attained. It should be noted that the pitching curve β ( v ) showed a gentle almost monotonic increase from zero to about six degrees at 20 m/s.
  • Pitch-regulated wind turbine with variable rpm at nominal power: This scheme was introduced for comparative purposes and represented a hybrid version between the former two approaches. As shown in Figure 5b, in this scheme, the rotor speed was varied in a fashion identical to the one used for stall regulation and a corresponding adjustment in the pitch angle curve (Figure 5d). Though there did not seem to be an objective, practical reason for using this strategy, using the same rotor speed curve is a useful tool for assessing the effect of the rotor thrust on the rotor dynamics, as simulated by FAST, and, consequently, on the fatigue loading and damage.

2.2.3. Wind Field Simulation

An important step in the creation of a dynamic aeroelastic simulation of a wind turbine rotor is the generation of a time-varying wind field, large enough to cover the whole rotor. Using stochastic wind fields, as opposed to a homogeneous wind speed over the swept rotor area, makes a critical difference for the purposes of fatigue assessments. As shown below, because of the finite (non-zero and not one) spatial coherence of real-life wind fields, the periodic rotation of the wind turbine translates into a time-varying stochastic wind speed signal with periodic components at any given location along the rotor blade. These periodic components correspond to the fundamental rotor frequency and its harmonics. Evidently, such periodic loading has a significant impact on fatigue loading.
QBlade has a computational tool for the creation of such wind fields based on stochastic temporospatial simulation. The following parameters were used in the present work:
  • Simulation time (s): All simulations were performed for 600 s (10 min)
  • Rotor radius (m): This parameter must be slightly larger than the rotor radius, to avoid convergence problems in the FAST simulation; therefore, R was set to 4 m
  • Hub height of the turbine (m): 15 m
  • Average speed (m/s): This parameter was varied from 3 m/s–20 m/s in order to assess the fatigue damage of each of the turbines for a large range of wind speed classes. The final set of simulations used for this work was limited to the range between 7 m/s and 20 m/s since the damage for lower wind speeds was found to be practically zero
  • Turbulence intensity ( % ) : Two sets of Turbulence Intensities (TI) were assumed, one corresponding to “high” and another to “low” TI. Given that TI depends on the average speed, the following formula, taken from the standard IEC61400-2, was used to adjust TI for each run:
    σ v [ m / s ] = 15 + a V hub 1 + a × I 15 ,
    where TI = σ v / v ¯ , a = 2 , and I 15 = 0.16 for low turbulence intensity, as well as a = 3 and I 15 = 0.18 for high TI.
Figure 6 shows a spatial wind field map for one instant taken from the simulation of 600 seconds with an average speed of 10 m/s and a high level of turbulence intensity (corresponding to 21% according to Equation (7).

2.2.4. Aeroelastic Simulation

The last simulation step in QBlade corresponds to the aeroelastic simulation of each of the three wind turbines described above using FAST [34]. FAST is a simulator developed and maintained by the National Renewable Energy Laboratory (NREL) for the simulation of extreme and fatigue loads and is often considered a standard for aeroelastic wind turbine simulations. FAST is embedded in QBlade, which offers the user the advantage of being able to import directly the turbine configuration obtained from the previous design into FAST, and it conducts the simulation with a relatively minor configuration effort. However, a basic understanding of the parameters required for the setup of the simulations is vital. A selection of some of the relevant parameters is shown below:
  • StallMode [STEADY/BEDDOES]: This parameter is a flag indicating whether the Leishman–Beddoes dynamic stall model is to be used [34]. In the present work, StallMode was set to BEDDOES for the simulations of the stall-regulated turbine, whereas STEADY was used for the pitch simulations
  • InfModel [EQUIL/DYNIN]: This parameter decides whether a generalized Dynamic-wake model (DYNIN) or an Equilibrium-inflow model (EQUIL) should be used [34]. In this work, the EQUIL model was selected throughout.
  • HLModel [PRANDTL/NONE]: When using the equilibrium inflow model, this parameter allows including or disabling hub-loss calculations [34]. The options NONE was used throughout this work.
Most of the FAST parameters were found to have a negligible effect on the obtained results, with the notable exception of the StallMode parameter, where the wrong setting led to instabilities. Once a FAST simulation was correctly configured, the following output time series were obtained: wind speed at the hub height, output power and torque, axial force (rotor thrust), and moments for flapwise and edgewise bending. Figure 7 shows the time series results of the bending moments, axial force, and wind speed. By using the time series from Figure 7 and applying Equation (4), the equivalent stress over the blade root can be obtained. Figure 7 shows the corresponding time series.

2.2.5. Cycle Counting and Damage Calculation

The last four stages of the proposed methodology were implemented in a MATLAB script. The input data corresponded to the equivalent stress time series (Figure 7). The first step was cycle counting, which was done with the rainflow method; the MATLAB implementation was used for this purpose. The output matrix contained the number of events for a given stress amplitude/average stress value combination.
The second calculation processed the output of the rainflow analysis by means of the Goodman method to obtain the number of permissible cycles for each combination of stress amplitude and average value (Equation (2)). The maximum values for the tension and compression resistance are presented in Table A1 for the root section. The value of the m parameter in Equation (2) was set to 10, corresponding to epoxy resin composites, according to [31] (see Table 1). The safety factors were taken from Table 2. Additionally, γ M 0 = 1.35 . Table 4 presents the calculation of the safety factors.

2.2.6. Fatigue Life Estimation

In order to build a consistent fatigue life vs. wind speed curve, some post-processing is necessary. The reason for this is two-fold: (i) Given the relatively short simulation time for each wind speed class, each 10-min time series is not necessarily fully representative of the underlying stochastic process generating the wind field. This problem can be addressed by repeatedly running the wind field generator and FAST with the same parameters and a different seed and then averaging the results. However, since the current version of QBlade does not allow for batch mode processing, there are practical limits to this approach; (ii) for the given typical values of average wind speed and turbulence intensity, there is a significant overlap of the corresponding time series with neighboring classes; therefore, a mobile weighted average is an appropriate solution. In order to obtain the results presented in this work, wind fields were generated for wind speed averages in increments of 0.5 m/s. Then, the probability density function, for each hub height wind speed time series, was determined and used as the weighting function for determining the weighted average of the fatigue damage at the center wind speed class. This approach effectively increased the sampling horizon for each wind speed class and simultaneously accounted for the finite distribution of each time series.

3. Results and Discussion

We will start the Results Section by first inspecting some of the time series outputs produced directly by the aeroelastic simulation. 
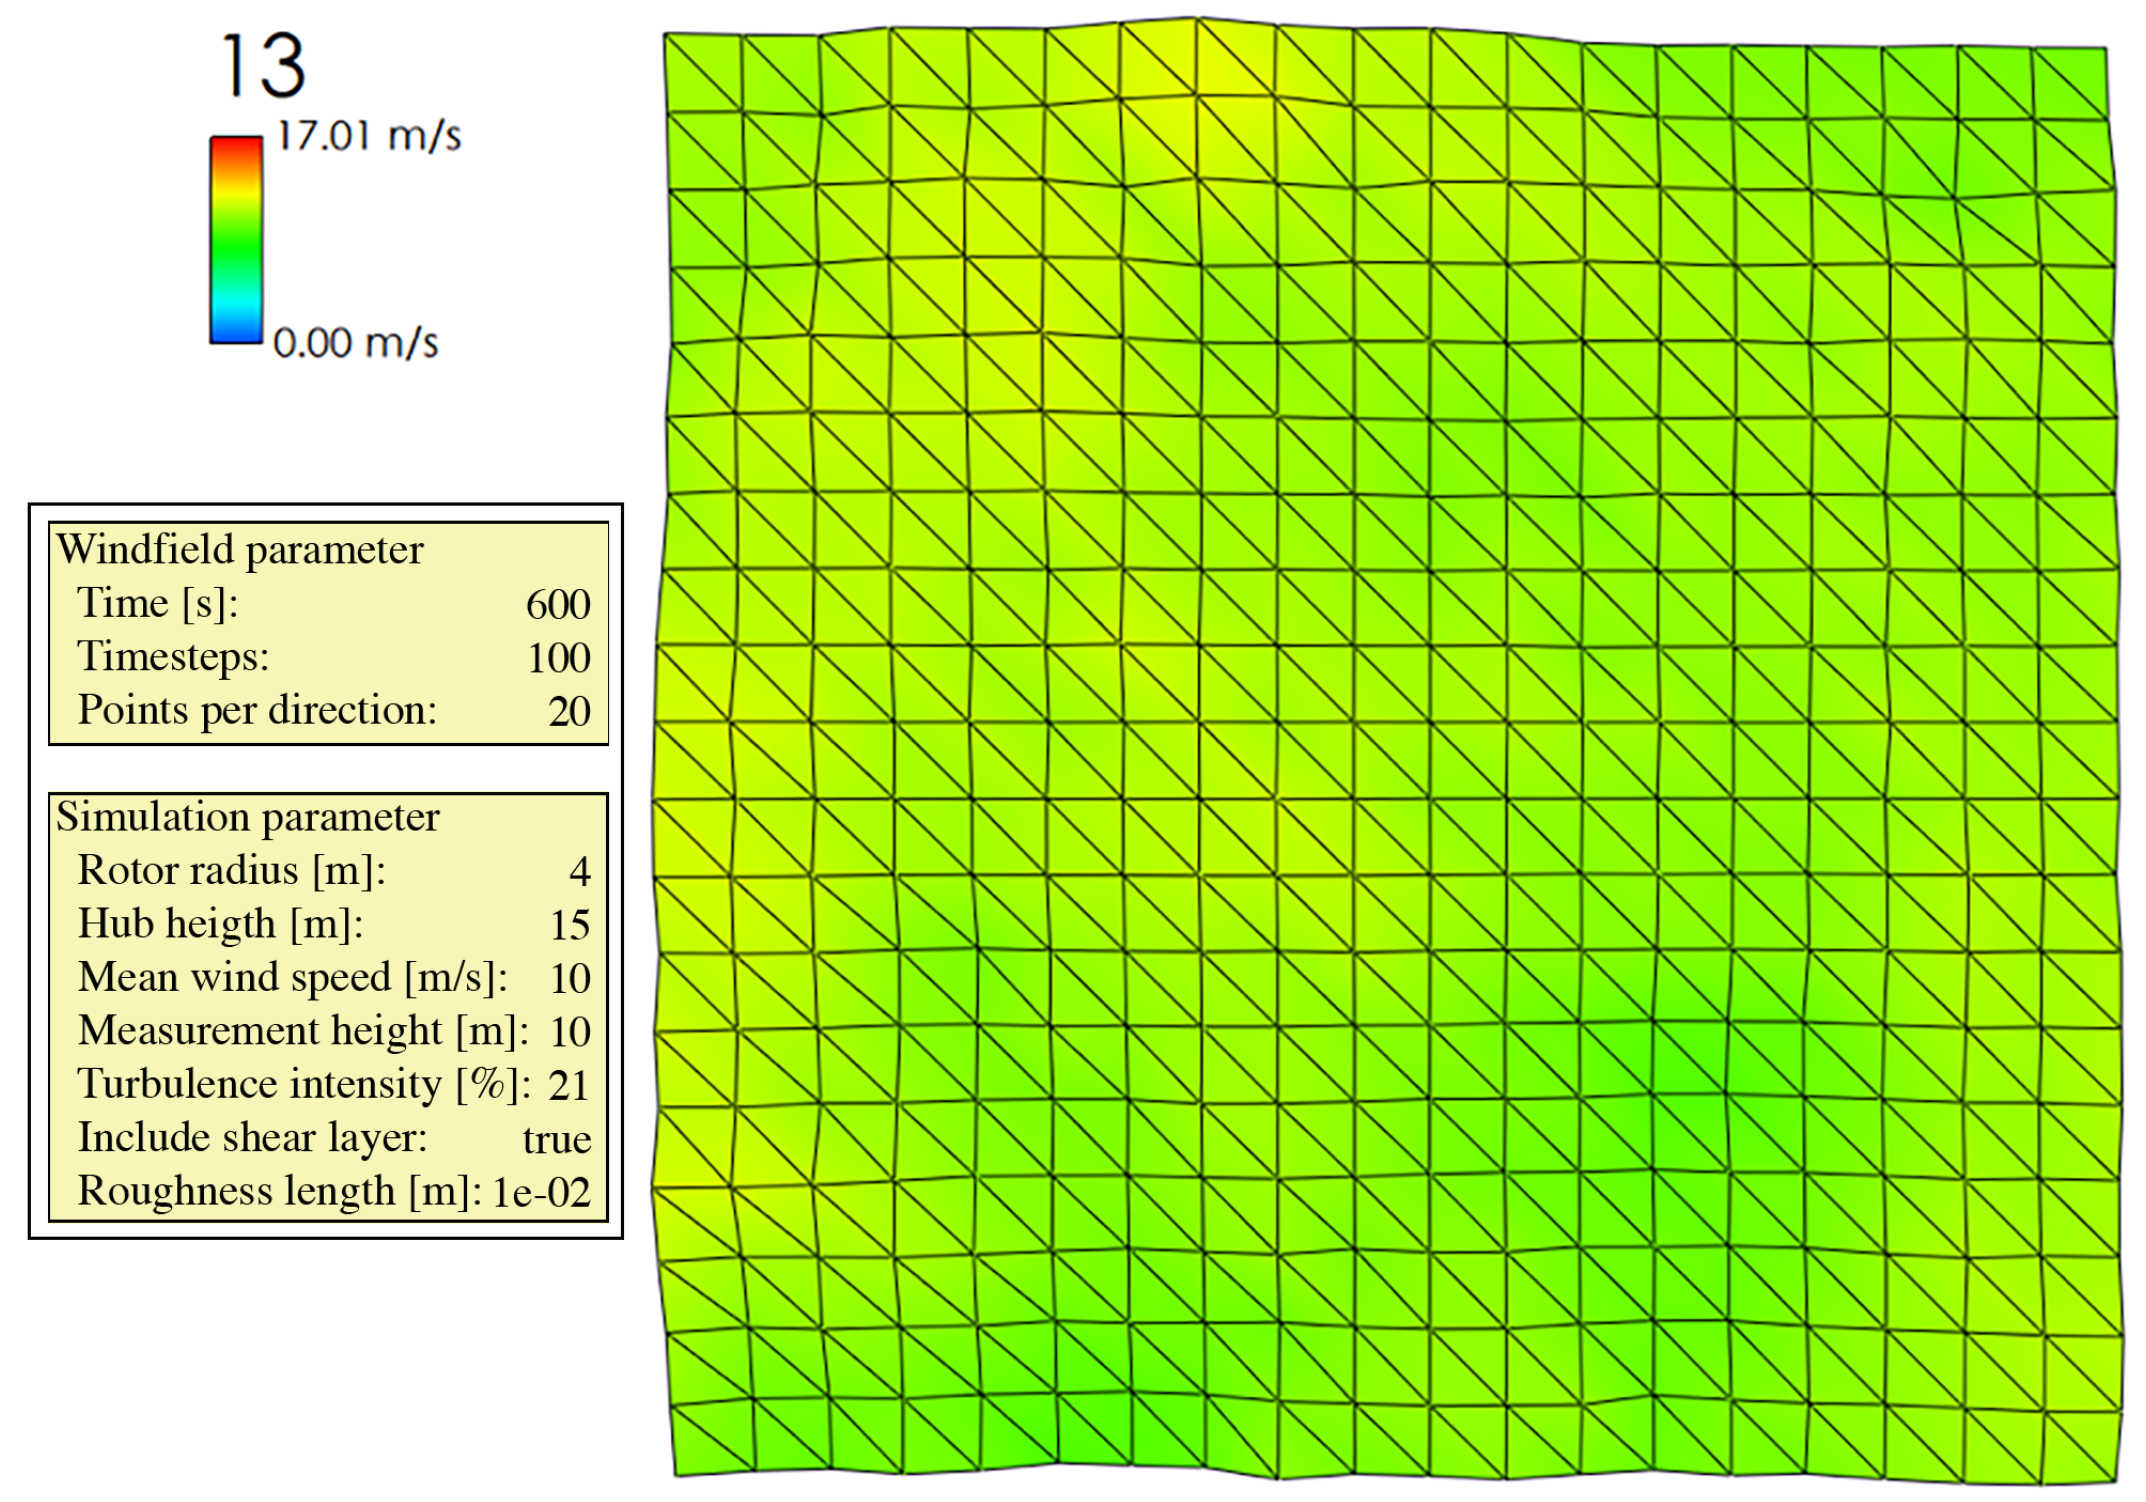
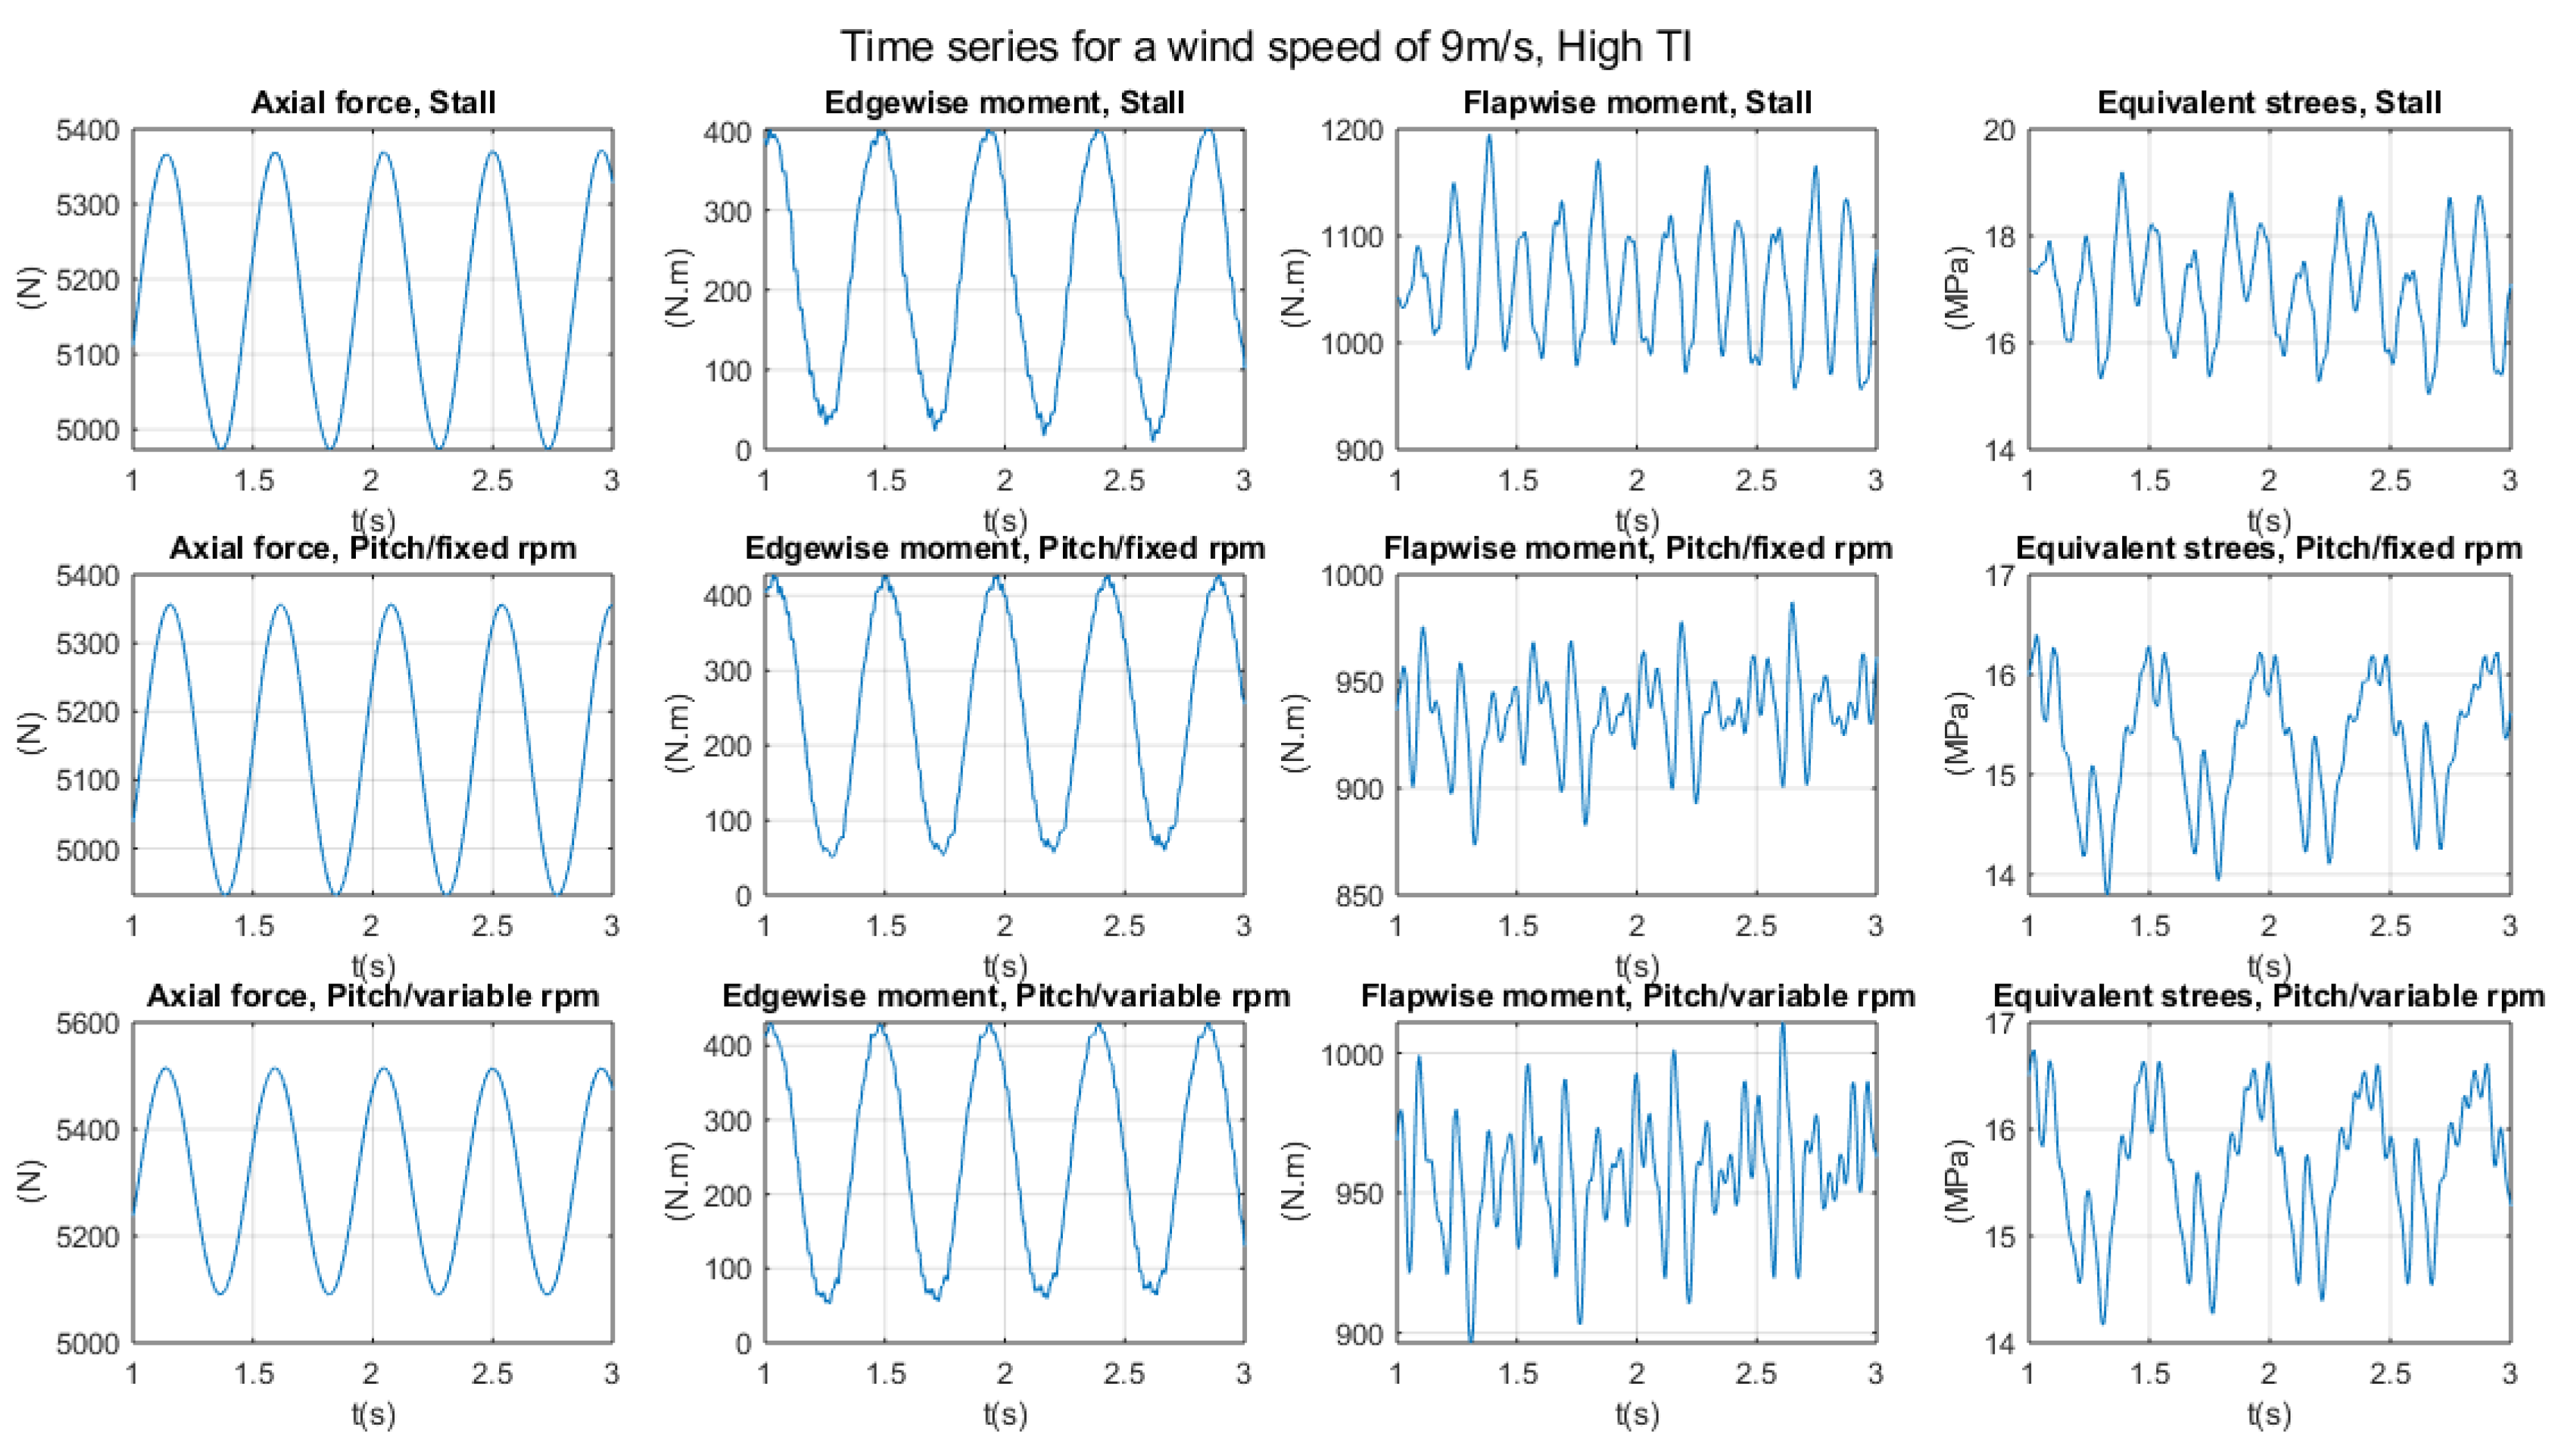
Figure 7 shows a short stretch of the time series results obtained for the case of an average wind speed of 9 m/s and a high turbulence intensity. It can be seen that the axial force (rotor thrust) and the in-plane (“edgewise”) bending moment showed an almost perfectly sinusoidal signal with a period of a little under half a second. By comparison to the power curve, it can be seen that this frequency was consistent with the rotor speed of 130 rpm, expected by design for a wind speed of 9 m/s. The amplitude of the rotor thrust oscillation was only about 5% of the average thrust, which is consistent with the fact that the rotor thrust always created a force in the downward direction, with a minor periodic variation, arising from the fact that the wind speed was higher at the top than at the bottom position. The amplitude of the edgewise oscillations, on the other hand, was almost 100% of the average value. This fact can be qualitatively understood by the observation that at the upper position, the blade sees the highest wind speed (and, consequently, also the highest in-plane force component), at the blade tip where the leverage is the highest, and conversely, the lowest wind speed (and therefore the smallest force) near the root where the leverage is the smallest. At the lower position, on the other hand, the point with the lowest wind speed has the highest leverage whereas the point with the smallest leverage has the highest wind speed. Evidently, this leads to a small in-plane bending moment at the bottom position of the blade and a high bending moment at the top. In any case, no significant difference was observed among the three regulation schemes. Note that the terrain roughness length used in the generation of the stochastic wind field was z 0 = 0.01 m, corresponding to a power law exponent of 0.136.
The situation at the out-of-plane or flapwise bending moment, as well as the resulting effective stress, is quite different. Not only were the average values higher for the stall-regulated wind turbine, but also could the presence of strong harmonics be detected, with a much stronger presence of harmonics in the case of stall regulation as compared to both pitch-regulation schemes, which had a nearly identical behavior between them, not unexpectedly, given the very similar regulation characteristics at 9 m/s.
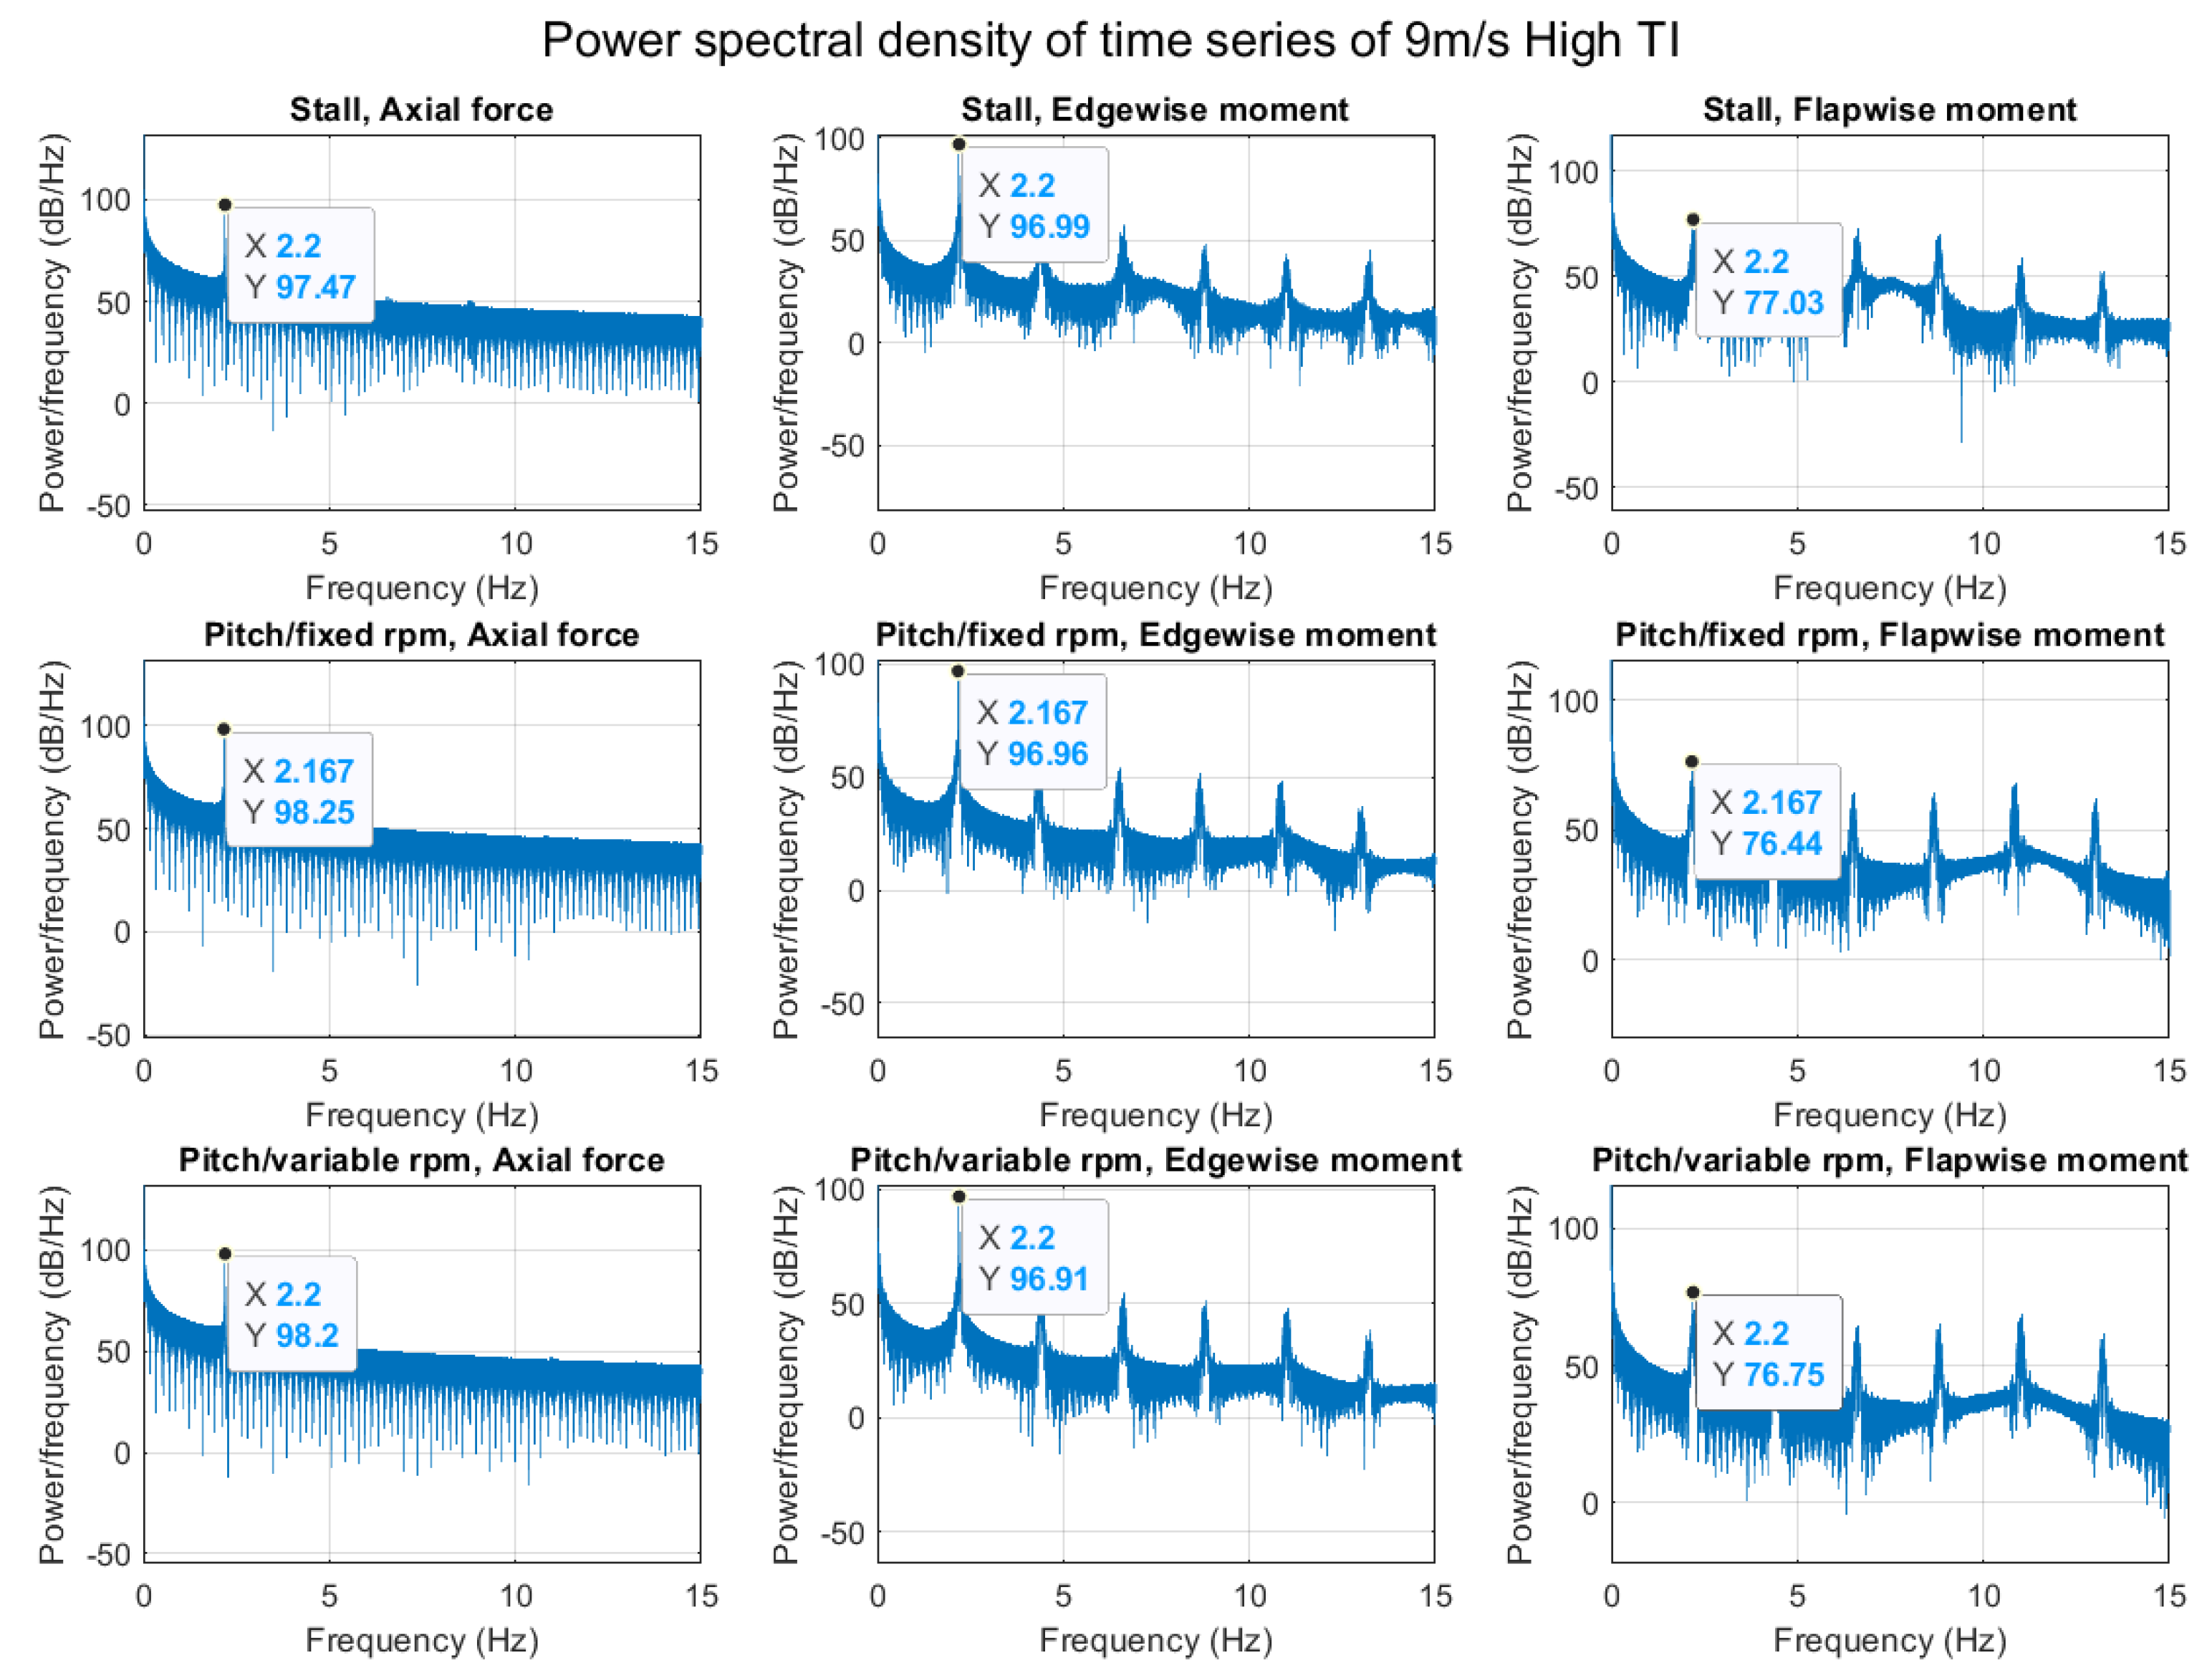
After receiving some initial insights from inspecting the time series, it is interesting to study the power spectra. In Figure 8, the primary outputs of the FAST simulation (thrust and bending moments) are shown for all three regulation schemes, again for the case of a 9-m/s wind speed. In the case of the axial force signal, one prominent peak at the primary rotor frequency can be observed, consistent with the almost perfectly sinusoidal signal shown in Figure 7. The situation at the bending moments, however, was quite different, as evidenced by the rich harmonic sequence in both sets of spectra. Whereas the periodicity of the rotor thrust signal can be plausibly interpreted as a result of the different wind speeds at the top and bottom positions of the blade, the periodicity of the bending moments can likely be attributed, at least in part, to the rotational sampling effect described above, which is expected to display a comb of harmonics. Regarding a possible distinction between the three regulation schemes, it can be noted that not only the stall regulation showed again the highest peak at the fundamental rotor frequency, but also was the first harmonics was stronger than those in the signals obtained from pitch regulation. Interestingly, the fourth harmonics seemed to be stronger in the pitch-regulated signal, but its overall contribution was small.
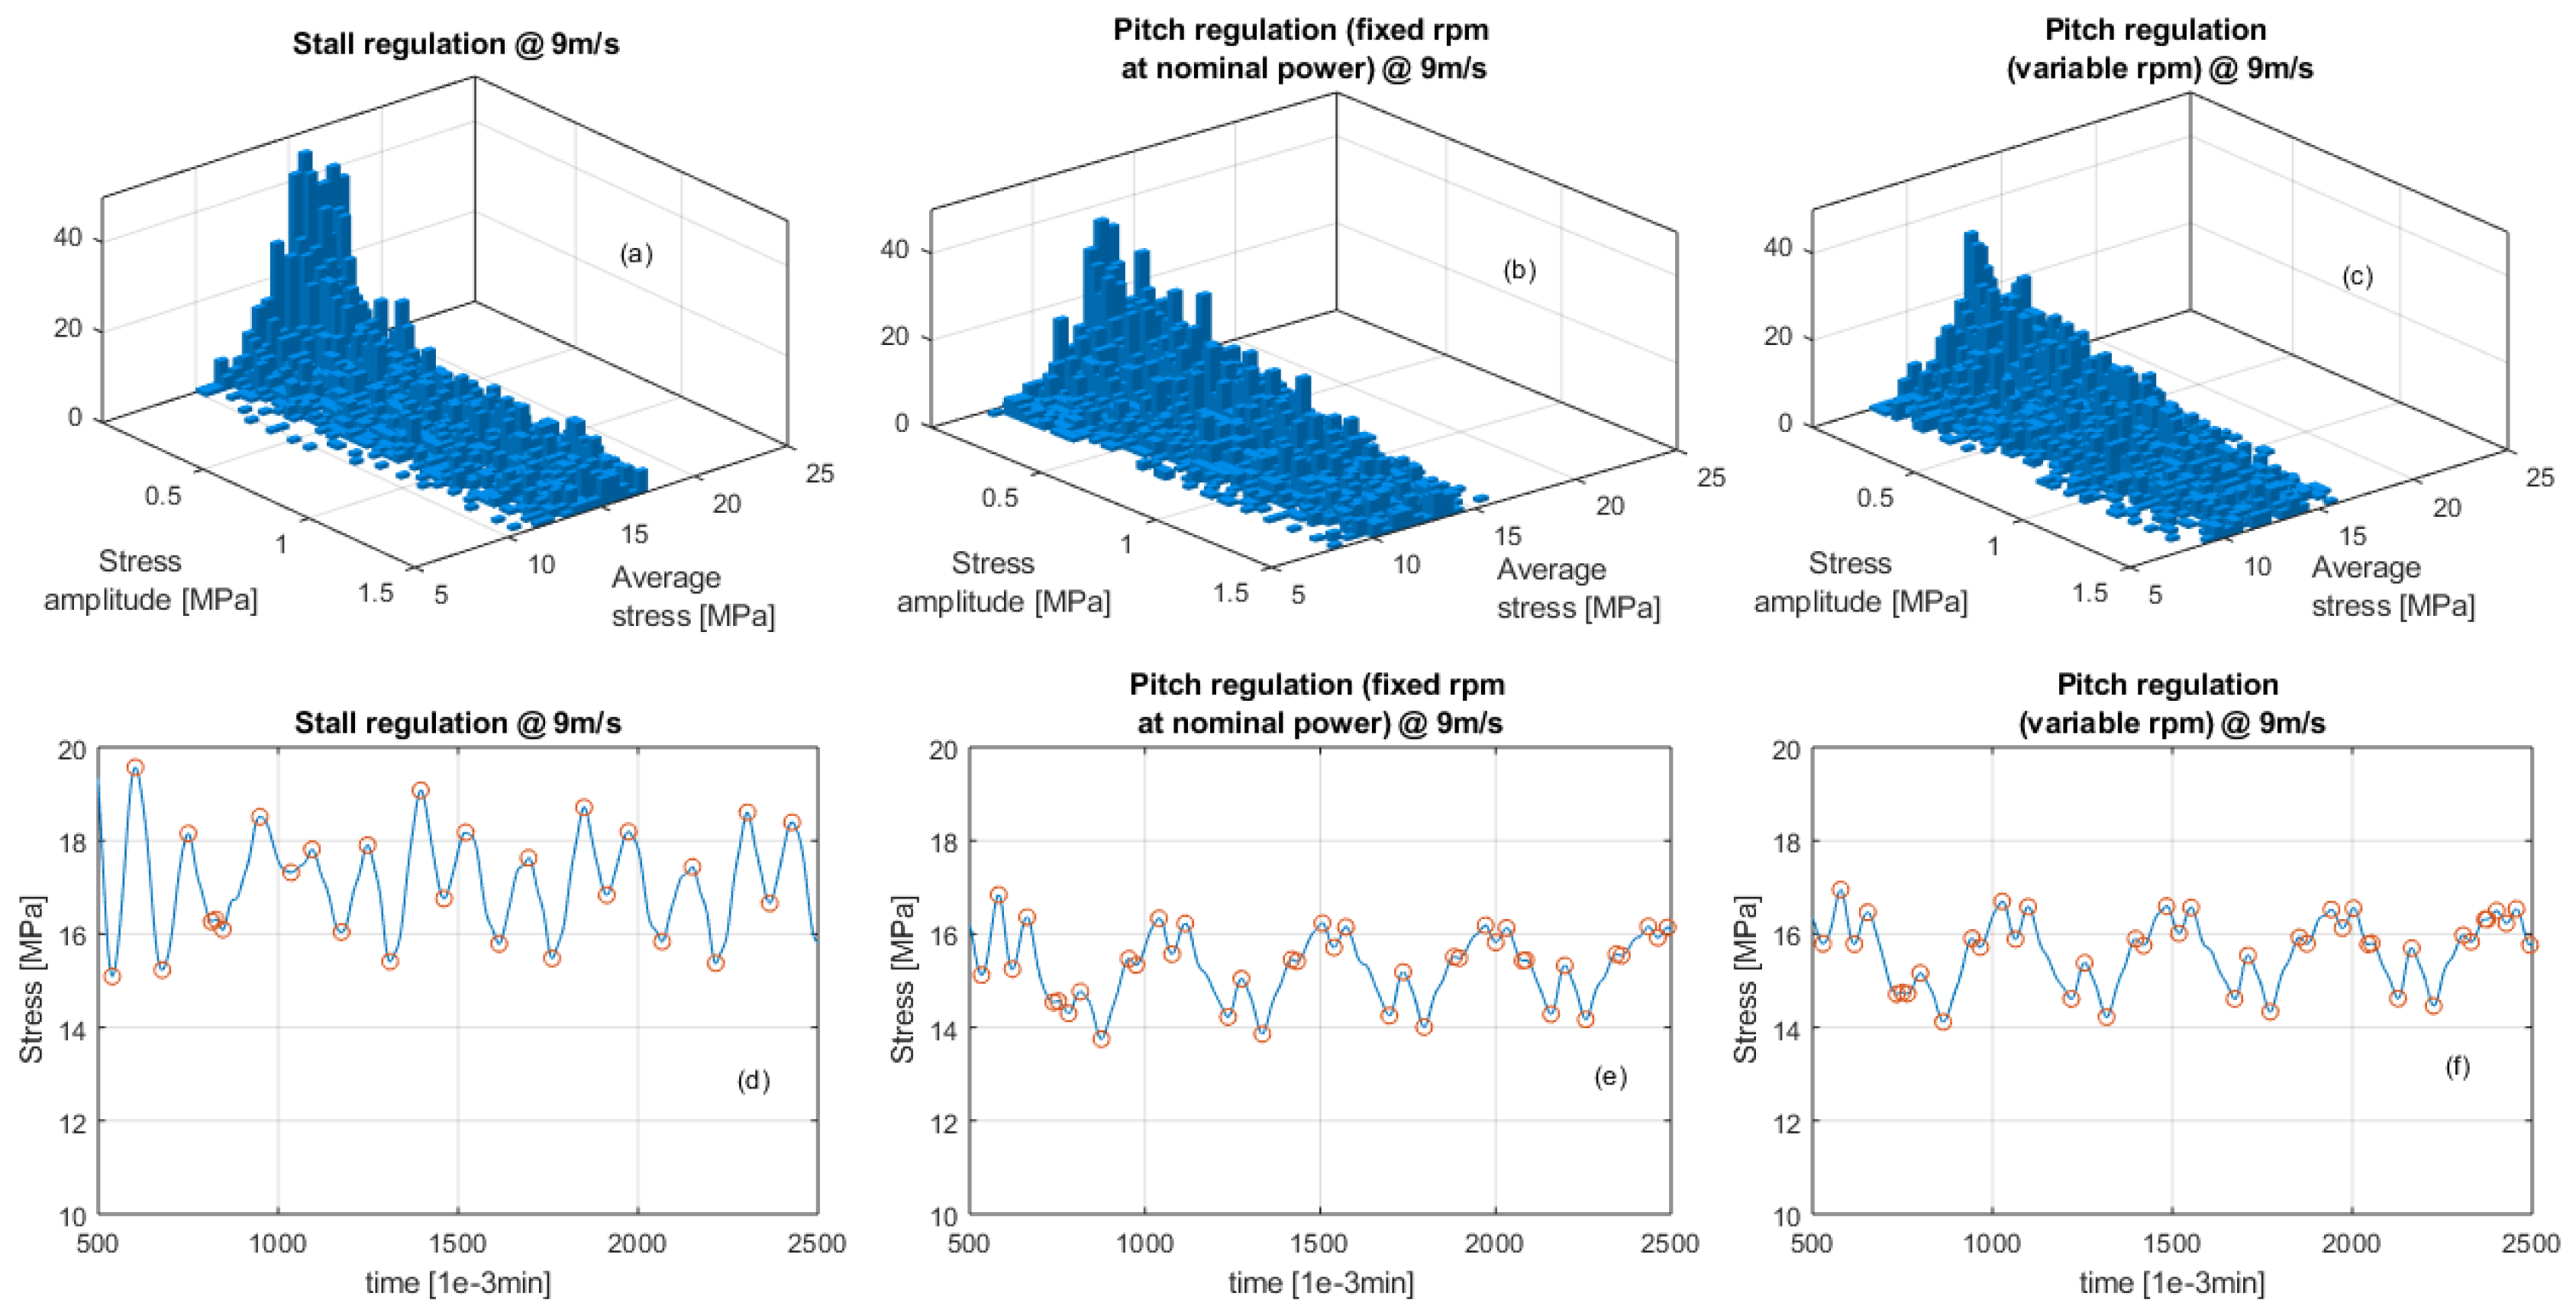
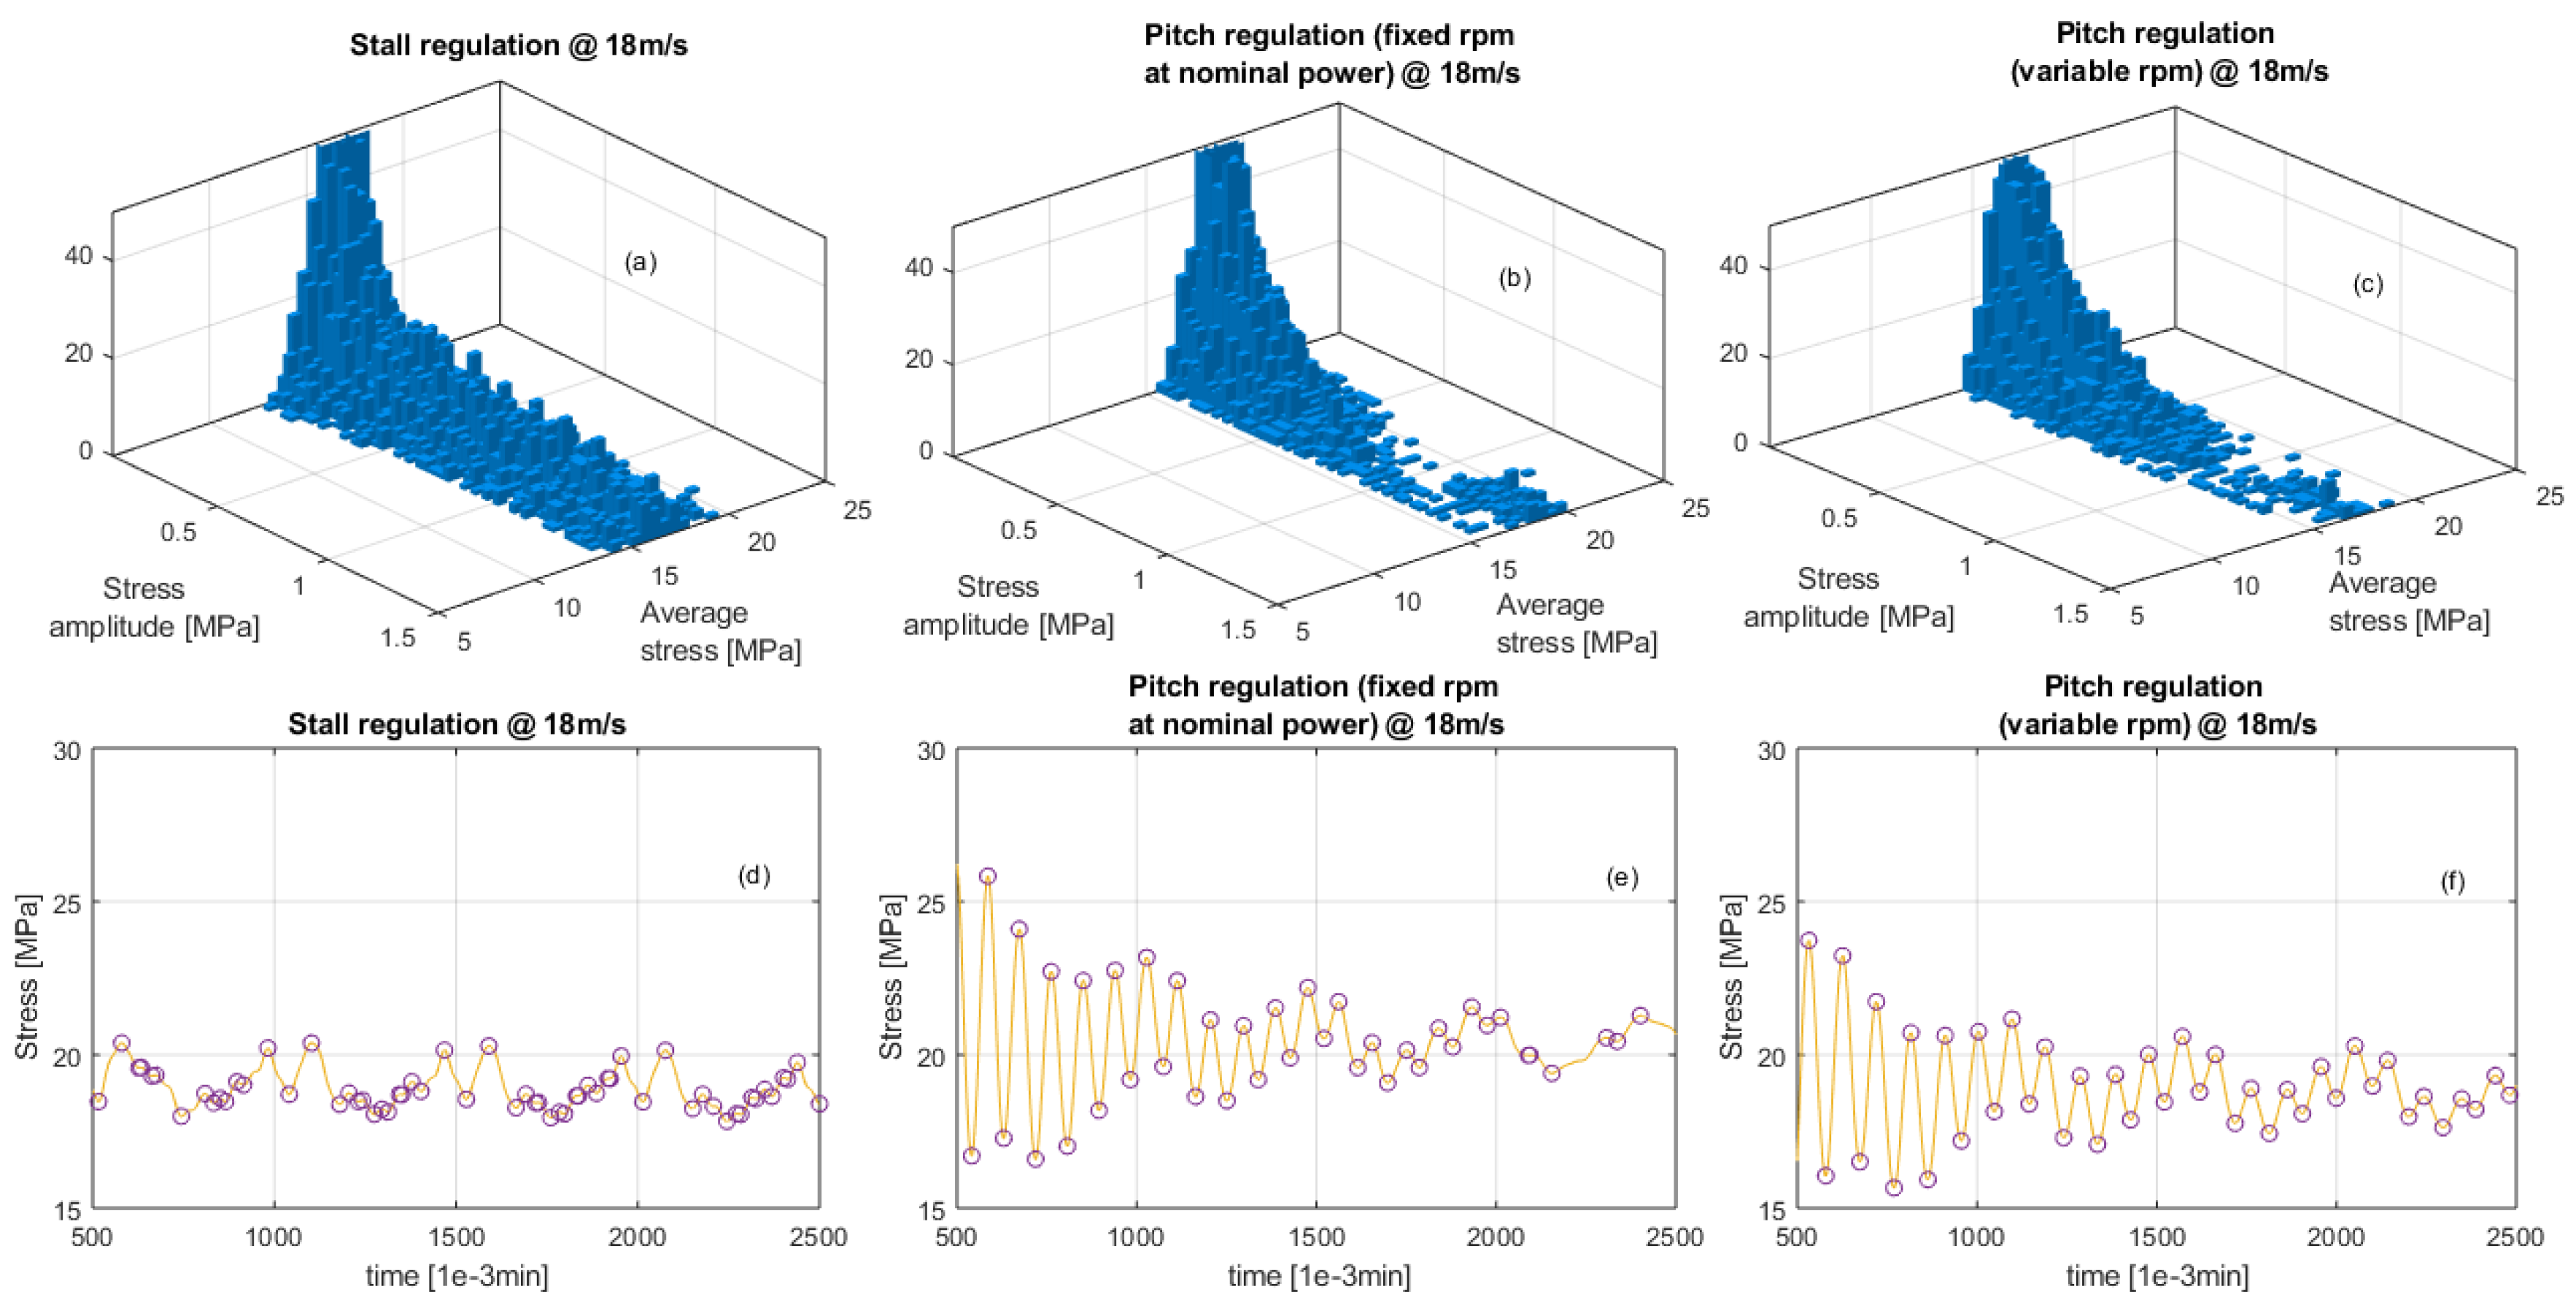
Having collected these initial insights, some of the results of the rainflow analysis will now be inspected. In Figure 9, the results obtained with the rainflow counting analysis of the stress time series obtained with each of the regulation schemes are shown (upper row), as well as short segments of the corresponding time series. Additionally, the inflection points as identified by the rainflow algorithm are marked for clarity. Prior to generating these diagrams, the stress time series were subjected to some moving-average filtering in order to eliminate the large number of very small-amplitude cycles, which do not contribute to fatigue damage, but obscure the direct comparison between the bivariate histograms.
As shown in Figure 9, the higher load level in the stall-regulation scheme, with vanishing differences between the two pitch-regulated schemes, become apparent. Not only is the average stress level higher (as evidenced by both the bivariate histogram and the time series segment), but also are the stress cycles deeper. The situation changed quite drastically when a higher average wind speed, specifically 18 m/s, was considered. As shown in Figure 10, at this wind speed, the stall-regulated signal now showed a significantly smaller average stress and also a smaller depth of the stress cycles. As opposed to the 9-m/s case, the two pitch regulation schemes now showed some differentiation, with the variable rpm pitch variant exhibiting a lower average stress, very similar to the one experienced by the stall regulated turbine, albeit with a higher alternating component.
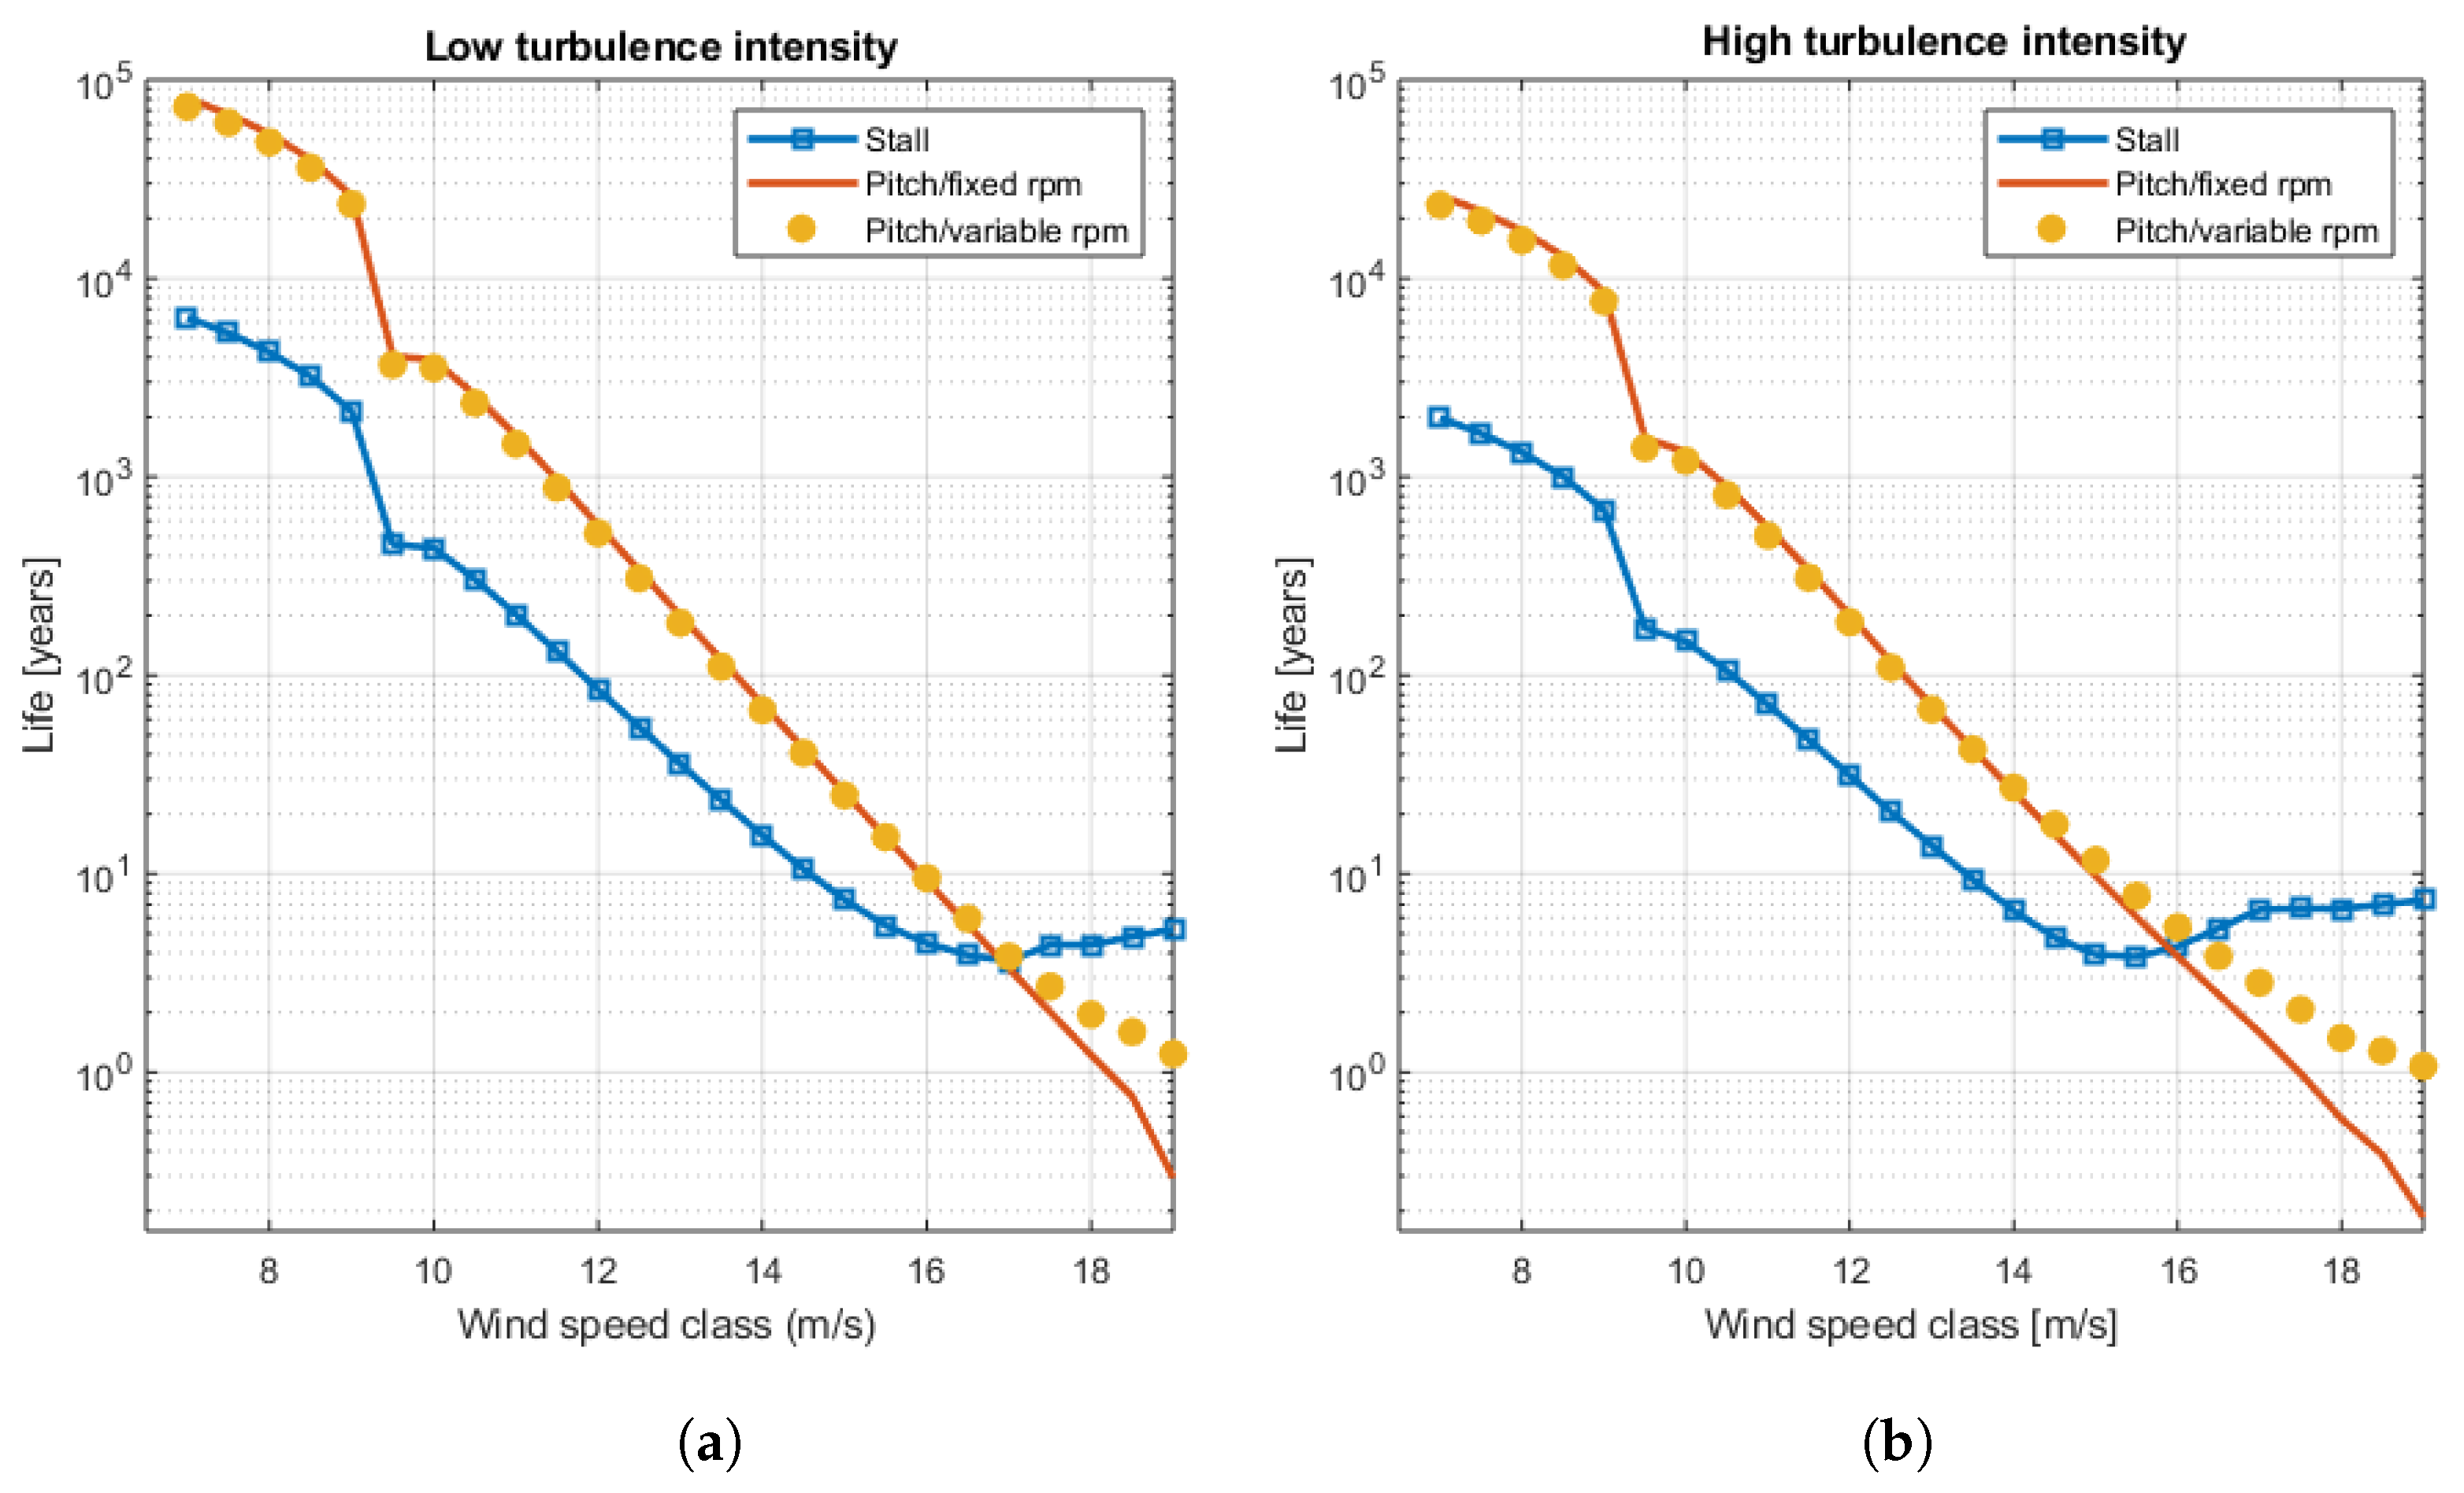
After these preparations, a fatigue life diagram can now be constructed as a function of the wind speed class. Figure 11 shows such a diagram for low (Figure 11a) and high levels of the turbulence intensity (Figure 11b). A number of things can be observed: first of all, and not unexpectedly, fatigue life decayed rapidly with wind speed; note the logarithmic scale of the figure. For each increase in wind speed by about 2 m/s, a reduction in fatigue life by one order of magnitude was observed, so evidently higher wind speeds put a higher strain on the rotor. Secondly, higher turbulence intensity generally led to higher fatigue damage, also an expected finding. This effect was also substantial: the higher turbulence cases showed a fatigue life about half an order of magnitude smaller than their low-turbulence counterparts, except for very high wind speeds (16 m/s and higher). This is clear evidence of the fact that the stress cycle amplitude (rather than the average stress) is the main driver behind fatigue degradation, at least for most of the wind speeds encountered in a normal wind climate.
Thirdly, and most importantly in the context of the present study, the type of power/rotor speed regulation makes a difference, and a great one. For medium wind speeds (7 m/s–10 m/s), the stall-regulated turbine experiences a fatigue damage about an order of magnitude larger than the pitch-regulated wind turbines. This differentiation was, again, expected since stall-regulated wind turbines experience a far more turbulent environment in their regulation regime, as compared to pitch-controlled turbines where flow remains attached most of the time. In the present case, the difference between the design operating conditions in the wind speed range between 8 m/s and 10 m/s was actually relatively small between the stall- and pitch-regulated turbines, since the pitch designs used in this work shared a “soft stall” with the stall turbine in that wind speed range, so the difference in fatigue life observed in Figure 11 was larger than one would expect. A plausible explanation for this is the use of the stall model used in the aeroelastic simulations; as mentioned above, reliable simulations without instabilities require the use of the Leishman–Beddoes dynamic stall model in the FAST program, whereas the pitch-regulated wind turbines were always simulated assuming steady flow conditions, even in the regime between 8 m/s and 10 m/s, where “soft stall” conditions could arise.
The difference in fatigue life between the stall- and the pitch-regulated turbines became gradually smaller with wind speed and even inverted its sign at very high wind speeds. This cross-over occurred at 17 m/s for the low turbulence intensity cases and at 16 m/s for high TI. Similarly, the fatigue life curve for the pitch-regulated turbine with variable rotor speeds started to separate from the fixed-rpm curve, after being almost indistinguishable for all lower wind speeds. This joint behavior of both the stall and the variable-rpm pitch turbine clearly pointed to a common rotor speed-related root cause. The fact that this departure from the general trend of the fatigue life curves occurred for smaller wind speed classes in the case of high turbulence is readily attributed to the fact that the filter mask for the moving-average calculation used to get to Figure 11 had a larger spread to neighboring wind speed classes in this case, leading to an effectively larger averaging window. Therefore, the effect of the rpm reduction occurring in the stall- and variable-rpm pitch turbines manifested itself at lower wind speeds. Other than that, the underlying effect appears to be the same. The most likely candidate for an explanation was the axial force or rotor thrust. At high wind speeds, the average thrust diminishes again in the case of the stall and variable-rpm pitch regulation, below the average thrust value of the fixed-rpm pitch-regulated wind turbine (not shown for brevity). This mechanism is likely to explain the observed behavior at very high wind speeds.
Now, after the differences in fatigue life between the three regulation schemes and their underlying root causes have been discussed with some detail, it is convenient to close the discussion with some considerations regarding the practical implications of the regulation schemes introduced in this work. A simple way of doing this is by convoluting the damage function D ( v , TI , reg ) with a Weibull distribution function characteristic of a given wind regime, as described above, and then applying Equation (4) in order to obtain the corresponding (average) fatigue life. As mentioned before, the primary damage function was assumed to be zero for wind speed averages lower than 7 m/s, meaning D ( v < 7 m / s , TI , reg = 0 ; additionally, only wind speed classes up to 20 m/s were considered; for higher values, the turbines were assumed to be parked, and fatigue damage accumulated during parked conditions was assumed to be negligible; therefore, D ( v > 20 m / s , TI , reg = 0 . Damage resulting from extreme events cannot, of course, be ruled out, but this is outside the scope of the current study.
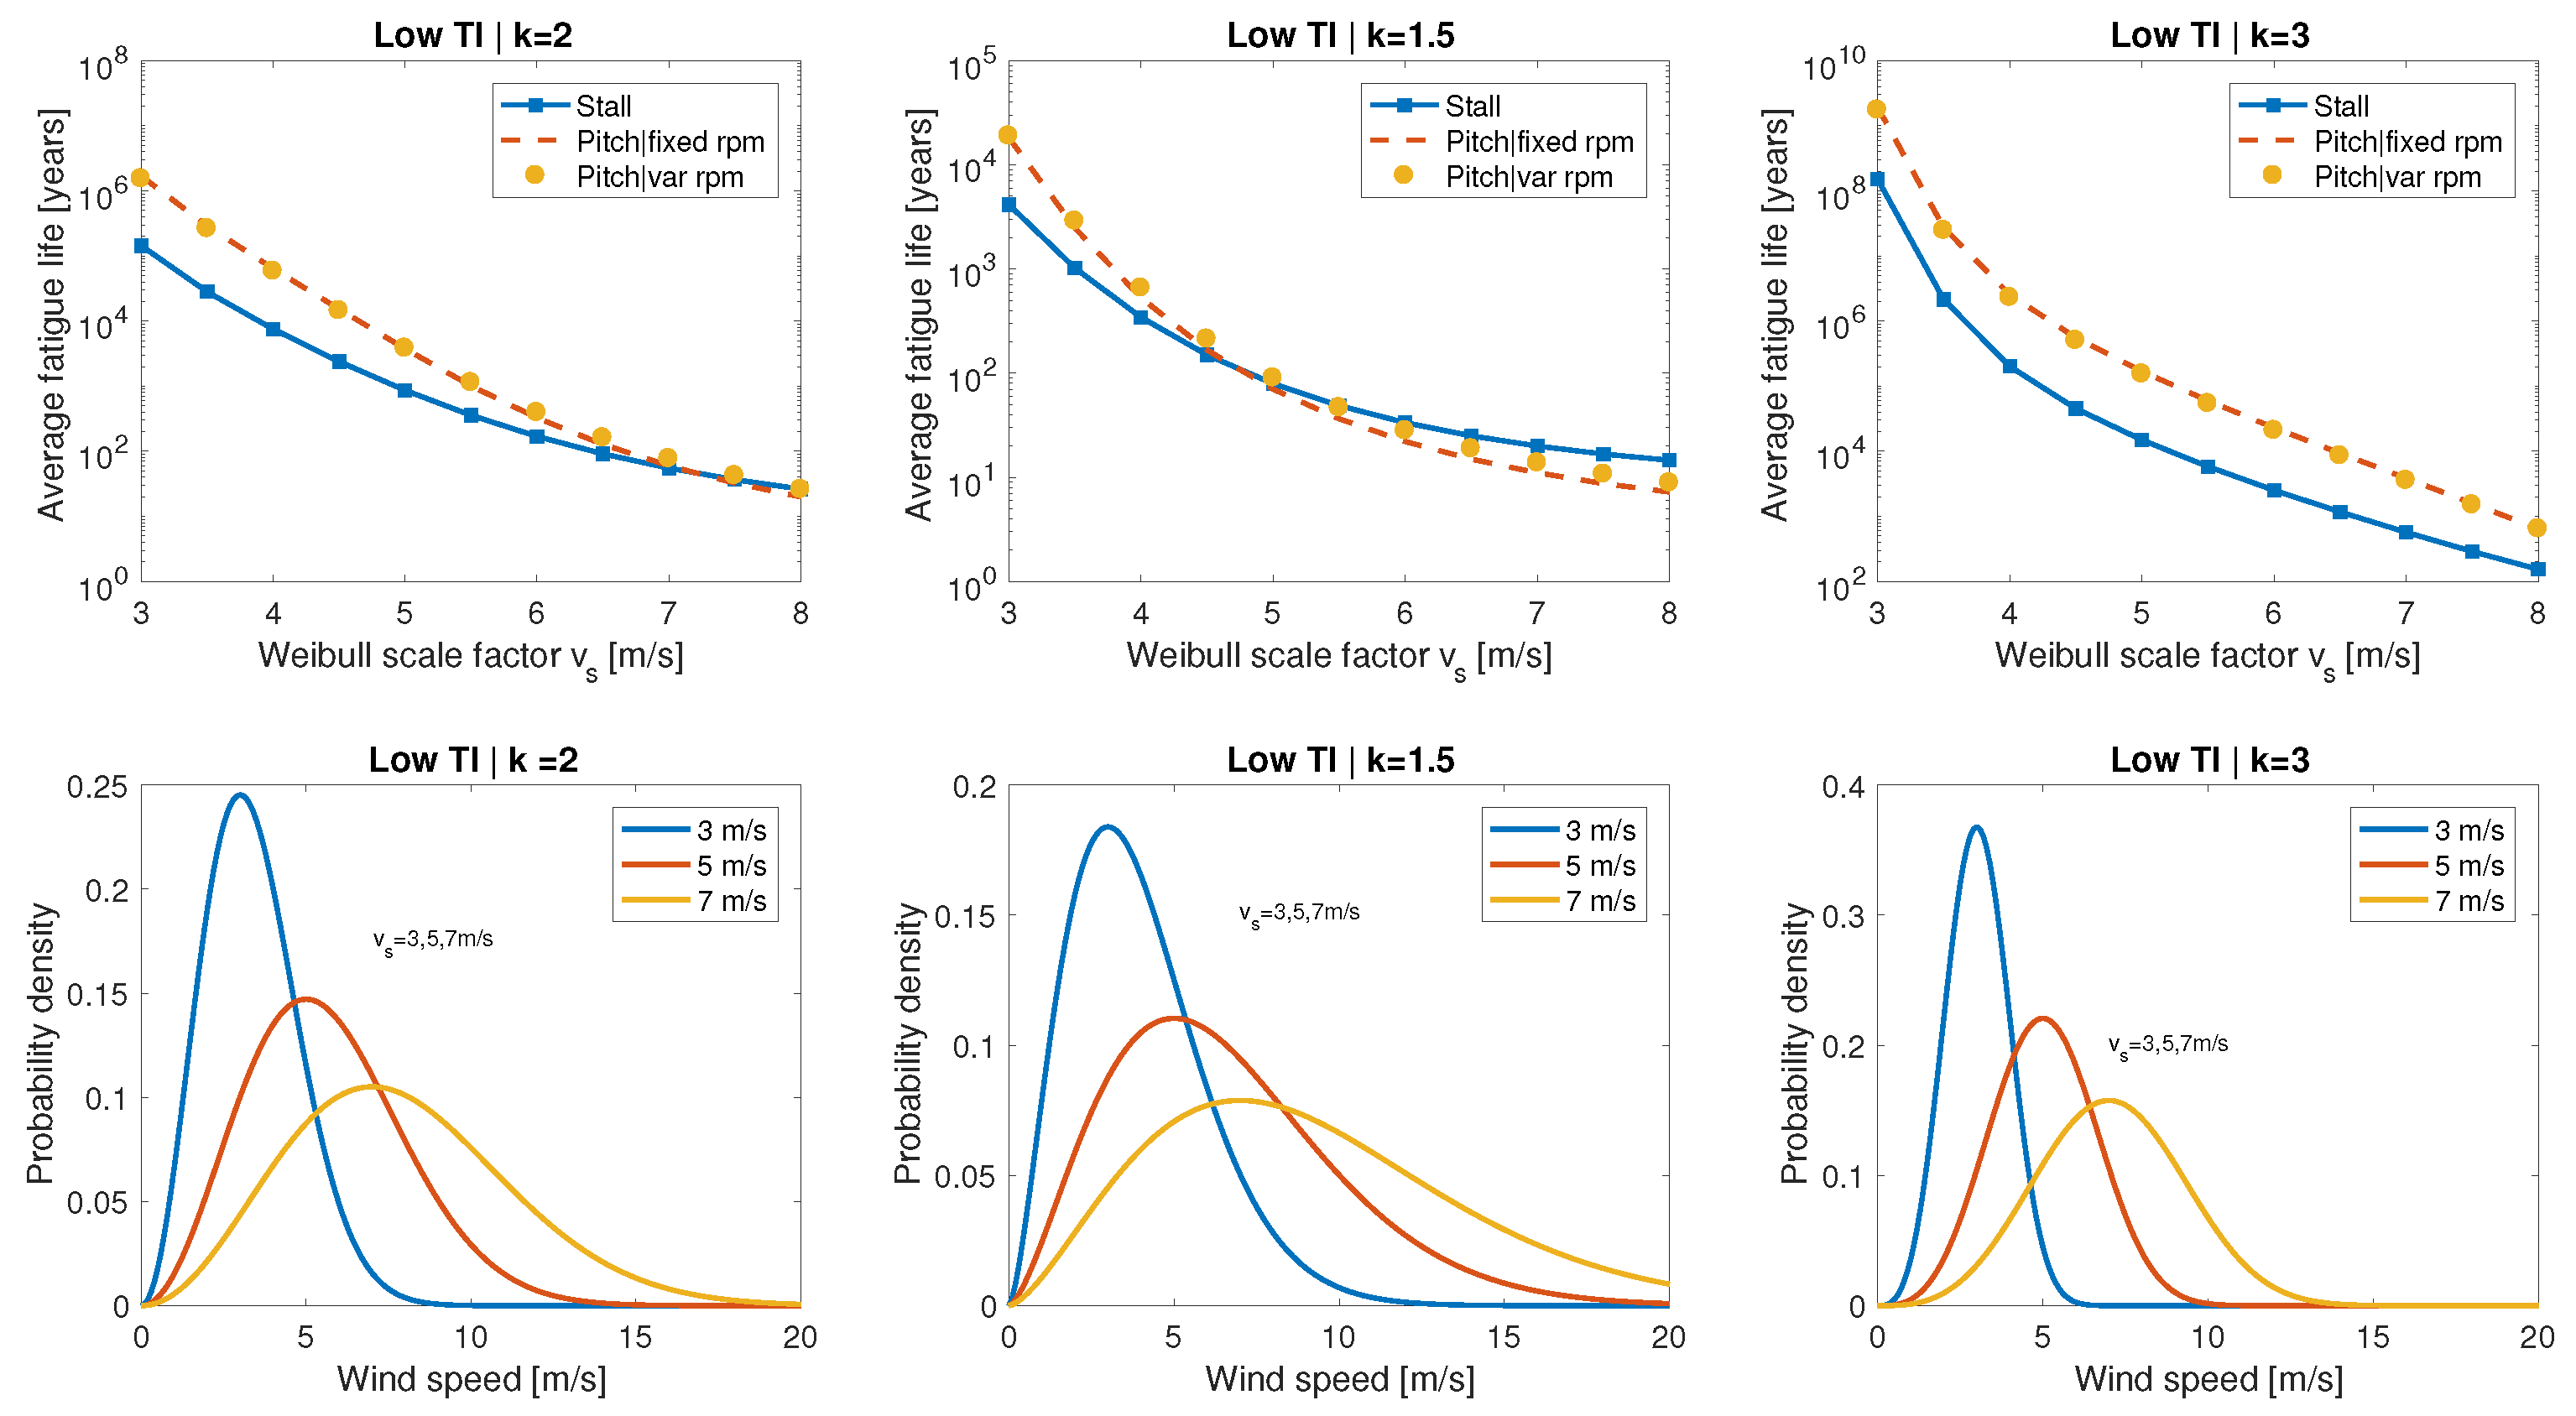
In Figure 12, the results for the average fatigue life are shown for the cases of low TI levels. The upper rows show the fatigue as a function of the Weibull scale factor v s , whereas the lower row has the corresponding Weibull probability density functions for selected v s values (3 m/s, 5 m/s, and 7 m/s). The columns are organized according to their Weibull shape factor ( k = 2 , 1.5 , 3 ). In the standard case of k = 2 (also referred to as a Rayleigh distribution), the normal ordering was largely conserved, with the stall-regulated turbine showing the lowest average fatigue life up to Weibull scale factors of about 7 m/s. Given that most small wind turbines operated at sites within this wind speed range, it is safe to say that normally stall regulation will lead to lower fatigue life. The differentiation was somewhat exacerbated in the case of k = 3 , where the average fatigue life of stall turbines remained consistently about an order of magnitude below that of their pitch-regulated counterparts. This stronger differentiation can be attributed to the narrower distributions obtained in the case of k = 3 . Conversely, sites with a low shape factor, as illustrated by the k = 1.5 case, showed wider distributions, leading to a cross-over between the stall and pitch fatigue life curves, at Weibull shape factors as low as about 4.5 m/s. The situation at high TI levels was analogous to the one at low TI; therefore, the corresponding graphs were omitted for brevity.

4. Summary and Conclusions

A comparative fatigue study was conducted for three small wind turbine power/rotor speed control schemes, one based on stall regulation and two others on pitch regulation. The rotor of the stall-regulated turbine was designed previously to co-optimize the objectives of high power coefficient at partial load, a flat power curve under nominal conditions with small excursions of the rotor speed, and favorable starting performance. The first pitch-controlled turbine design was based on a published large-scale blade, which was downscaled to the blade length of the stall design and afterwards fine-tuned. A second pitch-regulated wind turbine was designed by emulating the rotor speed function of the stall-regulated turbine; the objective was to separate any rpm-related effects in the fatigue damage from the intrinsic behavior of the stall and pitch regulation, respectively.
A methodology for fatigue damage assessment based on a combination of an aeroelastic simulation and the simplified model proposed in the IEC-61400-2 standard was designed and implemented. Fatigue life curves for two levels of turbulence intensity (adjusted to their respective average wind speeds) were calculated for all three regulations schemes as a function of the wind speed class. An exponential decay of the fatigue life was observed over a large range of average wind speeds, from 7 m/s to about 16 m/s, for all schemes. While the fixed-rpm pitch-regulated schemes continued to decay with the same law for even higher wind speeds, the fatigue life curves for the stall-regulated turbine were found to level off afterwards; the reduced rotor thrust coefficient, resulting from a reduced rotor speed at high wind speeds, was identified as the main underlying cause. Consistently, a similar behavior was observed for the pitch design with variable rotor speed.
Average fatigue life curves as a function of the Weibull scale factor were calculated for all cases and for different Weibull shape factors. Under typical wind regime conditions and small to moderate average wind speeds, the stall turbine exhibited a larger average fatigue damage, as expected. This difference was less pronounced for wind regimes with smaller shape factors, given the broader wind speed distributions. In all cases, both pitch- and stall-regulated wind turbines showed an average fatigue life in excess of several decades for wind speeds typically encountered in small wind turbine locations.

Author Contributions

Conceptualization, O.P.; data curation, B.L. and J.P.-C.; formal analysis, O.P.; funding acquisition, O.P.; investigation, B.L., J.P.-C., and L.I.M.; methodology, D.C. and O.P.; project administration, O.P.; resources, D.C. and L.I.M.; software, B.L.; supervision, O.P.; visualization, B.L. and O.P.; writing, original draft, L.I.M. and O.P.; writing, review and editing, O.P.

Funding

Three of the authors (D.C., L.I.M., and O.P.) acknowledge funding from FSE/CONACYT through the project P19 (“Control strategies for reliability in small wind turbines”) of the Mexican Center for Innovation in Wind Energy (CEMIE Eólico). B.L. and J.P.-C. acknowledge a tuition scholarship for their M.Sc. studies at Tecnológico de Monterrey and a stipend from CONACYT/PNPC under Program Number 5602.

Acknowledgments

D.C., L.I.M, and O.P appreciate the opportunity to participate in project P09 (“Design of wind turbine blades”) of the CEMIE Eólico. D.C. and O.P. would also like to thank the Energy and Climate Change group at Tecnológico de Monterrey for support. L.I.M. appreciates support from Tecnológico de Monterrey and Universidad de Cuenca.

Conflicts of Interest

The authors declare no conflict of interest.

Appendix A

Table A1. Blade materials.
Tri-Axial MaterialBidirectional Material
Density (kg/m 3 )19001810
Young module (GPa)26.911.8
X t (MPa)131128
X c (MPa)599131
Table A2. Stall wind turbine blade geometry.
Pos (m)Chord (m)Twist ( )AirfoilReynolds Number
00.12520Circular100,000
0.10.12520Circular100,000
2.430.48425DU210_22794,126
0.3680.37618DU210_22668,736
0.4730.3511.53DU210_21660,289
0.5830.339.09DU210_20657,824
0.6830.3127.25DU210_19650,773
0.7930.2975.91DU210_19648,334
0.8930.2844.93DU210_18644,009
1.0030.2734.25DU210_17643,540
1.1030.2633.77DU210_17640,649
1.2130.2543.43DU210_16639,978
1.3130.2463.19DU210_16637,957
1.4230.2393DU210_14638,624
1.5230.2322.83DU210_14636,073
1.6330.2262.66DU210_14636,483
1.7330.2212.48DU210_14637,019
1.8430.2162.28DU210_14637,953
1.9430.2112.06DU210_14636,508
2.0530.2071.81DU210_14638,509
2.1530.2031.54DU210_12638,453
2.2630.1991.26DU210_12638,856
2.3630.1960.97DU210_12640,628
2.4730.1920.68DU210_12639,616
2.5730.1890.387DU210_12640,226
2.6830.1870.097DU210_12644,794
2.7830.184−0.197DU210_12644,428
2.8930.181−0.505DU210_12644,546
2.9930.179−0.85DU210_12646,829
3.1530.177−1.241DU210_12654,205
Table A3. Pitch wind turbine blade geometry
Pos (m)Chord (m)Twist ( )FoilReynolds Number
00.220Circular100,000
0.10.220Circular100,000
0.2430.50321717.86NACA 4412794,126
0.3680.47532616.49NACA 4412668,736
0.4730.43599414.4NACA 4412660,289
0.5830.39633712.78NACA 4412657,824
0.6830.33362811.59NACA 4412650,773
0.7930.30406710.28NACA 4412648,334
0.8930.2823579.38NACA 4412644,009
1.0030.2644348.48NACA 4412643,540
1.1030.2469977.77NACA 4412640,649
1.2130.2346256.94NACA 4412639,978
1.3130.2262376.35NACA 4412637,957
1.4230.216865.72NACA 4412638,624
1.5230.2107055.13NACA 4412636,073
1.6330.2038754.59NACA 4412636,483
1.7330.1985564.09NACA 4412637,019
1.8430.1930043.62NACA 4412637,953
1.9430.1881383.26NACA 4412636,508
2.0530.1828722.89NACA 4412638,509
2.1530.1788182.59NACA 4412638,453
2.2630.1749032.35NACA 4412638,856
2.3630.1716612.19NACA 4412640,628
2.4730.1685922.12NACA 4412639,616
2.5730.1659712.125NACA 4412640,226
2.6830.1634382.23NACA 4412644,794
2.7830.1612152.4NACA 4412644,428
2.8930.1589692.68NACA 4412644,546
2.9930.1569593.06NACA 4412646,829
3.1530.1539773.77NACA 4412654,205

References

  1. Global Wind Statistics 2017; Technical Report; Global Wind Energy Council: Brussels, Belgium, 2018.
  2. Gupta, A.; McIntyre, A. Hype Cycle for Sustainability Technology; Technical Report; Gartner: Stamford, CT, USA, 2017. [Google Scholar]
  3. Fleck, B.; Huot, M. Comparative life-cycle assessment of a small wind turbine for residential off-grid use. Renew. Energy 2009. [Google Scholar] [CrossRef]
  4. Battisti, L.; Benini, E.; Brighenti, A.; Dell’Anna, S.; Castelli, M.R. Small wind turbine effectiveness in the urban environment. Renew. Energy 2018, 129, 102–113. [Google Scholar] [CrossRef]
  5. Pinheiro, E.; Bandeiras, F.; Gomes, M.; Coelho, P.; Fernandes, J. Performance analysis of wind generators and PV systems in industrial small-scale applications. Renew. Sustain. Energy Rev. 2019, 110, 392–401. [Google Scholar] [CrossRef]
  6. Dimitriou, A.; Kotsampopoulos, P.; Hatziargyriou, N. Best practices of rural electrification in developing countries: Technologies and case studies. MedPower 2014, 2014, 1–5. [Google Scholar] [CrossRef]
  7. Parida, A.; Choudhury, S.; Chatterjee, D. Microgrid Based Hybrid Energy Co-Operative for Grid-Isolated Remote Rural Village Power Supply for East Coast Zone of India. IEEE Trans. Sustain. Energy 2018, 9, 1375–1383. [Google Scholar] [CrossRef]
  8. Kavlak, G.; McNerney, J.; Trancik, J.E. Evaluating the causes of cost reduction in photovoltaic modules. Energy Policy 2018, 123, 700–710. [Google Scholar] [CrossRef] [Green Version]
  9. Soter, S.; Wegener, R. Development of Induction Machines in Wind Power Technology. In Proceedings of the 2007 IEEE International Electric Machines Drives Conference, Antalya, Turkey , 3–5 May 2007; Volume 2, pp. 1490–1495. [Google Scholar] [CrossRef]
  10. Macquart, T.; Maheri, A. A stall-regulated wind turbine design to reduce fatigue. Renew. Energy 2019, 133, 964–970. [Google Scholar] [CrossRef]
  11. Audierne, E.; Elizondo, J.; Bergami, L.; Ibarra, H.; Probst, O. Analysis of the furling behavior of small wind turbines. Appl. Energy 2010, 87, 2278–2292. [Google Scholar] [CrossRef]
  12. Arifujjaman, M.; Iqbal, M.T.; Quaicoe, J.E. Energy capture by a small wind-energy conversion system. Appl. Energy 2008, 85, 41–51. [Google Scholar] [CrossRef]
  13. Burlibaşa, A.; Ceangă, E. Rotationally sampled spectrum approach for simulation of wind speed turbulence in large wind turbines. Appl. Energy 2013, 111, 624–635. [Google Scholar] [CrossRef]
  14. Yang, W.; Peng, Z.; Wei, K.; Tian, W. Structural health monitoring of composite wind turbine blades: Challenges, issues and potential solutions. IET Renew. Power Gener. 2017, 11, 411–416. [Google Scholar] [CrossRef]
  15. Rubiella, C.; Hessabi, C.A.; Fallah, A.S. State of the art in fatigue modelling of composite wind turbine blades. Int. J. Fatigue 2018, 117, 230–245. [Google Scholar] [CrossRef]
  16. Post, N.L.; Case, S.W.; Lesko, J.J. Modeling the variable amplitude fatigue of composite materials: A review and evaluation of the state of the art for spectrum loading. Int. J. Fatigue 2008. [Google Scholar] [CrossRef]
  17. Ardila, O.G.C.; Lennie, M.; Branner, K.; Pechlivanoglou, G.; Nayeri, C.; Paschereit, C.O. Comparing Fatigue Life Estimations of Composite Wind Turbine Blades using different Fatigue Analysis Tools. In Proceedings of the 20th International Conference on Composite Materials, Copenhagen, Denmark, 19–24 July 2015; pp. 1–14. [Google Scholar]
  18. IEC_61400-1. Wind Energy Generation Systems—Part 1: Design Requirements; International Electrotechnical Commission (IEC): Geneva, Switzerland, 2019. [Google Scholar]
  19. Hayat, K.; Asif, M.; Ali, H.T.; Ijaz, H.; Mustafa, G. Fatigue life estimation of large-scale composite wind turbine blades. In Proceedings of the 2015 12th International Bhurban Conference on Applied Sciences and Technology (IBCAST), Islamabad, Pakistan, 13–17 January 2015; pp. 60–66. [Google Scholar] [CrossRef]
  20. Kong, C.; Kim, T.; Han, D.; Sugiyama, Y. Investigation of fatigue life for a medium scale composite wind turbine blade. Int. J. Fatigue 2006. [Google Scholar] [CrossRef]
  21. Wilkins, E.W.C. Cumulative damage in fatigue. In Proceedings of the Colloquium on Fatigue/Colloque de Fatigue/Kolloquium über Ermüdungsfestigkeit, Stockholm, Sweden, 25–27 May 1956. [Google Scholar] [CrossRef]
  22. Vassilopoulos, A.P.; Keller, T. Fatigue of Fiber-Reinforced Composites; Engineering Materials and Processes; Springer: London, UK, 2011. [Google Scholar] [CrossRef]
  23. IEC_61400-2. Wind Turbines—Part2: Design and Requirements for Small Wind Turbines; International Electrotechnical Commission (IEC): Geneva, Switzerland, 2006. [Google Scholar]
  24. Evans, S.; Bradney, D.; Clausen, P. Assessing the IEC simplified fatigue load equations for small wind turbine blades: How simple is too simple? Renew. Energy 2018, 127, 24–31. [Google Scholar] [CrossRef]
  25. Kennedy, C.R.; Jaksic V, L.S.B.C. Fatigue life of pitch- and stall-regulated composite tidal turbine blades. Renew. Energy 2018, 121, 688–699. [Google Scholar] [CrossRef] [Green Version]
  26. Marten, D.; Wendler, J. QBlade Guidelines v0.6; Technical Report; Berlin, Germany. 2013. Available online: https://pdfs.semanticscholar.org/1885/8285e209c482c74c368af688e23bed080971.pdf (accessed on 28 December 2018).
  27. Nijssen, R.P.L. Fatigue Life Prediction and Strength Degradation of Wind Turbine Rotor Blade Composites. Ph.D. Thesis, Delft University of Technology, Delft, The Netherlands, 2007. [Google Scholar]
  28. Rivera, J.A.; Aguilar, E.; Cárdenas, D.; Elizalde, H.; Probst, O. Progressive failure analysis for thin-walled composite beams under fatigue loads. Compos. Struct. 2016, 154, 79–91. [Google Scholar] [CrossRef]
  29. Cardenas, D.; Elizalde, H.; Probst, O. Progressive failure analysis of wind turbine blades under stochastic fatigue loads. Ingeniería Mecánica Tecnología y Desarrollo 2017, 5, 459–473. [Google Scholar]
  30. Mikel, M. Simulación de Ensayos a Fatiga en Palas de Aerogeneradores. Ph.D. Thesis, Universidad Pública de Navarra, Navarra, Spain, 2010. [Google Scholar]
  31. Guideline for the Certification of Wind Turbines; Technical Report; Germanischer Lloyd: Hamburg, Germany, 2010.
  32. Lee, H.G.; Kang, M.G.; Park, J. Fatigue failure of a composite wind turbine blade at its root end. Compos. Struct. 2015, 133, 878–885. [Google Scholar] [CrossRef]
  33. Wu, J.; Lai, F. Fatigue Life Analysis of Small Composite Sandwich Wind Tuebine Blades. Procedia Eng. 2011, 14, 2014–2020. [Google Scholar] [CrossRef]
  34. Jonkman, B.J.; Jonkman, J.M. FAST v8.16.00a-bjj User’s Guide. Nrel. 2016; 58p. Available online: https://wind.nrel.gov/nwtc/docs/README_FAST8.pdf (accessed on 28 December 2018).
  35. Garcia, M.; San-Martin, J.C.; Favela-Contreras, A.; Minchala, L.I.; Cardenas-Fuentes, D.; Probst, O. A simple approach to predictive control for small wind turbines with an application to stress alleviation. Control. Eng. Appl. Inform. 2018, 20, 69–77. [Google Scholar]
  36. Hansen, M.H.; Hansen, A.; Larsen, T.J.; Øye, S.; Sørensen, P.; Fuglsang, P. Control Design for a Pitch-Regulated, Variable Speed Wind Turbine; Technical Report; Risø National Laboratory: Roskilde, Denmark, 2005. [Google Scholar]
Figure 1. Overall methodology used in this work.
Applsci 09 04632 g001
Figure 2. Representative airfoils for turbines using stall (DU-210_xx airfoils) and pitch regulation (NACA 4412 airfoil), respectively.
Applsci 09 04632 g002
Figure 3. Blade geometry.
Applsci 09 04632 g003
Figure 4. Chord and twist functions for the stall and pitching blades.
Applsci 09 04632 g004
Figure 5. Operation curves of the WTs’ designs: power curve, rotational speed, torque curves, and pitch angle.
Applsci 09 04632 g005
Figure 6. Field wind simulation 10 m s with high turbulence intensity.
Applsci 09 04632 g006
Figure 7. Results of the aeroelastic simulation for an average wind speed of 9 m/s and high turbulence intensity: time series.
Applsci 09 04632 g007
Figure 8. Results of the aeroelastic simulation for an average wind speed of 9 m/s and high turbulence intensity: power spectra.
Applsci 09 04632 g008
Figure 9. Results of the rainflow analysis for 9 m/s. Upper row (ac): results of the rainflow analysis for the three regulation schemes. Lower row (df): corresponding time series with inflection points marked.
Applsci 09 04632 g009
Figure 10. Results of the rainflow analysis for 18 m/s. Upper row (ac): results of the rainflow analysis for the three regulation schemes. Lower row (df): corresponding time series with inflection points marked.
Applsci 09 04632 g010
Figure 11. Fatigue life as a function of the wind speed class for all three power regulation schemes. (a) Low turbulence intensity. (b) High turbulence intensity.
Applsci 09 04632 g011
Figure 12. Average fatigue life as a function of the Weibull scale factor v s for all three power regulation schemes, different Weibull shape factors, and low turbulence intensity. Upper row: average fatigue life. Lower row: corresponding Weibull distributions for selected v s values.
Applsci 09 04632 g012
Table 1. Values of the parameter m [31].
Materialm
Films with polyester resin9
Films with epoxy resin10
Polymeric films reinforced with carbon14
Table 2. Values of safety factors [31].
ValueDescription
C 1 a 1.35Influence of aging
C 2 a 1.1Temperature effect
C 3 a 1.1Films produced by resin infusion
1.2Films produced by pressure
C 4 a 1.0Post-cured film
1.1Non-post-cured film
C 2 b 1.1Temperature effect
C 3 b 1.0Unidirectional reinforcement
1.1No tissues
1.2Tissues and mat
C 4 b 1.0Post-cured film
1.1Non-post-cured film
C 5 b   1.0 to 1.2
Table 3. Operational characteristics of the three wind turbine designs studied in this work.
Stall RegulationPitch RegulationVariable Speed Pitch Regulation
Nominal power10 kW10 kW10 kW
V cut - in , V d , V cut - out 3 m/s–11 m/s–20 m/s3 m/s–11 m/s–20 m/s3 m/s–11 m/s–20 m/s
Rotational speedVariableNominal: 130 rpmVariable
Pitch angle β 0VariableVariable
Variable losses13%13%13%
λ o p t 6.16.216.21
Table 4. Calculation of the safety factors.
C 1 a 1.35 γ M a = γ M 0 i = 1 4 C i a = 2.64627
C 2 a 1.1
C 3 a 1.2
C 4 a 1.1
C 2 b 1.1 γ M b C 1 b = γ M 0 i = 2 5 C i b = 1.9602
C 3 b 1.0
C 4 b 1.1
C 5 b 1.2

