1. Introduction
Soft soil subgrades with high compressibility and low strength are often encountered in engineering practice. Generally, the mechanical properties of these subgrades cannot meet the requirements of practical engineering conditions. It is necessary to make ground improvements to avoid serious damage to the roadbed, pavement, and even the upper road structures [
1,
2,
3,
4]. As a typical example of the chemical improvement method, cement soil is widely applied to various roadbed treatment projects due to its advantages of good integrity, strong water stability, and low cost [
5,
6,
7,
8,
9]. However, a large number of tests show that, due to the defects of low tensile strength, large brittleness, and poor deformability, cement soil is not suitable for every kind of project [
10,
11,
12,
13]. In response to the above problems, many researchers have proposed a variety of improved methods based on different materials [
14,
15,
16,
17,
18,
19,
20], and found that the use of fiber reinforcement technology as a method for improving the mechanical properties performed well in terms of soil improvement [
21,
22].
In recent years, studies [
23,
24,
25] show that adding some fibers into the cemented soil can improve the tensile strength, toughness, bearing capacity of soil, and brittle failure to some extent. Tran et al. [
26] conducted unconfined tests on cement soil samples with different fiber mass contents; their results showed that the modification of a soil sample was optimum with a fiber mass content of 3‰– 5‰. Ayeldeen et al. [
27] carried out unconfined compressive tests on cemented soft soil samples with different fiber mass contents and found that the compressive strength first increases and then decreases as the fiber mass content increases in samples. When the fiber mass content was around 5‰, the compressive strength reached its maximum value. Yang et al. [
28] conducted unconfined tests on cement loess samples with different polypropylene (PP) fiber mass contents and found that fibers have the best effect on the compressive strength and ductility in samples with 4‰ fiber mass content. Estabragh et al. [
29] performed unconfined tests on PP fiber cement soft soils with different lengths and contents and pointed out that the compressive strength and tensile strength of cement soft soils increased with the increase in fiber mass content within a certain range, while the fiber length had little effect. By using the direct tensile test and split test results, Xiao and Liu [
30] investigated the effect of randomness in orientation of fibers on the tensile strength of a sample. In their study, two types of fibers were considered, namely, PP and polyvinyl alcohol (PVA) fibers. A prediction model was proposed for the tensile strength of cement-admixed clays. The above literature review suggests that fiber reinforcement is a good soil improvement measure, but few have considered the effect of confining pressure. In reality, the ground improvement level is often buried below the ground level. Sometimes the buried depth is as high as 30 m or even deeper. In such circumstances, the confining pressure is likely to affect the mechanical behavior of the cemented soils.
In this study, a series of triaxial unconsolidated undrained (UU) tests was carried out under different confining pressures. The brittleness index was introduced as the criterion for identifying brittle failure. The modification effects of different confining pressures and fiber mass contents on cement subgrade soil are discussed to provide a reference for the application of polypropylene fiber-cement-treated subgrade soil (PCS) in practical engineering problems.
2. Experimental Scheme
2.1. Test Material and Equipment
The soil was taken from Shaoxing City, Zhejiang Province. The specific physical properties are shown in
Table 1. PO32.5 Portland cement was used for the test. Polypropylene (PP) fiber of 6-mm length was used, which had chemical stability, strong gripping force with the surface of cement subgrade soil, and high tensile strength. The main technical indexes are shown in
Table 2, and the bulk fiber is shown in
Figure 1. The full-automated triaxial test apparatus used was TKA-TTS-3S.
2.2. Test Scheme
In this study, pavement soils were used. According to the practical engineering background, the test was divided into 5 groups with 4 samples in each group. Water content, cement content, fiber mass content, confining pressure
σ, and curing time of the experimented samples were designed as shown in
Table 3.
2.3. Sample Preparation
According to the Chinese National Geotechnical Test Standard (GB/T 50123-1999) and the designed test scheme [
31], the sample preparation process for triaxial UU tests can be divided into the following steps:
Subgrade soil was placed in a 105 ℃ constant temperature oven, baked for 24 h, and pulverized after drying.
The crushed subgrade soil was passed through a sieve with an aperture size of 2 mm to remove large particles and impurities such as stones.
Appropriate quantities of subgrade soil, cement, PP fiber, and water were weighed; after mixing evenly, according to the geotechnical test specification, a three-valve saturator was used to make triaxial samples of height H = 80 mm and diameter D = 39.1 mm.
After the sample was prepared, all triaxial samples were placed in the constant temperature (20 °C) and humidity (95%) curing box for standard curing for 7 days.
3. Test Results and Analysis
3.1. Stress–Strain Curve
Figure 2 shows the curves between deviatoric stress
q and axial strain
ε curve (hereinafter referred to as “stress–strain curve”) of PCS samples. It can be seen that the stress–strain curves of the samples are all softening curves. The axial strain
ε was considered within 10%, which is often the maximum strain level in practice.
3.2. Peak Stress and Strain at Peak Stress
The peak stress
qmax and strain at peak stress
diagrams of PCS samples can be obtained from the relevant data in
Figure 2, as shown in
Figure 3 and
Figure 4.
It can be seen from
Figure 3 and
Figure 4 that the peak stress and strain at peak stress of PCS samples gradually increase with the increase in confining pressure given a constant fiber mass content. In addition, under the same confining pressure, the peak stress and strain at peak stress of PCS samples first increase and then decrease with the increase in fiber mass content. When the fiber mass content is 6‰, the peak stress and strain at peak stress reach the maximum. Compared with the 0‰ PCS sample, with the change in confining pressure, the peak stress increases from 24% to 29% and the strain at peak stress increases from 85% to 120%.
The above results show that the modification effect of fiber increases with the increase in confining pressure; among them, the ductility is significantly improved.
3.3. Stress at 10% Axial Strain
It is evident that after reaching peak stress, the stress reduces gradually with greater strain, which means that, after the peak stress, the sample still has some strength to bear the internal force and it is helpful to the ductile failure mold. The stress value with 10% axial strain is referred to as
q0.1. The
q0.1 diagram of PCS samples can be obtained from the relevant data in
Figure 2, as shown in
Figure 5.
It can be seen from
Figure 5 that when the fiber mass content is fixed,
q0.1 in PCS samples increases with the increase in confining pressure. In addition, under the same confining pressure, with the increase in fiber mass content,
q0.1 of PCS samples first increases and then decreases. When the fiber mass content is 6‰, the residual stress reaches the maximum; compared with 0‰ PCS sample,
q0.1 increases from 87% to 110% with the change in confining pressure. It can be seen that with the addition of fiber, the ability of the sample to resist destruction is greatly improved.
3.4. Strength Curve
In order to draw the strength envelope of PCS samples and obtain their strength parameters, the peak of q is used as the failure point, where q = σ1 − σ3; taking the normal stress as the abscissa, the shear stress as the ordinate, (σ1 + σ3)/2 as the center, and (σ1 − σ3)/2 as the radius on the abscissa, the ultimate stress diagram is drawn on the τ–σ stress plan graph, as shown in
Figure 6; and the envelope of the ultimate stress circle under different confining pressures is drawn as shown in
Figure 7; the strength parameters
c and
ϕ of the samples are obtained from the strength envelope, as shown in
Table 4.
The relationship between the cohesion and the internal friction angle of PCS samples and fiber mass content can be obtained by referring to
Figure 6 and
Figure 7, and
Table 4, as shown in
Figure 8 and
Figure 9.
It can be seen from
Table 4, together with
Figure 8 and
Figure 9 that the cohesion
c and internal friction angle
ϕ of 0‰ PCS sample are 259.8 kPa and 33.1°, respectively. Their values for 6‰ PCS sample are 324.7 kPa and 35.5°, respectively. In other words, when the fiber mass content increases from 0‰ to 6‰, the sample’s cohesion
c and internal friction angle
ϕ increase 25.9% and 7.4%, respectively. However, further increase in fiber mass content lead to a decrease in
c and
ϕ. When the fiber mass content is 6‰,
c and
ϕ reach their maximum values, indicating that the shear strength is enhanced. The existence of an optimal fiber mass content may be justified by considering the effect of fibers in a PCS sample. During the cement hydration process, the fibers were combined with the surrounding matrix (cement-treated soil); as a result, a fiber can offer tensile strength in the sample if the cement slurry can coat each fiber well. This condition can be fulfilled if the fiber content is low. With the increase of fiber content, the cement slurry could be relatively insufficient to combine each fiber with its surrounding matrix; in addition, the overlaps among fibers are even likely to undermine the cement hydration process. As such, the strength parameters of the PCS sample have a decreasing tendency when the fiber content is too large. For instance, the strength parameters decrease when the fiber mass content increases from 6‰ to 10‰. In this study, the optimal fiber mass content was found to be 6‰ as indicated in
Figure 8 and
Figure 9. A similar phenomenon was reported in reference [
32], which examined the strength parameters of cement-tailings with fibers.
4. Sample Failure Characteristics
4.1. Brittleness Index
In order to study the brittleness characteristics of the samples during failure, Consoli et al. [
33] proposed the brittleness index as the evaluation criteria, as shown in Equation (1):
where
qmax and
q0.1 represent the peak stress and stress at 10% axial strain, respectively, and
I represents the brittleness index. The brittleness index of PCS samples can be obtained by substituting the relevant data in
Figure 2 into Equation (1), as shown in
Figure 10. The figure indicates that:
1. When the fiber mass content is fixed, with the increase in confining pressure, the brittleness index of PCS samples decreases and the ductility increases. Under a confining pressure of 100 kPa, the brittleness index is the highest and the brittle failure is obvious. The brittleness index reaches its lowest value when the confining pressure is 400 kPa, which suggest the best mitigation effect of brittle failure.
2. Under the same confining pressure, with the increase in fiber mass content, the brittleness index of PCS samples first decreases and then increases. When the fiber mass content is 6‰, the brittleness index reaches the minimum. Compared with 0‰ PCS sample, the brittleness index decreases from 52% to 79% with the increase in confining pressure, indicating that the incorporation of fiber can improve the brittle failure of the sample, and the modification effect is enhanced with the increase in confining pressure.
The main reason is that, with the change of confining pressure, there will be an interfacial interaction force between the fiber and the soil particles. When the PCS sample is subjected to an external force, the fiber will bear a part of the external force through the interfacial interaction, whereby improving the brittle failure of the sample.
4.2. Failure Angle of Sample
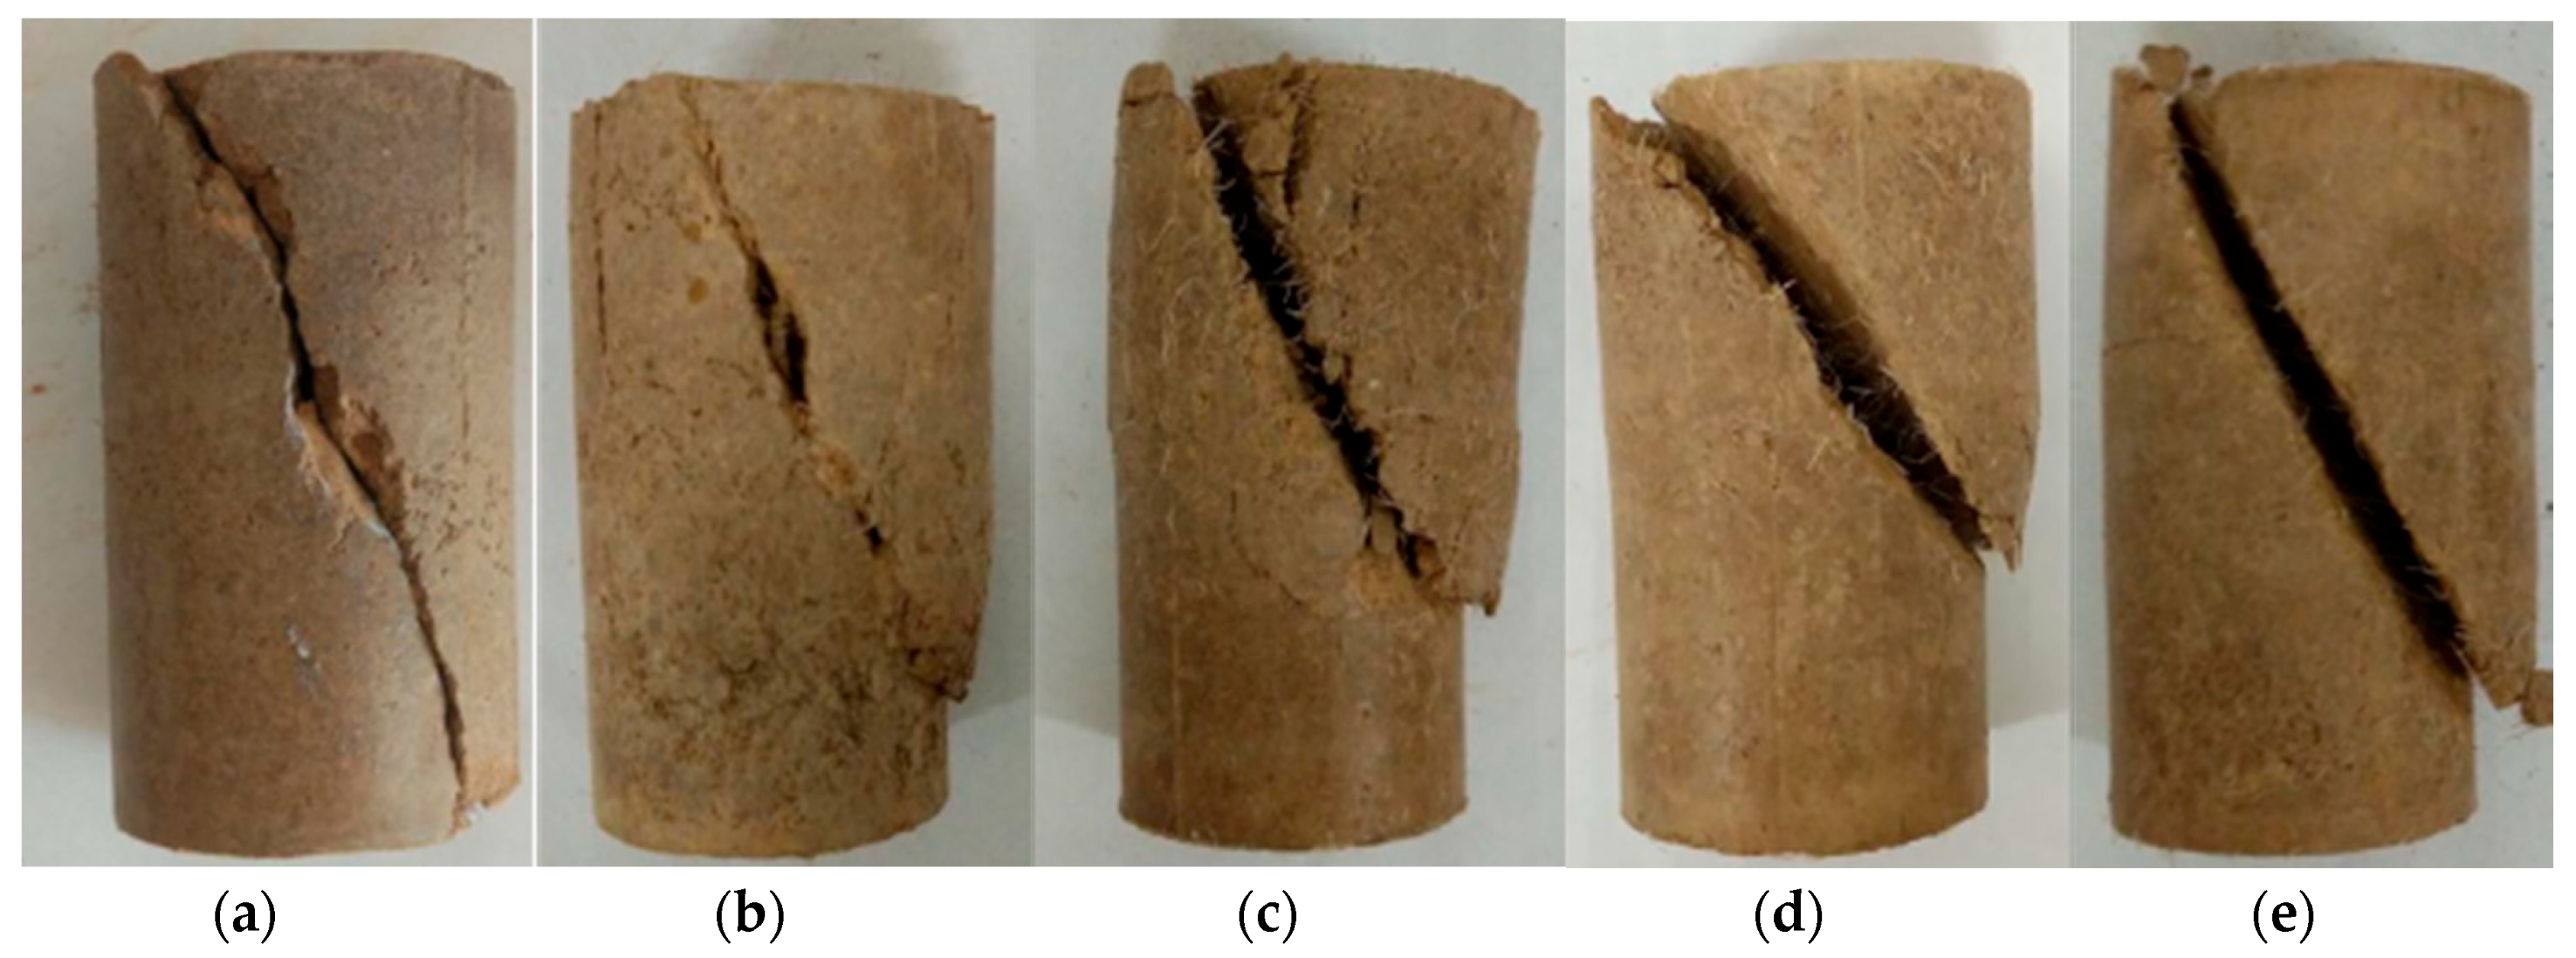
Fiber content plays an important role in the PCS’s failure model. Due to the confining pressure having no significant influence on the failure angle, in order to investigate the effect of fiber on the failure angle of cement subgrade soil samples, PCS samples with typical failure behavior [
15] under 300 kPa confining pressure were selected, as shown in
Figure 11. According to the failure pattern of these samples, the failure section diagram was drawn as shown in
Figure 12. The dimensions are specified in mm, the oblique line is the failure surface of the sample, and the angle between the failure surface and the horizontal direction is determined as the failure angle. The relationship between the fiber mass content and the angle can be obtained from the data in
Figure 12, as shown in
Figure 13.
Figure 13 indicates that, under the same confining pressure, the failure angle of PCS samples first decreases and then increases as the fiber mass content increases. When the fiber mass content is 6‰, the failure angle reaches its minimal value. This value is 16% less than that of a 0‰ PCS sample, indicating that the incorporation of fiber can improve the brittle fracture pattern of a sample to some extent. When the fiber mass content further increases to 10‰, the failure angle is still less than that of a 0‰ PCS sample, and the modification is significantly improved with the increase in fiber mass content. The main reason is that when the fiber mass content is too large, the fibers are likely to overlap with each other in the soil; as a result, the soil cannot be well compacted. Hence, the modification effect is limited. In addition, when the fiber mass content is within a certain range, the fiber can better fill the voids inside the PCS sample, a more stable structure can be formed between the fiber and soil particles, thereby improving the failure form of the sample. On the contrary, when the fiber mass content is too high, the fibers readily overlap with each other in the soil. In this regard, neither can the soil be well compacted, nor can the fiber be well connected. As such, the failure angle of the sample is improved and the modification effect decreases.
5. Conclusions
1. The deviatoric stress-axial strain curves of PCS samples are all strain-softening curves.
2. Under the same confining pressure, with the increase in fiber mass content, the peak stress, strain at peak stress, and residual stress of PCS samples first increase and then decrease. When the fiber mass content is 6‰, the modification effect is optimum. Compared with the 0‰ PCS sample, with the change in confining pressure, the peak stress increases from 24% to 29%, the strain at peak stress increases from 85% to 120%, and the residual stress increases from 87% to 110%. With the increase in confining pressure, the modification effect of fiber is gradually improved. Among the tests, the ductility is significantly improved.
3. The incorporation of fiber can increase the cohesion c and the internal friction angle ϕ of PCS samples. When the fiber mass content is 6‰, the cohesion c and the internal friction angle ϕ reach the maximum value. Compared with the 0‰ PCS sample, the cohesion c increases by 25.9% and the internal friction angle ϕ increases by 7.4%. It can be seen that the incorporation of fiber improves the cohesion c and the internal friction angle ϕ of the sample, thereby improving the shear strength.
4. When the fiber mass content is fixed, with the increase in confining pressure, the brittleness index of the PCS sample decreases and the ductility increases. Under a confining pressure of 100 kPa, the brittleness index is the highest and the brittle failure is obvious. Under a confining pressure of 400 kPa, the brittleness index reached its lowest value and the brittleness failure shows the most mitigation. When the fiber mass content is 6‰, the brittleness index reaches the minimum. Compared with the 0‰ PCS sample, with the increase in confining pressure, the brittleness index decreases from 52% to 79%. The incorporation of fiber can improve the brittle failure behavior of the sample, and the modification effect is enhanced with the increase in the confining pressure.
5. Under the same confining pressure, with the increase in fiber mass content, the failure angle of PCS samples first decreases and then increases. The PCS sample with 6‰ fiber mass content exhibits the minimum failure angle, providing solid evidence that the incorporation of fiber mitigates the brittle fracture form of the sample to some extent.
As a limitation, the current study only considered small soil specimens. In reality, the situation is more complicated, as there will be impurities such as stones and organic matter. The effect of impurities in a specimen and the effect of specimen size were not considered in this study, but which is worthy of future study.
Author Contributions
The authors confirm contribution to the paper as follow: W.W. and N.L. proposed the idea and wrote the paper; Y.L. (Yong Liu) revised the manuscript; C.Z., Y.L. (Yuan Li), and H.Z. conducted the tests and analyzed the data; J.G. reviewed the results and approved the final version of the manuscript.
Funding
This research was funded by the National Natural Science Foundation of China (Grant numbers [41772311]), the Zhejiang Provincial Natural Science Foundation of China (Grant number [LY17E080016]), the Open Research Fund of State Key Laboratory of Geomechanics and Geotechnical Engineering, Institute of Rock and Soil Mechanics, Chinese Academy of Science (Grant number [Z017013]), the Scientific Research Projects of Zhejiang Department of Housing and Urban and Rural Construction (Grant number [2017K179]), and the International Scientific and Technological Cooperation Projects of Shaoxing University (Grant number [2019LGGH1007]).
Conflicts of Interest
The authors declare no conflict of interest.
References
- Pan, Y.T.; Liu, Y.; Hu, J.; Sun, M.M.; Wang, W. Probabilistic investigations on the watertightness of jet-grouted ground considering geometric imperfections in diameter and position. Can. Geotech. J. 2017, 54, 1447–1459. [Google Scholar] [CrossRef]
- Liu, Y.; Lee, F.H.; Quek, S.T.; Chen, J.E.; Yi, J.T. Effect of spatial variation of strength and modulus on the lateral compression response of cement-admixed clay slab. Géotechnique 2015, 65, 851–865. [Google Scholar] [CrossRef]
- Wang, W.; Li, N.; Zhang, F.; Zhou, A.Z.; Chi, S. Experimental and mathematical investigations on unconfined compressive behavior of coastal soft soil under complicated freezing processes. Pol. Marit. Res. 2016, 23, 112–116. [Google Scholar] [CrossRef][Green Version]
- Li, N.; Zhu, Q.Y.; Wang, W.; Song, F.; An, D.A.; Yan, H.R. Compression characteristics and microscopic mechanism of coastal soil modified with cement and fly ash. Materials 2019, 12, 3182. [Google Scholar] [CrossRef] [PubMed]
- Yao, K.; Li, N.; Chen, D.H.; Wang, W. Generalized hyperbolic formula capturing curing period effect on strength and stiffness of cemented clay. Constr. Build. Mater. 2019, 199, 63–71. [Google Scholar] [CrossRef]
- Liu, Y.; He, L.Q.; Jiang, Y.J.; Sun, M.M.; Chen, E.J.; Lee, F.H. Effect of in situ water content variation on the spatial variation of strength of deep cement-mixed clay. Géotechnique 2019, 69, 391–405. [Google Scholar] [CrossRef]
- Xing, H.F.; Xiong, F.; Zhou, F. Improvement for the strength of salt-rich soft soil reinforced by cement. Marine Georesour. Geotechnol. 2017, 36, 38–42. [Google Scholar]
- Choobbasti, A.J.; Kutanaei, S.S. Microstructure characteristics of cement-stabilized sandy soil using nanosilica. J. Rock. Mech. Geotech. Eng. 2017, 9, 981–988. [Google Scholar] [CrossRef]
- Liu, Y.; Jiang, Y.; Xiao, H.; Lee, F.H. Determination of representative strength of deep cement-mixed clay from core strength data. Géotechnique 2017, 67, 350–3645. [Google Scholar] [CrossRef]
- Anagnostopoulos, C.A. Strength properties of an epoxy resin and cement-stabilized silty clay soil. Appl. Clay Sci. 2015, 114, 517–529. [Google Scholar] [CrossRef]
- Yao, K.; Xiao, H.; Chen, D.H.; Liu, Y. A direct assessment for the stiffness development of artificially cemented clay. Géotechnique 2019, 69, 741–747. [Google Scholar] [CrossRef]
- Jia, L.; Zhao, F.L.; Guo, J.; Yao, K. Properties and reaction mechanisms of magnesium phosphate cement mixed with ferroaluminate cement. Materials 2019, 12, 2561. [Google Scholar] [CrossRef] [PubMed]
- Mengue, E.; Mroueh, H.; Lancelot, L. Physicochemical and consolidation properties of compacted lateritic soil treated with cement. Soils Found. 2017, 57, 60–79. [Google Scholar] [CrossRef]
- Yao, K.; Wang, W.; Li, N.; Zhang, C.; Wang, L.X. Investigation on strength and microstructure characteristics of Nano-MgO admixed with cemented soft soil. Constr. Build. Mater. 2019, 206, 160–168. [Google Scholar] [CrossRef]
- Xiao, H.W.; Wang, W.; Goh, S.H. Effectiveness study for fly ash cement improved marine clay. Constr. Build. Mater. 2017, 157, 1053–1064. [Google Scholar] [CrossRef]
- Yao, K.; An, D.L.; Wang, W.; Li, N.; Zhang, C.; Zhou, A.Z. Effect of nano-mgo on mechanical performance of cement stabilized silty clay. Marine Georesour. Geotechnol. 2019. [Google Scholar] [CrossRef]
- Wang, W.; Zhang, C.; Li, N.; Tao, F.F.; Yao, K. Characterisation of nano magnesia-cement-reinforced seashore soft soil by direct-shear test. Marine Georesour. Geotechnol. 2019, 37, 989–998. [Google Scholar] [CrossRef]
- Jiang, P.; Qiu, L.Q.; Li, N.; Wang, W.; Zhou, A.Z.; Xiao, J.P. Shearing performance of lime reinforced iron tailing powder based on energy dissipation. Adv. Civ. Eng. 2018. [Google Scholar] [CrossRef]
- Lenoir, T.; Preteseille, M.; Ricordel, S. Contribution of the fiber reinforcement on the fatigue behavior of two cement-modified soils. Int. J. Fatigue 2016, 93, 71–81. [Google Scholar] [CrossRef]
- Wang, W.; Li, Y.; Yao, K.; Li, N.; Zhou, A.Z.; Zhang, C. Strength properties of nano-MgO and cement stabilized coastal silty clay subjected to sulfuric acid attack. Marine Georesour. Geotechnol. 2019. [Google Scholar] [CrossRef]
- Zerrouk, A.; Lamri, B.; Vipulanandan, C. Performance evaluation of human hair fiber reinforcement on lime or cement stabilized clayey-sand. Key Eng. Mater. 2015, 668, 207–217. [Google Scholar] [CrossRef]
- Gowthaman, S.; Nakashima, K.; Kawasaki, S. A state-of-the-Art review on soil reinforcement technology using natural plant fiber materials: Past findings present trends and future directions. Materials 2018, 11, 553. [Google Scholar] [CrossRef] [PubMed]
- Chen, M.; Shen, S.L.; Wu, H.N. Laboratory evaluation on the effectiveness of polypropylene fibers on the strength of fiber-reinforced and cement-stabilized Shanghai soft clay. Geotext. Geomembr. 2015, 43, 515–523. [Google Scholar] [CrossRef]
- Anggraini, V.; Asadi, A.; Syamsir, A. Three point bending flexural strength of cement treated tropical marine soil reinforced by lime treated natural fiber. Measurement 2017, 111, 158–166. [Google Scholar] [CrossRef]
- Sharma, R.K. Laboratory study on stabilization of clayey soil with cement kiln dust and fiber. Geotech. Geol. Eng. 2017, 35, 2291–2302. [Google Scholar] [CrossRef]
- Tran, K.Q.; Satomi, T.; Takahashi, H. Improvement of mechanical behavior of cemented soil reinforced with waste cornsilk fibers. Constr. Build. Mater. 2018, 178, 204–210. [Google Scholar] [CrossRef]
- Ayeldeen, M.; Kitazume, M. Using fiber and liquid polymer to improve the behaviour of cement-stabilized soft clay. Geotext. Geomembr. 2017, 45, 592–602. [Google Scholar] [CrossRef]
- Yang, B.H.; Weng, X.Z.; Liu, J.Z. Strength characteristics of modified polypropylene fiber and cement-reinforced loess. J. Cent. South Univ. 2017, 24, 560–568. [Google Scholar] [CrossRef]
- Estabragh, A.R.; Ranjbari, S.; Javadi, A.A. Properties of clay soil and soil cement reinforced with polypropylene fibers. ACI Mater. J. 2017, 114, 195–205. [Google Scholar] [CrossRef]
- Xiao, H.; Liu, Y. A prediction model for the tensile strength of cement-admixed clay with randomly orientated fibres. Eur. J. Environ. Civ. Eng. 2018, 22, 1131–1145. [Google Scholar] [CrossRef]
- GB/T 50123-1999, Standard for Soil Test Method. China Planning Press, 1999. Available online: http://www.zys168.net/Upload/DownLoad/DownLoadFile/20107191920846.pdf (accessed on 26 October 2019). (In Chinese).
- Xue, G.; Yilmaz, E.; Song, W.; Gao, S. Mechanical, flexural and microstructural properties of cement-tailings matrix composites: Effects of fiber type and dosage. Compos. Part B 2019, 131–142. [Google Scholar] [CrossRef]
- Consoli, N.C.; Pedro, D.M.; Ulbrich, L.A. Influence of fiber and cement addition on behavior of sandy soil. J. Geotech. Geoenviron. Eng. 1998, 124, 1211–1214. [Google Scholar] [CrossRef]
© 2019 by the authors. Licensee MDPI, Basel, Switzerland. This article is an open access article distributed under the terms and conditions of the Creative Commons Attribution (CC BY) license (http://creativecommons.org/licenses/by/4.0/).


