1. Introduction
Breast cancer is an acute health problem all over the world and one of the most common cancers that cause death among women. This cancer has caused over 1.7 million deaths in 2012 and nearly 5 million cases were diagnosed. The estimation for 2030 is that breast cancer cases will continue to grow in developing countries [
1].
To reduce these cases and to provide treatments, it is necessary to have better ways of diagnosing breast cancer early on. Using algorithms to help in the early diagnosis would be desirable [
2]. The algorithms can use the result images given by other tests like mammography studies or other screening techniques to obtain an easier image to analyze. These algorithms can obtain a simplified representation of the image only by extracting the region of interest from the image for later analysis.
Physicians use mammography studies to obtain an image of the breast, using X-rays to detect breast cancer followed by a detailed analysis of the generated image. These evaluations have resulted in a reduction of breast cancer mortality [
3]. When cancer is in the early phases, the group of abnormal cells is found in the same region, and hence it can be easily detected using mammography [
4]. The experts highly recommend a mammography study every one or two years for women aged 39 to 69 [
5,
6]. After the generation of the mammography image, it is necessary to process it to identify the Region of Interest (ROI) of the image for later analysis. This process receives the name of segmentation.
However, this is not the only way to carry out these studies; as an example, a different way is seen in the work carried out by Yu et al. in 2017 [
7]. They present an improvement in the images taken by ultrasound tomography, which improves the segmentation and the later analysis and classification of the image. In 2013, Duric et al. [
8] performed a comparison between ultrasound tomographies and digital mammographies showing that both methods are positively associated with the identification of the amount of dense tissue. They performed the study by comparing the volume-averaged sound speed of the breast in ultrasound tomography and mammographic percent density in mammographies.
Segmentation involves splitting a digital image into non-overlapping groups of pixels to make it easy to interpret [
9]. This process is useful to find objects and boundaries, and it can be used in many applications such as object detection, recognition, machine vision, and medical images [
10]. A perfect segmentation should have uniform and homogeneous characteristics, boundaries should be simple, interiors should not have small holes if possible, and adjacent regions should have different characteristics [
11]. Since the previous characteristics are hard to achieve, there are techniques that try to find the best segmentation for digital images, each of them with advantages and disadvantages [
10].
According to Fu et al. [
12], such techniques can be conveniently summarized into three types: edge detection, region extraction, and clustering segmentation.
Edge detection is a technique based on distinguishing regions with the highest change in grey level. It also detects discontinuities in depth and surface, changes in material properties, and variations in scene illumination and brightness.
Several studies report the progression and implementation of edge detection. Dollár and Zitnick [
13] uses a segmentation technique with a structured learning framework applied to random decision forests. Malik et al. [
14] describe the Canny edge detection method to identify lines in a Finger Knuckle Print, a biometric identifier adopted in recent years.
Qi et al. [
15] worked infrared images and algorithms to transform edges into curves and produce intersections for breast cancer detection. Later on, Mencattini et al. [
16] proposed an algorithm to detect micro-calcifications and masses. It also detects the edges using an enhancement procedure after a transformation process.
Song et al. [
17] used Fully Convolutional Networks to segment and detect corners in aerial images of buildings. Their work achieved good performance in this task, outperforming several algorithms in their corresponding comparison.
The region extraction approach splits an image into regions using merging or dividing techniques. Fan et al. [
18] proposed an image segmentation method using edges as first elements, incorporating pixels into each region at each iteration. A similar technique was used by Yan et al. in 2003 [
19] using local entropy, getting good performance with noisy images. The use of a region extraction algorithm is convenient because a region comprises more pixels and achieves better performances with noisy images, providing more information than edge detection techniques [
18], which face issues with noisy images. Combining both region extraction and edge detection provides more detail information about the image [
18].
Clustering or feature thresholding consider choosing a threshold value that maps all the pixels into different clusters. These threshold values can be grey level, gradients or percentages. Yao et al. [
20] used an algorithm based on clustering to segment fish images. Salem [
21] reported a similar technique to find white cells using a k-means algorithm. And Patel and Sinha [
22] used a clustering algorithm based on adaptive k-means, diversifying the parameters to boost image segmentation’s performance. In general, clustering is easy to implement, simple, and the results are easy to interpret.
On one hand, the extraction of regions seeks to identify the region of interest for further analysis. On the other hand, clustering algorithms seek to group regions with similar characteristics regardless of whether they represent something relevant.
The clustering approach for segmentation is the protagonist in this work.
There are recent works on the detection of breast cancer using image processing and deep learning to achieve good results in both branches. In 2018, Mambou et al. [
23] performed a comparative study of several algorithms for breast cancer detection using Infrared Thermal Imaging, obtaining relevant results in this field.
One of the classic methods for image thresholding is the Otsu method [
24], which uses clustering to generate binary images. This method is still one of the most referenced thresholding methods because of its simplicity and good performance. This method is sensitive if the region of interest (ROI) or the background is bigger than the other region since it will classify the other pixels incorrectly. The Otsu method finds the optimal threshold by maximizing or minimizing variances between or within each class, respectively [
25]. This method has been successfully used for image thresholding in many applications [
26,
27,
28].
In this paper, we explore two algorithms based on populations, the novel bat algorithm (NBA) and the genetic algorithm (GA). In addition, we explore the simulated annealing algorithm (SA) based on a single trajectory. The GA is based on an evolutionary system and the NBA is based on swarm optimization.
There are a lot of segmentation techniques, but there is no method to determine which is the most useful algorithm for the segmentation of specific digital images. In this paper, we focus on meta-heuristics applied to the segmentation of digital images, specifically, mammography images.
This paper is organized as follows. The review of recent works in mammography image segmentation is presented in
Section 2, with an explanation of the algorithms under test, while giving insights into their functioning. In
Section 3, the proposed methodology is described.
Section 4 provides the results and the analysis of the experiments. Finally, in
Section 5 we present the discussion and conclusions of this work and future work in this area.
2. Meta-Heuristics and Applications for Image Segmentation
Meta-heuristics are algorithms that mimic fauna behavior or biological systems to solve computational problems such as optimization, classification, or segmentation [
29]. Some algorithms used to solve optimization problems are not effective when the problem is nondeterministic since this requires many computational resources. Therefore, using meta-heuristics is one of the best choices because of their stochastic behavior [
30]. These algorithms use randomly generated values to conduct a local search while exploring a larger space of solution.
In this paper, we present the use of some meta-heuristics applied to segmentation. We explain these meta-heuristics below.
2.1. Simulated Annealing
Simulated annealing (SA) [
31] is a searching algorithm mainly designed for global optimization problems [
32].
The simulated annealing (SA) algorithm is an optimization method inspired by the tempering of metals used since 5000 B.C. and belongs to a class of local search algorithms (LSA) commonly called threshold algorithms (TA).
To understand the simulated annealing method, it is necessary to understand that this technique is used in the industry to obtain more resistant or more crystalline properties to improve the qualities of materials. This same principle is adapted to a computational algorithm that works by mimicking this process.
The process consists of “melting” the material (heating it to a very high temperature). In this situation, the atoms gain a “random” distribution within the material structure, and the system energy is maximal. Then, the temperature is reduced in stages, allowing the atoms to remain in equilibrium in each of these stages (that is, the atoms reach an optimal configuration for that temperature). At the end of the process, the atoms form a highly regular crystalline structure, thus, the material achieves maximum strength, and the system energy is minimal.
The experiments report that if the process sharply reduces the temperature or if there is not enough time in each stage, the structure of the material is not optimal.
This algorithm presents three main phases: heating the material to a predetermined temperature, maintaining the temperature that allows the molecules to accommodate in states of minimum energy, and then a slow cooling of the material to allow an increase in the size of the crystals and a reduction of their defects. In each iteration, the algorithm tests the neighbors to find better solutions, considering new solutions with a probability of using that solution even if it is not a better solution.
Simulated annealing (SA) is a simple trajectory method that starts with a certain state, S. Through a particular process, it generates a neighbor state, S’, to the current environment. If the energy, or evaluation of the state S’, is better than the one of S, the element S changes to S’.
If the evaluation of
S’ is worse than that of
S,
S’ is chosen instead of
S, with some probability depending on the differences of the evaluations of both states and the current temperature
T. The probability of choosing a worse state instead of the current state allows a local optimum to be left in order to reach the global optimum. In a minimization process, the probability of choosing a worse state is calculated by:
In this work, given a state
S, we obtain a neighboring state
S’ of the following form:
The simulated annealing algorithm has several stages. Each stage corresponds to a lower temperature than the previous stage (this refers to the monotony: after each stage, the temperature goes down and the system cools). Therefore, a criterion of temperature change is required (“how much time” is waited at each stage to result in the system achieving its “thermal equilibrium”).
If the temperature lowers sufficiently slowly (the temperature parameter and the generation of enough transitions) at each temperature, it can achieve the optimum configuration.
Recently, Manwar et al. [
32] used an algorithm similar to simulated annealing to reduce the nonlinearity of Galvo scanners. In that study, they evaluated the algorithm in different frequencies to synthesize the signal. Their method showed better results compared to other methods for the compensation of Galvo scanners.
Similarly, in 2018 Fayyaz et al. [
33], used simulated annealing (SA) to optimize an amplitude modulator showing the efficiency and effectiveness of SA when finding the optimum wavefront shape for focusing light.
2.2. Genetic Algorithms
In natural systems, different individuals of a population compete for resources to survive and reproduce. Those individuals with a better biological adaptation to their environment will preserve and enhanced their genetic material and pass that information to future generations, contrary to what happens with less adapted individuals, who will generate a smaller number of descendants, and the possibility of transmitting their genetic material information to the next generations is much smaller.
From an artificial systems perspective, computational thinking maps the adaptation coming from natural evolution processes into algorithms used for optimization problems. These heuristics-based algorithms try to imitate, in a certain way, the natural evolutionary process to get the best results for a specific problem. The evolutionary algorithms use a population to find solutions and identify the best one to solve an optimization problem. Among them are the genetic algorithms (GAs) that are computational models capable of adapting or recreating themselves based on mutation, crossing and selection phenomena [
34], biological metaphors principles of the natural evolution of the species proposed by Darwin in 1859 [
35]. Research on GAs began to develop in the 1950s, when some biologists tried to simulate genetic systems on a computer, such as A. Fraser [
36], who did something very similar to GAs using chains and phenotypes, trying to simulate them on the SILLIAC computer. Years later in 1975, John H. Holland [
37] was the first to gather and develop the critical mass of ideas from systems theory, mathematics, and computational science to get the principles of evolution to search for the optimal results of a particular problem. The principles developed by Holland led to the birth of the GAs and their use in the theory of intelligent adaptive systems.
As stated before, GAs algorithms work with a population of individuals included within a specific solution of a fitness function for the optimization problem. Each of these individuals has a value of the function being tested; this value represents the adaptation of the individual to the environment. The better the adaptation of an individual to the problem, the more likely they are to transmit their genes to the next generations. The solutions that obtain the best results for the solution of the aim function will be those that are preserved during the process of optimization for future generations of individuals. Therefore, this value of the function will determine if an individual is a good candidate or not and will guide the search for good solutions.
With individuals chromosomally coded, the algorithm can carry out the evolution of the solutions by following the steps described in
Figure 1 [
38]:
As a summary, the genetic algorithm starts with the randomness generation of population at the beginning and uses the crossing (exchange of genetic material between two individuals), mutation (alteration of the internal elements of each individual), and the selection operators (operators designed to select the most suitable individuals for each problem) to select the best solutions in each iteration.
2.3. Novel Bat Algorithm
The bat algorithm (BA) is an algorithm proposed by Yang and Hossein in 2012 [
39] as an algorithm used to solve optimization problems. Later, Meng et al. [
40] transformed the algorithm to include the Doppler effect, giving this version the name of novel bat algorithm (NBA). This algorithm uses bats’ behaviors and the echolocation ability to identify objects in a determinate space. The bats use echolocation to sense distance and change velocity and frequency to search for solutions for the fitness function that is being optimized.
One of the novel features of the NBA algorithm is the consideration and modelling of the compensation of the Doppler effect on the pulses emitted and the environmental noise. Another aspect to highlight is the inclusion of the quantum behavior of bats, which allows these virtual bats to find food in different habitats to find the optimal overall solution to the problem.
There are different variants of bat-inspired algorithms based on modelling some echolocation characteristics of bats. Therefore, the authors of the BA proposal in [
41] provide a set of rules for optimization algorithms based on the behavior of bats, as described in [
40]:
To measure distance, bats use echolocation, which also allows them to differentiate between their prey and obstacles.
Bats fly randomly with a velocity to a position with a fixed frequency , varying the wavelength and volume to look for their prey. Depending on the proximity of the target, they can automatically adjust the wavelength of their emitted pulses (frequency), and adjust the pulse emission rate .
Although the volume may vary in various ways in reality, it is important to consider that the noise varies from a positive number to a constant minimum value .
To this brief set of rules, we must add a couple more, which present a direct relationship with the new features proposed by the NBA algorithm [
40]:
Finally, characterizes the position and the velocities in an iteration G, of n bats looking for food in a d-dimensional space.
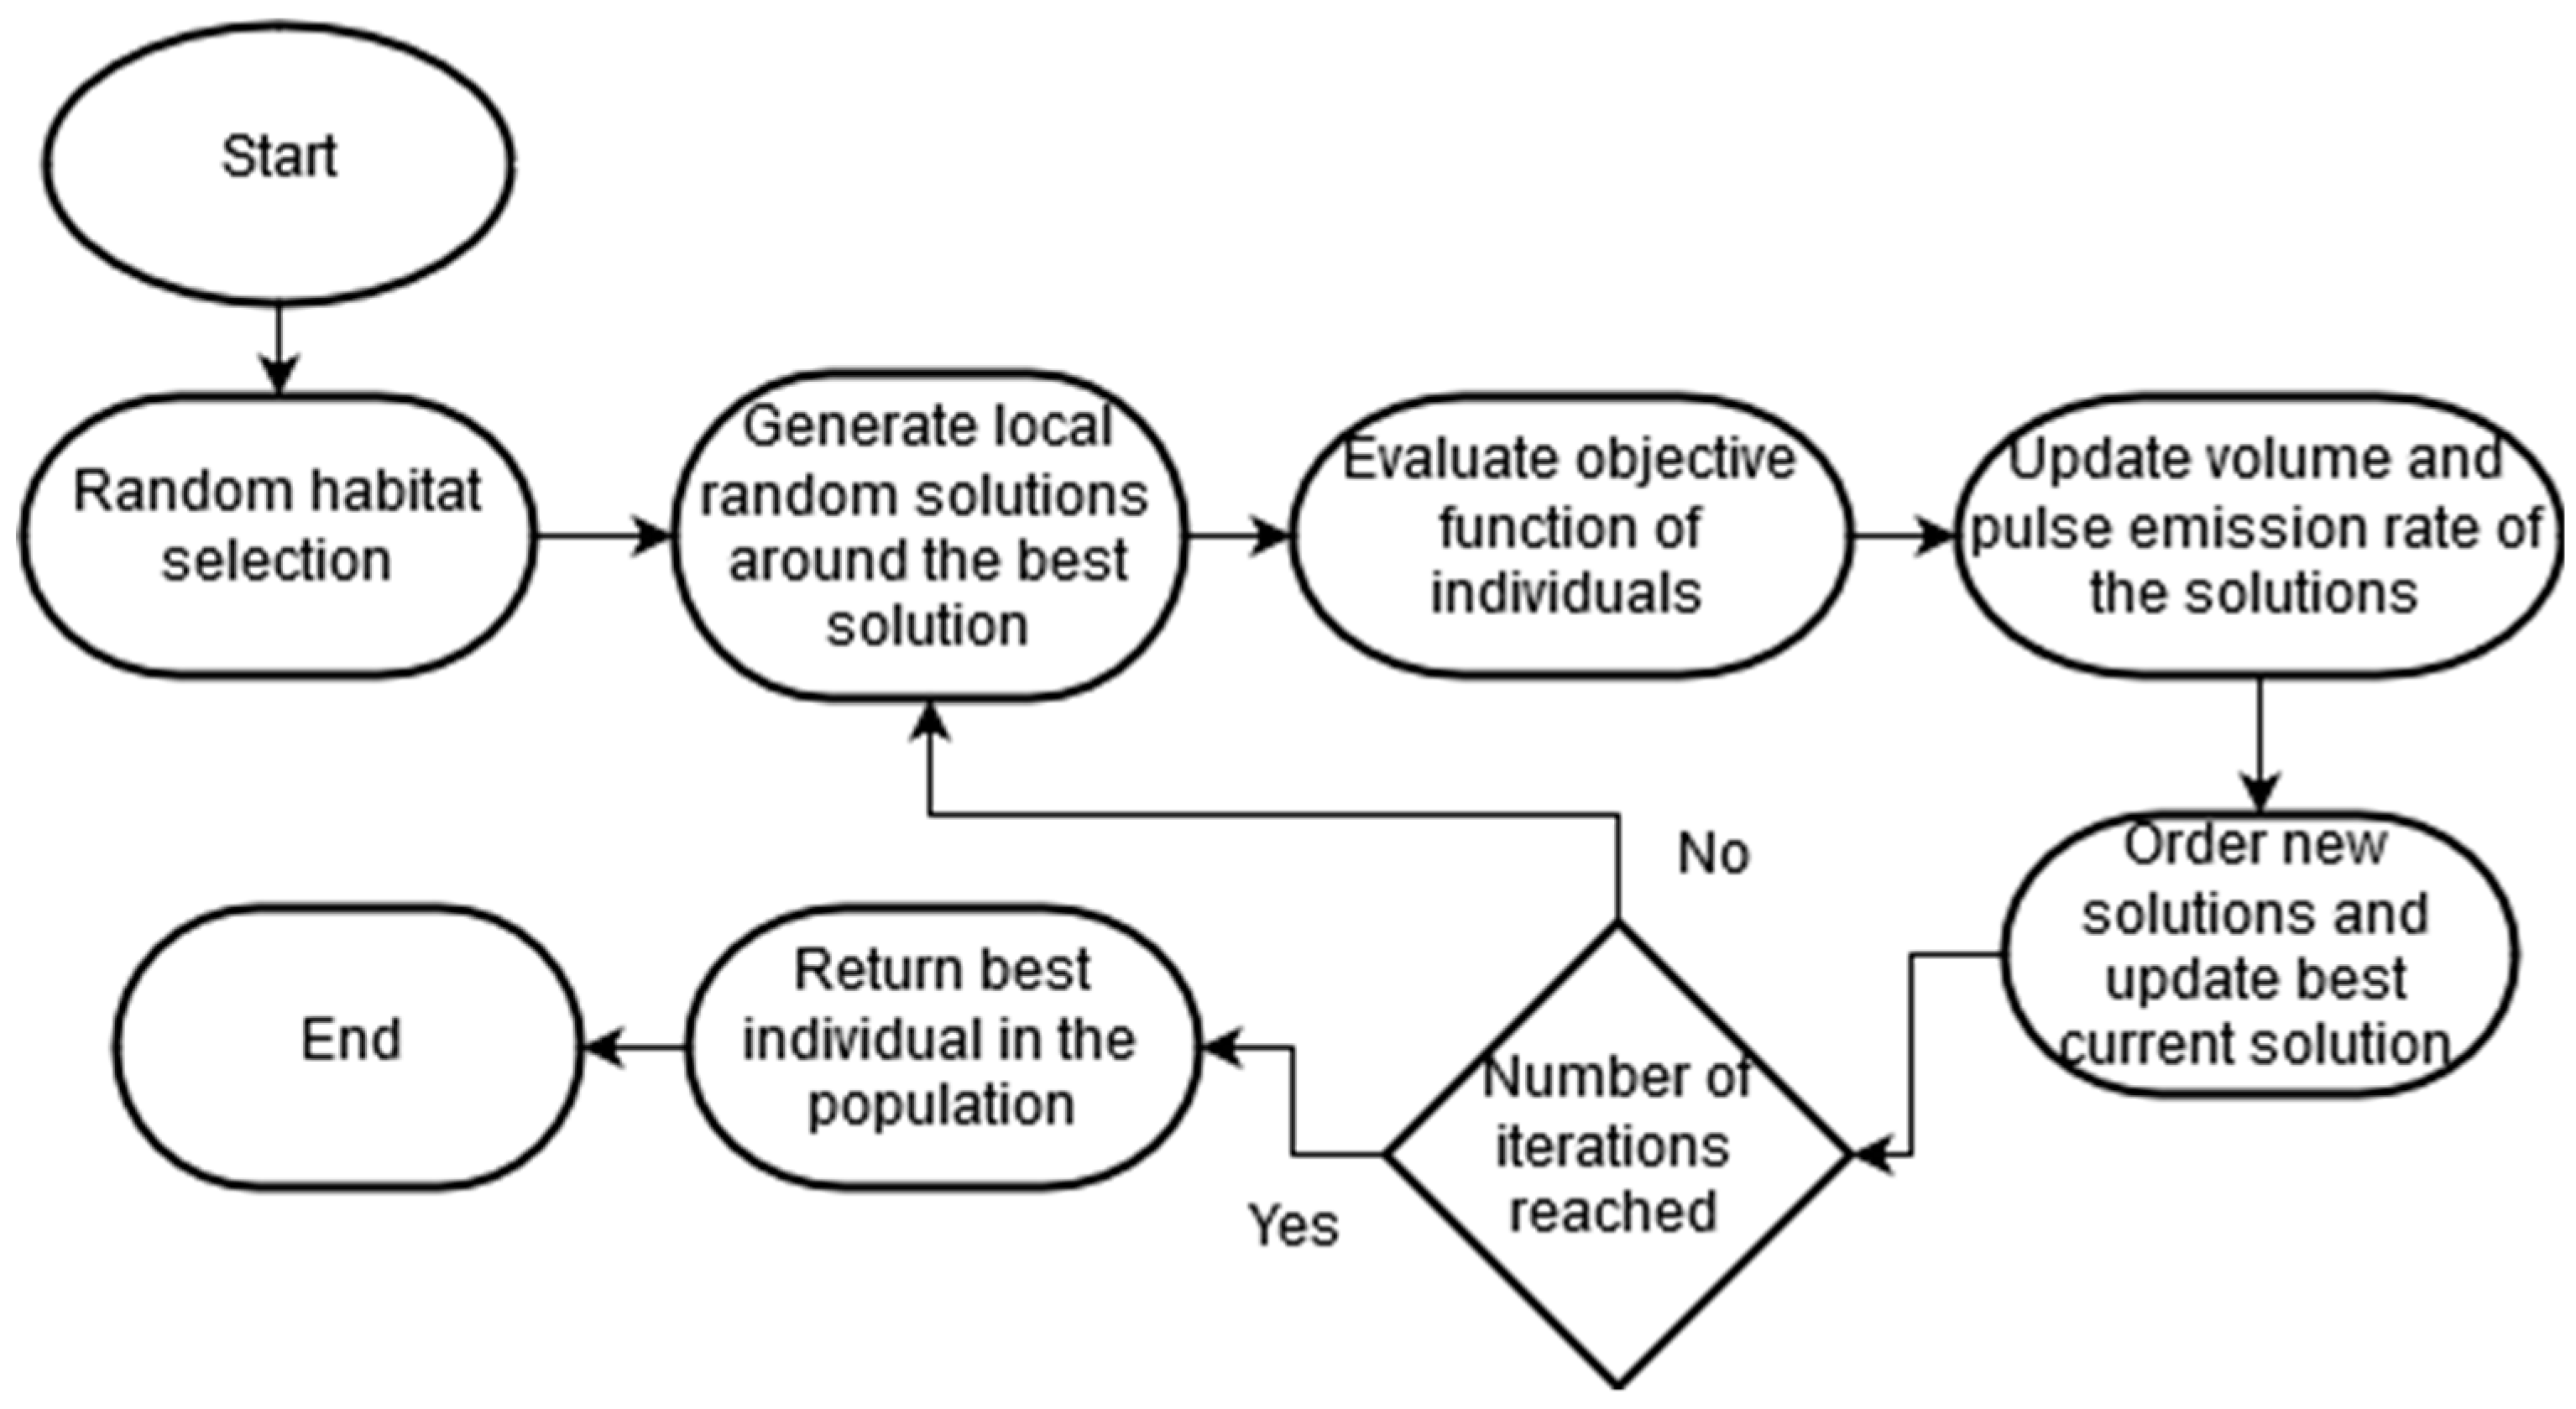
Updating the positions, velocities and other parameters of bats’ behavior takes
G number of iterations. Each one will perform the following steps explained in
Figure 2:
As seen, this algorithm can self-adapt throughout the optimization process, because of the compensation it makes for the Doppler effect in echoes and the adjustments it makes to the frequency according to the proximity of individuals to the solution. It is also worth mentioning the addition of habitat selection methods to BA, since these two types of behavior of bats, mechanical and quantum, allow the algorithm to have a better convergence and diversity of solutions.
This algorithm was used for the segmentation of mammography images by González-Patiño et al. in 2016 [
42], showing lower segmentation errors compared to the Otsu method.
The NBA and GA algorithms are population-based algorithms so they perform a more extensive search throughout the search space, which provides an advantage compared to SA which is a single-trajectory algorithm.
3. Proposed Method
In this work, we propose a new method for the segmentation of mammographic images through meta-heuristics. This process is relevant because most meta-heuristics are designed only as optimization algorithms.
This methodology consists of three stages:
In the first stage, a segmentation algorithm processes each image to simplify their analysis.
In the second stage, a group of radiological experts defines the characteristics that are relevant to the diagnosis. We define 11 characteristics of clinical and general data, six characteristics of lesion intensity descriptors, 13 characteristics of texture descriptors of the lesion, and eight descriptors of the shape and location of the lesion. With these 38 descriptors, a data bank is formed for subsequent classification.
Once the database is formed, a classification algorithm is used to get a pre-diagnosis of the corresponding lesion.
We explain each stage in the following subsections.
3.1. Image Segmentation as an Optimization Problem
The proposal of the present investigation for phase 1 of the method consists of the modification of the meta-heuristic algorithms previously mentioned in
Section 2, and its application to the segmentation of mammography images.
Performing the characterization of the mammographic image through the use of meta-heuristic algorithms outlines the problem of segmenting the image as an optimization problem. For this purpose, the Dunn index definition is considered as the objective function in all cases.
We use the Dunn index [
43] as the fitness function for the meta-heuristic algorithms, so that the higher the Dunn index, the better the segmentation. Thus, in the three meta-heuristic algorithms, this index is the objective function to be maximized, and it is defined in Equation (3). We calculate this index as the minimum outer-cluster distance over the maximum inter-cluster distance:
The optimization function allows you to calculate the dispersion between the pixels of different groups and pixels of the same group. It is sought to maximize this function since we prefer for the numerator to be a very large value and the denominator to be a tiny value.
The distance calculated in Equation (3) is the Minkowski distance of order
p = 1. This distance for the order
p is defined Equation (4) with
.
The Minkowski distance for order 1 is reduced to a difference between pixel values between 0 and 255.
Three-dimensional vectors for the coding of the solutions are used; the components are defined in the interval [0,255], and represent a grey level. Three components are defined since it is desired to segment the image into three regions: background, breast area, and lesion. An example of this coding is shown in
Figure 3.
Figure 3 represents an individual with three components, each of them representing a grey level.
This coding allows us to consider each solution as a candidate segmentation. Considering the solution of
Figure 3, where the components represent a region of the image, we can obtain segmentation, as shown in the same figure, for Individual 1. For each pixel in the image, we calculate the distance to each component value, and we will assign the pixel to the component with the lowest distance.
According to Zhang et al. [
44], the evaluation of the segmentation uses the average squared color error (
F, Equation (5)), which penalizes over-segmentations, and its improved version (
F’, Equation (6)), which penalizes segmentations with a much greater number of small regions.
where
represents the number of regions in the image,
is the quantity of pixels in the region
j,
is the area of the image,
is the number of regions of the segmented image that have exactly
b units of area,
is the squared colour error of region
j defined in Equation (7).
is the value of component
x for pixel
p and
is the average value of component
x in the region
j is defined in Equation (8).
In
Figure 4, you can observe an example of the use of the Dunn index to identify the best segmentation. We observe three individuals with three components, where each component represents a grey level used to generate the segmented image. The calculated fitness, shown in
Figure 4, is the value calculated using the Dunn index, which measures how good the segmentation is according to the distance between clusters.
In this paper we compare four segmentation algorithms, the Otsu method [
24] and three customized meta-heuristic algorithms [
31,
40,
45], to perform the segmentation task.
3.2. Extraction of Characteristics
For the diagnosis stage, a group of radiologists defined the characteristics. The characteristics are extracted from the region of interest of the segmented image and each definition is presented by Moura [
46] and it explains the formulas for each calculation. This manuscript will present some descriptors in
Table 1.
3.3. Classification of the Lesion
For this step, a new artificial immune system (AIS) is proposed, which presents a competitive performance for breast cancer classification.
The proposed algorithm uses two different responses (adaptive immune response and innate immune response), which can be seen analogously as the training phase and classification phase in pattern recognition. The innate immune response will use the antibodies generated in the previous response to classifying each pattern according to the most similar antibody, while the adaptive immune response is based on grouping the patterns into random groups without replacement for each of the classes.
Later, a mean pattern (antigen) will be calculated from the groups formed above. The class of the grouped patterns will be assigned to each generated pattern. The mean calculates the performance of the aforementioned set of patterns, using the antibodies as models to classify.
The algorithm performs the adjustment of the antibodies by making the antibodies approach their most similar pattern and moving them away from different class patterns.
Subsequently, it generates clones for each antibody, and it controls this increase, obtaining an average of the clones generated by each antibody.
In the adaptive immune response, the algorithm will generate artificial antibodies that will be used as structures that will remember recognized patterns (antigens) and will have the ability to identify new antigens.
Once it completes the adaptive immune response (training phase), it will use the final antibodies generated for the classification of the other patterns (innate immune response). This classification will be performed by finding the closest antibody to each pattern, so the assigned class of each pattern will be one of the closest antibodies.
As a summary:
The adaptive immune response consists of five phases:
Detection of antigenic macromolecules: Groups are generated where patterns are randomly grouped according to their class.
Activation of B lymphocytes: Representative antibodies are generated for a set of patterns by the average in each group.
Immune response regulation: The antibodies are adjusted, approaching them with similar antibodies and moving away from different antibodies.
Development of adaptive immunity: Cloning of the antibodies is performed. Surplus antibodies are also eliminated in an elitist way.
Resolution of threat: Antibodies are stored in the immune memory to be used in the innate immune response.
The Innate immune response consists of one phase:
The results applied in mammographic images are presented in the following section.
4. Experimental Results
Experimental tests were performed by segmenting images with three proposed segmentation algorithms. These results were compared to the images produced by the Otsu method.
Subsequently, the errors obtained by each algorithm and the best algorithm to segment are presented.
In the same way, the classification of six datasets using three algorithms are carried out (the presented model and two classic classification algorithms).
Performances are calculated and the algorithm with the best performance for each dataset is obtained.
4.1. Selection of the Best Segmentation Algorithm
To select the best segmentation algorithm, three meta-heuristic algorithms and the Otsu method were used to analyze mammographies from the Breast Cancer Digital Repository [
46], which come from a Portuguese breast cancer database of real patients, which comprises 362 segmentations. The Faculty of Medicine of the University of Porto, Portugal provided this database made by expert radiologists, and they proved by biopsies the classifications provided (benign or malign).
Otsu parameters were used as a default and implemented in Matlab™. The parameters for the NBA were: three bats, three regions, 10 iterations, and other parameters as proposed by Meng et al. [
40] were used. These parameters showed a lower error for segmentation according to the study of González-Patiño et al. in 2016 [
42]. For the genetic algorithm, 50 individuals were used, with three regions, 10 iterations, a mutation rate of 0.05 and a crossover rate of 0.7. Finally, for simulated annealing an initial temperature of 100,000 and a cooling rate of 0.05 were used.
Errors for each image were calculated and we present the mean of the results in
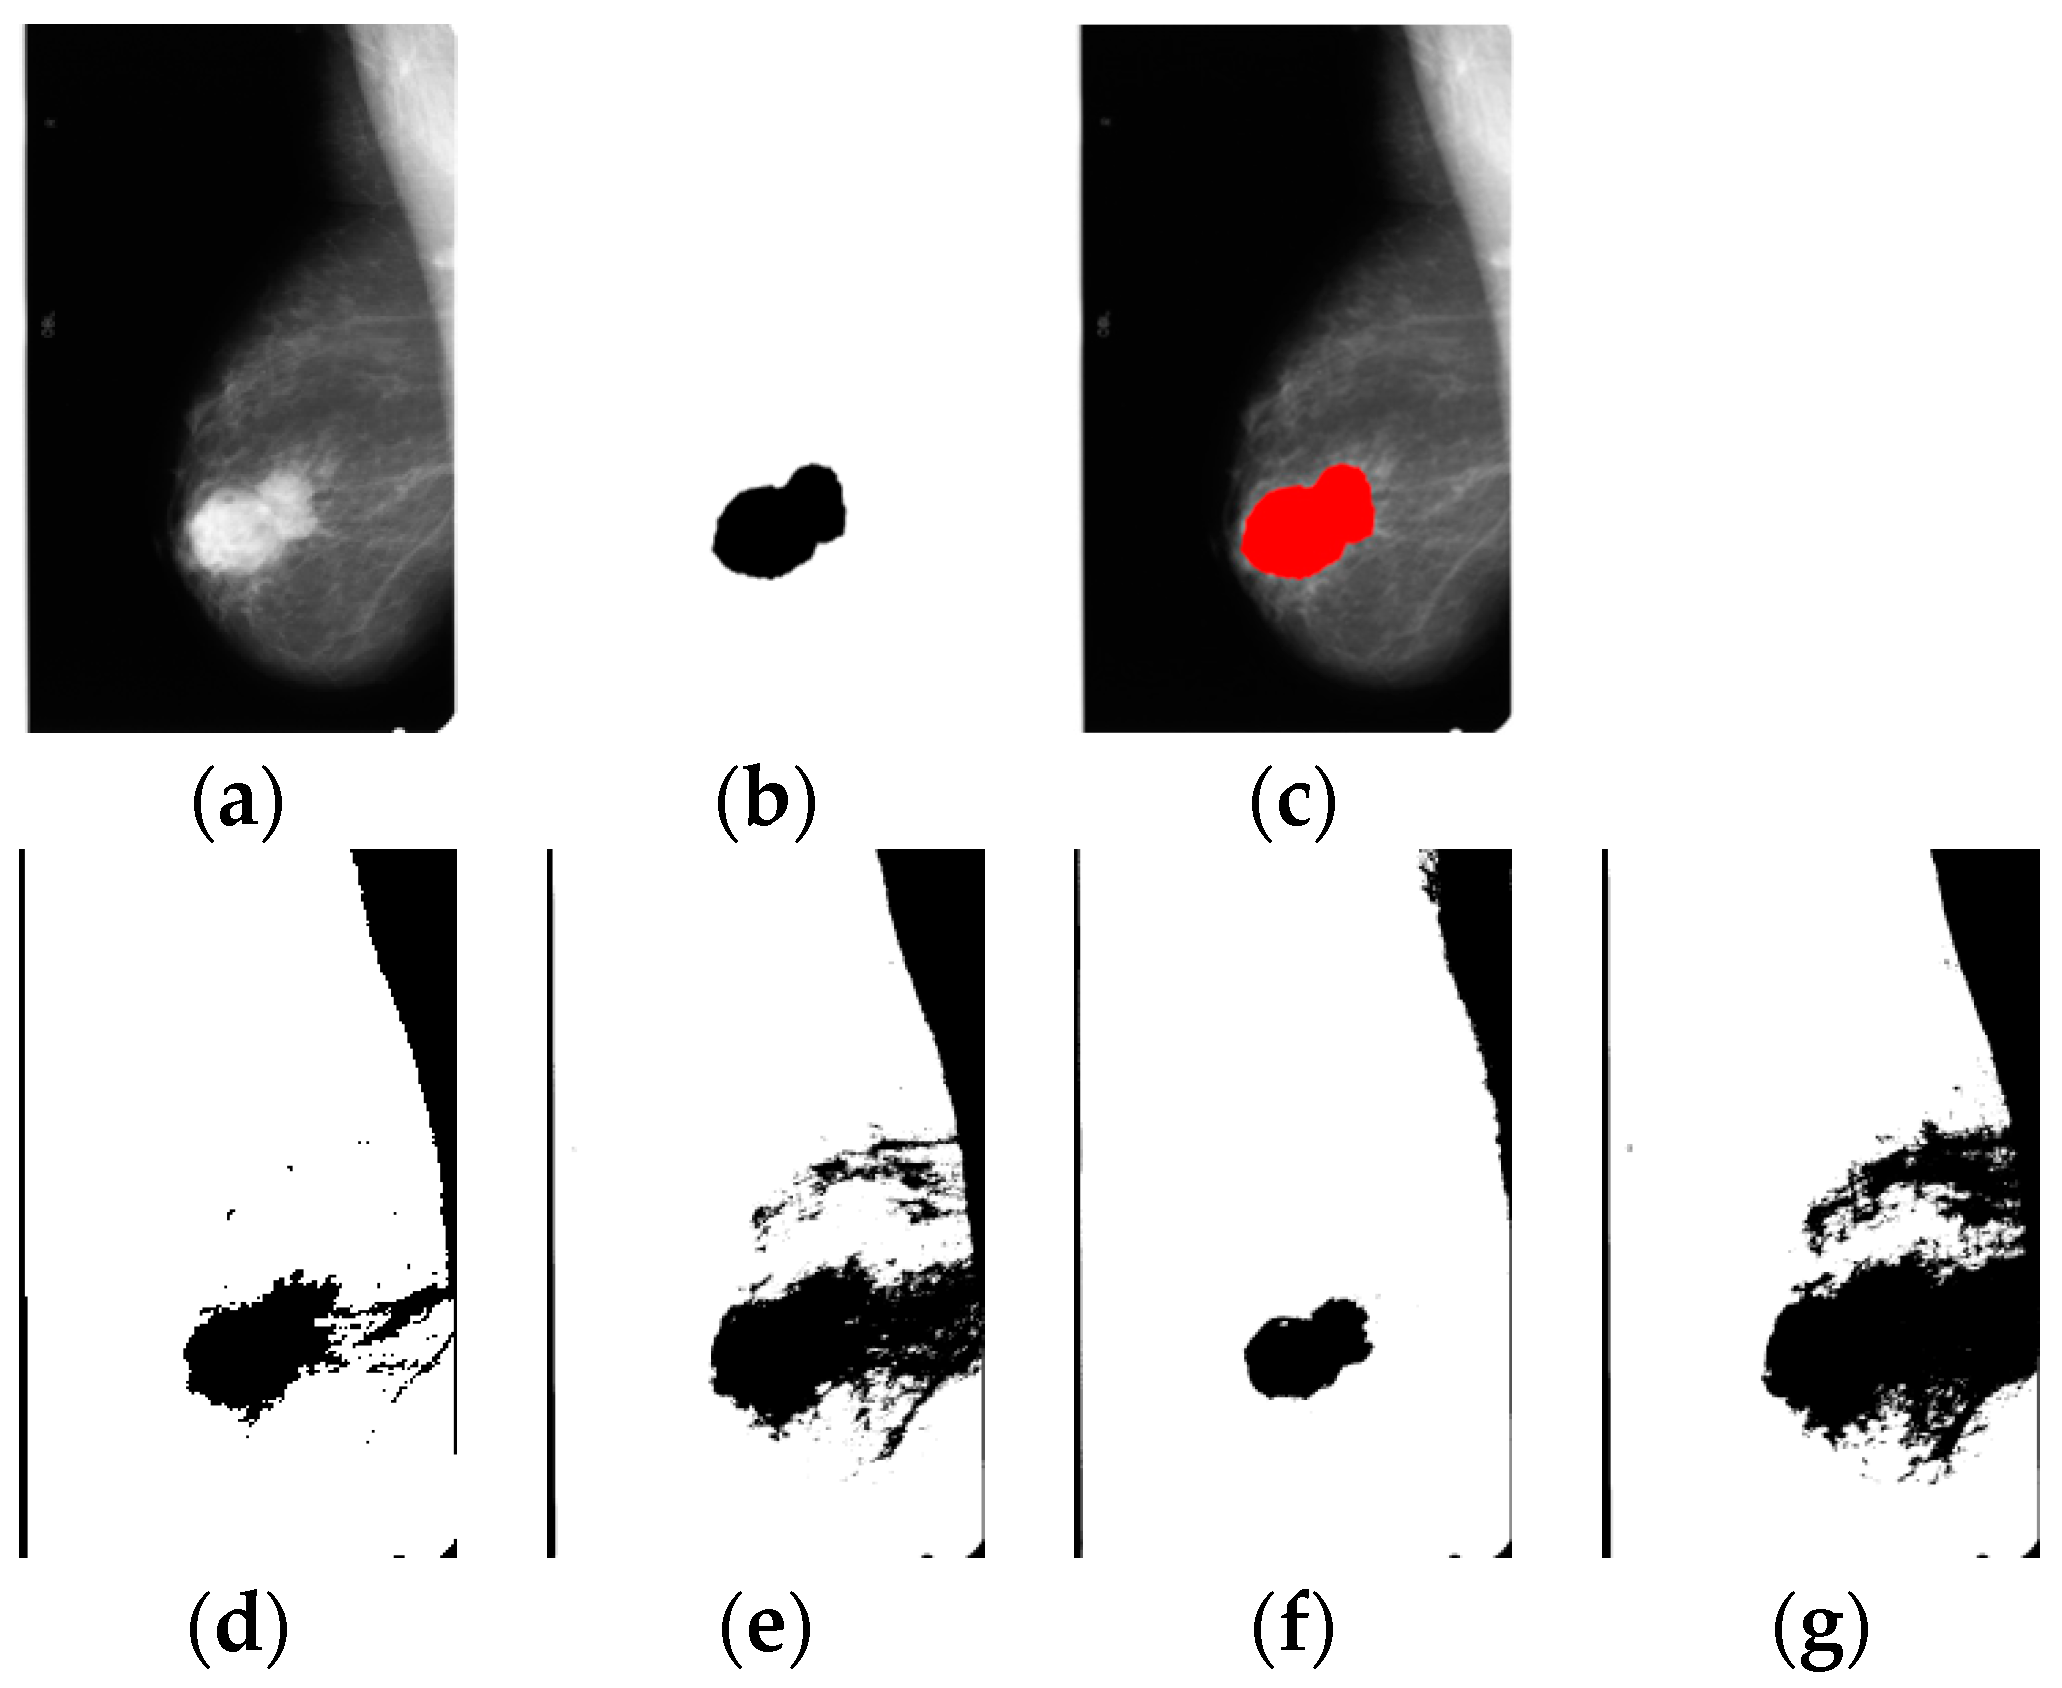
Table 2. The following images show two of the experiments carried out using images from mammographies. The first row shows the original mammography image, the region of interest and the region of interest overlapped in the original image. The second row shows the results applying the Otsu method, and the binarized segmentation obtained by the novel bat algorithm and the genetic algorithm. The final row shows the segmented image produced by the simulated annealing algorithm applied to segmentation.
Figure 5 shows a similar image (in shape) produced by Otsu and GA, while the NBA method segmented a different region. The NBA segmented a smaller region, which seems to be more accurate in relation to the original segmented image. The four algorithms got similar regions since the mammography has a very defined region of interest, however this is not the case in all images.
The behavior observed in the meta-heuristics results from the simplicity of the algorithms; given that GA is a more complex algorithm than the simulated annealing and the NBA.
Figure 5 and
Figure 6 reveals that the images segmented by GA have a smaller area compared to the images segmented by the Otsu method or NBA. This is relevant because the region obtained by GA is more similar to the original region obtained by the expert radiologist. It is necessary to take into consideration that the image acquired by some algorithms includes noisy pixels that do not correspond to the desired image, which is why in the results it is shown that GA got a better segmentation when contemplating all the corresponding pixels. In both cases, the algorithm which produced the most similar region to the original segmented image by the expert was genetic algorithms.
Table 2 and
Figure 7 show the mean of the errors for all the 362 mammography images of the dataset.
Table 2 shows a descending error of the algorithms, which showed that Otsu has the highest error while NBA and GA have lower errors, with GA being the algorithm with the lowest error.
Even if the Otsu method is a frequently used method for image thresholding, it can be observed that the Otsu method’s error is 1.42 times higher than that of the NBA and 1.54 times higher than that of the GA. The error acquired by the simulated annealing algorithm was close to but lower than the Otsu method. In addition, the NBA’s error is 1.08 times higher than the GA’s; showing that the GA has the lowest mean error for the segmentation of breast cancer mammographies. The GA showed a lower error because of its capability to explore a higher number of candidate solutions, which resulted in a better segmentation compared to the NBA, which also explores a large number of candidate solutions.
Run times for each algorithm were calculated, and the mean run time is shown in
Table 3.
According to the mean times, Otsu method had the lowest mean run time, in contrast to its higher error in the segmentation. The genetic algorithm had the lowest segmentation error, but it had the highest mean run time.
4.2. Classification of the Lesions
The proposed classification algorithm with six cancer-related datasets was tested, and the results are presented with the classification performances in the following section, including the comparison with two classic algorithms utilized in experiments and published in the literature.
The datasets used were:
Breast Cancer Digital Repository (BCDR) [
46]. The Faculty of Medicine of the University of Porto, Portugal provided this dataset, and it is used to explore the computer-based detection and diagnosis methods.
Breast Cancer Wisconsin (Original) Data Set (BCWO) [
47,
48]. The University of Wisconsin, USA provided this dataset. This dataset contains data collected from clinical cases by Dr. William Wolberg.
Breast Cancer Wisconsin (Prognostic) Data Set (BCWP) [
48]. Dr. Wolberg provided this dataset, and it contains the follow-up of breast cancer cases.
Lung Cancer Data Set (LCDS) [
48]. Hong and Young used this dataset to apply the k-nearest neighbor method, showing a biased result. It contains data on lung cancer patients.
Mammographic Mass Data Set (MMDS) [
49]. Matthias Elter donated this dataset to the University of California, Irvine (UCI) repository in October 2007. It contains data of mammographic mass lesions from Breast Imaging Report Database Systems.
Haberman’s Survival Data Set (HSDS) [
48]. Tjen-Sien Lim donated this dataset in 1999. It contains data related to the survival of patients who underwent breast cancer surgery.
Similarly, a brief description of the classical algorithms used for classification is included. Support Vector Machines (SVM) [
50] are algorithms used for classification and regression. These algorithms build a model that represents the patterns of the training set. Their main objective is to find a hyperplane that separates two classes. These algorithms work ideally for two classes; however, it is possible to use strategies that allow them to be used to build a model able to separate two classes.
Repeated incremental pruning to produce error reduction (RIPPER) [
51] is an algorithm based on association rules with reduced error pruning; this technique is frequently used in decision tree algorithms. The generation of rules is performed by applying pruning operators to reduce the error. The algorithm ends when the error is increased after a pruning operation.
Regarding the classification process, we present the results of classifier accuracy comparing the two algorithms with the artificial immune system in
Table 4.
We repeated the classification process 10 times and averaged the performance of each algorithm. The classification accuracy is calculated as the number of correctly classifying elements among the total number of elements. The best accuracy for each dataset is bolded in
Table 4.
As it can be observed, the artificial immune system (AIS) proposed got the best performance in four out of six datasets, which is interesting considering that the other algorithms are widely used in the literature.
5. Discussion and Conclusions
The meta-heuristic-based segmentations showed a lower error compared to the Otsu method, which is relevant since the Otsu method is one of the classic and still used methods for thresholding. These algorithms showed better performances than the Otsu method, even when using them without testing different configurations.
When contrasting the meta-heuristic with the highest error (SA) and the Otsu method, it can be observed that the error presented in simulated annealing is lower than that of Otsu, which represents an important fact since Otsu is a well-known and useful method for thresholding.
According to the runtime test, it was observed that the Otsu method had the lowest run time. However, implementing this method with the Matlab™ software resulted in an optimized and reviewed version of the algorithm. Implementing the meta-heuristic algorithms was a dummy one, with no use of parallel programming.
Many of the meta-heuristics have numerous parameters, which increases the performances of the algorithm depending on the values for each parameter. In this work, we change no parameters for such algorithms, and we did not prove other configurations, but in future work, this could be improved.
The classification model presented (AIS) showed a good performance in most of the datasets where it was tested. This is relevant since it is a new intelligent computing algorithm that opens a research gap in bio-inspired algorithms.
The proposed method can be used as a guide for the radiologists when there is a high demand for processing mammograms and it can also be used as a second opinion in critical cases.
In future work, we can implement preprocessing for enhancing the contrast of the images, to compare the use of preprocessing before segmenting using the meta-heuristics. This could help the segmentation algorithms to perform a better segmentation. This could help the segmentation algorithms to perform a better segmentation.
Concerning the classification algorithm, it is convenient to explore the use of mutation strategies, the global optima, and to improve the search for the desired solution.

 ,
, 


