Article

Effects of Laser Beam Parameters on Bendability and Microstructure of Stainless Steel in Three-Dimensional Laser Forming

by
Daniyal Abolhasani
1,
Seyed Mohammad Hossein Seyedkashi
1,*,
Mohammad Hoseinpour Gollo
2 and
Young Hoon Moon
3,*
1
Department of Mechanical Engineering, University of Birjand, Birjand 97175–376, Iran
2
Department of Mechanical Engineering, Shahid Rajaee Teacher Training University, Lavizan, Tehran 16785–136, Iran
3
School of Mechanical Engineering, Advanced Processing Technology Laboratory, Pusan National University, Pusan 46241, Korea
*
Authors to whom correspondence should be addressed.
Appl. Sci. 2019, 9(20), 4463; https://doi.org/10.3390/app9204463
Submission received: 22 September 2019 / Revised: 10 October 2019 / Accepted: 19 October 2019 / Published: 22 October 2019
(This article belongs to the Section Mechanical Engineering)

Abstract

:
In this study, the effects of beam diameter and hatch spacing between the scanning paths on the bendability and microstructural behavior of an AISI 316 stainless-steel sheet in three-dimensional laser forming were investigated. The strain on the heating lines and that between the scanning tracks were numerically investigated to elucidate the effects of process parameters. The strain on heating lines and that between scanning tracks were numerically investigated. The increase in hatch spacing caused a larger amount of counter bending to be retained in the unaffected areas between the tracks through a process dominated by a temperature gradient mechanism (TGM), and also caused a lower deformation. The formation of small equiaxed dendrite grains instead of coarse and inhomogeneous austenite grains occurred during the process at a larger beam diameter and smaller hatch spacing, which increased the bendability of the material, owing to the decrease in anisotropy in the microstructure. Moreover, the increase in the grain size of the reheated overlap region of the deformed sample led to a higher bendability. Under these conditions, the microhardness was also increased owing to the grain boundary strengthening effect.

1. Introduction

Laser bending is a noncontact forming technique, which can be used in high-precision bending, curvature adjustment, and alignment in various industries. This process is implemented using the temperature gradient, buckling, or upsetting mechanisms [1,2].
Owing to the thermal nature of the process, the material is affected by several process parameters, particularly by the laser beam parameters and scanning strategy [3]. The effects of laser forming parameters on the bending angle have been numerically and experimentally investigated for a better understanding of the process [1,2,3,4,5,6]. Various studies have been conducted on the microstructural characterization of the materials. Yang et al. [7] investigated the relations between the surface behaviors of the heat-affected zone and laser pulse parameters in laser forming. Zhang et al. [8] compared pulsed- and continuous-wave (CW) laser forming processes on ceramic, silicon, and stainless steel parts, in terms of microstructure. They reported that a larger material damage was caused by the CW laser, compared to the pulsed laser, although a larger bending angle was obtained by the CW laser. Birnbaum et al. [9] reported that repetitious scanning increased the volume fraction of martensitic structure in stainless-steel metals; however, the martensitic volume fraction should be minimized. Abazari et al. [10] performed an extensive study on the microstructural changes in SUS430/C11000/SUS430 composites during laser forming and on the effects of process parameters on the mechanical properties and fatigue life of the composites. In addition, the microstructural changes in laminated metal composites during laser forming have been studied by Seyedkashi et al. [11].
In the laser material processing, the microstructure of the sample could be significantly influenced by self-tempering, if the material was subjected to repeated reheating cycles. The resultant microstructure at the heat-affected zone was then a low- or high-tempered structure, based on the process parameters.
In two-dimensional laser forming, the effects of process parameters, such as laser power, scan speed, and beam diameter on the microstructural changes are already reported. However, the effects of process parameters including various beam diameters at different hatch spacings between the scanning paths on the microstructural behaviors of the scanned tracks are not well-understood. Moreover, the relations between microstructural behaviors with the bendability of the material, particularly in three-dimensional (3D) laser forming, have not been analyzed. The cooling rate determined by the thermal gradient and solidification rate is significantly influenced by process parameters, such as the beam diameter and hatch spacing and can affect the microstructure of the scanned track, which leads to varying deformation. The aim of this study was to understand the structural effects of the beam diameter and hatch spacing in 3D laser forming. In addition, the conditions yielding an increased bendability were revealed. The heat accumulation between the scan paths could be controlled, which was beneficial for the bending process, particularly in terms of the microstructure.

2. Methods

2.1. Laser Forming Experiments

American Iron and Steel Institute (AISI) 316 stainless-steel sheets with dimensions of 18 × 22 × 0.5 mm were used in this study. This material was extensively used at the macro- and micro level in various industries. The specific dimensions were chosen to not hinder the mechanical handling. The source of radiation was an ytterbium fiber laser (IPG YLR-200, IPG Photonics, Germany), with a wavelength of 1.07 μm and a maximum power of 200 W at 6 A.
A raster scanning pattern was applied for the laser forming, which involved several sequential scans, as shown in Figure 1a. The applied scanning approach and desired shape are illustrated in Figure 1b,c, respectively. Based on the preliminary experiments, the laser power and scanning velocity were set at 150 W and 3.82 mm/s, respectively, while the dwell time between each irradiations was 2 s [12]. The studied laser bending parameters are illustrated in Figure 2, where hs is the hatch spacing, Db is the beam diameter, and OR is the overlap ratio ( OR = 1 h s D b ) [12]. Table 1 summarizes the laser forming parameters used in this study.
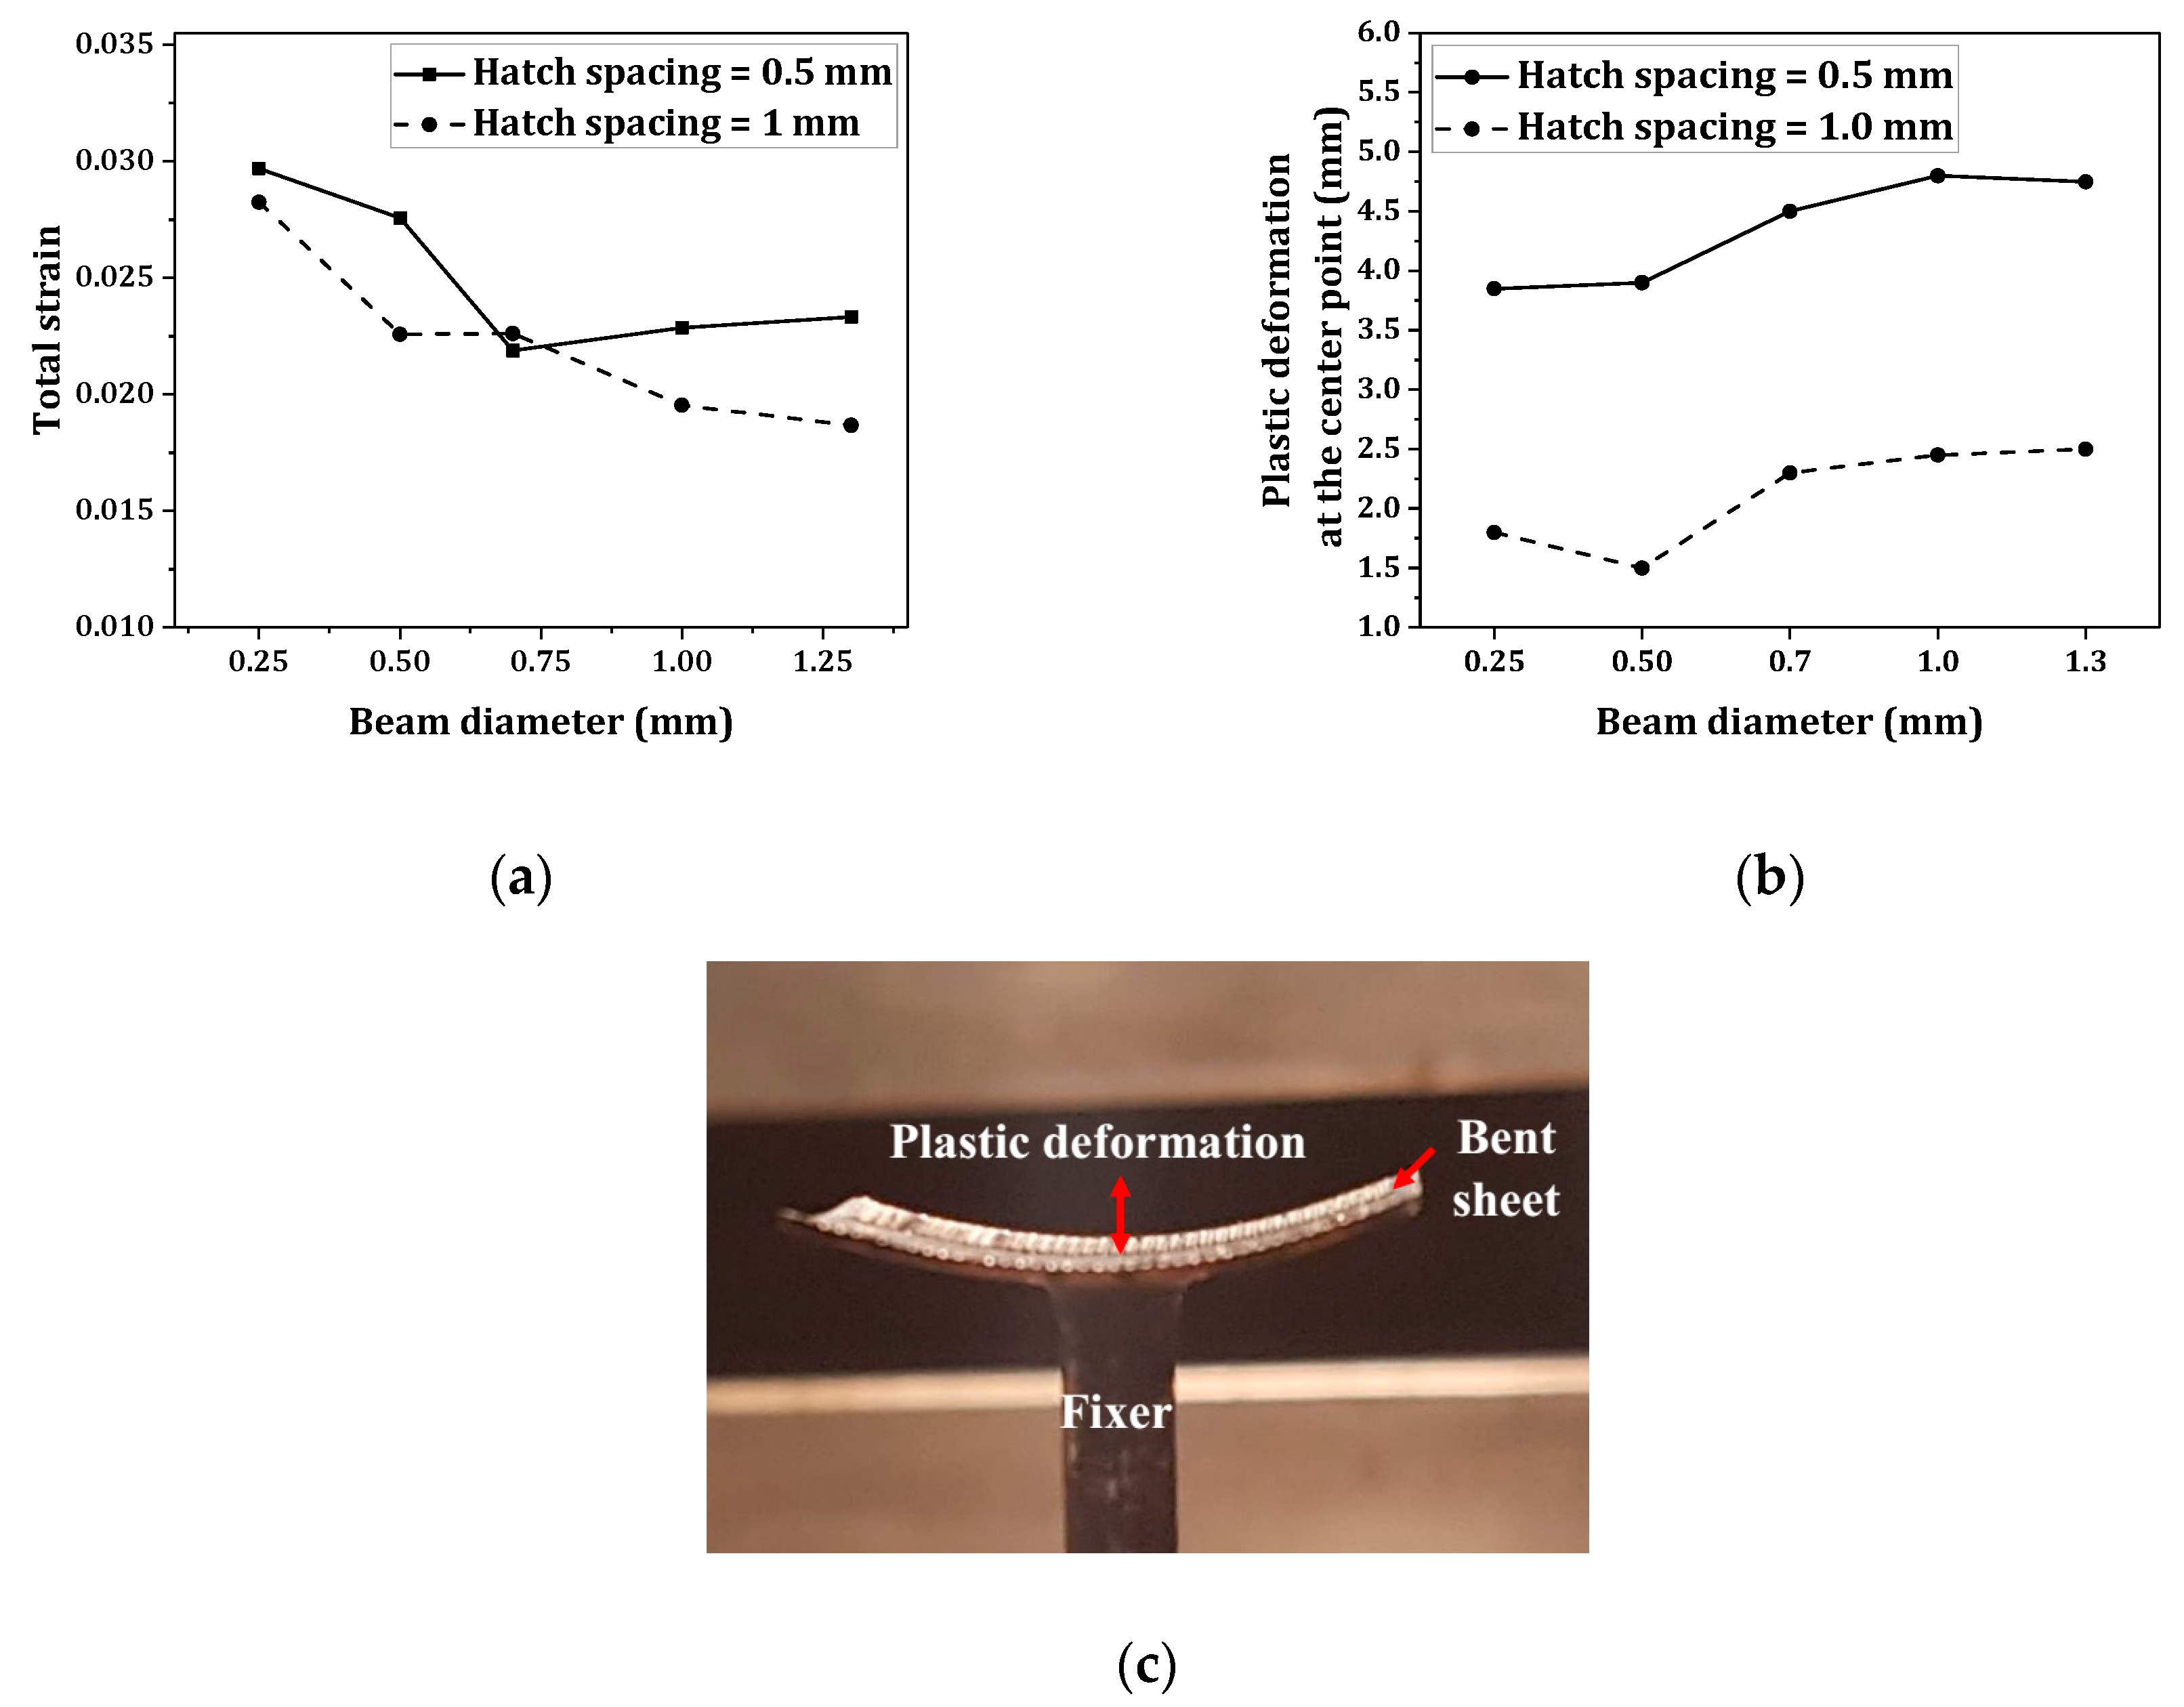
The plastic deformation at the center point of the deformed sample was considered to be the total deformation of the formed sample. A Mitutoyo micrometer was used for the measurements. After the laser forming, cross-section micrographs were acquired. For optical microscopy and scanning electron microscopy (SEM; ZEISS GEMINI SUPRATM; 40 VP) observations, the polished AISI 316 samples were etched by an aqua regia solution, consisting of 30 mL of distilled water, 20 mL of HCl, and 15 mL of HNO3, at a room temperature of approximately 120 s.
The thermal cycle in the irradiation pass is of importance for the evaluation of the suitability of the determined process parameters with respect to metallurgical properties [13]. Hence, the sample was laterally sectioned at the middle part and a microhardness test was performed along a specific scan pass. The Vickers microhardness test with a square-based pyramid diamond was performed, based on the American Society for Testing and Materials E 384-16 standard.

2.2. Determination of Strains and Temperatures

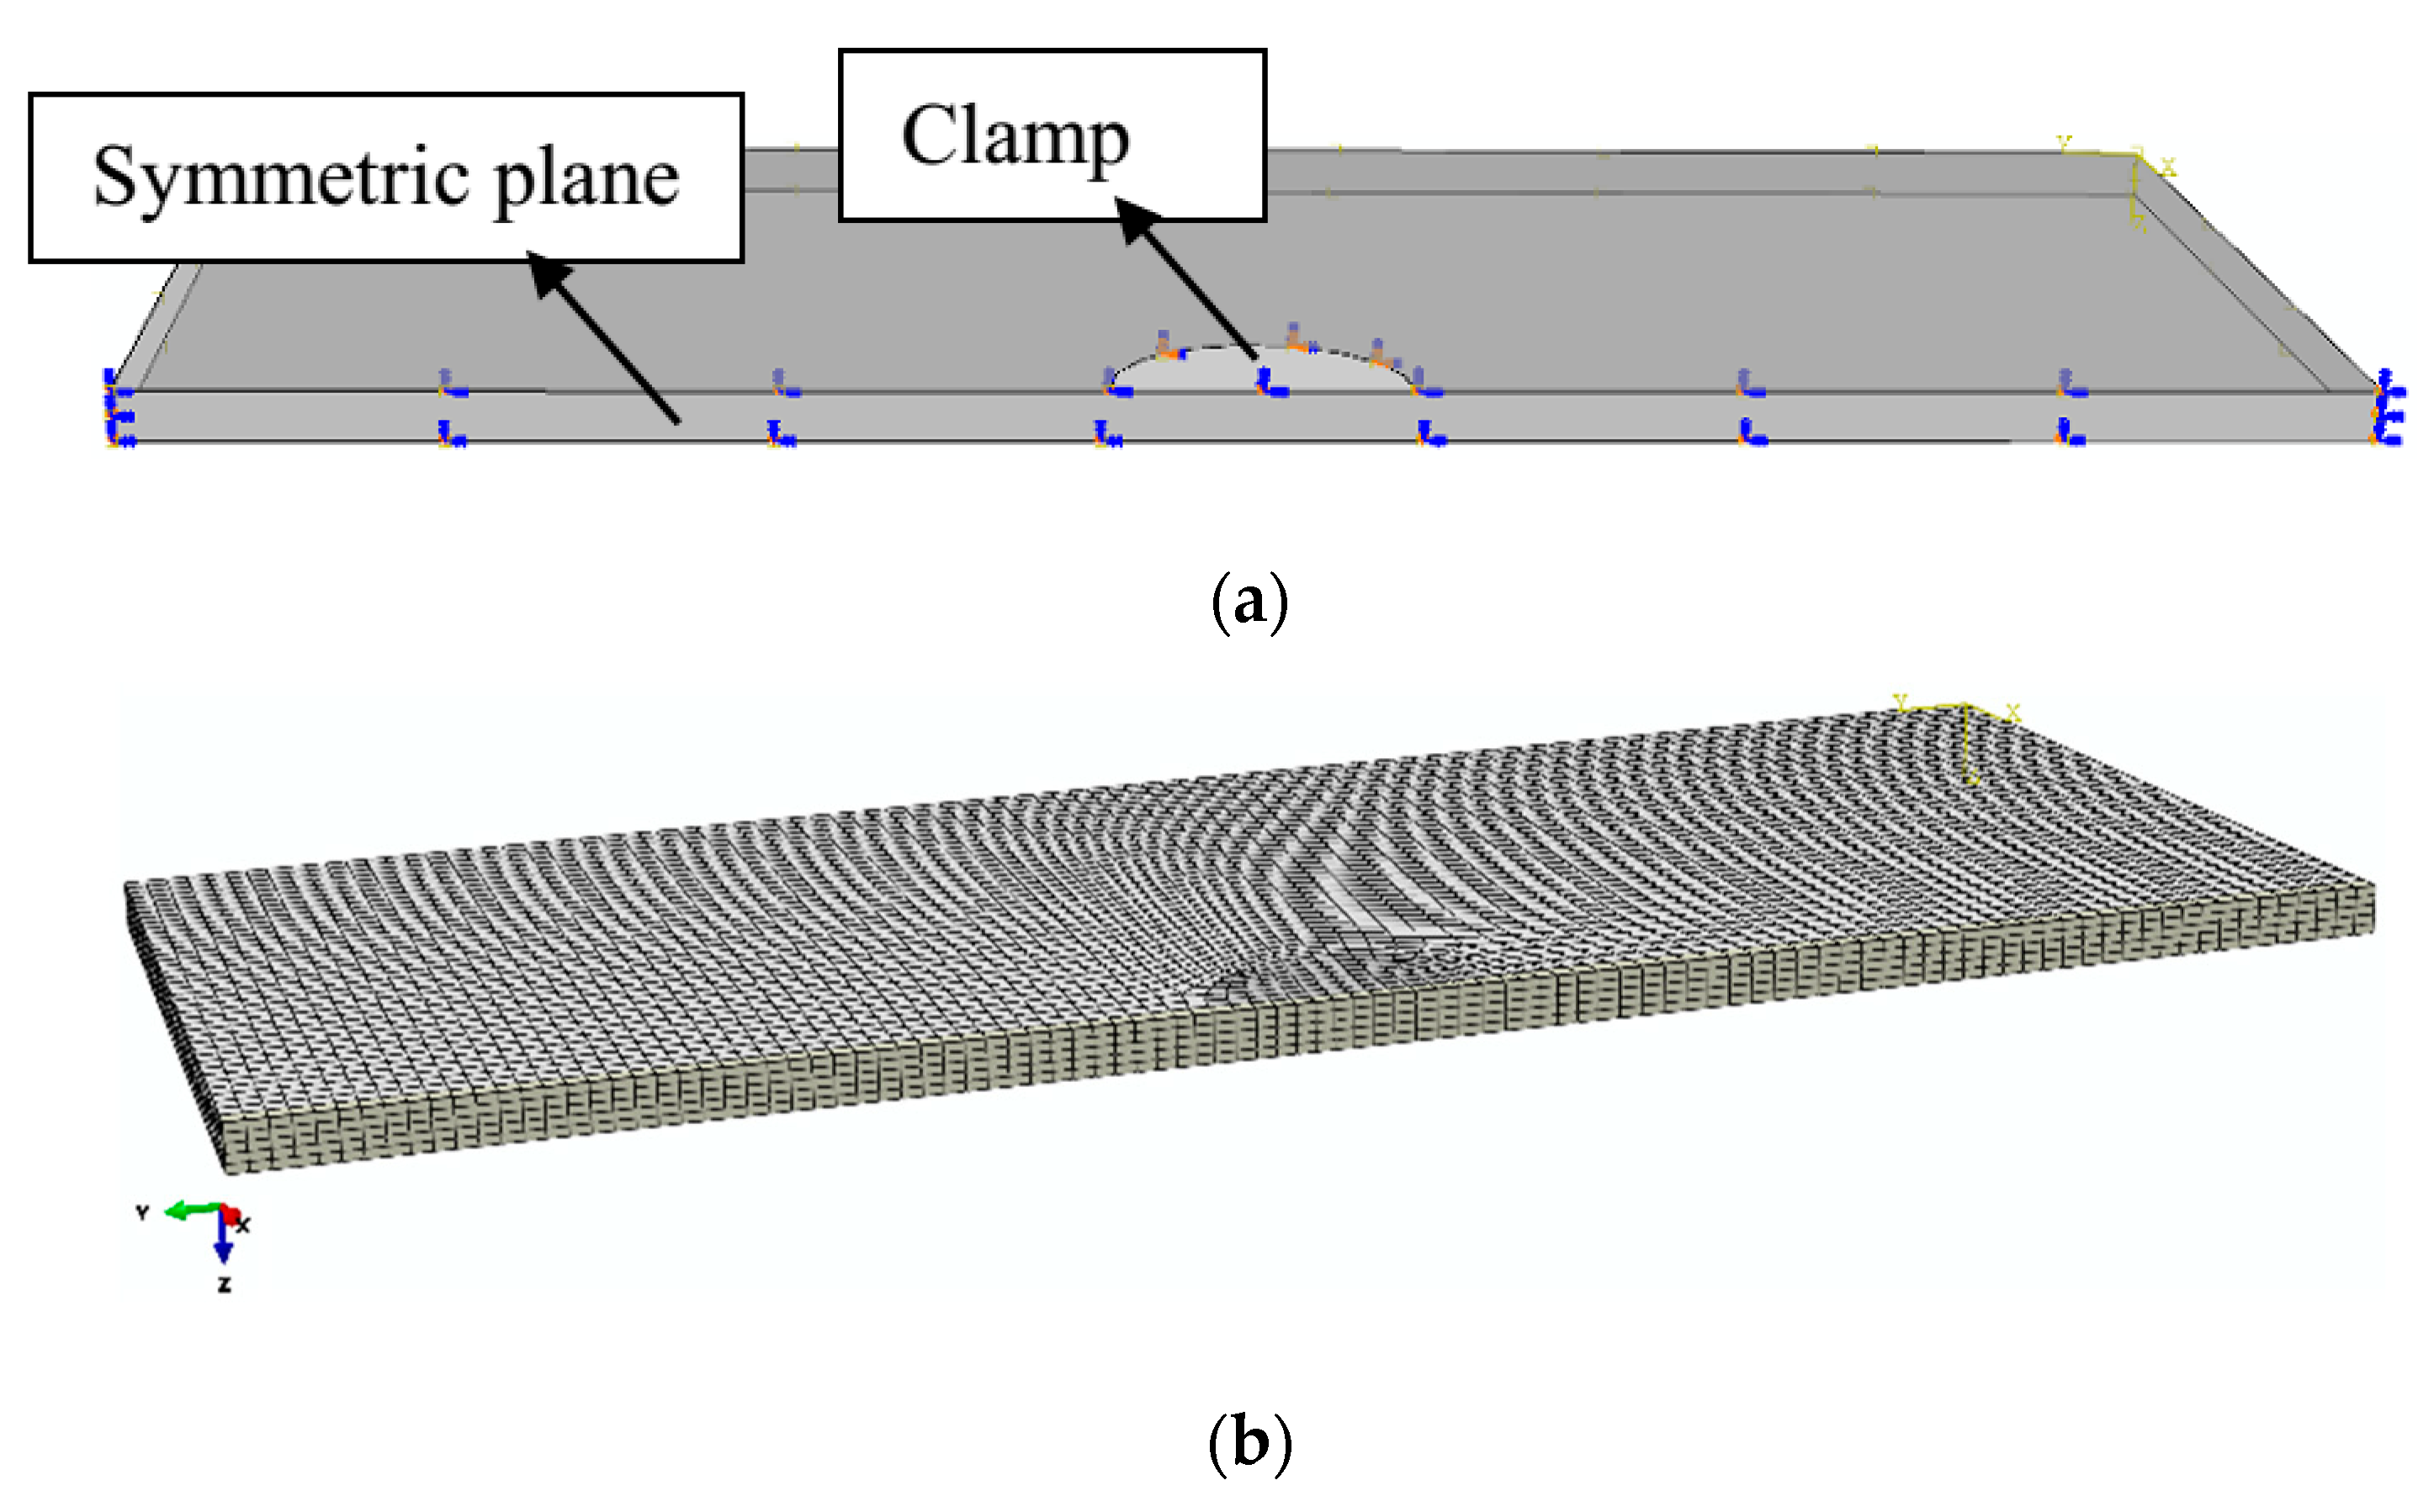
The evaluations of strains and temperatures for the tracks subjected to repeated heating and reheating during the laser forming were conducted by finite-element (FE) simulations by using the ABAQUS™ commercial software. To reduce the computation cost, only half of the plate was modeled and several adjacent tracks were analyzed in each simulation. In the model, the same fixture used in the real experiment was added around the center of the symmetric plane shown in Figure 3a. With a mesh refinement test, the whole specimen was meshed with approximately 54,500 eight-nodded linear hexahedral elements of type C3D8RT, distributed uniformly in the whole region, as shown in Figure 3b. In the thickness direction (z-direction), the mesh was uniform and the number of elements were 6, in order to accurately capture the flux distribution of the moving laser beam. In the x and y-directions, the element sizes were 148 × 10−6 m. If 10 nodes instead of 6 were used in the thickness direction, the temperature field and history were almost not affected, with the maximum temperature difference being less than 10 K. Decreasing the element length in the x and y-direction, the maximum temperature difference was less than 20 K. No change in the subsequent analysis was caused by these temperature differences.
The heat flux followed a Gaussian distribution [6],
Q = 2 A P π R 2 exp ( 2 ( x 2 + y 2 ) R 2 ) ,
where P is the laser power (W), A is the absorption coefficient, R is the laser beam radius (m), and x and y are the projected distances (m) from the center point of the laser beam. For the heat conduction within the workpiece, the thermal conductivity k (W/mK) was considered to be temperature-dependent. The convection and radiation boundary conditions were set as
qtotal = qcon + qrad = h(TT0) + εϭ(T − T0)4,
where h is the heat transfer coefficient (20 W/m2 K [14]), T0 is the surrounding temperature (300 K), T is the surface temperature during the laser heating processing, ε is the emissivity (0.8 and 0.32 for the heated surfaces with graphite coating and uncoated domains, respectively), and ϭ is the Stefan–Boltzmann constant (5.6703 × 10⁻⁸ W/m2 K4). The temperature dependences of the other parameters were obtained from the material supplier and literature [15].
The phase change was conducted according to the latent heat of fusion, which was provided separately by the enthalpy difference between the solidus and liquidus phases. The validation of the numerical model is explained in [12].
In the laser forming, the temperature could increase to the melting point of the workpiece material. Consequently, the influence of the strain rate on the material flow stress was increased at an increased temperature. Therefore, the strain rate associated with the strain had a large influence on the bend angle in the laser bending.
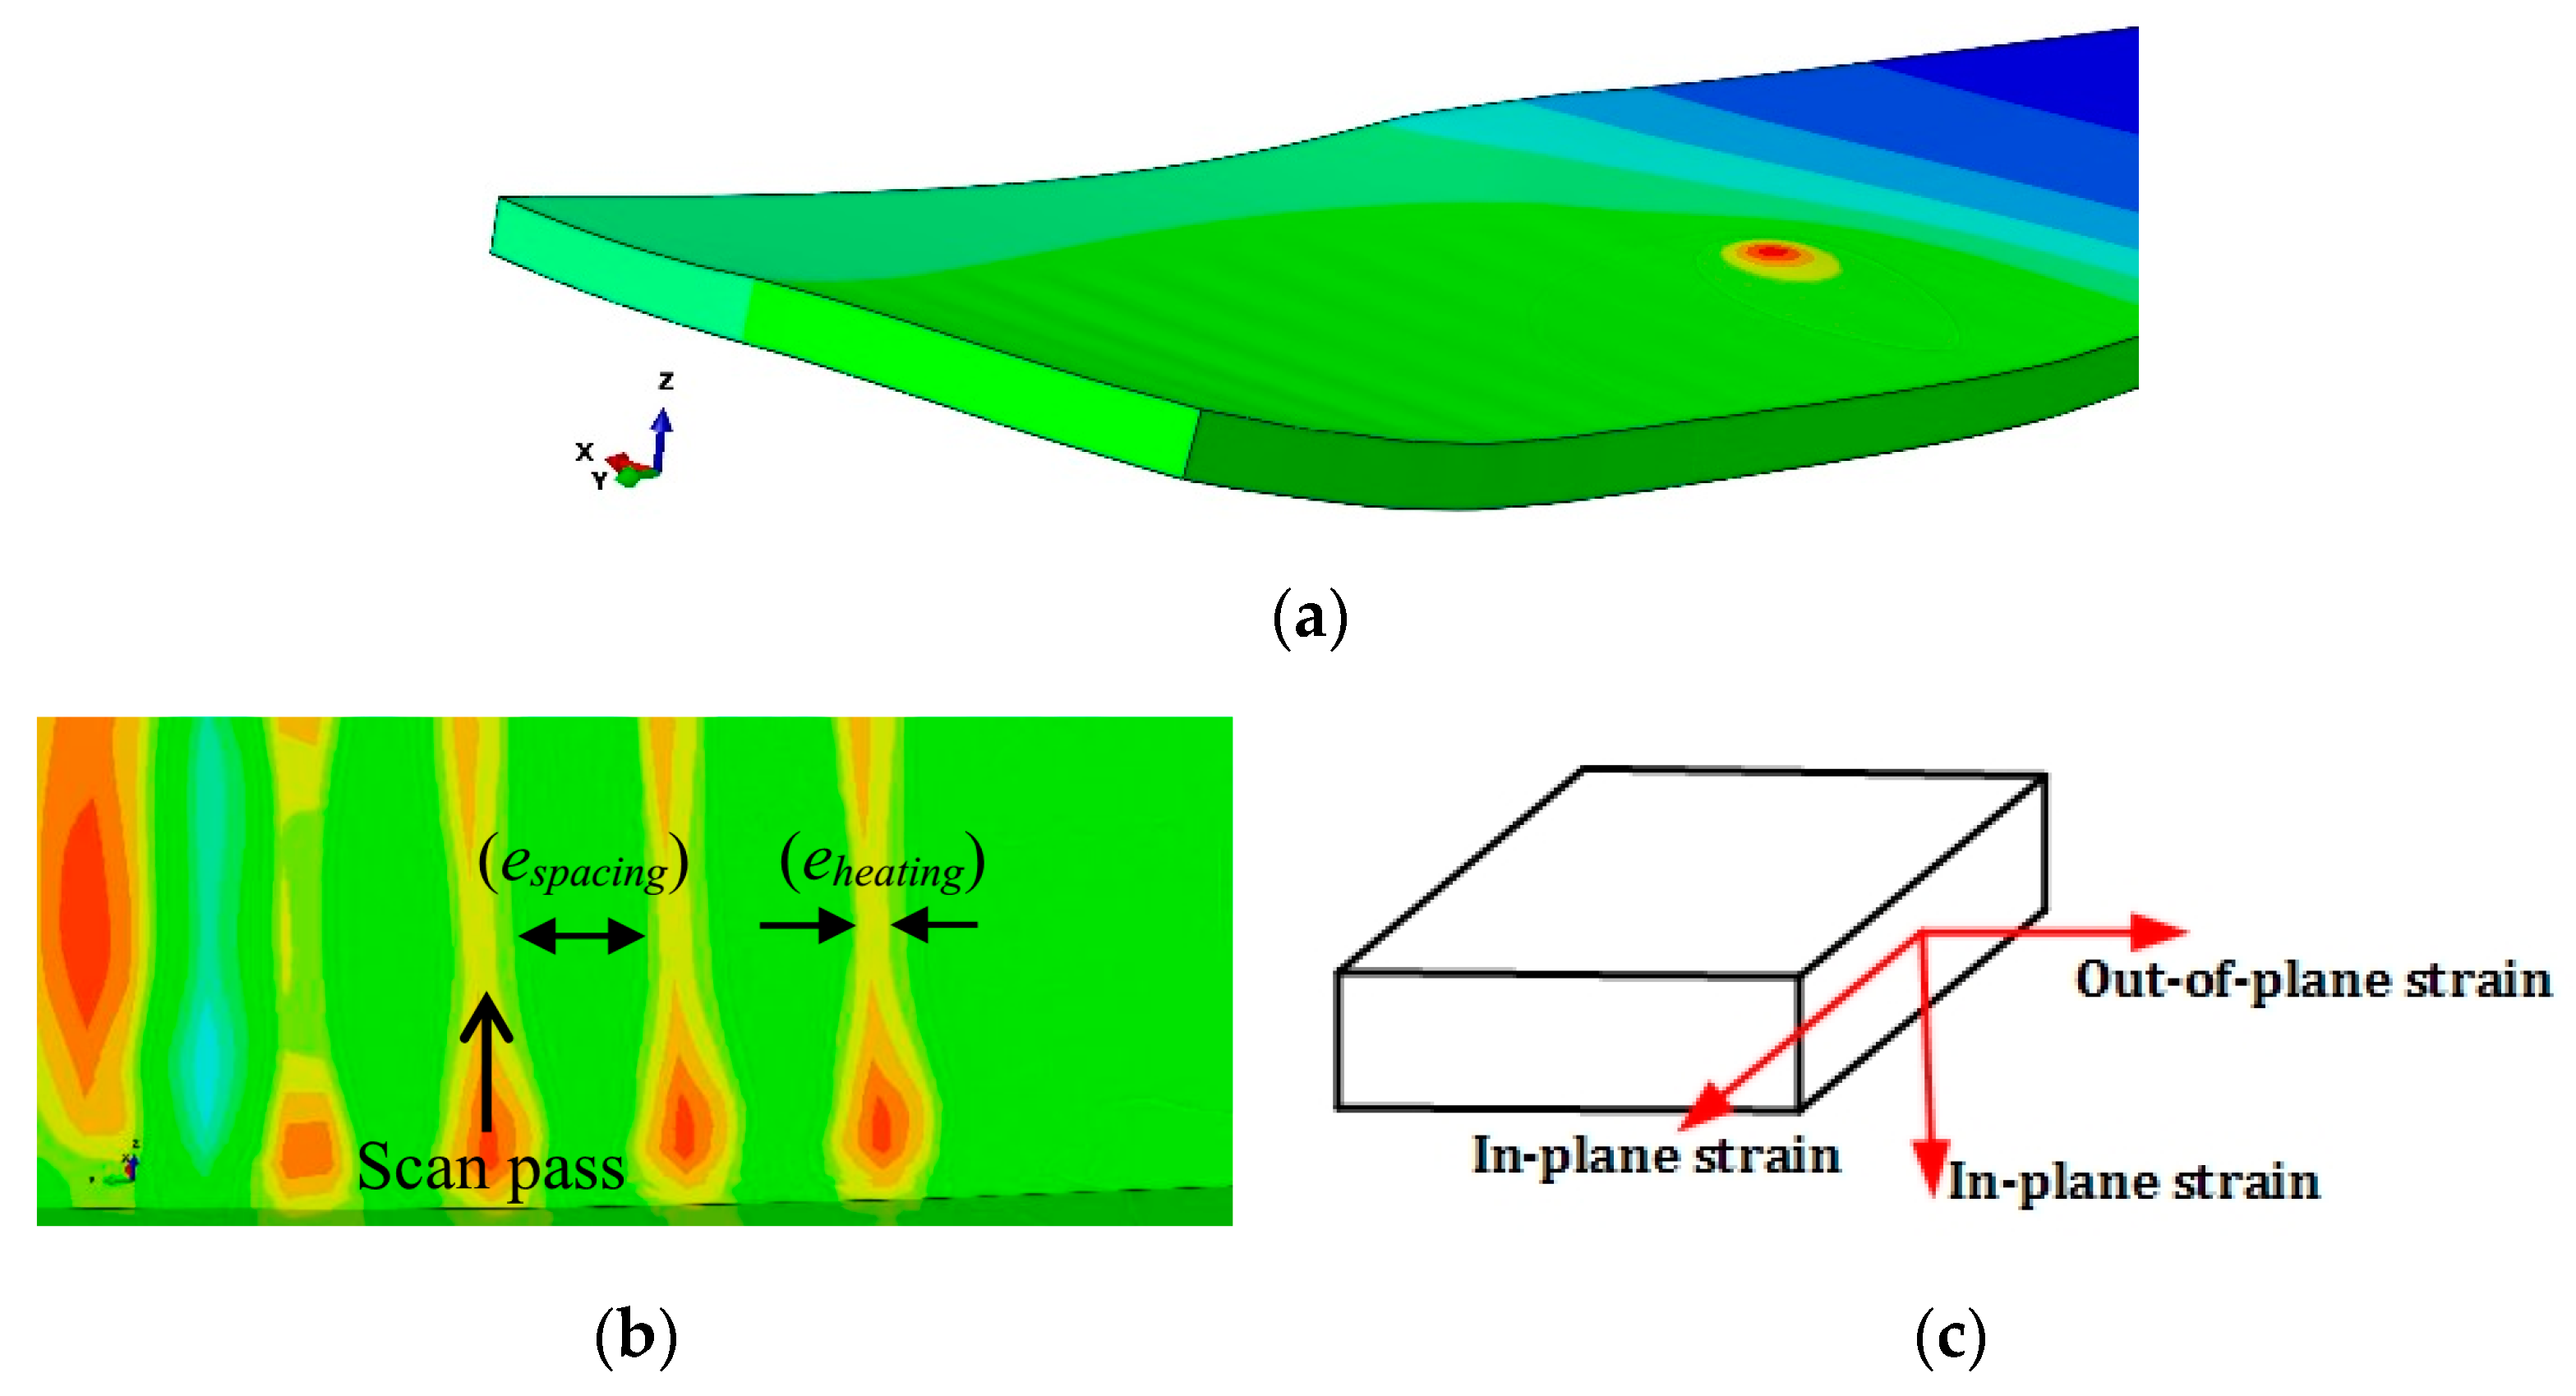
The strains on the heating line (eheating) and spacing between scan tracks (espacing) contributed to the total strain etotal [16,17,18],
etotal = eheating + espacing,
The in-plane (ein-plane) and out-of-plane (eout-of-plane) strains were the individual components of the heating strain (eheating) and the spacing strain (espacing) [18].
eheating = ein-plane + eout-of-plane
espacing = ein-plane + eout-of-plane
The simulated model is shown in Figure 4a. The heating and spacing strains were calculated through numerical modeling at the centers of the regions shown in Figure 4b. The in-plane strain was calculated by averaging the strains in the two perpendicular directions at the mid surface (Figure 4c), where the out-of-plane strain was also analyzed.

3. Results and Discussion

3.1. Effects of the Beam Diameter and Hatch Spacing

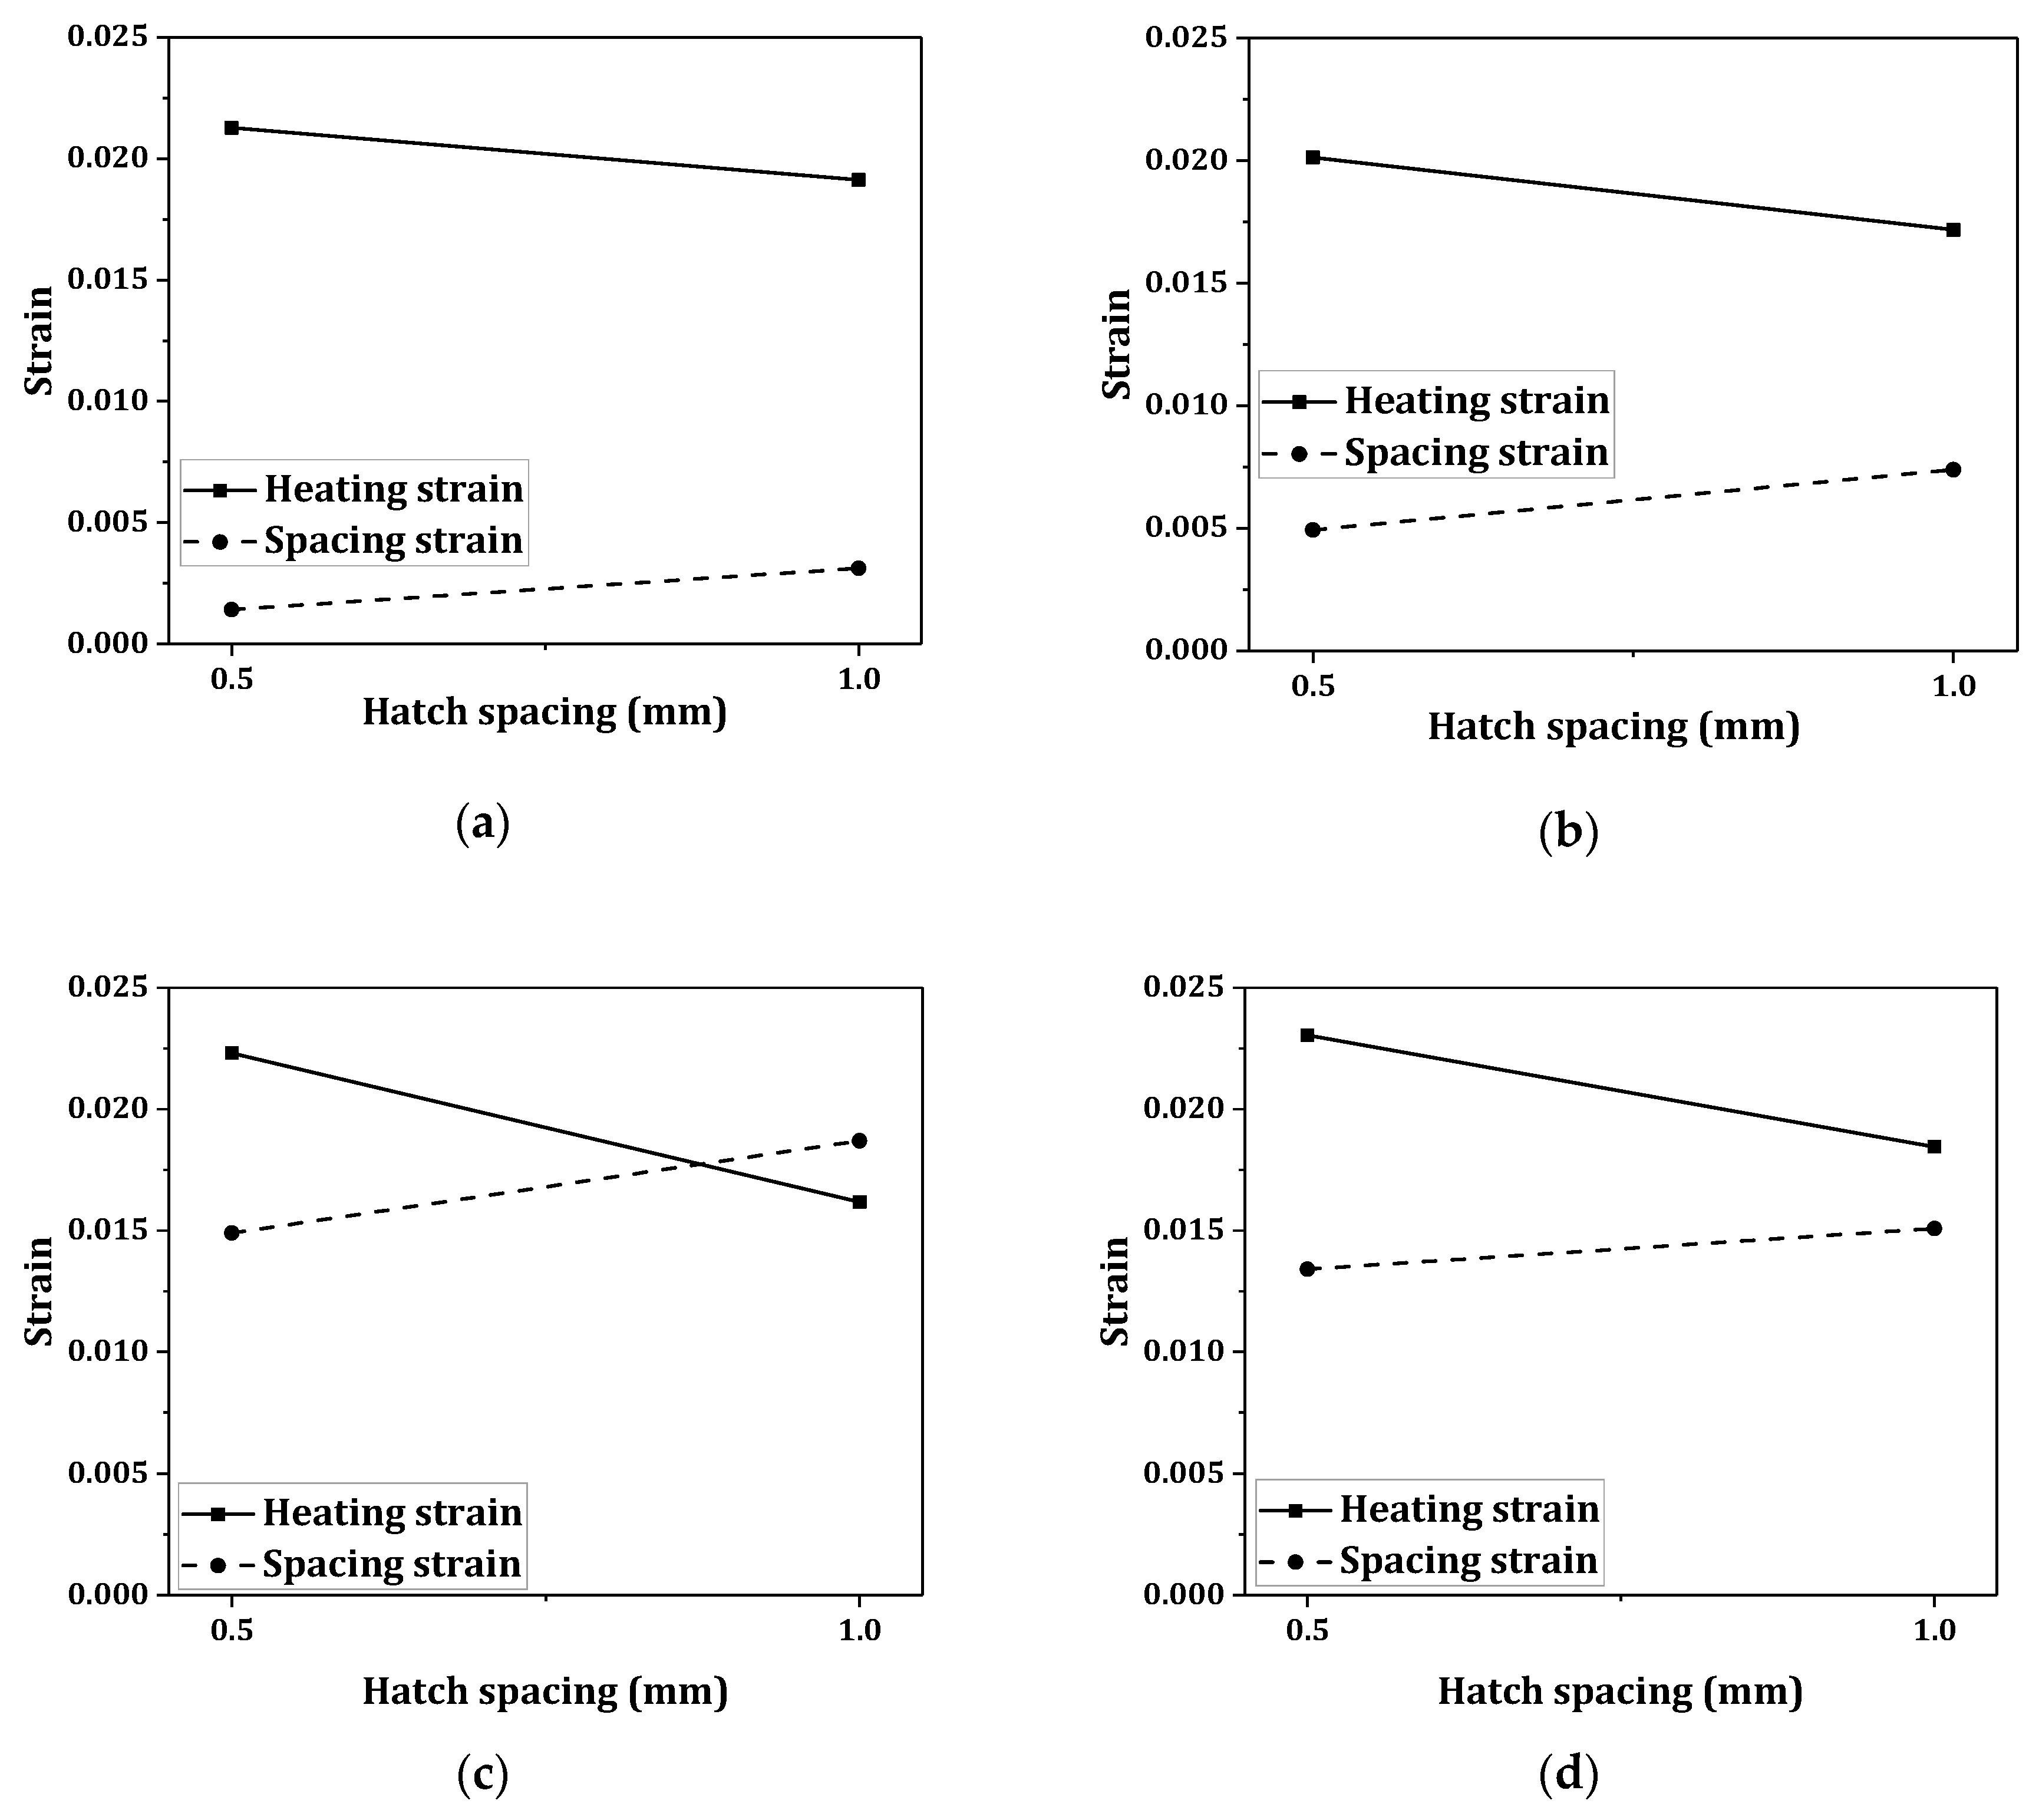
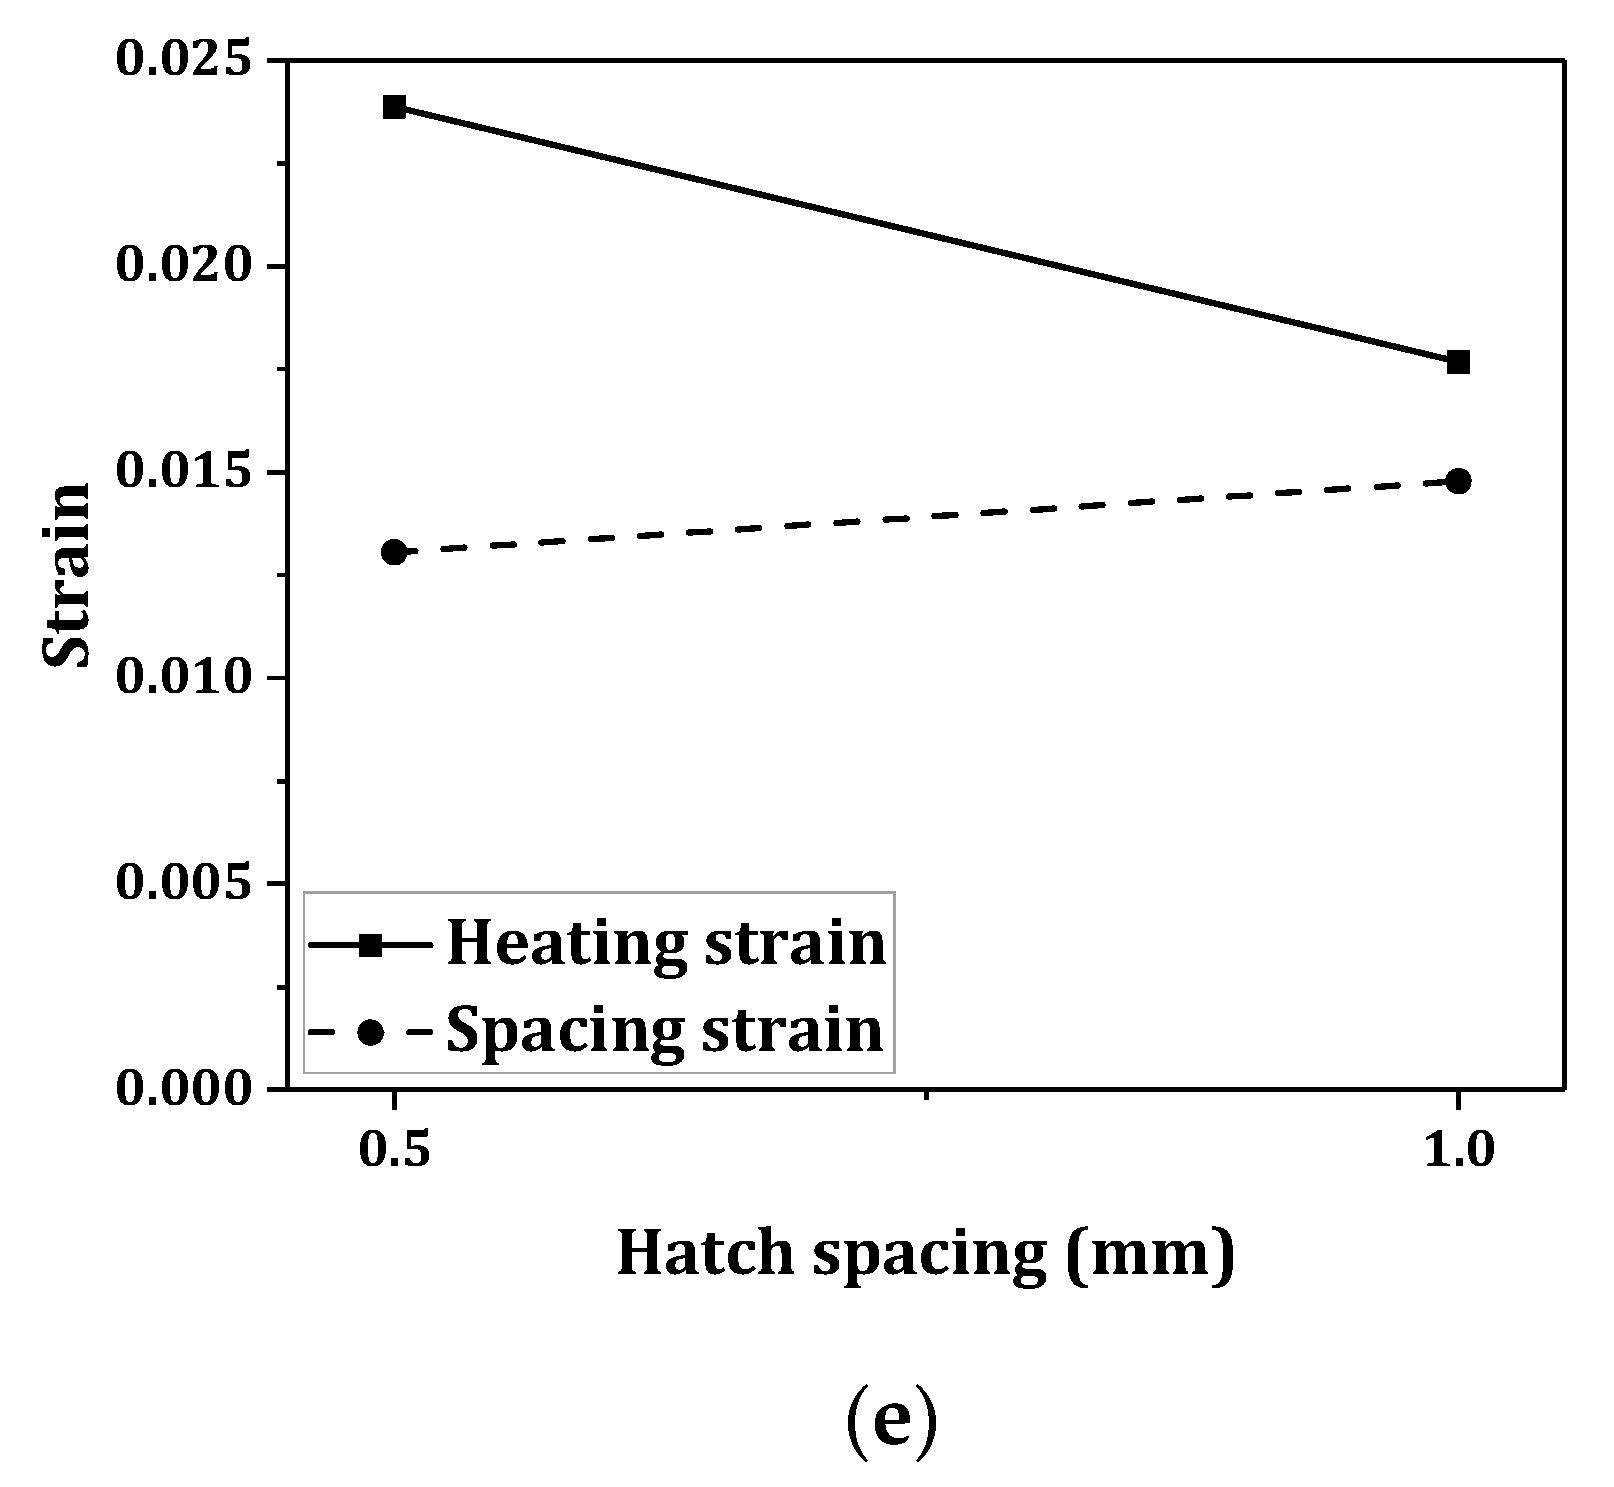
Several factors simultaneously contributed to the formation of a dome plate, including the beam parameters, temperature at the top surface, plastic strain, and microstructure, which were analyzed in this study. For each beam diameter, the plastic strains were analyzed with the change in hatch spacing. Figure 5a–e show the plastic strains calculated by using Equations (4) and (5). Under almost all conditions, similar trends were observed, i.e., espacing increased with the hatch spacing, while eheating decreased. Figure 6a shows the total strain calculated by using Equation (3). The largest sum of the plastic strains was obtained at the smallest beam diameter (Table 1). The obtained plastic deformations and deformed sample are presented in Figure 6b,c, respectively. Case d produced the largest plastic deformation, followed by that in case e. Despite the largest plastic deformation, the strains on the spacing between scan tracks, espacing was smaller than that of the sample with the larger hatch spacing presented in Figure 5d. Figure 6a,b show that the large plastic strain did not necessarily produce a large plastic deformation. The larger total plastic strain in Figure 6a might be attributed to the higher temperature on each path and counter bending on the unaffected areas between the scanning paths, although it decreased the total plastic deformation, as shown in Figure 6b. As is already understood, in laser forming based on geometrical and laser beam parameters, three key mechanisms called temperature gradient mechanism (TGM), buckling mechanism (BM) and upsetting mechanism (UM) have been identified [3]. TGM can be activated when the diameter of the laser beam has a size smaller than or equal to that of the sheet thickness, i.e., in the samples with Db = 0.25 and 0.5 mm, in both hs of 1.0 and 0.5 mm. In this mechanism the sheet was bending away from the laser beam during heating, because of the high thermal expansion on the top surface. During cooling, because of the thermal contraction at the top surface, the sheet was bending towards the laser beam. Since in this mechanism the temperature generated by the laser beam is very high in the surface, a quick decay of the temperature occurred. It was assumed that in a higher hatch spacing of hs = 1.0 mm, the previously counter bent area between the scanned paths could not be bent towards the laser beam, due to rapid cooling that was followed by insufficient surface shrinkage, resulting in lower deformations in these samples. While with the decrease in hatch spacing to hs = 0.5 mm, the previously counter bent area between the scanned paths could probably be bent towards the laser beam fairly easily, due to the larger temperature distribution at the top surface and the subsequent shrinkage.
Accounting for the total strains generated in the forming process was not sufficient to predict the deformation behavior [19]. This implied that the temperature variations and microstructures of the bent samples should be also considered.

3.2. Effects of the Temperature and Microstructure

Figure 7 shows the maximum temperatures of the samples obtained by the finite element analysis. Higher temperatures were generally generated at smaller beam diameters. Considering the melting temperature of the alloy (dashed line, 1713 K), these results suggest a correlation between melting and an increase in total strain (Figure 6a).
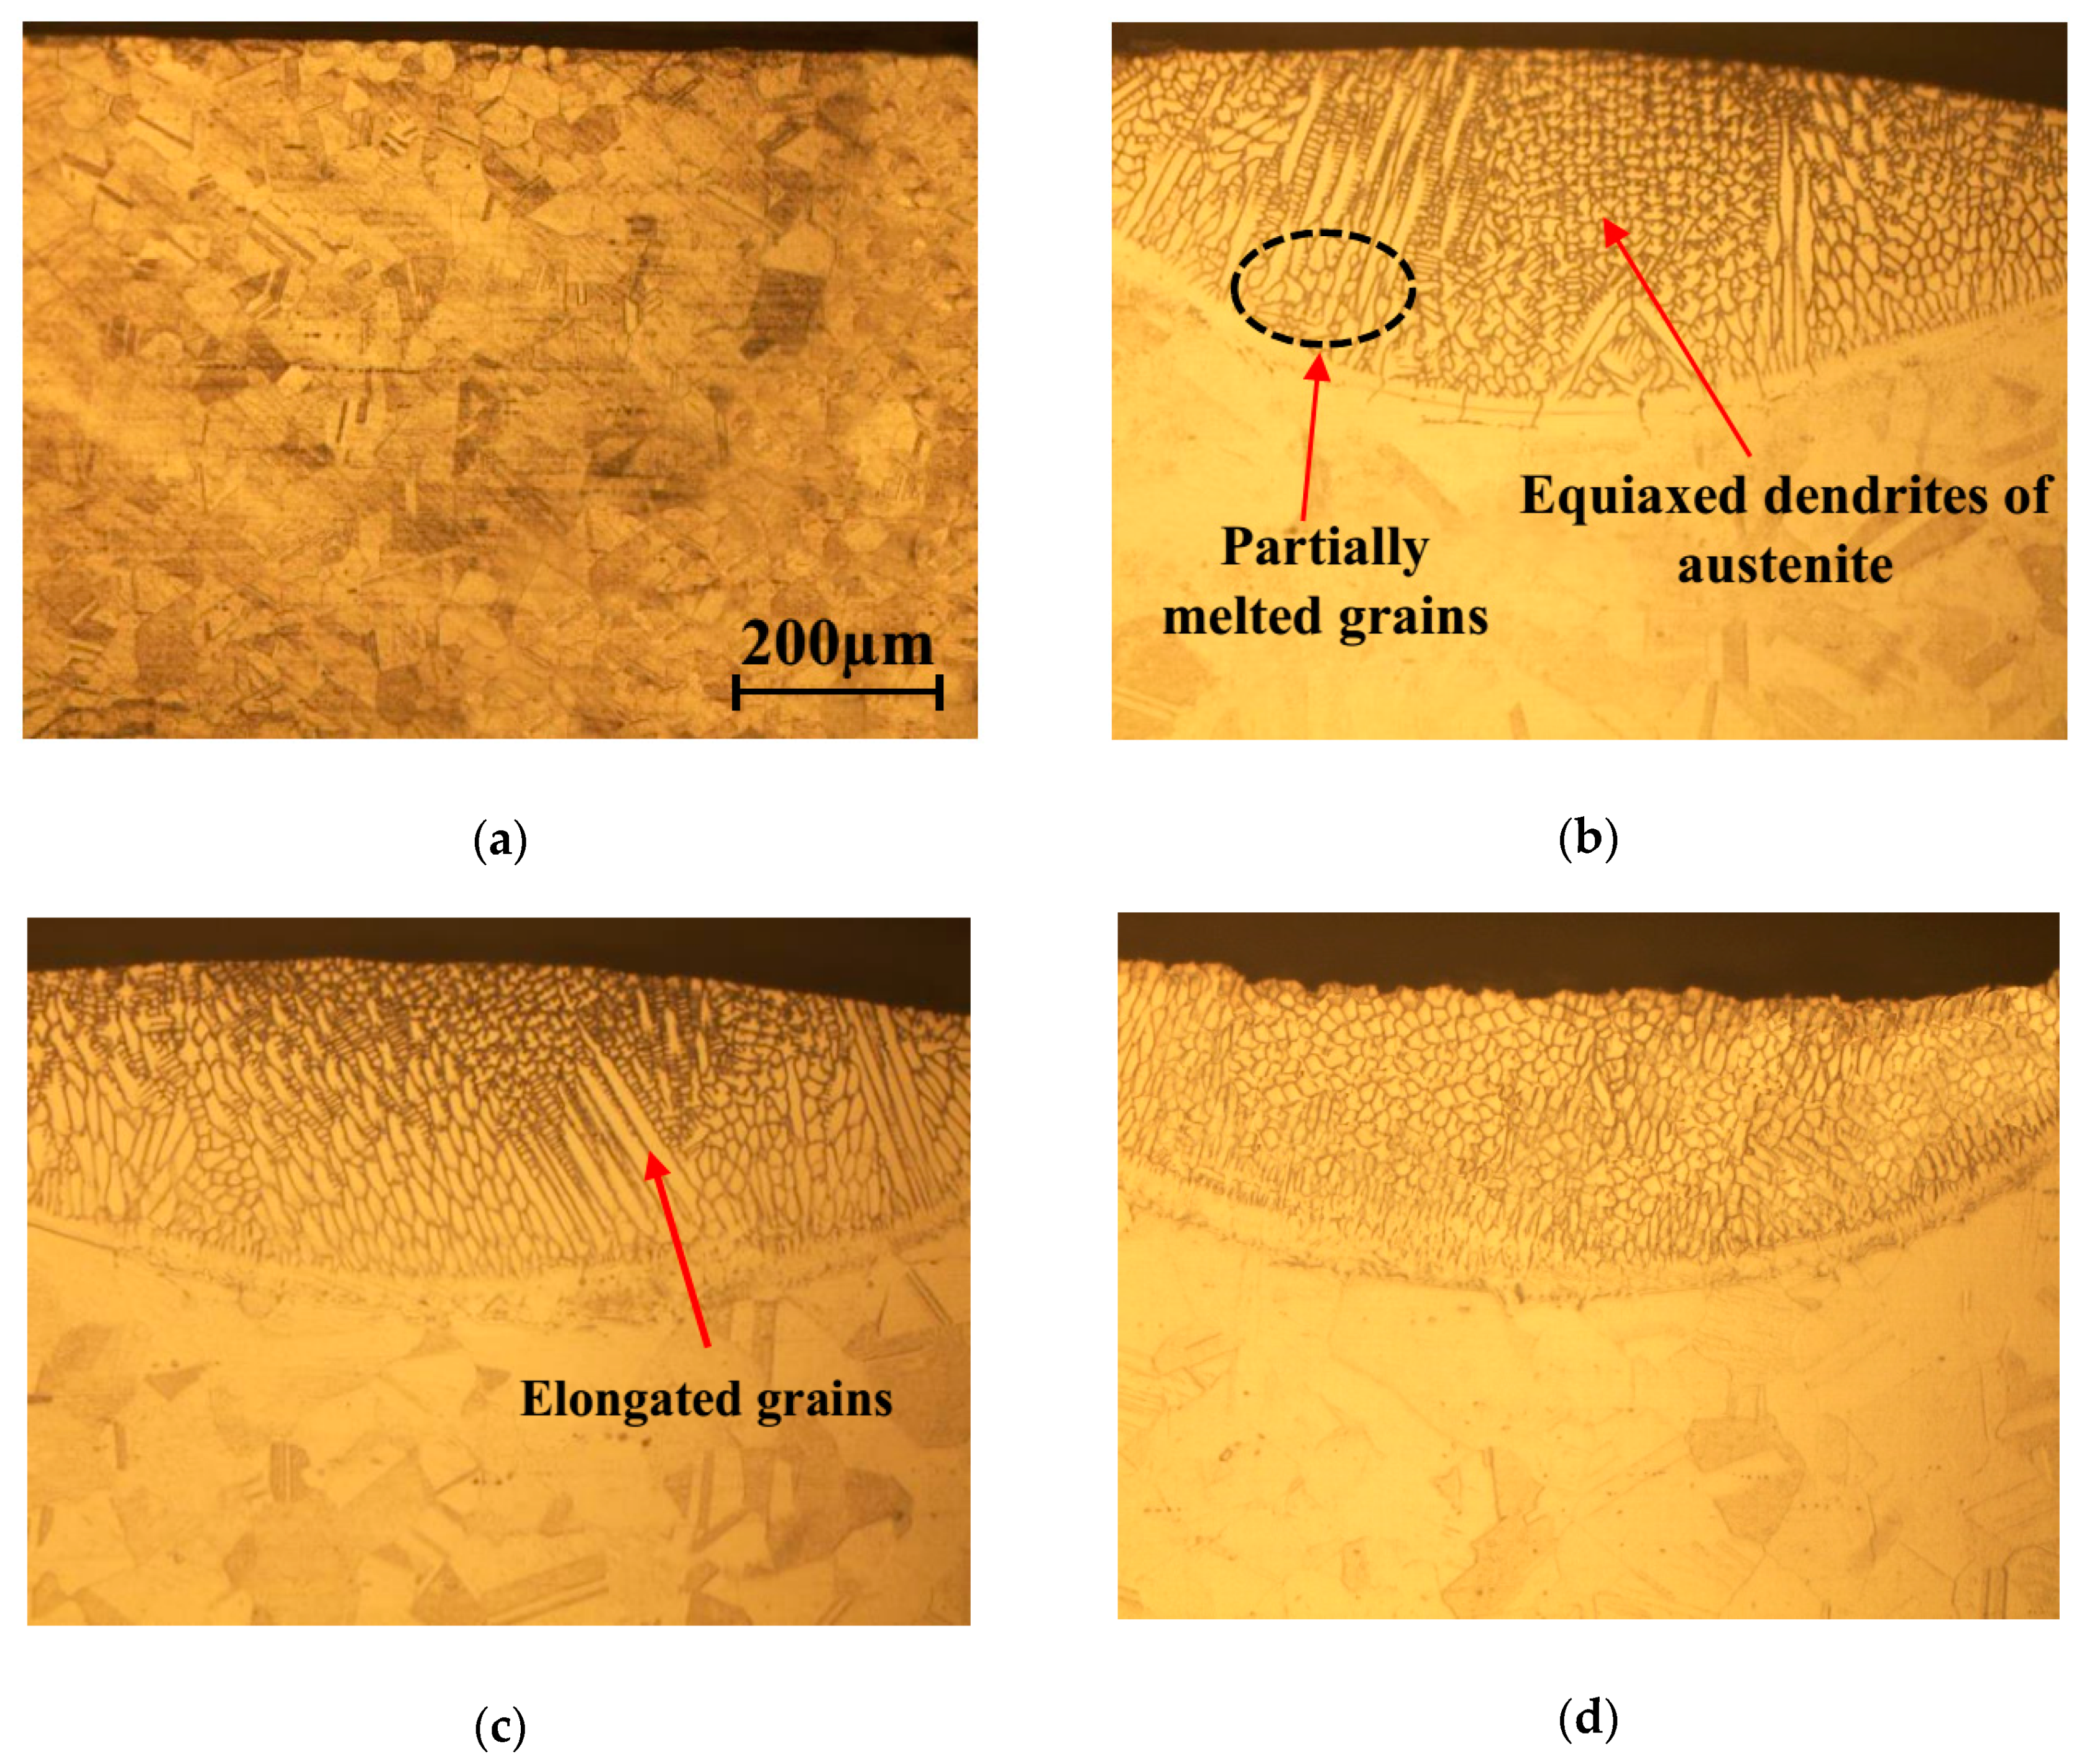
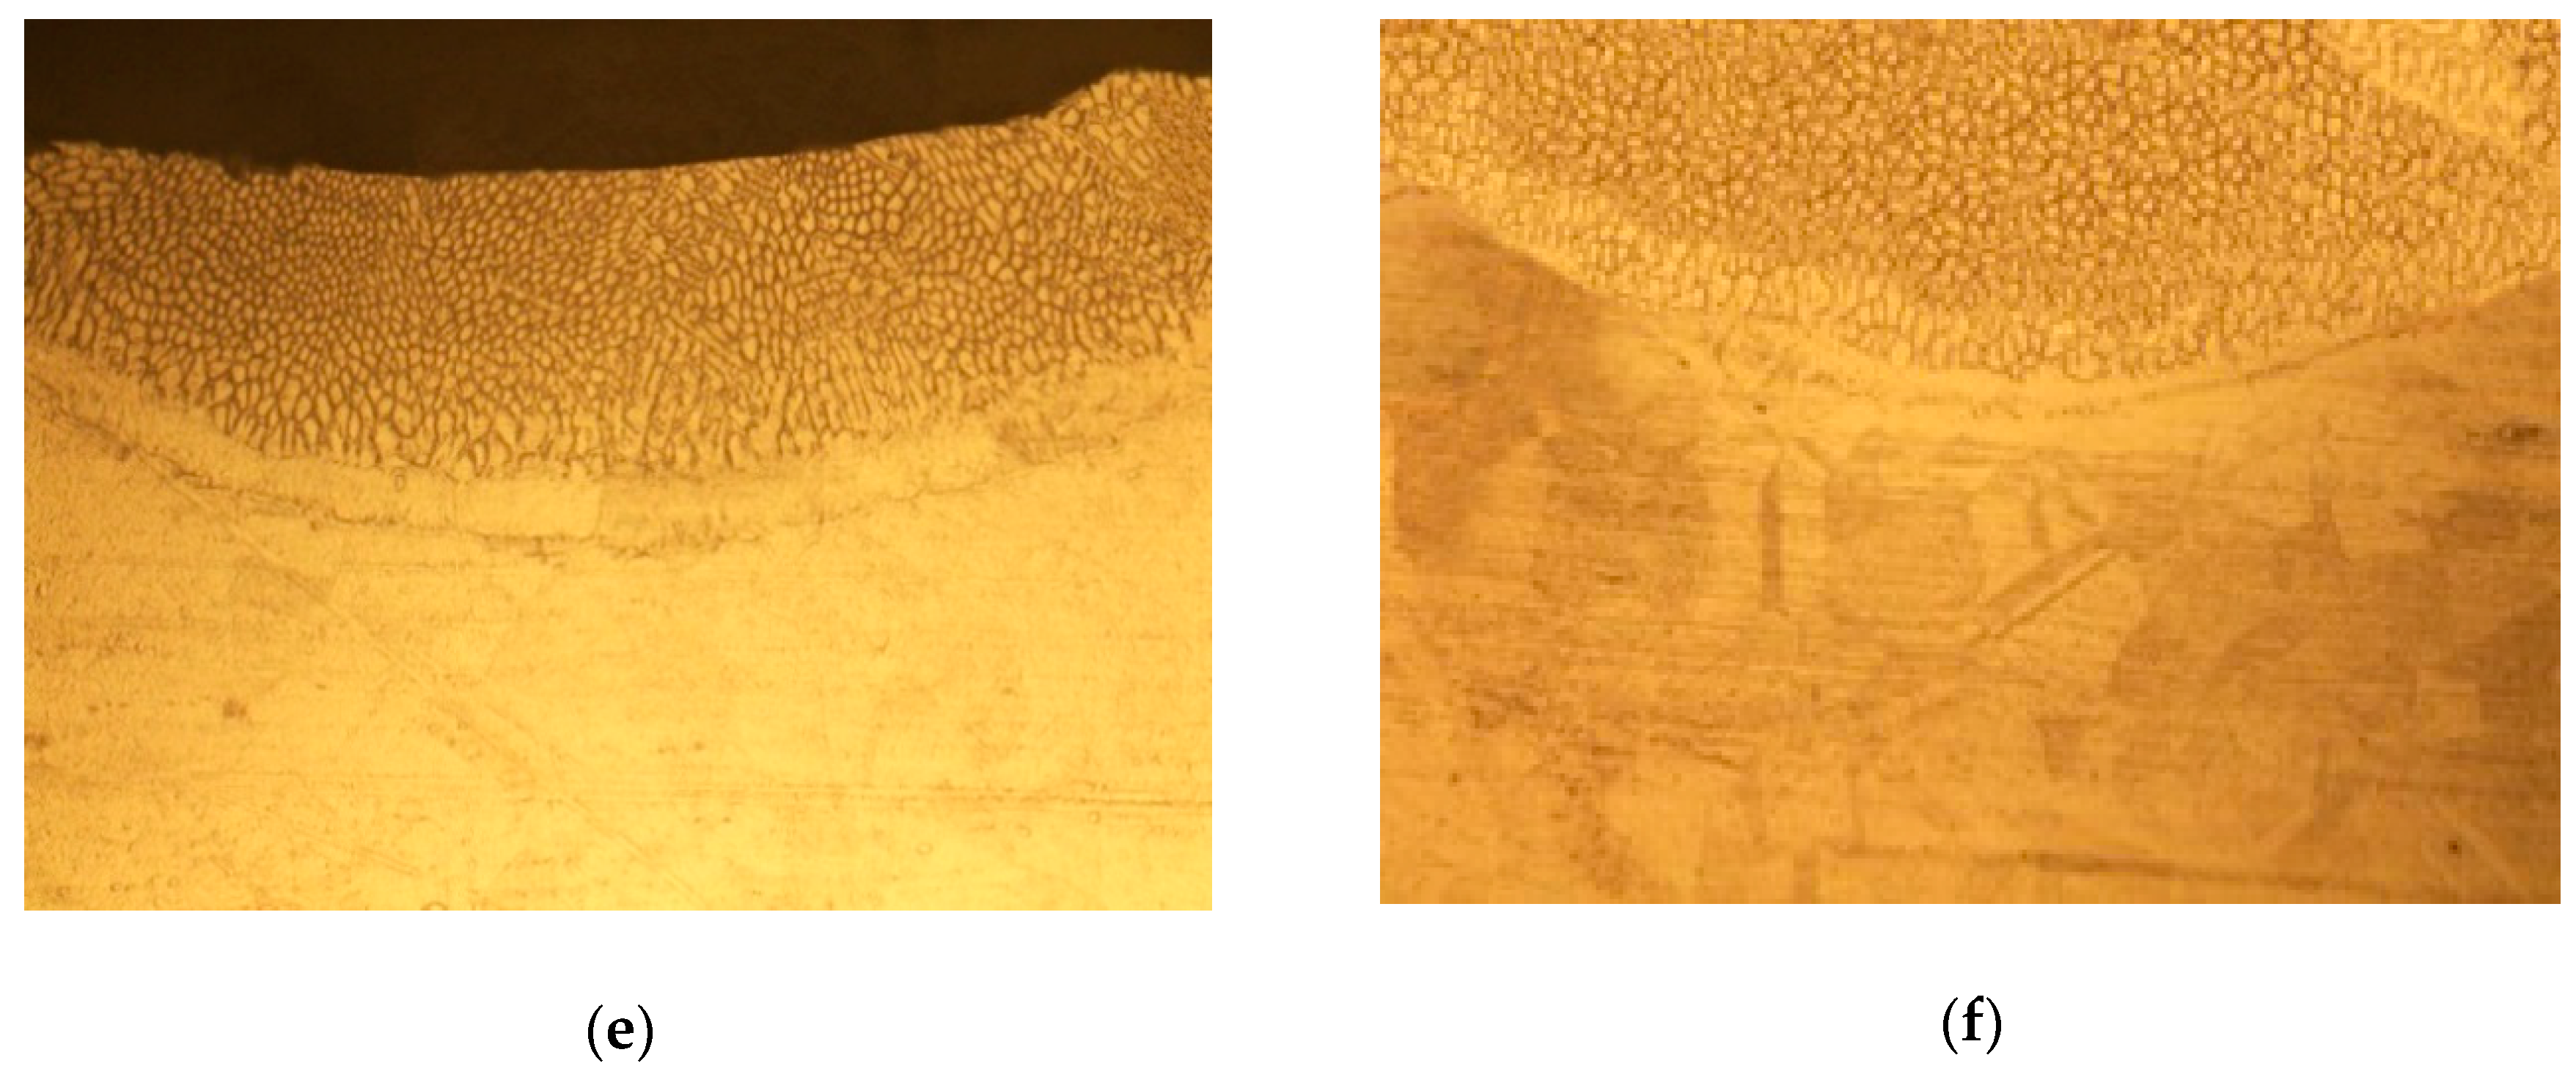
Figure 8a shows the optical microstructure of the parent material, which reveals an austenitic coarse-grain structure. Figure 8b–f show the cross-section micrographs under selected conditions (Table 1).
In the samples processed at small beam diameters of 0.25 and 0.5 mm, the grain structures were deformed inhomogenously, which led to the formation of zones with different grain sizes and orientations, as shown in Figure 8b,c where the maximum temperature was above the melting temperature seen in Figure 7. The typical scanning tracks of these samples created several zones including (i) fusion; (ii) partially affected (partially melted and equiaxed dendritic grains); and (iii) unaffected zones. The non-uniform microstructures in these samples including grains elongated by the melting, partially melted materials consisting of solid grains near the elongated grains, and equiaxed dendrites of austenite are presented in Figure 8b,c. These structures could be attributed to the excess heat input and high cooling rate. In laser forming, the elongated grains could be attributed to the material flow caused by the plastic deformation induced by the heat flux. Meanwhile, there was a grain refinement for the samples that were not affected by melting, as seen in Figure 8d–f.
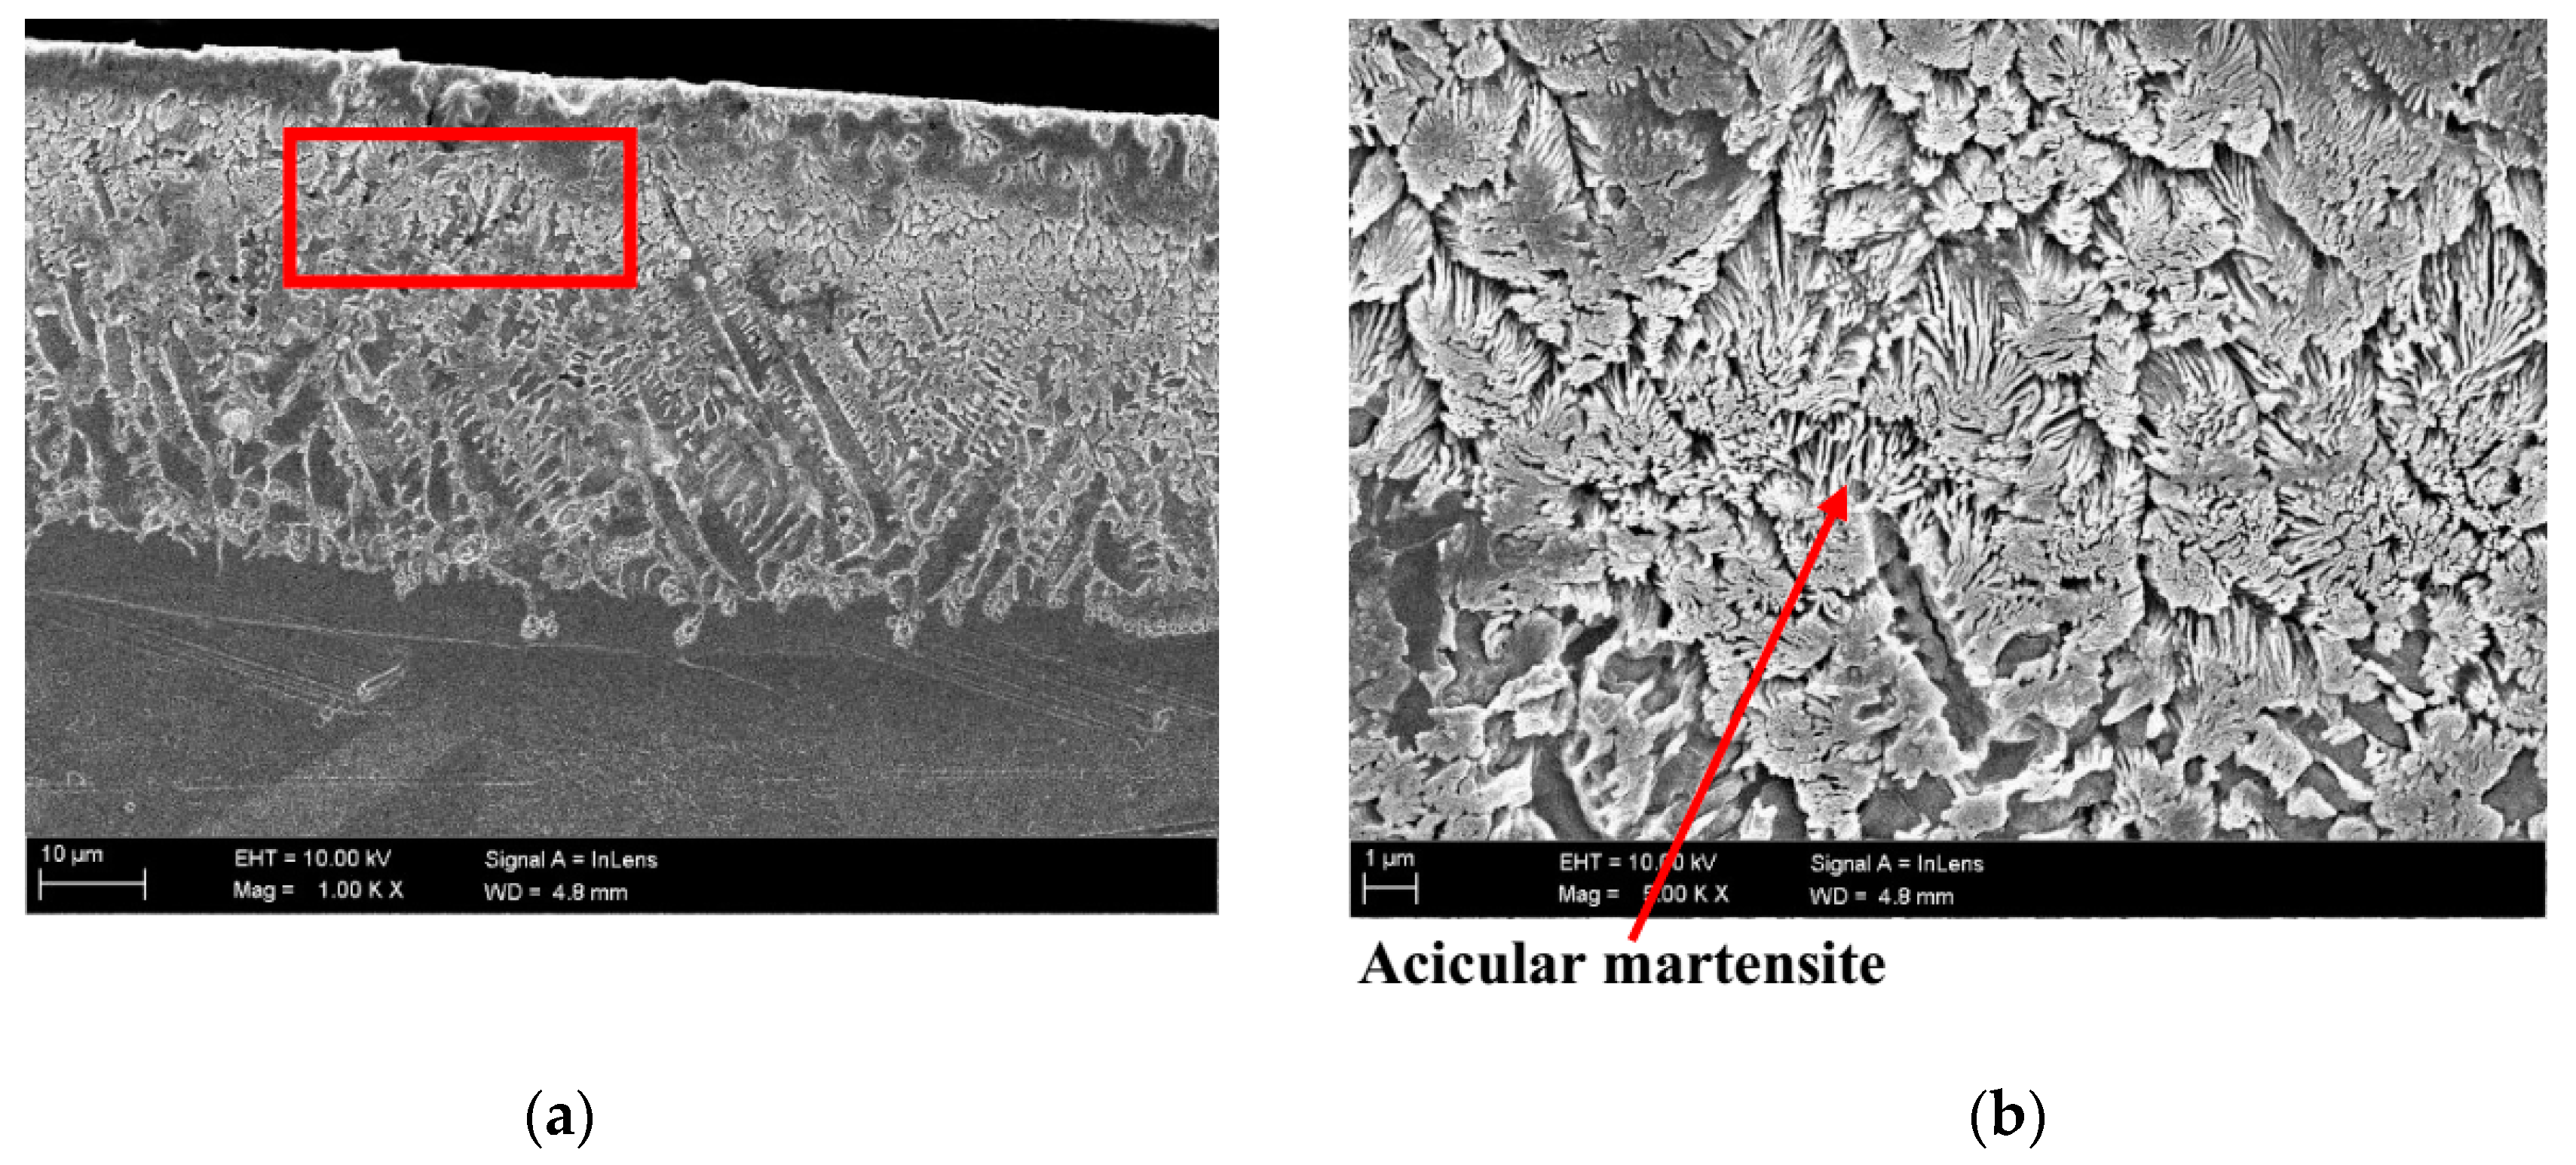
SEM images (Figure 9a–f) were acquired for a microstructural analysis. Upon the heating of the austenitic stainless steel, the face-centered cubic austenite (γ-phase) was the first phase that formed, which then transformed into the body-centered cubic ferrite (δ-phase), upon further heating [20]. The critical stress could contribute to the phase transformation by applying a load, such as the thermal load, during the laser forming process. At high temperatures, where temperature exceeded the upper band of the austenite phase transformation, i.e., 1,422 K, stress induced phase transformation took place, as high cooling rate occurred, resulting in the formation of a stress-induced martensite [21]. However, incomplete quenching could be expected due to a high cooling rate in the top layers. Therefore, the partial martensite phase transformation might have been obtained in the form of acicular martensite.
The analysis of the microstructure near the irradiated surface showed a stress-induced low-tempered martensite in the form of acicular martensite originating from the partial martensite phase transformation in the sample obtained at Db = 0.25 and hs = 1.0 mm, from direct transformation of γ- austenite ➝ ά- martensite through dislocation reactions [21].
Figure 9d shows the δ-ferrite formed around the γ-austenite grains in the sample obtained at Db = 0.5 and hs = 0.5 mm. In practical conditions, the volume change associated with a phase transformation can increase the total strain. The laser affected zone might be governed by the instability at high temperatures during the laser irradiation. The instability would result from the change in density during phase change and the acceleration of the γ/δ interface. As a result, an inertial force was imposed on the transformed material. This inertial force destabilized to the irradiate surface, while during heating, the surface tension exerted a force attempting to maintain a flat surface [22]. This could be a reason for this claim. This can be observed in Figure 6a, from the FEM analysis, which was up to temperature enhancement.
The larger deformations in the samples formed at a hatch spacing of 0.5 mm and beam diameters ≥0.7 mm (Figure 6b) might be attributed to the small equiaxed dendrite grains (Figure 9e,f) instead of the columnar austenite grains observed for the sample obtained at Db = 1.0 and hs = 0.5 mm. This might be attributed to the complete phase transformation, as above 1,422 K and up to the melting point (1,422 K ˂ T ˂ 1,713 K) ferrites form in the alloy [23]. Notably, the increase in formability of the material was proportional to the decrease in grain size of the heated sample [24,25,26]. The homogenized equiaxed fine grains in the microstructure were also associated with a decrease in anisotropy. The decrease in anisotropy in the microstructure with the homogenization increased the work hardening capacity owing to the modified distribution of dislocations and slip systems. Thus, the sheet metal resistance to plastic instability was reduced and the formability was increased.

3.3. Overlap Region

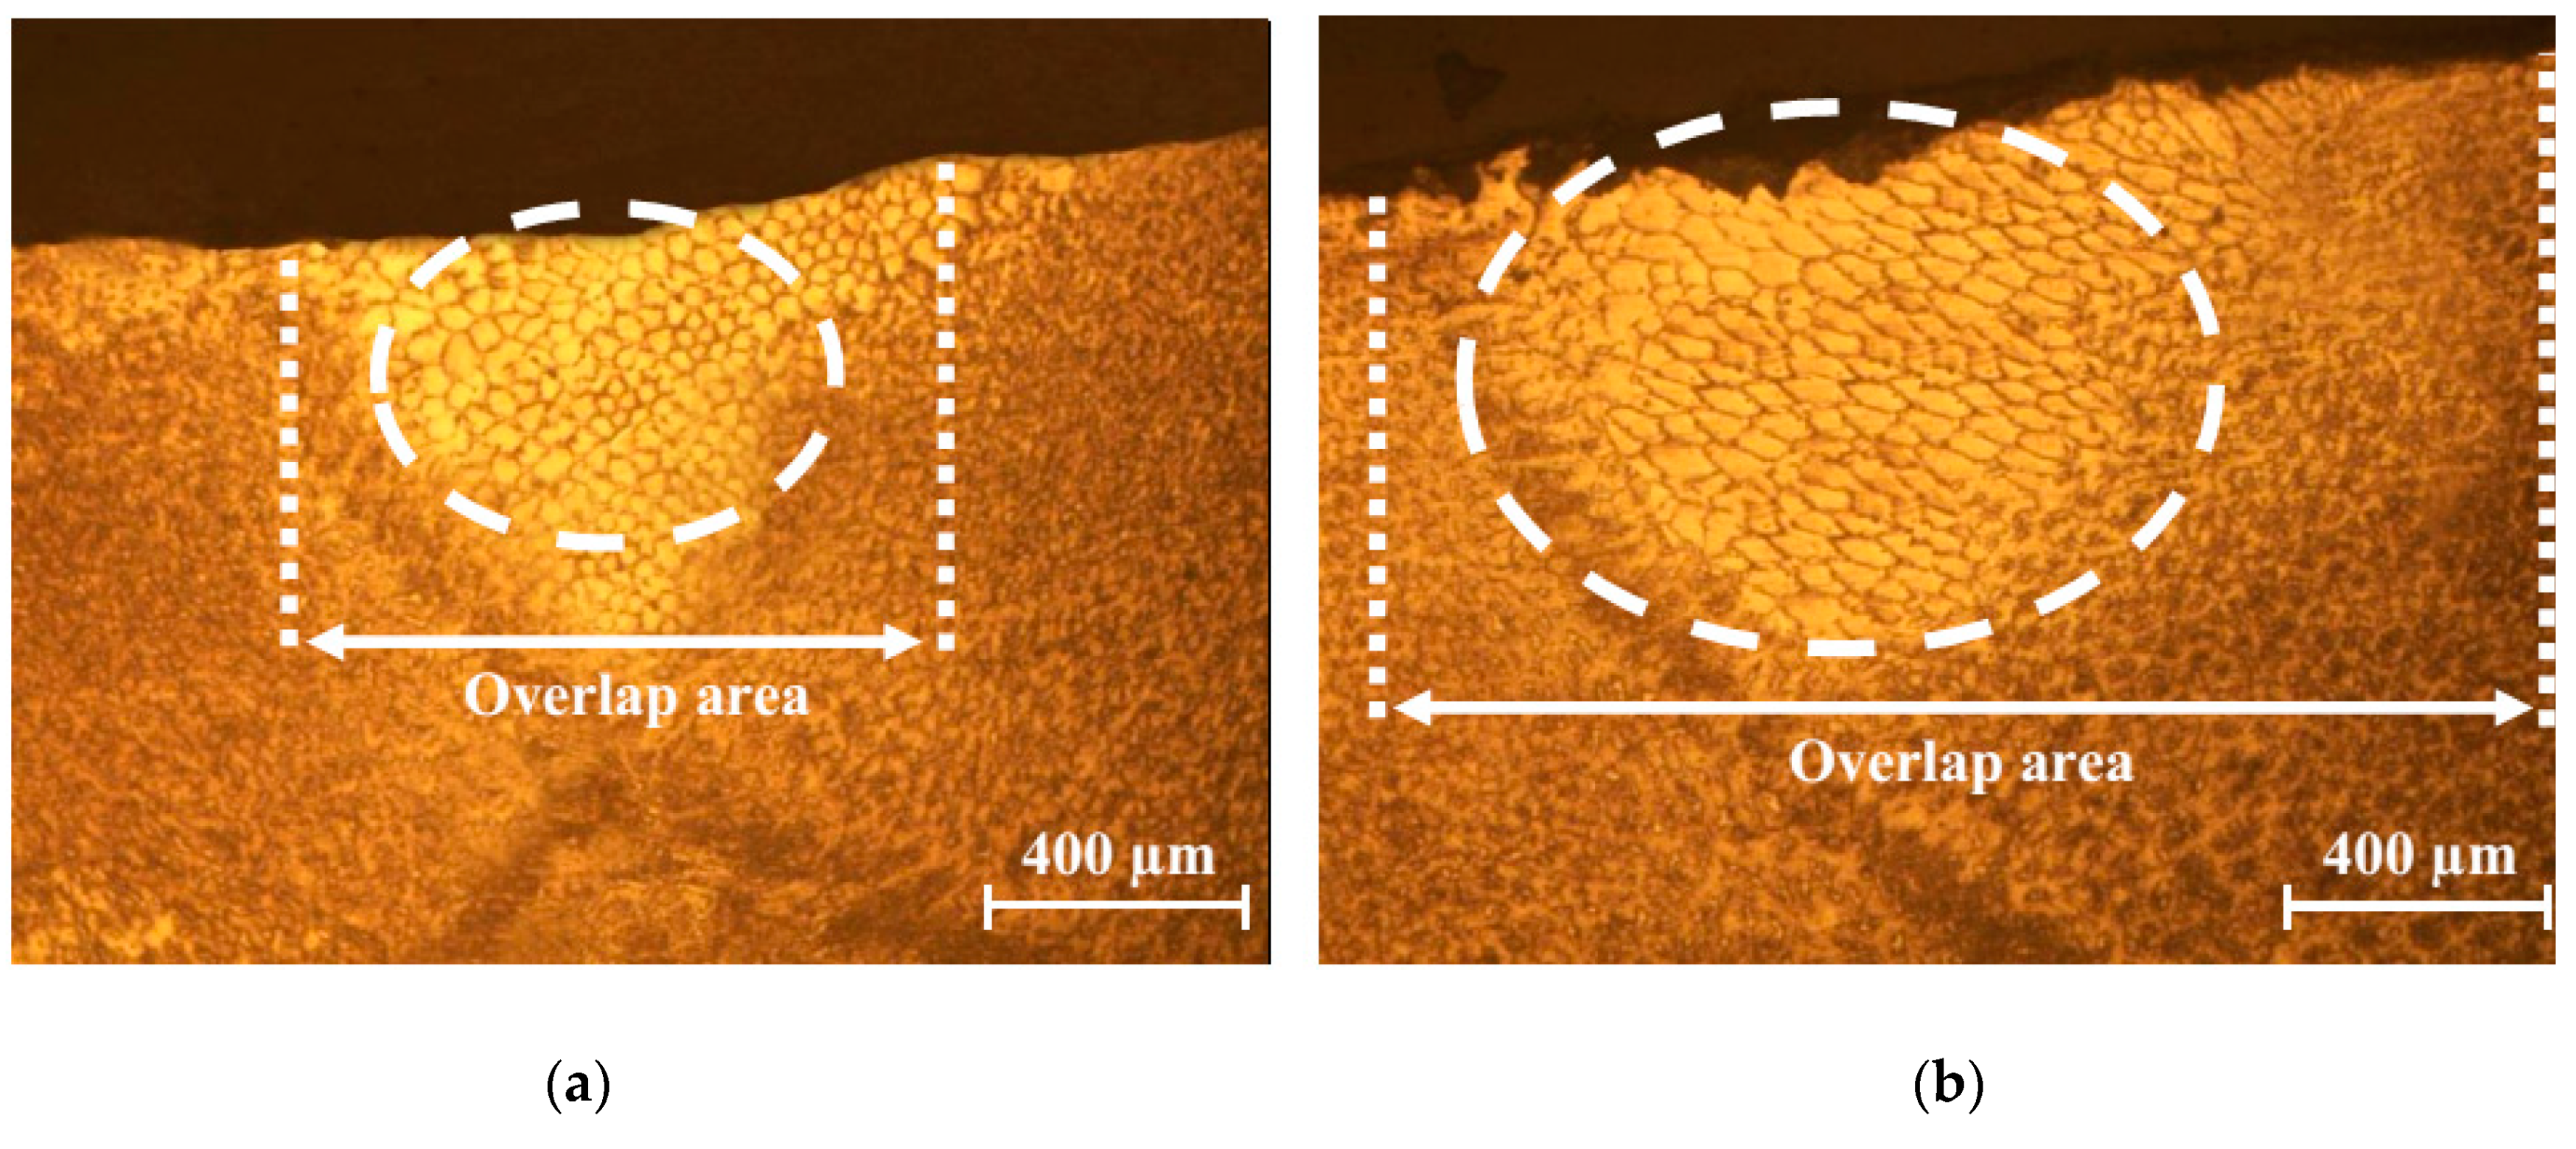
The overlapping of tracks often involves (1) reheated regions of a small portion of the previous track, which might involve phase transformation by tempering within these regions; or (2) remelted regions of a portion of the previous track, which might cause grain orientation changes and non-uniform microstructure within the melt pool, owing to the non-uniform cooling rate [27]. The grain size was slightly increased in the reheated overlap areas of the samples processed with positive overlaps (Figure 2). Owing to the larger overlap ratio, the permanence time of the reheated material within the overlap area was large. The heat generated by the subsequent passes coarsened the fine grains already produced by the former pass. According to the Hall–Petch equation ( σ y = σ i + k / d ), the increased grain size (d) in the overlap area reduced the yield stress (σy), and hence increased the local deformation. According to Figure 10a,b, the fine grains produced in the previous pass appeared to have transformed back into the coarse γ-austenite grains.

3.4. Microhardness

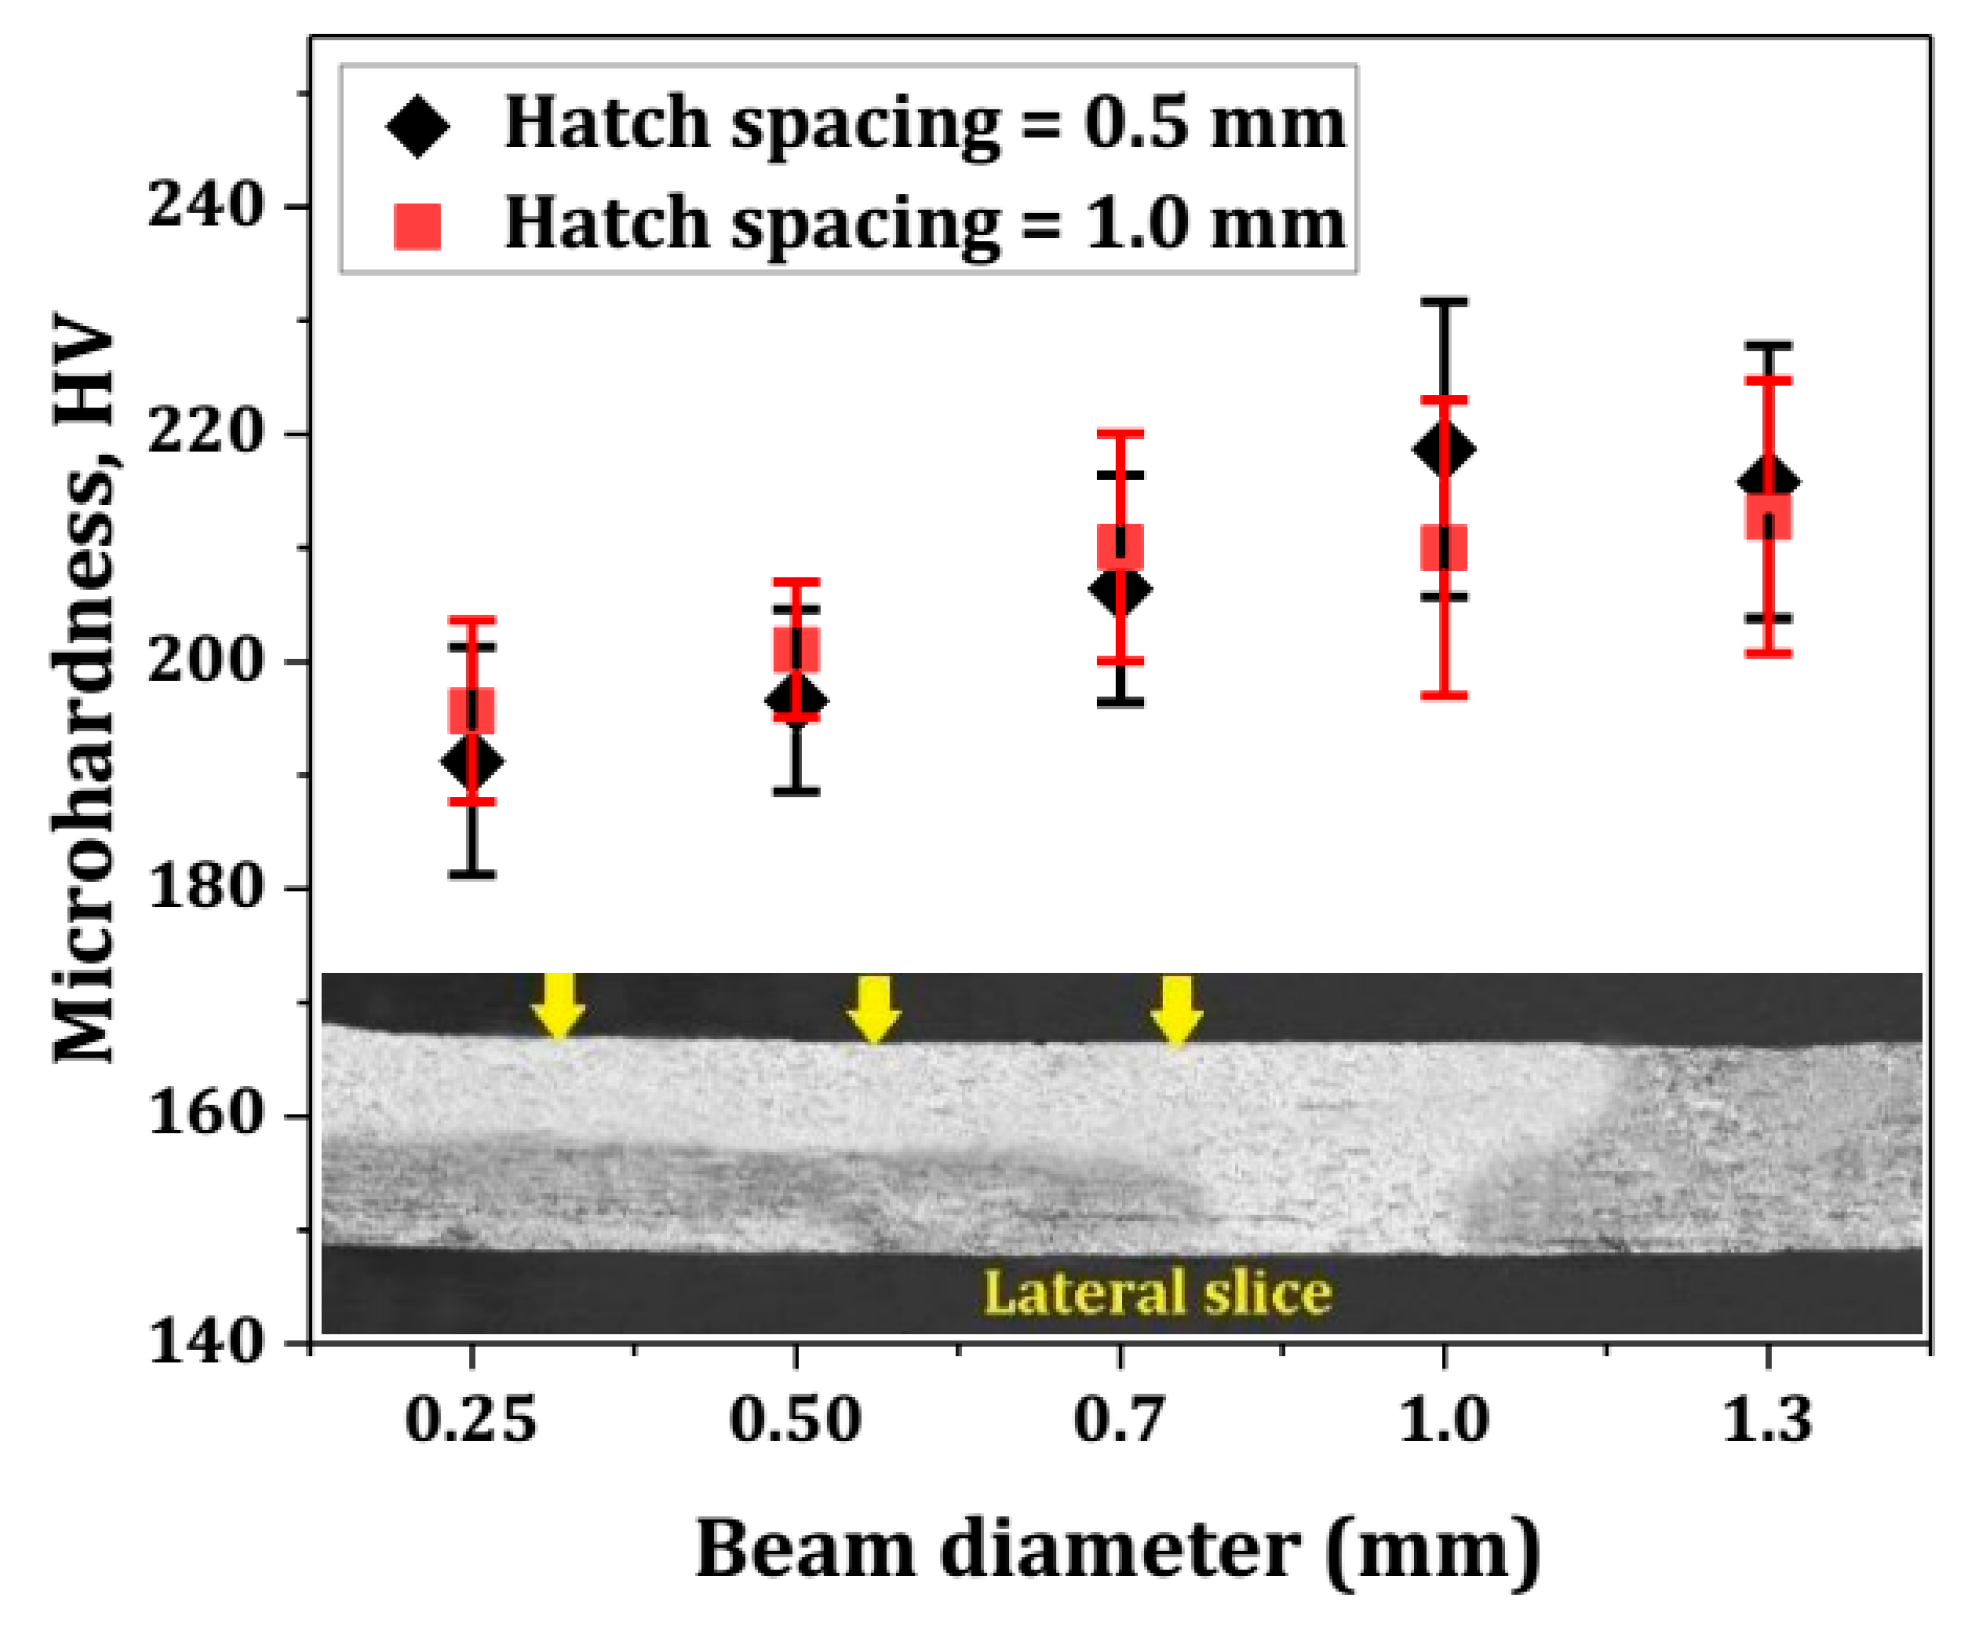
In general, the microstructure affected the hardness of the scanned track. The mean value of Vickers hardness (average of three measurements) at the top surface along the half-length of the lateral slice through the middle pass is shown in Figure 11. An increase in measured hardness was observed with the decrease in hatch spacing and increase in beam diameter. All samples exhibited hardnesses comparable to the initial hardness of AISI 316 (147.6 HV0.1). During the plastic deformation, the dislocation movement turns into dislocation accumulation when the grain boundaries act as obstacles against the dislocation flow [24]. Consequently, the stress concentration and strength of the material at the grain boundaries are increased. When the beam diameter was increased to 1.0 and 1.3, the microstructures of the heat-affected areas of the scanned tracks included equiaxed fine grains (Figure 8e,f). The microstructural results showed the larger numbers of grain boundaries in the above samples. This implied that small spherical grains were replaced with inhomogeneous austenite grains. The grain boundary strengthening effect contributed to an increase in the microhardness at the scanned track, owing to the reduction in grain size and increase in the number of grain boundaries. The relation between the hardness and the number of grain boundaries could be expressed by using the Hall–Petch equation [28].
h = h 0 + k d ,
where h is the hardness of the material, h0 and k are the material strengthening constants, and d is the grain size, which is inversely proportional to the number of grain boundaries.
The larger hardnesses of the samples obtained at Db = 0.7, 1.0, and 1.3 mm (hs = 0.5 mm) (approximately 209, 218, and 215 HV, respectively) could be attributed to the larger strain hardening induced by the bending strain (Figure 6b). The analysis at the hatch spacing of 1.0 mm showed that the smaller deformation was not strictly associated with the decrease in hardness. Notably, increases were observed at the smaller beam diameters of 0.25, 0.5, and 0.7 mm. Therefore, the cooling rates of the simulated models were analyzed through the following equations.
The thermal gradient (G) and solidification rate (R) were the fundamental parameters determining the cooling rate (C), which could be calculated by [29]
G = ( T x ) 2 + ( T y ) 2 + ( y z ) 2 ,
R = v cos(α),
C = GR,
where T x , T y , and T z   are the temperature gradients along the x, y, and z directions, respectively, v is the laser scan speed, and α is the angle between the scan and growth directions of the grains. For the top surface and cross section, cos(α) in a specific direction (x, y, or z) could be expressed by [29]
cos ( α ) i = T i G ,
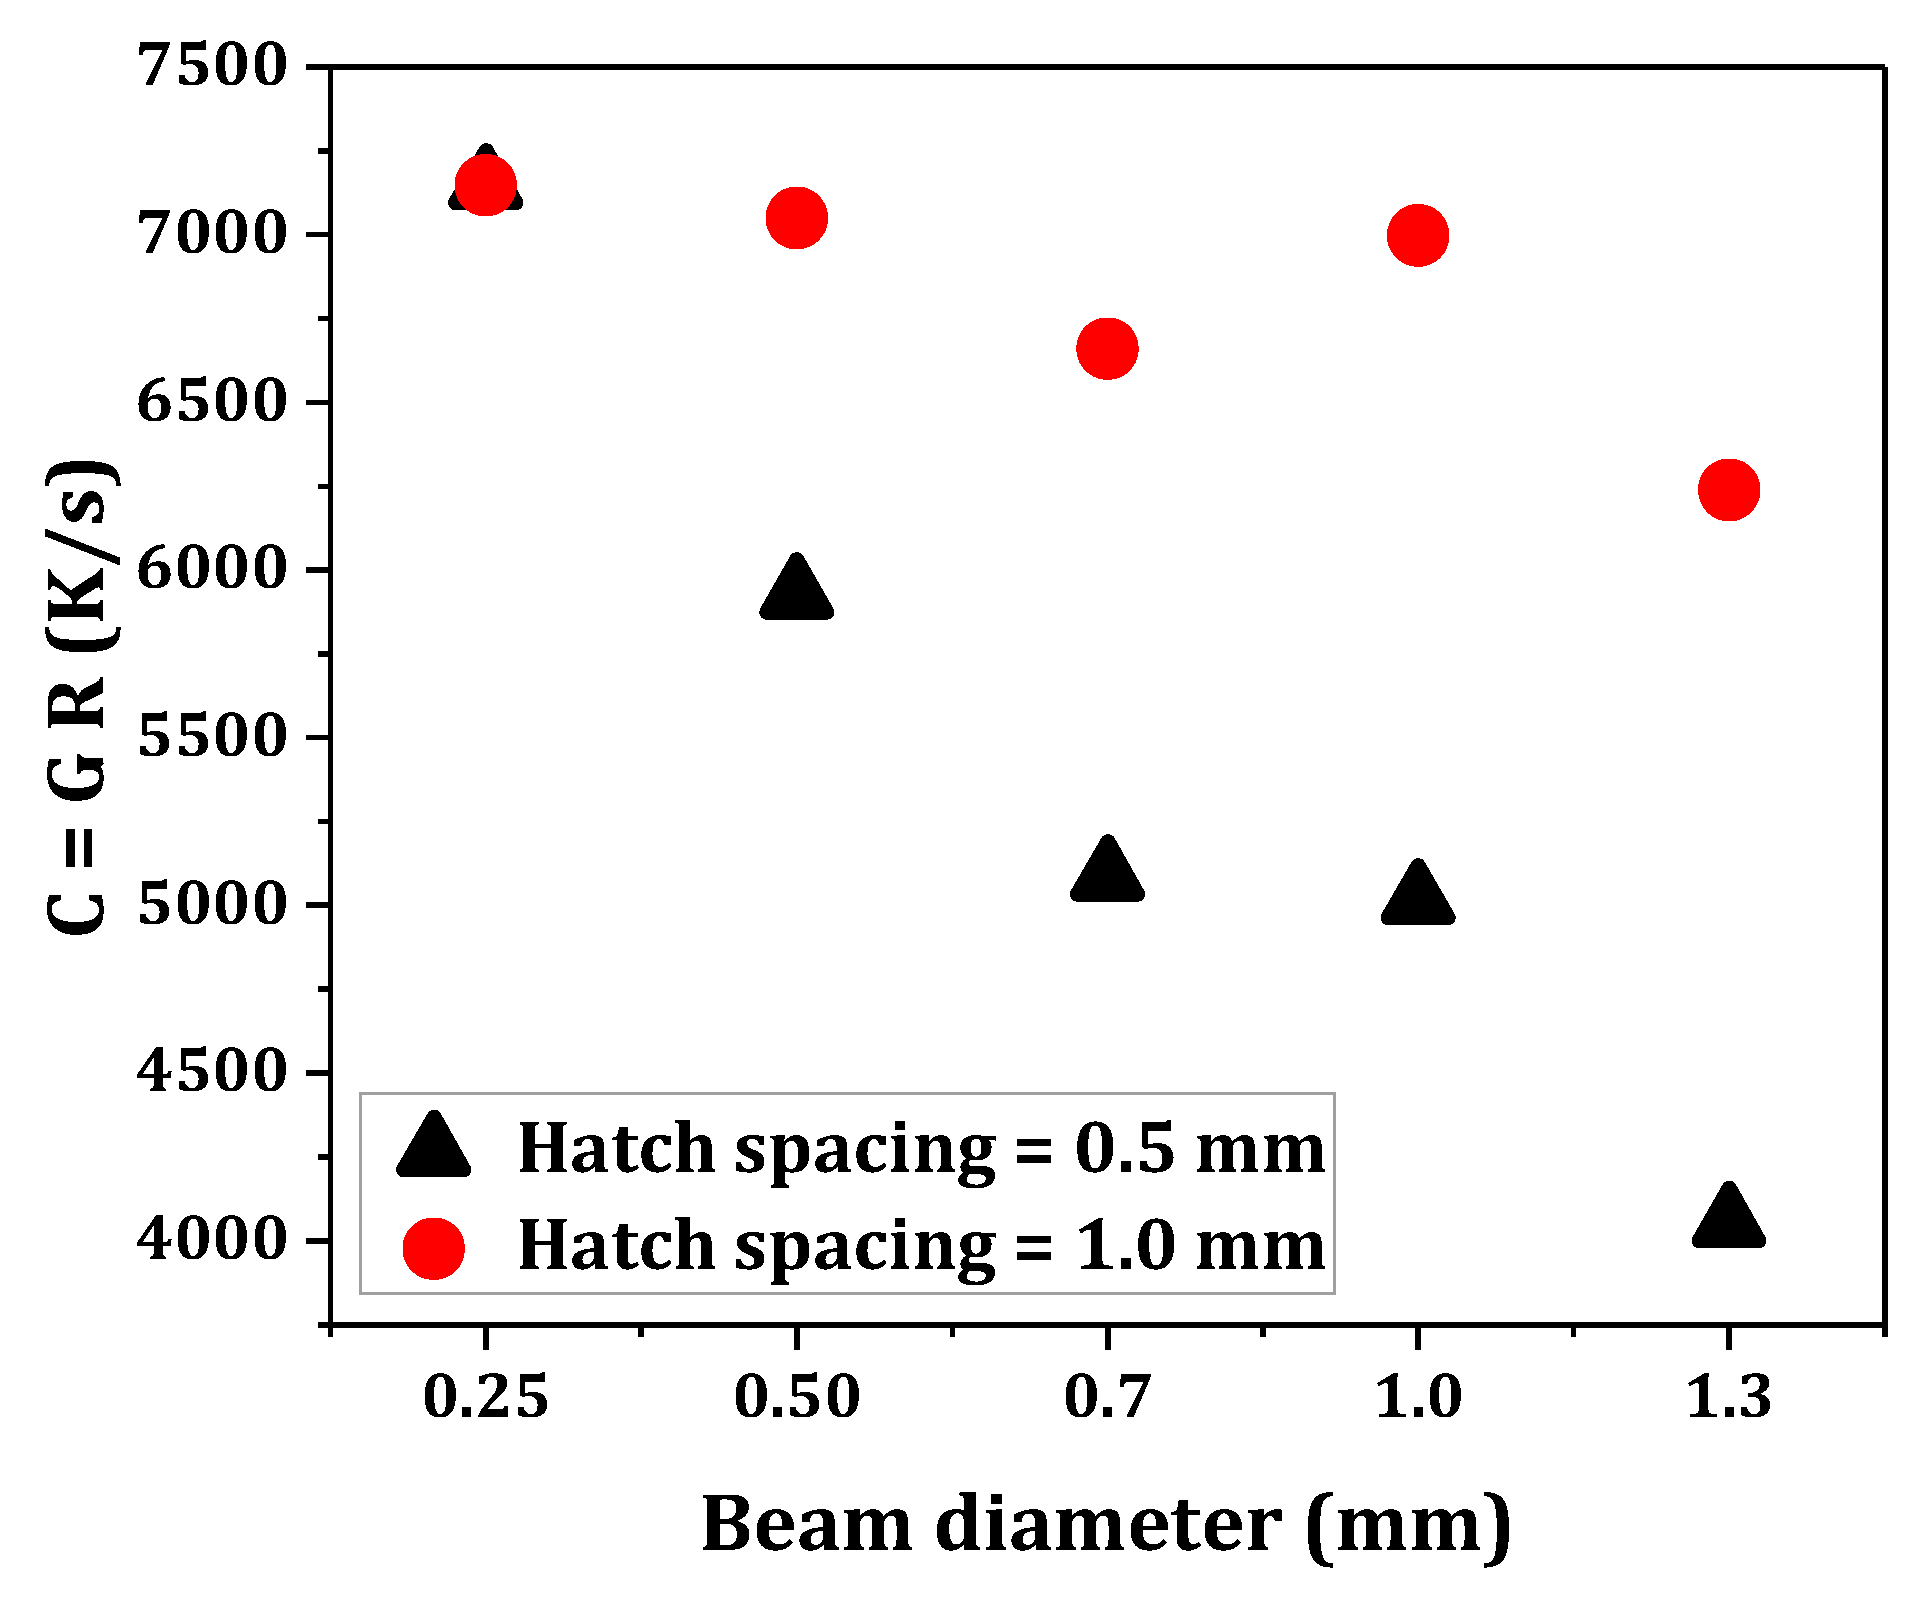
where i is the specific direction (x, y, or z). The obtained cooling rate is shown in Figure 12. For the solidification rate, the mean value (Ravg) of the three directions was calculated.
When the beam diameter was in the range of 0.25–1.0 mm, the cooling rate was in the range of approximately 6,660 up to the maximum of 7,147 for the sample with a hatch spacing of 1.0 mm. The equiaxed dendrites of the austenite around the center of the track could be formed upon rapid cooling at the heated surface (nucleation of small grains in Figure 8b,c), which led to a slightly higher microhardness (Figure 11) [30,31].

4. Conclusions

The effects of the beam diameter and hatch spacing on the bendability and microstructural behavior of the AISI 316 stainless-steel sheet were investigated. The conclusions of this study could be summarized as follows.
(1).
At a constant beam diameter, with an increase in hatch spacing, the strain on the spacing between the scan tracks increased, while the strain on the heating line decreased. The increase in strain of the spacing between the scan tracks was responsible for the lower bendability of the material, which demonstrated the counter bending between the scan paths.
(2).
The total plastic strain increased with a decrease in beam diameter and increase in hatch spacing. This was attributed to the increase in temperature and implied a correlation between the melting and an increase in the total strain.
(3).
When the beam diameter was increased and the hatch spacing was decreased, the formation of the small equiaxed dendrite grains instead of coarse and inhomogeneous austenite grains increased the bendability of the material. This could be attributed to the decrease in anisotropy in the microstructure, which increased the work hardening capacity.
(4).
The grain sizes were increased in the reheated overlap regions of the samples. The reduction in the yield stress of the material in the overlap region owing to the grain growth led to a larger deformation.
(5).
The grain boundary strengthening effect with the larger strain hardening of the material were responsible for the increase in microhardness with an increase in beam diameter and decrease in hatch spacing. However, at the small beam diameter and large hatch spacing, the increase in the cooling rate was responsible for the microhardness improvement.

Author Contributions

Formal analysis, D.A.; Investigation, D.A.; Methodology, M.H.G.; Project administration, S.M.H.S.; and Supervision, Y.H.M.

Funding

This research was funded by the National Research Foundation of Korea, grant-funded by the Korean government (no. 2012R1A5A1048294).

Conflicts of Interest

The authors declare no conflict of interest.

References

  1. Chen, J.Y.; Conlon, K.; Xue, L.; Rogge, R. Experimental study of residual stresses in laser clad AISI P20 tool steel on pre-hardened wrought P20 substrate. Mater. Sci. Eng. A 2010, 527, 7265–7273. [Google Scholar] [CrossRef] [Green Version]
  2. Woo, Y.Y.; Hwang, T.; Oh, I.; Seo, D.; Moon, Y.H. Analysis on selective laser melting of WC-reinforced H13 steel composite powder by finite element method. Adv. Mech. Eng. 2019, 11, 1687814018822200. [Google Scholar] [CrossRef]
  3. Seyedkashi, S.M.H.; Abazari, H.D.; Hoseinpour Gollo, M.; Woo, Y.Y.; Moon, Y.H. Characterization of laser bending of SUS304/C11000clad sheets. J. Mech. Sci. Technol. 2019, 33, 3223–3230. [Google Scholar] [CrossRef]
  4. Imhan, K.I.; Baharudin, B.T.H.T.; Zakaria, A.; Shah, B.; Ismail, M.I.; Alsabti, N.M.H.; Ahmad, A.K. Investigation of material specifications changes during laser tube bending and its influence on the modification and optimization of analytical modeling. Opt. Laser Technol. 2017, 95, 151–156. [Google Scholar] [CrossRef]
  5. Hwang, T.; Woo, Y.Y.; Han, S.W.; Moon, Y.H. Functionally graded properties in directed-energy-deposition titanium parts. Opt. Laser Technol. 2018, 105, 80–88. [Google Scholar] [CrossRef]
  6. Seyedkashi, S.H.; Hosseinpour Gollo, M.; Biao, J.; Moon, Y.H. Laser bendability of SUS430/C11000/SUS430 laminated composite and its constituent layers. Met. Mater. Int. 2016, 22, 527–534. [Google Scholar] [CrossRef]
  7. Yang, L.; Tang, J.; Wang, M.; Wang, Y.; Chen, Y. Surface characteristic of stainless steel sheet after pulsed laser forming. Appl. Surf. Sci. 2010, 256, 7018–7026. [Google Scholar] [CrossRef]
  8. Zhang, X.R.; Xu, X. High precision microscale bending by pulsed and CW lasers. J. Manuf. Sci. Eng. 2003, 125, 512–518. [Google Scholar] [CrossRef]
  9. Birnbaum, A.J.; Yao, Y.L. The effects of laser forming on NiTi superelastic shape memory alloys. J. Manuf. Sci. Eng. 2010, 132, 041002. [Google Scholar] [CrossRef]
  10. Abazari, H.D.; Seyedkashi, S.M.H.; Hosseinpour Gollo, M.; Moon, Y.H. Evolution of microstructure and mechanical properties of SUS430/C11000/SUS430 composites during the laser-forming process. Met. Mater. Int. 2017, 23, 865–876. [Google Scholar] [CrossRef]
  11. Seyedkashi, S.H.; Cho, J.; Lee, S.; Moon, Y.H. Feasibility of underwater laser forming of laminated metal composites. Mater. Manuf. Process. 2018, 33, 546–551. [Google Scholar] [CrossRef]
  12. Abolhasani, D.; Seyedkashi, S.M.H.; Kim, Y.T.; Hoseinpour Gollo, M.; Moon, Y.H. A double raster laser scanning strategy for rapid die-less bending of 3D shape. J. Mater. Res. Technol. 2019, 8, 4741–4756. [Google Scholar] [CrossRef]
  13. Joo, B.D.; Jang, J.H.; Lee, J.H.; Son, Y.M.; Moon, Y.H. Selective laser melting of Fe-Ni-Cr layer on AISI H13 tool steel. Trans. Nonferr. Met. Soc. China 2009, 19, 921–924. [Google Scholar] [CrossRef]
  14. Abolhasani, D.; Seyedkashi, S.M.H.; Kang, N.; Kim, Y.J.; Woo, Y.Y.; Moon, Y.H. Analysis of melt-pool behaviors during selective laser melting of AISI 304 stainless-steel composites. Metals 2019, 9, 876. [Google Scholar] [CrossRef]
  15. Davis, J.R.; Mills, K.M.; Lampman, S.R. Properties and Selection: Irons, Steels, and High Performance Alloys; Metals Handbook; ASM: Materials Park, OH, USA, 2005. [Google Scholar]
  16. Moon, Y.H.; Kim, D.W.; Van Tyne, C.J. Analytical model for prediction of sidewall curl during stretch-bend sheet metal forming. Int. J. Mech. Sci. 2008, 50, 666–675. [Google Scholar] [CrossRef]
  17. Jeon, C.H.; Han, S.W.; Joo, B.D.; Van Tyne, C.J.; Moon, Y.H. Deformation analysis for cold rolling of Al-Cu double layered sheet by the physical modeling and finite element method. Met. Mater. Int. 2013, 19, 1069–1076. [Google Scholar] [CrossRef]
  18. Cheng, J.; Yao, Y.L. Process design of laser forming for three-dimensional thin plates. J. Manuf. Sci. Eng. 2004, 126, 217–225. [Google Scholar] [CrossRef]
  19. Kim, S.Y.; Joo, B.D.; Shin, S.; Van Tyne, C.J.; Moon, Y.H. Discrete layer hydroforming of three-layered tubes. Int. J. Mach. Tool Manuf. 2013, 68, 56–62. [Google Scholar] [CrossRef]
  20. Park, J.Y.; Oh, I.Y.; Van Tyne, C.J.; Moon, Y.H. Characterization of deformation processing maps of 304L stainless steel based on compressive and tensile flow curves. Proc. Inst. Mech. Eng. 2018, 233, 203–210. [Google Scholar] [CrossRef]
  21. Solomon, N.; Solomon, I. Deformation induced martensite in AISI 316 stainless steel. Rev. Metal. 2010, 46, 121–128. [Google Scholar] [CrossRef]
  22. Shen, N.; Ding, H.; Wang, Q.; Ding, H. Effect of confinement on surface modification for laser peen forming without protective coating. Surf. Coat. Tech. 2016, 289, 194–205. [Google Scholar] [CrossRef] [Green Version]
  23. Walczak, M.; Ramos-Grez, J.; Celentano, D.; Lima, E. Sensitization of AISI 302 stainless steel during low-power laser forming. Opt. Laser Eng. 2010, 48, 906–914. [Google Scholar] [CrossRef]
  24. Abolhasani, D.; Ezatpour, H.R.; Sajjadi, S.A.; Abolhasani, Q. Microstructure and mechanical properties evolution of 6061 aluminum alloy formed by forward thixoextrusion process. Mater. Des. 2013, 49, 784–790. [Google Scholar] [CrossRef]
  25. Jang, J.H.; Lee, J.H.; Joo, B.D.; Moon, Y.H. Flow characteristics of aluminum coated boron steel in hot press forming. Trans. Nonferr. Met. Soc. China 2009, 19, 913–916. [Google Scholar] [CrossRef]
  26. Everhart, W.; Newkirk, J. Grain Size Effects in Selective Laser Melted Fe-Co-2V. Appl. Sci. 2019, 9, 3701. [Google Scholar] [CrossRef]
  27. Abolhasani, D.; Seyedkashi, S.M.H.; Hwang, T.W.; Moon, Y.H. Selective laser melting of AISI 304 stainless steel composites reinforced by Al2O3 and eutectic mixture of Al2O3–ZrO2 powders. Mater. Sci. Eng. A 2019, 763, 138161. [Google Scholar] [CrossRef]
  28. Dieter, G.E.; Bacon, D.J. Mechanical Metallurgy; McGraw-hill: New York, NY, USA, 1986. [Google Scholar]
  29. Blecher, J.; Palmer, T.; DebRoy, T. Solidification map of a nickel-base alloy. Metall. Mater. Trans. 2014, 45, 2142–2151. [Google Scholar] [CrossRef]
  30. Park, Z.S.; Kim, J.; Woo, Y.Y.; Lee, H.; Kim, J.H.; Moon, Y.H. Forced circulation of nitrogen gas for accelerated and eco-friendly cooling of metallic parts. Appl. Sci. 2019, 9, 3679. [Google Scholar] [CrossRef]
  31. Jang, J.H.; Joo, B.D.; Van Tyne, C.J.; Moon, Y.H. Characterization of deposited layer fabricated by direct laser melting process. Met. Mater. Int. 2013, 19, 497–506. [Google Scholar] [CrossRef]
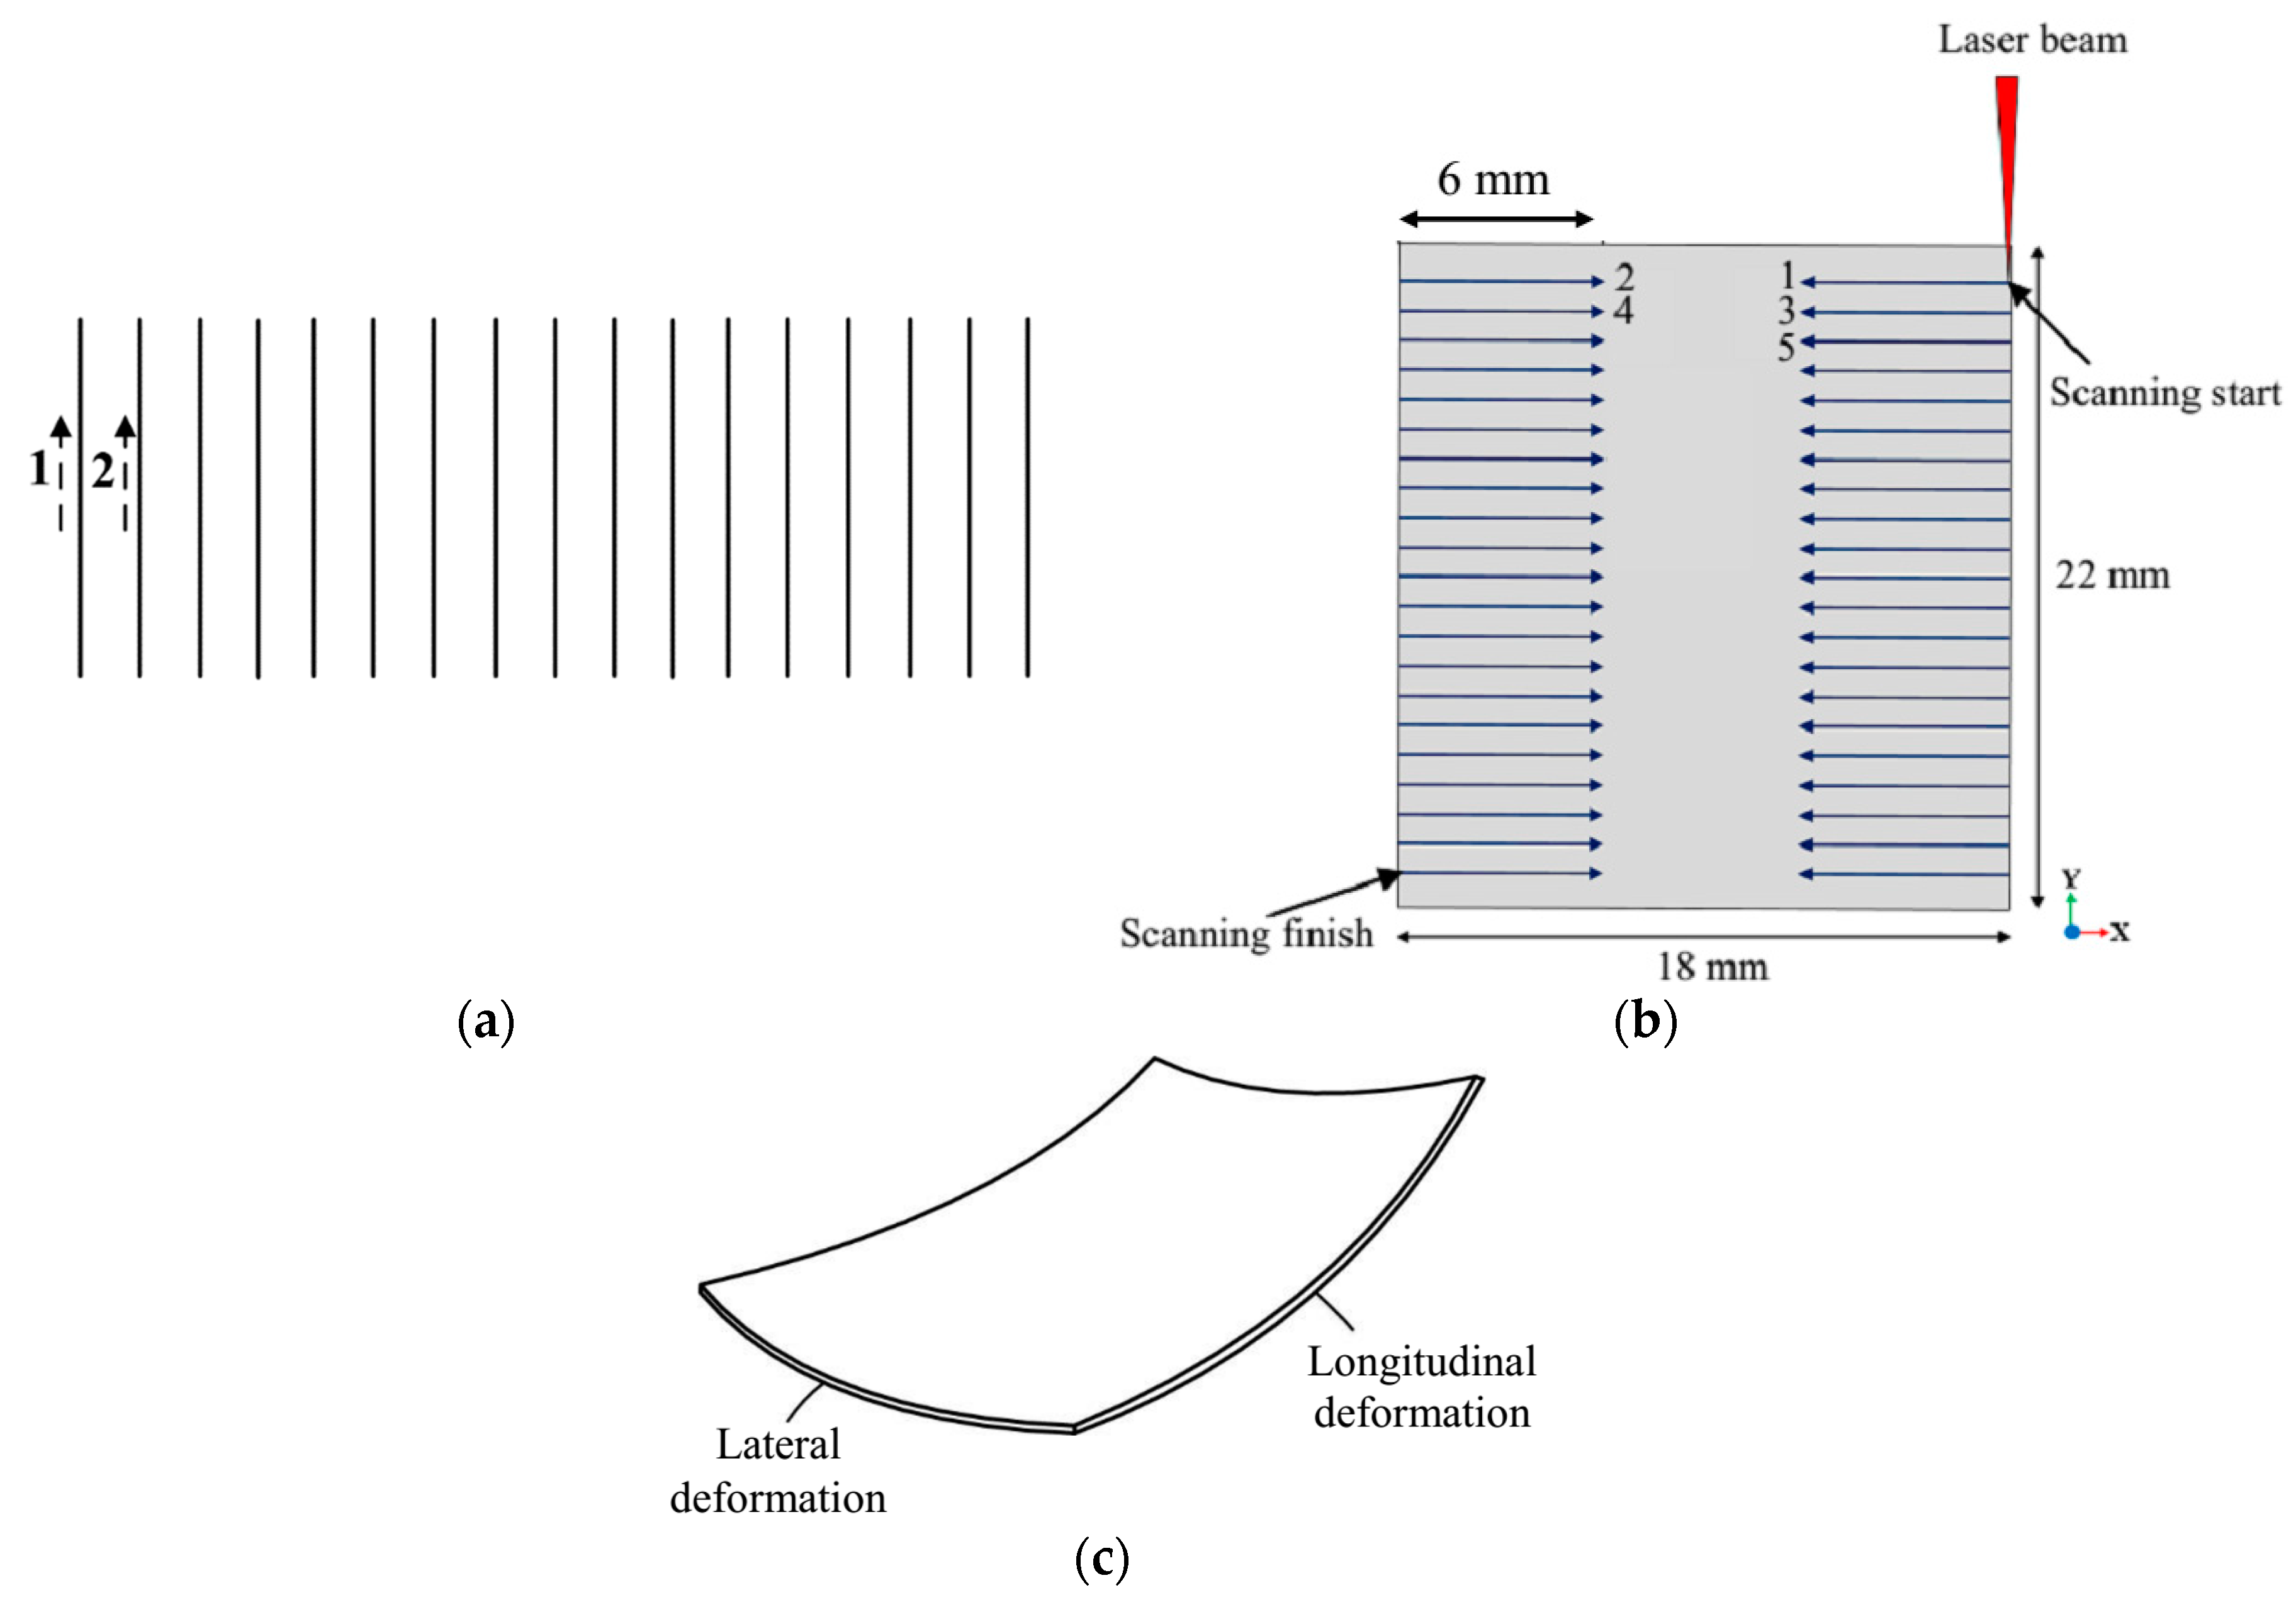
Figure 1. (a) Raster scanning strategy; (b) applied raster scanning strategy; and (c) depiction of the desired shape.
Applsci 09 04463 g001
Figure 2. Schematics of the studied laser forming parameters.
Applsci 09 04463 g002
Figure 3. (a) Model with the clamp; and (b) the computational mesh used for 3D with plane-symmetry finite element analysis.
Applsci 09 04463 g003
Figure 4. (a) Simulation of the deformed sample; (b) definition of eheating and espacing in the strain field; and (c) definition of the in-plane and out-of-plane strains.
Applsci 09 04463 g004
Figure 5. Heating and spacing strains at Db of (a) 0.25; (b) 0.5; (c) 0.7; (d) 1.0; and (e) 1.3 mm.
Applsci 09 04463 g005aApplsci 09 04463 g005b
Figure 6. (a) Total strain; (b) plastic deformation at the center point from the experimental measurements; and the (c) deformed sample.
Applsci 09 04463 g006
Figure 7. Maximum temperatures of the laser-formed samples from the finite element analysis.
Applsci 09 04463 g007
Figure 8. (a) Optical micrographs of the parent austenitic stainless steel 316. Formed samples at Db and hs of (b) 0.25 and 1.0; (c) 0.5 and 0.5; (d) 0.7 and 0.5; (e) 1.0 and 0.5; and (f) 1.3 and 0.5 mm, respectively.
Applsci 09 04463 g008aApplsci 09 04463 g008b
Figure 9. SEM images of the samples obtained at (a,b) Db = 0.25, hs = 1.0; (c,d) Db = 0.5, hs = 0.5; and (e,f) Db = 1.0, hs = 0.5 mm.
Applsci 09 04463 g009aApplsci 09 04463 g009b
Figure 10. Optical micrographs of the overlap areas of the samples obtained at Db = 1.3 and hatch spacings of (a) 1.0 mm and (b) 0.50 mm, which show the back-transformed grains (within the dashed ovals).
Applsci 09 04463 g010
Figure 11. Average microhardnesses of the samples, indented along the scan direction outlined in the lateral slice image.
Applsci 09 04463 g011
Figure 12. Obtained cooling rates from FEM analysis.
Applsci 09 04463 g012
Table 1. Process parameters.
CaseABCDEabcde
hs (mm)1.01.01.01.01.00.50.50.50.50.5
Db (mm)0.250.50.71.01.30.250.50.71.01.3
OR−3.0−1.0−0.430.00.23−1.00.00.300.500.62